Embed Size (px)
Citation preview
Instrumentation of HPLC
Mobile Phase Considerations
i Wherever you see this symbol, it is important to access the on-line course as there is interactive material that cannot be fully shown in this reference manual.
Aims and Objectives
Aims and Objectives
Aims
To explain the purpose of the mobile phase in HPLC
To outline the basic concepts of the Liquid Chromatographic process
To describe the best way to prepare mobile phase components
To highlight the potential problems caused by improper preparation and use of mobile phases
To describe the way that mobile phase composition effects retention and selectivity in reverse phase HPLC
To describe various physico-chemical properties of the typical solvents used for HPLC
To explain various methods for degassing HPLC mobile phases Objectives At the end of this Section you should be able to:
Demonstrate an understanding of the purpose of the mobile phase in HPLC
Describe the Liquid Chromatographic process and relate retention and selectivity of analytes to different mobile phase compositions
Describe suitable methods to prepare and degas mobile phases
Demonstrate an understanding of how certain physico-chemical properties of mobile phase constituents may affect an analysis
© Crawford Scientific www.chromacademy.com
2
Content The Mobile Phase –Introduction 3 The Liquid Chromatographic Process 4 Analyte Retention Processes 5 The Partition Coefficient 7 Retention and Selectivity 8 Solvent Type and Selectivity 10 Optimising Selectivity using Retention 11 Gradient Elution 13
Gradient steepness 14 Mobile Phase Delivery 15 Solvent miscibility 16 UV Cut Off 18 Other Solvent Considerations 19 Mobile Phase Preparation 21
Mixing 21 Filtration 22 Degassing 23 Outlet Degassing 24 Degassing / Column Damage 25
Methods of Degassing 25 Helium Sparging 27 Vacuum Degassing 27 Glossary 28
© Crawford Scientific www.chromacademy.com
3
The Mobile Phase –Introduction In reverse phase HPLC, the stationary phase is an adsorbent packed into a column and the mobile phase is composed of water and/or organic solvents plus other additives. When an injection is made via the autosampler the sample is introduced into the mobile phase flow path and swept into the column by the mobile phase. When the sample enters the column it will partition (distribute), between the mobile and stationary phase. The extent to which the sample partitions into either phase is governed by its physico-chemical for that phase. By changing the chemical composition of the mobile and/or stationary phase it is possible to effect the retention of various analytes –by changing the partition ratio.
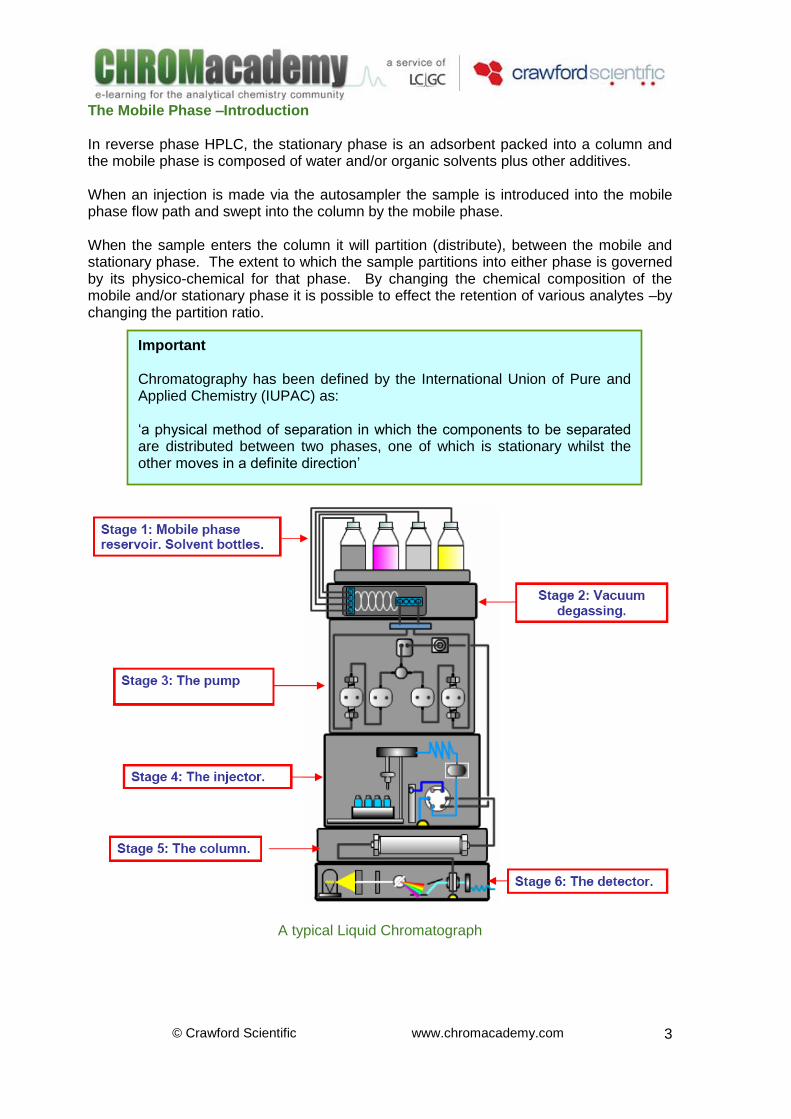
A typical Liquid Chromatograph
Important Chromatography has been defined by the International Union of Pure and Applied Chemistry (IUPAC) as: ‘a physical method of separation in which the components to be separated are distributed between two phases, one of which is stationary whilst the other moves in a definite direction’
© Crawford Scientific www.chromacademy.com
4
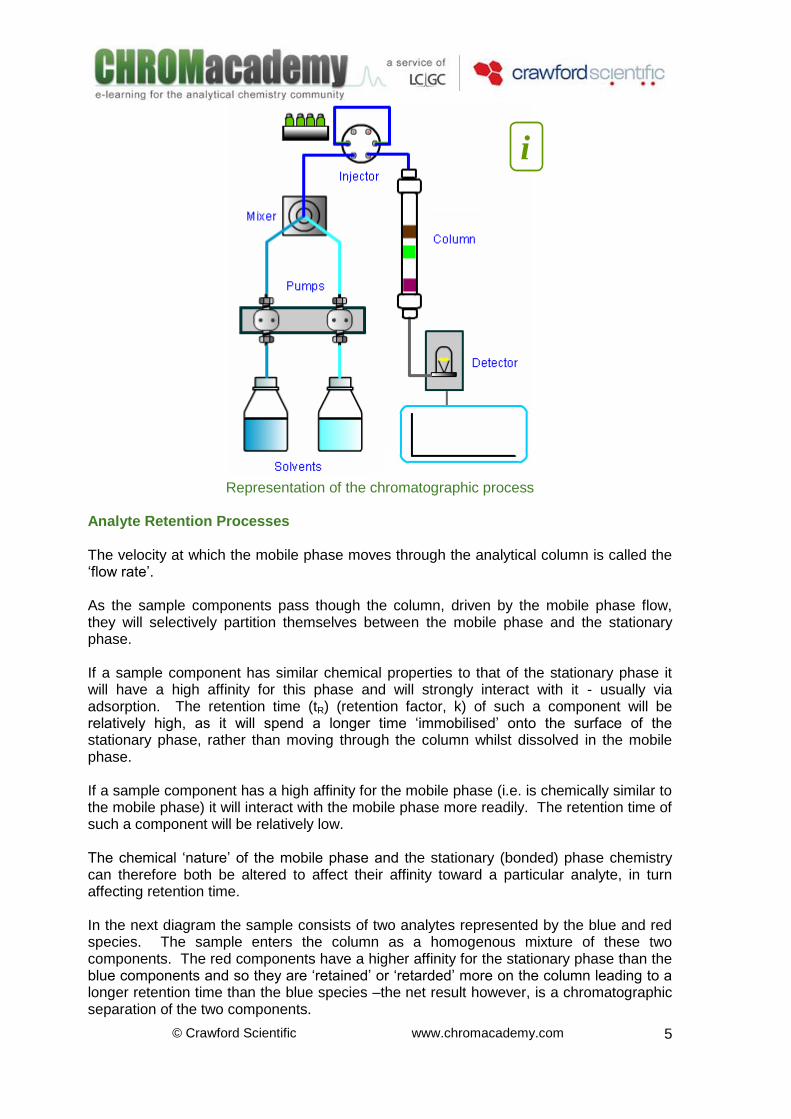
Where Stage 1: Mobile phase reservoir. Solvent bottles. The mobile phase is stored here prior to being pumped through the system. Stage 2: Vacuum degassing. Modern HPLC Systems use on-line vacuum degassing to remove dissolved gas from the mobile phase, this gives less noisy baselines and better chromatographic performance. Stage 3: The pump. The mobile phase then passes through the pump. Mixing of 2 or more mobile phase components can be automated here using various different pump configurations. Mobile phase components can be mixed in different ratios to alter the mobile phase characteristics and therefore improve separation and resolution. Stage 4: The injector. Here the sample is introduced into the mobile phase flow, without interrupting the mobile phase flow or reducing the system pressure. Stage 5: The column. The sample is partitioned between the mobile and stationary phase. The degree to which the analyte partitions between the phases will govern its retention. Stage 6: The detector. The detector measures some physico-chemical property (eg UV absorption) of the mobile phase as it elutes from the column. The response of the detector will change as the sample components begin to elute. The Liquid Chromatographic Process The mobile phase is continuously pumped at a fixed flow rate through the system after mixing (if required), by the pump. The injector is used to introduce a plug of sample into the mobile phase without having to stop the mobile phase flow, and without introducing air into the system. The mixture of components is carried in a narrow band to the top of the column. Some compounds in the sample mixture will have a greater preference for the stationary phase than the mobile phase and will be retained in the column longer. Those components that are not retained as strongly are transported more quickly through the column by the mobile phase. The higher the surface area available to the sample (achieved using a longer column or smaller particle size), the more opportunities for interaction with the stationary phase and the greater the separation. The detector is then used to respond to a physico-chemical property of the analyte (perhaps a UV Chromophore consisting of a set of conjugated double bonds or an aromatic group). This response is digitally amplified and sent to a data system where it is recorded as the ‘chromatogram’.
© Crawford Scientific www.chromacademy.com
5
Representation of the chromatographic process
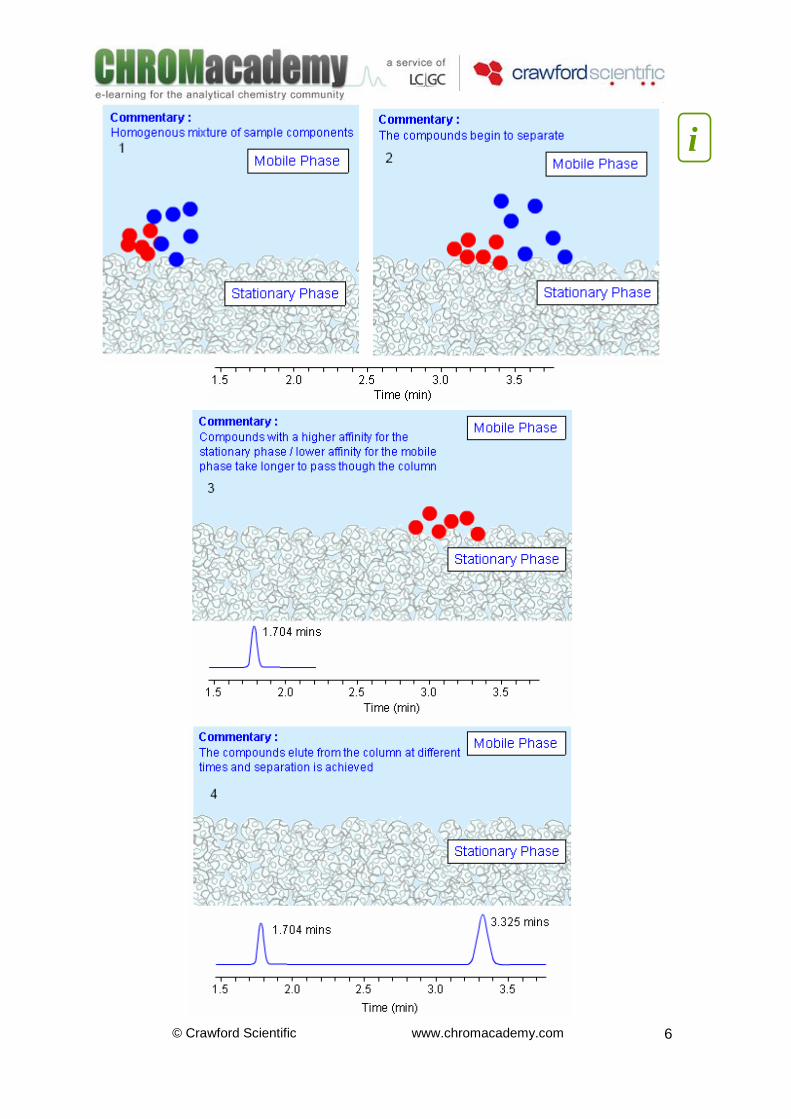
Analyte Retention Processes The velocity at which the mobile phase moves through the analytical column is called the ‘flow rate’. As the sample components pass though the column, driven by the mobile phase flow, they will selectively partition themselves between the mobile phase and the stationary phase. If a sample component has similar chemical properties to that of the stationary phase it will have a high affinity for this phase and will strongly interact with it - usually via adsorption. The retention time (tR) (retention factor, k) of such a component will be relatively high, as it will spend a longer time ‘immobilised’ onto the surface of the stationary phase, rather than moving through the column whilst dissolved in the mobile phase. If a sample component has a high affinity for the mobile phase (i.e. is chemically similar to the mobile phase) it will interact with the mobile phase more readily. The retention time of such a component will be relatively low. The chemical ‘nature’ of the mobile phase and the stationary (bonded) phase chemistry can therefore both be altered to affect their affinity toward a particular analyte, in turn affecting retention time. In the next diagram the sample consists of two analytes represented by the blue and red species. The sample enters the column as a homogenous mixture of these two components. The red components have a higher affinity for the stationary phase than the blue components and so they are ‘retained’ or ‘retarded’ more on the column leading to a longer retention time than the blue species –the net result however, is a chromatographic separation of the two components.
i
© Crawford Scientific www.chromacademy.com
6
i

© Crawford Scientific www.chromacademy.com
7
The Partition Coefficient The degree to which an analyte will partition between the two phases is governed by the distribution co-efficient. This is defined by the following equation:
Mob
Satx
C
CK
Where CSat is the concentration of the compound in the stationary phase and CMob is the concentration of the compound in the mobile phase, at equilibrium. The value of Kx is constant for a particular compound under a given set of chromatographic conditions. Kx represents the equilibrium distribution (under a given set of analytical conditions) of the analyte between the two phases. Because the mobile phase moves, a non-equilibrium situation occurs at both the front and back of the analyte band in both the mobile and stationary phases –this is illustrated in the example opposite. This results in a net movement of analyte molecules at the front of the band into the mobile phase and those at the back of the band into the stationary phase, to re-establish equilibrium conditions. This causes the band of analyte to move through the column in the manner shown. The time taken for adsorption and desorption to occur at both ends of the band will dictate the speed of analyte transit through the column, and also the width of the chromatographic peak for that analyte.
i
© Crawford Scientific www.chromacademy.com
8
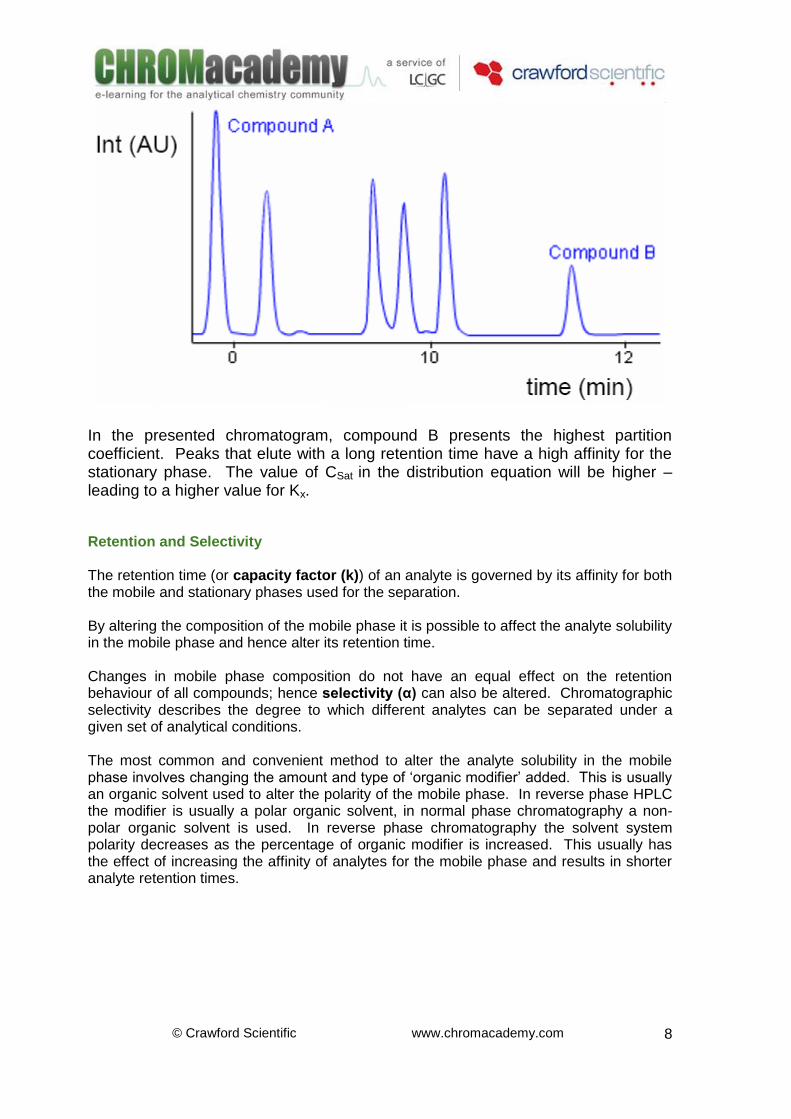
In the presented chromatogram, compound B presents the highest partition coefficient. Peaks that elute with a long retention time have a high affinity for the stationary phase. The value of CSat
in the distribution equation will be higher –
leading to a higher value for Kx. Retention and Selectivity The retention time (or capacity factor (k)) of an analyte is governed by its affinity for both the mobile and stationary phases used for the separation. By altering the composition of the mobile phase it is possible to affect the analyte solubility in the mobile phase and hence alter its retention time. Changes in mobile phase composition do not have an equal effect on the retention behaviour of all compounds; hence selectivity (α) can also be altered. Chromatographic selectivity describes the degree to which different analytes can be separated under a given set of analytical conditions. The most common and convenient method to alter the analyte solubility in the mobile phase involves changing the amount and type of ‘organic modifier’ added. This is usually an organic solvent used to alter the polarity of the mobile phase. In reverse phase HPLC the modifier is usually a polar organic solvent, in normal phase chromatography a non-polar organic solvent is used. In reverse phase chromatography the solvent system polarity decreases as the percentage of organic modifier is increased. This usually has the effect of increasing the affinity of analytes for the mobile phase and results in shorter analyte retention times.
© Crawford Scientific www.chromacademy.com
9
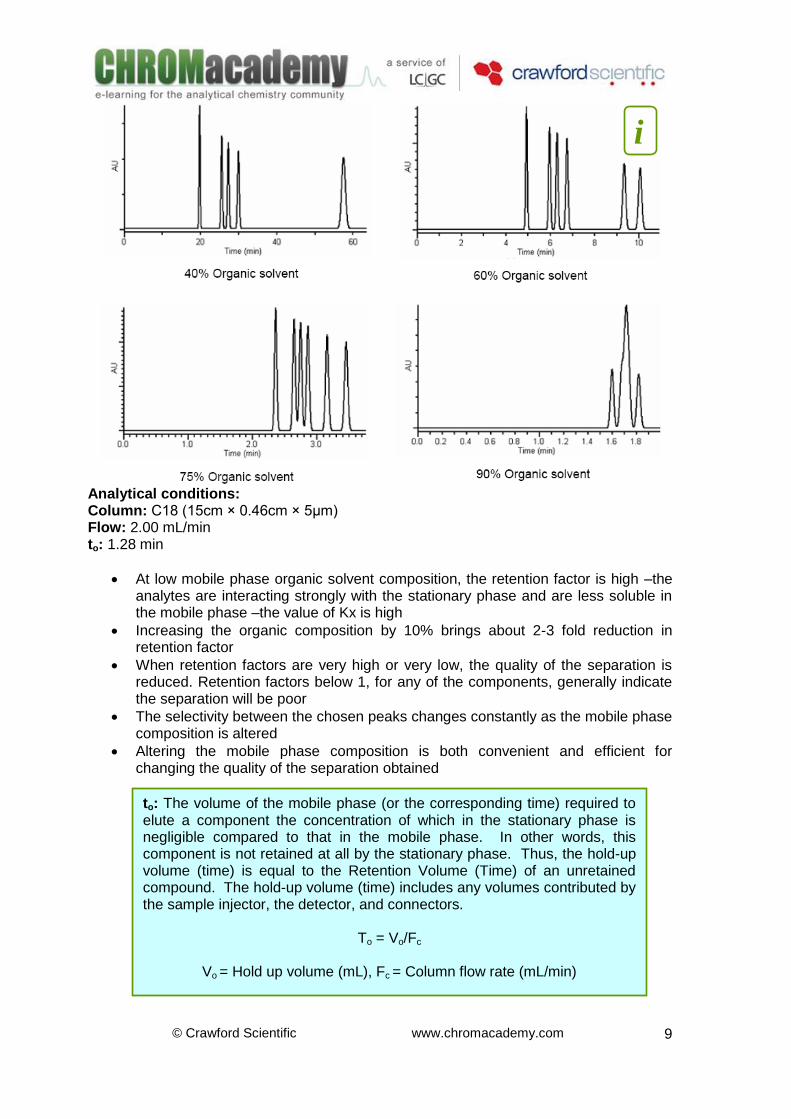
Analytical conditions: Column: C18 (15cm × 0.46cm × 5μm) Flow: 2.00 mL/min to: 1.28 min
At low mobile phase organic solvent composition, the retention factor is high –the analytes are interacting strongly with the stationary phase and are less soluble in the mobile phase –the value of Kx is high
Increasing the organic composition by 10% brings about 2-3 fold reduction in retention factor
When retention factors are very high or very low, the quality of the separation is reduced. Retention factors below 1, for any of the components, generally indicate the separation will be poor
The selectivity between the chosen peaks changes constantly as the mobile phase composition is altered
Altering the mobile phase composition is both convenient and efficient for changing the quality of the separation obtained
i
to: The volume of the mobile phase (or the corresponding time) required to elute a component the concentration of which in the stationary phase is negligible compared to that in the mobile phase. In other words, this component is not retained at all by the stationary phase. Thus, the hold-up volume (time) is equal to the Retention Volume (Time) of an unretained compound. The hold-up volume (time) includes any volumes contributed by the sample injector, the detector, and connectors.
To = Vo/Fc
Vo = Hold up volume (mL), Fc
= Column flow rate (mL/min)
© Crawford Scientific www.chromacademy.com
10
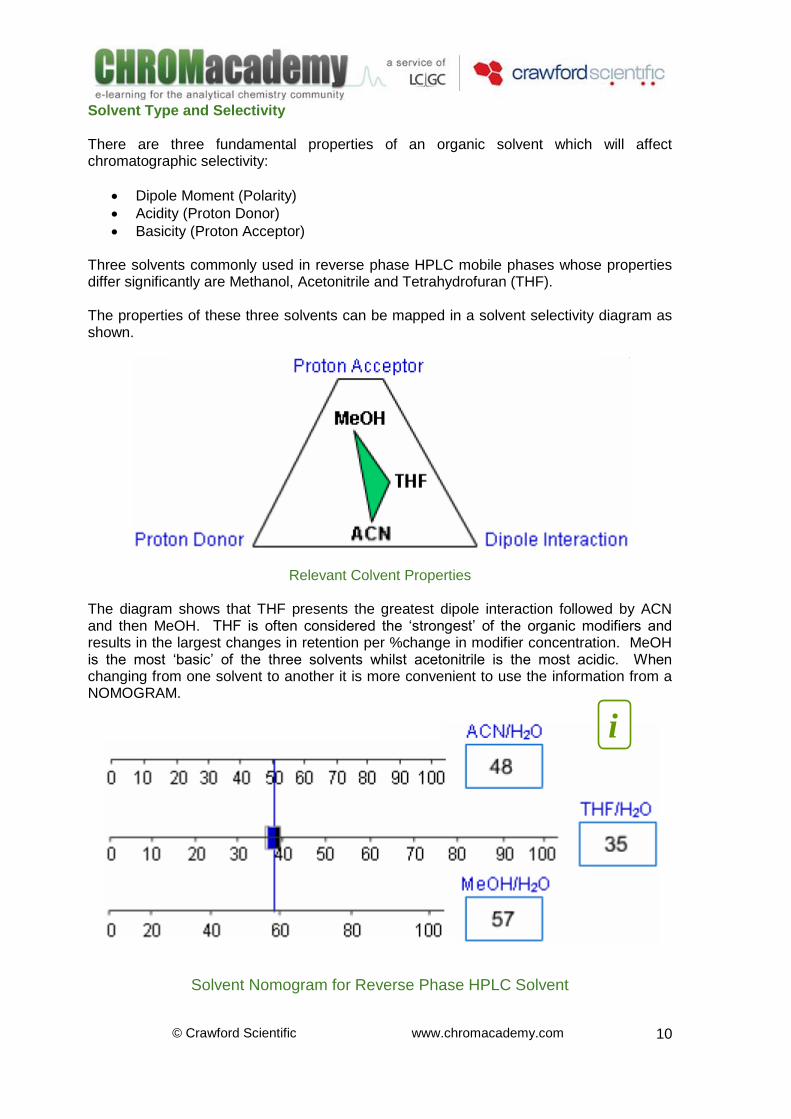
Solvent Type and Selectivity There are three fundamental properties of an organic solvent which will affect chromatographic selectivity:
Dipole Moment (Polarity)
Acidity (Proton Donor)
Basicity (Proton Acceptor) Three solvents commonly used in reverse phase HPLC mobile phases whose properties differ significantly are Methanol, Acetonitrile and Tetrahydrofuran (THF). The properties of these three solvents can be mapped in a solvent selectivity diagram as shown.
Relevant Colvent Properties The diagram shows that THF presents the greatest dipole interaction followed by ACN and then MeOH. THF is often considered the ‘strongest’ of the organic modifiers and results in the largest changes in retention per %change in modifier concentration. MeOH is the most ‘basic’ of the three solvents whilst acetonitrile is the most acidic. When changing from one solvent to another it is more convenient to use the information from a NOMOGRAM.
Solvent Nomogram for Reverse Phase HPLC Solvent
i
© Crawford Scientific www.chromacademy.com
11
A nomogram compares the relative elution strengths of each solvent. In this way an equivalent mobile phase composition can be chosen that has same eluting power as the original (i.e.the overall separation will occur in the same timeframe) but with differing selectivity. In such cases the phases being compared are said to be ISOELUOTROPIC. This means that the elution time of the last compound will be approximately the same, whilst the selectivity between peaks within the chromatogram may be significantly different. In this way the separation conditions may be optimised, by altering the mobile phase composition, in order to achieve the desired resolution (RS>1.7 for rugged baseline separations) between all analytes.
Table 1. Physical Properties of Common Reverse Phase HPLC Solvents
Solvent εo (Al2O
3) εo (SiOH) εo (C18) P^
Tetrahydrofuran 0.45-0.62 0.53 3.7 4.0
Acetonitrile (ACN) 0.52-0.65 0.50-0.52 3.1 5.8
Methanol 0.95 0.70-0.73 1.0 5.1
Water - - - 10.2
εo - a measure of relative elution strength P^- Snyder polarity index value
Optimising Selectivity using Retention As well as altering the amount of organic modifier used to achieve a separation, it is also possible to alter the type of organic modifier used. For example, in Reverse Phase HPLC Acetonitrile and Methanol are often used interchangeably to affect a separation. Nomograms can be used to alter the separation such that the overall retention time remains similar, but the selectivity of the separation is altered. Such mobile phase compositions are said to be ‘Isoeluotropic’. In the next example a nomogram has been used to determine the composition of an Acetonitrile based mobile phase that will give an equivalent run time, but may alter selectivity, compared to a Methanol based equivalent. In this case, a satisfactory separation could not be obtained using Methanol as the mobile phase modifier.
© Crawford Scientific www.chromacademy.com
12
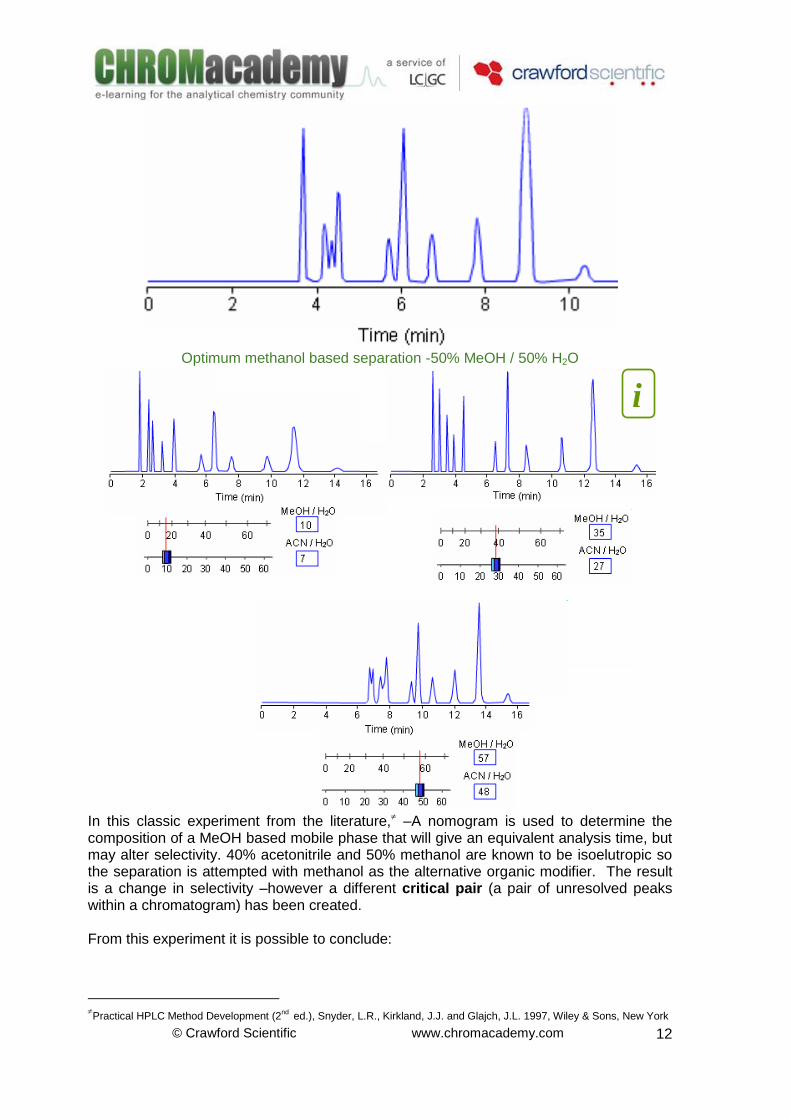
Optimum methanol based separation -50% MeOH / 50% H2O
In this classic experiment from the literature, –A nomogram is used to determine the composition of a MeOH based mobile phase that will give an equivalent analysis time, but may alter selectivity. 40% acetonitrile and 50% methanol are known to be isoelutropic so the separation is attempted with methanol as the alternative organic modifier. The result is a change in selectivity –however a different critical pair (a pair of unresolved peaks within a chromatogram) has been created. From this experiment it is possible to conclude:
Practical HPLC Method Development (2
nd
ed.), Snyder, L.R., Kirkland, J.J. and Glajch, J.L. 1997, Wiley & Sons, New York
i

© Crawford Scientific www.chromacademy.com
13
Nomograms can be used to alter the selectivity of a separation without radically altering the overall retention time
If the desired selectivity cannot be achieved using one solvent, then changing to a different organig modifier with isoelutropic composition can result in an altered separation selectivity
The isoelutropic mobile phase compositions result in separations of APPROXIMATELY the same magnitude of retention
The approximation becomes less accurate at extremes of organic modifier content
For this separation would be IMPOSSIBLE to separate all components using methanol as the organic modifier in the mobile phase
The use of the nomogram (it is very important to access the on-line course!!!) shows that modifier compositions of 40% acetonitrile or less ALL provide a suitable separation
40% acetonitrile will produce an isoelutropic separation with altered selectivity and better overall chromatographic resolution
33% acetonitrile produces the most suitable compromise between retention time and resolution
Gradient Elution HPLC is frequently used for the separation of samples containing analytes with a wide range of sample chemistry and polarity. In such situations, a constant mobile phase composition during the analysis, i.e. isocratic conditions, may not provide an acceptable separation. Early eluting analytes may be poorly resolved whilst other analytes may have unacceptably long retention times with poor peak shape and sensitivity. To solve these problems, the composition of the mobile phase may be changed during the separation –usually starting with low amounts of modifier, which is gradually increased during the analysis. Two or sometimes three modifiers that differ in elution strength are sometimes employed. During gradient analysis the mobile phase composition is mixed on-line by the pumping system. Two pumps heads can by employed to mix a two solvent (binary system), or one pump head can be used in conjunction with an electronically controlled mixing device to mix two (binary), three (ternary) or four (quaternary) solvent mixtures. After sample introduction, the ratio of these solvents is programmed to vary either continuously or in steps, resulting in enhanced separation efficiency. The next example shows how it is possible to use a mobile phase gradient to overcome many of the problems associated with isocratic analysis.

© Crawford Scientific www.chromacademy.com
14
Advantages of Gradient Elution:
Improved resolution
Increased detection
Ability to separate complex samples
Shorter analysis times
Decrease in column deterioration due to strongly retained components Other uses of Gradient Elution:
Column cleaning
Scouting runs for method development Disadvantages of Gradient Elution:
More expensive instrumentation
Possible precipitation at interfaces, when using multiple proportioning valves
Re-equilibration time adds to analysis time
Instruments vary in their dwell volume (Vd), which can cause method transfer problems
Gradient steepness
© Crawford Scientific www.chromacademy.com
15
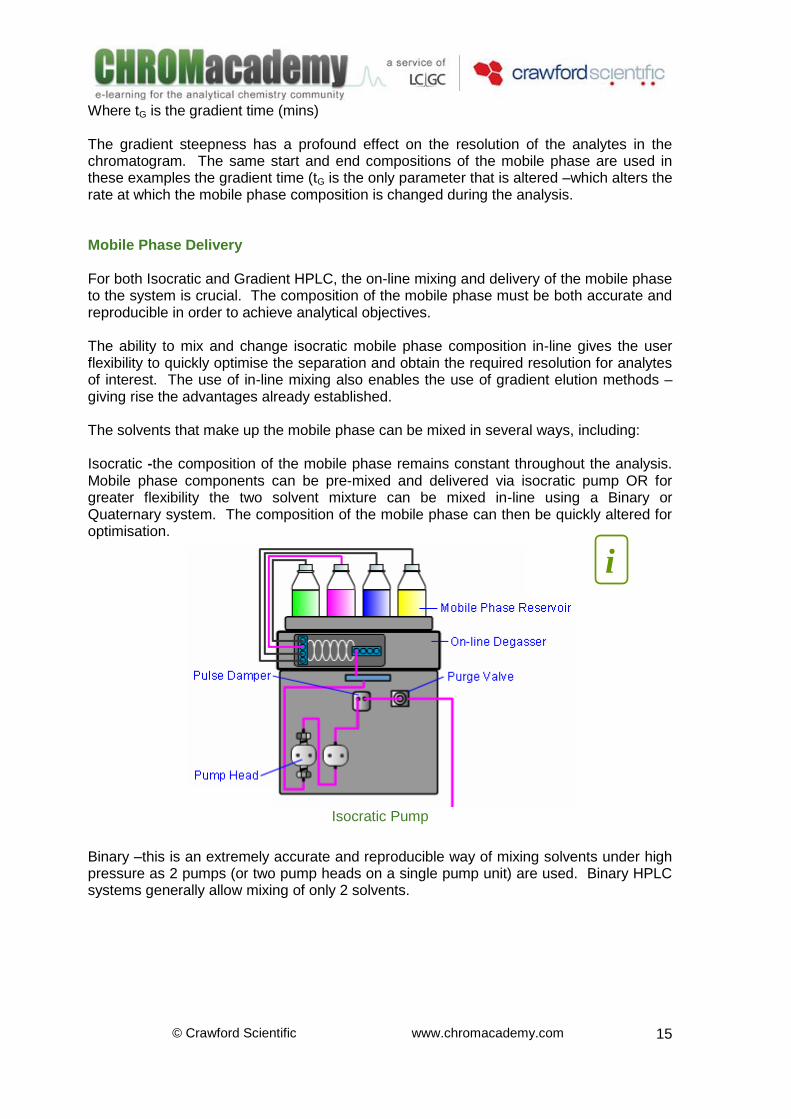
Where tG is the gradient time (mins) The gradient steepness has a profound effect on the resolution of the analytes in the chromatogram. The same start and end compositions of the mobile phase are used in these examples the gradient time (tG is the only parameter that is altered –which alters the rate at which the mobile phase composition is changed during the analysis. Mobile Phase Delivery For both Isocratic and Gradient HPLC, the on-line mixing and delivery of the mobile phase to the system is crucial. The composition of the mobile phase must be both accurate and reproducible in order to achieve analytical objectives. The ability to mix and change isocratic mobile phase composition in-line gives the user flexibility to quickly optimise the separation and obtain the required resolution for analytes of interest. The use of in-line mixing also enables the use of gradient elution methods – giving rise the advantages already established. The solvents that make up the mobile phase can be mixed in several ways, including: Isocratic -the composition of the mobile phase remains constant throughout the analysis. Mobile phase components can be pre-mixed and delivered via isocratic pump OR for greater flexibility the two solvent mixture can be mixed in-line using a Binary or Quaternary system. The composition of the mobile phase can then be quickly altered for optimisation.
Isocratic Pump
Binary –this is an extremely accurate and reproducible way of mixing solvents under high pressure as 2 pumps (or two pump heads on a single pump unit) are used. Binary HPLC systems generally allow mixing of only 2 solvents.
i
© Crawford Scientific www.chromacademy.com
16
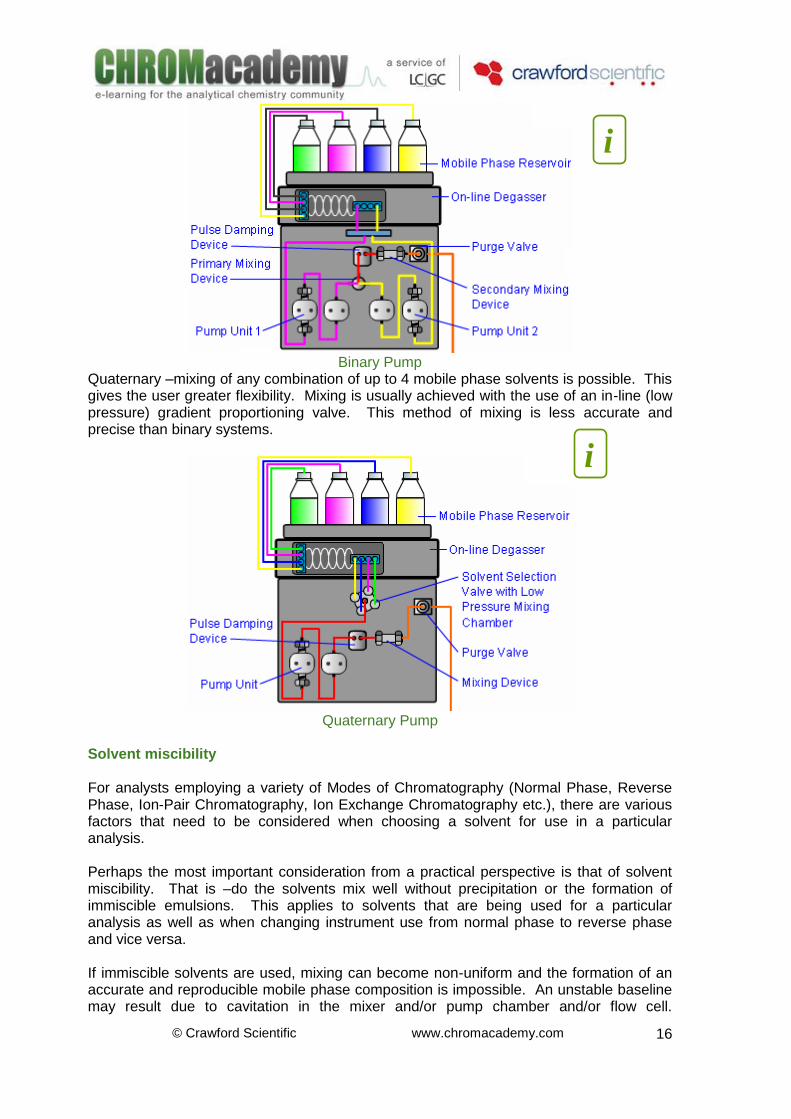
Binary Pump
Quaternary –mixing of any combination of up to 4 mobile phase solvents is possible. This gives the user greater flexibility. Mixing is usually achieved with the use of an in-line (low pressure) gradient proportioning valve. This method of mixing is less accurate and precise than binary systems.
Quaternary Pump
Solvent miscibility For analysts employing a variety of Modes of Chromatography (Normal Phase, Reverse Phase, Ion-Pair Chromatography, Ion Exchange Chromatography etc.), there are various factors that need to be considered when choosing a solvent for use in a particular analysis. Perhaps the most important consideration from a practical perspective is that of solvent miscibility. That is –do the solvents mix well without precipitation or the formation of immiscible emulsions. This applies to solvents that are being used for a particular analysis as well as when changing instrument use from normal phase to reverse phase and vice versa. If immiscible solvents are used, mixing can become non-uniform and the formation of an accurate and reproducible mobile phase composition is impossible. An unstable baseline may result due to cavitation in the mixer and/or pump chamber and/or flow cell.
i
i
© Crawford Scientific www.chromacademy.com
17
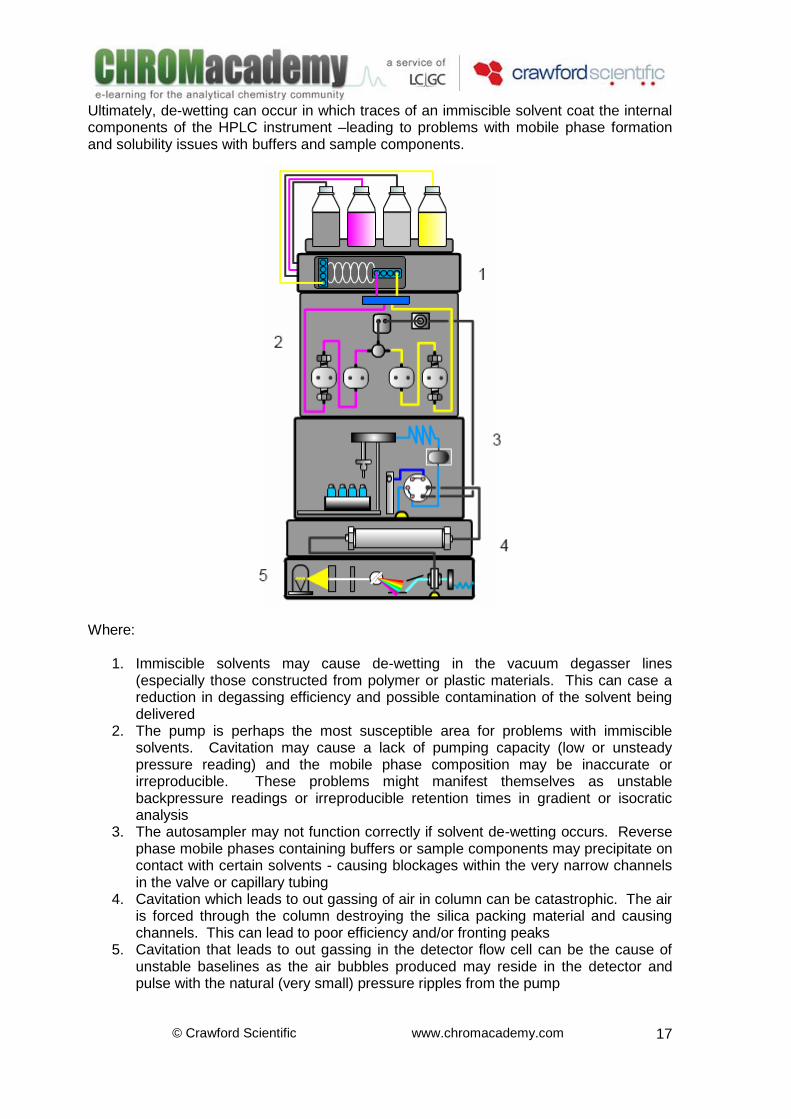
Ultimately, de-wetting can occur in which traces of an immiscible solvent coat the internal components of the HPLC instrument –leading to problems with mobile phase formation and solubility issues with buffers and sample components.
Where:
1. Immiscible solvents may cause de-wetting in the vacuum degasser lines (especially those constructed from polymer or plastic materials. This can case a reduction in degassing efficiency and possible contamination of the solvent being delivered
2. The pump is perhaps the most susceptible area for problems with immiscible solvents. Cavitation may cause a lack of pumping capacity (low or unsteady pressure reading) and the mobile phase composition may be inaccurate or irreproducible. These problems might manifest themselves as unstable backpressure readings or irreproducible retention times in gradient or isocratic analysis
3. The autosampler may not function correctly if solvent de-wetting occurs. Reverse phase mobile phases containing buffers or sample components may precipitate on contact with certain solvents - causing blockages within the very narrow channels in the valve or capillary tubing
4. Cavitation which leads to out gassing of air in column can be catastrophic. The air is forced through the column destroying the silica packing material and causing channels. This can lead to poor efficiency and/or fronting peaks
5. Cavitation that leads to out gassing in the detector flow cell can be the cause of unstable baselines as the air bubbles produced may reside in the detector and pulse with the natural (very small) pressure ripples from the pump
© Crawford Scientific www.chromacademy.com
18
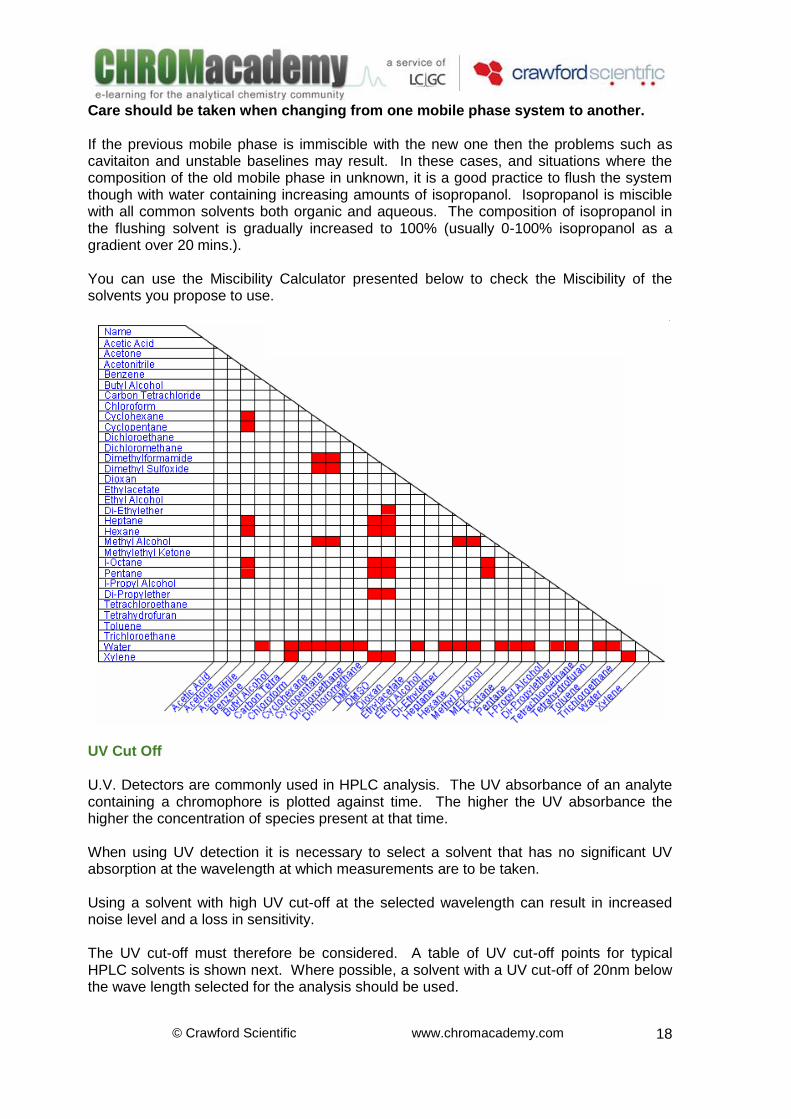
Care should be taken when changing from one mobile phase system to another. If the previous mobile phase is immiscible with the new one then the problems such as cavitaiton and unstable baselines may result. In these cases, and situations where the composition of the old mobile phase in unknown, it is a good practice to flush the system though with water containing increasing amounts of isopropanol. Isopropanol is miscible with all common solvents both organic and aqueous. The composition of isopropanol in the flushing solvent is gradually increased to 100% (usually 0-100% isopropanol as a gradient over 20 mins.). You can use the Miscibility Calculator presented below to check the Miscibility of the solvents you propose to use.
UV Cut Off U.V. Detectors are commonly used in HPLC analysis. The UV absorbance of an analyte containing a chromophore is plotted against time. The higher the UV absorbance the higher the concentration of species present at that time. When using UV detection it is necessary to select a solvent that has no significant UV absorption at the wavelength at which measurements are to be taken. Using a solvent with high UV cut-off at the selected wavelength can result in increased noise level and a loss in sensitivity. The UV cut-off must therefore be considered. A table of UV cut-off points for typical HPLC solvents is shown next. Where possible, a solvent with a UV cut-off of 20nm below the wave length selected for the analysis should be used.
© Crawford Scientific www.chromacademy.com
19
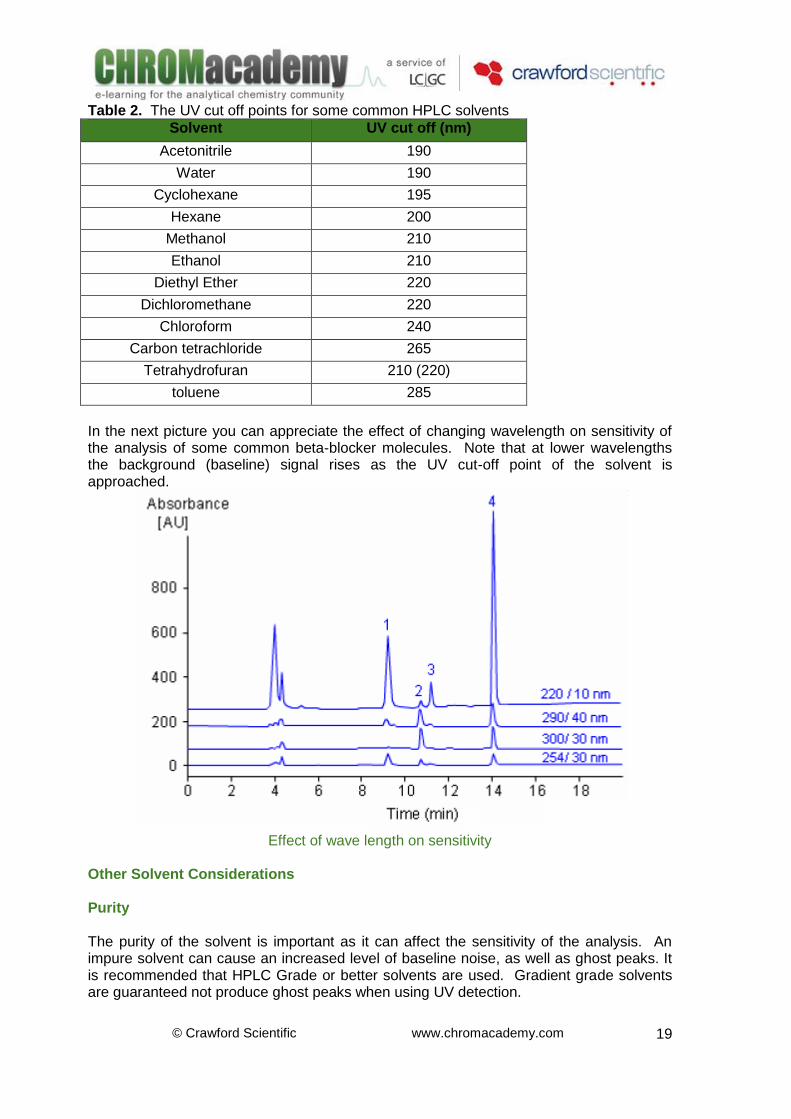
Table 2. The UV cut off points for some common HPLC solvents
Solvent UV cut off (nm)
Acetonitrile 190
Water 190
Cyclohexane 195
Hexane 200
Methanol 210
Ethanol 210
Diethyl Ether 220
Dichloromethane 220
Chloroform 240
Carbon tetrachloride 265
Tetrahydrofuran 210 (220)
toluene 285
In the next picture you can appreciate the effect of changing wavelength on sensitivity of the analysis of some common beta-blocker molecules. Note that at lower wavelengths the background (baseline) signal rises as the UV cut-off point of the solvent is approached.
Effect of wave length on sensitivity
Other Solvent Considerations Purity The purity of the solvent is important as it can affect the sensitivity of the analysis. An impure solvent can cause an increased level of baseline noise, as well as ghost peaks. It is recommended that HPLC Grade or better solvents are used. Gradient grade solvents are guaranteed not produce ghost peaks when using UV detection.
© Crawford Scientific www.chromacademy.com
20
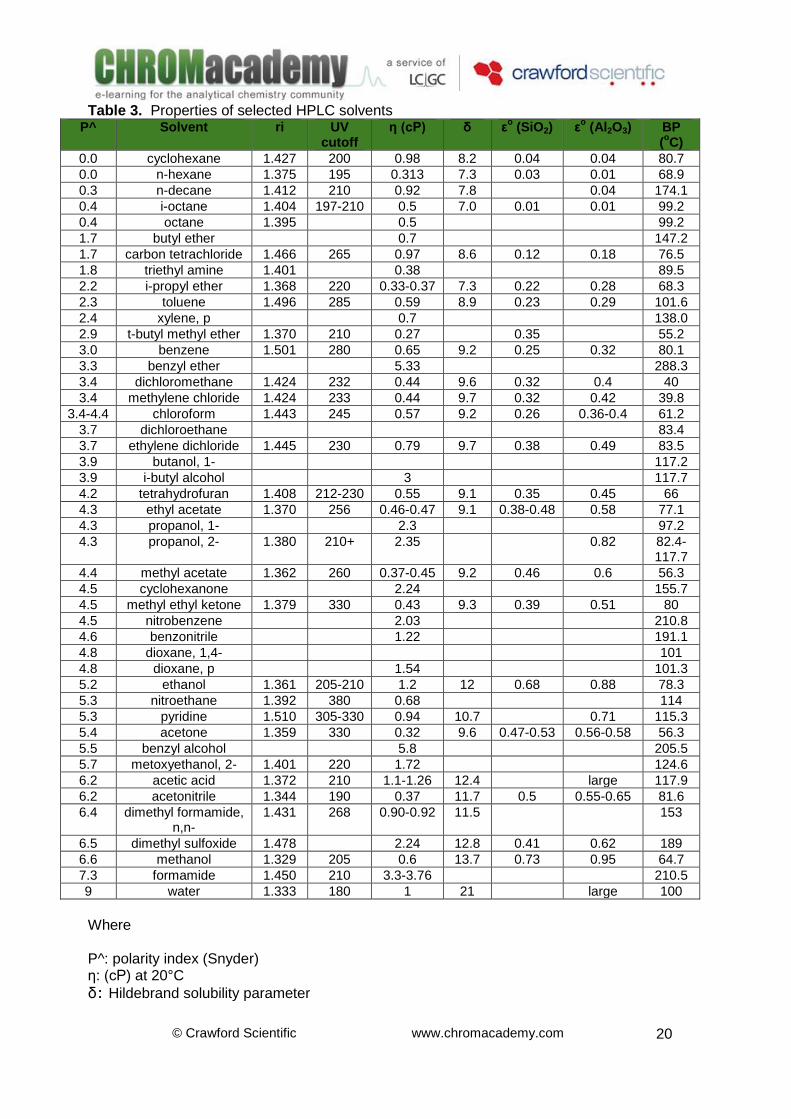
Table 3. Properties of selected HPLC solvents P^ Solvent ri UV
cutoff η (cP) δ ε
o (SiO2) ε
o (Al2O3) BP
(oC)
0.0 cyclohexane 1.427 200 0.98 8.2 0.04 0.04 80.7
0.0 n-hexane 1.375 195 0.313 7.3 0.03 0.01 68.9
0.3 n-decane 1.412 210 0.92 7.8 0.04 174.1
0.4 i-octane 1.404 197-210 0.5 7.0 0.01 0.01 99.2
0.4 octane 1.395 0.5 99.2
1.7 butyl ether 0.7 147.2
1.7 carbon tetrachloride 1.466 265 0.97 8.6 0.12 0.18 76.5
1.8 triethyl amine 1.401 0.38 89.5
2.2 i-propyl ether 1.368 220 0.33-0.37 7.3 0.22 0.28 68.3
2.3 toluene 1.496 285 0.59 8.9 0.23 0.29 101.6
2.4 xylene, p 0.7 138.0
2.9 t-butyl methyl ether 1.370 210 0.27 0.35 55.2
3.0 benzene 1.501 280 0.65 9.2 0.25 0.32 80.1
3.3 benzyl ether 5.33 288.3
3.4 dichloromethane 1.424 232 0.44 9.6 0.32 0.4 40
3.4 methylene chloride 1.424 233 0.44 9.7 0.32 0.42 39.8
3.4-4.4 chloroform 1.443 245 0.57 9.2 0.26 0.36-0.4 61.2
3.7 dichloroethane 83.4
3.7 ethylene dichloride 1.445 230 0.79 9.7 0.38 0.49 83.5
3.9 butanol, 1- 117.2
3.9 i-butyl alcohol 3 117.7
4.2 tetrahydrofuran 1.408 212-230 0.55 9.1 0.35 0.45 66
4.3 ethyl acetate 1.370 256 0.46-0.47 9.1 0.38-0.48 0.58 77.1
4.3 propanol, 1- 2.3 97.2
4.3 propanol, 2- 1.380 210+ 2.35 0.82 82.4-117.7
4.4 methyl acetate 1.362 260 0.37-0.45 9.2 0.46 0.6 56.3
4.5 cyclohexanone 2.24 155.7
4.5 methyl ethyl ketone 1.379 330 0.43 9.3 0.39 0.51 80
4.5 nitrobenzene 2.03 210.8
4.6 benzonitrile 1.22 191.1
4.8 dioxane, 1,4- 101
4.8 dioxane, p 1.54 101.3
5.2 ethanol 1.361 205-210 1.2 12 0.68 0.88 78.3
5.3 nitroethane 1.392 380 0.68 114
5.3 pyridine 1.510 305-330 0.94 10.7 0.71 115.3
5.4 acetone 1.359 330 0.32 9.6 0.47-0.53 0.56-0.58 56.3
5.5 benzyl alcohol 5.8 205.5
5.7 metoxyethanol, 2- 1.401 220 1.72 124.6
6.2 acetic acid 1.372 210 1.1-1.26 12.4 large 117.9
6.2 acetonitrile 1.344 190 0.37 11.7 0.5 0.55-0.65 81.6
6.4 dimethyl formamide, n,n-
1.431 268 0.90-0.92 11.5 153
6.5 dimethyl sulfoxide 1.478 2.24 12.8 0.41 0.62 189
6.6 methanol 1.329 205 0.6 13.7 0.73 0.95 64.7
7.3 formamide 1.450 210 3.3-3.76 210.5
9 water 1.333 180 1 21 large 100
Where P^: polarity index (Snyder) η: (cP) at 20°C
δ: Hildebrand solubility parameter
© Crawford Scientific www.chromacademy.com
21
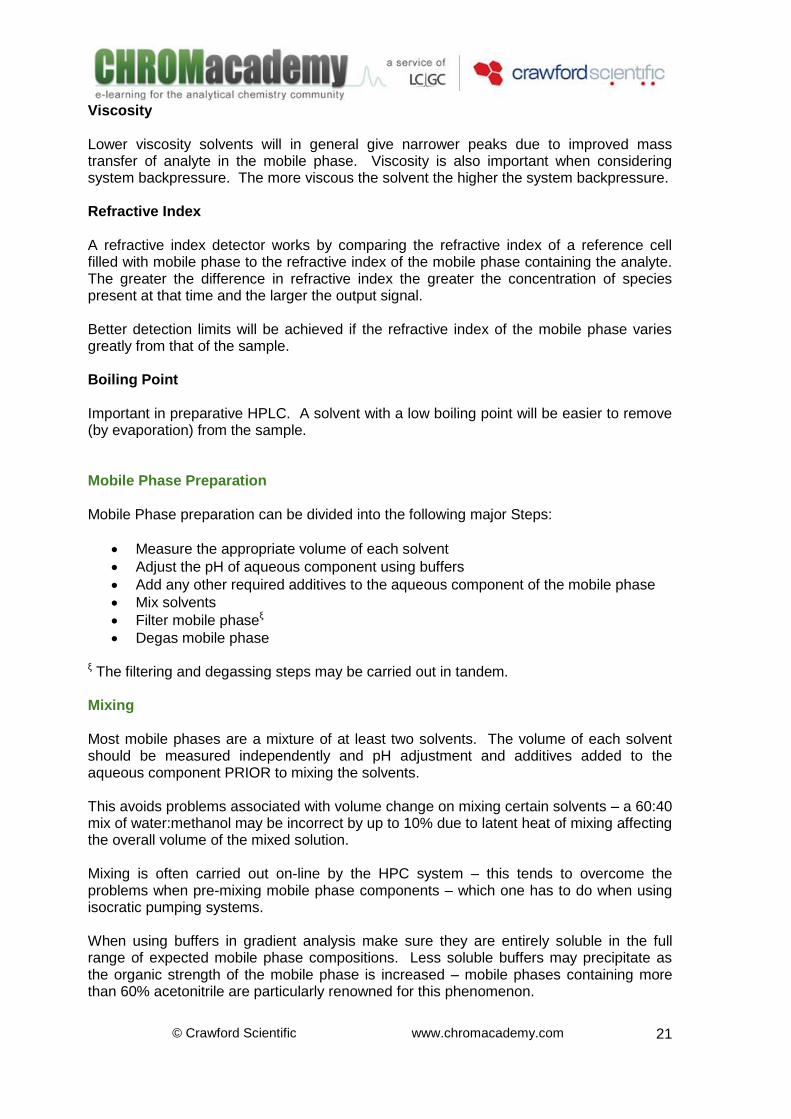
Viscosity Lower viscosity solvents will in general give narrower peaks due to improved mass transfer of analyte in the mobile phase. Viscosity is also important when considering system backpressure. The more viscous the solvent the higher the system backpressure. Refractive Index A refractive index detector works by comparing the refractive index of a reference cell filled with mobile phase to the refractive index of the mobile phase containing the analyte. The greater the difference in refractive index the greater the concentration of species present at that time and the larger the output signal. Better detection limits will be achieved if the refractive index of the mobile phase varies greatly from that of the sample. Boiling Point Important in preparative HPLC. A solvent with a low boiling point will be easier to remove (by evaporation) from the sample. Mobile Phase Preparation Mobile Phase preparation can be divided into the following major Steps:
Measure the appropriate volume of each solvent
Adjust the pH of aqueous component using buffers
Add any other required additives to the aqueous component of the mobile phase
Mix solvents
Filter mobile phaseξ
Degas mobile phase ξ The filtering and degassing steps may be carried out in tandem. Mixing Most mobile phases are a mixture of at least two solvents. The volume of each solvent should be measured independently and pH adjustment and additives added to the aqueous component PRIOR to mixing the solvents. This avoids problems associated with volume change on mixing certain solvents – a 60:40 mix of water:methanol may be incorrect by up to 10% due to latent heat of mixing affecting the overall volume of the mixed solution. Mixing is often carried out on-line by the HPC system – this tends to overcome the problems when pre-mixing mobile phase components – which one has to do when using isocratic pumping systems. When using buffers in gradient analysis make sure they are entirely soluble in the full range of expected mobile phase compositions. Less soluble buffers may precipitate as the organic strength of the mobile phase is increased – mobile phases containing more than 60% acetonitrile are particularly renowned for this phenomenon.
© Crawford Scientific www.chromacademy.com
22
Filtration To protect the HPLC and your column from particulate matter, manufacturers recommend filtering of mobile phases prior to use. This task can be accomplished with simple vacuum filtration devices purchased through HPLC supply catalogs. Add all buffers and modifiers prior to filtration. A vacuum is applied to pull the solvent through a filter –which also acts to simultaneously degass the mobile phase. Handle filters with tweezers and make certain the filtration apparatus is clean at all times. Nylon 66 is a good filter material for aqueous mobile phases, while PTFE is an excellent filter for most organic solvents. Inorganic membranes are resistant to chemical degradation from a wide range of HPLC solvents. Be aware that Teflon filters cannot be used with water due to the material’s nonpolar characteristics. HPLC mobile phase filters have a pore size of around 4.5 microns.
© Crawford Scientific www.chromacademy.com
23
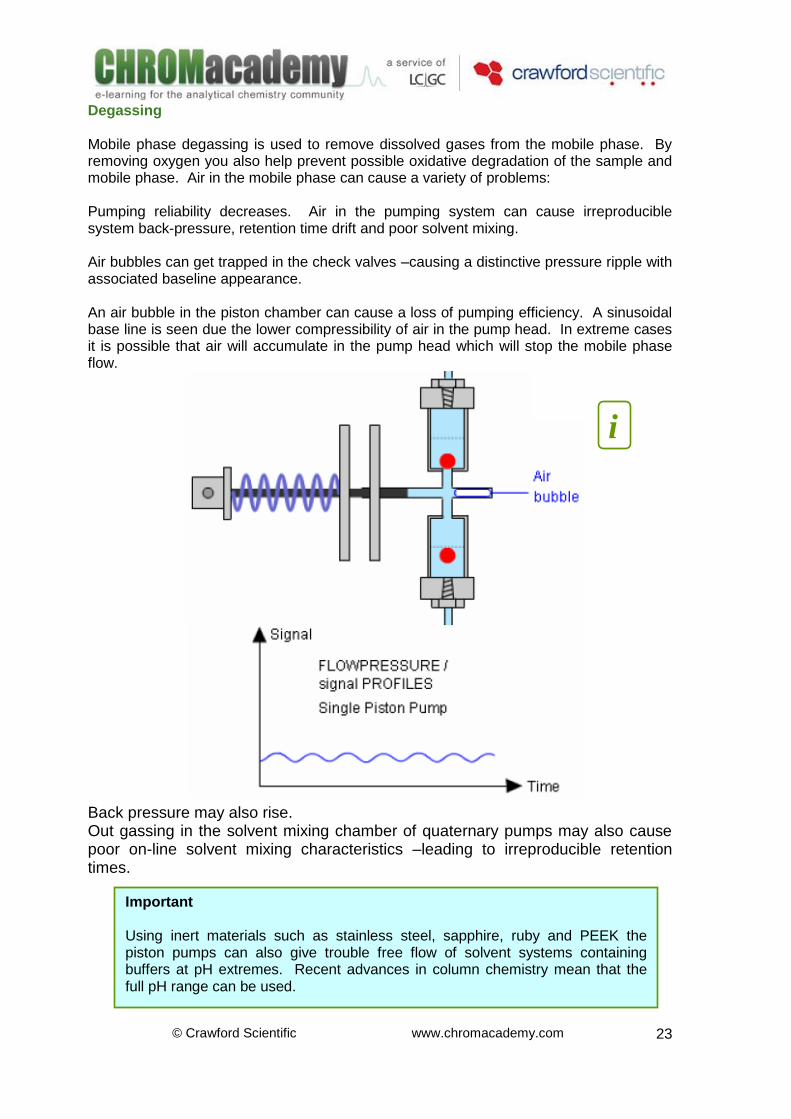
Degassing Mobile phase degassing is used to remove dissolved gases from the mobile phase. By removing oxygen you also help prevent possible oxidative degradation of the sample and mobile phase. Air in the mobile phase can cause a variety of problems: Pumping reliability decreases. Air in the pumping system can cause irreproducible system back-pressure, retention time drift and poor solvent mixing. Air bubbles can get trapped in the check valves –causing a distinctive pressure ripple with associated baseline appearance. An air bubble in the piston chamber can cause a loss of pumping efficiency. A sinusoidal base line is seen due the lower compressibility of air in the pump head. In extreme cases it is possible that air will accumulate in the pump head which will stop the mobile phase flow.
Back pressure may also rise. Out gassing in the solvent mixing chamber of quaternary pumps may also cause poor on-line solvent mixing characteristics –leading to irreproducible retention times.
Important Using inert materials such as stainless steel, sapphire, ruby and PEEK the piston pumps can also give trouble free flow of solvent systems containing buffers at pH extremes. Recent advances in column chemistry mean that the full pH range can be used.
i
© Crawford Scientific www.chromacademy.com
24
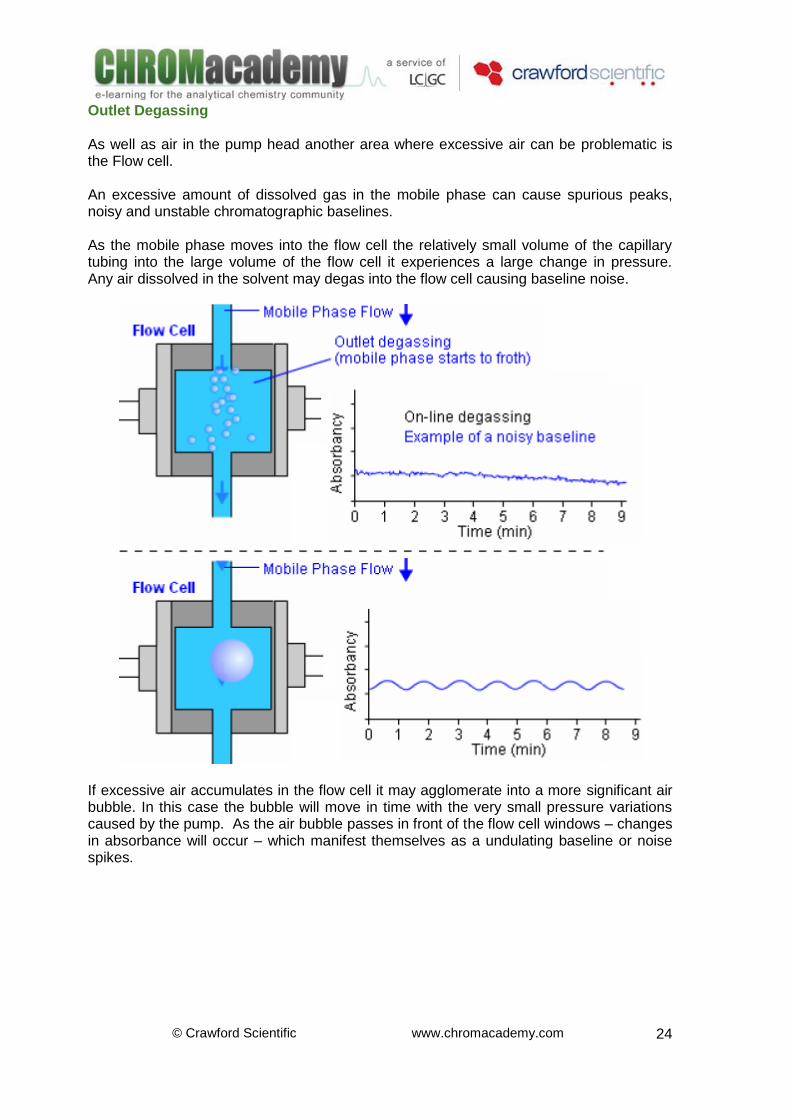
Outlet Degassing As well as air in the pump head another area where excessive air can be problematic is the Flow cell. An excessive amount of dissolved gas in the mobile phase can cause spurious peaks, noisy and unstable chromatographic baselines. As the mobile phase moves into the flow cell the relatively small volume of the capillary tubing into the large volume of the flow cell it experiences a large change in pressure. Any air dissolved in the solvent may degas into the flow cell causing baseline noise.
If excessive air accumulates in the flow cell it may agglomerate into a more significant air bubble. In this case the bubble will move in time with the very small pressure variations caused by the pump. As the air bubble passes in front of the flow cell windows – changes in absorbance will occur – which manifest themselves as a undulating baseline or noise spikes.
© Crawford Scientific www.chromacademy.com
25
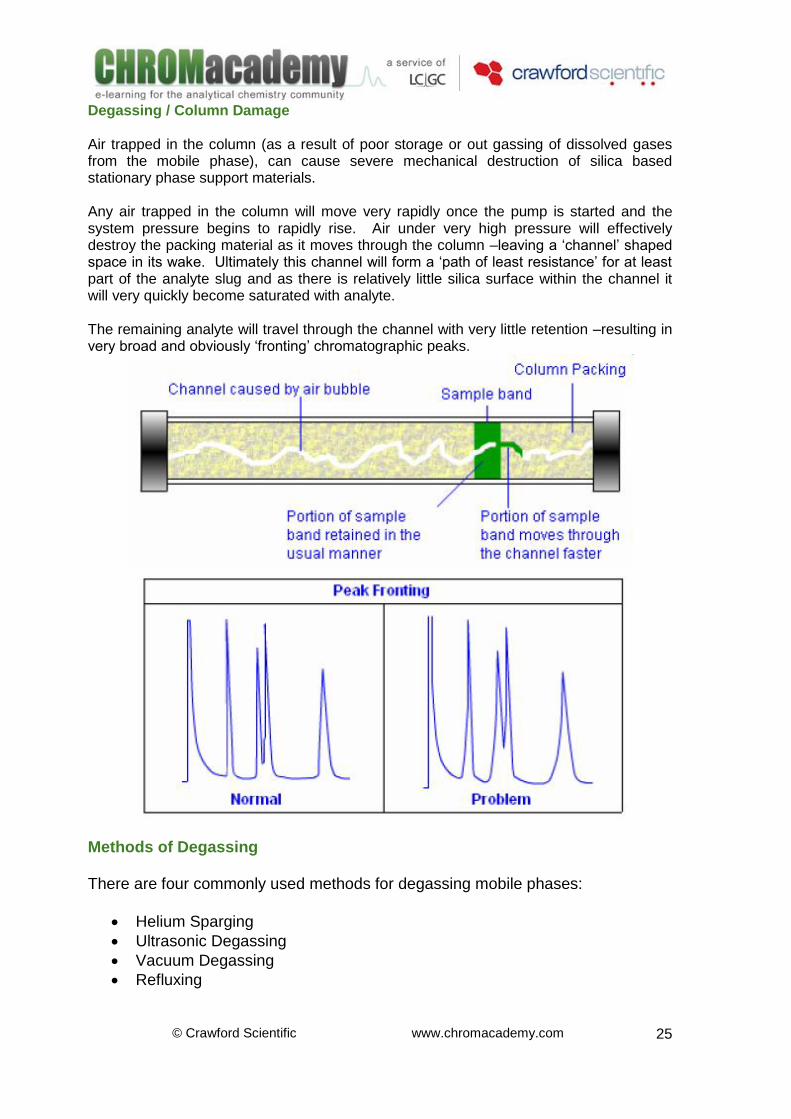
Degassing / Column Damage Air trapped in the column (as a result of poor storage or out gassing of dissolved gases from the mobile phase), can cause severe mechanical destruction of silica based stationary phase support materials. Any air trapped in the column will move very rapidly once the pump is started and the system pressure begins to rapidly rise. Air under very high pressure will effectively destroy the packing material as it moves through the column –leaving a ‘channel’ shaped space in its wake. Ultimately this channel will form a ‘path of least resistance’ for at least part of the analyte slug and as there is relatively little silica surface within the channel it will very quickly become saturated with analyte. The remaining analyte will travel through the channel with very little retention –resulting in very broad and obviously ‘fronting’ chromatographic peaks.
Methods of Degassing There are four commonly used methods for degassing mobile phases:
Helium Sparging
Ultrasonic Degassing
Vacuum Degassing
Refluxing
© Crawford Scientific www.chromacademy.com
26
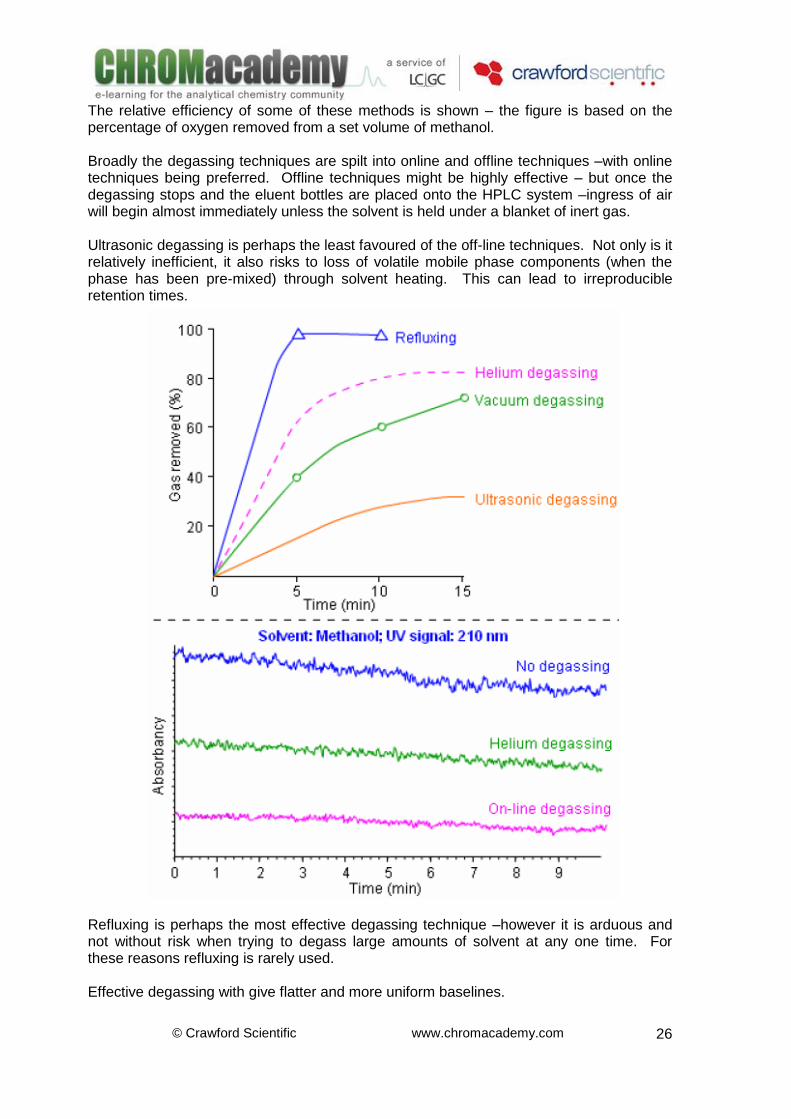
The relative efficiency of some of these methods is shown – the figure is based on the percentage of oxygen removed from a set volume of methanol. Broadly the degassing techniques are spilt into online and offline techniques –with online techniques being preferred. Offline techniques might be highly effective – but once the degassing stops and the eluent bottles are placed onto the HPLC system –ingress of air will begin almost immediately unless the solvent is held under a blanket of inert gas. Ultrasonic degassing is perhaps the least favoured of the off-line techniques. Not only is it relatively inefficient, it also risks to loss of volatile mobile phase components (when the phase has been pre-mixed) through solvent heating. This can lead to irreproducible retention times.
Refluxing is perhaps the most effective degassing technique –however it is arduous and not without risk when trying to degass large amounts of solvent at any one time. For these reasons refluxing is rarely used. Effective degassing with give flatter and more uniform baselines.
© Crawford Scientific www.chromacademy.com
27
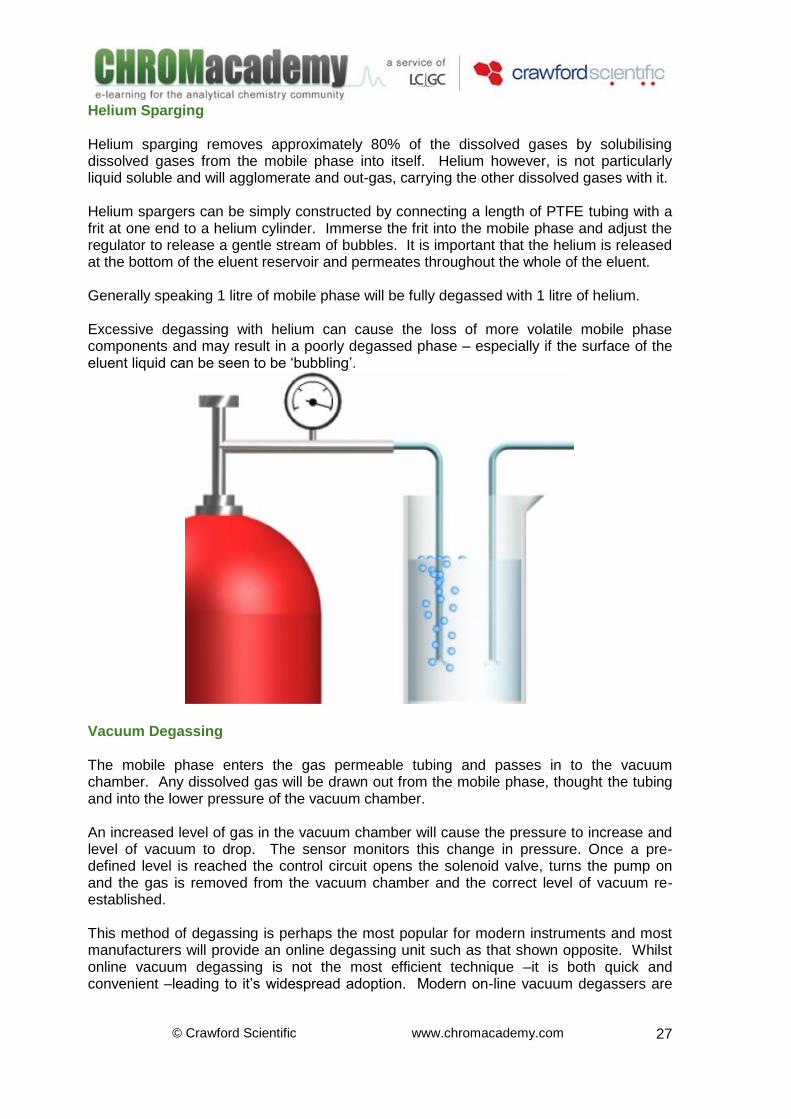
Helium Sparging Helium sparging removes approximately 80% of the dissolved gases by solubilising dissolved gases from the mobile phase into itself. Helium however, is not particularly liquid soluble and will agglomerate and out-gas, carrying the other dissolved gases with it. Helium spargers can be simply constructed by connecting a length of PTFE tubing with a frit at one end to a helium cylinder. Immerse the frit into the mobile phase and adjust the regulator to release a gentle stream of bubbles. It is important that the helium is released at the bottom of the eluent reservoir and permeates throughout the whole of the eluent. Generally speaking 1 litre of mobile phase will be fully degassed with 1 litre of helium. Excessive degassing with helium can cause the loss of more volatile mobile phase components and may result in a poorly degassed phase – especially if the surface of the eluent liquid can be seen to be ‘bubbling’.
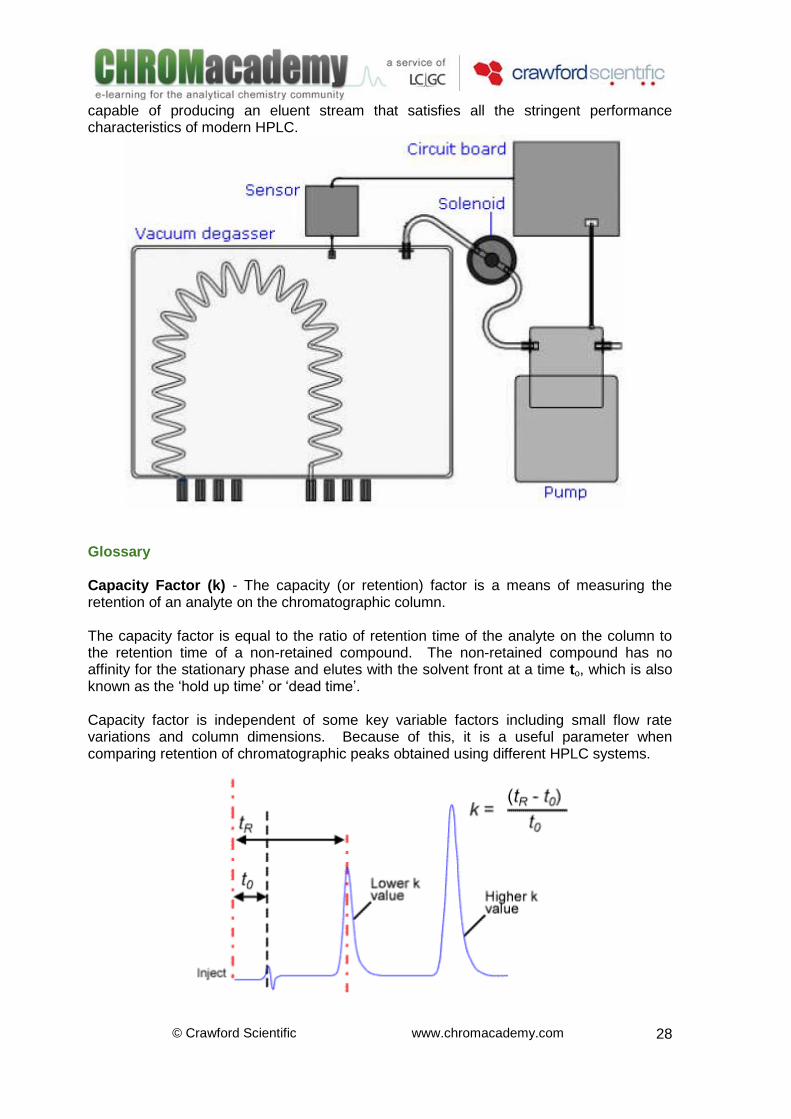
Vacuum Degassing The mobile phase enters the gas permeable tubing and passes in to the vacuum chamber. Any dissolved gas will be drawn out from the mobile phase, thought the tubing and into the lower pressure of the vacuum chamber. An increased level of gas in the vacuum chamber will cause the pressure to increase and level of vacuum to drop. The sensor monitors this change in pressure. Once a pre-defined level is reached the control circuit opens the solenoid valve, turns the pump on and the gas is removed from the vacuum chamber and the correct level of vacuum re-established. This method of degassing is perhaps the most popular for modern instruments and most manufacturers will provide an online degassing unit such as that shown opposite. Whilst online vacuum degassing is not the most efficient technique –it is both quick and convenient –leading to it’s widespread adoption. Modern on-line vacuum degassers are
© Crawford Scientific www.chromacademy.com
28
capable of producing an eluent stream that satisfies all the stringent performance characteristics of modern HPLC.
Glossary Capacity Factor (k) - The capacity (or retention) factor is a means of measuring the retention of an analyte on the chromatographic column. The capacity factor is equal to the ratio of retention time of the analyte on the column to the retention time of a non-retained compound. The non-retained compound has no affinity for the stationary phase and elutes with the solvent front at a time to, which is also known as the ‘hold up time’ or ‘dead time’. Capacity factor is independent of some key variable factors including small flow rate variations and column dimensions. Because of this, it is a useful parameter when comparing retention of chromatographic peaks obtained using different HPLC systems.
© Crawford Scientific www.chromacademy.com
29
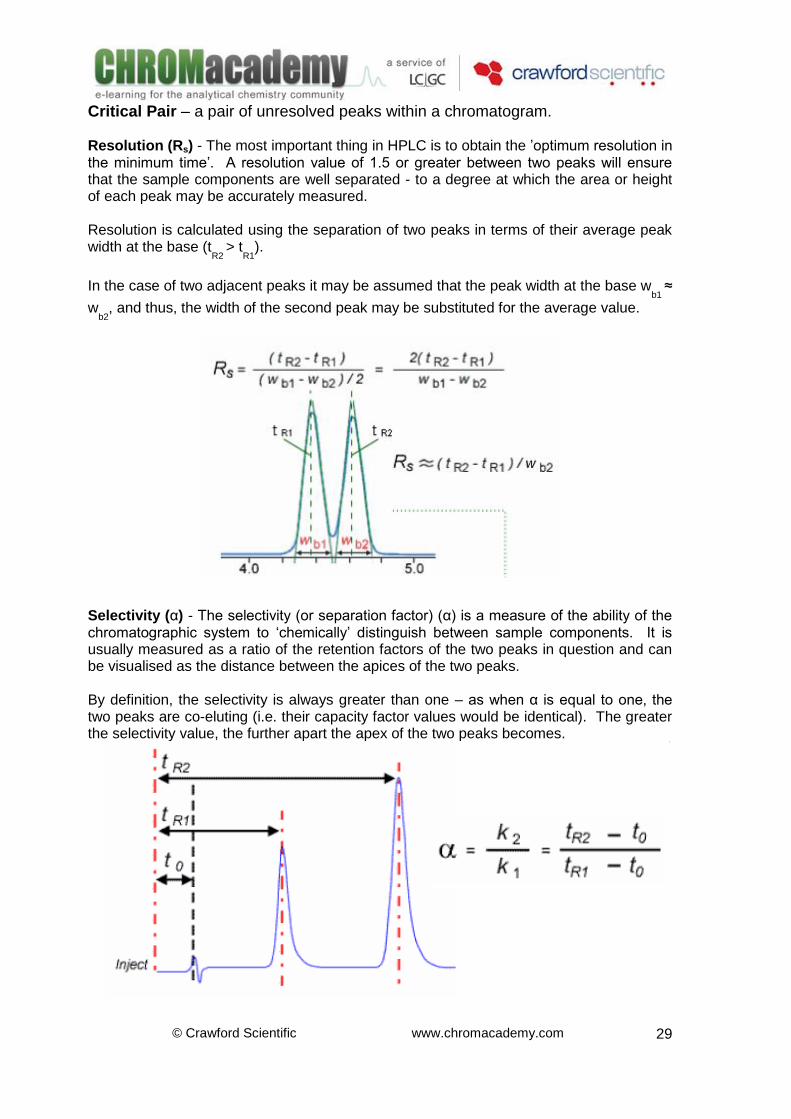
Critical Pair – a pair of unresolved peaks within a chromatogram. Resolution (Rs) - The most important thing in HPLC is to obtain the ’optimum resolution in the minimum time’. A resolution value of 1.5 or greater between two peaks will ensure that the sample components are well separated - to a degree at which the area or height of each peak may be accurately measured. Resolution is calculated using the separation of two peaks in terms of their average peak width at the base (t
R2 > t
R1).
In the case of two adjacent peaks it may be assumed that the peak width at the base w
b1 ≈
wb2
, and thus, the width of the second peak may be substituted for the average value.
Selectivity (α) - The selectivity (or separation factor) (α) is a measure of the ability of the chromatographic system to ‘chemically’ distinguish between sample components. It is usually measured as a ratio of the retention factors of the two peaks in question and can be visualised as the distance between the apices of the two peaks. By definition, the selectivity is always greater than one – as when α is equal to one, the two peaks are co-eluting (i.e. their capacity factor values would be identical). The greater the selectivity value, the further apart the apex of the two peaks becomes.


![[PPT]Liquid Chromatography Fundamentals - Theory · Web viewLiquid Chromatography Fundamentals - Theory Keywords HPLC, LC, HPLC theory, HPLC fundamentals, teaching HPLC, learning](https://img.pdfslide.net/doc/110x75/5b1aa2c67f8b9a3c258de481/pptliquid-chromatography-fundamentals-theory-web-viewliquid-chromatography.jpg)