Embed Size (px)
Citation preview
Theory of thermoelectric phenomena
May 28, 2015
4. lecture, Lausanne, 2015 Theory of thermoelectric phenomena

Summary of the scaling results for the CF split Anderson model
In the high-T phase, all the CF states are occupied,the f-state is fully degenerate.
In Ce compounds, J = 5/2 and N = 6.
In Yb compounds, J = 7/2 and N = 8.
The CF splitting defines the temperature scale kBT∆ = ∆/2.
For T ≥ T∆, the scaling trajectory is defined by the high-TKondo scale, TH
K ∆.
Below T∆, the excited CF states depopulate, the degeneracy off-states drops from N to, say, Nm = 2.
For TK < T < T∆, the Kondo physics is governed by TK THK .
At T ' TK , the system makes a transition to the low-T phase,properties are governed by the low-T Kondo scale TK TH
K .
4. lecture, Lausanne, 2015 Theory of thermoelectric phenomena
Summary of the scaling results for the Anderson model
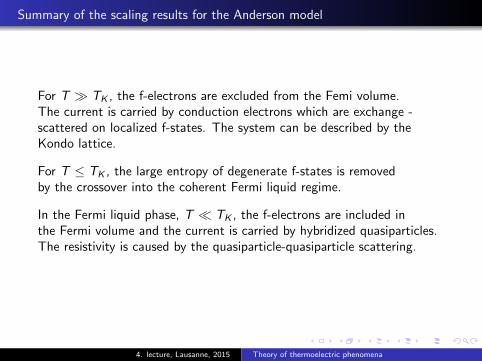
For T TK , the f-electrons are excluded from the Femi volume.The current is carried by conduction electrons which are exchange -scattered on localized f-states. The system can be described by theKondo lattice.
For T ≤ TK , the large entropy of degenerate f-states is removedby the crossover into the coherent Fermi liquid regime.
In the Fermi liquid phase, T TK , the f-electrons are included inthe Fermi volume and the current is carried by hybridized quasiparticles.The resistivity is caused by the quasiparticle-quasiparticle scattering.
4. lecture, Lausanne, 2015 Theory of thermoelectric phenomena
Summary of the scaling results for the Anderson model
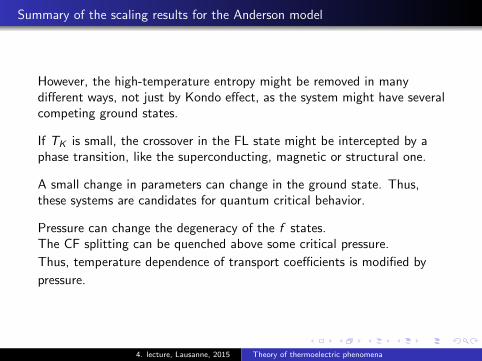
However, the high-temperature entropy might be removed in manydifferent ways, not just by Kondo effect, as the system might have severalcompeting ground states.
If TK is small, the crossover in the FL state might be intercepted by aphase transition, like the superconducting, magnetic or structural one.
A small change in parameters can change in the ground state. Thus,these systems are candidates for quantum critical behavior.
Pressure can change the degeneracy of the f states.The CF splitting can be quenched above some critical pressure.
Thus, temperature dependence of transport coefficients is modified by
pressure.
4. lecture, Lausanne, 2015 Theory of thermoelectric phenomena
Low-temperature properties of Kondo systems
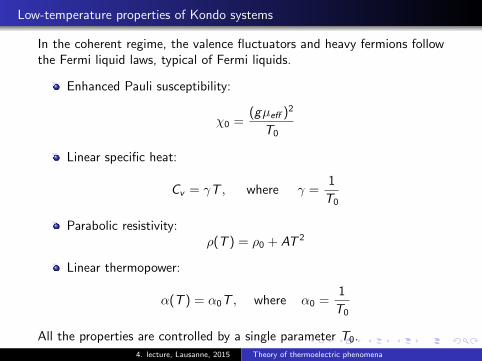
In the coherent regime, the valence fluctuators and heavy fermions followthe Fermi liquid laws, typical of Fermi liquids.
Enhanced Pauli susceptibility:
χ0 =(gµeff )2
T0
Linear specific heat:
Cv = γT , where γ =1
T0
Parabolic resistivity:ρ(T ) = ρ0 + AT 2
Linear thermopower:
α(T ) = α0T , where α0 =1
T0
All the properties are controlled by a single parameter T0.4. lecture, Lausanne, 2015 Theory of thermoelectric phenomena
Consequences of the Fermi liquid laws
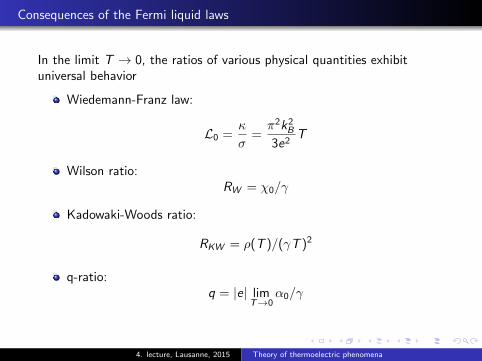
In the limit T → 0, the ratios of various physical quantities exhibituniversal behavior
Wiedemann-Franz law:
L0 =κ
σ=π2k2
B
3e2T
Wilson ratio:RW = χ0/γ
Kadowaki-Woods ratio:
RKW = ρ(T )/(γT )2
q-ratio:q = |e| lim
T→0α0/γ
4. lecture, Lausanne, 2015 Theory of thermoelectric phenomena
10–4
10–3
10–2
10–1
100
101
(A) (B)
102
A (
µΩ
cm
K–2)
102 3 4 5 6
1002 3 4 5 6
10002 3
γ (mJ mol−1 K−2)
CeCu6
N = 8
A/γ2 = 0.36 × 10
−6
µΩ cm K2 mol
2 mJ
−2
N = 6
N = 4
N = 2
A/γ2 = 1 × 10
−5
µΩ cm K2 mol
2 mJ
−2
YbCu4.5Ag0.5
YbCu4Ag
YbCu5
YbNi2Ge2
CeNi9Si4
CeSn3
YbInCu4
YbAl3YbAl2
CeNi
Yb2Co3Ga9
CePd3
YbCuAl
CeAl3
YbRh2Si2
UBe13
CeCu2Si2
UPt3YbNi2B2C
YbRh2Si2
(H = 6T)
CeB6
CeRu2Si2
USn3
UAl2
UPt2 UPt
UIn3
UGa3
YbInAu2
Eu(Pt0.8Ni0.2)2Si2
Eu(Pt0.75Ni0.25)2Si2
N ≅ 8
N ≅ 6
N ≅ 4
N ≅ 2
5 f
SmFe4P12
SmOs4Sb12
α /T
(T
= 0
) (µ
V K
–2)
10
1
0.1
0.01
–0.01
Cu Pd
Bi-2201
(ET)2Cu(NSC)2YbAl3
URu2Si2YbCu2Ag
UBe13
YbCu4.5
YbCu2Sl2
(ET)2Br
NbSe2
NaxCoO2
La 214
UPd2Al3
CoPl2Si2CoRu2Si2
CeColn5
CaAl3
CeCu6CoCu2Si2
Sf2RuO4
–0.1
–1
–10
1 10 100 1000
γ (mJ mol−1 K−2)
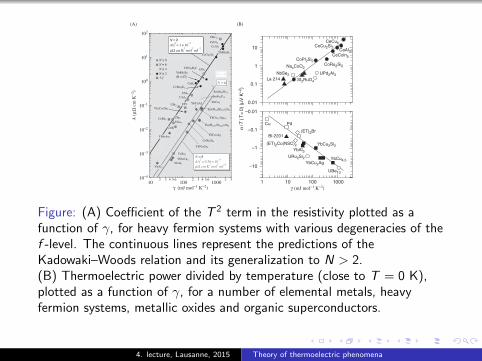
Figure: (A) Coefficient of the T 2 term in the resistivity plotted as afunction of γ, for heavy fermion systems with various degeneracies of thef -level. The continuous lines represent the predictions of theKadowaki–Woods relation and its generalization to N > 2.(B) Thermoelectric power divided by temperature (close to T = 0 K),plotted as a function of γ, for a number of elemental metals, heavyfermion systems, metallic oxides and organic superconductors.
4. lecture, Lausanne, 2015 Theory of thermoelectric phenomena
Theory should account for the FL laws and explain the deviations fromthe universal ratios.
Another puzzling feature of the Fermi liquid state is the pressuredependence shown by the residual resistance ρ0(p) and the coefficient ofthe T 2 term in the low-temperature resistivity
A(p) =ρ(p)− ρ0(p)]
T 2
The pressure data exhibit anomalies at the crossover between variousregimes.
The properties of the FL state and the high-temperature properties seem
to be correlated.
4. lecture, Lausanne, 2015 Theory of thermoelectric phenomena

Pressure dependence of residual resistance in CeCu2Si2
tion is at its narrowest since ambient pressure. As Tc isdriven to zero at high pressure, the superconducting CP jumpbecomes smaller and broader !as shown at 4.67 GPa" until itis no longer visible. When the pressure was reduced, the CPpeak recovered its shape, indicating the reversibility of thebulk pressure-induced behavior.The dramatic increase in the apparent size of the super-
conducting jump is intriguing and might suggest the pres-ence of strong coupling37 or other qualitative change in theSC state. Although the apparent value of (#CP /$T)Tc isclearly less than the BCS ratio of 1.43, similar ac measure-ments on CeCoIn5 in an argon pressure medium indicate thatthere is a substantial contribution to the measured heat ca-pacity from addenda.38 In helium we would expect this to beeven more significantThe increase in the CP jump size might itself be an arti-
fact of the uncalibrated ac calorimetry method; nevertheless,(#CP /$T)Tc does appear to show a maximum at a pressurecoinciding with the increase in Tc . Furthermore, the assump-tion of strong coupling provided the best fit to Hc2 for mea-surements of the upper critical field in another sample.14The electronic specific heat coefficient $ and, hence, the
effective mass m*/m can be estimated by following the calo-rimetric signal C/T at a fixed temperature and measurementfrequency above the superconducting transition, though thisincludes constant or slowly varying addenda from the he-lium, diamonds, etc. Figure 3 shows the estimate $(P),along with the value deduced from measurements of the up-per critical field in Ref. 14. A single constant scale factor hasbeen introduced, showing that the two curves can be super-imposed. There is a clear anomaly in $ at 4 GPa !just belowthe pressure corresponding to Tc
max), superimposed on a con-stant reduction with pressure. The effective mass is also re-flected in the initial slope of the upper critical field Hc2! (Tc),which in our sample also had a maximum at the same pres-sure as the peak in $ .The residual resistivity %0 has a huge peak at a pressure
slightly higher than the maximum in Tc . The magnitude ofthis peak varies by a factor of more than 10 betweensamples.27,14 However, it is possible to scale the residual re-
sistivities from different samples onto the same Lorentziancurve !see Fig. 4". A constant value %0* , different for eachsample, is subtracted from %0 at each pressure, and the resultis multiplied by a scale factor a &i.e., %0!!a(%0"%o*)], sothat all lie on the curve defined by sample S1, which has thehighest residual resistivity !i.e., aS1!1).According to the theoretical prediction, the residual resis-
tivity %0 is given as21
%0!Bn imp!u!0 "!2ln"# "'n f'( f
$)% NF"#%0
unit , !6"
where the coefficient B depends on the band structure of hostmetals, n imp is the concentration of impurities with moderatescattering potential u(q) coming from disorder other than Ceions, NF is the density of states of quasiparticles around theFermi level, and the last term represents the residual resis-tivity due to unitary scattering mainly arising from any defi-cit or defect of the Ce ions. The scaling behavior of %0shown in Fig. 4 would be possible if the universal form isgiven by ln!("'nf /'(f)) /NF!. It is an open question whetherthe observed Lorentzian form is indeed reproduced by thetheory of Ref. 22.There is a striking correlation between the scaling factor a
and the behavior of Tc . The sample measured in heliumreported in this paper and sample C1, pressurized in steatite,both have similar values of a, and both Tc
onset and TcR!0 agree
over almost the entire pressure range. Sample S1, with thehighest %0 at Pv , has a lower Tc
max (&1.2 K", and the super-conductivity disappears at a lower pressure. Samples C2 andS2 have scaling factors a around 14, and show a highermaximum Tc , with superconductivity extended over agreater pressure range than in the samples with larger re-sidual resistivities. These differences between samples, bothin %0 and Tc , are vastly amplified from their appearance atambient pressure. According to Eq. !6", the scaling factor a is
FIG. 3. Estimate $(P) of the Sommerfeld coefficient from an accalorimetry signal at 2 K !triangles", scaled for comparison withthat deduced from Hc2 measurements !squares" !Ref. 14". The noiseon the calorimetry signal is smaller than the symbol size; however,see text for a discussion of possible systematic errors.
FIG. 4. Enhancement of residual resistivity in several differentCeCu2Si2 samples, scaled to a universal pressure dependence, witha and %0* being normalizing factors. The maximum in %0 is at apressure slightly higher than that corresponding to the maximum inTc . The inset shows n for a fit of %!%0#ATn. Solid squares indi-cate results from this work; the rest are reported in Ref. 27 !S and Crefer to the original labels and a retained for continuity".
SIGNATURES OF VALENCE FLUCTUATIONS IN . . . PHYSICAL REVIEW B 69, 024508 !2004"
024508-5
Figure: Enhancement of residual resistivity in several samples, scaled to auniversal pressure dependence. (a and ρ∗0 are normalizing factors.)
4. lecture, Lausanne, 2015 Theory of thermoelectric phenomena
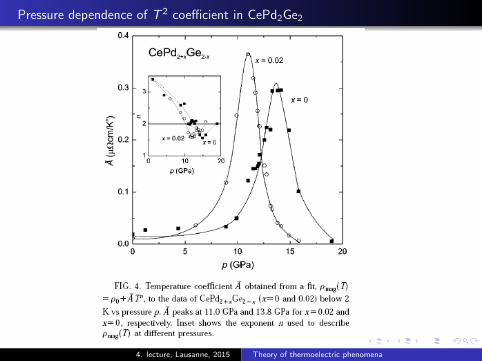
Pressure dependence of T 2 coefficient in CePd2Ge2
4. lecture, Lausanne, 2015 Theory of thermoelectric phenomena
00.001
0.01
0.1
1
0.2
1
10
T (
K)
100
300
(A)
(B)
5 10 15 20
Superconductingphase
Magneticphase
CeCu2Ge2
Tc
max
max
T2
TM
T1
250
10
20
30
40
P (GPa)
A (µ
! c
m K
–2)
"0
(µ
! c
m)
20 100
0.01
0.1
1CeCu2Si2:
C1C2S2This work
CeCu2Ge2:
#1#2
A (
µ!
cm
K–
2)
T" (K)
1 10 1000
50
100
150
CeCu2Si2(0 GPa)
" (
µ!
cm
)
T (K)
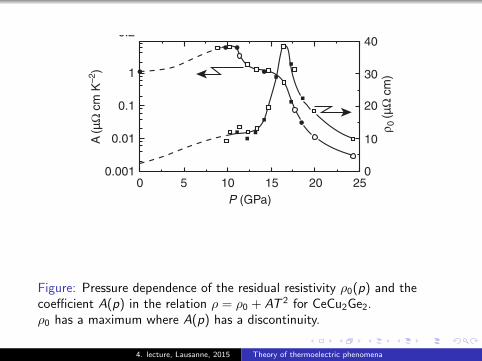
Figure: Pressure dependence of the residual resistivity ρ0(p) and thecoefficient A(p) in the relation ρ = ρ0 + AT 2 for CeCu2Ge2.ρ0 has a maximum where A(p) has a discontinuity.
4. lecture, Lausanne, 2015 Theory of thermoelectric phenomena
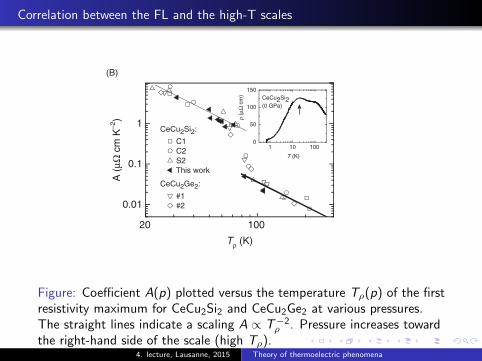
Correlation between the FL and the high-T scales
00.001
0.01
0.1
1
0.2
1
10
T (
K)
100
300
(A)
(B)
5 10 15 20
Superconductingphase
Magneticphase
CeCu2Ge2
Tc
max
max
T2
TM
T1
250
10
20
30
40
P (GPa)
A (µ
! c
m K
–2)
"0
(µ
! c
m)
20 100
0.01
0.1
1CeCu2Si2:
C1C2S2This work
CeCu2Ge2:
#1#2
A (
µ!
cm
K–
2)
T" (K)
1 10 1000
50
100
150
CeCu2Si2(0 GPa)
" (
µ!
cm
)
T (K)
Figure: Coefficient A(p) plotted versus the temperature Tρ(p) of the firstresistivity maximum for CeCu2Si2 and CeCu2Ge2 at various pressures.The straight lines indicate a scaling A ∝ T−2
ρ . Pressure increases towardthe right-hand side of the scale (high Tρ).
4. lecture, Lausanne, 2015 Theory of thermoelectric phenomena
Description of the HF and VF compounds at low temperatures
To describe the HF and the FV systems in the coherent regime we usethe periodic Anderson model with SU(N) symmetry.N is the effective degeneracy of the 4f states.
The hybridization can mix only the states which belong to the same irep,so the model describes N conduction channels connected in parallel.
For nf electrons per Ce ion and nc electrons per conduction channel,there are n = Nnc + nf ≤ 2 electrons at each lattice site.
The description based on this model is a drastic simplification withrespect to the real materials and the model applies only to the low-energypart of the excitation spectrum.
However, the model describes the effects of local correlations and if thesecorrelations are causing the low-temperature anomalies, the qualitativefeatures should be captured by the solution.
4. lecture, Lausanne, 2015 Theory of thermoelectric phenomena
Difficulties with the periodic Anderson model
The difficulty is that, unlike the single impurity models, the latticemodels with on-site correlation can be solved accurately only in somelimiting cases.
Thus, we do not really know if these effective models really explain theanomalies that one finds in the experimental data.
Recently, there are serious efforts to combine the band structure of theVF and HF compounds with the many body treatment of localcorrelations, the so called DMFT approach.
The DMFT provides the solution of the lattice problem with on-sitecorrelations at all temperatures and is very promising. But more work isto be done.
4. lecture, Lausanne, 2015 Theory of thermoelectric phenomena
Fermi liquid description of the low-temperature state
The solution at low temperatures can be obtained using Landau’squasiparticle description.
The universal behavior shown by the low-temperature experimental datapoints to a single relevant Fermi liquid scale. Choose,
T0 '1
γ
The specific heat coefficient γ can either be taken from the experimentor calculated, together with the chemical potential µ, for the system inthermal equilibrium.
Once T0 is fixed, we can express all other physical quantities as theuniversal functions of T/T0 or ω/T0.
4. lecture, Lausanne, 2015 Theory of thermoelectric phenomena
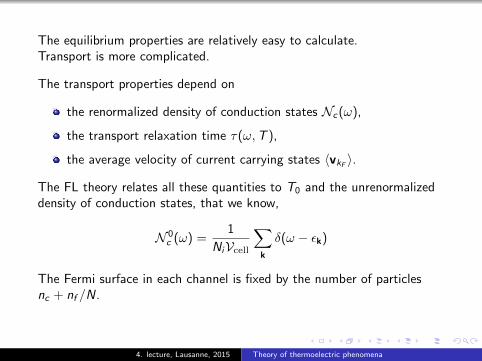
The equilibrium properties are relatively easy to calculate.Transport is more complicated.
The transport properties depend on
the renormalized density of conduction states Nc (ω),
the transport relaxation time τ(ω,T ),
the average velocity of current carrying states 〈vkF〉.
The FL theory relates all these quantities to T0 and the unrenormalizeddensity of conduction states, that we know,
N 0c (ω) =
1
NiVcell
∑k
δ(ω − εk)
The Fermi surface in each channel is fixed by the number of particlesnc + nf /N.
4. lecture, Lausanne, 2015 Theory of thermoelectric phenomena
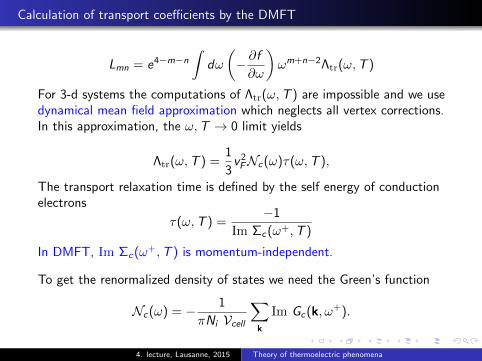
Calculation of transport coefficients by the DMFT
Lmn = e4−m−n
∫dω
(− ∂f∂ω
)ωm+n−2Λtr(ω,T )
For 3-d systems the computations of Λtr(ω,T ) are impossible and we usedynamical mean field approximation which neglects all vertex corrections.In this approximation, the ω,T → 0 limit yields
Λtr(ω,T ) =1
3v2
FNc (ω)τ(ω,T ),
The transport relaxation time is defined by the self energy of conductionelectrons
τ(ω,T ) =−1
Im Σc (ω+,T )
In DMFT, Im Σc (ω+,T ) is momentum-independent.
To get the renormalized density of states we need the Green’s function
Nc (ω) = − 1
πNi Vcell
∑k
Im Gc (k, ω+).
4. lecture, Lausanne, 2015 Theory of thermoelectric phenomena
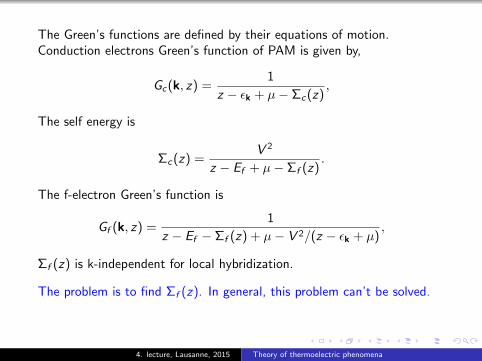
The Green’s functions are defined by their equations of motion.Conduction electrons Green’s function of PAM is given by,
Gc (k, z) =1
z − εk + µ− Σc (z),
The self energy is
Σc (z) =V 2
z − Ef + µ− Σf (z).
The f-electron Green’s function is
Gf (k, z) =1
z − Ef − Σf (z) + µ− V 2/(z − εk + µ),
Σf (z) is k-independent for local hybridization.
The problem is to find Σf (z). In general, this problem can’t be solved.
4. lecture, Lausanne, 2015 Theory of thermoelectric phenomena
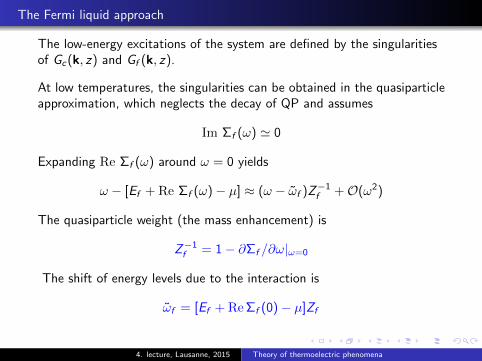
The Fermi liquid approach
The low-energy excitations of the system are defined by the singularitiesof Gc (k, z) and Gf (k, z).
At low temperatures, the singularities can be obtained in the quasiparticleapproximation, which neglects the decay of QP and assumes
Im Σf (ω) ' 0
Expanding Re Σf (ω) around ω = 0 yields
ω − [Ef + Re Σf (ω)− µ] ≈ (ω − ωf )Z−1f +O(ω2)
The quasiparticle weight (the mass enhancement) is
Z−1f = 1− ∂Σf /∂ω|ω=0
The shift of energy levels due to the interaction is
ωf = [Ef + ReΣf (0)− µ]Zf
4. lecture, Lausanne, 2015 Theory of thermoelectric phenomena
The Fermi liquid approach
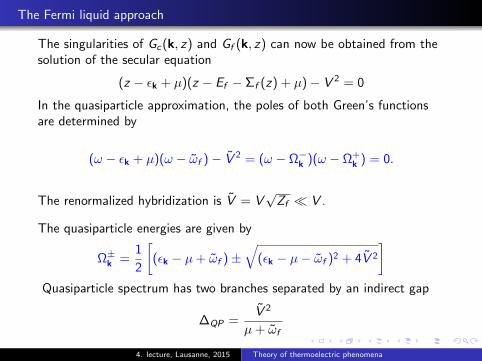
The singularities of Gc (k, z) and Gf (k, z) can now be obtained from thesolution of the secular equation
(z − εk + µ)(z − Ef − Σf (z) + µ)− V 2 = 0
In the quasiparticle approximation, the poles of both Green’s functionsare determined by
(ω − εk + µ)(ω − ωf )− V 2 = (ω − Ω−k )(ω − Ω+k ) = 0.
The renormalized hybridization is V = V√Zf V .
The quasiparticle energies are given by
Ω±k =1
2
[(εk − µ+ ωf )±
√(εk − µ− ωf )2 + 4V 2
]Quasiparticle spectrum has two branches separated by an indirect gap
∆QP =V 2
µ+ ωf
4. lecture, Lausanne, 2015 Theory of thermoelectric phenomena
Non-interacting quasiparticles
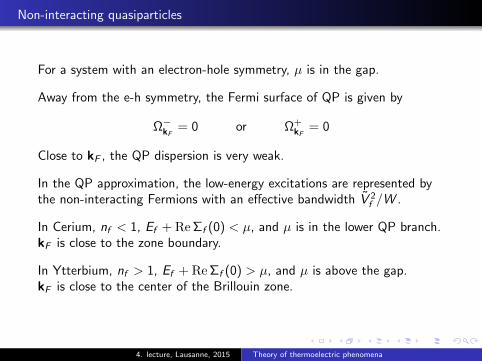
For a system with an electron-hole symmetry, µ is in the gap.
Away from the e-h symmetry, the Fermi surface of QP is given by
Ω−kF= 0 or Ω+
kF= 0
Close to kF , the QP dispersion is very weak.
In the QP approximation, the low-energy excitations are represented bythe non-interacting Fermions with an effective bandwidth V 2
f /W .
In Cerium, nf < 1, Ef + ReΣf (0) < µ, and µ is in the lower QP branch.kF is close to the zone boundary.
In Ytterbium, nf > 1, Ef + ReΣf (0) > µ, and µ is above the gap.kF is close to the center of the Brillouin zone.
4. lecture, Lausanne, 2015 Theory of thermoelectric phenomena
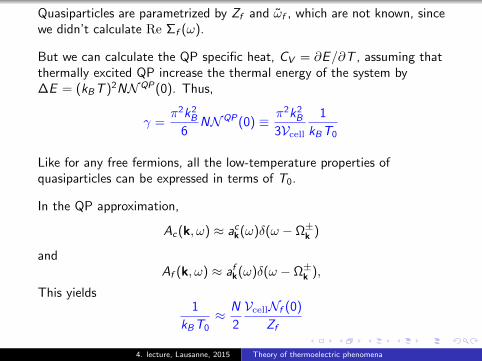
Quasiparticles are parametrized by Zf and ωf , which are not known, sincewe didn’t calculate Re Σf (ω).
But we can calculate the QP specific heat, CV = ∂E/∂T , assuming thatthermally excited QP increase the thermal energy of the system by∆E = (kBT )2NNQP (0). Thus,
γ =π2k2
B
6NNQP (0) ≡ π2k2
B
3Vcell1
kBT0
Like for any free fermions, all the low-temperature properties ofquasiparticles can be expressed in terms of T0.
In the QP approximation,
Ac (k, ω) ≈ ack(ω)δ(ω − Ω±k )
andAf (k, ω) ≈ af
k(ω)δ(ω − Ω±k ),
This yields1
kBT0≈ N
2
VcellNf (0)
Zf
4. lecture, Lausanne, 2015 Theory of thermoelectric phenomena
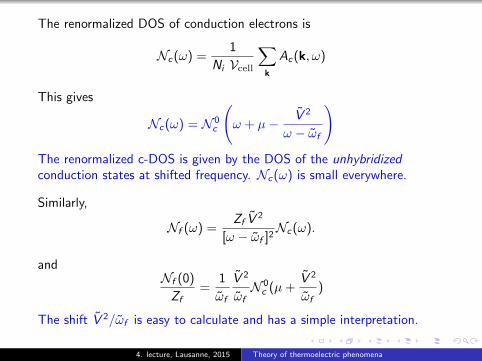
The renormalized DOS of conduction electrons is
Nc (ω) =1
Ni Vcell
∑k
Ac (k, ω)
This gives
Nc (ω) = N 0c
(ω + µ− V 2
ω − ωf
)The renormalized c-DOS is given by the DOS of the unhybridizedconduction states at shifted frequency. Nc (ω) is small everywhere.
Similarly,
Nf (ω) =Zf V
2
[ω − ωf ]2Nc (ω).
andNf (0)
Zf=
1
ωf
V 2
ωfN 0
c (µ+V 2
ωf)
The shift V 2/ωf is easy to calculate and has a simple interpretation.
4. lecture, Lausanne, 2015 Theory of thermoelectric phenomena
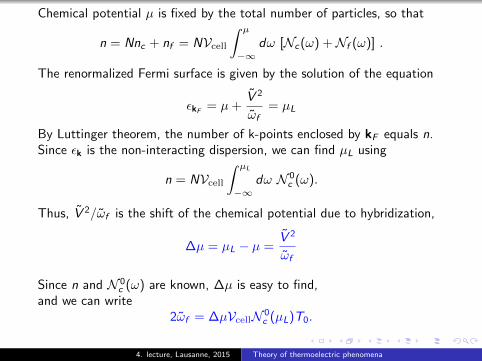
Chemical potential µ is fixed by the total number of particles, so that
n = Nnc + nf = NVcell∫ µ
−∞dω [Nc (ω) +Nf (ω)] .
The renormalized Fermi surface is given by the solution of the equation
εkF= µ+
V 2
ωf= µL
By Luttinger theorem, the number of k-points enclosed by kF equals n.Since εk is the non-interacting dispersion, we can find µL using
n = NVcell∫ µL
−∞dω N 0
c (ω).
Thus, V 2/ωf is the shift of the chemical potential due to hybridization,
∆µ = µL − µ =V 2
ωf
Since n and N 0c (ω) are known, ∆µ is easy to find,
and we can write2ωf = ∆µVcellN 0
c (µL)T0.
4. lecture, Lausanne, 2015 Theory of thermoelectric phenomena
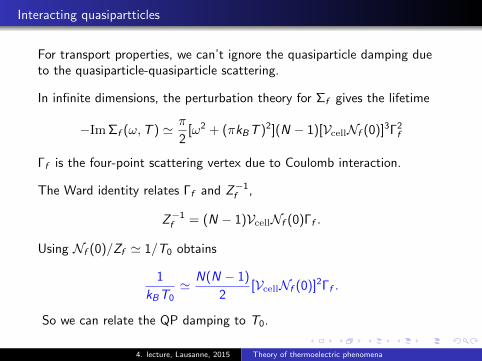
Interacting quasipartticles
For transport properties, we can’t ignore the quasiparticle damping dueto the quasiparticle-quasiparticle scattering.
In infinite dimensions, the perturbation theory for Σf gives the lifetime
−ImΣf (ω,T ) ' π
2[ω2 + (πkBT )2](N − 1)[VcellNf (0)]3Γ2
f
Γf is the four-point scattering vertex due to Coulomb interaction.
The Ward identity relates Γf and Z−1f ,
Z−1f = (N − 1)VcellNf (0)Γf .
Using Nf (0)/Zf ' 1/T0 obtains
1
kBT0' N(N − 1)
2[VcellNf (0)]2Γf .
So we can relate the QP damping to T0.
4. lecture, Lausanne, 2015 Theory of thermoelectric phenomena
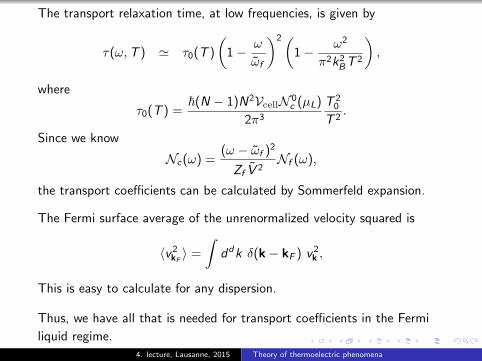
The transport relaxation time, at low frequencies, is given by
τ(ω,T ) ' τ0(T )
(1− ω
ωf
)2(1− ω2
π2k2BT
2
),
where
τ0(T ) =~(N − 1)N2VcellN 0
c (µL)
2π3
T 20
T 2.
Since we know
Nc (ω) =(ω − ωf )2
Zf V 2Nf (ω),
the transport coefficients can be calculated by Sommerfeld expansion.
The Fermi surface average of the unrenormalized velocity squared is
〈v2kF〉 =
∫ddk δ(k− kF ) v2
k ,
This is easy to calculate for any dispersion.
Thus, we have all that is needed for transport coefficients in the Fermi
liquid regime.4. lecture, Lausanne, 2015 Theory of thermoelectric phenomena
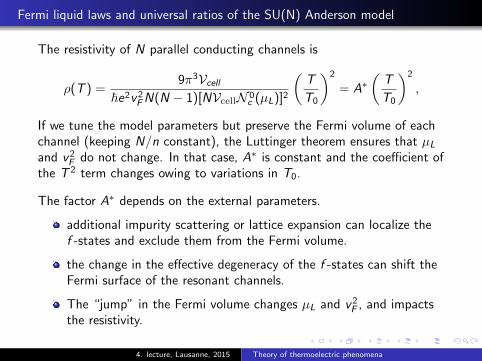
Fermi liquid laws and universal ratios of the SU(N) Anderson model
The resistivity of N parallel conducting channels is
ρ(T ) =9π3Vcell
~e2v2FN(N − 1)[NVcellN 0
c (µL)]2
(T
T0
)2
= A∗(
T
T0
)2
,
If we tune the model parameters but preserve the Fermi volume of eachchannel (keeping N/n constant), the Luttinger theorem ensures that µL
and v2F do not change. In that case, A∗ is constant and the coefficient of
the T 2 term changes owing to variations in T0.
The factor A∗ depends on the external parameters.
additional impurity scattering or lattice expansion can localize thef -states and exclude them from the Fermi volume.
the change in the effective degeneracy of the f -states can shift theFermi surface of the resonant channels.
The “jump” in the Fermi volume changes µL and v2F , and impacts
the resistivity.
4. lecture, Lausanne, 2015 Theory of thermoelectric phenomena

The Sommerfeld expansion for L12 and L11 gives the Seebeck coefficient
α(T ) ' ± 4π2kB
|e|N∆µVcellN 0c (µL)
T
T0.
The sign of α(T ) is positive for Ce- and Eu-based systems andnegative for Yb-based ones.
∆µ has an explicit parameter dependence. Strictly speaking,α(T ) is not a universal function of T/T0.
For nf ' 1 and large N we can write
α(T ) = ±4π2kB
nf |e|T
T0.
The closer the system to half-filling, the larger the slope, α/T ∝ 1/T0.Large slope does not imply large α(T ) at finite temperatures, since theFL laws are only valid for T T0. Close to half-filling, T0 isexponentially small.
4. lecture, Lausanne, 2015 Theory of thermoelectric phenomena
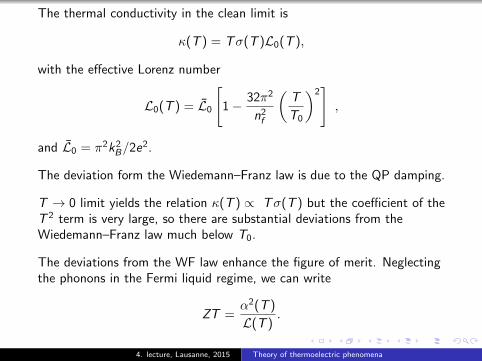
The thermal conductivity in the clean limit is
κ(T ) = Tσ(T )L0(T ),
with the effective Lorenz number
L0(T ) = L0
[1− 32π2
n2f
(T
T0
)2],
and L0 = π2k2B/2e2.
The deviation form the Wiedemann–Franz law is due to the QP damping.
T → 0 limit yields the relation κ(T ) ∝ Tσ(T ) but the coefficient of theT 2 term is very large, so there are substantial deviations from theWiedemann–Franz law much below T0.
The deviations from the WF law enhance the figure of merit. Neglectingthe phonons in the Fermi liquid regime, we can write
ZT =α2(T )
L(T ).
4. lecture, Lausanne, 2015 Theory of thermoelectric phenomena

The KW ratio, ρ(T )/(γT )2, reads
RKW =81
hk2Be
2
V3cell
v2F [NVcellN 0
c (µL)]2
112N(N − 1)
RKW exhibits an explicit dependence on the ground-state degeneracy andthe average velocity (squared), and an implicit dependence on the Fermivolume (i.e., on the carrier concentration n).
The q-ratio is
q = limT→0|eα|/γT ' 12/[N∆µ N 0
c (µL)],
∆µ has an explicit parameter dependence, so that the q-ratio can deviatefrom the universal value.
The transfer of f -electrons into the conduction band makes the q-ratiopressure-dependent.
Data on the hydrostatic pressure-dependence of the q-ratio are not yetavailable, but the deviations from the universal value are indicated bychemical pressure experiments.
4. lecture, Lausanne, 2015 Theory of thermoelectric phenomena
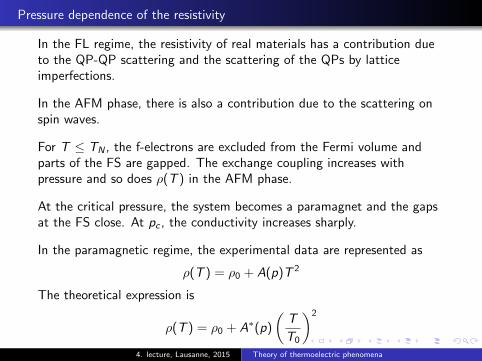
Pressure dependence of the resistivity
In the FL regime, the resistivity of real materials has a contribution dueto the QP-QP scattering and the scattering of the QPs by latticeimperfections.
In the AFM phase, there is also a contribution due to the scattering onspin waves.
For T ≤ TN , the f-electrons are excluded from the Fermi volume andparts of the FS are gapped. The exchange coupling increases withpressure and so does ρ(T ) in the AFM phase.
At the critical pressure, the system becomes a paramagnet and the gapsat the FS close. At pc , the conductivity increases sharply.
In the paramagnetic regime, the experimental data are represented as
ρ(T ) = ρ0 + A(p)T 2
The theoretical expression is
ρ(T ) = ρ0 + A∗(p)
(T
T0
)2
4. lecture, Lausanne, 2015 Theory of thermoelectric phenomena
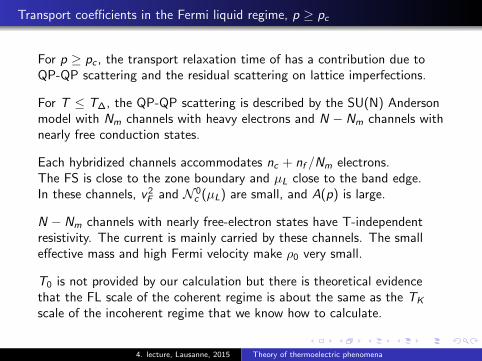
Transport coefficients in the Fermi liquid regime, p ≥ pc
For p ≥ pc , the transport relaxation time of has a contribution due toQP-QP scattering and the residual scattering on lattice imperfections.
For T ≤ T∆, the QP-QP scattering is described by the SU(N) Andersonmodel with Nm channels with heavy electrons and N − Nm channels withnearly free conduction states.
Each hybridized channels accommodates nc + nf /Nm electrons.The FS is close to the zone boundary and µL close to the band edge.In these channels, v2
F and N 0c (µL) are small, and A(p) is large.
N − Nm channels with nearly free-electron states have T-independentresistivity. The current is mainly carried by these channels. The smalleffective mass and high Fermi velocity make ρ0 very small.
T0 is not provided by our calculation but there is theoretical evidencethat the FL scale of the coherent regime is about the same as the TK
scale of the incoherent regime that we know how to calculate.
4. lecture, Lausanne, 2015 Theory of thermoelectric phenomena
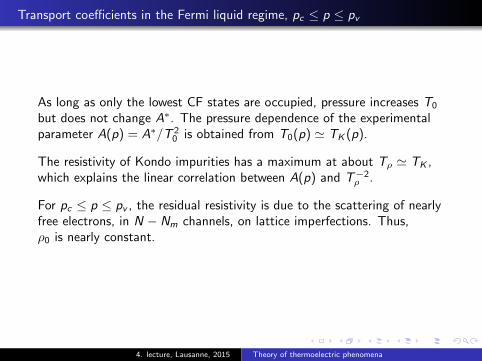
Transport coefficients in the Fermi liquid regime, pc ≤ p ≤ pv
As long as only the lowest CF states are occupied, pressure increases T0
but does not change A∗. The pressure dependence of the experimentalparameter A(p) = A∗/T 2
0 is obtained from T0(p) ' TK (p).
The resistivity of Kondo impurities has a maximum at about Tρ ' TK ,which explains the linear correlation between A(p) and T−2
ρ .
For pc ≤ p ≤ pv , the residual resistivity is due to the scattering of nearlyfree electrons, in N − Nm channels, on lattice imperfections. Thus,ρ0 is nearly constant.
4. lecture, Lausanne, 2015 Theory of thermoelectric phenomena
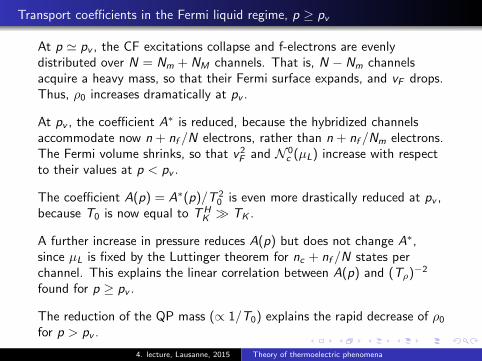
Transport coefficients in the Fermi liquid regime, p ≥ pv
At p ' pv , the CF excitations collapse and f-electrons are evenlydistributed over N = Nm + NM channels. That is, N − Nm channelsacquire a heavy mass, so that their Fermi surface expands, and vF drops.Thus, ρ0 increases dramatically at pv .
At pv , the coefficient A∗ is reduced, because the hybridized channelsaccommodate now n + nf /N electrons, rather than n + nf /Nm electrons.The Fermi volume shrinks, so that v2
F and N 0c (µL) increase with respect
to their values at p < pv .
The coefficient A(p) = A∗(p)/T 20 is even more drastically reduced at pv ,
because T0 is now equal to THK TK .
A further increase in pressure reduces A(p) but does not change A∗,since µL is fixed by the Luttinger theorem for nc + nf /N states perchannel. This explains the linear correlation between A(p) and (Tρ)−2
found for p ≥ pv .
The reduction of the QP mass (∝ 1/T0) explains the rapid decrease of ρ0
for p > pv .
4. lecture, Lausanne, 2015 Theory of thermoelectric phenomena
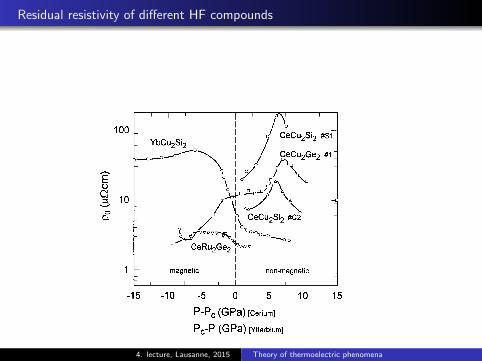
Residual resistivity of different HF compounds
Fig. 3. The superconducting transition of CeCu!Si
!and
CeCu!Ge
!!1 and !2 close to the !
!(P) maximum. For
CeCu!Si
!data recorded in a magnetic field of 3 T are included.
The transition is shown in detail in the inset.
Fig. 4. Residual resistivity of di!erent HF compounds. Thecritical pressure P
!(GPa) "8, 8.7, 9.4 and !1 for YbCu
!Si
!,
CeRu!Ge
!CeCu
!Ge
!!1 and CeCu
!Si
!, respectively.
For example, CeNi!Ge
![18] seems to correspond to
CeCu!Ge
!at 16 GPa, i.e. far above P
!when !"#$
"+
80 K and !!
is maximum. Another example is the !"#$"
minimum of CeCu!
for P(P![10] which appears to be
qualitatively similar to that of CeCu!Ge
!in Fig. 1. Addi-
tionally, the profound unity between metallic Ce-basedHF compounds is reflected by their thermopower behav-iour [5]. It is, e.g. striking that a strong resemblancebetween the thermopowers of CeRu
!Si
!at ambient
P and CeCu!Si
!at 4 GPa is found although the resistivi-
ties are di!erent.Unusual resistive transitions of certain samples of
CeCu!Ge
!and CeCu
!Si
!at pressures of the !
!(P) max-
imum gives further hints about the enhancement ofsuperconductivity. In Fig. 3, sample !1 of CeCu
!Ge
!shows a standard transition at !
!+1.8 K. For
!(1.4 K, its resistivity has dropped below our thre-shold detection level of 10#$ !!cm. Thus, in comparisonto the normal phase resistivity, a drop of " by more thanfive decades is observed. Sample !2 which has been cutfrom the same crystallite has a di!erent behaviour. Below&1.8 K, the drop of " is modest until !
!&0.55 K, where
superconductivity sets in. The ohmic response of sample!2 to very di!erent excitation currents suggests thatbelow 1.8 K the "-drop is not due to superconductingtraces. Without any other results, the change of slope of" near 1.8 K would be interpreted as a sign of magneticordering.
The resistive transition of CeCu!Si
!can also exhibit
surprising structures as shown in Fig. 3 for two "(!)-curves of CeCu
!Si
!in zero field and in B"3 T. The
main transition in zero field is located at !!+2.4 K,
but at lower ! a very small ohmic contribution re-
mains down to &1.5 K (see inset Fig. 3). In a magneticfield this contribution shifts to lower ! as the maintransition does. These observations do not necessarilyreflect the sample imperfection and tend to indicatethat the superconductivity is likely di!erent when !
!is enhanced. It might be possible that the !
!enhance-
ment occurs in a small part of the sample volume.Finally, one can note that the higher "
%value of
CeCu!Si
!the less pronounced pressure-induced !
!en-
hancement seems. For high "%
values, !!increases only
up to 1.2 K.
4. Residual scattering in HF compounds
Analysis of "(!)-data are most often done according toseveral hypotheses which are seldom discussed. Forexample, although not always independent, various scat-tering mechanisms are assumed to give additive contri-butions to ". For a real crystal, the residual resistivity"%
ascribed to the disorder (all types of defects: impurity,vacancy, etc.) is considered as temperature independent.Fig. 4 shows that in various HF compounds "
%varies
considerably between the magnetic and non-magneticregions or in the P-interval where !
!(P) changes. It
appears that "%
strongly depends on electronic correla-tions present in the systems considered. The structures in"%(P), with very di!erent magnitudes, are not necessarily
centered at P!, as observed for CeAl
&single crystals [19]
and their origin seems to be divers. At pressures close tothe !
!(P) maximum, the magnitude of the "
%-peak of
CeCu!Si
!and CeCu
!Ge
!is very sample dependent
[4,15]. The occurrence of this peak can be associated to
4 D. Jaccard et al. / Physica B 259—261 (1999) 1—7
Figure: Residual resistivity of different HF compounds.
4. lecture, Lausanne, 2015 Theory of thermoelectric phenomena
Comparison with experiment
In CeRu2Ge2 and CePd2−x Ge2−x , the transition at pc is directly into thefully degenerate 4f spin-orbit multiplet. At pc , the conduction electronsbecome heavy, so A(p) and ρ0(p) become very large.
Above pc , the coefficient A∗ is pressure independent, so that the rapiddecrease of A(p) and ρ0(p) is caused by the increase of T0 ' TK .
YbCu2Si2, at ambient pressure, is a valence fluctuator. An increase ofpressure stabilizes 4f 13-configuration and gives rise to a HF state in all 8channels of the j = 7/2 multiplet. Pressure increases the effective mass,so that ρ0 increases with pressure.
At higher pressure, the CF excitations start to appear, and, eventually,the effective degeneracy of the 4f -hole drops from N = 8 to N = 2. Thetransport is through the N − 2 “nonresonant” sub-bands, so that ρ0
drops abruptly.
4. lecture, Lausanne, 2015 Theory of thermoelectric phenomena

4. lecture, Lausanne, 2015 Theory of thermoelectric phenomena
4. lecture, Lausanne, 2015 Theory of thermoelectric phenomena

4. lecture, Lausanne, 2015 Theory of thermoelectric phenomena

4. lecture, Lausanne, 2015 Theory of thermoelectric phenomena

4. lecture, Lausanne, 2015 Theory of thermoelectric phenomena