Embed Size (px)
Citation preview

Equity Research 5.30 France 360_CR Sponsored Research
IMPORTANT. Please refer to the last page of this report for “Important disclosures” and analyst(s) certifications.
keplercheuvreux.com
Theradiag Buy (Buy)
France | Medtech & services | MCAP EUR 19.0m Target Price EUR 5.30 29 April 2015
Current Price
Up/downside
Change in TP
Change in EPS
none
EUR 3.6
47.2%
-13.11%
down nm 2015E
Monitoring the way forward
Lionel Labourdette, PhD, MBA [email protected]
+33 1 70 81 57 98 Market data
Market cap (EURm) 19
Free float 63%
No. of shares outstanding (m) 5
Avg. daily trading volume('000) 5
YTD abs performance -5.0%
52-week high (EUR) 5.74
52-week low (EUR) 3.42
FY to 31/12 (EUR) 2015E 2016E 2017E
Sales (m) 7.6 9.5 12.2
EBITDA adj (m) -2.7 -2.2 -1.7
EBIT adj (m) -3.4 -3.0 -2.6
Net profit adj (m) -3.1 -2.7 -2.6
Net fin. debt (m) -1.0 -0.1 1.0
FCF (m) -3.0 -3.0 -3.1
EPS adj. and fully dil. -0.59 -0.49 -0.43
Consensus EPS -0.36 0.01 na
Net dividend 0.00 0.00 0.00
FY to 31/12 (EUR) 2015E 2016E 2017E
P/E (x) adj and ful. dil. na na na
EV/EBITDA (x) na na na
EV/EBIT (x) na na na
FCF yield na na na
Dividend yield 0.0% 0.0% 0.0%
Net fin.debt/EBITDA 0.4 0.0 -0.6
Gearing na na 25.0%
ROIC na na na
EV/IC (x) 10.6 11.2 11.1
Theradiag has transformed from a run-of-the-mill distributor into an innovation-driven company developing and selling high-value-added kits, especially in the field of biotherapy monitoring. The shift in the product mix is already having a positive impact on margins. With an expanding offer, the group is likely to post solid growth over the next five years. Buy.
2014: a year of inflection As was to be expected, cleaning up Theradiag’s portfolio had an impact on the group’s top line in 2009-13 (-40%). However, it posted a 5% increase in revenues in 2014, announcing a return to sustainable growth, supported by a new range of proprietary products. The growing share of “in-house” products (higher margins) has already positively affected gross margins (69% vs. c. 50% in 2009), which we expected to continue over the next five years.
R&D pipeline: significant progress, HIV tropism kit fails The change in the business model required significant R&D investments to develop a proprietary offer. At the start of 2015, with Lisa Tracker, Theradiag owned the largest offer in biotherapy monitoring (antibody-based therapies for inflammatory diseases and several types of cancer). The company also made progress in microRNA-based detection kits (cancer and HIV/AIDS). The company has, however, failed to demonstrate a significant advantage for its HIV tropism kit, whose commercial potential was uncertain.
Theranostics: payors slow to make reimbursement decisions The biotherapy monitoring allows for better management of diseases (prevents resistance/intolerance to the drug), and it may help to improve posology (dosage and timing). Savings have been demonstrated, but payors have not yet prioritised the dossier. The revenues of large pharma companies are potentially under pressure (lobbying?). Positive decisions in some countries are likely, but we think the best approach for Theradiag would be to develop companion tests for new therapies that will support future prescriptions rather than being a threat to its current cash cows.
Buy, TP cut from EUR6.10 to EUR5.30 The group’s 2014 figures and the recent partnership with UCB make us confident about its recovery. Lisa Tracker is meeting doctors’ and patients’ expectations and is likely to deliver sustainable growth sooner or later. We think the current price is an attractive level to play this story. Thus, we remain positive on the stock with a Buy rating. However, the tight cash position is likely to put pressure on the stock. TP cut from EUR6.10 to EUR5.30.
KEPLER CHEUVREUX and the issuer have agreed that KEPLER CHEUVREUX will produce and disseminate investment research on the said issuer as a service to the issuer.

Theradiag Buy TP EUR 5.30
2 keplercheuvreux.com
Company summary Market data
Theradiag is a diagnostics company specialised in the development and marketing of high-value-
added kits for autoimmune and inflammatory diseases. The company has also developed a franchise
in the growing segment of microRNA-based diagnostic technologies (new reliable disease signatures).
The business model is based on direct sales in France and long-term distribution partnerships abroad.
Theradiag plans to become a leader in the monitoring of biotherapies.
Market cap (EUR) Free float market cap (EUR) No. of shares outstanding (m) 3m avg. daily vol ('000) YTD abs. performance 52-week high (EUR) 52-week low (EUR)
19.2m 63.0
5 5
-5.0% 5.74 3.42
Management Key shareholders
Gérard Tobelem, Chairman
Michel Finance, CEO
Truffle Capital 32.0% Holding incubatrice Biotech 2.0% Management 2.0%
Strengths Weaknesses
Brand image, quality and reliability of productsBrand image, quality and reliability of products
Largest offer in the monitoring of biotherapiesLargest offer in the monitoring of biotherapies
Solid record in the development of diagnostic kitsSolid record in the development of diagnostic kits
Collaboration with UCBCollaboration with UCB
No reimbursment of Lisa Tracker to dateNo reimbursement of Lisa Tracker to date
Exposure to French market still very highExposure to the French market still very high
No proprietary biological markersNo proprietary biological markers Tight cash positionTight cash position
Opportunities Threats
Partnerships with members of the ABIRISK consortiumPartnerships with members of the ABIRISK consortium
Companion tests for new biotherapiesCompanion tests for new biotherapies
miRNA-based diagnostics and theranostics kitsmiRNA-based diagnostics and theranostics kits
Approval of biosimilars of key antibodiesApproval of biosimilars of key antibodies
Failures in clinical validationFailures in clinical validation Delay in the penetration of the US marketDelay in the penetration of the
US marketLong delay in reimbursement process Long delay in reimbursement process Lobbying from biotherapies manufacturersLobbying from biotherapies
manufacturers
Key financials (please see the end of this report for full financials) Per share data 2012 2013 2014 2015E 2016E 2017E
EPS adj and fully diluted -0.25 -0.46 -0.63 -0.59 -0.49 -0.43 Cash flow per share -0.11 -0.79 -0.49 -0.41 -0.39 -0.36 Book value per share 2.20 1.99 1.28 1.06 0.80 0.60 DPS 0.00 0.00 0.00 0.00 0.00 0.00 Valuation
P/E adjusted and fully diluted na na na na na na P/CF na na na na na na P/BV 2.4 2.2 3.7 3.4 4.5 6.0 Dividend yield (%) 0.0% 0.0% 0.0% 0.0% 0.0% 0.0% FCF yield (%) -4.3% -22.5% -14.3% -15.7% -14.4% -13.5% EV/Sales 1.9 2.3 3.2 2.4 2.2 2.0 EV/EBITDA na na na na na na EV/EBIT na na na na na na Income statement (EURm)
Sales 8.3 6.8 7.1 7.6 9.5 12.2 % Change -18.7% -18.1% 5.2% 6.5% 25.6% 28.1%
EBITDA adjusted -0.3 -1.7 -2.7 -2.7 -2.2 -1.7 EBIT adjusted -1.0 -2.0 -3.3 -3.4 -3.0 -2.6 Adjusted EBIT margin (%) -11.9% -29.2% -46.2% -44.6% -31.8% -21.1% Net profit reported -1.0 -1.9 -3.0 -3.1 -2.7 -2.6 Net profit adjusted -1.0 -1.9 -3.0 -3.1 -2.7 -2.6 Cash flow statement (EURm)
CF from operating activities -0.4 -3.3 -2.5 -2.2 -2.3 -2.3 Capex -0.4 -0.9 -1.0 -0.8 -0.7 -0.8 Free cash flow -0.9 -4.2 -3.5 -3.0 -3.0 -3.1 Balance sheet (EURm)
Intangible assets 0.7 1.0 2.9 2.7 2.6 2.5 Tangible assets 0.1 0.1 0.7 0.6 0.6 0.6 Fin. & other non-current assets 2.7 2.9 0.3 0.3 0.3 0.3 Total shareholders' equity 8.4 8.3 6.7 5.6 4.7 3.9 Pension provisions 0.0 0.0 0.0 0.0 0.0 0.0 Liabilities and provisions 6.2 3.3 3.9 4.0 4.9 5.6 Net financial debt -5.0 -2.7 -1.7 -1.0 -0.1 1.0 Working capital requirement 0.1 1.7 1.5 1.1 1.3 1.6 Invested capital 0.1 1.8 2.2 1.7 1.9 2.2 Ratios
ROE -17.6% -22.8% -39.5% -50.2% -52.6% -61.4% ROIC -186.8% -137.0% -109.4% -115.0% -112.8% na EV/IC na 8.8 10.4 10.6 11.2 11.1 Gearing -59.3% -32.4% -25.5% -17.9% -1.4% 25.0%
1 year performance 2011
Sales breakdown 2014 2011
2011
3.0
3.5
4.0
4.5
5.0
5.5
6.0
6.5
7.0
Apr 14 Jul 14 Oct 14 Jan 15Price DJ Stoxx 600 (rebased)
73.0%
17.0%
10.0%Eurozone
North America
Asia
Theradiag Buy TP EUR 5.30
3 keplercheuvreux.com
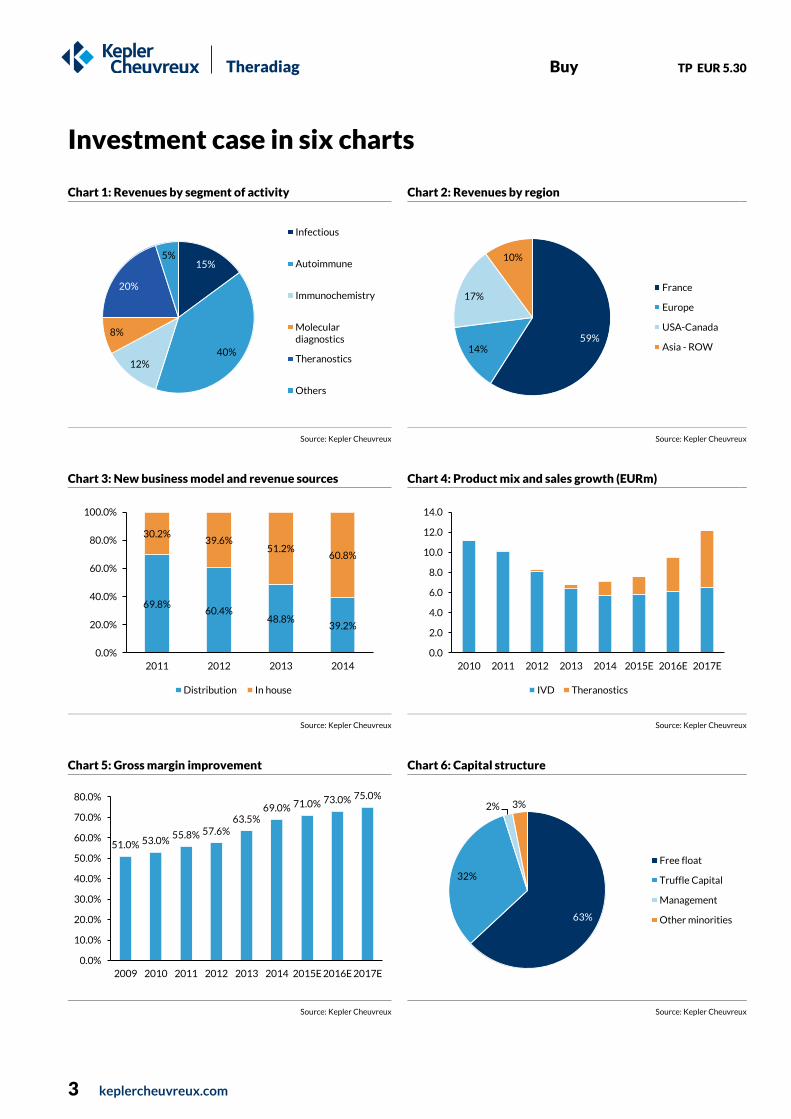
Investment case in six charts
Chart 1: Revenues by segment of activity Chart 2: Revenues by region
Source: Kepler Cheuvreux Source: Kepler Cheuvreux
Chart 3: New business model and revenue sources Chart 4: Product mix and sales growth (EURm)
Source: Kepler Cheuvreux Source: Kepler Cheuvreux
Chart 5: Gross margin improvement Chart 6: Capital structure
Source: Kepler Cheuvreux Source: Kepler Cheuvreux
15%
40% 12%
8%
20%
5%
Infectious
Autoimmune
Immunochemistry
Moleculardiagnostics
Theranostics
Others
59% 14%
17%
10%
France
Europe
USA-Canada
Asia - ROW
69.8% 60.4%
48.8% 39.2%
30.2% 39.6%
51.2% 60.8%
0.0%
20.0%
40.0%
60.0%
80.0%
100.0%
2011 2012 2013 2014
Distribution In house
0.0
2.0
4.0
6.0
8.0
10.0
12.0
14.0
2010 2011 2012 2013 2014 2015E 2016E 2017E
IVD Theranostics
51.0% 53.0% 55.8% 57.6%
63.5% 69.0% 71.0% 73.0% 75.0%
0.0%
10.0%
20.0%
30.0%
40.0%
50.0%
60.0%
70.0%
80.0%
2009 2010 2011 2012 2013 2014 2015E 2016E 2017E
63%
32%
2% 3%
Free float
Truffle Capital
Management
Other minorities

Theradiag Buy TP EUR 5.30
4 keplercheuvreux.com
Contents
Investment case in six charts 3
Investment case summary 5
Reaping the rewards of a new business model 5
Pipeline: significant progress, HIV tropism kit fails 5
Theranostics: offer could be exposed to lobbying 5
UCB: a promising partnership 6
Stock undervalued: Buy 6
Key achievements in 2014 7
Continuous change in its portfolio makeup 7
Return to growth after a four-year decline 8
R&D pipeline: key approvals and milestones passed 9
HIV tropism kit: lack of differentiation with existing offer 10
ABIRISK consortium: ALTER selected as first choice partner 10
UCB Pharma: first and promising strategic alliance 11
Monitoring biotherapies: real demand 12
The right dose, at the right time, to the right patient 12
Undisputed potential savings for payors… 13
…but the goose that lays the golden egg will be defended 14
Future opportunities lie in companion tests for new therapies 14
Deconstructing the forecasts 15
Revenues 15
Operating expenses 16
Valuation, target price and risks 17
Valuation of the assets 17
Peer comparison 18
Target Price: cut from EUR6.10 to EUR5.30 18
Risks 19
Research ratings and important disclosures 24
Legal and disclosure information 26

Theradiag Buy TP EUR 5.30
5 keplercheuvreux.com
Investment case summary Theradiag has transformed itself from a kit and equipment distributor into a
developer of innovative diagnostics and theranostics solutions. Growth in
revenues from the Lisa Tracker range (monitoring of biotherapies) in 2014 is a
positive signal. In addition, the partnership signed with UCB paves the way for
new deals, which remain a priority to make biotherapy monitoring a future
growth driver in the diagnostics industry.
Reaping the rewards of a new business model
A few years ago, Theradiag made strategic changes to its business model,
transforming from a simple distributor of diagnostic kits and equipment into a
developer and marketer of high-value-added kits (especially in the field to
theranostics). As a result, revenues dropped in 2009-13 (-40%) on the back of lower
investment in its older ranges and the end of distribution agreements. However,
2014 saw a timid rebound (+5%), supported by good momentum in the new In Vitro
Diagnostic (IVD) offer and the Lisa Tracker range (biotherapy monitoring). Thanks to
“in house” products, which are higher-margin, profitability has improved
significantly over the two last years (+11bps), a trend that is expected to continue in
the next three years. Although sales expansion remains a real challenge for a small
company, Theradiag is currently becoming an undisputed player in the field of
theranostics.
Pipeline: significant progress, HIV tropism kit fails
The new strategy, based on the development and supply of high-value-added kits,
has required heavy investments in R&D. In 2014, Theradiag reinforced its pipeline
with new collaborations (based on the microRNA proprietary platform acquired in
2012) and also obtained the CE mark for its first cancer diagnostic kit. Theradiag
now offers the largest number of kits for the monitoring of anti-TNF based therapies
(inflammatory diseases). While the company reached significant milestones in 2014,
its HIV tropism kit was a real concern, failing to show a competitive advantage
versus the existing offer; the company had expected the kit to drive its growth in the
following years (expected launch late 2015).
Theranostics: offer could be exposed to lobbying
Along with the increasing number of approved biotherapies come questions about
their effectiveness after long periods of use and potential long-term tolerance
(immune reaction). Monitoring biotherapies is therefore essential to ensure that the
injected doses are effective and do not cause side effects. While Theradiag’s offer
meets doctors’ expectations, Lisa Tracker is likely to demonstrate that some
patients should not receive treatment or should be treated with lower doses (less
concentrated or split over longer periods). This represents potential, significant
savings for payors, but may have an impact on the business of the biotherapies’
manufacturers. The interests of the stakeholders clearly diverge and lobbying
against monitoring tools is a threat that Theradiag is likely to face.
Moving towards a more profitable product mix
Expansion of the theranostic offer; miRNA-based kits still awaiting first approval
Lisa Tracker likely to generate significant savings but pharma rebellion not far away

Theradiag Buy TP EUR 5.30
6 keplercheuvreux.com
UCB: a promising partnership
Theradiag has been selected to become a partner in the ABIRISK consortium, a
group of pharmaceuticals companies interested in understanding the
immunogenicity of biotherapies. This situation made discussions with potential
partners possible. UCB entered a collaboration agreement with Theradiag to assess
the performance of Lisa Tracker in patients treated with Cimzia (monoclonal
antibody target TNF in patients suffering from inflammatory diseases). This first
deal paves the way for long-term collaborative programmes, especially in the
development of companion tests for novel biotherapies currently in clinical
development. The ideal situation would be to see Lisa Tracker approved and sold as
a companion test.
Stock undervalued: Buy
Theradiag has successfully changed its business model. The top line now has to be
developed as quickly as possible to balance out the R&D and marketing expenses
required to expand the revenue sources (short term and future growth drivers). The
ramp-up of sales will depend on strategic alliances that the group signs, especially in
the US, where implementing Lisa Tracker in a CLIA laboratory is likely to open up a
large market. Our valuation (DCF for the IVD business and rNPV for Lisa Tracker) is
based on conservative assumptions and implies significant upside (c. +45%). The
positioning of the company in a market with clearly identified demand represents a
good opportunity to play the wave of theranostics dedicated to biotherapies. We
confirm our positive rating and fix a new TP of EUR5.30.
Making potential enemies your partner a good strategy
Current price attractive to play future of theranostics
Theradiag Buy TP EUR 5.30
7 keplercheuvreux.com
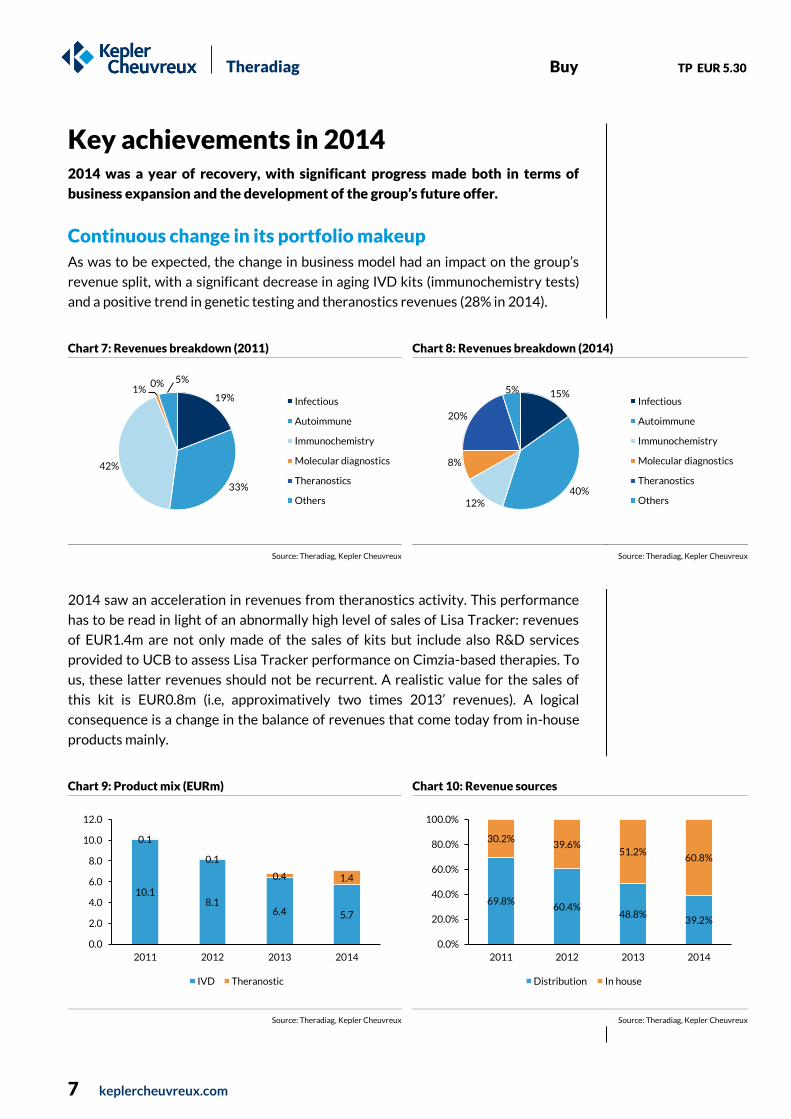
Key achievements in 2014 2014 was a year of recovery, with significant progress made both in terms of
business expansion and the development of the group’s future offer.
Continuous change in its portfolio makeup
As was to be expected, the change in business model had an impact on the group’s
revenue split, with a significant decrease in aging IVD kits (immunochemistry tests)
and a positive trend in genetic testing and theranostics revenues (28% in 2014).
Chart 7: Revenues breakdown (2011)
Chart 8: Revenues breakdown (2014)
Source: Theradiag, Kepler Cheuvreux Source: Theradiag, Kepler Cheuvreux
2014 saw an acceleration in revenues from theranostics activity. This performance
has to be read in light of an abnormally high level of sales of Lisa Tracker: revenues
of EUR1.4m are not only made of the sales of kits but include also R&D services
provided to UCB to assess Lisa Tracker performance on Cimzia-based therapies. To
us, these latter revenues should not be recurrent. A realistic value for the sales of
this kit is EUR0.8m (i.e, approximatively two times 2013’ revenues). A logical
consequence is a change in the balance of revenues that come today from in-house
products mainly.
Chart 9: Product mix (EURm)
Chart 10: Revenue sources
Source: Theradiag, Kepler Cheuvreux Source: Theradiag, Kepler Cheuvreux
19%
33%
42%
1% 0% 5%
Infectious
Autoimmune
Immunochemistry
Molecular diagnostics
Theranostics
Others
15%
40% 12%
8%
20%
5% Infectious
Autoimmune
Immunochemistry
Molecular diagnostics
Theranostics
Others
10.1 8.1
6.4 5.7
0.1
0.1
0.4 1.4
0.0
2.0
4.0
6.0
8.0
10.0
12.0
2011 2012 2013 2014
IVD Theranostic
69.8% 60.4%
48.8% 39.2%
30.2% 39.6%
51.2% 60.8%
0.0%
20.0%
40.0%
60.0%
80.0%
100.0%
2011 2012 2013 2014
Distribution In house

Theradiag Buy TP EUR 5.30
8 keplercheuvreux.com
The change in the model also has an impact on the regional breakdown of revenues.
Theradiag is currently expanding its business internationally, promoting the “in
house” products that generate revenues in foreign countries. This trend is expected
to continue, providing better visibility on Lisa Tracker, especially in the US, where a
partnership with CLIA labs is likely to facilitate market penetration.
Chart 11: Geographical breakdown (2011)
Chart 12: Geographical breakdown (2014)
Source: Theradiag, Kepler Cheuvreux Source: Theradiag, Kepler Cheuvreux
Return to growth after a four-year decline
2014 was a key period, which saw an end to the decline in revenues. Theradiag
benefited from a favourable scissor effect, with the decline in old IVD ranges offset
by increasing volumes of in-house products. We assume 2013 represents a low point
from which the company is expected to deliver sustainable growth. Theranostics’s
offer is expected to contribute more and more in the future. This positive scenario is
made possible thanks to good visibility on the future growth drivers the group has
developed internally or will have access to through an in-licensing strategy
(distribution rights in France and/or key European countries).
Chart 13: Impact of new business model on revenues (EURm)
Source: Kepler Cheuvreux
73%
15%
7% 5%
France
Europe
USA-Canada
Asia - ROW 59% 14%
17%
10%
France
Europe
USA-Canada
Asia - ROW
11.1 10.1
8.1 6.4 5.7 5.9 6.1 6.5
0.0 0.1
0.1
0.4 1.4 1.7 3.4
5.6
0.0
2.0
4.0
6.0
8.0
10.0
12.0
14.0
2010 2011 2012 2013 2014 2015E 2016E 2017E
IVD Theranostics

Theradiag Buy TP EUR 5.30
9 keplercheuvreux.com
R&D pipeline: key approvals and milestones passed
Lisa Tracker: a large portfolio Over the last three years, Theradiag has progressively improved its theranostics offer.
To date, ten kits have received a CE mark. After an initial focus on inflammatory diseases
(eight kits), Theradiag has brought out new kits in oncology to assess patient response to
two blockbuster treatments (Herceptin and Avastin). In March 2015, a new kit to
address psoriasis and arthritic psoriasis obtained a CE mark.
Table 1: Biotherapies addressed by Lisa Tracker monitoring kits (as of April 2015)
Antibody Target Brand name Laboratory Key approved indications
Currency Sales 2014 (m)
Infliximab TNFα Remicade J&J/Merck RA, CD, UC, SA, PS, JA USD 9,240 Adalilumab TNFα Humira Abbvie RA, CD, SA, PS, JA USD 12,543 Eternacept TNFα Enbrel Amgen/Pfizer RA, SA, PS, JA USD 7,520 Golilumab TNFα Simponi J&J/Merck RA, SA, PS, JA USD 1,876 Certolizumab TNFα Cimzia UCB RA, CD EUR 797 Rituximab CD-20 Mabthera Roche Oncology, RA CHF 1,297* Tocilizumab IL6 receptor RoActemra Roche/Chugai RA, JA CHF 1,224 Bevacizumab VEGF Avastin Roche Metastatic cancers CHF 6,417 Trastuzumab HER2/neu receptor Herceptin Roche Breast cancer CHF 6,275 Ustekinumab IL12-IL23 Stelara J&J PS, PA USD 2,072
* RA prescriptions only - RA: Rheumatoid Arthritis; CD: Crohn Disease; UC: Ulcerative Colitis; JA: Juvenile Arthritis; PS: Psoriasis; SA: Spondyloarthritis; PA: Psoriatic Arthritis
Source: Kepler Cheuvreux
MicroRNA: fashionable technology The dosage of circulating microRNA represents a real opportunity to monitor the
expression of the genes of interests involved in a large number of conditions. Over
the last decade, the total number of scientific articles describing the role and
involvement of miRNA in metabolic processes has risen significantly (c. 33,000
references by end-2014 in the Pubmed database). miRNA has become a very hot
field of investigation for diagnostic kits developers. These small nucleotides offer
several advantages, as they represent ideal biomarkers to:
Diagnose a disease: detection of the presence of malignant cells expressing
genes known to be associated with a condition and eventually assess the
severity of the disease.
Predict the evolution of the disease and anticipate the response to future
treatments: monitoring the markers and assessing the risk of potential recurrence.
Theradiag is involved in several programmes based on miRNA signatures.
MICRA project: aims at developing a theranostic tool to help in the early
detection of rectal cancer and anticipate the response to radiotherapy and
chemotherapy. This project (in collaboration with an academic partner ICM)
made real progress, and miRNA have been identified and patented. The next
step will be clinical validation in large cohorts of patients.
CARENA project: aims at developing companion tests for HIV treatments (in
partnership with CNRS and Abivax) and a prognostic tool for AIDS progress and
a predictive test for assessing the resistance to antiviral drugs. A first milestone
was reached by demonstrating that miRNA signatures are relevant.
With Prestizia, Theradiag made a strategic and relevant acquisition to become a recognised player in the exciting field of miRNA

Theradiag Buy TP EUR 5.30
10 keplercheuvreux.com
Table 2: R&D pipeline
2015E 2016E 2017E 2018E
Lisa Tracker US miRNA Rheumatoid Arthritis miRNA Obesity miRNA Colorectal cancer miRNA companion test HIV drug
Source: Kepler Cheuvreux
HIV tropism kit: lack of differentiation with existing offer
Theradiag acquired Prestizia in April 2012, a start-up specialised in miRNA with a
promising kit to assess and determine tropism of the AIDS virus (more specifically for
the CCR5 receptor). This kit was expected to become a companion test for Maraviroc-
based therapies, a CCR5 receptor blocking drug that prevents “R5 strains” of HIV from
penetrating the patient’s T4 lymphocytes. Virus miRNA dosage is complex, and
Theradiag’s technology allowed for a faster detection with improved sensitivity. While
it had undisputed advantages, clinical studies did not show a significant difference
with the existing offer (Trofile kit from Monogram Biosciences or academic labs
traditional methods). On top of that, the decline in sales of Selzentry (Maraviroc
marketed by Pfizer and GSK) made management decide to stop the programme owing
to a lack of visibility on future revenue. This news was a real disappointment, as the
HIV tropism kit was supposed to be a growth driver as of 2016.
ABIRISK consortium: ALTER selected as first choice partner
While biotherapies are supposed to reproduce natural biological mechanisms and/or
to restore a lost function, the risk that a patient develops an immune response to the
treatment is real (most biotherapies are protein-based treatments that may be
identified as a foreign antigen by the immune system). Such events may occur in
chronic conditions that require repeated administration over long periods. With an
increasing population of patients treated with therapeutics proteins (especially
monoclonal antibodies), the number of cases of intolerance or lost effectiveness
surged over the last decade. As of 2015, no pharma or a biotech company can afford
not to pay attention to this risk.
In this prospect, the ABIRISK consortium was created, supported by big pharma
(Merck, Pfizer, Novartis, GSK, Sanofi, UCB) and academic partners (INSERM and
CNRS). The main objective of this network is to better understand the immune
reaction to biotherapies, which include the patient’s production of antidrug
antibodies (ADAs) and drug-neutralising antibodies (NAbs). In 2014, Theradiag was
selected as an ABIRISK partner. The programme’s budget is EUR50m. Lisa Tracker
kits will be used to determine the concentration of ADAs and NAbs in large patient
cohorts affected by rheumatoid arthritis and Crohn’s disease over a three-year
period. Theradiag will supply material for more than 5,000 tests.
Being a member of the ABIRISK consortium, Theradiag benefits from real
competitive advantages:
Improved visibility at the international level: in the coming years, ABIRISK is
likely to release results and confirm the need for systematic biotherapy
A complex environment led to the logical decision to stop the project
An ideal situation to become the leader in the monitoring of biotherapies

Theradiag Buy TP EUR 5.30
11 keplercheuvreux.com
monitoring. As a result and as Lisa Tracker is the sole kit being assessed,
Theradiag will likely benefit from future prescriptions.
Access to the largest database of patients treated with mAbs: Theradiag is
likely to collect information on most patients and increase its internal database
with information from extended populations. This knowledge, acquired with a
minimal investment, is a unique opportunity for Theradiag and is likely to benefit
new generations of monitoring kits.
Access to key players to discuss potential partnerships: as a technology provider
and data collector, Theradiag has the opportunity to establish close relationships
with big pharmaceutical groups. A first collaboration began in 2014 with UCB.
Beside the monitoring of approved therapies, collaborations are open for
therapies under clinical development for which a companion test would help to
reinforce future prescription power (personalised medicine, etc.).
UCB Pharma: first and promising strategic alliance
With Cimzia (monoclonal antibody targeting TNF and approved for rheumatoid
and psoriatic arthritis, Crohn’s disease, ankylosing spondylitis and axial
spondyloarthritis with EUR797m in 2014 sales), UCB was definitively interested in
Theradiag’s monitoring products. In 2014, the company showed UCB a comparison
of Lisa Tracker with the kits used so far to monitor Cimzia. This first assessment
revealed that Lisa Tracker was equivalent to previous tests performed by UCB.
Today and from a regulatory point of view, it is impossible for UCB to make a co-
promotion of Lisa Tracker with Cimzia. Nevertheless, communication by Theradiag
will be possible and doctors prescribing Cimzia are likely to recommend the use of
Lisa Tracker to assess a patient’s tolerance to the biotherapy.
A second step in the collaboration includes the integration of Lisa Tracker in the
clinical programmes with a future positioning as a companion test in France and at
the international level.
This first partnership was excellent news. There is no doubt that other
pharmaceutical laboratories or biotech companies are likely to assess Theradiag’s
technology in the coming years. Defending an existing franchise is key for most
companies with a successful biotherapy. In addition real progresses in disease
management, Lisa Tracker holds the potential to expand the business (better
identification of subgroups of patients responding perfectly to treatment). A reliable
timetable is difficult to define, but new partnerships are likely to be signed in the
next two years.
Test and then marry!

Theradiag Buy TP EUR 5.30
12 keplercheuvreux.com
Monitoring biotherapies: real demand Biotherapies have become integral to managing a growing number of conditions.
That said, we are still on the learning curve, and the pharma/biotech sector has
to adapt existing paradigms to optimise effectiveness. Monitoring active
compounds in the body as well as following a disease’s progress have become a
prerequisite to determine the success of a given therapy.
The right dose, at the right time, to the right patient
A successful therapy is the result of a combination of many parameters. If the
effectiveness of an active compound on its target remains the central issue, there
are also many secondary factors that can have a significant impact on reaching
therapeutic benefits, which include: 1) the amount of drug administrated (dependent
on the effectiveness as well as on the maximum tolerated dose); 2) bioavailability,
destruction/excretion by the organism; 3) the delay between two injections, 4/
progressive intolerance/insensitivity to the treatment. As for most of the
conventional chemical entities, the prescriptions of biotherapies are frequently
established on the basis of the weight of the patient (doses fixed at X mg per kg).
Since biotherapies are based on the involvement of large molecules in metabolic
pathways and since the degradation/elimination of the active compound often
requires more time than for small chemical entities, the question of the lifespan of
the therapeutic agent becomes a central concern. A second and important point
directly dependent on the previous issue, is the organism’s reaction to treatment.
Finally, assigning the dosage based solely on a patient’s “weight” is totally
inappropriate for most therapies involving complex mechanisms, such as the
activation/inhibition of the immune system. In these cases, adapting the treatment
to the proper level of a patient’s immune activity is likely to be much more relevant
than defining a dose per kg.
To date, the doctors do not have access to this information (or partially). Providing
doctors with reliable tools to establish good patient diagnostics before the re-
administration of any biotherapy is essential. This will allow for the assessment of: 1)
the residual concentration of the active compound; 2) the existence of any reaction
(through the dosage of antidrug and/or neutralising antibodies); 3) the level immune
system markers.
The best example of the urgent need for monitoring tools is the treatment of
inflammatory diseases with anti-TNF antibodies in patients suffering from
rheumatoid arthritis. In the first treatment period (T1), the monoclonal antibody
(mAb) induces a positive response with a drop in free-TNF. After a few
administrations (T2), the patient’s immune system starts to react to the therapeutic
protein (ADAb: antidrug antibodies).
Long-term tolerance to therapeutic proteins is still poorly documented. Resistance can appear and still requires to be assessed.

Theradiag Buy TP EUR 5.30
13 keplercheuvreux.com
Free TNF is still blocked at that time. Further administrations of mAb will see their
benefit drop dramatically with an increase in the immune response (T3). ADAb
neutralise mAb, preventing its interaction with TNF, whose concentration rises
again. New administrations of mAb will no longer have an effect on the condition.
The fully activated immune system blocks the newly injected mAb. The TNF level
reaches pathological concentrations, and the condition is no longer managed.
Chart 14: Simplified representation of the immune reaction against a biotherapy
Source: Theradiag, Kepler Cheuvreux
Undisputed potential savings for payors…
Adapting treatments to patients has multiples advantages: with better disease
management, patients recover faster with a better overall situation.
Beyond the medical aspects, payors will find monitoring to be a good opportunity to
save money. There are various reasons that support the implementation of a
systematic use of monitoring tools:
Preventing the administration of biotherapies in non-responsive patients: the
number of patients that have become resistant or less sensitive to a therapeutic
protein rises with the duration of the treatment. Long-term administration of
costly and no longer effective therapies does not make sense. Switching to
another therapeutic offer is often necessary.
Adapting the right dose: immune system activity depends on each individual.
Some patients respond to a treatment at lower doses than usual prescription
levels. Savings could therefore be made by adapting dosages properly
(antibodies are very expensive).
Adapting the time between two administrations: having access to the dosage of
residual therapies allows for a significant improvement in the planning of mAb
injections. Re-injecting at the right time will limit the risk of excess mAb, which is
often associated with or is likely to induce an immune reaction. This may limit
the rate of non-responders.
0
10
20
30
40
50
60
70
80
T1 T2 T3 T4 T5
Therapeutic mAb ADAb TNFa
Injecting biotherapies to non-responding patients does not make sense, which could save huge amounts of resources

Theradiag Buy TP EUR 5.30
14 keplercheuvreux.com
In order to demonstrate the economic benefits of biotherapy monitoring, Theradiag
has sponsored a retrospective study on patients suffering from intestinal bowel
diseases (Crohn’s disease) treated with anti-TNF therapies. Over a period of five
years, savings would likely to amount for a total of EUR130m in France. On a global
basis, this figure could reasonably increase ten-fold. When taking other indications
(rheumatoid arthritis and TNF related inflammations) into account, the overall
savings could exceed EUR5bn.
…but the goose that lays the golden egg will be defended
Lisa Tracker paves the way for undisputed savings. However, Theradiag is likely to
face (or is currently facing) real resistance from biotherapy sellers whose profitable
business is currently under scrutiny. Lisa Tracker demonstrates that a significant
number of patients (up to 30%) are no longer responding to some anti-TNF
therapies. This situation is likely to make some pharmaceutical companies a bit
nervous. They could lobby or pressure on governments to defend their interests (e.g.
a loss of business/activity could provoke social consequences).
As a French-based company and according to the figures previously mentioned, we
do not understand why the HAS (Haute Autorité de Santé) did not give the French
healthcare system a positive recommendation on Lisa Tracker. This situation is
totally aberrant, but market penetration and the systematic use of Lisa Tracker is
closely dependent on reimbursement decisions. We do not see a strong signal that is
likely to make us adopt a very aggressive scenario in the short term.
Future opportunities lie in companion tests for new therapies
Currently, there is no question about the credibility and the added value of Lisa
Tracker. To give more marketing power to the concept of biotherapy monitoring,
Theradiag should set up a Trojan horse strategy. The best approach is to develop
companion tests for new biotherapies (or for new indications under clinical
validation for existing treatments).
In addition to improved disease management (patient screening, treatment
modification, etc.), Lisa Tracker is expected to increase clinical trial success rates
(only responding patients will be treated). Thus, the value proposition is real. All
pharmaceutical and biotech groups are focused on failure concerns and thus should
be likely to adopt a theranostics tool that will significantly improve the visibility on
market approval and support prescriptions.
Regarding potential revenues, Theradiag could capture value throughout the clinical
validation period (supply of theranostics kits). After regulatory clearance, Lisa
Tracker will benefit from marketing efforts made by the new biotherapy developer.
The package “treatment + related theranostics tool” is the most appropriate way to
bypass the reimbursement issues that Theradiag is currently is facing.
UCB is likely to initiate this type of collaborative programme. Management has
launched several contacts with other potential partners (in the ABIRISK
consortium). We strongly believe that the company will sign collaborations with new
laboratories in the next 24 months.
The best strategy is to position the monitoring kit as companion test
Big pharmas are expected to fight monitoring tools that pose a real threat to their cash cows

Theradiag Buy TP EUR 5.30
15 keplercheuvreux.com
Deconstructing the forecasts In vitro diagnostics are likely to remain the company’s main source of revenue in
the short term. Meanwhile, the fast growing theranostics offer represents the
company’s key long-term growth driver. R&D expenditures and marketing
efforts logically affect short-term profitability.
Revenues
Moving from a distribution model to a fully integrated company that develops and sells
high-value-added kits has had a direct impact on the product mix in the last four years.
In vitro diagnostics Distribution
Theradiag’s strategy regarding its distribution business is clear and relies on being
well positioned in fast-growth segments. Historical product ranges are not expected
to deliver sustainable growth and thus are not seeing investment in marketing and
selling. To balance out the drop in revenues, Theradiag is actively exploring licensing
opportunities (e.g. molecular testing with kits licensed to Asuragen). As a local player
with a recognised franchise, Theradiag could be a good partner for US-based
companies looking to penetrate France or key European countries. Therefore, we
expect this portfolio to be reinforced in the coming years, which could make the
long-term average annual growth rate of +5% totally realistic.
In house products
Theradiag has developed a proprietary range of products, especially dedicated to
diagnosing autoimmune disease (kits, detection systems based on Luminex multi-
parameter analysis). The company is recognised at the international level for its
expertise and is likely to see continuous growth in the coming years. We expect a
long-term annual growth of +15%.
Theranostics With the development of its theranostics offer, Theradiag is expected to expand its
portfolio and address new therapeutic areas (cancers, infectious diseases, etc.). New
partnerships, similar to that signed with UCB, are likely to support sustainable
growth (supply of tests in clinical development of new biotherapies and marketing of
companion tests). Beyond Lisa Tracker, the miRNA-based offer is supposed to add
new revenues in the mid-term. Compared to the IVD business, theranostics
represents Theradiag’s key growth driver.
IVD business expected to deliver sustainable but moderate growth
Development partnerships and distribution agreements are likely to support a strong performance

Theradiag Buy TP EUR 5.30
16 keplercheuvreux.com
Table 3: Estimated revenues (EURm)
2012 2013 2014 2015E 2016E 2017E 2018E 2019E 2020E 2021E 2022E
IVD Distribution 4.99 3.30 2.79 2.81 2.90 3.02 3.17 3.32 3.49 3.67 3.85 change -26.6% -34% -15.4% 1.0% 3.0% 4.0% 5.0% 5.0% 5.0% 5.0% 5.0%
IVD In house products 3.15 3.08 2.92 3.07 3.25 3.57 4.00 4.56 5.25 6.04 6.94 change 5.2% -2.4% -5.0% 5.0% 6.0% 10.0% 12.0% 14.0% 15.0% 15.0% 15.0%
Lisa Tracker 0.12 0.39 1.41 1.70 3.36 5.60 7.98 10.18 11.54 12.71 14.84 change na 229.7% 261.4% 20.6% 98.5% 66.4% 42.5% 27.6% 13.3% 10.2% 16.8%
Total SALES 8.25 6.76 7.11 7.58 9.51 12.19 15.15 18.07 20.28 22.41 25.63 change -18.7% -18.1% 5.2% 6.5% 25.6% 28.1% 24.3% 19.3% 12.2% 10.5% 14.4%
Source: Kepler Cheuvreux
Operating expenses
R&D: building future growth drivers Like any technology company, Theradiag has to support an aggressive innovation
policy to keep its edge and secure future revenues (the supply of new kits, replacing
ageing product ranges, etc.). Besides reimbursement issues, prescriptions by doctors
are directly linked to the performance of diagnostics and theranostics tools. If
regulators do not require thorough investigations, convincing physicians is a real
challenge and the decision-making process is often dependent on the availability of
solid clinical evidence. Investing in large clinical studies is therefore a prerequisite to
show the benefits of diagnostics/theranostics tools. R&D expenses are likely to
increase in the coming years (EUR1.52m in 2014, with a +10% 2014-17E CAGR).
Marketing: penetrate the markets as fast as possible Theradiag is allotting significant resources to the commercialisation of its kits and its
partners’ analysis systems. In parallel, the company has to support the emerging
theranostics business, which requires a significant amount of medical education.
Overall, Theradiag spent EUR3.0m in 2014 (42% of total revenues) to promote its
diagnostic and theranostics portfolios. To develop its businesses and achieve
expected revenues, the company will have to support its local sales force and
allocate resources to its distributors to help them sell the theranostics offer (in
house products sold outside of France). Heavy promotion investments are therefore
anticipated in the coming years (EUR2.98m in 2014, with a +15% 2014-17E CAGR).
General and Administrative: to be improved The decline in revenues (-40% in 2009-13) was not associated with a similar
decrease in G&A expenses. The current organisation therefore has a significant
impact on the P&L (EUR2.07m in 2014). We expect a limited increase in G&A for the
three next-years (+3% 2014-2017E CAGR).
Increasing revenues is a priority and requires a strong presence in the targeted areas
Developing “in-house” products has a price

Theradiag Buy TP EUR 5.30
17 keplercheuvreux.com
Valuation, target price and risks Valuation of the assets
We have split the company’s activities into two businesses, whose maturity and
challenges are completely different. While the IVD business is well established and
has to continue its transition towards a more profitable model, the theranostics
business faces real challenges (commercial expansion for approved kits and
technical validation for new kits under development). Therefore, we prefer to use
two distinct valuation methods to take into account the nature and risks associated
with each activity.
DCF of the IVD business This business is currently in a rebound period. The inflexion point is behind us with a
predominant part of revenues coming from in house products with higher margins.
The risk associated is relatively low, but Theradiag remains a small company with
limited resources. The commercial battle is real with new offers in genetic testing.
We have therefore applied a discount rate of 12%.
Table 4: DCF valuation of the IVD business (EURm)
2014 2015E 2016E 2017E 2018E 2019E 2020E 2021E 2022E 2023E 2024E 2025E
Revenues 5.7 5.9 6.1 6.6 7.2 7.9 8.7 9.7 10.8 12.0 13.4 15.0 Operating Profit - 0.7 - 0.7 - 0.5 - 0.3 - 0.1 0.2 0.5 0.9 1.2 1.6 2.0 2.4 Tax - - - - - - - - 0.2 0.5 0.7 0.8 NOPAT - 0.7 - 0.7 - 0.5 - 0.3 - 0.1 0.2 0.5 0.9 1.1 1.1 1.3 1.6 Depreciation 0.1 0.1 0.1 0.1 0.1 0.1 0.2 0.2 0.2 0.2 0.2 Change in Working Capital 0.0 0.0 0.1 0.1 0.1 0.1 0.1 0.2 0.2 0.2 0.2 Capital Expenditure 0.1 0.1 0.1 0.1 0.1 0.1 0.2 0.2 0.2 0.2 0.1 Free Cash Flows - 0.7 - 0.6 - 0.3 - 0.2 0.1 0.4 0.7 0.9 0.8 1.1 1.4 Discount factor 12% 0.893 0.797 0.712 0.636 0.567 0.507 0.452 0.404 0.361 0.322 0.287 Discounted FCF - 0.7 - 0.5 - 0.2 - 0.1 0.0 0.2 0.3 0.4 0.3 0.3 0.4 Infinite growth rate 1.5% Discounted Terminal Value 4.6 Enterprise Value 5.1
Source: Kepler Cheuvreux
Table 5: Sensitivity of DCF valuation to discount rate and to infinite growth (EURm)
Discount rate 11.0% 11.5% 12.0% 12.5% 13.0%
0.5% 5.7 5.2 4.7 4.3 3.9 1.0% 6.0 5.4 4.9 4.4 4.0
Infinite growth 1.5% 6.2 5.6 5.1 4.6 4.2 2.0% 6.6 5.9 5.3 4.8 4.4
2.5% 6.9 6.2 5.6 5.0 4.5
Source: Kepler Cheuvreux
rNPV of the Theranostics business Lisa Tracker has ten distinct references granted by its CE marks. Thus, it has passed
its technical validation. Access to the US market remains, however, a real challenge,
and Theradiag does not plan to file a 510k. Instead, it prefers collaborations with
CLIA partners (Clinical Laboratory Improvement Amendments) that offer the
simplest way to sell the kits.

Theradiag Buy TP EUR 5.30
18 keplercheuvreux.com
The risk associated with this business is therefore commercial uncertainty
(reimbursement processes, potential lobbying from biotherapies manufacturers).
We have therefore used a 13% discount rate. Long-term revenues are likely to come
from new kits to be developed. Our base-case scenario does not take into account
any positioning as a companion test. Any strategic partnership that positions Lisa
Tracker as companion test would offer significant upside.
Table 6: rNPV of Lisa Tracker (EURm)
2014 2015E 2016E 2017E 2018E 2019E 2020E 2021E 2022E 2023E 2024E 2025E
Sales 1.41 1.70 3.36 5.60 7.98 10.18 11.54 12.71 14.84 16.54 18.32 19.78 COGS 0.07 0.15 0.29 0.49 0.70 0.89 1.01 1.11 1.29 1.42 1.57 1.67 Operational costs 0.82 0.42 1.01 1.68 2.15 2.54 2.65 2.80 3.12 3.31 3.48 2.97 Pretax profit 0.52 1.13 2.06 3.43 5.12 6.74 7.87 8.81 10.44 11.81 13.28 15.14 Profit after tax (33%) 0.75 1.38 2.30 3.43 4.52 5.27 5.90 6.99 7.91 8.90 10.14 Discount factor (13%) 1.000 0.885 0.783 0.693 0.613 0.543 0.480 0.425 0.376 0.333 0.295 0.261 Discounted profit 0.67 1.08 1.59 2.10 2.45 2.53 2.51 2.63 2.63 2.62 2.64 NPV full success 23.5 Probability of success 100% rNPV 23.5
Source: Kepler Cheuvreux
Peer comparison
As a loss-making company, the sole ratio that can be used for Theradiag is a sales
multiple. Fast growing companies benefit from a premium (5-10x). Theradiag is
currently building its foundation for future growth and does not deliver double-digit
growth. In the short term, the market is not likely to accept high multiples (2-3x
annual sales is definitively realistic). Future performance (expansion of Lisa Tracker
in the US, launch of miRNA kits) is however expected to change the equity story, but
regulatory milestones have to be passed.
Table 7: Comparison with diagnostics companies (in m)
Company Ticker Country Currency Market Cap.
Cash EV Sales 2014
Sales 2015E
Sales 2016E
EV/Sales 2015E
EV/Sales 2016E
Integragen ALINT FR EUR 29 5 24 6.0 6.5 7.0 3.6 3.4 Biosynex ALBIO FR EUR 6 -0 7 5.2 5.8 6.5 1.2 1.0 Novacyt ALNOV FR EUR 33 -2 35 7.8 9.6 13.4 3.6 2.6 Genomic Vision GV FR EUR 66 20 46 3.5 4.7 5.7 9.7 8.1 Diaxonhit ALEHT FR EUR 41 14 27 30.6 32.9 37.0 0.8 0.7 Epigenomics ECX:GR GER EUR 87 8 79 1.5 4.5 19.8 17.7 4.0 Diagnocure CUR:CN CA CAND 4 2 2 0.6 0.9 1.2 2.1 1.6 Rosetta Genomics ROSG US USD 47 16 32 1.3 8.5 16.0 3.7 2.0 Nanosphere NSPH US USD 23 -6 29 14.3 19.4 24.6 1.5 1.2 Trovagene TROV:US US USD 216 12 203 0.3 1.4 7.9 145.2 25.7 THERADIAG ALTER FR EUR 20 2 18 7.1 7.6 9.5 2.4 1.9
Source: Factset, Kepler Cheuvreux
Target Price: cut from EUR6.10 to EUR5.30
Although the commercial challenge is real, Theradiag is expected to deliver what we
see as a conservative scenario for both businesses (IVD and theranostics). The DCF
valuation of the IVD business is logically impacted by short-term losses. Regarding
the theranostics business, our valuation based on a conservative market penetration
Fast-growing companies benefit from a premium

Theradiag Buy TP EUR 5.30
19 keplercheuvreux.com
offers real upside. Any new partnership will likely increase the visibility of future
revenues and reduce risk (decrease in the discount rate).
Table 8: SOP (EURm)
Asset/project Status Expected launch Peak sales (EURm) Prob. of success Method Value
IVD Business Market Already marketed 15 100% DCF 5.1 Lisa Tracker Market / Validation US H2 2015E 20 100% rNPV 23.5 miRNA Cancer Research >2016 To be estimated - miRNA Obesity Research >2016 To be estimated - miRNA Rheumatoid Arthritis Research >2016 To be estimated - Companion test HIV drug Research >2019 To be estimated - Total 28.6 Net Debt (31-12-2014) -1.7 Equity 30.3 Number of shares (m) 5.321 Diluted number of shares (m) 5.747 Equity /share (diluted, in EUR) 5.3
Source: Kepler Cheuvreux
The stock trades at levels that do not reflect the intrinsic value of the existing
products and of the kits under development. Our new assumptions, which are based
on a very conservative scenario, yield a new target price of EUR5.30 (vs EUR6.10).
We remain positive on the stock, whose performance will be driven by the top line
and the announcement of potential Lisa Tracker collaborations.
Risks
Theradiag develops diagnostics and theranostics kits. The company is logically
exposed to potential clinical trial failures. That said, this risk is limited, compared to
pure biotech companies, since most of the effectiveness/sensitivity of the kits can be
assessed by researchers using simple biological models (in vitro testing, cellular-
based investigations). The decision to launch clinical validation (i.e. assays on large
numbers of biological samples from healthy people and patients) is often made with
the support of solid scientific and technical data. The success rate in clinical trials
and in the approval process for the diagnostics industry is therefore significantly
higher than for drug-developing companies.
While getting approval for new kits is feasible, the real challenge companies like
Theradiag face is penetrating their markets. An increasingly large offer and the
presence of big players with impressive portfolios often make the expansion of
revenues difficult. Thus, the commercial risk is relatively high. This situation is
particularly critical when reimbursement issues limit the capacity of public hospitals
to use these kits.

Theradiag Buy TP EUR 5.30
20 keplercheuvreux.com
Valuation
FY to 31/12 (EUR) 2010 2011 2012 2013 2014 2015E 2016E 2017E
Per share data EPS adjusted 0.00 -0.01 -0.25 -0.46 -0.57 -0.58 -0.46 -0.41 % Change na na na na na na na na EPS adjusted and fully diluted 0.00 -0.01 -0.25 -0.46 -0.63 -0.59 -0.49 -0.43 % Change na na na na na na na na EPS reported 0.00 -0.01 -0.25 -0.46 -0.57 -0.58 -0.46 -0.41 % Change na na na na na na na na EPS Consensus -0.36 0.01 Cash flow per share 0.00 -0.05 -0.11 -0.79 -0.49 -0.41 -0.39 -0.36 Book value per share 0.13 0.11 2.20 1.99 1.28 1.06 0.80 0.60 DPS 0.00 0.00 0.00 0.00 0.00 0.00 0.00 0.00 Number of shares, YE (m) 23.5 23.5 3.8 4.2 5.2 5.3 5.9 6.4 Number of shares, fully diluted, YE (m) 23.5 29.4 4.6 5.0 5.3 5.9 6.4 7.0 Share price Latest price / year end 5.4 3.5 3.8 3.6 3.6 3.6 52 week high (Year high) 5.7 5.7 7.8 4.2 52 week low (Year low) 4.8 3.3 3.4 3.5 Average price (Year) 5.3 4.4 4.8 3.6 Enterprise value (EURm) Market capitalisation 20.3 18.5 24.8 19.2 21.1 23.2 Net financial debt -1.3 -1.1 -5.0 -2.7 -1.7 -1.0 -0.1 1.0 Pension provisions 0.0 0.0 0.0 0.0 0.0 0.0 0.0 0.0 Market value of minorities 0.0 0.0 0.0 0.0 0.0 0.0 0.0 0.0 Market value of equity affiliates (net of tax) 0.0 0.0 0.0 0.0 0.0 0.0 0.0 0.0 Others 0.0 0.0 0.0 0.0 0.0 0.0 0.0 0.0 Enterprise value 15.3 15.8 23.1 18.1 21.0 24.1 Valuation P/E adjusted na na na na na na P/E adjusted and fully diluted na na na na na na P/E consensus na na P/BV 2.4 2.2 3.7 3.4 4.5 6.0 P/CF na na na na na na Dividend yield (%) 0.0% 0.0% 0.0% 0.0% 0.0% 0.0% FCF yield (%) -4.3% -22.5% -14.3% -15.7% -14.4% -13.5% ROE (%) 2.1% na na na na na na na ROIC (%) na na na na na na na EV/Sales 1.85 2.34 3.25 2.40 2.21 1.98 EV/EBITDA na na na na na na EV/EBIT na na na na na na EV/NOPAT na na na na na EV/IC na 8.8 10.4 10.6 11.2 11.1 ROIC/WACC na na na na na na na EV/IC over ROIC/WACC na na na na na

Theradiag Buy TP EUR 5.30
21 keplercheuvreux.com
Income statement
FY to 31/12 (EURm) 2010 2011 2012 2013 2014 2015E 2016E 2017E
Sales 11.1 10.2 8.3 6.8 7.1 7.6 9.5 12.2 % Change -0.9% -8.9% -18.7% -18.1% 5.2% 6.5% 25.6% 28.1% EBITDA reported 0.5 -0.2 -0.3 -1.7 -2.7 -2.7 -2.2 -1.7 % Change na na na na na na na na Depreciation and amortisation -0.3 -0.4 -0.7 -0.2 -0.5 -0.6 -0.8 -0.8 Goodwill impairment 0.0 0.0 0.0 0.0 -0.1 -0.1 -0.1 -0.1 Other financial result and associates 0.0 0.0 0.0 0.0 0.0 0.0 0.0 0.0 EBIT reported 0.2 -0.6 -1.0 -2.0 -3.3 -3.4 -3.0 -2.6 % Change na na na na na na na na Net financial items -0.2 0.0 -0.1 0.0 -0.1 0.0 -0.1 -0.1 Associates 0.0 0.0 0.0 0.0 0.0 0.0 0.0 0.0 Others 0.0 0.0 0.0 0.0 0.0 0.0 0.0 0.0 Earnings before tax 0.0 -0.6 -1.1 -2.0 -3.4 -3.4 -3.1 -2.6 % Change na na na na na na na na Tax 0.0 0.0 0.2 0.2 0.5 0.3 0.4 0.0 Net profit from continuing operations 0.0 -0.6 -0.9 -1.8 -2.8 -3.1 -2.7 -2.6 % Change na na na na na na na na Net profit from discontinuing activities 0.1 0.3 -0.1 -0.1 -0.2 0.0 0.0 0.0 Net profit before minorities 0.1 -0.3 -1.0 -1.9 -3.0 -3.1 -2.7 -2.6 Minorities 0.0 0.0 0.0 0.0 0.0 0.0 0.0 0.0 Net profit reported 0.1 -0.3 -1.0 -1.9 -3.0 -3.1 -2.7 -2.6 % Change na na na na na na na na Adjustments 0.0 0.0 0.0 0.0 0.0 0.0 0.0 0.0 Net profit adjusted 0.1 -0.3 -1.0 -1.9 -3.0 -3.1 -2.7 -2.6 % Change na na na na na na na na Gross profit 5.9 5.7 4.8 4.3 4.9 5.4 6.9 9.1 EBITDA adjusted 0.5 -0.2 -0.3 -1.7 -2.7 -2.7 -2.2 -1.7 EBIT adjusted 0.2 -0.6 -1.0 -2.0 -3.3 -3.4 -3.0 -2.6 Gross profit margin (%) 53.0% 55.8% 57.6% 63.5% 69.0% 71.0% 73.0% 75.0% EBITDA margin (%) 4.3% na na na na na na na EBIT margin (%) 1.6% na na na na na na na Net profit margin (%) 0.5% na na na na na na na Tax rate (%) 33.0% 33.0% 33.0% 33.0% 33.0% 33.0% 0.0% na Payout ratio (%) 0.0% 0.0% 0.0% 0.0% 0.0% 0.0% 0.0% 0.0% EPS reported (EUR) 0.00 -0.01 -0.25 -0.46 -0.57 -0.58 -0.46 -0.41 % change na na na na na na na na EPS adjusted (EUR) 0.00 -0.01 -0.25 -0.46 -0.57 -0.58 -0.46 -0.41 % change na na na na na na na na EPS adj and fully diluted(EUR) 0.00 -0.01 -0.25 -0.46 -0.63 -0.59 -0.49 -0.43 % change na na na na na na na na DPS (EUR) 0.00 0.00 0.00 0.00 0.00 0.00 0.00 0.00 % change na na na na na na na na Consensus Sales (EURm) 8.6 12.9 na Consensus EBITDA (EURm) -1.3 0.5 na Consensus EBIT (EURm) -1.6 0.1 na Consensus EPS (EUR) -0.36 0.01 na Consensus DPS (EUR) 0.00 0.00 na

Theradiag Buy TP EUR 5.30
22 keplercheuvreux.com
Cash flow statement
FY to 31/12 (EURm) 2010 2011 2012 2013 2014 2015E 2016E 2017E
Net profit before minorities 0.1 -0.3 -1.0 -1.9 -3.0 -3.1 -2.7 -2.6 Depreciation and amortisation 0.3 0.3 -0.1 0.2 0.4 0.5 0.6 0.7 Goodwill impairment 0.0 0.0 0.0 0.0 -0.1 -0.1 -0.1 -0.1 Change in working capital -0.3 -0.6 0.3 -1.6 0.0 0.4 -0.2 -0.3 Others -0.1 -0.4 0.4 0.0 0.1 0.1 0.1 0.1 Cash Flow from operating activities 0.0 -1.1 -0.4 -3.3 -2.5 -2.2 -2.3 -2.3 % Change na na na na na na na na Capex -0.3 -0.7 -0.4 -0.9 -1.0 -0.8 -0.7 -0.8 Free cash flow -0.2 -1.7 -0.9 -4.2 -3.5 -3.0 -3.0 -3.1 % Change na na na na na na na na Acquisitions -0.1 0.0 -0.1 -2.2 -0.2 -0.2 0.0 0.0 Divestments 0.2 0.7 -0.5 0.2 0.2 0.1 0.3 0.0 Dividend paid 0.0 0.0 0.0 0.0 0.0 0.0 0.0 0.0 Share buy back 0.0 0.0 0.0 0.0 0.0 0.0 0.0 0.0 Capital increases 0.0 1.0 6.8 1.8 2.7 1.8 1.8 1.8 Others -0.1 0.2 0.6 -0.1 0.1 0.0 0.0 0.0 Change in net financial debt -0.2 0.2 5.9 -4.4 -0.7 -1.3 -0.9 -1.3 Change in cash and cash equivalents -0.2 0.2 5.9 -4.4 -0.7 -0.8 -0.6 -1.0 Attributable FCF -0.2 -1.7 -0.9 -4.2 -3.5 -3.0 -3.0 -3.1 Cash flow per share (EUR) 0.00 -0.05 -0.11 -0.79 -0.49 -0.41 -0.39 -0.36 % Change na na na na na na na na FCF per share (EUR) -0.01 -0.07 -0.23 -0.99 -0.68 -0.56 -0.52 -0.49 % Change na na na na na na na na Capex / Sales (%) 2.3% 6.6% 5.2% 12.7% 14.3% 10.7% 7.7% 6.6% Capex / D&A (%) 83.7% 178.0% 59.2% 345.9% 203.1% 135.2% 94.8% 100.4% Cash flow / Sales (%) 0.1% na na na na na na na FCF / Sales (%) na na na na na na na na FCF Yield (%) na na na na na na na na Unlevered FCF Yield (%) na na na na na na na na

Theradiag Buy TP EUR 5.30
23 keplercheuvreux.com
Balance sheet
FY to 31/12 (EURm) 2010 2011 2012 2013 2014 2015E 2016E 2017E
Cash and cash equivalents 2.3 2.5 8.4 4.0 3.3 2.5 1.8 0.8 Inventories 1.5 1.5 1.6 1.7 1.8 1.9 2.3 3.0 Accounts receivable 0.6 0.4 0.7 0.8 0.6 0.7 0.9 1.1 Other current assets 0.2 0.2 0.6 1.2 1.0 1.0 1.1 1.2 Current assets 4.6 4.6 11.3 7.6 6.7 6.0 6.1 6.1 Tangible assets 0.3 0.2 0.1 0.1 0.7 0.6 0.6 0.6 Goodwill 0.0 0.0 0.0 0.0 0.0 0.0 0.0 0.0 Other Intangible assets 0.4 0.8 0.7 1.0 2.9 2.7 2.6 2.5 Financial assets 0.3 0.2 2.7 2.9 0.3 0.3 0.3 0.3 Other non-current assets 1.0 0.0 0.0 0.0 0.0 0.0 0.0 0.0 Non-current assets 2.1 1.2 3.4 4.0 3.8 3.6 3.5 3.4 Short term debt 0.0 0.0 2.1 0.0 0.4 0.4 0.4 0.4 Accounts payable 1.8 1.0 1.8 0.7 0.8 0.9 1.1 1.5 Other short term liabilities 0.7 0.8 1.0 1.2 1.1 1.5 1.8 2.3 Current liabilities 2.5 1.8 4.8 1.9 2.3 2.9 3.4 4.2 Long term debt 1.0 1.4 1.4 1.3 1.1 1.0 1.3 1.3 Pension provisions 0.0 0.0 0.0 0.0 0.0 0.0 0.0 0.0 Other long term provisions 0.2 0.0 0.0 0.1 0.4 0.1 0.2 0.2 Other long term liabilities 0.0 0.0 0.0 0.0 0.0 0.0 0.0 0.0 Non-current liabilities 1.2 1.4 1.4 1.4 1.6 1.1 1.5 1.5 Shareholders' equity 2.9 2.6 8.4 8.3 6.7 5.6 4.7 3.9 Minority interests 0.0 0.0 0.0 0.0 0.0 0.0 0.0 0.0 Total equity 2.9 2.6 8.4 8.3 6.7 5.6 4.7 3.9 Balance sheet total 6.6 5.8 14.6 11.7 10.5 9.6 9.6 9.5 % Change 0.9% -12.1% 151.1% -20.4% -9.7% -8.5% -0.1% -1.1% Book value per share (EUR) 0.13 0.11 2.20 1.99 1.28 1.06 0.80 0.60 % Change 2.1% -10.7% 1864.6% -9.7% -35.4% -17.6% -23.9% -25.2% Net debt -1.3 -1.1 -5.0 -2.7 -1.7 -1.0 -0.1 1.0 Net financial debt -1.3 -1.1 -5.0 -2.7 -1.7 -1.0 -0.1 1.0 Trade working capital 0.3 1.0 0.5 1.8 1.6 1.6 2.1 2.6 Working capital -0.3 0.4 0.1 1.7 1.5 1.1 1.3 1.6 Inventories/sales 13.6% 14.6% 19.4% 24.8% 24.6% 24.6% 24.6% 24.6% Invested capital 0.1 0.6 0.1 1.8 2.2 1.7 1.9 2.2 Net fin. debt / EBITDA (x) -2.7 5.2 19.8 1.6 0.6 0.4 0.0 -0.6 Net fin. debt / FCF (x) 5.3 0.6 5.8 0.7 0.5 0.3 0.0 -0.3 Gearing (%) -44.2% -41.9% -59.3% -32.4% -25.5% -17.9% -1.4% 25.0% Goodwill / Equity (%) 0.0% 0.0% 0.0% 0.0% 0.0% 0.0% 0.0% 0.0%
Theradiag Buy TP EUR 5.30
24 keplercheuvreux.com
Research ratings and important disclosures Disclosure checklist - Potential conflict of interests
Stock ISIN Disclosure (See Below) Currency Price
ABBVIE US00287Y1091 nothing to disclose USD 66.49 AMGEN US0311621009 nothing to disclose USD 162.49 BIOSYNEX FR0011005933 nothing to disclose EUR 4.05 CHUGAI PHARM. JP3519400000 nothing to disclose JPY 3785 DIAGNOCURE CA2519121016 nothing to disclose CAD 0.13 DIAXONHIT FR0004054427 nothing to disclose EUR 0.58 EPIGENOMICS N DE000A11QW50 nothing to disclose EUR 5.65 GENOMIC VISION FR0011799907 8 EUR 14.3 INTEGRAGEN FR0010908723 nothing to disclose EUR 5.77 JOHNSON & JOHNSON US4781601046 nothing to disclose USD 100.74 MERCK & CO. (FRA) US58933Y1055 nothing to disclose EUR 54.65 NANOSPHERE US63009F2048 nothing to disclose USD 4.08 NOVACYT FR0010397232 nothing to disclose EUR 5.47 PFIZER US7170811035 nothing to disclose USD 34.48 ROCHE CH0012032048 nothing to disclose CHF 273.3 ROSETTA GENOMICS IL0011026494 nothing to disclose USD 3.42 THERADIAG FR0004197747 6, 8 EUR 3.57 TROVAGENE US8972383090 nothing to disclose USD 8.07 UCB BE0003739530 nothing to disclose EUR 67.04
Source: Factset closing prices of 28/04/2015 Stock prices: Prices are taken as of the previous day’s close (to the date of this report) on the home market unless otherwise stated.
Key:
Kepler Capital Markets SA (KCM) holds or owns or controls 100% of the issued shares of Crédit Agricole Cheuvreux SA (CA Cheuvreux), collectively hereafter KEPLER CHEUVREUX .
1. KEPLER CHEUVREUX holds or owns or controls 5% or more of the issued share capital of this company; 2. The company holds or owns or controls 5% or more of the issued share capital of Kepler Capital Markets SA; 3. KEPLER CHEUVREUX is or may be regularly carrying out proprietary trading in equity securities of this company; 4. KEPLER CHEUVREUX has been lead manager or co-lead manager in a public offering of the issuer’s financial instruments during the last twelve months; 5. KEPLER CHEUVREUX is a market maker in the issuer’s financial instruments; 6. KEPLER CHEUVREUX is a liquidity provider in relation to price stabilisation activities for the issuer to provide liquidity in such instruments; 7. KEPLER CHEUVREUX acts as a corporate broker or a sponsor or a sponsor specialist (in accordance with the local regulations) to this company; 8. KEPLER CHEUVREUX and the issuer have agreed that KEPLER CHEUVREUX will produce and disseminate investment research on the said issuer as a service to the issuer; 9. KEPLER CHEUVREUX has received compensation from this company for the provision of investment banking or financial advisory services within the previous twelve months; 10. KEPLER CHEUVREUX may expect to receive or intend to seek compensation for investment banking services from this company in the next three months; 11. The author of, or an individual who assisted in the preparation of, this report (or a member of his/her household), or a person who although not involved in the preparation of the report had or could reasonably be expected to have access to the substance of the report prior to its dissemination has a direct ownership position in securities issued by this company; 12. An employee of KEPLER CHEUVREUX serves on the board of directors of this company; 13. As at the end of the month immediately preceding the date of publication of the research report Kepler Capital Markets, Inc. beneficially owned 1% or more of a class of common equity securities of the subject company; 14. KEPLER CHEUVREUX and UniCredit Bank AG have entered i nto a Co-operation Agreement to form a strategic alliance in connection with certain services including services connected to investment banking transactions. UniCredit Bank AG provides investment banking services to this issuer in return for which UniCredit Bank AG received consideration or a promise of consideration. Separately, through the Co-operation Agreement with UniCredit Bank AG for services provided by KEPLER CHEUVREUX in connection with such activities, KEPLER CHEUVREUX also received consideration or a promise of a consideration in accordance with the general terms of the Co-operation Agreement; 15. KEPLER CHEUVREUX and Crédit Agricole Corporate & Investment Bank (“CACIB”) have entered into a Co-operation Agreement to form a strategic alliance in connection with certain services including services connected to investment banking transactions. CACIB provides investment banking services to this issuer in return for which CACIB received consideration or a promise of consideration. Separately, through the Co-operation Agreement with CACIB for services provided by KEPLER CHEUVREUX in connection with such activities, KEPLER CHEUVREUX also received consideration or a promise of a consideration in accordance with the general terms of the Co-operation Agreement; 16. UniCredit Bank AG holds or owns or controls 5% or more of the issued share capital of KEPLER CAPITAL MARKETS SA. UniCredit Bank AG provides investment banking services to this issuer in return for which UniCredit Bank AG received consideration or a promise of consideration; 17. CACIB holds or owns or controls 15% of more of the issued share capital of KEPLER CAPITAL MARKETS SA. CACIB provides investment banking services to this issuer in return for which CACIB received consideration or a promise of consideration; 18. An employee of UniCredit Bank AG serves on the board of directors of KEPLER CAPITAL MARKETS SA; 19. Two employees of CACIB serve on the board of directors of KEPLER CAPITAL MARKETS SA. CACIB provides investment banking services to this issuer in return for which CACIB received consideration or a promise of consideration; 20. The services provided by KEPLER CHEUVREUX are provided by Kepler Equities S.A.S., a wholly-owned subsidiary of KEPLER CAPITAL MARKETS SA.
Rating history:
KEPLER CHEUVREUX current rating for Theradiag is Buy and was issued on 12/05/2014.
We did not disclose the rating to the issuer before publication and dissemination of this document.
Rating ratio Kepler Cheuvreux Q1 2015 Rating breakdown A B Buy 44.0% 0.0% Hold 34.0% 0.0% Reduce 21.0% 0.0% Not Rated/Under Review/Accept Offer 1.0% 0.0% Total 100.0% 0.0% Source: Kepler Cheuvreux A: % of all research recommendations B: % of issuers to which Investment Banking Services are supplied
From 9 May 2006, KEPLER CHEUVREUX’s rating system consists of three ratings: Buy, Hold and Reduce. For a Buy rating, the minimum expected upside is 10% in absolute terms over 12 months. For a Hold rating the expected upside is below 10% in absolute terms. A Reduce rating is applied when there is expected downside on the stock. Target prices are set on all stocks under coverage, based on a 12-month view. Equity ratings and valuations are issued in absolute terms, not relative to any given benchmark.

Theradiag Buy TP EUR 5.30
25 keplercheuvreux.com
Analyst disclosures
The functional job title of the person(s) responsible for the recommendations contained in this report is Equity Research Analyst unless otherwise stated on the cover.
Name of the Equity Research Analyst(s): Lionel Labourdette, PhD, MBA
Regulation AC - Analyst Certification: Each Equity Research Analyst(s) listed on the front-page of this report, principally responsible for the preparation and content of all or any identified portion of this research report hereby certifies that, with respect to each issuer or security or any identified portion of the report with respect to an issuer or security that the equity research analyst covers in this research report, all of the views expressed in this research report accurately reflect their personal views about those issuer(s) or securities. Each Equity Research Analyst(s) also certifies that no part of their compensation was, is, or will be, directly or indirectly, related to the specific recommendation(s) or view(s) expressed by that equity research analyst in this research report.
Each Equity Research Analyst certifies that he is acting independently and impartially from KEPLER CHEUVREUX shareholders, directors and is not affected by any current or potential conflict of interest that may arise from any KEPLER CHEUVREUX activities.
Analyst Compensation: The research analyst(s) primarily responsible for the preparation of the content of the research report attest that no part of the analyst’s(s’) compensation was, is or will be, directly or indirectly, related to the specific recommendations expressed by the research analyst(s) in the research report. The research analyst’s(s’) compensation is, however, determined by the overall economic performance of KEPLER CHEUVREUX.
Registration of non-US Analysts: Unless otherwise noted, the non-US analysts listed on the front of this report are employees of KEPLER CHEUVREUX, which is a non-US affiliate and parent company of Kepler Capital Markets, Inc. a SEC registered and FINRA member broker-dealer. Equity Research Analysts employed by KEPLER CHEUVREUX, are not registered/qualified as research analysts under FINRA/NYSE rules, may not be associated persons of Kepler Capital Markets, Inc. and may not be subject to NASD Rule 2711 and NYSE Rule 472 restrictions on communications with covered companies, public appearances, and trading securities held by a research analyst account.
Please refer to www.keplercheuvreux.com for further information relating to research and conflict of interest management.
Regulators Location Regulator Abbreviation
Kepler Capital Markets S.A - France Autorité des Marchés Financiers AMF
Kepler Capital Markets, Sucursal en España Comisión Nacional del Mercado de Valores CNMV
Kepler Capital Markets, Frankfurt branch Bundesanstalt für Finanzdienstleistungsaufsicht BaFin
Kepler Capital Markets, Milan branch Commissione Nazionale per le Società e la Borsa CONSOB
Kepler Capital Markets, Amsterdam branch Autoriteit Financiële Markten AFM
Kepler Capital Markets, Zurich branch Swiss Financial Market Supervisory Authority FINMA
Kepler Capital Markets, Inc. Financial Industry Regulatory Authority FINRA
Kepler Capital Markets, London branch Financial Conduct Authority FCA
Kepler Capital Markets, Vienna branch Austrian Financial Services Authority FMA
Crédit Agricole Cheuvreux, SA - France Autorité des Marchés Financiers AMF
Crédit Agricole Cheuvreux España S.V Comisión Nacional del Mercado de Valores CNMV
Crédit Agricole Cheuvreux Niederlassung Deutschland Bundesanstalt für Finanzdienstleistungsaufsicht BaFin
Crédit Agricole Cheuvreux S.A., branch di Milano Commissione Nazionale per le Società e la Borsa CONSOB
Crédit Agricole Cheuvreux Amsterdam Autoriteit Financiële Markten AFM
Crédit Agricole Cheuvreux Zurich Branch Swiss Financial Market Supervisory Authority FINMA
Crédit Agricole Cheuvreux North America, Inc. Financial Industry Regulatory Authority FINRA
Crédit Agricole Cheuvreux International Limited Financial Conduct Authority FCA
Crédit Agricole Cheuvreux Nordic AB Finansinspektionen FI
Kepler Capital Markets S.A and Crédit Agricole Cheuvreux SA, are authorised and regulated by both Autorité de Contrôle Prudentiel and Autorité des Marchés Financiers.
For further information relating to research recommendations and conflict of interest management please refer to www.keplercheuvreux.com..
Theradiag Buy TP EUR 5.30
26 keplercheuvreux.com
Legal and disclosure information Other disclosures
This product is not for retail clients or private individuals.
The information contained in this publication was obtained from various publicly available sources believed to be reliable, but has not been independently verified by KEPLER CHEUVREUX. KEPLER CHEUVREUX does not warrant the completeness or accuracy of such information and does not accept any liability with respect to the accuracy or completeness of such information, except to the extent required by applicable law.
This publication is a brief summary and does not purport to contain all available information on the subjects covered. Further information may be available on request. This report may not be reproduced for further publication unless the source is quoted.
This publication is for information purposes only and shall not be construed as an offer or solicitation for the subscription or purchase or sale of any securiti es, or as an invitation, inducement or intermediation for the sale, subscription or purchase of any securities, or for engaging in any other transaction. This publication is not for private individuals.
Any opinions, projections, forecasts or estimates in this report are those of the author only, who has acted with a high degree of expertise. They reflect only the current views of the author at the date of this report and are subject to change without notice. KEPLER CHEUVREUX has no obligation to update, modify or amend this publication or to otherwise notify a reader or recipient of this publication in the event that any matter, opinion, projection, forecast or estimate contained herein, changes or subsequently becomes inaccurate, or if research on the subject company is withdrawn. The analysis, opinions, projections, forecasts and estimates expressed in this report were in no way affected or influenced by the issuer. The author of this publication benefits financially from the overall success of KEPLER CHEUVREUX.
The investments referred to in this publication may not be suitable for all recipients. Recipients are urged to base their investment decisions upon their own appropriate investigations that they deem necessary. Any loss or other consequence arising from the use of the material contained in this publication shall be the sole and exclusive responsibility of the investor and KEPLER CHEUVREUX accepts no liability for any such loss or consequence. In the event of any doubt about any investment, recipients should contact their own investment, legal and/or tax advisers to seek advice regarding the appropriateness of investing. Some of the investments mentioned in this publication may not be readily liquid investments. Consequently it may be difficult to sell or realise such investments. The past is not necessarily a guide to future performance of an investment. The value of investments and the income derived from them may fall as well as rise and investors may not get back the amount invested. Some investments discussed in this publication may have a high level of volatility. High volatility investments may experience sudden and large falls in their value which may cause losses. International investing includes risks related to political and economic uncertainties of foreign countries, as well as currency risk.
To the extent permitted by applicable law, no liability whatsoever is accepted for any direct or consequential loss, damages, costs or prejudices whatsoever arising from the use of this publication or its contents.
KEPLER CHEUVREUX (and its affiliates) have implemented written procedures designed to identify and manage potential conflicts of interest that arise in connection with its research business, which are available upon request. The KEPLER CHEUVREUX research analysts and other staff involved in issuing and disseminating research reports operate independently of KEPLER CHEUVREUX Investment Banking business. Information barriers and procedures are in place between the research analysts and staff involved in securities trading for the account of KEPLER CHEUVREUX or clients to ensure that price sensitive information is handled according to applicable laws and regulations.
Country and region disclosures
United Kingdom: This document is for persons who are Eligible Counterparties or Professional Clients only and is exempt from the general restriction in section 21 of the Financial Services and Markets Act 2000 on the communication of invitations or inducements to engage in investment activity on the grounds that it is being distributed in the United Kingdom only to persons of a kind described in Articles 19(5) (Investment professionals) and 49(2) (High net worth companies, unincorporated associations, etc.) of the Financial Services and Markets Act 2000 (Financial Promotion) Order 2005 (as amended). It is not intended to be distributed or passed on, directly or indirectly, to any other class of persons. Any investment to which this document relates is available only to such persons, and other classes of person should not rely on this document.
United States: This communication is only intended for, and will only be distributed to, persons residing in any jurisdictions where such distribution or availability would not be contrary to local law or regulation. This communication must not be acted upon or relied on by persons in any jurisdiction other than in accordance with local law or regulation and where such person is an investment professional with the requisite sophistication to understand an investment in such securities of the type communicated and assume the risks associated therewith.
This communication is confidential and is intended solely for the addressee. It is not to be forwarded to any other person or copied without the permission of the sender. This communication is provided for information only. It is not a personal recommendation or an offer to sell or a solicitation to buy the securities mentioned. Investors should obtain independent professional advice before making an investment.
Notice to U.S. Investors: This material is not for distribution in the United States, except to “major US institutional investors” as defined in SEC Rule 15a-6 ("Rule 15a-6"). Kepler Cheuvreux refers to Kepler Capital Markets, Société anonyme (S.A.) (“Kepler Capital Markets SA”) and its affiliates, i ncluding CA Cheuvreux, Société Anonyme (S.A.). Kepler Capital Markets SA has entered into a 15a-6 Agreement with Kepler Capital Markets, Inc. ("KCM, Inc.”) which enables this report to be furnished to certain U.S. recipients in reliance on Rule 15a-6 through KCM, Inc.
Each U.S. recipient of this report represents and agrees, by virtue of its acceptance thereof, that it is a "major U.S. institutional investor" (as such term is defined in Rule 15a-6) and that it understands the risks involved in executing transactions in such securities. Any U.S. recipient of this report that wishes to discuss or receive additional information regarding any security or issuer mentioned herein, or engage in any transaction to purchase or sell or solicit or offer the purchase or sale of such securities, should contact a registered representative of KCM, Inc.
KCM, Inc. is a broker-dealer registered with the Securities and Exchange Commission (“SEC”) under the U.S. Securities Exchange Act of 1934, as amended, Member of the Financial Industry Regulatory Authority (“FINRA”) and Member of the Securities Investor Protection Corporation (“SIPC”). Pursuant to SEC Rule 15a-6, you must contact a Registered Representative of KCM, Inc. if you are seeking to execute a transaction in the securities discussed in this report. You can reach KCM, Inc. at 600 Lexington Avenue, New York, NY 10022, Compliance Department (212) 710-7625; Operations Department (212) 710-7606; Trading Desk (212) 710-7602. Further information is also available at www.keplercapitalmarkets.com. You may obtain information about SIPC, including the SIPC brochure, by contacting SIPC directly at 202-371-8300; website: http://www.sipc.org/
KCM, Inc. is a wholly owned subsidiary of Kepler Capital Markets SA. Kepler Capital Markets SA, registered on the Paris Register of Companies with the number 413 064 841 (1997 B 10253), whose registered office is located at 112 avenue Kléber, 75016 Paris, is authorised and regulated by both Autorité de Contrôle Prudentiel (ACP) and Autorité des Marchés Financiers (AMF).
Nothing herein excludes or restricts any duty or liability to a customer that KCM, Inc. may have under applicable law. Investment products provided by or through KCM, Inc. are not insured by the Federal Deposit Insurance Corporation and are not deposits or other obligations of any insured depository institution, may lose value and are not guaranteed by the entity that published the research as disclosed on the front page and are not guaranteed by KCM, Inc.
Investing in non-U.S. Securities may entail certain risks. The securities referred to in this report and non-U.S. issuers may not be registered under the U.S. Securities Act of 1933, as amended, and the issuer of such securities may not be subject to U.S. reporting and/or other requirements. Rule 144A securities may be offered or sold only to persons in the U.S. who are Qualified Institutional Buyers within the meaning of Rule 144A under the Securities Act. The information available about non-U.S. companies may be limited, and non-U.S. companies are generally not subject to the same uniform auditing and reporting standards as U.S. companies. Securities of some non-U.S. companies may not be as liquid as securities of comparable U.S. companies. Securities discussed herein may be rated below investment grade and should therefore only be considered for inclusion in accounts qualified for speculative investment.

Theradiag Buy TP EUR 5.30
27 keplercheuvreux.com
Analysts employed by Kepler Capital Markets SA, a non-U.S. broker-dealer, are not required to take the FINRA analyst exam. The information contained in this report is intended solely for certain "major U.S. institutional investors" and may not be used or relied upon by any other person for any purpose. Such information is provided for informational purposes only and does not constitute a solicitation to buy or an offer to sell any securities under the Securities Act of 1933, as amended, or under any other U.S. federal or state securities laws, rules or regulations. The investment opportunities discussed in this report may be unsuitable for certain investors depending on their specific investment objectives, risk tolerance and financial position.
In jurisdictions where KCM, Inc. is not registered or licensed to trade in securities, or other financial products, transactions may be executed only in accordance with applicable law and legislation, which may vary from jurisdiction to jurisdiction and which may require that a transaction be made in accordance with applicable exemptions from registration or licensing requirements.
The information in this publication is based on sources believed to be reliable, but KCM, Inc. does not make any representation with respect to its completeness or accuracy. All opinions expressed herein reflect the author's judgment at the original time of publication, without regard to the date on which you may receive such information, and are subject to change without notice.
KCM, Inc. and/or its affiliates may have issued other reports that are inconsistent with, and reach different conclusions from, the information presented in this report. These publications reflect the different assumptions, views and analytical methods of the analysts who prepared them. Past performance should not be taken as an indication or guarantee of future performance, and no representation or warranty, express or implied, is provided in relation to future performance.
KCM, Inc. and any company affiliated with it may, with respect to any securities discussed herein: (a) take a long or short position and buy or sell such securities; (b) act as investment and/or commercial bankers for issuers of such securities; (c) act as market makers for such securities; (d) serve on the board of any issuer of such securities; and (e) act as paid consultant or advisor to any issuer. The information contained herein may include forward-looking statements within the meaning of U.S. federal securities laws that are subject to risks and uncertainties. Factors that could cause a company's actual results and financial condition to differ from expectations include, without limitation: political uncertainty, changes in general economic conditions that adversely affect the level of demand for the company's products or services, changes in foreign exchange markets, changes in international and domestic financial markets and in the competitive environment, and other factors relating to the foregoing. All forward-looking statements contained in this report are qualified in their entirety by this cautionary statement.
France: This publication is issued and distributed in accordance with Articles L.544-1 and seq and R. 621-30-1 of the Code Monétaire et Financier and with Articles 313-25 to 313-27 and 315-1 and seq of the General Regulation of the Autorité des Marchés Financiers (AMF).
Germany: This report must not be distributed to persons who are retail clients in the meaning of Sec. 31a para. 3 of the German Securities Trading Act (Wertpapierhandelsgesetz – “WpHG”). This report may be amended, supplemented or updated in such manner and as frequently as the author deems.
Italy: This document is issued by Kepler Capital Markets, Milan branch and Crédit Agricole Cheuvreux S.A., branch di Milano, authorised in France by the Autorité des Marchés Financiers (AMF) and the Autorité de Contrôle Prudentiel (ACP) and registered in Italy by the Commissione Nazionale per le Società e la Borsa (CONSOB) and is distributed by Kepler Capital Markets S.A and Crédit Agricole Cheuvreux, Société Anonyme (S.A.), authorised in France by the AMF and the ACP and registered in Italy by CONSOB. This document is for Eligible Counterparties or Professional Clients only as defined by the CONSOB Regulation 16190/2007 (art. 26 and art. 58).Other classes of persons should not rely on this document. Reports on issuers of financial instruments listed by Article 180, paragraph 1, letter a) of the Italian Consolidated Act on Financial Services (Legislative Decree No. 58 of 24/2/1998, as amended from time to time) must comply with the requirements envisaged by articles 69 to 69-novies of CONSOB Regulation 11971/1999. According to these provisions Kepler Capital Markets S.A and Crédit Agricole Cheuvreux, Société Anonyme (S.A.)warns on the significant interests of Kepler Capital Markets S.A and Crédit Agricole Cheuvreux, Société Anonyme (S.A.)indicated in Annex 1 hereof, confirms that there are not significant financial interests of Kepler Capital Markets S.A and Crédit Agricole Cheuvreux, Société Anonyme (S.A.)in relation to the securities object of this report as well as other circumstance or relationship with the issuer of the securities object of this report (including but not limited to conflict of interest, significant shareholdings held in or by the issuer and other significant interests held by Kepler Capital Markets S.A and Crédit Agricole Cheuvreux, Société Anonyme (S.A.)or other entities controlling or subject to control by Kepler Capital Markets S.A and Crédit Agricole Cheuvreux, Société Anonyme (S.A.)in relation to the issuer which may affect the impartiality of this document]. Equities discussed herein are covered on a continuous basis with regular reports at results release. Reports are released on the date shown on cover and distributed via print and email. Kepler Capital Markets, Milan branch and Crédit Agricole Cheuvreux S.A., branch di Milano analysts are not affiliated with any professional groups or organisations. All estimates are by Kepler Capital Markets S.A and Crédit Agricole Cheuvreux, Société Anonyme (S.A.) unless otherwise stated.
Spain: This document is only intended for persons who are Eligible Counterparties or Professional Clients within the meaning of Article 78bis and Article 78ter of the Spanish Securities Market Act. It is not intended to be distributed or passed on, directly or indirectly, to any other class of persons. This report has been issued by Kepler Capital Markets, Sucursal en España and Crédit Agricole Cheuvreux España S.V, registered in Spain by the Comisión Nacional del Mercado de Valores (CNMV) in the foreign investments firms registry and it has been distributed in Spain by it or by Kepler Capital Markets S.A and Crédit Agricole Cheuvreux, Société Anonyme (S.A.) authorised and regulated by both Autorité de Contrôle Prudentiel and Autorité des Marchés Financiers. There is no obligation to either register or file any report or any supplemental documentation or information with the CNMV. In accordance with the Spanish Securities Market Law (Ley del Mercado de Valores), there is no need for the CNMV to verify, authorise or carry out a compliance review of this document or related documentation, and no information needs to be provided.
Switzerland: This publication is intended to be distributed to professional investors in circumstances such that there is no public offer. This publication does not constitute a prospectus within the meaning of Articles 652a and 1156 of the Swiss Code of Obligations.
Canada: The information provided in this publication is not intended to be distributed or circulated in any manner in Canada and therefore should not be construed as any kind of financial recommendation or advice provided within the meaning of Canadian securities laws.
Other countries: Laws and regulations of other countries may also restrict the distribution of this report. Persons in possession of this document should inform themselves about possible legal restrictions and observe them accordingly.
Equity Research Local insight, European scale
keplercheuvreux.com
Medtech & services research team
Lionel Labourdette, PhD, MBA Main author
+33 1 70 81 57 98
Natalia Bobo [email protected]
+34 91 436 5165
Maja Pataki Head of Med Tech Devices Research
+41 43 333 6623
Lionel is a specialist of the structure and
chemistry of proteins
Before joining Kepler Cheuvreux, Lionel
began his career in 1989 as a researcher
in various laboratories and institutes.
He co-initiated a project in 1999 in the
field of gene therapy. He then became
sell-side analyst in charge of Pharma
and Biotech sectors at Dexia Securities
and in 2001 he joined the Pharma team
of HSBC Securities to cover European
biotech stocks. In 2004, Lionel became
CFO of Laboratoires GOEMAR, a
biotech company specialised in sea
water solutions and active ingredients
in seaweed. He developed a consulting
business and co-funded Biostrategic
Partners in 2011. Lionel has been
involved in recent IPOs on the NYSE
Euronext and SPOs.
Lionel graduated from the Ecole
Normale Supérieure de Lyon, and has a
PhD in Biochemistry from University of
Lyon and an MBA from EM Lyon.
David Cerdan Head of Small & Mid Caps Research [email protected]
+33 1 7081 5743
Filippo Prini [email protected]
+39 02 8550 7226
Richard Koch [email protected]
+46 8 723 5172
Oliver Reinberg, CFA Head of Med Techs. & Services Research
+49 69 7569 140
Europe
Amsterdam +31 20 573 06 66 Frankfurt +49 69 756 960 Geneva +41 22 361 5151 London +44 20 7621 5100 Madrid +34 914365100 Milan +39 02 85507 1 Paris +33 1 53 65 35 00 Stockholm +46 8 723 51 00 Vienna +43 1 537 124 147 Zurich +41 43 333 66 66
America & Asia
Boston +1 617 295 0100 New York +1 212 710 7600 San Francisco +1 415 255 9802