Embed Size (px)
Citation preview

The Real Value of China’s Stock Market by
Fangzhou Lu
An honors thesis submitted in partial fulfillment
of the requirements for the degree of
Bachelor of Science
Undergraduate College
Leonard N. Stern School of Business
New York University
May 2014
Professor Marti G. Subrahmanyam Professor Robert Whitelaw Faculty Adviser Thesis Adviser

The Real Value of China’s Stock Market⇤
Jennifer N. Carpenter
New York University
Fangzhou Lu
New York University
Robert F. Whitelaw
New York University
March 31, 2014
⇥We thank Viral Acharya, Franklin Allen, Yakov Amihud, Jennifer Arlen, Kalok Chan, HuiChen, Will Goetzmann, Joel Hasbrouck, Peter Henry, Kose John, Alexander Ljungqvist, ThomasPhilippon, Alexi Savov, Antionette Schoar, Myron Scholes, Johannes Stroebel, Jiang Wang, Je�Wurgler, and Hongjun Yan for helpful comments and suggestions.
The Real Value of China’s Stock Market
Abstract
China is the world’s largest investor and greatest contributor to global growth. The success
of China’s stock market in attracting domestic and international capital and allocating it
e⇧ciently to corporate investment will be an important determinant of global growth in the
coming decades. Despite its reputation as a casino, China’s stock market has functioned well
since the reforms of the last decade. Stock price informativeness has increased and compares
favorably with that in the US. The e⇧ciency of corporate investment is highly correlated with
stock price informativeness and has followed a strikingly similar trend. Despite its segmented
nature, China’s equity market delivers a cross-sectional pattern of returns surprisingly similar
to that found in other countries, with high premia for size, value, illiquidity, and right-
skewed payo⇥s. Moreover, China’s stock market has performed well, especially its small
and medium enterprises. It exhibits low correlation with other equity markets, reflecting
restrictions on international capital flows. As a result, China’s factor portfolios o⇥er high
alphas for US and global investors who can access them. This suggests that liberalizing
capital flows would reduce corporate China’s cost of capital. While China’s stock market is
already an important enterprise financing channel, additional regulatory reforms to improve
the information environment and liberalize the flow of capital would further empower this
market to attract capital, allocate it e⇧ciently, and support economic growth worldwide.
China became the world’s largest investor in 2010 and has held the leading position
ever since. In 2013, China made $4.4 trillion of total fixed-asset investment, compared with
$3.1 trillion in the US and $1.2 trillion in Japan. China has also been the greatest contributor
to global growth since 2006, contributing $0.7 trillion to global GDP in 2013, compared with
$0.5 trillion from the US and $0.1 trillion from Russia. The e⇧ciency of China’s financial
system in allocating capital across investment opportunities will be an important determinant
of global economic growth in the coming decades, and its stock market is likely to be the
most critical channel.
China’s financial system is dominated by a large state-owned banking sector and a grow-
ing shadow banking sector. Total bank credit was 128% of GDP in 2012, according to Elliott
and Yan (2013), and total credit in the shadow banking sector was reckoned to be anywhere
from 40 to 90% of GDP, while China’s stock market capitalization is only 44% of GDP.
By contrast, in the US, bank credit and stock market capitalization were 48% and 118% of
GDP in 2012. Allen, Qian, and Qian (2005) argue that China is a counterexample to the
findings of the law, insititutions, growth, and finance literature such as La Porta, Lopez-de-
Silanes, Shleifer, and Vishny (1997, 1998, 2000), and that its alternative financing channels
support its growth. Despite increasing concerns about the rapid growth of the unregulated
shadow banking sector, bad loans, and systemic risk, China has tolerated this growing sector,
perhaps as a channel for more market-driven lending and interest rate liberalization.
While China’s shadow banking sector may be an e⇥ective financing channel for fueling
economic growth, explicit and implicit state subsidies to this sector may crowd out other
important competing financial sectors. In particular, China’s stock market has a unique,
essential, and potentially more important role to play. A large literature in economics,
finance, and accounting links good legal and market institutions, informativeness of stock
prices about future profits and required returns, and e⇧ciency of corporate investment and
economic growth. Relative to other components of the financial system, such as banks, stock
markets can improve the e⇧ciency of capital allocation by creating stronger incentives for
information generation and by aggregating that information across a broader set of market
participants. In addition, listing standards and auditing and disclosure processes for publicly
traded firms provide transparency. Stock markets also channel tradable equity capital to
firms, lowering the cost of equity capital, and enriching the portfolio choice of investors.
Relative to other financing channels, stock markets can also be the preferred access point
for foreign portfolio investors because of the relative transparency and liquidity of traded
equities. Finally, because of their role in generating information and transparency, stock
markets can be important complements to the relationship-driven, custom-tailored, but often
opaque banking and shadow banking sectors.
1

This paper examines the e⇥ectiveness of China’s stock market at aggregating and im-
pounding information about firm profits into prices, allocating capital e⇧ciently across firms,
and enhancing the opportunity set of investors. We begin with an analysis of the informa-
tiveness of China’s stock market over the period 1996 to 2012, using data from the China
Stock Market and Accounting Research (CSMAR) database. Following Bai, Philippon, and
Savov (2013), we define the informativeness of the market as the cross-sectional variation in
future earnings predicted by firm market value. Our results suggest that the informativeness
of prices has steadily improved since the establishment of market reforms around the time
of China’s entry into the WTO and compares favorably with that in the US. We relate the
trends in the price informativeness of China’s stock market to China’s legal, market, and
accounting regimes since 1996.
Next, we examine the e⇧ciency of corporate investment in China during the same period.
Modifying the approach of Durnev, Morck, and Yeung (2004) for the Chinese setting, we
define the e⇧ciency of investment as the unexpected change in equity value associated with
a unit of unexpected investment, measured in a cross-sectional regression. We find that the
trend of investment e⇧ciency closely follows that of price informativeness over our sample
period, with an economically and statisically high correlation between the series.
Finally, we analyze the pricing of equity in China by characterizing the cross-section of
Chinese stock returns and their correlation with stock returns in other large economies. In
contrast to the high correlations in returns across open markets, returns in China’s stock
market exhibit low correlation with other large economies. Yet, despite this evidence of
market segmentation, and the market’s early reputation as a casino, China’s stocks exhibit
cross-sectional return patterns surprising similar to those in the US. Moreover, although the
Shanghai Stock Exchange index has recently earned China’s stock market a reputation for
poor performance, our analysis of the broader market, including stocks on the Shenzhen,
SME, and ChiNext boards, suggests that China’s stock market o⇥ers attractive returns and
opportunities for diversification to international equity investors.
China’s market is still young, but our results suggest that many of China’s market reforms
have already been e⇥ective, based on the trends of stock price informativeness and investment
e⇧ciency. To sustain China’s contribution to global growth, further reforms that increase
market informativeness, liberalize capital flows, and attract international capital will be
important to reduce corporate China’s cost of equity capital and increase its investment
e⇧ciency.
2

1 Overview of China’s stock market
In contrast to the markets of developed countries, China’s stock market has a history of only
23 years. However, since its opening in 1991 in Shanghai and Shenzhen, it has become one
of the most important enterprise financing channels in China. As a country, China has the
second largest stock market by trading volume and the third largest by market capitalization,
$3.7 trillion in 2013, after the the US and Japan. Figure 1 shows that the number of stocks
has risen from 53 in 1992 to 2538 in 2012. The main boards of the Shanghai and Shenzhen
Stock Exchanges list larger more mature stocks, like the NYSE in the US. The Shenzhen
Stock Exchange also includes two other boards, the Small and Medium Enterprise Board
and the ChiNext Board, also known as the Growth Enterprise Board, more comparable to
the NASDAQ in US, which provide capital for smaller and high-technology stocks.
China’s stock market has a number of distinctive features. First, it is a pure order-
driven market, as opposed to a quote-driven market, whereas the US and several other
countries have hybrid equity market systems. Second, it is a centralized market, whereas the
US market is fragmented, with dark pools and other o⇥-exchange trading. This may have
important implications for market informativeness. There are no dark pools with hidden
orders in China, all orders are visible. Moreover, there is no extended trading period for
institutional investors. Institutional and retail investors have equal access to information
from a market microstructure point of view. In addition, China’s stock market has a price
move limit of 10% to deter excess volatility and stock manipulation.
China’s stock market has a dual-share system in which domestic investors can invest
only in A shares, while foreign investors can invest only in B shares. In addition, many
firms have H shares, traded on the Hong Kong Stock Exchange. A number of articles,
such as Chan, Menkveld, and Yang (2008) and Mei, Scheinkman, and Xiong (2009), study
the discount of B share and H share value relative to A shares, which they attribute to
information asymmetry between foreign and domestic investors and speculative motives.
With the introduction of programs such as the Qualified Foreign Institutional Investors
(QFII) program of 2002, which relaxed the cross-trading restrictions, B share issuance and
trading have mostly vanished. In addition, China’s equity market used to have a large
nontradable component, held by corporate founders, often central or local governments.
With the share structure reform starting in 2002, this phenomenon has mostly disappeared
among mid and small-cap stocks, though not entirely among large stocks.
In 2001, a famous Chinese economist, Wu Jinglian, characterized China’s stock market as
a “Casino” manipulated by speculators, misled by the central government’s visible hand to
unfairly support state-owned enterprises (SOEs), and without a strong link to fundamentals.
3

!"
#"
$!"
$#"
%!"
%#"
&!"
&#"
!"
#!!"
$!!!"
$#!!"
%!!!"
%#!!"
&!!!"
'()*+,"-."/0-123" 4-056"75,2+0"859":4,;66;-<"=7>?"
!"#$%&'()'*+",-./'01234'5-%4&1'(667879(7'

Moreover, much of the academic literature in finance on China has emphasized the market’s
imperfections. However, our results suggest that, on the contrary, China’s stock market is
as informative as the US stock market in terms of aggregating and impounding information
about future profits into prices, and exhibits a cross-sectional return pattern surprisingly
similar to those in developed markets, despite its segmented nature.
2 The informativeness of stock prices in China
A long literature in economics, finance, and accounting going back to Hayek (1945) and Fama
(1970) links good legal and market institutions to stock price informativeness about future
profits and required returns, and further to the e⇧ciency of capital allocation and corporate
investment. Elements of this nexus include the benefits of e⇥ective of listing, disclosure,
and auditing policy (Amihud and Mendelson (1988), Diamond and Verrecchia (1991), Healy
and Palepu (2001), and Hail and Leuz (2009)), aggregation of di⇥use information across
individuals, incentives to generate information, and its inference from prices (Grossman and
Stiglitz (1980), Glosten and Milgrom (1985), Kyle (1985)), and managerial use of price
signals in resource allocation and investment decisions (Wurgler (2000), Baker, Stein, and
Wurgler (2003), Durnev, Morck, and Yeung (2004), Chari and Henry (2004), Chen, Gold-
stein, and Jiang (2007)). A branch of the literature introduced by Morck, Yeung, and Yu
(2000) proposes stock price asynchronicity and idiosyncratic firm risk as measures of firm-
specific information in prices. More recently, Bai, Philippon, and Savov (2013) define price
informativeness as the predicted variation in a cross-sectional regression of future corporate
earnings on firm market values and study its trend in the US stock market. Subsection 2.1
examines the price informativeness of China’s stock market, shows that it is comparable to
that in the US, and relates its trends to the regulatory regimes that prevailed during its
history. Subsection 2.2 shows that the average idiosyncratic risk of China’s stocks is greater
than that in the US and highlights the di⇧culties of comparing R2’s across countries.
2.1 Price informativeness about future earnings
Bai, Philippon, and Savov (2013) develop a model in which stock price informativeness
promotes e⇧cient allocation of corporate investment and economic growth. They define
price informativeness as the extent to which market valuations di⇥erentiate firms that will
have high profits from those that will not. Empirically, they define price informativeness in
a given year t as the predicted variation, at ⇥ ⌅t(log(M/A)), in the following cross-sectional
regression of future earnings on current market equity value and lagged earnings, normalized
4

by book asset value,
Ei,t+k
Ai,t= ct + at log(
Mi,t
Ai,t) + bt(
Ei,t
Ai,t) + ⇧i,t+k , (1)
with industry fixed e⇥ects to control for di⇥erences in discount rates. Their focus is on the
trend of stock price informativeness in the US, which they find has not increased since 1960.
We take this model to the data on earnings, equity market value, and asset book value from
the China Stock Market and Accounting Research (CSMAR) database from 1996 to 2012.
To filter out bad data, we eliminate observations with earnings greater than three times book
asset value.
Figure 2 plots the coe⇧cients at inside their 95% confidence bands, the predicted variation
at⇥⌅t(log(M/A)), and the marginal R2 of regression (1) for forecasting periods k = 1, 2, and
3, for each year t = 1996 to 2012� k.1 Marginal R2 is the change in the R2 of regression (1)
created by adding log(Mi,t
Ai,t) as a regressor. Judging from a comparison with Figure 2 of Bai,
Philippon, and Savov (2013), the average level of stock price informativeness in China over
the period is similar to that in the US. However, four distinct periods are apparent, which
we interpret in the context of the regulatory regimes that prevailed over the life of China’s
stock market in Figure 3.
As indicated in Figure 3, we identify four stages of the development of China’s stock
market. The first, a period of market opening and construction from 1991 to 1997, is charac-
terized by the establishment of the exchanges in Shanghai and Shenzhen and the transition
from a decentralized and disorganized stock market to a centralized modern market. During
the first five years, the number of stocks listed on the Shanghai and Shenzhen stock exchanges
grew from eight stocks to more than five hundred stocks. Many stocks moved from an OTC
platform to Shanghai and Shenzhen’s electronic trading platform. In 1992, a direct electronic
trading system was implemented, which increased liquidity in the equity market. In 1996,
the number of listed companies first exceeded 500 and the Dow Jones first published the
China, Shanghai 30, and Shenzhen indices, which attracted a significant following by equity
analysts. In addition, the Exchanges unified limit-order books and greatly reduced trading
commissions, which also increased liquidity. Chordia, Roll, and Subrahmanyam (2008) show
theoretically that increasing liquidity improves market e⇧ciency and informativeness, which
suggests that these developments likely contributed to the rise of informativeness in China’s
stock market over this period. Moreover, the adoption of a price move limit of 10% and a
one-day minimum holding period may have deterred stock price manipulation, as suggested
1The confidence bands use White heteroskedasticity-consistent standard errors. We also calculated stan-dard errors clustered by industry, with qualitatively similar results.
5

!"#$%&'()'*+,-.'/%"-&'"01,%2345&0&66'"0'78"039'!,%&-3640#'&3%0"0#6':"+8'&;$"+<'/%"-&6
!"#"$%
!&'!&(%
"#"$%
"#")%
"#"(%
"#"*%
"#&%
"#&$%
7,&=-"&0+'.>?'
"%
"#"$%
"#")%
"#"(%
"#"*%
"#&%
"#&$%
@3%#"03A'BC6;$3%&D'.>?'
"%
"#"&%
"#"$%
"#"+%
"#")%
"#",%
E%&D"-+&D'53%"34,0'.>?'
!"#"$%
!&'!&(%
"#"$%
"#")%
"#"(%
"#"*%
"#&%
"#&$%
7,&=-"&0+'.>F'
"%
"#"$%
"#")%
"#"(%
"#"*%
"#&%
"#&$%
@3%#"03A'BC6;$3%&D'.>F'
"%
"#"&%
"#"$%
"#"+%
"#")%
"#",%
E%&D"-+&D'53%"34,0'.>F'
!"#"$%
!&'!&(%
"#"$%
"#")%
"#"(%
"#"*%
"#&%
"#&$%
7,&=-"&0+'.>('
"%
"#"&%
"#"$%
"#"+%
"#")%
"#",%
E%&D"-+&D'53%"34,0'.>('
"%
"#"$%
"#")%
"#"(%
"#"*%
"#&%
"#&$%
@3%#"03A'BC6;$3%&D'.>('

!"#$%%$&$%%'#
()*+,-#
./,0102#3#
4506-*78950
!"#$"%$$&'
()*'+),-.'
/01,23'
402,50213'
2,6'
40-,70-,'
1,618-.'
9:;<1817-6
%#"%="%$$&'
(21<>'9?18-'
802,5-'<1@1A'
)B'%CD'.-A'
B)?'2<<'.A)8E.
!!"#$%%:&;<<$#
=/,87>)950#
3#
?88570902#
@*)7A
#"%!"#CCC'
F1?.A'.A)8E'
A?26-.'2;)G-'
%CC'H:2,3'
1,G-.I52I),'
J,6.'.-?1):.'
288):,I,5'
B?2:6
!!!"#;<<$&
;<<'#()*+,-#
B,C5*D
%#"C!"#CC%''
K-*'2,6'
.A?18A-?'
8)@92,>'
6-<1.I,5'
?-5:<2I),'
-,B)?8-6
%%"%L"#CC#'
M0-'/4N/'
?2IJ-.'OFPP'
9?)5?2@'B)?'
61?-8A'B)?-15,'
1,.AQ'RS.02?-'
)*,-?.019
C#"C#"#CCT''
K2I),2<',1,-'
?:<-.'
.A?-,5A0-,'
@1,)?1A>'
.02?-0)<6-?'
9?)A-8I),'2,6'
61G16-,6'9)<18>
!E"#;<<:&
;<$<#
@10)081)>#
4*1616
%$$&'
K:@;-?')B'
<1.A-6'
8)@92,1-.'
-U8--6.'!CC
$"#T"%$$&'
V1@1AS)?6-?'
;))E.'
:,1J-63'
A?261,5'B--.'
?-6:8-6'
L"%!"%$$W'
M0-'/4N/'
;-8)@-.'
?-5:<2A)?')B'
402,5021'
2,6'
40-,70-,'
-U802,5-.
%$$L'X?18-.'
)B'J?@.'1,'4M'
.E>?)8E-A3'
@2?E-A'
@2,19:<2I),'
?2@92,A
!"%!"#CC%'
Y8),)@1.A'
Z:'+1,5<12,'
9?)9).-.'
[/2.1,)['
A0-)?>')B'
/01,2\.'.A)8E'
@2?E-A
CL"#C"#CC%'
4-G-?2<'
@2])?'
288):,I,5'
.82,62<.'
?-G-2<-6
%%"%%"#CC%
/01,2'])1,.'
A0-'ZM^
%"#L"#CC#'
K),A?262;<-'
.02?-.'
5?26:2<<>'5)'
9:;<183'
A?262;<-'
.02?-0)<6-?.'
8)@9-,.2A-6
C%"CW"#CC='
M0-'/4N/'
I50A-,.'
?-9)?I,5'?:<-.'
A)'6-A-?'
288):,I,5'
B?2:6
C%"%="#CC&'
_2?51,'
A?261,5'2,6'
.0)?A'.-<<1,5'
91<)A'
9?)5?2@'
1,A?)6:8-6
CQCC'
CQC%'
CQC#'
CQC='
CQCT'
CQC!'
%$$&' %$$W' %$$L' %$$$' #CCC' #CC%' #CC#' #CC=' #CCT' #CC!' #CC&' #CCW' #CCL' #CC$' #C%C'
@127*,#F"#=-58+#G*18,#!0C5*D)9H,0,66#10#4I10)#!"#$%!"&'#
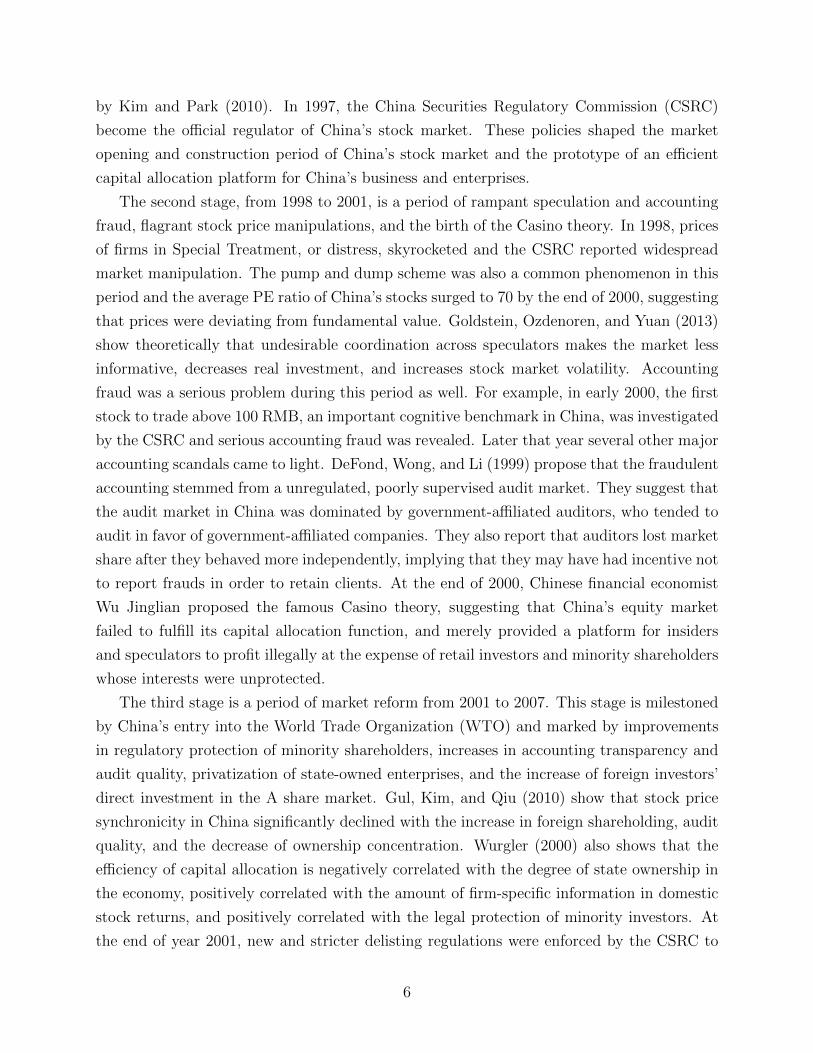
by Kim and Park (2010). In 1997, the China Securities Regulatory Commission (CSRC)
become the o⇧cial regulator of China’s stock market. These policies shaped the market
opening and construction period of China’s stock market and the prototype of an e⇧cient
capital allocation platform for China’s business and enterprises.
The second stage, from 1998 to 2001, is a period of rampant speculation and accounting
fraud, flagrant stock price manipulations, and the birth of the Casino theory. In 1998, prices
of firms in Special Treatment, or distress, skyrocketed and the CSRC reported widespread
market manipulation. The pump and dump scheme was also a common phenomenon in this
period and the average PE ratio of China’s stocks surged to 70 by the end of 2000, suggesting
that prices were deviating from fundamental value. Goldstein, Ozdenoren, and Yuan (2013)
show theoretically that undesirable coordination across speculators makes the market less
informative, decreases real investment, and increases stock market volatility. Accounting
fraud was a serious problem during this period as well. For example, in early 2000, the first
stock to trade above 100 RMB, an important cognitive benchmark in China, was investigated
by the CSRC and serious accounting fraud was revealed. Later that year several other major
accounting scandals came to light. DeFond, Wong, and Li (1999) propose that the fraudulent
accounting stemmed from a unregulated, poorly supervised audit market. They suggest that
the audit market in China was dominated by government-a⇧liated auditors, who tended to
audit in favor of government-a⇧liated companies. They also report that auditors lost market
share after they behaved more independently, implying that they may have had incentive not
to report frauds in order to retain clients. At the end of 2000, Chinese financial economist
Wu Jinglian proposed the famous Casino theory, suggesting that China’s equity market
failed to fulfill its capital allocation function, and merely provided a platform for insiders
and speculators to profit illegally at the expense of retail investors and minority shareholders
whose interests were unprotected.
The third stage is a period of market reform from 2001 to 2007. This stage is milestoned
by China’s entry into the World Trade Organization (WTO) and marked by improvements
in regulatory protection of minority shareholders, increases in accounting transparency and
audit quality, privatization of state-owned enterprises, and the increase of foreign investors’
direct investment in the A share market. Gul, Kim, and Qiu (2010) show that stock price
synchronicity in China significantly declined with the increase in foreign shareholding, audit
quality, and the decrease of ownership concentration. Wurgler (2000) also shows that the
e⇧ciency of capital allocation is negatively correlated with the degree of state ownership in
the economy, positively correlated with the amount of firm-specific information in domestic
stock returns, and positively correlated with the legal protection of minority investors. At
the end of year 2001, new and stricter delisting regulations were enforced by the CSRC to
6

protect retail investor interests. In 2002, the CSRC ratified the QFII program, signifying
that foreign institutional investors could invest in A shares directly. The first two foreign
institutional investors were the Nomura and UBS open-end mutual funds. In 2004, the
CSRC established the National Nine Rules to protect minority shareholder interests, deter
stock price manipulation, and deter accounting and audit fraud. In 2006, the Shanghai and
Shenzhen Stock Exchanges introduced margin trading and short selling pilot programs, which
expanded gradually in the subsequent years. In a study of 46 countries, Bris, Goetzmann,
and Zhu (2007) find evidence that allowing short sales permits prices to incorporate negative
information more quickly. More recently, Ljungqvist and Qian (2014) document a direct
mechanism through which short sales give arbitrageurs an incentive to incorporate negative
information into prices. The combination of regulatory policies, capital market development,
improving accounting and auditing quality, and foreign investors’ holding of A shares directly
may have helped boost informativeness in China’s stock market during this period. The
fourth and last stage, from 2008, is the financial crisis period. The crisis may have depressed
realized price informativeness for at least two reasons, one, because it precipitated extreme
realizations from the distribution of earnings, and two, because it lead to some dislocation
and mistrust of capital markets, which did in fact undermine the informativeness of prices.
2.2 Idiosyncratic firm risk
This section examines stock price informativeness in China measured by average idiosyn-
cratic firm risk and market model R2, as proposed by Morck, Yeung, and Yu (2000), Durnev,
Morck, Yeung, and Zarowin (2003), and Morck, Yeung, and Yu (2013). Li, Rajgopal, and
Venkatachalam (2013) catalog a large literature that links these measures to stock price in-
formativeness, investment e⇧ciency, disclosure and audit quality, and corporate governance.
For each stock i with a return time series of at least 36 months during the period 1995-2012,
we estimate the idiosyncratic variance ⌅2�i from the monthly market model regression
ri,t � rf,t = �i + ⇥i(rm,t � rf,t) + ⇧i,t , (2)
and then calculate the cross-sectional average idiosyncratic variance. Table 1 shows that the
square root of the average annualized idiosyncratic variance in China is 58%, compared with
27% in the US during the period 1962-1997, as estimated in Campbell, Lettau, Malkiel, and
Xu (2001). By this metric, the firm-specific information content of stocks in China is more
than double that in the US.
We also estimate the annualized volatility of the excess return on the market portfolios
in China and the US to be 32% and 16%, respectively, over the period 1995-2012. To
7

reconcile these results with the more commonly recognized US stock return volatility figure
and highlight China’s high return variance, note that representative firms with these variance
decompositions and market beta’s of one would have total return volatility of 66% and 31%
in China and the US, respectively.
The high market return variance in China drives up its synchronicity measure
R2i =
⌅2�m
⌅2�m + ⌅2
�i
. (3)
As Table 1 summarizes, Panel B of Figure 2 of Morck, Yeung, and Yu (2013) find average
R2s of 36% and 14% in China and the US, respectively, weighting by total firm variance. By
this measure, stock prices in the US appear to contain greater firm-specific information. This
highlights the di⇧culties of comparing R2s across countries with very di⇥erent market return
variances, as Morck, Yeung, and Yu (2013) point out. Li, Rajgopal, and Venkatachalam
(2013) and Hou, Lin, and Wei (2013) elaborate on additional limitations of the R2 measure.
Table 1: Average idiosyncratic firm risk and R2 in China and the US
Square root of cross-sectional average annualized idiosyncratic stock return variance, market returnvariance, total return variance for a representative firm, and average market model R2s from Morck,Yeung, and Yu (2013), in percent.
Idiosyncratic Market Total Average R2
volatility volatility volatility
China 57.81 32.31 66.23 36.00
US 26.57 16.14 31.09 14.00
3 E⇥ciency of corporate investment in China
Summarizing economic arguments that go back to Hayek (1945) and Fama (1970), Durnev,
Morck, and Yeung (2004) state that “corporate capital investment should be more e⇧cient
where stock prices are more informative.” They find a positive cross-sectional correlation
between their measure of corporate investment e⇧ciency and firm-specific variation in stock
returns in US firms. More broadly, in a study of 65 countries, Wurgler (2000) finds a
positive correlation between the e⇧ciency of capital allocation and the development of the
financial sector and a positive correlation between e⇧ciency and the amount of firm-specific
information in domestic stock returns. This section examines the link between stock price
8

informativeness and corporate investment e⇧ciency in China and finds a strong positive
correlation.
We define the e⇧ciency of corporate investment as the unexpected change in equity value
associated with a unit of unexpected investment, measured for each year t by the coe⇧cient
⇥t in the following version of the cross-sectional regression proposed by Durnev, Morck, and
Yeung (2004),�Vi,t
Ai,t�1= �t + ⇥t
�Ai,t
Ai,t�1+ ⇤t
�Vi,t�1
Ai,t�1+ ⇧i,t , (4)
where the second regressor above controls for the anticipated return on equity and in addition,
we include industry fixed e⇥ects to control for di⇥erences in expected growth and depreciation
rates of capital stock. Durnev, Morck, and Yeung (2004) use market asset value instead of
equity value, they interpret the coe⇧cient ⇥t as the marginal Tobin’s q, and they measure
e⇧ciency of investment as the di⇥erence between this coe⇧cient and one, based on the
argument that the marginal q of firms that are investing optimally should be one. By
contrast, we interpret the coe⇧cient ⇥ above as a direct measure of investment e⇧ciency for
several reasons. First, unexpected investment may be “good news” about the productivity
of both past and future investment, and may optimally translate to changes in value greater
than one for one. Second, as it measures the relationship between investment and changes
in value over a year, it is average rather than marginal q. Third, in a setting such as China,
where most firms face potentially severe capital constraints, it may be di⇧cult for firms to
reach the optimal investment level. Thus, we interpret a larger coe⇧cient in the cross-section
as reflecting greater e⇧ciency of investment.
Figure 4 plots the time series of investment e⇧ciency coe⇧cients inside their 95% confi-
dence bands over the period 1996-2012. Figure 5 plots this time series of investment e⇧ciency
coe⇧cients using the right-hand scale, in combination with the time series of Bai-Philippon-
Savov price informativeness measures we calculated in Section 2.1, using the left-hand scale,
for three di⇥erent earnings forecasting periods. The patterns of the two time series are strik-
ingly similar, and the correlation between them is high and statistically significant in the
cases of earnings forecasting periods of 2 and 3 years, despite the short sample period.
This result supports the idea that corporate investment is more e⇧cient when stock
prices are more informative. It may be that a listing on the stock exchange in salutory
information environments improves the e⇧ciency of corporate investment for other reasons
as well, for example, because disclosure and auditing standards in and of themselves lead to
better managerial decision-making. The result may flow from broader channels as well, for
example, that legal, regulatory, and accounting environments in which the stock market is
functioning well are also those in which managerial investment decisions are more informed
9

!"#$%&'()'*+,"&-,.'/0',/%1/%23&'"-4&536&-3'"-'78"-2'9::;<=>99
!"!#
!"$#
%"!#
%"$#
&"!#
&"$#
'"!#
'"$#
%(()# %((*# %((+# %(((# &!!!# &!!%# &!!&# &!!'# &!!,# &!!$# &!!)# &!!*# &!!+# &!!(# &!%!# &!%%#

!!!!"#$%&'!()!*+,-.!/&#-'!#01,&2345'0'66!307!#05'6+2'0+!'8-#'0-9!#0!:;#03!<==>?@A<@
!"!#
!"$#
%"!#
%"$#
&"!#
&"$#
'"!#
!#
!"!%#
!"!&#
!"!'#
!"!(#
!"!$#
%))*#%))+#%)),#%)))#&!!!#&!!%#&!!&#&!!'#&!!(#&!!$#&!!*#&!!+#&!!,#&!!)#&!%!#&!%%#
B01,&2345'0'66!
C&#-'!#01,&2345'0'66!D.E<F!307!#05'6+2'0+!'8-#'0-9!?!-,&&!GHIJ!+?6+3+!<)KL!
M8-#'0-9!
!"!#
!"$#
%"!#
%"$#
&"!#
&"$#
'"!#
!#
!"!%#
!"!&#
!"!'#
!"!(#
!"!$#
%))*# %))+# %)),# %)))# &!!!# &!!%# &!!&# &!!'# &!!(# &!!$# &!!*# &!!+# &!!,# &!!)# &!%!#
B01,&2345'0'66!
C&#-'!#01,&2345'0'66!D.E@F!307!#05'6+2'0+!'8-#'0-9!?!-,&&!(LIJ!+?6+3+!@)(>!
M8-#'0-9!
!"!#
!"$#
%"!#
%"$#
&"!#
&"$#
'"!#
!#
!"!%#
!"!&#
!"!'#
!"!(#
!"!$#
%))*# %))+# %)),# %)))# &!!!# &!!%# &!!&# &!!'# &!!(# &!!$# &!!*# &!!+# &!!,# &!!)#
B01,&2345'0'66!
C&#-'!#01,&2345'0'66!D.EGF!307!#05'6+2'0+!'8-#'0-9!?!-,&&!(AIJ!+!6+3+!@)AA!
M8-#'0-9!

and better aligned with equity value maximization. Finally, we note that the average level
of investment e⇧ciency over the sample period is 1.00, compared with an average coe⇧cent
of 0.91 in the US, reported by Durnev, Morck, and Yeung (2004).
4 Equity pricing and investment opportunities in China
While the last section examines the informativeness of stock prices about future profits and
its relation to corporate investment, this section studies the pricing of those profits and im-
plications for portfolio investors and corporate cost of capital. We analyze the cross-sectional
structure of returns and equity premia paid to Chinese investors, the performance of China’s
stock market and correlation with stock markets in other countries, and investment opportu-
nities for foreign investors. We find that despite the market’s segmentation from other major
markets and its early reputation as a casino, the cross-sectional pattern of returns is quite
similar to that in the US. This is especially surprising given the low correlation between re-
turns in China and those in other large economies. Moreover, China o⇥ers attractive returns
and opportunities for diversification to international equity investors who can access them.
However, this suggests that capital controls are raising the cost of equity capital for China’s
firms and that China has much to gain from opening its market to foreign investors.
4.1 The cross-section of expected returns
This section presents new evidence on the cross-section of expected returns. Chen, Kim, Yao,
and Yu (2010) examine cross-sectional stock return predictability in China over the period
July 1995 to June 2007 using data on A shares from the PACAP-CCER China database.
They consider 18 firm-specific variables found to have predict returns in the US and find all
18 have signs consistent with US evidence, and five are significant in their sample, compared
with eight variables that are significant in the US data over the same period. Cakici, Chan,
and Topyan (2011) analyze stock return predictability in China from January 1994 to March
2011 using data on A shares traded on the Shanghai and Shenzhen Stock Exchanges from
Datastream and find strong predictive power of size, book-to-market, cash-flow-to-price, and
earnings-to-price, but not momentum. We update and extend this evidence using data from
July 1995 to December 2012 on A shares of firms traded on the Shanghai and Shenzhen
Exchanges from the CSMAR database.
10

4.1.1 Firm-level cross-sectional regressions
We begin with Fama and MacBeth (1973) firm-level cross-sectional regressions of returns on
eight predictor variables: BETA, SIZE, BM, MOM, ILLIQ, MAX, REV, and SOE. Following
Scholes andWilliams (1977) and Dimson (1979) to account for nonsychronous trading, BETA
is obtained from regressing daily firm return on daily current, lead, and lagged market returns
over the previous month and summing the three coe⇧cients. Following a long literature going
back to Banz (1981), SIZE is the natural logarithm of the market value of firm equity at
the end of the previous month. Following Fama and French (1992), BM is the ratio of
book value of equity to market value of equity at the end of the previous calendar year.
Following Jegadeesh and Titman (1993), momentum, MOM, is defined as the cumulative
stock return over the previous eleven-month period, lagged one month. Following Amihud
(2002), illiquidity, ILLIQ, is measured as the average over the previous month of the daily
ratio of the absolute value of the stock return to the total value of shares traded. Following
Bali, Cakici, and Whitelaw (2011), MAX is the maximum daily stock return over the previous
month. Following Jegadeesh (1990) and Lehmann (1990), short-term reversal, REV, is the
return on the stock over the previous month. Given the importance of the level of state
ownership in China in distinguishing firms’ political risk, governance structure, objectives,
opportunity set, and access to capital, we also introduce the variable SOE, which is the
percentage of the firm’s shares held by the central or local government in the previous
month.
Table 2 presents the results of univariate regressions for each predictor, multiple regres-
sions with BETA, SIZE, BM, and MOM, and multiple regressions with the additional pre-
dictor variables as well. Overall, the results are surprisingly similar to those for US stocks
reported in Bali, Cakici, and Whitelaw (2011). The coe⇧cient on BETA is significantly
positive in the multiple regressions, but not by itself, with comparable magnitudes. The
coe⇧cient on SIZE is generally strongly significantly negative, though it loses magnitude
and significance in the presence of ILLIQ. The coe⇧cient on BM is consistently significantly
positive, though smaller in magnitude than in the US data. The coe⇧cient on MOM by
itself is insignificant, in contrast to the US results, but it regains significance in the mul-
tiple regressions. Whether or not the premiums attributable to size, book-to-market, and
momentum should be interpreted as evidence of market ine⇧ciency, the predictive power of
these variables for stock returns in China is in line with the cross-sectional return patterns
documented for developed economies, such as in Fama and French (1998) and Fama and
French (2012).
The coe⇧cient on ILLIQ is consistently significantly positive. As in the US, Chinese
investors charge a premium for bearing illiquidity, whether to compensate for direct trading
11

costs or the probability of trading against more informed market participants. Information
asymmetry between corporate insiders and outsiders, government insiders and outsiders, and
domestic and foreign investors is regarded as a major concern in China. These results suggest
that legal, accounting, and market reforms that increase transparency and level the playing
field could not only attract more market participants, but also lower firms’ cost of capital.
The coe⇧cient on MAX is strikingly significantly negative, as in the US data. The evi-
dence suggests that, like US investors, Chinese investors also pay up for lottery-like payo⇥s.
This similarity in investor preferences is especially noteworthy considering potentially strong
cultural di⇥erences between the two groups, and it raises the possibility that many of the be-
havioral biases documented for US investors may also hold more universally. The coe⇧cient
on REV is also significantly negative, as in the US.
Finally, the coe⇧cient on SOE, the percentage of government-owned shares, is signif-
icantly positive in the multiple regression. This suggests that Chinese investors discount
state-controlled firms, perhaps for the political risk that government subsidies may be re-
moved in the future, or more general uncertainties about state-owned firms’ future objectives,
governance structure, access to capital, and investment opportunity sets.
4.1.2 Portfolio-level analysis
This section provides further evidence on the pricing of size, book-to-market, momentum,
illiquidity, and asymmetric returns through analysis of return di⇥erences across portfolios
sorted by the predictor variables. Following Fama and French (1993), Carhart (1997), and
the Ken French Data Library, we begin by forming the six 2⇥3 value-weighted SIZE-BM
portfolios and the six 2⇥3 value-weighted SIZE-MOM portfolios that go into the construction
of the size, book-to-market, and momentum zero-cost factor portfolios SMB, HML, and
WML, for China. Throughout our analysis, we use tradeable rather than total market
value in the weighting. Table 3 presents the returns and alphas for the twelve double-
sorted portfolios as well as for the factor portfolios. The CAPM alphas are from time-series
regressions of portfolio excess returns on the excess return of the market, RMRF.
Table 3 shows that small stocks consistently outperform large stocks and value stocks
consistently outperform growth stocks in China, in terms of both excess return and CAPM
alpha. Moreover, the SMB and HML factors returns are significantly positive. On the
other hand, consistent with Cakici, Chan, and Topyan (2011), the WML factor returns are
insignificant. Xu and Zhang (2013) provide a comprehensive analysis of the Fama-French
factor portfolios and their ability to explain size and book-to-market e⇥ects in stock returns
in China. We use the factor portfolios to check the robustness of our previous results and
then examine correlations and investment opportunities across countries in the next section.
12
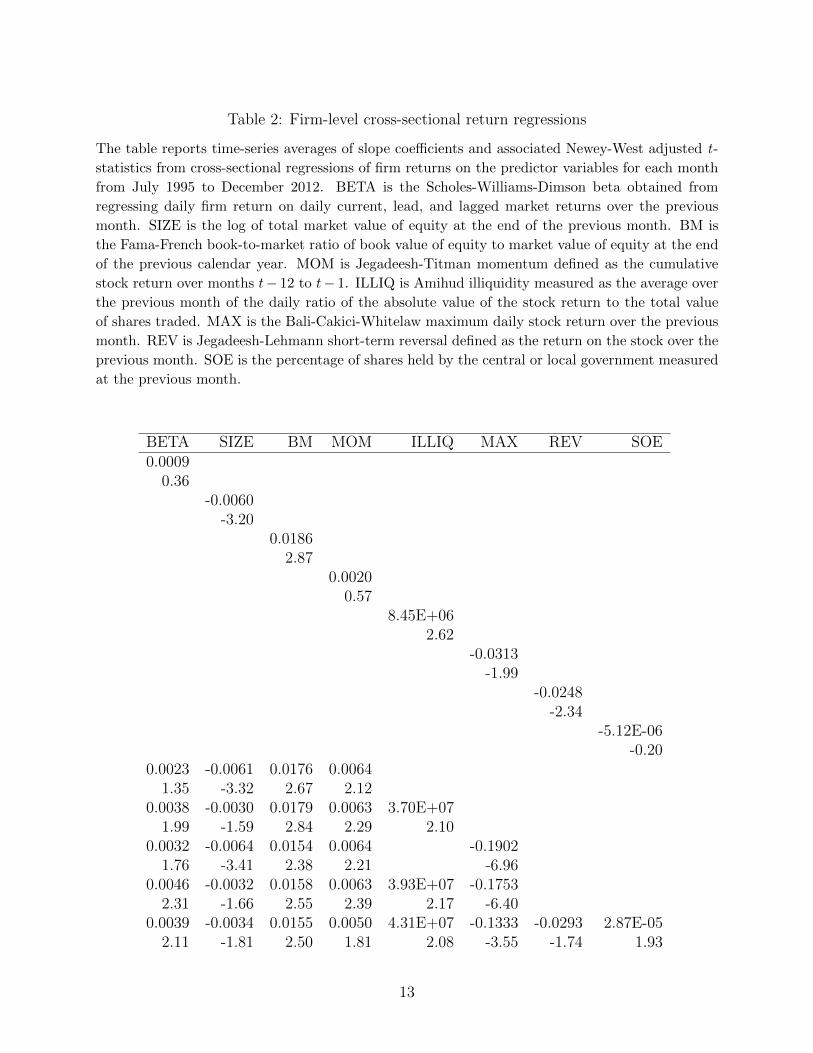
Table 2: Firm-level cross-sectional return regressions
The table reports time-series averages of slope coe⇤cients and associated Newey-West adjusted t-statistics from cross-sectional regressions of firm returns on the predictor variables for each monthfrom July 1995 to December 2012. BETA is the Scholes-Williams-Dimson beta obtained fromregressing daily firm return on daily current, lead, and lagged market returns over the previousmonth. SIZE is the log of total market value of equity at the end of the previous month. BM isthe Fama-French book-to-market ratio of book value of equity to market value of equity at the endof the previous calendar year. MOM is Jegadeesh-Titman momentum defined as the cumulativestock return over months t� 12 to t� 1. ILLIQ is Amihud illiquidity measured as the average overthe previous month of the daily ratio of the absolute value of the stock return to the total valueof shares traded. MAX is the Bali-Cakici-Whitelaw maximum daily stock return over the previousmonth. REV is Jegadeesh-Lehmann short-term reversal defined as the return on the stock over theprevious month. SOE is the percentage of shares held by the central or local government measuredat the previous month.
BETA SIZE BM MOM ILLIQ MAX REV SOE
0.0009
0.36
-0.0060
-3.20
0.0186
2.87
0.0020
0.57
8.45E+06
2.62
-0.0313
-1.99
-0.0248
-2.34
-5.12E-06
-0.20
0.0023 -0.0061 0.0176 0.0064
1.35 -3.32 2.67 2.12
0.0038 -0.0030 0.0179 0.0063 3.70E+07
1.99 -1.59 2.84 2.29 2.10
0.0032 -0.0064 0.0154 0.0064 -0.1902
1.76 -3.41 2.38 2.21 -6.96
0.0046 -0.0032 0.0158 0.0063 3.93E+07 -0.1753
2.31 -1.66 2.55 2.39 2.17 -6.40
0.0039 -0.0034 0.0155 0.0050 4.31E+07 -0.1333 -0.0293 2.87E-05
2.11 -1.81 2.50 1.81 2.08 -3.55 -1.74 1.93
13

We form value-weighted portfolios of stocks sorted into quintiles by Amihud illiquidity
and by Bali-Cakici-Whitelaw maximum return. Table 4 shows the returns, CAPM alphas,
and four-factor alphas for the quintile portfolios and the di⇥erence in these quantities between
quintiles one and five. The four-factor alphas are from time-series regressions of the portfolio
excess returns on RMRF, SMB, HML, and WML. Panel A shows an almost monotonic
illiquidity e⇥ect across the quintiles, and the di⇥erences between top and bottom quintiles are
significant for all performance measures. Panel B shows performance across MAX quintiles.
Similar to the findings of Bali, Cakici, and Whitelaw (2011) for US stocks, the pattern is
slightly hump-shaped, rather than strictly monotonic, but the di⇥erence in alphas between
low and high max quintiles is significant. The magnitudes of the di⇥erences are also similar
to those for US stocks.
Table 3: Returns on portfolios sorted by size, book-to-market, and momentum
Average returns and alphas on the six 2⇥3 value-weighted size/book-to-market portfolios andthe six 2⇥3 value-weighted size/momentum portfolios that go into the construction of the Fama-French-Carhart factor portfolios, SMB, HML, and WML, for China over the period March 1995to December 2012, and Newey-West adjusted t-statistics for di�erences. CAPM alphas are fromtime-series regressions of portfolio excess returns on the excess return of the market, RMRF.
Returns CAPM alphas
Panel A. Size-book-to-market portfolios
S B S B
H 2.64 1.68 1.10 0.26
M 2.03 1.32 0.56 -0.17
L 1.22 1.14 -0.18 -0.23
Panel B. Size-momentum portfolios
S B S B
H 1.64 1.39 0.16 -0.01
M 2.28 1.43 0.77 -0.02
L 2.06 1.10 0.60 -0.34
Panel C. Di⇥erences and t-statisticsSMB 0.59 1.82 0.54 1.67
HML 0.98 3.03 0.88 3.17
WML -0.06 -0.24 -0.05 -0.19
4.2 Market integration and investment opportunities
This section provides preliminary evidence on China’s stock market integration with other
markets and opportunities available to international investors. Section 4.2.1 examines the
14

Table 4: Returns on portfolios sorted by illiquidity and maximum return
Average returns and alphas on value-weighted quintile portfolios over the period March 1995 toDecember 2012, and Newey-West adjusted t-statistics for di�erences. The CAPM alphas are fromtime-series regressions of portfolio excess returns on the excess return of the China market portfolio,RMRF. The four-factor alphas are from time-series regressions of the portfolio excess returns onthe Fama-French-Carhart factor portfolios RMRF, SMB, HML, and WML, constructed from stocksin China. In panel A, stocks are sorted into portfolios based on Amihud illiquidity, measured asthe average over the previous month of the daily ratio of the absolute value of the stock return tothe total value of shares traded. In panel B, stocks are sorted into portfolios based on Bali-Cakici-Whitelaw maximum daily stock return over the previous month.
Quintile Returns CAPM alphas Four-factor alphas
Panel A. Portfolios sorted by illiquidity
Illiquid 2.37 0.98 0.64
2 2.12 0.68 0.32
3 1.75 0.32 0.02
4 1.54 0.09 -0.13
Liquid 1.30 -0.12 0.07
Di⇥erence 1.07 1.10 0.58
t-stat 2.10 2.26 2.62
Panel B. Portfolios sorted by maximum return
Low MAX 1.50 0.20 0.05
2 1.67 0.24 0.20
3 1.75 0.28 0.25
4 1.30 -0.14 -0.08
High MAX 1.12 -0.39 -0.48
Di⇥erence 0.38 0.59 0.52
t-stat 1.42 2.36 1.85
15

correlations of Fama-French-Carhart factors across four major markets, China, the US, Eu-
rope, and Japan. Section 4.2.2 examines the performance of the di⇥erent markets and
discusses implications for investment opportunities. We find that in contrast to the high
correlations in returns across developed markets, returns in China’s stock market have low
correlations with those in other large economies. China has begun to open its doors to foreign
investors through its QFII prgram, but it is still a segmented market and may have much
to gain from liberalizing its capital account. At the same time, our evidence suggests that
despite a reputation for poor performance, China’s stock market o⇥ers attractive returns
and opportunities for diversification to international investors.
4.2.1 Stock market correlations across large economies
This section gives preliminary evidence on the degree of integration between China’s stock
market and those of other large economies and discusses the implications and related litera-
ture. Table 5 presents correlations across monthly returns from China, the US, Europe, and
Japan for each of the four Fama-French-Carhart factors, RMRF, SMB, HML, and WML,
from 1995 to 2012. Table 5 shows a high degree of correlation across the developed markets
for RMRF, HML, and WML, ranging form 0.38 to 0.83. This is consistent with Asness,
Moskowitz, and Pedersen (2013) for who find average correlations of 0.68 and 0.65 for value
and momentum strategies, respectively, across the US, the UK, Europe, and Japan.
However, in contrast to the developed markets, returns in China have low correlations
with returns elsewhere, ranging from 0.07 to 0.21, for the market, value, and momentum
factors, and correlations are even negative for the size factor. China looks like a segmented
market, which is consistent with the lack of overlap in investors between the China and
other markets. However, one might expect there to be a common global cash flow factor in
all markets. As exporters, Chinese firms should be exposed to this factor. In other words,
capital markets are segregated, but the economy is not. That would explain the small but
generally positive correlations.
This evidence of market segmentation has a number of implications. A long literature
provides both theory and evidence on the positive e⇥ects of liberalization and integration
on emerging markets’ the cost of capital, investment, growth, and investment opportunities
for foreign investors through improvements in risk sharing across countries. For example,
in samples of up to 16 emerging markets, Stulz (1999) and Bekaert and Harvey (2000) and
Bekaert, Harvey, and Lundblad (2003) find that opening a country to portfolio flows decreases
its cost of capital without increasing its volatility or creating excessive contagion e⇥ects,
although liberalizations do not generally lead to full market integration. In samples of up
to 25 countries, Henry (2000a), Henry (2000b), Henry (2003), and Chari, Henry, and Sasson
16

(2012) find that stock market liberalizations reduce cost of capital and boost investment,
growth, and wages. Chari and Henry (2004) and Chari and Henry (2008) study the e⇥ect of
market liberalization at the firm level and show how stock prices and corporate investment
respond to reductions in cost of capital that occur after liberalization. China’s Qualified
Foreign Institutional Investor program awarded $42 billion of investment quotas to almost
200 foreign investors by March 2013, but this is only a beginning. The evidence suggests
that China still has much to gain from opening its stock market up to the international
investment community.
Table 5: Correlations of FFC factors across large economies 1995-2012
Correlations of monthly USD returns on FFC factors across large economies over the period January1995 to December 2012.
US Europe Japan US Europe Japan
RMRF SMB
China 0.16 0.21 0.10 -0.15 -0.05 -0.13
US 0.83 0.49 0.27 0.00
Europe 0.51 0.35
HML WML
China 0.07 0.12 0.13 0.10 0.10 0.09
US 0.77 0.46 0.51 0.38
Europe 0.42 0.45
4.2.2 Investment performance and opportunities
This section examines the stock market performance in China, the US, Europe, and Japan
over from 1995 to 2012 and explores investment opportunities for international investors.
Table 6 presents mean returns, volatilities, and cross-factor correlations for the market,
size, value, and momentum factors in the four di⇥erent markets. Consistent with Fama
and French (2012), we find a significant value premium in all four markets, and there is a
significant momentum premium in the western markets, but it is much smaller in Japan,
and insignificant in China. On the other hand the size premium is only apparent in China
over this period.
In terms of overall market performance, China is striking for both its high mean and high
volatility, both double those in the US over the same period, and thus delivering the same
Sharpe ratio. The mean annualized return of 15.01% runs counter to the perception that
China’s stock market has performed poorly over its history. To explain the components of
China’s market return, Figure 6 shows the cumulative and average returns of the publicized
17

!"#$%&'()'*$+$,-./&'-01'2/&%-#&'3&4$%05'67789:;6:
!"
#!!"
$!!"
%!!"
&!!"
'!!!"
'#!!"
'$!!"
'%!!"
'&!!"
()*+,"'%-./0"
)1234123"'%-.%0"
)1536157"'#-$$0"
8)".-$!0"
9:53"'-/;0"

price indices, in Yuan, the return on the Yuan, and the average USD return on the CSMAR
market portfolio, which is weighted by traded market value and includes dividends. The
much publicized Shanghai Stock Exchange index has only averaged an annual appreciation
of 12.44% over the period. The Shenzhen price index, which includes the smaller stocks on
the Shenzhen, SME, and ChiNext Boards have done better, averaging 16.96%. The smaller
enterprises, outside the state-controlled sector have the been the growth drivers in China’s
corporate sector. China’s USD return is further augmented by an annualized average USD
return in the Chinese Yuan of 1.73% over the period. Altogether, the average raw USD
return on China’s stock market is 16.97% over the period.
Table 6: Returns and factor structures in large economies 1995-2012
Annualized means and volatilities (in %) of monthly USD returns on the Fama-French-Carhartfactors and cross-factor correlations (in decimal) over the period January 1995 to December 2012in China, the US, Europe and Japan.
RMRF SMB HML WML RMRF SMB HML WML
China US
Mean (in %) 15.01 8.77 13.44 0.96 6.74 -1.36 5.65 5.64
Volatility (in %) 32.31 16.03 15.63 14.59 16.14 12.47 11.73 19.25
RMRF 0.09 0.18 -0.03 0.20 -0.21 -0.29
SMB 0.16 -0.33 -0.35 -0.21
HML -0.38 0.04
Europe Japan
Mean (in %) 6.69 -0.33 5.29 11.78 -1.91 -0.24 5.43 2.35
Volatility (in %) 18.34 8.19 8.97 15.84 18.82 11.13 10.55 16.78
RMRF -0.16 0.16 -0.35 0.06 -0.20 -0.15
SMB -0.12 0.11 0.06 -0.16
HML -0.28 -0.27
The evidence of high mean portfolio returns in China and low correlations with developed
markets suggests that China o⇥ers attractive investment opportunities for international in-
vestors. Following Fama and French (2012), Table 7 provides evidence on this question by
examining alphas of the China portfolios with respect to the US and Global factors. As the
table shows, China’s market portfolio earned an economically significant alpha with respect
to the US and Global four factors of over 1% per month. Its size and book-to-market factor
portfolios also earn large alphas, which are highly statistically significant.
We rule out the possibility that these results are driven by a missing China factor in
US returns by examining the e⇥ect of adding the China market portfolio as a fifth factor,
along with the US RMRF, SMB, HML, and WML factors, in time series regressions of test
18

portfolio returns on these factors. We use as test portfolios the 25 Fama-French size/book-
to-market portfolios and the 30 Fama-French industry portfolios from the Ken French Data
Library. We find that their alphas, factor loadings, and R2s scarcely change and they do
not load significantly on the China factor, consistent with our earlier results on the low
correlation between US and China factors. This robustness check reconfirms our evidence of
the availability of high alphas in China for international investors who can access them.
Table 7: Alphas of China portfolios with respect to US and global factors
Monthly alphas (in %) of USD returns on the four Fama-French-Carhart China portfolios withrespect to the US and global Fama-French-Carhart factors, and their Newey-West adjusted t-statistics, over the period January 1995 to December 2012.
China portfolio US factors Global factors
1-factor 4-factor 1-factor 4-factor
RMRF Alpha 1.08 1.00 1.07 0.97
t-stat 1.33 1.20 1.36 1.17
SMB Alpha 0.75 0.77 0.74 0.81
t-stat 2.32 2.36 2.28 2.38
HML Alpha 1.14 1.12 1.14 1.16
t-stat 3.36 2.36 2.28 2.38
WML Alpha 0.09 0.05 0.08 -0.01
t-stat 0.31 0.19 0.30 -0.04
5 Conclusions
China is the world’s largest investor and greatest contributor to global growth by wide
margins. The success of China’s stock market in attracting domestic and international
capital and allocating it e⇧ciently to corporate investment will be an important determinant
of global growth in the coming decades. China’s stock market is young but, despite its early
reputation as a casino, has functioned well since the reforms of the last decade. Stock price
informativeness has increased and compares favorably with that in the US. The e⇧ciency of
corporate investment is highly correlated with stock price informativeness and has followed
a strikingly similar trend. Despite its segmented nature, China’s equity market delivers a
cross-sectional pattern of returns that is surprisingly similar to that found in other countries,
with high premia for size, value, illiquidity, and right-skewed payo⇥s. Moreover, counter to
perception, China’s stock market has performed very well, especially its small and medium
enterprises. Furthermore, the market exhibits low correlation with other equity markets,
19

reflecting its restrictions on international capital flows. As a result, China’s factor portfolios
o⇥er high alphas for US and global investors who can navigate capital controls through
programs such as QFII. At the same time, this suggests further capital market liberalization
would reduce the cost of capital. Taken together, our results suggest that while China’s stock
market is already playing a vital role in supporting economic growth, especially through its
small and medium enterprises, additional regulatory reforms to improve the information
environment and liberalize the flow of capital would further empower the market to attract
capital, allocate it e⇧ciently, and support economic growth worldwide.
References
Allen, Franklin, Jun Qian, and Meijun Qian, 2005, Law, finance, and economic growth in
China, Journal of Financial Economics 77, 57–116.
Amihud, Yakov, 2002, Illiquidity and stock returns: cross-section and time-series e⇥ects,
Journal of Financial Markets 5, 31–56.
Amihud, Yakov, and Haim Mendelson, 1988, Liquidity and asset prices: Financial manage-
ment implications, Financial Management 5–15.
Asness, Cli⇥ord S, Tobias J Moskowitz, and Lasse Heje Pedersen, 2013, Value and momentum
everywhere, The Journal of Finance 68, 929–985.
Bai, Jennie, Thomas Philippon, and Alexi Savov, 2013, Have financial markets become more
informative?, New York University Working paper .
Baker, Malcolm, Jeremy C Stein, and Je⇥rey Wurgler, 2003, When does the market matter?
Stock prices and the investment of equity-dependent firms, The Quarterly Journal of
Economics 118, 969–1005.
Bali, Turan G, Nusret Cakici, and Robert F Whitelaw, 2011, Maxing out: Stocks as lotteries
and the cross-section of expected returns, Journal of Financial Economics 99, 427–446.
Banz, Rolf W, 1981, The relationship between return and market value of common stocks,
Journal of Financial Economics 9, 3–18.
Bekaert, Geert, and Campbell R Harvey, 2000, Foreign speculators and emerging equity
markets, The Journal of Finance 55, 565–613.
Bekaert, Geert, Campbell R Harvey, and Christian T Lundblad, 2003, Equity market liber-
alization in emerging markets, Journal of Financial Research 26, 275–299.
20

Bris, Arturo, William N Goetzmann, and Ning Zhu, 2007, E⇧ciency and the bear: Short
sales and markets around the world, The Journal of Finance 62, 1029–1079.
Cakici, Nusret, Kalok Chan, and Kudret Topyan, 2011, Cross-sectional stock return pre-
dictability in China, Available at SSRN 2038497 .
Campbell, John Y, Martin Lettau, Burton G Malkiel, and Yexiao Xu, 2001, Have individual
stocks become more volatile? An empirical exploration of idiosyncratic risk, The Journal
of Finance 56, 1–43.
Carhart, Mark M, 1997, On persistence in mutual fund performance, The Journal of Finance
52, 57–82.
Chan, Kalok, Albert J Menkveld, and Zhishu Yang, 2008, Information asymmetry and asset
prices: Evidence from the China foreign share discount, The Journal of Finance 63, 159–
196.
Chari, Anusha, Peter Henry, and Diego Sasson, 2012, Capital market integration and wages,
American Economic Journal: Macroeconomics 4, 102–132.
Chari, Anusha, and Peter Blair Henry, 2004, Risk-sharing and asset prices: Evidence from
a natural experiment, The Journal of Finance 59, 1295–1324.
Chari, Anusha, and Peter Blair Henry, 2008, Firm-specific information and the e⇧ciency of
investment, Journal of Financial Economics 87, 636–655.
Chen, Qi, Itay Goldstein, and Wei Jiang, 2007, Price informativeness and investment sensi-
tivity to stock price, Review of Financial Studies 20, 619–650.
Chen, Xuanjuan, Kenneth A Kim, Tong Yao, and Tong Yu, 2010, On the predictability of
Chinese stock returns, Pacific-Basin Finance Journal 18, 403–425.
Chordia, Tarun, Richard Roll, and Avanidhar Subrahmanyam, 2008, Liquidity and market
e⇧ciency, Journal of Financial Economics 87, 249–268.
DeFond, Mark L, Tak Jun Wong, and Shuhua Li, 1999, The impact of improved auditor inde-
pendence on audit market concentration in China, Journal of Accounting and Economics
28, 269–305.
Diamond, Douglas W, and Robert E Verrecchia, 1991, Disclosure, liquidity, and the cost of
capital, The Journal of Finance 46, 1325–1359.
21

Dimson, Elroy, 1979, Risk measurement when shares are subject to infrequent trading, Jour-
nal of Financial Economics 7, 197–226.
Durnev, Art, Randall Morck, and Bernard Yeung, 2004, Value-enhancing capital budgeting
and firm-specific stock return variation, The Journal of Finance 59, 65–105.
Durnev, Artyom, Randall Morck, Bernard Yeung, and Paul Zarowin, 2003, Does greater firm-
specific return variation mean more or less informed stock pricing?, Journal of Accounting
Research 41, 797–836.
Elliott, Douglas, and Kai Yan, 2013, The Chinese financial system: An introduction and
overview, John L. Thornton China Center Monograph Series .
Fama, Eugene F, 1970, E⇧cient capital markets: A review of theory and empirical work,
The Journal of Finance 25, 383–417.
Fama, Eugene F, and Kenneth R French, 1992, The cross-section of expected stock returns,
The Journal of Finance 47, 427–465.
Fama, Eugene F, and Kenneth R French, 1993, Common risk factors in the returns on stocks
and bonds, Journal of Financial Economics 33, 3–56.
Fama, Eugene F, and Kenneth R French, 1998, Value versus growth: The international
evidence, The Journal of Finance 53, 1975–1999.
Fama, Eugene F, and Kenneth R French, 2012, Size, value, and momentum in international
stock returns, Journal of Financial Economics 105, 457–472.
Fama, Eugene F, and James D MacBeth, 1973, Risk, return, and equilibrium: Empirical
tests, The Journal of Political Economy 607–636.
Glosten, Lawrence R, and Paul R Milgrom, 1985, Bid, ask and transaction prices in a
specialist market with heterogeneously informed traders, Journal of Financial Economics
14, 71–100.
Goldstein, Itay, Emre Ozdenoren, and Kathy Yuan, 2013, Trading frenzies and their impact
on real investment, Journal of Financial Economics 109, 566–582.
Grossman, Sanford J, and Joseph E Stiglitz, 1980, On the impossibility of informationally
e⇧cient markets, The American Economic Review 70, 393–408.
22
Gul, Ferdinand A, Jeong-Bon Kim, and Annie A Qiu, 2010, Ownership concentration, foreign
shareholding, audit quality, and stock price synchronicity: Evidence from China, Journal
of Financial Economics 95, 425–442.
Hail, Luzi, and Christian Leuz, 2009, Cost of capital e⇥ects and changes in growth expecta-
tions around us cross-listings, Journal of financial economics 93, 428–454.
Hayek, Friedrich August, 1945, The use of knowledge in society, American Economic Review
35, 519–530.
Healy, Paul M, and Krishna G Palepu, 2001, Information asymmetry, corporate disclosure,
and the capital markets: A review of the empirical disclosure literature, Journal of Ac-
counting and Economics 31, 405–440.
Henry, Peter Blair, 2000a, Do stock market liberalizations cause investment booms?, Journal
of Financial Economics 58, 301–334.
Henry, Peter Blair, 2000b, Stock market liberalization, economic reform, and emerging mar-
ket equity prices, The Journal of Finance 55, 529–564.
Henry, Peter Blair, 2003, Capital account liberalization, the cost of capital, and economic
growth, American Economic Review 93, 91–96.
Hou, Kewei, Peng Lin, and Xiong Wei, 2013, Is R-squared a measure of market ine⇧ciency?,
Princeton University Working Paper .
Jegadeesh, Narasimhan, 1990, Evidence of predictable behavior of security returns, The
Journal of Finance 45, 881–898.
Jegadeesh, Narasimhan, and Sheridan Titman, 1993, Returns to buying winners and selling
losers: Implications for stock market e⇧ciency, The Journal of Finance 48, 65–91.
Kim, Kenneth A, and Jungsoo Park, 2010, Why do price limits exist in stock markets? A
manipulation-based explanation, European Financial Management 16, 296–318.
Kyle, Albert S, 1985, Continuous auctions and insider trading, Econometrica: Journal of
the Econometric Society 1315–1335.
La Porta, Rafael, Florencio Lopez-de Silanes, Andrei Shleifer, and Robert W Vishny, 1997,
Legal determinants of external finance, The Journal of Finance 52, 1131–1150.
La Porta, Rafael, Florencio Lopez-de Silanes, Andrei Shleifer, and Robert W Vishny, 1998,
Law and finance, Journal of Political Economy 106, 1113–1155.
23

La Porta, Rafael, Florencio Lopez-de Silanes, Andrei Shleifer, and Robert W Vishny, 2000,
Investor protection and corporate governance, Journal of Financial Economics 58, 3–27.
Lehmann, Bruce N, 1990, Fads, martingales, and market e⇧ciency, The Quarterly Journal
of Economics 105, 1–28.
Li, Bin, Shivaram Rajgopal, and Mohan Venkatachalam, 2013, R-squared and idiosyncratic
risk are not interchangeable, Duke University Working paper .
Ljungqvist, Alexander, and Wenlan Qian, 2014, How constraining are limits to arbitrage?
evidence from a recent financial innovation, National Bureau of Economic Research .
Mei, Jianping, Jose A Scheinkman, and Wei Xiong, 2009, Speculative trading and stock
prices: Evidence from Chinese AB share premia, Annals of Economics and Finance 10,
225–255.
Morck, Randall, Bernard Yeung, and Wayne Yu, 2000, The information content of stock
markets: Why do emerging markets have synchronous stock price movements?, Journal
of Financial Economics 58, 215–260.
Morck, Randall, Bernard Yeung, and Wayne Yu, 2013, R-squared and the economy, Working
Paper .
Scholes, Myron, and Joseph Williams, 1977, Estimating betas from nonsynchronous data,
Journal of Financial Economics 5, 309–327.
Stulz, Rene M, 1999, Globalization, corporate finance, and the cost of capital, Journal of
Applied Corporate Finance 12, 8–25.
Wurgler, Je⇥rey, 2000, Financial markets and the allocation of capital, Journal of Financial
Economics 58, 187–214.
Xu, Jin, and Shaojun Zhang, 2013, The Fama-French three factors in the Chinese stock
market, Hong Kong Polytechnic University Working paper .
24