Embed Size (px)
Citation preview

Thermal Analysis of the Vulnerability of the S S C CSpacesuit Battery Design to Short-Circuit Conditions
2010 Space Power Workshop2010 Space Power WorkshopManhattan Beach, CAApril 22, 2010
Gi-Heon KimLarry ChaneyKandler Smith*
Ahmad PesaranAhmad PesaranEric Darcy
NREL/PR-540-47948
NREL is a national laboratory of the U.S. Department of Energy, Office of Energy Efficiency and Renewable Energy, operated by the Alliance for Sustainable Energy, LLC.

National Renewable Energy Laboratory Innovation for Our Energy Future2
Gasket SealPTC Ring
+ Top Cover
CID Button
CID RingPolymer+Tag Mounting
Disk
Scored Disk Vent
Background and Motivation for Present Work
• Background– Cell PTC device proven
effective control for overcurrent hazards at Li-ion cell and small battery level
– Proven ineffective in high-voltage battery designs
– Fire in 2004 Memphis FedEx facility possibly caused by PTC device failures in large-capacity (66p-2s) battery, which shorted while at 50% SOC
• Motivation– Can NASA’s spacesuit
battery design (16p-5s) array depend on cell PTC devices to tolerate an external 16p short?
– What are conditions for safe storage and operation?

National Renewable Energy Laboratory Innovation for Our Energy Future3
Objectives
• Create mathematical model of full 16p-5s spacesuit battery that captures electrical/thermal behavior during electrical shorts
• Extend PTC, cell, and module models from previous work1,2,3
• Assess vulnerability of 16p-5s spacesuit battery to pack-internal (cell-external) shorts between module banks
1. “Cell PTC Device Characterization,” E. Darcy et.al, 2008 NASA Aerospace Battery Workshop2. “Thermal/Electrical Modeling for Abuse-Tolerant Design of Li-ion Modules,” K. Smith et al, 2008
NASA Aerospace Battery Workshop3. “Thermal/Electrical Modeling for Abuse Tolerant Design of Lithium Ion Modules,” K. Smith et al.,
Int. J. Energy Res., vol. 34, no. 2, pp. 204-215, 2010.
Photo: ABSL
Photo: NASA

National Renewable Energy Laboratory Innovation for Our Energy Future4
Overview• Modeling Approach
– Cell with PTC device• Electrical • Thermal (5-node)
– Module• Electrical (multinode network)• Thermal (multinode network)
– Pack• Electrical (multinode network)• Thermal (multinode network)
• Validation with experiments from ABSL– Pack-external short of bank 3
• Modeling analysis – Pack-internal short of bank 3– Design and storage considerations
• Conclusions
Photo: ABSL

National Renewable Energy Laboratory Innovation for Our Energy Future
PTC Device – Background• Commercial lithium ion 18650 cells typically have a current-limiting PTC (positive temperature coefficient) device installed in the cell cap to limit external currents in the event of an external short to the cell.
• The PTC device consists of a matrix of crystalline polyethylene containing dispersed conductive particles, usually carbon black.* The resistance of the PTC device increases sharply with temperature.
• When a short is applied to a cell, the elevated currents cause the PTC device to self-heat and move to a high resistance state in which most of the cell voltage is across the PTC device but the current is significantly reduced.
• As long as the short is maintained, the PTC device produces enough heat to keep itself in this tripped state (lower current being offset by greater voltage drop across PTC device).
Single Cell Short:
*Doljack, F., IEEE Transactions on Components, Hybrids, and Manufacturing Technology, 4, 732, 1981
PTC annulus

National Renewable Energy Laboratory Innovation for Our Energy Future6
16P Bundle External Short Test• Performed by Symmetry
Resources, Inc.• Moli ICR18650J cells• 16 parallel• 10 mΩ external short
Model has to Capture Key Physics of an Electrical Short
• PTC device behavior– RPTC(T)– Thermal connection with the
cell• Cell electrical behavior
– Current/voltage/temperature relationship
• Cell-to-cell heat transfer– Conduction
• air gaps• electrical tabs
– radiation• Cell-to-ambient heat transfer
– Convection to air– Conduction through wire
leads
Photos: SRI

National Renewable Energy Laboratory Innovation for Our Energy Future7
Model Development Approach
Unit Cell Model
R1(SOC,TJR)
VOCV(SOC)
C1(SOC,TJR)
Rs(SOC,TJR) RPTC(TPTC)
+
-
I(t)
V(t)
Jelly Roll PTC
5.JellyBottom
4.JellyMiddle
3.JellyTop 2.PTC 1.Top
Button
Ambient
K23K34K45
K5a
K12
K1aK4a K3a
5.JellyBottom
4.JellyMiddle
3.JellyTop 2.PTC 1.Top
Button
Ambient
5.JellyBottom
4.JellyMiddle
3.JellyTop 2.PTC 1.Top
Button
Ambient
K23K34K45
K5a
K12
K1aK4a K3a
5 4 3 1
2
Multicell T&E Network Model
T10
T9
T8 T7
T6
T5
T4
T3T2
T1
Rptc
Zjr
V0+-
+-
+-
RshortVmeas
Imeas
1 162
5-NodeThermal Model
Electrical Model
Thermal Network Model
Electrical Network Model
electrical/thermal interactionelectrical/thermal interaction
Integrated Thermal and Electrical Network Model of a Multicell Batteryfor Safety Evaluation of Module Design with PTC Devices during External Short

National Renewable Energy Laboratory Innovation for Our Energy Future8
Unit Cell Model – ElectricalEquivalent
circuit model including PTC
device
R1(SOC,TJR)
VOCV(SOC)
C1(SOC,TJR)
Rs(SOC,TJR)
V1
RPTC(TPTC)
+
-
I(t)
V(t)
Jellyroll PTC
PTC Resistance vs. Temp.
Data: SRI

National Renewable Energy Laboratory Innovation for Our Energy Future
Unit Cell Model – 5-node Thermal
( )∑ −=j
jiiji TTKQ
( )dtdTMCpTTKQ i
ij
jiiji +−=∑
Steady Form
Unsteady Form
A PTC:3.38W, Jelly:0.0093WB PTC:3.0W, Jelly:0.0093WC PTC:2.0W, Jelly:0.0093WD PTC:1.0W, Jelly:0.0093WE PTC:1.0W, Jelly:1.0W
40
60
80
100
120
140
160
tem
pera
ture
[o C]
Fluent5-Node Aprox
Top button
PTC
Jelly top
Jelly middle
Jelly bottom
AB
D
C
E
40
60
80
100
120
140
160
tem
pera
ture
[o C]
Fluent5-Node Aprox
Top button
PTC
Jelly top
Jelly middle
Jelly bottom
AABB
DD
CC
EE
Detailed Cell Thermal Model• Large computational requirement• Not suitable for multicell modeling
5.JellyBottom
4.JellyMiddle
3.JellyTop 2.PTC 1.Top
Button
Ambient
K23K34K45
K5a
K12
K1aK4a K3a
5.JellyBottom
4.JellyMiddle
3.JellyTop 2.PTC 1.Top
Button
Ambient
5.JellyBottom
4.JellyMiddle
3.JellyTop 2.PTC 1.Top
Button
Ambient
K23K34K45
K5a
K12
K1aK4a K3a
5 4 3 1
2
5-Node Cell Thermal Model• Low order dynamic model• Suitable for multicell modeling
Comparison of Detailed and 5-Node Models for different heat generation conditions
9

National Renewable Energy Laboratory Innovation for Our Energy Future10
Multicell Network Model − Thermal
Thermal Network Model
Thermal Mass: Identifying thermal mass at each nodeHeat Generation: PTC heat, discharge/charge heat (optional: abuse reaction heat) Heat Transfer: Quantifying heat exchange among the nodes
convectionijconductionconnectorijradiationijijj
ijijitransport QQQQQQ ,_,,,1
, , ++=−= ∑≠=
D
d
F1 F2 F3 F4F2
D
d
F1 F2 F3 F4F2
d/D
F
D
d
F1 F2 F3 F4F2
D
d
F1 F2 F3 F4F2
d/D
F
)( 44, jiijradiationij TTAFQ −= ε
Cell-to-Cell Irradiative Heat Transfer

Multicell Network Model − Thermal
Heat Rejection Through Wires Heat Transfer to Ambient
)()( 44 TTATTAhQ iiiiai
1 0 0
1 2 0
1 4 0
1 6 0
)(0
TThAdxdTkAQ b
xbbase
lxmxm xxBeAeTT
011
lxm xxCeTT
2
0 5 1 0 1 5 2 0 2 5 3 0 3 5 4 0 4 5 5 02 0
4 0
6 0
8 0
1 0 0
x [ c m ]
T [o C
]
Heat Conduction Through Air Gap Transverse Heat Transfer Through Plates
Photo: NASA ISS01E5361 Photo: ABSL
a
THkQ
3
National Renewable Energy Laboratory Innovation for Our Energy Future11
L
3

National Renewable Energy Laboratory Innovation for Our Energy Future
Extend Validated 16P Model for 16P5S Pack
12
16P model validated against a bank short test• Created and validated a multicell math model
capturing electrical and thermal interactions of cells with PTC devices during abuse
• PTC device is an effective thermal regulator; maximum cell temperature (final state) is very similar for a variety of initial and boundary conditions for tested 16P events
Extend the validated model to 16P5S pack • Extended the study to identify thermal
configuration among the components of the 3d module design
• Expanded the model capability to capture thermal and electrical responses and their interactions in complex geometries
• 881 thermal nodes are used
I
T

National Renewable Energy Laboratory Innovation for Our Energy Future
Vertical Arrangement of Thermal Nodes
13
Aluminum Plate
Nickel Bus Plate
Nickel Bus Plate
Aluminum Plate
Top Button
Jelly Roll Node 3
Jelly Roll Node 1
Jelly Roll Node 2
GRP Plate
GRP Plate
• 11 nodes are vertically placed at 80 cell locations
• Node thermal connections are defined considering various heat transfer modes
• Aluminum enclosure box is considered thermally lumped
• 11 x 80 + 1 = 881 node system

National Renewable Energy Laboratory Innovation for Our Energy Future
ABSL experiment: Bank 3 short through external resistor
Model Validation for Pack-External Short
80 cell battery in test enclosure
10 mΩ resistor
14
Photo: ABSL

National Renewable Energy Laboratory Innovation for Our Energy Future
ABSL Instrumentation
D
E
F
G
Brick Temperature Sensor Locations
A
B
Center-most cell
C
Cell Temperature Sensor Locations
15
Bank 3 Photos: ABSL

National Renewable Energy Laboratory Innovation for Our Energy Future
Model Validation – First 6000 secondsTe
mpe
ratu
re (o
C)
Time (s)
Symbols: ABSL test dataLines: NREL model output
Center cell
Edge cell
GRP
Al plate-cAl plate-pCorner cell
Box
16

National Renewable Energy Laboratory Innovation for Our Energy Future
Cell Temperature Distribution at 6000 seconds
17
Tem
pera
ture
(oC
)
Height of cylinder depicts peak jellyroll temperature (oC) of each
cell as predicted by model.
0
20
40
60
80
100

National Renewable Energy Laboratory Innovation for Our Energy Future
0
20
40
60
80
100
120
0 2000 4000 6000 8000 10000 12000 14000 16000 18000
Thermocouple Temperatures(ABSL Test Data)
TC-A
TC-B
TC-C
TC-D
TC-E
TC-F
TC-G
TC-H
TC-I
TC-J
Beyond 6000 Seconds, ABSL Test Data Show Periodic Spikes in Temperature
~7000-s
Tem
pera
ture
(oC
)
Time (s)18
ABSL Test Data

National Renewable Energy Laboratory Innovation for Our Energy Future
Model Qualitatively Captures Spikes in Temperature
~7000-s
Tem
pera
ture
(oC
)
Time (s)
Edge cell is the coolest of the bank 3 shorted cells,
has lowest PTC resistance, and
is first cell todischarge.
End of discharge accompanied by high cell resistance, spike in temperature.
19
Center cell
GRP
Al plate-cAl plate-pCorner cell
Box
Edge cell
A
B
A
B
Symbols: ABSL test dataLines: NREL model output

National Renewable Energy Laboratory Innovation for Our Energy Future
Edge cell is the coolest of the bank 3 shorted cells, Has lowest PTC resistance, and Is first cell to completely discharge.
PTC
Hea
t Gen
erat
ion
(W)
Cel
l Ope
n-C
ircui
t Vol
tage
(V)
20
Model Qualitatively Captures Spikes in Temperature A
B
Time (s) Time (s)
A
A

National Renewable Energy Laboratory Innovation for Our Energy Future
E.g., bank 3 short is caused by foreign object between banks 3 and 4*
Model Analysis of Pack-Internal Shorts
Bank 1+
Bank 2-
Bank 3+
Bank 4-
Bank 5+
21
* Requires more than two faults: Introduction of FOD & penetration of Kapton/Nomex/Kapton divider between banks

National Renewable Energy Laboratory Innovation for Our Energy Future
4 V
8 V 16 V
12 V
.... ....
Schematic of Shorted Middle Cell Bank
• Short runs through cell can of cell from adjacent bank 4• Bare walls of cells are negatively biased• Note that 3-layer (Kapton-Nomex-Kapton) bank-to-bank insulator is omitted for clarity
Cell Bank 3
Shortpath
22
+
+
+
+ + +
- - - -
- -

National Renewable Energy Laboratory Innovation for Our Energy Future
Bank 3 Short from 100% SOC• Cell 42 (bank 3) participates in electrical discharge• Cell 56 (bank 4) does not electrically discharge; its external can wall serves as a path for short current• Model assumes ohmic heat of short shared equally by cells 42 and 56
• Internal-to-pack short more thermally severe than external-to-pack• Thermal mass dominates – negligible dependence on earth vs. space boundary conditions• Runaway possibly prevented at 10 mΩ• Runaway predicted at 20,30 mΩ with collateral damage
Bank 3Cell 42 Cell 56
Rshort Short Condition(SOC0 = 100%)
Cell 42 Tmax(Bank 3)
Cell 56 Tmax(Bank 4)
10 mΩ External-to-pack, earth 97oC @ 6000-s 75oC @ 6000-s
Internal-to-pack, earth 150oC @ 16-s 146oC @ 16-s
Internal-to-pack, space 153oC @ 16-s 147oC @ 16-s
20 mΩ Internal-to-pack, space 525oC @ 110-s 522oC @ 110-s
30 mΩ Internal-to-pack, space 595oC @ 240-s 591oC @ 240-s23
National Renewable Energy Laboratory Innovation for Our Energy Future
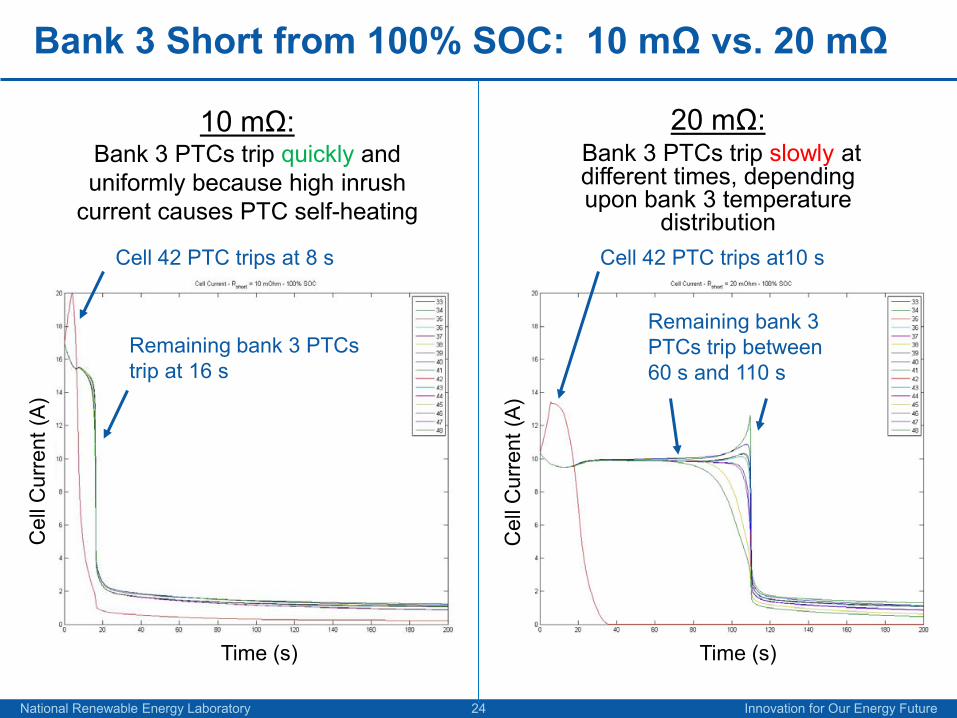
Bank 3 Short from 100% SOC: 10 mΩ vs. 20 mΩ
24
10 mΩ:Bank 3 PTCs trip quickly and uniformly because high inrush
current causes PTC self-heating
Cel
l Cur
rent
(A)
Time (s) Time (s)
Cel
l Cur
rent
(A)
20 mΩ:Bank 3 PTCs trip slowly at different times, depending upon bank 3 temperature
distributionCell 42 PTC trips at 8 s
Remaining bank 3 PTCs trip at 16 s
Cell 42 PTC trips at10 s
Remaining bank 3 PTCs trip between 60 s and 110 s

National Renewable Energy Laboratory Innovation for Our Energy Future
Bank 3 short from 100% SOC: 10 mΩ vs. 20 mΩ
25
10 mΩ:Bank 3 PTCs trip quickly and uniformly due to high in-rush
current causing PTC self-heating
Tem
pera
ture
(oC
)
Time (s) Time (s)
Tem
pera
ture
(oC
)
20 mΩ:Bank 3 PTCs trip slowly, at
different times dependent upon bank 3 temperature distribution
All bank 3 PTCs trip by 16 s
All bank 3 PTCs trip by 110 s
Cell 42 Cell 42
Rest of bank 3 Rest of bank 3

National Renewable Energy Laboratory Innovation for Our Energy Future
Bank 3 Short from 100% SOC: Cell-to-Cell Radiation
Design question: Would a high-emissivity coating applied to bare cell walls help limit thermal excursion?
Bank 3Cell 42
Rshort Short Condition(SOC0 = 100%)
Cell wall emissivity
Cell 42 Tmax(Bank 3)
20 mΩ Internal-to-pack, earth
ε = 0.3 (Nominal)
525oC @ 110 s
ε = 0.9(Coating)
410oC @ 102 s
26
(Minimalchange)

National Renewable Energy Laboratory Innovation for Our Energy Future
Bank 3 Short: SOC Dependence
Is battery design tolerant to pack-internal shorts when stored at low SOCs?
Bank 3Cell 42
Rshort Short Condition Initial SOC Initial OCV Cell 42 Tmax(Bank 3)
20 mΩ Internal-to-pack, earth
1.5% 3.428 V 117oC @ 85 s
0.5% 3.346 V 83oC @ 80 s
27
No thermal runaway when stored at 0% SOC (3.25 OCV).

National Renewable Energy Laboratory Innovation for Our Energy Future
What About Cell-Internal Shorts?
28
• Scenario• 20 mΩ short bridging anode and cathode inside a cell jellyroll• Defective cell at 100% SOC• Battery at room temperature
• Possible projections based on model results• Cell bank energy would rapidly dissipate inside the cell and raise
its temperature• Defective cell’s PTC device would trip and choke off current from
the 15 cells in parallel, well before their PTC devices trip• So, the hazard may be limited to the defective cell only and less
collateral damage may result vs. the internal pack short
• Further work is necessary in this area for confirmation

National Renewable Energy Laboratory Innovation for Our Energy Future
Conclusions• 80-cell spacesuit battery electrical/thermal model
• Captures relevant physics for cell-external shorting events, including PTC behavior
• Agrees well with pack-external bank 3 short experiment run by ABSL• Predicts that design will tolerate all pack-external short resistance conditions
• Relocating short from pack-external (experimental validation) to pack-internal (modeling study) causes substantial additional heating of cells that can lead to cell thermal runaway
• Negligible sensitivity to earth/space BCs (thermal mass dominates)• Large sensitivity to Rshort
• Rshort < 10 mΩ: 16P bank PTCs trip quickly, most likely preventing runaway• 10 mΩ < Rshort < 60 mΩ: Thermal runaway appears likely
• Fortunately, all three layers of bank-to-bank separator must fail for pack-internal short scenario to occur
• Nevertheless, this finding re-emphasizes the general imperative of battery pack assembly cleanliness
• Design is tolerant to pack-internal short when stored at 0% SOC
29

National Renewable Energy Laboratory Innovation for Our Energy Future
Acknowledgments
This work was funded by NASA Johnson Space Center under interagency agreement.
•NASA-JSC – Eric Darcy, Sam Russell•ABSL – Craig Flora•UTC Hamilton-Sunstrand – Mike Puskar•DOE Office of Energy Efficiency & Renewable Energy – David Howell, Hybrid Electric Systems Team Lead, Energy Storage R&D
30

National Renewable Energy Laboratory Innovation for Our Energy Future
Extra Slides
31

National Renewable Energy Laboratory Innovation for Our Energy Future
Contact Resistance Formulation
32
For uncertainty of quantifying thermal resistance at the contact interface between the parts, a parametric formulation was developed.Temperature discontinuity at interface, ∆Tinterface, was set as a fraction of the total temperature difference between the adjacent nodes, ∆T.∆ Tinterface = f * ∆ T1-4 (0 <= f < 1)
Akx
TTR
TT
Akx
TTQ
NiNii
AlAl ∆
−=
−=
∆−
= 433221
[ ]KW
Akx
Akx
fR
K
Ni
Ni
Al
Al
∆+
∆−
==−
−11
4141 ∆x: half of plate thickness
Aluminum
NickelInterface
T1
T2 T3T4
T1 T3T2 T4
Temperatures
x