Embed Size (px)
Citation preview
Thermal and Arc Flash Analysis of Electric Motor Drives in Distribution Networks
47Volume 8, Number 2, 2017
Preliminary Communication
Srete NikolovskiJosip Juraj Strossmayer University of Osijek,Faculty of Electrical Engineering, Computer Science and Information Technology Osijek, [email protected]
Dragan MlakićDistribution Company, Novi Travnik, Electric Power Company HZ-HB Inc. Mostar, Bosnia and [email protected] Emir AlibašićZZO Tuzla Kanton, Tuzla, Bosnia and [email protected]
Abstract – The paper presents thermal analysis and arc flash analysis taking care of protection relays coordination settings for electric motor drives connected to the electrical network. Power flow analysis is performed to check if there are any voltage and loading violation conditions in the system. Fault analysis is performed to check the short circuit values and compute arc flash energy dissipated at industrial busbars to eliminate damage to electrical equipment and electrical shocks and hazard to personnel. Computers enable the use of smart algorithms used by electrical engineers in providing accuracy of these actions. A fast and accurate procedure for proper incident arc flash energy computation and overcurrent relays coordination in distribution networks is presented. The paper presents the use of the Arc Flash module for arc flash energy computation during the short circuit on LV and HV busbars with soft motor starters. A sample case of one real network is presented which uses soft motor starters as well as the influence on arc flash energy in one transformer station supplying the industrial network in Bosnia and Herzegovina.
Keywords – arc flash, distribution network, electric motor drive, power flow, protection, short circuit, thermal analysis
1. INTRODUCTION
The paper presents computer modeling and arc flash hazard analysis of the distribution network with an industrial consumer with electric motor drives of one technological facility [1]. Protection coordina-tion is essential in industrial facilities in order to avoid damage due to an arc flash produced by short circuit currents. Also, power flow analysis is very important to thermal analysis to check if some part of the system is overloaded [2]. An arc flash is dangerous because it produces the following effect: 80 % of all electri-cal injuries are burns resulting from the electric arc flash. Section 2 deals with thermal analysis and power flow computations. Section 3 presents arc flow analy-sis. Measures for reducing arc flash risk using proper protection coordination are presented in Section 4. The arc flash causes an explosion of electrical equip-ment resulting in an arc plasma ball. Also, solid cop-per vaporizes and expands to approximately 67,000 times its original volume. The temperatures exceed 12,000 Co and sound levels can reach up to 141.5 dB.
In addition, the force can produce a pressure wave and light can be very bright including a plasma ball. The pressure of toxic smoke can be very dangerous [3]. Arc flash analysis and a hazard assessment are normed differently in the USA and the EU countries. In the USA, IEEE 1584-2002 entitled “IEEE Guide for Per-forming Arc-Flash Hazard Calculations” is a standard. It provides a methodology for computing prospec-tive arc flash hazards [4]. Based on the test data, the IEEE 1584 Committee developed empirical equations to calculate arc flash incident energy for AC systems. The Occupational Safety and Health Administration has two parts, i.e. OSHA 1910.132 (d), and 1926.28 (a). According to the NFPA 70E industry standard [5], an employer is responsible for:
• Conducting a hazard assessment in the work-place;
• Choosing and using the proper personal protec-tive equipment; and
48 International Journal of Electrical and Computer Engineering Systems
• Documenting the risk assessment.
OSHA considers arc flash assessments that follow the NFPA 70E standard. They have to be in line with OSHA requirements and protect workers from electrical safe-ty hazards [6-7]. In the EU, the IEC standard does not pay special attention to arc flash energy calculation but it has a personal protection equipment (PPE) stan-dard for arc flash protection equipment testing. The IEC 61482-1 and the similar EN 61482-1 are split into two parts, which cover the methods for testing of clothing fabrics and garments designed to protect personnel against arc flash.
IEC and identical EU standards, which have supersed-ed ENV 50354, are now known as the “box test”. There are two test method versions: the “material box test”, which includes heat transfer measurements and ther-mal curve differential analysis, and the “garment box test”, which requires only a visual assessment of gar-ment performance [8].
The box-test standard defines two testing conditions, namely Class 1 and Class 2:
• Class 1 tests at the arc current of 4 kA and arc du-ration of 500 ms;
• Class 2 tests at the arc current of 7 kA and arc du-ration of 500 ms.
A sample case considered in the paper are the in-dustrial facilities supplied by the 10 kV overhead transmission line connected to the transformer sta-tion TS 10/0.4 kV [9]. The modeled network consists of overhead distribution lines, a transformer station, molded-case circuit breakers, digital relays, cables and electric motors modeled in the software which can perform power flow, short circuit and arc flash modules.
Table 1. Motor data
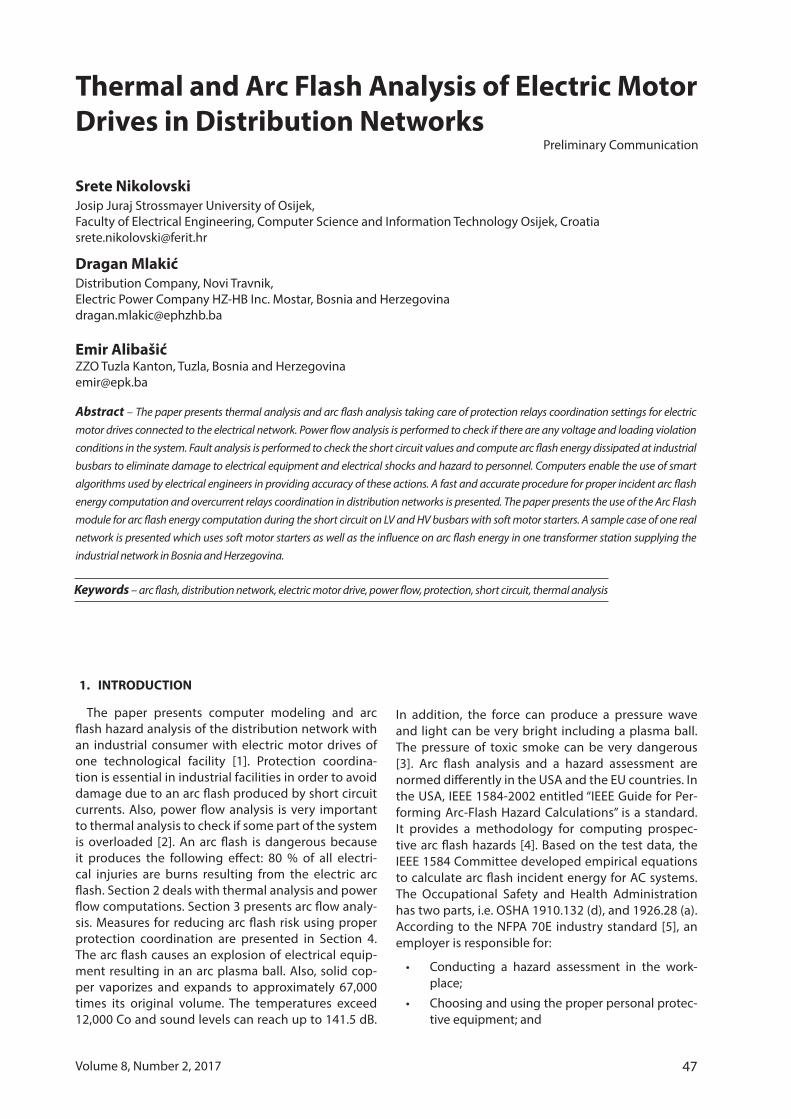
Fig. 1. A single-line diagram of the electric motor drives connected to the TS [11]
2. THERMAL ANALYSIS OF AN ELECTRICAL NETWORK AND AN ELECTRIC MOTOR DRIVE
Supply feeder rated voltage 10 kV is connected to TS Plješevac 10/0.4 kV transformer station. The length of line is 11.5 km and it is composed of Al/Fe 50 mm2 conductors and some parts with older Al/Fe 25 mm2 conductors. The feeder line of 10 kV is connected to TS 110/35/10 kV Kiseljak supply transformer station. The main motor data are given in Table 1.
Motor data Type Rated power Voltage PF
Function (kW) (V)
Mill 1 and Mill 2 AHR 200 380 0.85
Crusher 3 and Crusher 4 AHR 132 380 0.85
Colander AHR 132 380 0.85
Transport track AHR 132 380 0.85
Power flow analysis shows that there is no overload of any element in the network and the technological process which will be presented with computed results and thermal measurements and images. A summary report is shown in Table 2.
Table 2. Summary system report
Motor data Type Rated power Voltage PF
Generation in the system 750 209 779 0.963
Load in the system 687 154 704 0.976
Losses in the system 63 55
49Volume 8, Number 2, 2017
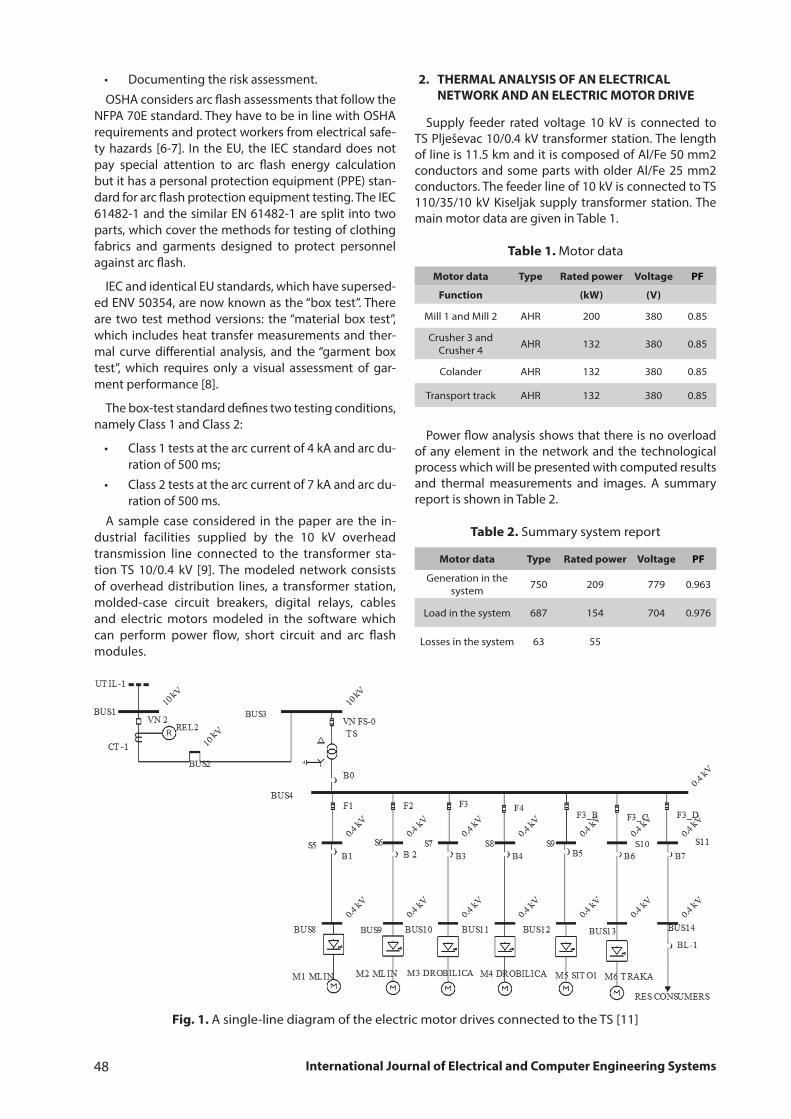
With a thermal image of the medium voltage (MV) line pole in Fig 2, it is indicated that there are no over-loaded elements on distribution conductors, isolators and connection elements. The working temperature of Al/Fe conductors is 65°C. The cables on the primary side can withstand a working temperature of 75°C and the transformer temperature for cooling IEC class for the ONAN transformer is 65-85°C.
Element overloads are presented in Tables 3 and 4.
Fig. 2. Thermal image of a 10 kV pole of the distribution line
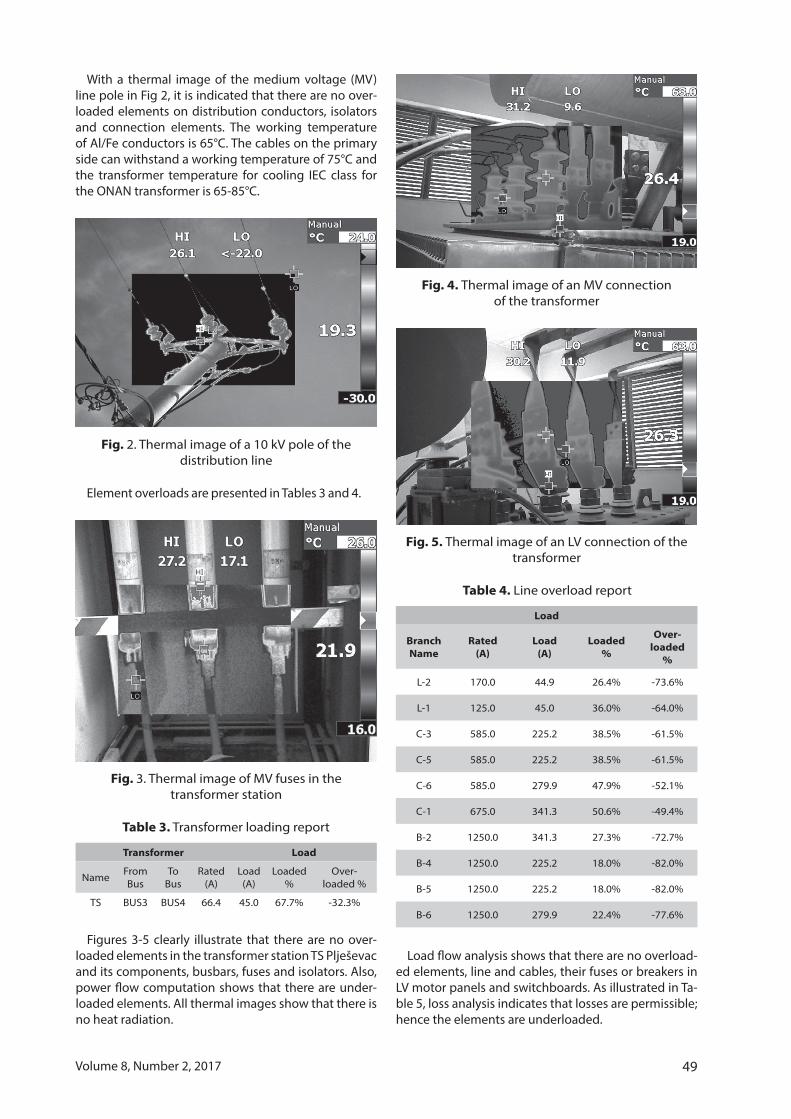
Fig. 3. Thermal image of MV fuses in the transformer station
Transformer Load
Name From Bus
To Bus
Rated (A)
Load (A)
Loaded %
Over- loaded %
TS BUS3 BUS4 66.4 45.0 67.7% -32.3%
Table 3. Transformer loading report
Figures 3-5 clearly illustrate that there are no over-loaded elements in the transformer station TS Plješevac and its components, busbars, fuses and isolators. Also, power flow computation shows that there are under-loaded elements. All thermal images show that there is no heat radiation.
Fig. 4. Thermal image of an MV connection of the transformer
Fig. 5. Thermal image of an LV connection of the transformer
Load
Branch Name
Rated (A)
Load (A)
Loaded%
Over-loaded
%
L-2 170.0 44.9 26.4% -73.6%
L-1 125.0 45.0 36.0% -64.0%
C-3 585.0 225.2 38.5% -61.5%
C-5 585.0 225.2 38.5% -61.5%
C-6 585.0 279.9 47.9% -52.1%
C-1 675.0 341.3 50.6% -49.4%
B-2 1250.0 341.3 27.3% -72.7%
B-4 1250.0 225.2 18.0% -82.0%
B-5 1250.0 225.2 18.0% -82.0%
B-6 1250.0 279.9 22.4% -77.6%
Table 4. Line overload report
Load flow analysis shows that there are no overload-ed elements, line and cables, their fuses or breakers in LV motor panels and switchboards. As illustrated in Ta-ble 5, loss analysis indicates that losses are permissible; hence the elements are underloaded.
50 International Journal of Electrical and Computer Engineering Systems
From Bus To Bus Losses
Name Base (kV) Name Base
(kV) kW kVAr
BUS1 10.00 BUS2 10.00 36.3 23.4BUS2 10.00 BUS3 10.00 21.4 7.3BUS3 10.00 BUS4 0.400 4.2 23.9
BUS10 0.400 S7 0.400 0.2 0.1BUS12 0.400 S9 0.400 0.2 0.1BUS14 0.400 S11 0.400 0.3 0.2
S5 0.400 BUS8 0.400 0.4 0.2S5 0.400 BUS4 0.400 0.2 0.0S7 0.400 BUS4 0.400 0.2 0.0S9 0.400 BUS4 0.400 0.2 0.0
S11 0.400 BUS4 0.400 0.2 0.0
Total Losses 63.8 55.2
Table 5. Branch losses report
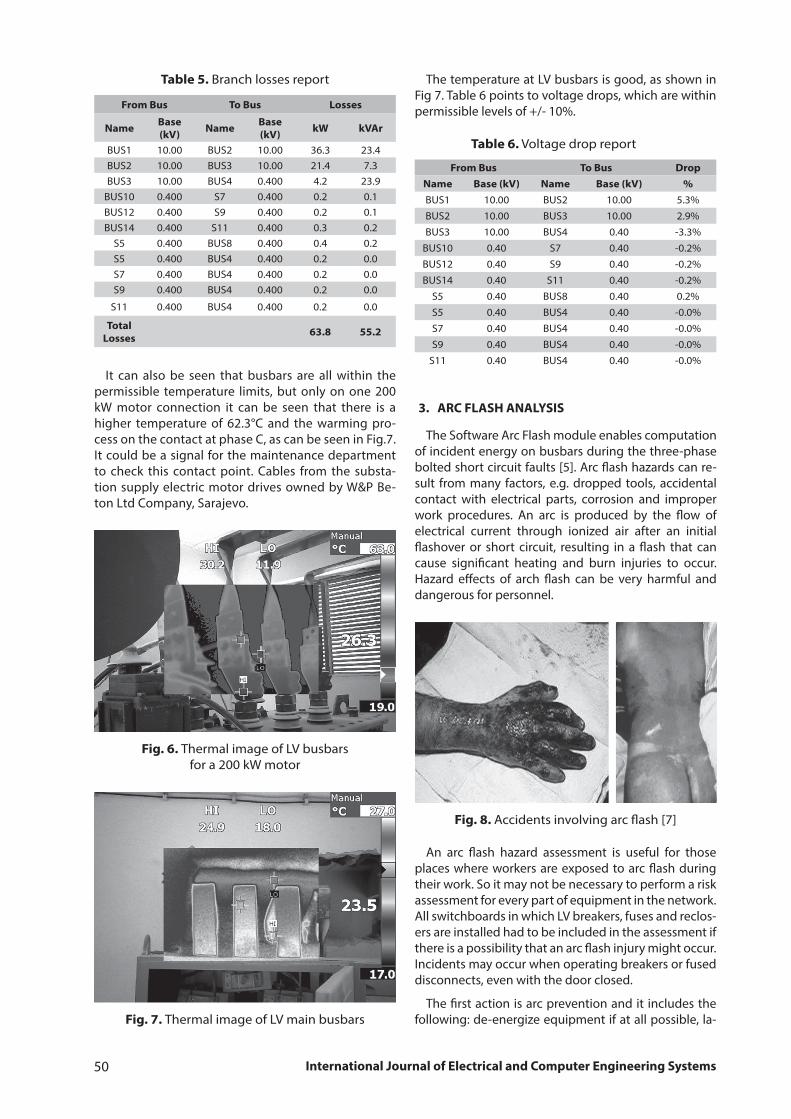
It can also be seen that busbars are all within the permissible temperature limits, but only on one 200 kW motor connection it can be seen that there is a higher temperature of 62.3°C and the warming pro-cess on the contact at phase C, as can be seen in Fig.7. It could be a signal for the maintenance department to check this contact point. Cables from the substa-tion supply electric motor drives owned by W&P Be-ton Ltd Company, Sarajevo.
Fig. 6. Thermal image of LV busbars for a 200 kW motor
Fig. 7. Thermal image of LV main busbars
The temperature at LV busbars is good, as shown in Fig 7. Table 6 points to voltage drops, which are within permissible levels of +/- 10%.
From Bus To Bus DropName Base (kV) Name Base (kV) %BUS1 10.00 BUS2 10.00 5.3%
BUS2 10.00 BUS3 10.00 2.9%
BUS3 10.00 BUS4 0.40 -3.3%
BUS10 0.40 S7 0.40 -0.2%
BUS12 0.40 S9 0.40 -0.2%
BUS14 0.40 S11 0.40 -0.2%
S5 0.40 BUS8 0.40 0.2%
S5 0.40 BUS4 0.40 -0.0%
S7 0.40 BUS4 0.40 -0.0%
S9 0.40 BUS4 0.40 -0.0%
S11 0.40 BUS4 0.40 -0.0%
Table 6. Voltage drop report
3. ARC FLASH ANALYSIS
The Software Arc Flash module enables computation of incident energy on busbars during the three-phase bolted short circuit faults [5]. Arc flash hazards can re-sult from many factors, e.g. dropped tools, accidental contact with electrical parts, corrosion and improper work procedures. An arc is produced by the flow of electrical current through ionized air after an initial flashover or short circuit, resulting in a flash that can cause significant heating and burn injuries to occur. Hazard effects of arch flash can be very harmful and dangerous for personnel.
Fig. 8. Accidents involving arc flash [7]
An arc flash hazard assessment is useful for those places where workers are exposed to arc flash during their work. So it may not be necessary to perform a risk assessment for every part of equipment in the network. All switchboards in which LV breakers, fuses and reclos-ers are installed had to be included in the assessment if there is a possibility that an arc flash injury might occur. Incidents may occur when operating breakers or fused disconnects, even with the door closed.
The first action is arc prevention and it includes the following: de-energize equipment if at all possible, la-
51Volume 8, Number 2, 2017
bel equipment and train personnel, minimize risk with good safety practices, move people further away, de-sign the hazard out (Safety by Design), reduce available fault current, and faster clearing times. What is impor-tant to realize is that the level of fault current changes clearing times of all protective relays. These changes can have a significant impact on the arc flash hazard and the Personal Protection Equipment requirements (PPE) for each part of equipment.
Fig. 9. Using protection equipment when working with voltage [10]
Working distance is a very important part of an arc flash hazard assessment. The arc flash boundary and associated protection requirements are based on the incident energy levels available to the person’s chest or face. The hands or arms are not included. A degree of injury depends on the percentage of person’s burned skin since the head and chest areas are more critical to survival than fingers or arms. During live working, the hand and head regions are particularly at risk of being burnt by arc faults. National regulations valid in the country of use must be observed. Employers must provide tested personal protective equipment (PPE) in compliance with Directive 89/686/EEC to their employ-ees. PPE must be certified by an accredited test insti-tute. Employers must ensure that PPE is used properly.
Fig. 10. Software module for Arc Flash [11]
Software enables analysis including multiple graphi-cal tools to solve overcurrent relay coordination prob-lems to reduce arc flash effects. The program enables up to five working distances for each voltage level. The user can use a safety program where distances can be modified for a specific operation and mainte-nance function. This also allows easy standardization of personal protecting equipment and clothing levels for safety benefits. For higher voltage levels, greater distances may be used to indicate hot stick operations.
Determination of the arc energy is given by the equation:
where:
Warc - electrical arc energy (expected value)
kp - arc power in relation to the short-circuit power
Un - nominal voltage
I“k3p - three-phase fault current
tk - tripping time of the overcurrent relay
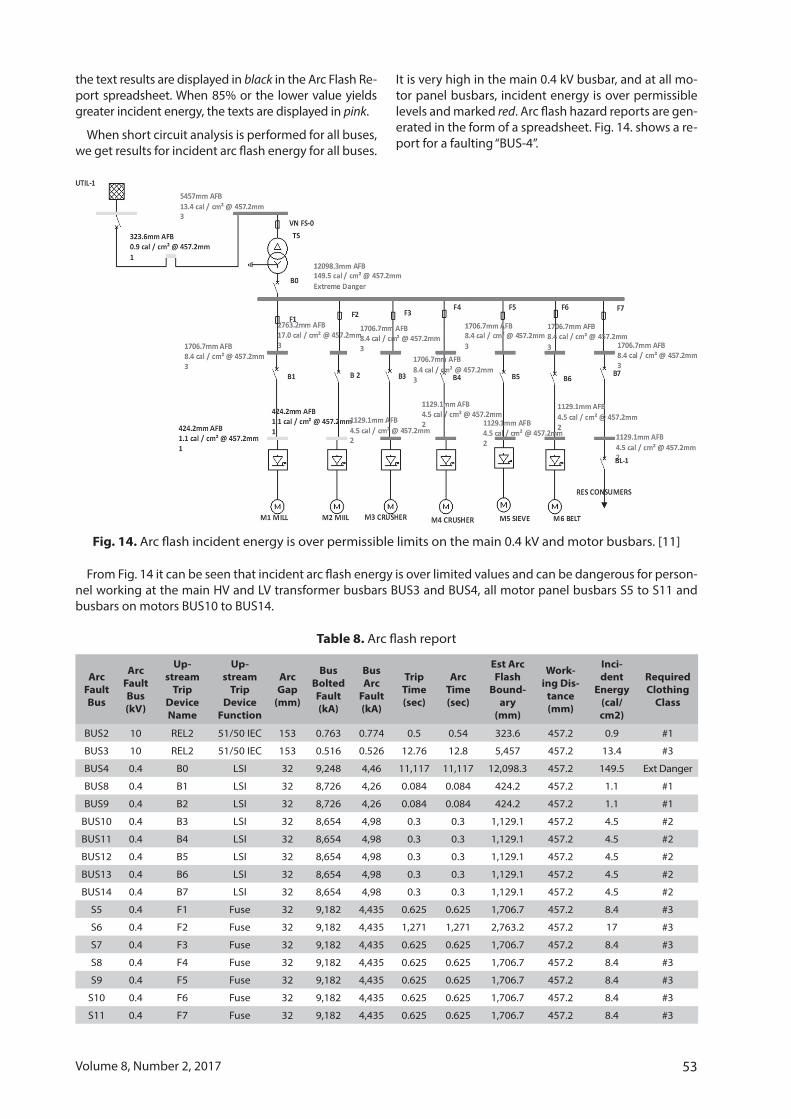
The amount of energy impressed on a surface at a specific distance away from the source during an elec-trical arc event is defined as incident energy. Incident energy is measured in joules per centimeter squared (J/cm2) or in calories per centimeter squared (cal/cm2). Software provides a threshold incident energy level for different voltage ranges. If the incident energy level of a particular device is above the threshold, the device will be highlighted on the one-line as immediate dan-ger. Electrical workers and safety managers can use this threshold to immediately identify areas where current Personal Protective Equipment (PPE) standards will not provide the required safety margins. Traditional infra-red thermograph survey inspection that can be used for preventive checking using infrared windows and viewports for visual inspection in regular scheduled maintenance intervals is shown in Fig. 11.
Fig. 11. Infrared visual thermography inspection [10]
The selection and overcurrent coordination of the sys-tem protective relays are very important. Each protective device needs to be determined by plotting the device TCC (Time-Current-Curves) operating characteristic for a given
52 International Journal of Electrical and Computer Engineering Systems
feeder supply. Adequate separation of protective relays depends on the type of device and the desired safety fac-tor. At the beginning of a 0.4 kV feeder there is a second-ary overcurrent relay Energoinvest. At the primary side of the distribution transformer is an MV fuse. Protection re-lays used to protect the secondary side of the transformer in TS Plješevac is an LV breaker with the LSI characteristic. On the cables, there are fuses and LV breakers with LSI characteristics and relays for electric motor soft start. Pro-tection input data for relay presetting from the Distribu-tion System Operator (DSO) Company and the W&P Beton Ltd Company are given in Table 7.
RelayProtection relay settings
Type of relay Function Setting Setting
REL 2 Energoin. Overcurrent
I>120 A, Very in-
verse IEC
I>> 330 A, time
deal=11
I>>>570 A, t=0.5 s
FS0 HV Fuse 63 A IEC standard
B4 SIEMENS LV breaker
LSI I>1280 A
I>>4800 A, LT band A
StT delay B
I>>>12800 A
F1, F2 LV Fuses 500A IEC standard
F3 LV Fuse 400A
B1-B2 SIEMENS LV breakers LSI I>400 A
I>>2400 A, LT band B
StT delay AI>>> 4800 A
B3 SIEMENS LV breaker LSI I>300 A
I>>1600 A, LT band B
StT delay BI>>> 3200 A
Table 7. Protection relay settings
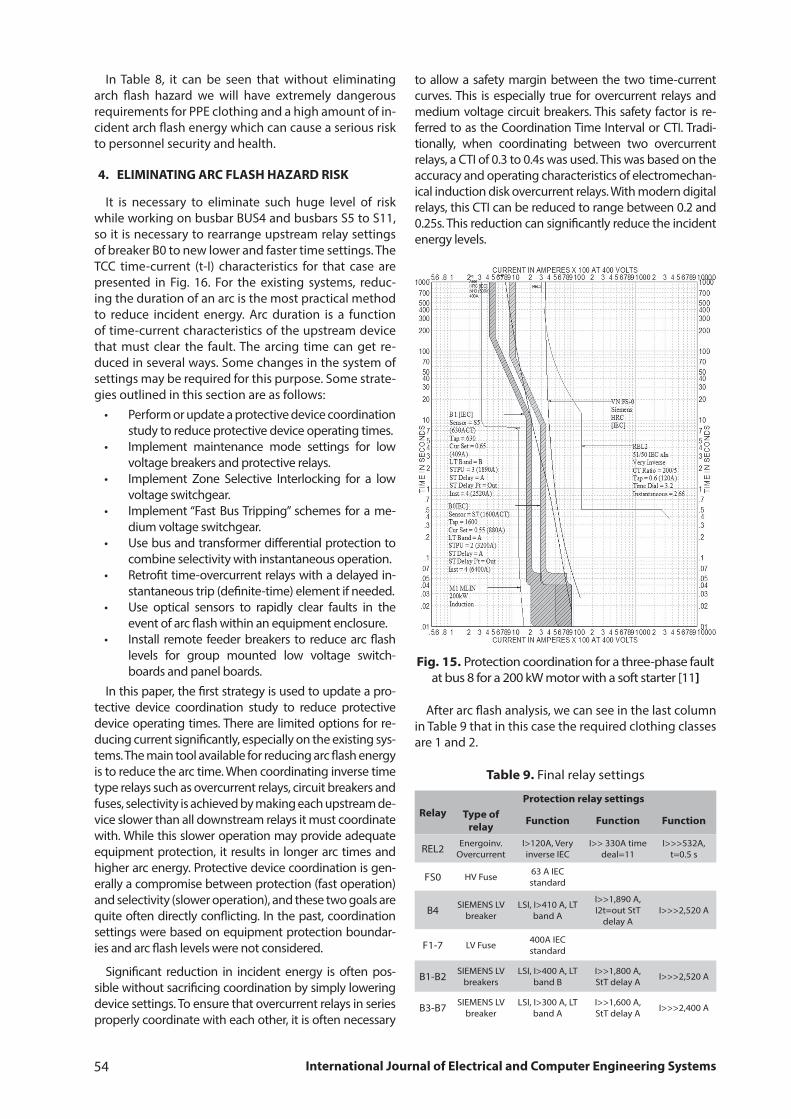
Overcurrent coordination for a three-phase fault at bus 11 for a 200 kW motor is shown in Fig. 12. From the TCC curves shown in Fig. 12 it can be concluded that protection relay coordination is well performed. In the case of three-phase faults, motor LV breaker B3 will trip first. If it fails to trip, then the LV fuse will trip. The last to be activated is breaker B0 on the LV secondary side of the transformer.
All motors at LV busbars with rated power 200 kW and M3 132 kW are equipped with a soft starter adjustable frequency device to adjust starting of the motor. In this case, the soft starter manufactured by Allen-Bradley is used, and its soft start curve is presented in Fig. 13. [8]
Fig. 12. Protection coordination for a 3-phase fault at bus 8 for a 200 kW soft start motor [11]
Fig. 13. Soft start curve of the SMC Flex adjustable controller
Arc flash hazard analysis is performed in the short cir-cuit focus. The analysis yields results as required by NFPA-70E. NFPA requires a specification of the arc flash bound-ary and the incident arc energy at a probable working distance. Various analysis options are available such as the type of the calculation method, working distances, units, the type of enclosure for equipment, and the use of arcing time. Results may be viewed on the one-line as well as in spreadsheet reports. The arc flash report is an interactive spreadsheet, in which users can change some values and the results will change automatically.
Work permits for working on energized equipment recommending the appropriate PPE based on arc flash hazard analysis and the nature of work can be created. The IEEE 1584 equations are applicable up to 15kV. Above 15 kV, the program uses the Ralph Lee method and the distance X factor and the gap from the library do not apply. This method has the distance exponent of 2. Software obtains “Worst-Case Arc Flash Hazards”, the arcing time from the upstream protective device of the faulted bus. Some circuit breakers have an additional instantaneous trip setting that can be turned on during maintenance work. In the case of faults, this results in fast tripping, limiting the arc flash incident energy.
During normal operation, this trip is set to “Off” for se-lective coordination. This additional trip may be known as Maintenance Mode or have commercial names such as ARMS, Quick-Trip, or RELT. As specified in Short Circuit Options, when 100% of calculated arc current or the up-per value yields greater arc flash incident energy, then
53Volume 8, Number 2, 2017
the text results are displayed in black in the Arc Flash Re-port spreadsheet. When 85% or the lower value yields greater incident energy, the texts are displayed in pink.
When short circuit analysis is performed for all buses, we get results for incident arc flash energy for all buses.
It is very high in the main 0.4 kV busbar, and at all mo-tor panel busbars, incident energy is over permissible levels and marked red. Arc flash hazard reports are gen-erated in the form of a spreadsheet. Fig. 14. shows a re-port for a faulting “BUS-4”.
Fig. 14. Arc flash incident energy is over permissible limits on the main 0.4 kV and motor busbars. [11]
From Fig. 14 it can be seen that incident arc flash energy is over limited values and can be dangerous for person-nel working at the main HV and LV transformer busbars BUS3 and BUS4, all motor panel busbars S5 to S11 and busbars on motors BUS10 to BUS14.
Arc Fault Bus
Arc Fault Bus (kV)
Up-stream
Trip Device Name
Up-stream
Trip Device
Function
Arc Gap
(mm)
Bus Bolted Fault (kA)
Bus Arc
Fault (kA)
Trip Time (sec)
Arc Time (sec)
Est Arc Flash
Bound-ary
(mm)
Work-ing Dis-
tance (mm)
Inci-dent
Energy (cal/cm2)
Required Clothing
Class
BUS2 10 REL2 51/50 IEC 153 0.763 0.774 0.5 0.54 323.6 457.2 0.9 #1
BUS3 10 REL2 51/50 IEC 153 0.516 0.526 12.76 12.8 5,457 457.2 13.4 #3
BUS4 0.4 B0 LSI 32 9,248 4,46 11,117 11,117 12,098.3 457.2 149.5 Ext Danger
BUS8 0.4 B1 LSI 32 8,726 4,26 0.084 0.084 424.2 457.2 1.1 #1
BUS9 0.4 B2 LSI 32 8,726 4,26 0.084 0.084 424.2 457.2 1.1 #1
BUS10 0.4 B3 LSI 32 8,654 4,98 0.3 0.3 1,129.1 457.2 4.5 #2
BUS11 0.4 B4 LSI 32 8,654 4,98 0.3 0.3 1,129.1 457.2 4.5 #2
BUS12 0.4 B5 LSI 32 8,654 4,98 0.3 0.3 1,129.1 457.2 4.5 #2
BUS13 0.4 B6 LSI 32 8,654 4,98 0.3 0.3 1,129.1 457.2 4.5 #2
BUS14 0.4 B7 LSI 32 8,654 4,98 0.3 0.3 1,129.1 457.2 4.5 #2
S5 0.4 F1 Fuse 32 9,182 4,435 0.625 0.625 1,706.7 457.2 8.4 #3
S6 0.4 F2 Fuse 32 9,182 4,435 1,271 1,271 2,763.2 457.2 17 #3
S7 0.4 F3 Fuse 32 9,182 4,435 0.625 0.625 1,706.7 457.2 8.4 #3
S8 0.4 F4 Fuse 32 9,182 4,435 0.625 0.625 1,706.7 457.2 8.4 #3
S9 0.4 F5 Fuse 32 9,182 4,435 0.625 0.625 1,706.7 457.2 8.4 #3
S10 0.4 F6 Fuse 32 9,182 4,435 0.625 0.625 1,706.7 457.2 8.4 #3
S11 0.4 F7 Fuse 32 9,182 4,435 0.625 0.625 1,706.7 457.2 8.4 #3
Table 8. Arc flash report
54 International Journal of Electrical and Computer Engineering Systems
In Table 8, it can be seen that without eliminating arch flash hazard we will have extremely dangerous requirements for PPE clothing and a high amount of in-cident arch flash energy which can cause a serious risk to personnel security and health.
4. ELIMINATING ARC FLASH HAZARD RISK
It is necessary to eliminate such huge level of risk while working on busbar BUS4 and busbars S5 to S11, so it is necessary to rearrange upstream relay settings of breaker B0 to new lower and faster time settings. The TCC time-current (t-I) characteristics for that case are presented in Fig. 16. For the existing systems, reduc-ing the duration of an arc is the most practical method to reduce incident energy. Arc duration is a function of time-current characteristics of the upstream device that must clear the fault. The arcing time can get re-duced in several ways. Some changes in the system of settings may be required for this purpose. Some strate-gies outlined in this section are as follows:• Perform or update a protective device coordination
study to reduce protective device operating times.• Implement maintenance mode settings for low
voltage breakers and protective relays.• Implement Zone Selective Interlocking for a low
voltage switchgear.• Implement “Fast Bus Tripping” schemes for a me-
dium voltage switchgear.• Use bus and transformer differential protection to
combine selectivity with instantaneous operation.• Retrofit time-overcurrent relays with a delayed in-
stantaneous trip (definite-time) element if needed.• Use optical sensors to rapidly clear faults in the
event of arc flash within an equipment enclosure.• Install remote feeder breakers to reduce arc flash
levels for group mounted low voltage switch-boards and panel boards.
In this paper, the first strategy is used to update a pro-tective device coordination study to reduce protective device operating times. There are limited options for re-ducing current significantly, especially on the existing sys-tems. The main tool available for reducing arc flash energy is to reduce the arc time. When coordinating inverse time type relays such as overcurrent relays, circuit breakers and fuses, selectivity is achieved by making each upstream de-vice slower than all downstream relays it must coordinate with. While this slower operation may provide adequate equipment protection, it results in longer arc times and higher arc energy. Protective device coordination is gen-erally a compromise between protection (fast operation) and selectivity (slower operation), and these two goals are quite often directly conflicting. In the past, coordination settings were based on equipment protection boundar-ies and arc flash levels were not considered.
Significant reduction in incident energy is often pos-sible without sacrificing coordination by simply lowering device settings. To ensure that overcurrent relays in series properly coordinate with each other, it is often necessary
to allow a safety margin between the two time-current curves. This is especially true for overcurrent relays and medium voltage circuit breakers. This safety factor is re-ferred to as the Coordination Time Interval or CTI. Tradi-tionally, when coordinating between two overcurrent relays, a CTI of 0.3 to 0.4s was used. This was based on the accuracy and operating characteristics of electromechan-ical induction disk overcurrent relays. With modern digital relays, this CTI can be reduced to range between 0.2 and 0.25s. This reduction can significantly reduce the incident energy levels.
Fig. 15. Protection coordination for a three-phase fault at bus 8 for a 200 kW motor with a soft starter [11]
After arc flash analysis, we can see in the last column in Table 9 that in this case the required clothing classes are 1 and 2.
RelayProtection relay settings
Type of relay Function Function Function
REL2 Energoinv. Overcurrent
I>120A, Very inverse IEC
I>> 330A time deal=11
I>>>532A, t=0.5 s
FS0 HV Fuse 63 A IEC standard
B4 SIEMENS LV breaker
LSI, I>410 A, LT band A
I>>1,890 A, I2t=out StT
delay AI>>>2,520 A
F1-7 LV Fuse 400A IEC standard
B1-B2 SIEMENS LV breakers
LSI, I>400 A, LT band B
I>>1,800 A, StT delay A I>>>2,520 A
B3-B7 SIEMENS LV breaker
LSI, I>300 A, LT band A
I>>1,600 A, StT delay A I>>>2,400 A
Table 9. Final relay settings
55
Fig. 15. Arc flash reduction using correct relay settings. [11]
Table 10 presents the final result after rearranging relay settings.
Table 10. Arc flash final report
Bus Name
Bus kV
Device Name
Device Func-tion
Arc Gap
(mm)
Bus Bolted Fault (kA)
Bus Arc Fault (kA)
Trip Time (sec)
Arc Time (sec)
Est Arc Flash
Bound-ary (mm)
Work-ing Dis-
tance (mm)
Inci-dent
Energy (cal/cm2)
Required Clothing
Class
BUS2 10 REL2 51/50 153 0.763 0.774 0.05 0.09 51.3 457.2 0.1 #1
BUS3 10 REL2 51/50 153 0.516 0.526 6.056 6.096 2,545.8 457.2 6.4 #2
BUS4 0.4 B0 LSI 32 9.248 5.248 0.06 0.06 393.5 457.2 1 #1
BUS8 0.4 B1 LSI 32 8.726 5.013 0.04 0.04 288.9 457.2 0.6 #1
BUS9 0.4 B0 LSI 32 8.726 5.013 0.06 0.06 380.5 457.2 0.9 #1
BUS10 0.4 B0 LSI 32 8.654 4.98 0.06 0.06 378.6 457.2 0.9 #1
BUS11 0.4 B0 LSI 32 8.654 4.98 0.06 0.06 378.6 457.2 0.9 #1
BUS12 0.4 B0 LSI 32 8.654 4.98 0.06 0.06 378.6 457.2 0.9 #1
BUS13 0.4 B0 LSI 32 8.654 4.98 0.06 0.06 378.6 457.2 0.9 #1
BUS14 0.4 B0 LSI 32 8.654 4.98 0.06 0.06 378.6 457.2 0.9 #1
S5 0.4 F1 IEC 32 9.182 5.218 0.06 0.06 391.8 457.2 1 #1
S6 0.4 F2 IEC 32 9.182 5.218 0.06 0.06 391.8 457.2 1 #1
S7 0.4 F3 IEC 32 9.182 5.218 0.06 0.06 391.8 457.2 1 #1
S8 0.4 F4 IEC 32 9.182 5.218 0.06 0.06 391.8 457.2 1 #1
S9 0.4 F5 IEC 32 9.182 5.218 0.06 0.06 391.8 457.2 1 #1
S10 0.4 F6 IEC 32 9.182 5.218 0.06 0.06 391.8 457.2 1 #1
S11 0.4 F7 IEC 32 9.182 5.218 0.06 0.06 391.8 457.2 1 #1
Volume 8, Number 2, 2017
56
After arc flash analysis, in the last column in Table 11 it can be seen that in this case the required clothing classes are #1 and #2.
Table 11. Personal protection equipment
Hazard Risk Cat-
egory
Clothing Description (Number of
clothing layers given in paren-
thesis)
Total Weight
(oz/yd2)
Minimum Arc Thermal Perfor-mance Exposure
Value (ATPV) or Breakopen Threshold En-ergy Rating of PPE (cal/cm2)
0 Untreated Cotton (1) 4.7-7 1.2
1 FR Shirt and FR Pants (1) 4.5-8 4
2
Cotton Underwear plus FR Shirt and FR
Pants (2)
9-12 8
3
Cotton Underwear plus
FR Shirt and FR Pants plus Coverall (3)
16-20 25
4
Cotton Underwear plus
FR Shirt and FR Pants plus Double Layer
Switching Coat and Pants (4)
24-40 40
5. CONCLUSION
In this paper, thermal analysis using an infrared thermal camera and computer power flow analysis is presented to confirm the presence of any element overload in the distribution system and an industrial company. In addition, Arc Flash analysis is introduced followed by a hazard assessment and it is explained how to use a computer program for calculating inci-dent energy; working distance and personal protective equipment can be chosen to mitigate arch flash effects. Protection coordination of numerical relays, LV break-ers and fuses is very important and it is one of the ways to mitigate and reduce the risk of arc flash. A sample case was presented where presetting values of time current curves were not chosen and coordinated well so that it caused a high level of incident energy. After rearranging TCC presented in Fig. 15, incident energy was reduced and the risk of arc flash is mitigated.
6. ACKNOWLEDGMENT
The authors would like to thank the Distribution Company Novi Travnik as part of the Electric Power Company HZ-HB Inc. Mostar, Bosnia and Herzegovina, for the submitted network data.
7. REFERENCES:
[1] C. L. Brooks, “Integrating Arc-Flash Analysis: A Look
at Protective Device Coordination”, EEE Industry Ap-
plications Magazine, Vol. 20, No. 3, 2014, pp. 14-23.
[2] C. E. Davis, A Guide to Performing an Arc Flash
Hazard Assessment Using Power Analysis Soft-
ware, www.easypower.com/arc_flash/docs/Per-
forming_Arc_Flash_Hazard_Assessment.pdf (ac-
cessed: 2017)
[3] J. Lagree, Arc Flash Mitigation Techniques for Con-
siderations for System Design, www.easypower.
com/docs/Arc_Flash_Jim_Lagree_Eaton.pdf (ac-
cessed: 2017)
[4] Standard IEEE 1584-2002, IEEE Guide for Perform-
ing Arc-Flash Hazard Calculations, standards.ieee.
org/findstds/standard/1584-2002.html (accessed:
2017)
[5] NFPA 70E, Standard for Electrical Safety Require-
ments for Employee Workplaces, 2015 Edition, Na-
tional Fire Protection Association
[6] Occupational Safety and Health Standards,
29CFR, Part 1910, Subpart S, Electrical, www.osha.
gov/pls/oshaweb/owadisp.show_document?p_
table=STANDARDS&p_id=10135 (accessed: 2017)
[7] C. M. Wellman, “OSHA arc-flash injury data analy-
sis”, Proceedings of the IEEE IAS Electrical Safety
Workshop, Daytona Beach, Florida, USA, 31 Janu-
ary - 3 February 2012, pp. 1-5.
[8] Live working - Protective clothing against the
thermal hazards of an electric arc, Part 1-2: Test
methods, Method 2: Determination of arc protec-
tion class of material and clothing by using a con-
strained and directed arc, IEC 61482-1-2:200.
[9] S. Nikolovski, G. Knežević, D. Mlakić, “Smart Protec-
tion Device Coordination of Electrical Motor Drive
Facility Connected on Distribution Network”, Pro-
ceedings of 1st International Conference on Smart
Systems and Technologies, Osijek, Croatia, 12-14
October 2016, pp.141-147.
[10] C. St. Pierre, S. Shrestha, A. Majd, D. Castor, C. Da-
vis. R. Luo, M. Koch, Practical Solution Guide To Arc
Flash Hazards, easypower.com/downloads/Practi-
cal_Solution_Guide_to_Arc_Flash_Hazards.pdf
(accessed: 2017)
International Journal of Electrical and Computer Engineering Systems

57
[11] EasyPower 9.8, Software User’s Manual, Software LLC, version 9.7. Mohawk St, Tualatin, Oregon, 2016
[12] A. M. Graham, M. Hodder, G. Gates, “Current Meth-ods for Conducting An Arc-Flash Hazard Analysis”, IEEE Transactions on Industry Applications, Vol. 44, No. 6, 2008, pp. 1902-1909.
[13] C. Inshaw, R. A. Wilson, “Arc flash hazard analysis and mitigation”, Proceedings of the 58th Annual Conference for Protective Relay Engineers, College Station, Texas, USA, 5-7 April 2005, pp. 145-157.
[14] Arc Flash - A guide to standards and requirements for protective clothing, www.arcflashprotection.co.uk/wp-content/uploads/arc_flash_guide_v2.pdf (accessed: 2016)
Volume 8, Number 2, 2017