Embed Size (px)
Citation preview

Thermal behavior of some Estonian clays and their mixtureswith oil shale ash additives
Tiit Kaljuvee • Igor Stubna • Peeter Somelar •
Valdek Mikli • Rein Kuusik
Received: 31 October 2013 / Accepted: 26 March 2014
� Akademiai Kiado, Budapest, Hungary 2014
Abstract Thermal behavior of green clay samples from
Kunda and Arumetsa deposits (Estonia) as potential raw
materials for production of ceramics and the influence of
previously fired clay and hydrated oil shale ash additives
on it were the objectives of this research. Two different
ashes were used as additives: the electrostatic precipitator
ash from the first field and the cyclone ash formed,
respectively, at circulating fluidized bed combustion
(temperatures 750–830 �C) and pulverized firing (temper-
atures 1,200–1,400 �C) of Estonian oil shale at Estonian
Power Plant. The experiments on a Setaram Labsys Evo
1600 thermoanalyzer coupled with Pfeiffer OmniStar Mass
Spectrometer by a heated transfer line were carried out
under non-isothermal conditions up to 1,050 �C at the
heating rate of 5 �C min-1 in an oxidizing atmosphere
containing 79 % of Ar and 21 % of O2. Standard 100 lL Pt
crucibles were used, the mass of samples was
50 ± 0.5 mg, and the gas flow 60 mL min-1. The results
obtained indicate the complex character of transformations
and show certain differences in the thermal behavior of
Arumetsa and Kunda clays and their mixtures with oil
shale ashes depending on the chemical and mineralogical
composition of the clays as well as of the oil shale ashes
studied.
Keywords Clay � Oil shale ash � TG–DTA-MS � XRD
Introduction
Clays are the most common materials used in the tradi-
tional ceramic industry, and they are continuously the
objects of great interest.
Five samples of clay of Rosarno (South Italy) quarry
have been analyzed as possible materials for production of
ceramics by means of DSC, thermal analysis, XRD, and
X-ray fluorescence analyses methods [1]. The clays contain
quartz, illite, and oligoclase. It was shown that the endo-
thermic peaks at 100 and 500 �C correlated, respectively,
with the loss of interlay water and dehydroxylation of clay
‘‘matrix’’ of the samples. All the studied clay samples with
10–15 % kaolin additive are usable in a slip for single fired
red tiles, the optimum firing temperature being 1,000 �C.
In [2] a low-cost tile, the clay mixed with kaolin for
ceramic filters was evaluated. DTA curves of kaolin at the
heating rate of 50 �C min-1 had well-defined peaks at 595
and 1,034 �C corresponding to metakaolinite and mullite
formation, respectively. Kaolin addition to tile clay led to
an increase in melting temperature from 1,100 to 1,120 �C
and 1,132 �C, respectively, with 10 and 20 % of additive.
The shrinkage of samples was observed above 800 �C
indicating the beginning of pre-sintering of samples.
The effect of grinding on thermal behavior of pyro-
phyllite and talc, as commonly used clay minerals, was
investigated in [3]. TG and DTA results showed that
grinding caused a decrease in the temperature at which the
Electronic supplementary material The online version of thisarticle (doi:10.1007/s10973-014-3797-0) contains supplementarymaterial, which is available to authorized users.
T. Kaljuvee (&) � V. Mikli � R. Kuusik
Tallinn University of Technology, Ehitajate tee 5, 19086 Tallinn,
Estonia
e-mail: [email protected]
I. Stubna
Constantine the Philosopher University, A. Hlinku 1,
949 01 Nitra, Slovakia
P. Somelar
Tartu University, Vanemuise 46, Tartu, Estonia
123
J Therm Anal Calorim
DOI 10.1007/s10973-014-3797-0

structure bound OH group realized and enhanced the for-
mation of high-temperature phases. For the ground talc
samples, the crystallization of non-crystalline phase into
orthorhombic enstatite was observed in the range of
800 �C. For ground pyrophyllite, a certain agglomeration
of grains was observed above 950 �C.
Dweck has pointed out the importance of using simulta-
neous TG–DTA analyses methods to study clay samples of
different types and with different compositions (kaolinitic,
montmorillonitic, organofilic, etc.; clays rich of gibbsite,
quartz, organic matter, etc.) [4]. Most indicative are the DTG
peaks compared to DTA or DSC peaks at analyzing the
thermal decomposition steps of organophilic clays or natural
clays with organic matter, because the exothermic burnout
of organic matter and endothermic dehydration and dehy-
droxylation of mineral components takes place at the same
temperatures–between 200 and 550 �C.
The non-isothermal kinetics of mullite formation from
non-activated as well as from mechanically activated kao-
linite–alumina ceramic system have been studied in [5]. The
bulk nucleation and crystal growth steps in mullite crystal-
lization were observed. Alumina addition to kaolinite
increased the activation energy for the bulk nucleation step,
but had minor effect on the crystal growth step. Mechanical
activation of kaolinite or kaolinite–alumina system
decreased the activation energies for these steps from 1,148
to 1,003 kJ mol-1 and from 913 to 495 kJ mol-1, respec-
tively. Alumina addition to kaolinite in the activated system
had no effect on the bulk nucleation, but had an effect on the
crystal growth in mullite crystallization.
The dehydroxylation of a series of kaolinite clay min-
erals, kaolinite, halloysite, and dickite has been investi-
gated by the Fourier transform in situ infrared emission
spectroscopy over a temperature range of 100–800 �C in
[6]. Dehydroxylation was determined by the loss of
intensity of hydroxyl bands in the emission spectra
between 3,550 and 3,750 cm-1. The kaolinite clay mineral
loses the inner sheet and the inner hydroxyl group simul-
taneously, whereas dickite and halloysites are shown to
lose the outer hydroxyls, as evidenced by the intensity loss
of the 3,684 cm-1 peak, before the inner hydroxyl groups
with the following formation of a silanole group. This can
be determined by the intensity loss of the 3,620 cm-1 peak
and appearance of the hydroxyl band at 3,730 cm-1. It is
proposed that the dehydroxylation process for kaolinite
takes place homogeneously throughout according to two
mechanisms, and this for dickite and halloysite in steps,
with the first hydroxyl-loss homogeneously and the second
one non-homogeneously.
The effect of dehydroxylation degree on pozzolanic
activity of kaolinite was studied in [7]. It was found that the
dehydroxylation is accompanied with the kaolinite amor-
phization, which affects the pozzolanic activity. At the Ta
ble
1M
iner
alo
gic
alco
mp
osi
tio
n(%
)o
fin
itia
lsa
mp
les
and
ble
nd
s
Sam
ple
Am
or-
phous
conte
nt
Quar
tz,
SiO
2
Ort
ho-
clas
e,
KA
lSi 3
O8
Pla
gio
-
clas
e,
Na,
CaA
l
Si 3
O6
Cal
cite
,
CaC
O3
Lim
e,
CaO
Dolo
mit
e,
CaM
g
(CO
3) 2
Per
icla
se,
MgO
Pyri
te,
FeS
2
Hem
atit
e,
Fe 2
O3
Kao
lin,
Al 2
Si 2
O5
(OH
) 4
Illi
te,
illi
te–
smec
tite
,
mic
a,
KA
l 2(A
lSi 3
O1
0)(
OH
) 2
Am
phip
ole
,
NaC
a 2(F
e2?
,F
e3?
)
Si 6
Al 2
O2
2(O
H) 2
Chlo
rite
,
(Mg,
Al,
Fe)
6(S
i,
Al)
4O
10
(OH
) 6
Gypsu
m,
CaS
O4
*2H
2O
Anhydri
te,
CaS
O4
Spin
el,
MgA
l 2O
3
Port
landit
e,
Ca(
OH
) 2
Aru
met
saC
lay
(A)
–18.5
3.8
5.3
0.6
–2.1
––
1.2
11.6
48.9
1.6
4.9
––
––
A?
20
%fi
red
A ?20
%E
SP
A
I,H
32.4
16.3
5.8
4.2
2.0
0.4
1.0
0.6
–1.5
6.7
19.5
0.7
2.7
–0.7
2.0
1.4
A?
20
%fi
red
A?
20
%C
A,
H
23.3
16.9
1.3
2.3
2.1
1.2
1.1
0.9
–3.6
7.9
27.3
0.6
2.5
–1.4
3.6
2.9
Kunda
clay
(K)
–27.2
5.2
–0.2
––
–0.8
–7.0
51.1
–5.0
1.2
––
–
K?
20
%fi
red
K ?20
%E
SP
A
I,H
25.3
24.4
5.5
–1.8
0.5
–0.5
0.6
1.3
3.2
25.9
–3.8
0.8
1.4
1.1
1.1
K?
20
%fi
red
K?
20
%C
A,
H
8.8
28.4
10.4
–2.6
1.4
–0.8
0.4
0.9
2.3
32.4
–4.6
1.1
2.5
2.9
3.3
T. Kaljuvee et al.
123
calcination temperatures below 450 �C, kaolin clays
showed relatively low level of the dehydroxylation degree,
less than 0.18. In the range from 450 to 570 �C, the degree
of dehydroxylation sharply increased to 0.95, and finally at
the temperatures between 570 and 700 �C, the kaolinite
was fully dehydroxylated.
Table 2 Chemical composition (%) and some physico-chemical characteristics of initial samples
Item samples CaO
total
CaO
free
MgO SiO2 Al2O3 Fe2O3 SO3
total
K2O Na2O LOI Corg BET
SSA, m2 g-1Porosity,
mm3 g-1dmean,
lm
Arumetsa clay 1.5 – 2.7 56.5 18.4 6.8 0.08 4.5 0.58 6.9 0.32 44.71 77.63 12.7
Kunda clay 0.4 – 2.3 61.4 17.8 5.9 1.68 6.0 0.08 4.8 0.21 30.86 51.87 15.1
CFBC/ESPA 1 30.7 9.0 4.5 34.4 8.6 4.2 4.35 4.5 0.19 5.6 – 3.67 5.94 32.5
PF/CA 51.6 22.7 4.9 24.5 6.4 3.9 3.37 2.0 0.14 1.5 – 0.91 1.69 55.8
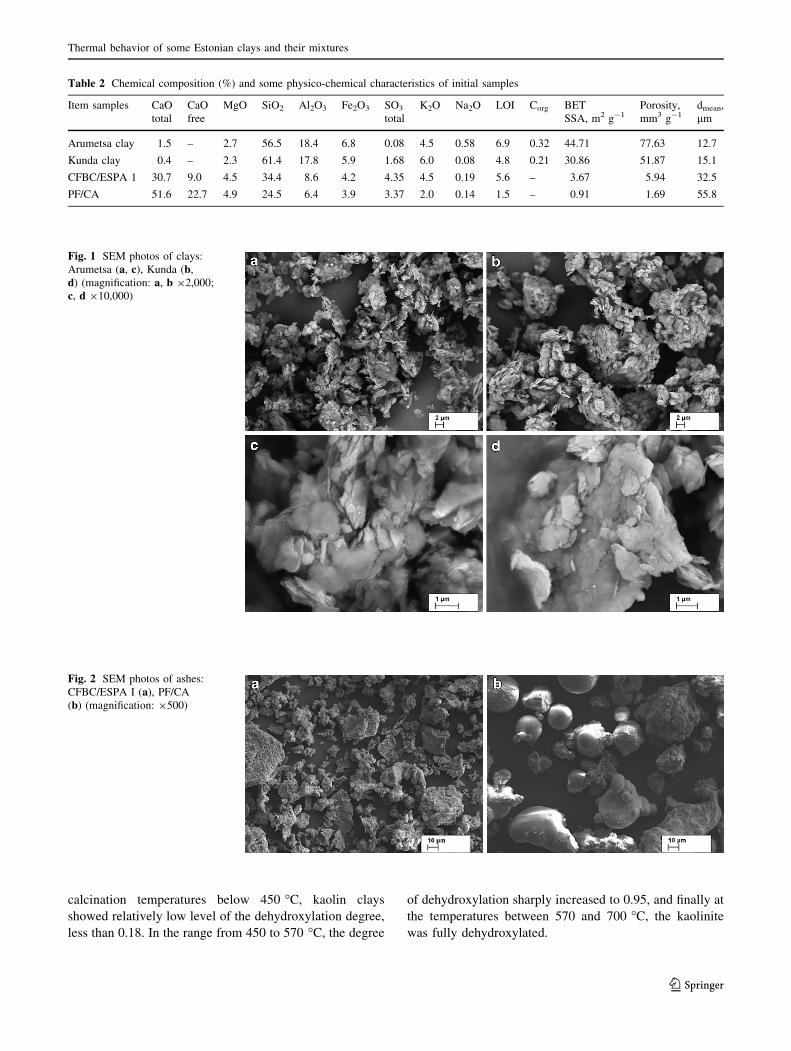
Fig. 1 SEM photos of clays:
Arumetsa (a, c), Kunda (b,
d) (magnification: a, b 92,000;
c, d 910,000)
Fig. 2 SEM photos of ashes:
CFBC/ESPA I (a), PF/CA
(b) (magnification: 9500)
Thermal behavior of some Estonian clays and their mixtures
123

The effect of mineralogy on the pozzolanic activity of
thermally treated kaolin was studied in [8]. It was estimated
that the pozzolanic activity of metakaolinite is strongly related
to the crystallinity of the original kaolinite: well-ordered
kaolinite is transformed in less reactive metakaolinite.
The decomposition behavior of kaolin [9] and Ocma-
type bentonite [10] samples has been studied using
simultaneous TG–DTA. New layer-structure formation
during the calcination process of kaolin was found, and
metakaolin compound was detected between 600 and
900 �C [9]. At thermal treatment of bentonite, the mass
loss regions related to the dehydration and dehydroxylation
process were determined, respectively, between 20–80 �C
and 290–686 �C [10].
In [11], it was shown that the crystallinity and porosity
of smectite, contained in bentonites as the major clay
mineral, are reduced greatly by thermal treatment. It was
found that the change at dehydration up to 400 �C is
reversible, but becomes after heating above 600 �C irre-
versible. The crystal structure of smectite collapses irre-
versibly at 900 �C.
The influence of firing rate on thermal behavior of
commercial kaolin was studied in [12]. Kaolinite dehydr-
oxylation, metakaolinite structure change, exothermic
structural organization, and mullite formation were found
to be very sensitive to the heating rate. The formation of
mullite increased with increase in the firing rate.
Analogous data about thermal behavior of Estonian
clays as potential raw materials for production of ceramics
are missing. Therefore, the aim of this research was to
study thermal behavior of Estonian clays from the two
biggest deposits (Arumetsa and Kunda ones) and the
influence of oil shale ash additives on the thermal behavior
of clays in oxidizing atmosphere. The amount of oil shale
ashes formed at electricity production in Estonia is on the
annual level of 5–6 million tons. Reuse of these ashes is
very limited–only 5 %, mostly, in the cement industry and
in the production of building blocks. One new possibility of
utilization of these ashes could be their application in
ceramic industry.
Experimental
Materials
The mineralogical and chemical composition of clays and
oil shale ashes studied are presented in Tables 1 and 2.
Arumetsa and Kunda clays are characterized by high
content of illite ? illite–smectite ? mica—48.9 % and
51.1 % and quartz—18.5 % and 27.2 %, respectively.
Kaolin, orthoclase, and calcite are also present in both
clays, but plagioclase and dolomite only in Arumetsa and
gypsum, and pyrite in Kunda clay (Table 1). The content of
organic carbon in Arumetsa and Kunda clay is 0.32 and
0.21 %, respectively (Table 2). Arumetsa clay is charac-
terized, as compared to Kunda one, by higher BET specific
surface area (SSA)–44.71 and 30.86 m2 g-1 and porosity–
77.63 and 51.87 mm3 g-1, and smaller mean particle size–
12.7 and 15.1 lm, respectively (Table 2). These differ-
ences are well observed in the scanning electron micro-
scope (SEM) photos (Fig. 1).
Two different types of oil shale ashes were used as
additives: the electrostatic precipitator ash from the first
1
0
–1
–2
–3
–4
–5
–6
–7
–8
Exo
DT
G/%
°C
–1D
TA/µ
vT
G/%
Exo
DT
G/%
°C
–1
Ion
curr
ent/A
Ion
curr
ent/A
Ion
curr
ent/A
DTA
/µv
TG
/%
0
–0.5
–1
–1.5
–2
–2.5
–3
–3.5
–4
–4.5
–5
1.00E–10
8.01E–11
8.01E–11
1.8E–12
1.6E–12
1.4E–12
1.2E–12
1E–12
8E–13
6E–13
4E–13
2E–13
7.01E–11
6.01E–11
5.01E–11
4.01E–11
3.01E–11
2.01E–11
1.01E–11
1.00E–13
6.01E–11
4.01E–11
2.01E–11
1.00E–130 200 400 600 800 1000Temperature/°C Temperature/°C
Temperature/°C
975
0 200 400 600 800 1000
0 200 400 600 800 1000
82 658
497
500
658H2O
306508
CO
320 691 TG
DTA
DTG
119
255
421
501
115
DT
501
DTA
516
H2O
SO2CO2
TG
688
SO2
CO2
206 C
383 C
823 C
448 C
a b c
Fig. 3 Thermoanalytical curves and emission profiles of gaseous compounds evolved at thermal treatment of Arumetsa (a) and Kunda (b,
c) clays
T. Kaljuvee et al.
123

field (CFBC/ESPA I) and the cyclone ash (PF/CA) formed,
respectively, at circulating fluidized bed combustion
(CFBC) at temperatures 750–830 �C and pulverized firing
(PF) at temperatures 1,200–1,400 �C of Estonian oil shale
(OS) at Estonian Power Plant.
The ashes studied differ in their chemical composition
(CaOfree = 9.0 and 22.7 %, MgO = 4.5 and 4.9 %,
CaO = 30.7 and 51.6 %, SO3 = 4.4 and 3.4 %, and
SiO2 = 34.4 and 24.5 %) for ESPA I and CA, respectively,
and grain-size composition (Table 2). For ESPA I, the
mean particle size is 32.5 and for CA 55.8 lm. The BET
SSA for ESPA I and CA is 3.67 and 0.91 m2g-1, and
porosity 5.94 and 1.69 mm3 g-1, respectively (Table 2).
ESPA I, which is formed at moderate temperatures, is
characterized by particles of irregular shape and porous
surface (Fig. 2a), because particle temperature does not
rise to the level which is necessary to form molten phase.
In the case of CA, molten phase plays an important role in
the formation of particle shape, and surface properties–
particles are characterized by a regular round shape and
smooth surface (Fig. 2b).
The blends studied contained 60 % of green clay,
20 % of fired clay (at 1,050 �C 60 min), and 20 % of
CFBC/ESPA I or PF/CA previously hydrated. The main
mineral phases in these blends, in addition of these
originated from clays, are anhydrite, portlandite, lime,
periclase, and different silicates like belite, melilite,
merwinite, spinel, and adularia originated from ashes.
The content of amorphous phase is between 8.8 and
32.4 % (Table 1).
Methods
The experiments with a Setaram Labsys Evo 1600 ther-
moanalyzer coupled with Pfeiffer OmniStar Mass Spec-
trometer by a heated transfer line were carried out under non-
isothermal conditions by heating up to 1,050 �C at the rate of
5 �C min-1 in an oxidizing atmosphere which contained
79 % of Ar and 21 % of O2. Standard 100 lL Pt crucibles
were used, the mass of samples was 50 ± 0.5 mg, and the
gas flow 60 mL min-1. For reproducibility, all experiments
were performed twice. Prior to experiments, the equipment
was calibrated for temperature readings with calcium oxalate
monohydrate.
XRD analysis was performed with Bruker D8 Advanced
Diffractometer employing Cu Ka radiation and collecting
data in the range of 2h from 10 to 60�. The surface
observations were carried out with scanning electron
microscope Jeol JMS-8404A, BET SSA, and porosity
measurements with Sorptometer Kelvin 1,042 and the
particle size distribution on the analyzer Partica LA-
950V2.Ta
ble
3M
ass
loss
esan
dp
eak
ste
mp
erat
ure
sat
DT
G,
DT
A,
and
evo
lved
gas
eou
sco
mp
ou
nd
s(M
S:
H2O
,C
O2,
SO
2)
curv
esfo
rth
esa
mp
les
Sam
ple
Mas
s
loss
up
to
25
0�C
/
%
DT
G/D
TA
/MS
/
�CT
emp
.
ran
ge/
�C
Mas
s
loss
/
%
DT
G/D
TA
/MS
/�C
Tem
p.
ran
ge/
�CM
ass
loss
/
%
DT
G/D
TA
/MS
/�C
To
tal
mas
s
loss
up
to
1,0
50
�C/
%
Aru
met
sacl
ay(A
)1
.75
82
,1
56
sh/
98
/H2O
-82
25
0–
63
54
.72
49
7/5
08
,5
75
sh/H
2O
-30
6,
50
0;
CO
2-
32
0
63
5–
10
50
1.4
56
58
,6
88
/65
8,
97
5/C
O2-
69
1
7.9
2
A?
20
%fi
red
A?
20
%E
SP
AI,
H
2.3
79
4/9
5/H
2O
-94
25
0–
59
03
.04
43
6,
48
5/4
40
,5
00
,5
79
sh/H
2O
-43
9,
48
9;
CO
2-3
50
59
0–
10
50
2.0
36
91
/66
5/C
O2-6
95
7.4
4
A?
20
%fi
red
A?
20
%C
A,H
0.8
29
4/-
/H2O
-90
25
0–
59
03
.44
43
6,
49
3/4
35
,5
00
,5
79
sh/H
2O
-43
5,
49
0;
CO
2-3
25
59
0–
10
50
2.4
46
95
/69
1/C
O2-7
02
6.7
0
Ku
nd
aC
lay
(K)
0.5
51
15
,16
1sh
,21
6sh
/
11
9/H
2O
-11
5
25
0–
68
03
.30
39
4,
50
1/4
21
,5
16
,5
68
sh/H
2O
-
34
0sh
,50
1;
CO
2-2
06
,3
83
;S
O2-4
48
68
0–
10
50
0.9
67
91
/75
0sh
/SO
2-8
23
4.8
1
K?
20
%fi
red
K?
20
%E
SP
AI,
H
2.2
79
0/-
/H2O
-90
25
0–
58
02
.15
44
0,
50
4/4
37
,5
20
,5
75
/H2O
-34
4sh
,
43
7,
49
7sh
;C
O2-3
33
58
0–
10
50
1.8
26
58
/65
8sh
/CO
2-6
58
6.2
4
K?
20
%fi
red
K?
20
%C
A,H
0.5
11
11
/11
9sh
/
H2O
-11
1
25
0–
58
02
.29
43
2,
50
8/4
36
,5
20
,5
76
sh/H
2O
-34
8,
43
6,
48
9;
CO
2-3
40
58
0–
10
50
1.8
46
72
/66
2sh
/CO
2-6
80
4.6
4
Sh
sho
uld
er
Thermal behavior of some Estonian clays and their mixtures
123

Results and discussion
Thermal and MS analysis
The results of thermal analysis of clays up to 250–265 �C
indicated the emission of physically bound water and in the
case of Kunda clay, also the crystal water from dehydration of
gypsum (Fig. 3a, b, Table 3). In the temperature range from
250–265 �C to 580–680 �C, the emission of H2O was caused
by dehydroxylation of illite, illite–smectite, mica, and kaolin
[2, 4, 7–9]. The emission of carbon dioxide was a result of
thermooxidation of organic matter. In addition, at heating of
Kunda clay, emission of SO2 was noticed (Fig. 3c) related to
thermooxidation of pyrite [13–15]. In the temperature range
from 550–680 �C to 900 �C, the mass loss was caused by
continuing dehydroxylation processes, but in a greater extent,
by decomposition of dolomite and calcite (Fig. 3a, b,
Tables 1, 3). The endothermic peak or shoulder in DTA
curves around 568–579 �C (Table 3) is characteristic to the a-
b quartz transformation [4, 16] and the exothermic peak with
maximum at 975 �C to the mullite crystallization [7, 16]
(Fig. 3a, Table 3). With Kunda clay, also the emission of SO2
from the second step of pyrite thermooxidation added to the
mass loss (Fig. 3c, Table 3). At that, the emission of CO2
from Kunda clay was quite modest, as the content of calcite in
Kunda clay is only on the level of 0.2 % (Table 1). The total
mass loss up to 1,050 �C was for Arumetsa 7.9 % and for
Kunda clay 4.8 % (Fig. 3a, b, Table 3).
Temperature/°C Temperature/°C
0
–1
–2
–3
–4
–5
–6
–7
–8
Exo
DT
G/%
°C
–1D
TA/µ
vT
G/%
0
–1
–2
–3
–4
–5
–6
–7
Exo
DT
G/%
min
–1D
TA/µ
vT
G/%
1.60E–10
1.40E–10
1.20E–10
1.00E–10
8.03E–11
6.03E–11
4.03E–11
2.03E–11
3.00E–13
Ion
curr
ent/A
1.60E–10
1.40E–10
1.20E–10
1.00E–10
8.03E–11
6.03E–11
4.03E–11
2.03E–11
3.00E–13
Ion
curr
ent/A
H2O
CO2
H2O
CO2
TG
TG
DTGDTG
0 500 1000 0 500 10007
658440
DTA
90
658
527438
437
333 658350 695
439
500
665
489
440
DTA
691485
436
94
a bFig. 4 Thermoanalytical curves
and emission profiles of gaseous
compounds evolved at thermal
treatment of mixtures of
Arumetsa clay (60 %) ? fired
Arumetsa (20 %) ? hydrated
ESPA I (20 %) (a) and Kunda
clay (60 %) ? fired Kunda
(20 %) ? hydrated ESPA I
(20 %) (b)
0
–1
–2
–3
–4
–5
–6
–7
–8
Exo
DT
G/ °
C–1
DTA
/µv
TG
/%
Exo
DT
G/%
°C
–1D
TA/µ
vT
G/%
0
–0.5
–1
–1.5
–2
–2.5
–3
–3.5
–4
–4.5
–5
Temperature/°C Temperature/°C
1.20E–10
1.00E–10
1.00E–10
8.03E–11
6.03E–11
4.03E–11
2.03E–11
3.00E–13
8.01E–11
6.01E–11
4.01E–11
2.01E–11
1.00E–13
Ion
curr
ent/A
Ion
curr
ent/A
0 500 1000DTG
49394
436695
435
DTA
691490
50043590
325 702H2O
CO2
TG
DTA
H2O
CO2
TG
5000 1000
DTG111
672
436
432
662111
348
437
340 680
520
a bFig. 5 Thermoanalytical curves
and emission profiles of gaseous
compounds evolved at thermal
treatment of mixtures of
Arumetsa clay (60 %) ? fired
Arumetsa (20 %) ? hydrated
CA (20 %) (a) and Kunda clay
(60 %) ? fired Kunda
(20 %) ? hydrated CA (20 %)
(b)
T. Kaljuvee et al.
123

At thermal treatment of mixtures containing, for
example, 60 % of clay, 20 % of fired clay, and 20 % of
previously hydrated ash, some remarkable differences can
be followed. First, the well-fixed endotherms with the
minimums in DTA curves which correspond to the maxi-
mums in the H2O emission profiles at 439 and 437 �C for
the mixtures with Arumetsa and Kunda clay with ESPA I
(Fig. 4a, b, Table 3) and at 435 and 436 �C with CA
(Fig. 5a, b, Table 3), respectively, indicate the decompo-
sition of portlandite; and second, SO2 was not present in
the evolved gasses.
At that, the characteristic peaks in H2O profiles for the
compositions with CA are more intensive, because the
content of free CaO in CA is twice as high as in ESPA
(Table 2), and, consequently, also the content of Ca(OH)2
formed at hydration of ashes is higher. CO2 profiles in the
temperature range between 250–265� and 550–680 �C are
less intensive for compositions with ash additives (Figs. 3–
5), because the ashes do not contain organic matter [17],
and CO2 formed at thermooxidation of organics in clays
can be partly bound into solid phase by Ca(OH)2 or by free
CaO, formed at decomposition of portlandite, giving sec-
ondary calcite [18, 19]. At temperatures higher than
600 �C, in contrary, the CO2 profiles are more intensive as
compared to these for clays due to decomposition of
additional amount of carbonates contained in the ashes
(Table 1) and secondary CaCO3 formed at lower
temperatures.
The absence of SO2 in the evolved gasses is caused by
its total binding into solid phase by free CaO with the
formation of anhydrite [20] (Tabel 4) which does not
decompose at temperatures below 1,050 �C.
The total mass loss up to 1,050 �C for the mixtures with
Arumetsa and Kunda clay with ESPA I additive was 7.4
and 6.2 % (Fig. 4a, b, Table 3) and with CA additive 6.7
and 4.6 %, respectively (Fig. 5a, b, Table 3).
Therefore, at thermal treatment of Estonian clays stud-
ied, they followed similar route of decomposition of clays:
emission of physically bound water, thermooxidation of
organic matter and dehydroxylation of clay minerals,
decomposition of carbonates, and with Kunda clay, in
addition, thermooxidation of pyrite. The oil shale ash
additives reduce the amount of carbon dioxide formed and
emitted at thermooxidation of organic matter and exclude
the emission of sulfur dioxide formed at thermooxidation
of pyrite.
XRD analysis and physical–chemical characteristics
Essential changes can be observed in the mineralogical
composition of fired clays as compared with the initial
ones (Tables 1, 4). First of all, the clay samples fired up to
1,050 �C contain considerable amount of amorphous Ta
ble
4M
iner
alo
gic
alco
mp
osi
tio
n(%
)o
fth
erm
ally
trea
ted
sam
ple
s
Sam
ple
Am
orp
hous
conte
nt
Quar
tz,
SiO
2
Pla
gio
clas
e,
Na,
CaA
lSi 3
O6
Per
icla
se,
MgO
Hem
atit
e,
Fe 2
O3
Anhydri
te,
CaS
O4
Bel
ite,
Ca 2
SiO
4
Spin
el,
MgA
l 2O
3
San
idin
,
KA
lSi 3
O8
Aker
man
ite,
CaM
gS
i 2O
7
Mull
ite,
Al 6
Si 2
O1
3
Woll
asto
nit
e,
CaS
iO3
Dio
psi
de,
CaM
gS
i 2O
6
Sil
lim
anit
e,
Al 2
SiO
5
Aru
met
sacl
ay(A
);1,0
50
�C38.6
13.3
3.7
–15.2
––
15.1
2.9
–7.5
––
1.7
A?
20
%fi
red
A?
20
%C
A,
H;
1,0
50
�C48.7
7.9
10.4
0.7
10.3
1.3
1.9
5.3
4.9
5.3
0.8
1.0
––
A?
20
%fi
red
A?
20
%E
SP
AI,
H;
1,0
50
�C47.1
10.8
8.2
0.8
9.7
1.6
0.8
7.8
3.0
1.8
1.4
2.2
4.1
–
Kunda
clay
(K),
1,0
50
�C58.9
16.9
––
5.7
––
9.5
6.6
–T
R–
–1.5
K?
20
%fi
red
K?
20
%C
A,
H;
1,0
50
�C52.1
15.7
5.5
TR
5.8
2.0
0.5
6.6
6.3
1.7
0.7
1.6
1.4
–
K?
20
%fi
red
K20
%E
SP
AI,
H;
1,0
50
�C45.5
15.3
8.1
0.5
5.0
1.7
2.1
5.3
4.6
5.6
–2.0
2.9
–
Thermal behavior of some Estonian clays and their mixtures
123

matter—38.6 % in fired Arumetsa and 58.9 % in Kunda
clay. Kaolin, illite, illite–smectite, and mica as well as
dolomite, calcite, and pyrite are completely decomposed,
and the content of quartz is remarkably decreased
(Table 4).
In the fired clays, different secondary minerals like
mullite and sillimanite are present, formed at the
decomposition of primary minerals, as well as spinel,
formed as a result of reactions between quartz and the
decomposition products of primary minerals [21]
(Table 4). Orthoclase and adularia are replaced with higher
temperature polymorph—sanidin. The increase in hematite
content in the fired clays as well as in blends resulted from
thermooxidation of pyrite and decomposition of amphipole
and chlorite is also remarkable.
In addition, the fired blends with ash additives can be
characterized by high content of amorphous matter of about
45–52 % and, as compared with fired clay samples, forma-
tion of different Ca and Mg silicates like wollastonite, and
ackermanite and diopside formed as a result of reactions
between periclase and the products of decomposition of
primary minerals. The presence of anhydrite is resulted from
reactions between sulfur dioxide formed at thermooxidation
of pyrite and portlandite (and free CaO) contained in oil
shale ashes. The fired blends are also characterized by higher
content of plagioclase and sanidin, lower content of mullite
and spinel, and the absence of sillimanite (Table 4).
Considerable changes in the physical–chemical character-
istics of different compositions take place during their heat-
ing up to 1,050 �C: BET SSA decreases from 20–31 m2 g-1
to 0.7–1.1 m2 g-1 and porosity from 36–47 m3 g-1 to
0.8–1.0 mm3 g-1 (Table 5). It can be explained by the for-
mation of amorphous matter and interparticle sintering,
which cause the filling and closing of micro- and mesopores,
and can be well observed in SEM photos (Fig. 6).
Table 5 BET SSA and porosity of samples
Sample SSA/
m2 g-1Porosity/
m3 g-1
Initial samples and compositions
Arumetsa clay (a) 44.71 77.63
Arumetsa ? 20 % fired A ? 20 %CA 28.87 40.40
Arumetsa ? 20 % fired A ? 20 %ESPA I, H 28.00 46.74
Kunda clay (K), 30.86 51.87
Kunda ? 20 % fired K ? 20 %CA, HC 19.94 37.78
Kunda ? 20 % fired K 20 %ESPA I, H 21.78 36.04
Samples and compositions heated up to 1050 �c
Arumetsa clay 0.84 0.98
Arumetsa ? 20 % fired A ? 20 %CA, H 0.85 0.78
Arumetsa ? 20 % fired A ? 20 %ESPA I, H 1.13 1.01
Kunda clay 0.94 0.95
Kunda ? 20 % fired K ? 20 %CA, HC 0.70 0.92
Kunda ? 20 % fired K 20 %ESPA I, H 1.01 0.89
Fig. 6 SEM photos of
compositions: Kunda clay
(60 %) ? fired Kunda
(20 %) ? PF/CA (20 %),
initial (a) and fired up to
1,050 �C (b); Arumetsa clay
(60 %) ? fired Arumetsa
(20 %) ? CFBC/ESPA I
(20 %), initial (c) and fired up
to 1,050 �C (d) (magnification:
910,000)
T. Kaljuvee et al.
123

So, certain differences can be observed in the changes of
mineralogical composition and in the physical–chemical
characteristics of samples at their thermal treatment
depending on the origin and composition of initial samples.
Conclusions
At thermal treatment of Arumetsa and Kunda, green clays
and their mixtures with OS ash additives, emission of
physically bound water, water originated from dehydr-
oxylation of clay minerals, and carbon dioxide formed at
thermooxidation of organic matter were fixed. In addition,
carbon dioxide was formed due to decomposition of car-
bonates. In the case of Kunda clay, the emitted water can
partly be related to dehydration of gypsum and sulfur
dioxide to two-step thermooxidation of pyrite.
The clay mixtures with OS ash additives emitted water
also during decomposition of portlandite. There were no
sulfur dioxide emissions from the blends based on Kunda
clay due to its complete binding into solid phase. The
results of XRD analysis enabled to describe the changes in
the mineralogical composition of the samples that take
place during their thermal treatment.
The results obtained indicate the complex character of
transformations and show certain differences in the thermal
behavior of Arumetsa and Kunda clays and their blends
with OS ash depending on the chemical and mineralogical
composition of the clays and ashes studied.
Acknowledgements This study was supported by Estonian
Research Council Targeted Financing Project SF0140082s08 and by
Archimedes project 3.2.0501. 10.0002.
References
1. Nastro V, Vuono D, Guzzo M, Niceforo G, Bruno I, De Luca P.
Characterisation of raw materials for production of ceramics.
J Therm Anal Calorim. 2006;84:181–4.
2. Albuquerque FR, Parente B, Lima SJG, Paskocimas CA, Longo
E, Souza AG, Santos IMG, Rernandes VJ Jr. Thermal transfor-
mations of tile clay before and after kaolin addition. J Therm
Anal Calorim. 2004;75:677–85.
3. Balek V, Perez-Maqueda LA, Poyota J, Cerny Z, Ramirez-Valle
V, Buntseva IM, Perez-Rodriguez JL. Effect of grinding on
thermal reactivity of ceramic clay minerals. J Therm Anal Cal-
orim. 2007;88:87–91.
4. Dweck J. Qualitative and quantitative characterization of Bra-
zilian natural and organophilic clays by thermal analysis. J Therm
Anal Calorim. 2008;92:129–35.
5. Elmas E, Yildiz K, Toplan N, Ozkan Toplan H. The non-iso-
thermal kinetics of mullite formation in mechanically activated
kaolinite-alumina ceramic system. J Therm Anal Calorim. 2012;
108:1201–6.
6. Frost RL, Vassallo AM. The dehydroxylation of kaolinite clay
minerals using infrared emission spectroscopy. Clays Clay Miner.
1996;44:635–51.
7. Shvarzman A, Kovler K, Grader GS, Shter GE. The effect of
dehydroxylation/amorphization on pozzolanic activity of kaolin-
ite. Cem Concr Res. 2003;33:405–16.
8. Kakali G, Perraki T, Tsivilis S, Badogiannis E. Thermal treat-
ment of kaolin: the effect of mineralogy on the pozzolanic
activity. Appl Clay Sci. 2001;20:73–80.
9. Wang H, Li C, Peng Z, Zhang S. Characterization and thermal
behavior of kaolin. J Therm Anal Calorim. 2011;105:157–60.
10. Kok MV. Thermal analysis and rheological study of Ocma type
bentonite used in drilling fluids. Energy Sources A. 2013;35:
122–33.
11. Onal M, Sarikaya Y. Thermal behavior of a bentonite. J Therm
Anal Calorim. 2007;90:167–72.
12. Castelein O, Soulestin B, Bonnet JP, Blanchart P. The influence
of heating rate on the thermal behaviour and mullite formation
from a kaolin raw material. Ceram Int. 2011;27:517–22.
13. Jorgensen FRA, Moyle FJ. Phases formed during the thermal
analysis of pyrite in air. J Therm Anal Calorim. 1982;25:473–85.
14. Paulik F, Paulik J, Arnold M. Kinetics and mechanism of
decomposition of pyrite under conventional and quasi-isother-
mal–quasi-isobaric thermoanalytical conditions. J Therm Anal
Calorim. 1982;25:313–25.
15. Pelovski Y, Petkova V. Investigation on thermal decomposition
of pyrite. J Therm Anal Calorim. 1999;56:95–9.
16. Faria KCP, Holanda JNF. Thermal study of clay ceramic pastes
containing sugarcane bagasse ash waste. J Therm Anal Calorim.
2013;114:27–32.
17. Kuusik R, Uibu M, Kirsimae K. Characterization of oil shale ashes
formed at industrial-scale CFBC boilers. Oil Shale. 2005;22:407–19.
18. Kaljuvee T, Trikkel A, Kuusik R. Decarbonization of natural
lime-containing materials and reactivity of calcined products
towards SO2 and CO2. J Therm Anal Calorim. 2001;64:1229–40.
19. Kaljuvee T, Kuusik R, Trikkel A. SO2 binding into the solid
phase during thermooxidation of blends based on Estonian oil
shale semicoke. J Therm Anal Calorim. 2003;72:393–404.
20. Kaljuvee T, Toom M, Trikkel A, Kuusik R. Reactivity of oil shale
ashes in the binding of SO2. J Therm Anal Calorim. 2007;88:51–8.
21. Aras A. The change of phase composition in kaolinite- and illite-
rich clay-based ceramic bodies. Appl Clay Sci. 2004;24:257–69.
Thermal behavior of some Estonian clays and their mixtures
123