Embed Size (px)
Citation preview
(Gosling et al., 2009; Petralli et al., 2012; Kilbourne,1997). As Basu and Samet (2002) state, people liv-ing in urban areas have a higher risk of death duringheat waves than those living in rural areas due to theUrban Heat Island Effect. Furthermore, the moretemperature increases, the more consumption ofenergy increases since it becomes necessary to coolindoor spaces for a better comfort. This causes sev-eral effects like a higher demand for electricity,higher pollution, higher urban footprint and finallyreflects also in human discomfort and health prob-lems (Hassid et al., 2000; Santamouris et al., 2001;Cartalis et al., 2001; Santamouris et al., 2007;Stathopoulou et al., 2008). In the last few years,many authors have focused more attention to theintra-urban air temperature difference respect tothat one between urban and rural areas (Arnfield,
Thermal comfort and green areas in FlorenceMartina Petralli1,2,*, Giada Brandani1,2, Marco Napoli1,2, Alessandro Messeri1,2, Luciano Massetti3
Ital
ian
Jour
nal o
f Agr
omet
eoro
logy
- 2/
2015
Riv
ista
Ita
liana
di A
grom
eteo
rolo
gia
- 2/2
015
39
1. INTRODUCTIONThe temperature difference between urban andrural areas has been investigated all over the world(Oke, 1976; Bottyan et al., 2005; Unger, 2004; Yan etal., 2010). Several studies have evidenced that urbanmorbidity and mortality in summer are becomingincreasing problems due both to the high tempera-tures that can occur during summer in the urbanenvironment and to the high population density
Abstract: Thermal comfort in urban environment is one of the major issue that future planning authorities will arguein the next years. It is well known that urban design at the micro-scale can influence human thermal comfort. In thelast few years many authors have underlined the effect of the presence of green or high albedo materials on thermalcomfort together with pedestrian heat stress. But it is not easy to translate the climate language into planning tools tobe applied by urban planners. This study aims at quantifying the amount of hours, during the summer period, ofthermal discomfort in the city of Florence in order to support planners to identify the needs of the city. Another purposeis to investigate the relationship between hours of thermal comfort and percentage of green area in the surroundings.Three biometeorological indices widely used to express thermal comfort in Italy (Steadman Apparent TemperatureIndex, Humidex, and Thom Discomfort Index) were calculated in 15 places in Florence urban area during Summer2010. Results of this study quantify the difference in terms of thermal comfort that it is possible to find during thesummer period in the city of Florence according to the biometeorological indices used, as well as the benefits in termsof thermal comfort of a 10% increase of green in an area of 250 m radius.Keywords: biometeorology, thermal comfort, urban green, microclimate, biometeorological indices.
Riassunto: Il benessere termico in ambiente urbano rappresenta uno dei temi principali che gli amministratori e gliurbanisti dovranno affrontare nei prossimi anni. È ormai noto, infatti, che il disegno delle infrastrutture urbane puòinfluenzare il benessere termico della popolazione. Sono infatti numerosi gli studi che a livello internazionale hannosottolineato l’importanza delle aree verdi o dell’uso di materiali con elevati valori di albedo sul benessere/disagio termicosui pedoni. Ma il trasferimento delle conoscenze e del linguaggio climatico in strumenti utili ai pianificatori è tutt’oggirelativamente difficile. Questo lavoro mira a quantificare le ore di disagio termico durante il periodo estivo nella cittàdi Firenze, al fine di fornire informazioni utili che possano supportare i pianificatori e gli amministratorinell’identificazione delle caratteristiche e delle esigenze della città. Un secondo scopo è quello di valutare la relazionetra ore di disagio termico estivo e presenza di aree verdi nelle vicinanze. A tal fine, in 15 zone della città di Firenze,sono state quantificate le ore di disagio termico registrate durante l’estate 2010 utilizzando tre indici biometeorologicicomunemente usati in Italia per la valutazione del disagio termico estivo, l’Apparent temperature di Steadman, l’indiceHumidex e l’indice di Thom. I risultati sono utili a quantificare le differenze, in termini di benessere/disagio termico,che si possono registrare durante il periodo estivo all’interno della città di Firenze, e l’effetto che un aumento del 10%di area verde in un’area di 250 metri di raggio può determinare in termini di benessere termico.Parole chiave: biometeorologia, benessere termico, verde urbano, microclima, indici biometeorologici.
Nomenclature of term used: AT: Apparent Temperature Index (°C); H: Humidex (°C); DI: Thom Discomfort Index (°C);T: Air temperature (°C); RH: relative humidity (%); TW= wet bulb temperature (°C); Pa= vapor pressure (kPa).
* Corresponding author’s e-mail: [email protected] Interdepartmental Centre of Bioclimatology (CIBIC), University ofFlorence.2 Department of Agrifood Production and Environmental Sci-ences(DISPAA), University of Florence.3 Institute of Biometeorology (Ibimet) – National Research Council,Florence, Italy.Received 18 December 2014, accepted 28 February 2015.
39-48 Petralli:Layout 1 8-07-2015 13:11 Pagina 39
Ital
ian
Jour
nal o
f Agr
omet
eoro
logy
- 2/
2015
Riv
ista
Ita
liana
di A
grom
eteo
rolo
gia
- 2/2
015
40
Cohen et al., 2012; Lin et al., 2008; Potchter et al.,2006; Ali-Toudert and Mayer 2005).This study deals with urban human-biometeorologyon the micro-scale aiming at quantifying the intra-urban thermal comfort variability of Florence byusing a network of air temperature and relative hu-midity sensors. Furthermore, it aims at finding a re-lationship between this variability and the presenceof green areas, in order to study the effect of vege-tation on thermal comfort within urban environ-ment.
2. METHODS
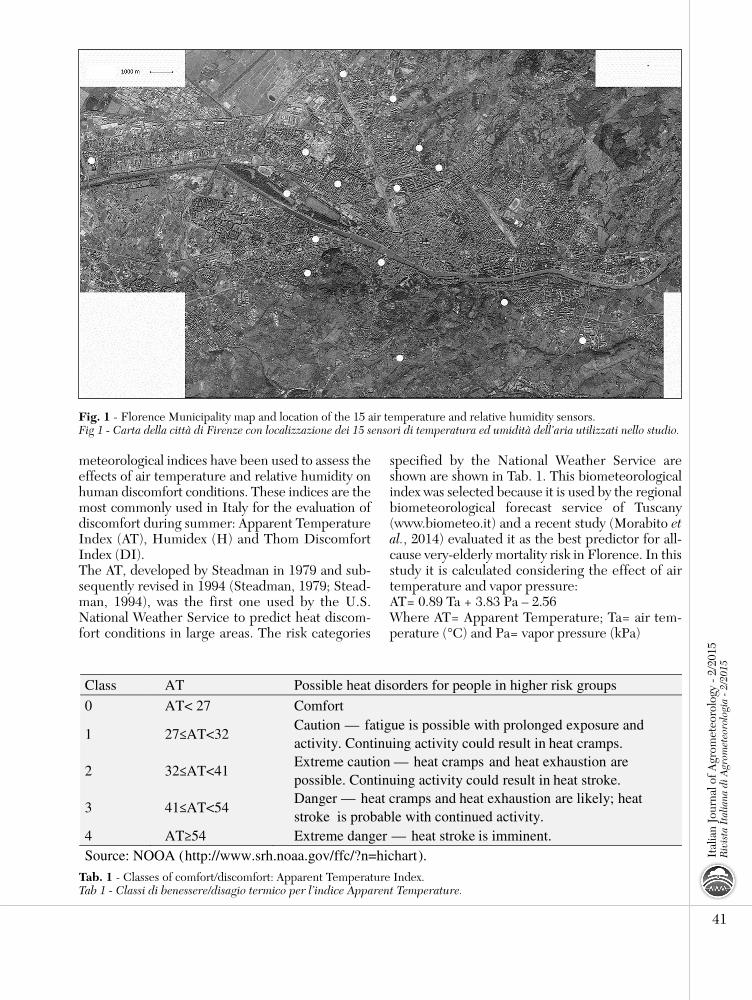
2.1. Study area and meteorological dataA network of air temperature and relative humiditysensors (HOBO® PRO series Temp/RH Data Log-ger, Onset Computer Corporation, Pocassette, MA,USA; operating range T:-30-50 °C, RH:0-100%, reso-lution: 0.2 °C between 0-40 °C) with naturally venti-lated solar radiation shields (RS1-HOBO® PROaccessories) was set up in the city of Florence since2004 (Lat: 43.77; Long: 11.26; elevation 50 m asl). Thecity lies on a plain in the central part of Italy to thesouthwest of the Apennine mountains and it is char-acterized by a sub-Mediterranean climate with hot anddry summer, mild and quite wet winter, and wet au-tumn and spring. Sensors were located in the urbanarea at a height of approximately 2 m to analyze ther-mal conditions at pedestrian level, and more than 2 maway from buildings in order to obtain representativemeasurements in built-up areas (Oke 2004). Data were collected every 15 minutes from eachstation and hourly averaged values were calculated.All the analyses were made on data collected ac-cording to the WMO standard. Air temperature andrelative humidity data series completeness werechecked, consequently, only 15 stations that had nomissing data in both parameters in the study period(from the 1st of June to the 31st of August 2010)were selected (Fig. 1).
2.2. Biometeorological indices and percentage of greenIn the last century an active research on how to de-fine thermal comfort together with how to gradethermal stress has been carried out (Blazejczyk etal., 2012). These efforts have resulted in a largenumber of indices that can be divided into threegroups: rational indices, based on calculations in-volving the heat balance equation; empirical indices,based on objective and subjective strain; direct in-dices, based on direct measurements of environ-mental variables. In this study, three direct bio-
2003; Coutts et al, 2007; Unger, 2004; Eliasson,1996; Holmer et al. 2007; Petralli et al., 2011; Chenet al., 2012). Similarly to the urban-rural difference,the intra-urban thermal difference is stronger dur-ing calm and sunny days as well as during theevening (Eliasson, 1996; Petralli et al., 2011). InFlorence (Italy), during summer period, a differ-ence of 12 summer days (days with maximum tem-perature higher than 25 °C) and of 32 tropical nights(days with minimum air temperature higher than 20°C) was found between the coolest and the hottestareas of the city (Petralli et al., 2011). The effects ofthe intra-urban thermal differences can have evi-dent applications in several fields of study, such asbiometeorology, urban planning, plant phenologyand aerobiology. According to these differences, it ispossible to identify areas of the city characterized,for example, by advanced flowering, or at higherhealth risk during summer heat waves or cold spells(Neil et al., 2014; Massetti et al., 2015; Loughnan etal. 2012; Kestens et al., 2011). Other effects of theintra-urban thermal variability are related to ther-mal comfort (Chen and Ng, 2012). The topic ofurban thermal comfort is particularly attractive byexperts from several disciplines, such as urban plan-ners, urban designers, architects, biometeorologistsand physicians (especially epidemiologists and phys-iologists). Among the factors that affect urban heatisland and the intra-urban thermal distributionthere are the high buildings density, the use of ma-terials that absorb solar radiation, the scarcity ofgreen areas as well as the production of anthro-pogenic heat (Oke et al., 1991). Thus, thermal com-fort is particularly influenced by urban design at themicro-scale (Vanos et al., 2012; Holst and Mayer,2011; Petralli et al., 2014; Massetti et al., 2014): thepresence of parks, the sky view factor and the ori-entation of the street canyon can influence mi-crometeorological variables that control the humanthermal sensation, such as air temperature, relativehumidity, wind speed and mean radiant tempera-ture (Vanos et al., 2012; Holst and Mayer, 2011; Mc-Gregor, 2012; Johansson and Emmanuel, 2006).Lindberg and Grindmond (2011) confirm thatthrough the increase of green areas and vegetationit may be possible to improve citizens’ comfort dur-ing summer heat waves. In addition, the increase ofthermal comfort can be achieved by reducing sur-face temperatures through the use of elements suchas trees and buildings (Shashua-Bar et al., 2011;Spronken-Smith and Oke 1999). Relative to this,many studies state that even different vegetationtypes and vegetation densities have diverse effectson thermal comfort (Charalampopoulos et al., 2012;
39-48 Petralli:Layout 1 29-06-2015 13:04 Pagina 40
Ital
ian
Jour
nal o
f Agr
omet
eoro
logy
- 2/
2015
Riv
ista
Ita
liana
di A
grom
eteo
rolo
gia
- 2/2
015
41
specified by the National Weather Service areshown are shown in Tab. 1. This biometeorologicalindex was selected because it is used by the regionalbiometeorological forecast service of Tuscany(www.biometeo.it) and a recent study (Morabito etal., 2014) evaluated it as the best predictor for all-cause very-elderly mortality risk in Florence. In thisstudy it is calculated considering the effect of airtemperature and vapor pressure:AT= 0.89 Ta + 3.83 Pa – 2.56Where AT= Apparent Temperature; Ta= air tem-perature (°C) and Pa= vapor pressure (kPa)
meteorological indices have been used to assess theeffects of air temperature and relative humidity onhuman discomfort conditions. These indices are themost commonly used in Italy for the evaluation ofdiscomfort during summer: Apparent TemperatureIndex (AT), Humidex (H) and Thom DiscomfortIndex (DI).The AT, developed by Steadman in 1979 and sub-sequently revised in 1994 (Steadman, 1979; Stead-man, 1994), was the first one used by the U.S.National Weather Service to predict heat discom-fort conditions in large areas. The risk categories
Fig. 1 - Florence Municipality map and location of the 15 air temperature and relative humidity sensors.Fig 1 - Carta della città di Firenze con localizzazione dei 15 sensori di temperatura ed umidità dell’aria utilizzati nello studio.
Class AT Possible heat disorders for people in higher risk groups
0 AT< 27 Comfort
1 27≤AT<32 Caution — fatigue is possible with prolonged exposure and activity. Continuing activity could result in heat cramps.
2 32≤AT<41 Extreme caution — heat cramps and heat exhaustion are possible. Continuing activity could result in heat stroke.
3 41≤AT<54 Danger — heat cramps and heat exhaustion are likely; heat stroke is probable with continued activity.
4 AT≥54 Extreme danger — heat stroke is imminent. Source: NOOA (http://www.srh.noaa.gov/ffc/?n=hichart).
Tab. 1 - Classes of comfort/discomfort: Apparent Temperature Index.Tab 1 - Classi di benessere/disagio termico per l’indice Apparent Temperature.
39-48 Petralli:Layout 1 8-07-2015 13:12 Pagina 41
Green Cover Ratio (GCR), defined as the percent-age of the area covered by any kind of vegetationagainst the total area (%), was used to analyze theeffect of vegetation during the summer season.GCR was calculated by using geographically refer-enced data integrated by visual classification of veg-etated areas (ESRI®ArcMap™ 9.3.1) performed onorthoimages provided by Florence Municipality(scale 1:10000, pixel resolution: 0.50 m x 0.50 m).Within this study the GCR was calculated on abuffer area of 250 m radius, centered on each sen-sor.
2.3. Statistical analysis To analyze the influence of green areas on summer airtemperatures within the urban environment, the rela-tionship between average seasonal values of discom-fort indices (AT, H, DI), and GCR were calculated bylinear regression. For each analysis, results were ex-pressed by coefficient of determination (R2) and sig-nificance level p. All the statistical analyses wereperformed by using SPSS for Windows version 17.
3. RESULTSSummer mean and standard deviation of minimum,mean and maximum daily temperature and relativehumidity for each sensor are presented in Tab. 4.Mean summer thermal difference between thecoolest and the hottest area of the city of Florencereached 2.9 °C, 2.7 °C and 3.1 °C respectively for
42
Ital
ian
Jour
nal o
f Agr
omet
eoro
logy
- 2/
2015
Riv
ista
Ita
liana
di A
grom
eteo
rolo
gia
- 2/2
015
The Apparent Temperature Index is valid for airtemperatures above 20 °C and its values are cate-gorized due to possible heat disorders in people(Blazejczyk et al. 2012).
The Humidex Index was developed in 1965 and re-vised in 1979 by Masterson and Richardson (1979). Itis still used in Canada for the weather forecast duringsummer season. It gives a measure of the perceivedtemperature combining the effect of excessive hu-midity and high temperature (Conti et al., 2005).The risk categories are shown in Tab. 2 and theindex is calculated as follows:H = Ta + ( 0.5555 x ( Pa – 10 ))Where H= Humidex; Ta= air temperature (°C) andPa= vapor pressure (kPa).
Thom Discomfort Index, proposed by Thom eBosen (1959), provides a measure that describes thedegree of discomfort conditions at various combi-nations of temperature and humidity (Mather,1974). It is based on both dry and wet bulb tem-peratures and it is currently used in Central Italy(Emilia-Romagna Region) during summer seasonby the Meteorological Service (Zauli Sajani et al.,2002). Risks categories are shown in Tab. 3 and it iscalculated as follows:DI = 0.4 x (Ta + Tw) + 4.8Where DI= Discomfort Index; Ta= air temperature(°C) and TW= wet bulb temperature (°C) .
Class H Degree of comfort
0 H<27 Comfort 1 27≤H<30 Some discomfort 2 30≤H<40 Great discomfort 3 40≤H<55 Dangerous 4 H≥55 Very dangerous (heatstroke imminent)
Tab. 2 - Classesof comfort/discomfort: Humidex (H).Tab. 2 - Classi di benessere/disagio termicoper l’indice Humidex (H)et al. (2002).
Class DI Degree of discomfort
0 DI < 21 No discomfort 1 21 ≤ DI < 24 Less than half population feels discomfort 2 24 ≤ DI < 27 More than half population feels discomfort
3 27 ≤ DI < 29 Most population feels discomfort and deterioration of psychophysical conditions
4 29 ≤ DI < 32 The whole population feels an heavy discomfort
5 DI ≥ 32 Sanitary emergency due to the very strong discomfort which may cause heatstrokes
Source: Thom and Bosen (1959)
Tab. 3 - Classesof comfort/discomfort:Thom Discomfort Index(DI).Tab. 3 - Classi di benessere/disagio termicoper l’indice di Thom (DI).
39-48 Petralli:Layout 1 8-07-2015 13:13 Pagina 42
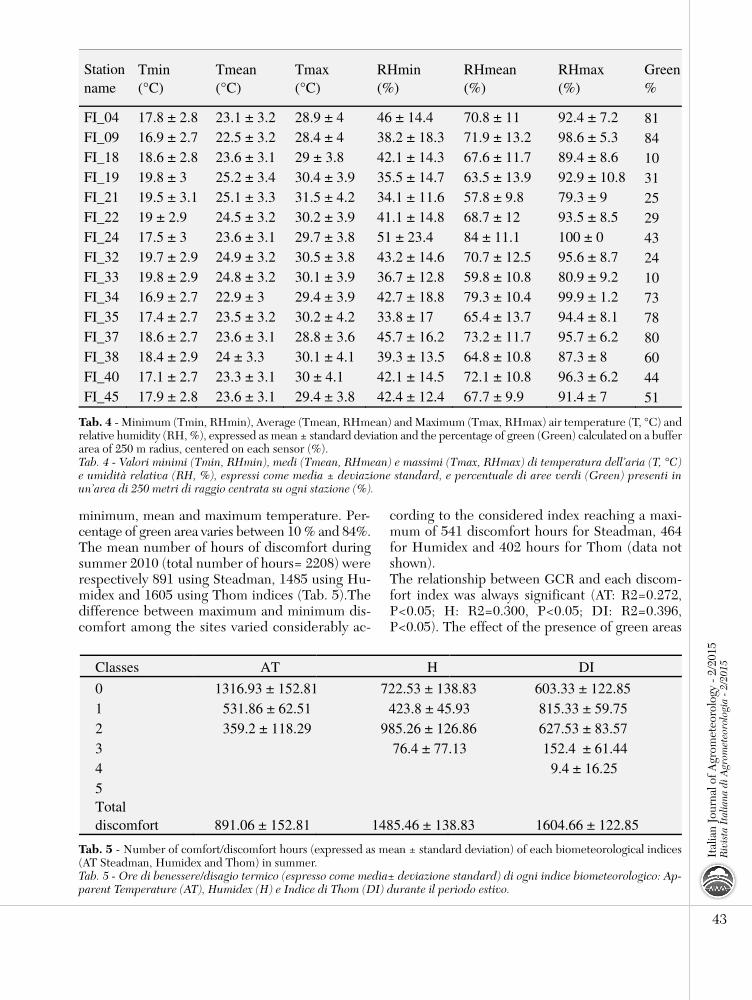
minimum, mean and maximum temperature. Per-centage of green area varies between 10 % and 84%.The mean number of hours of discomfort duringsummer 2010 (total number of hours= 2208) wererespectively 891 using Steadman, 1485 using Hu-midex and 1605 using Thom indices (Tab. 5).Thedifference between maximum and minimum dis-comfort among the sites varied considerably ac-
cording to the considered index reaching a maxi-mum of 541 discomfort hours for Steadman, 464for Humidex and 402 hours for Thom (data notshown).The relationship between GCR and each discom-fort index was always significant (AT: R2=0.272,P<0.05; H: R2=0.300, P<0.05; DI: R2=0.396,P<0.05). The effect of the presence of green areas
43
Ital
ian
Jour
nal o
f Agr
omet
eoro
logy
- 2/
2015
Riv
ista
Ita
liana
di A
grom
eteo
rolo
gia
- 2/2
015
Stationname
Tmin (°C)
Tmean (°C)
Tmax (°C)
RHmin (%)
RHmean (%)
RHmax (%)
Green %
FI_04 17.8 ± 2.8 23.1 ± 3.2 28.9 ± 4 46 ± 14.4 70.8 ± 11 92.4 ± 7.2 81 FI_09 16.9 ± 2.7 22.5 ± 3.2 28.4 ± 4 38.2 ± 18.3 71.9 ± 13.2 98.6 ± 5.3 84 FI_18 18.6 ± 2.8 23.6 ± 3.1 29 ± 3.8 42.1 ± 14.3 67.6 ± 11.7 89.4 ± 8.6 10 FI_19 19.8 ± 3 25.2 ± 3.4 30.4 ± 3.9 35.5 ± 14.7 63.5 ± 13.9 92.9 ± 10.8 31 FI_21 19.5 ± 3.1 25.1 ± 3.3 31.5 ± 4.2 34.1 ± 11.6 57.8 ± 9.8 79.3 ± 9 25 FI_22 19 ± 2.9 24.5 ± 3.2 30.2 ± 3.9 41.1 ± 14.8 68.7 ± 12 93.5 ± 8.5 29 FI_24 17.5 ± 3 23.6 ± 3.1 29.7 ± 3.8 51 ± 23.4 84 ± 11.1 100 ± 0 43 FI_32 19.7 ± 2.9 24.9 ± 3.2 30.5 ± 3.8 43.2 ± 14.6 70.7 ± 12.5 95.6 ± 8.7 24 FI_33 19.8 ± 2.9 24.8 ± 3.2 30.1 ± 3.9 36.7 ± 12.8 59.8 ± 10.8 80.9 ± 9.2 10 FI_34 16.9 ± 2.7 22.9 ± 3 29.4 ± 3.9 42.7 ± 18.8 79.3 ± 10.4 99.9 ± 1.2 73 FI_35 17.4 ± 2.7 23.5 ± 3.2 30.2 ± 4.2 33.8 ± 17 65.4 ± 13.7 94.4 ± 8.1 78 FI_37 18.6 ± 2.7 23.6 ± 3.1 28.8 ± 3.6 45.7 ± 16.2 73.2 ± 11.7 95.7 ± 6.2 80 FI_38 18.4 ± 2.9 24 ± 3.3 30.1 ± 4.1 39.3 ± 13.5 64.8 ± 10.8 87.3 ± 8 60 FI_40 17.1 ± 2.7 23.3 ± 3.1 30 ± 4.1 42.1 ± 14.5 72.1 ± 10.8 96.3 ± 6.2 44 FI_45 17.9 ± 2.8 23.6 ± 3.1 29.4 ± 3.8 42.4 ± 12.4 67.7 ± 9.9 91.4 ± 7 51
Tab. 4 - Minimum (Tmin, RHmin), Average (Tmean, RHmean) and Maximum (Tmax, RHmax) air temperature (T, °C) andrelative humidity (RH, %), expressed as mean ± standard deviation and the percentage of green (Green) calculated on a bufferarea of 250 m radius, centered on each sensor (%). Tab. 4 - Valori minimi (Tmin, RHmin), medi (Tmean, RHmean) e massimi (Tmax, RHmax) di temperatura dell’aria (T, °C)e umidità relativa (RH, %), espressi come media ± deviazione standard, e percentuale di aree verdi (Green) presenti inun’area di 250 metri di raggio centrata su ogni stazione (%).
Classes AT H DI
0 1316.93 ± 152.81 722.53 ± 138.83 603.33 ± 122.85 1 531.86 ± 62.51 423.8 ± 45.93 815.33 ± 59.75 2 359.2 ± 118.29 985.26 ± 126.86 627.53 ± 83.57 3
76.4 ± 77.13 152.4 ± 61.44
4
9.4 ± 16.25 5
Total discomfort 891.06 ± 152.81 1485.46 ± 138.83 1604.66 ± 122.85
Tab. 5 - Number of comfort/discomfort hours (expressed as mean ± standard deviation) of each biometeorological indices(AT Steadman, Humidex and Thom) in summer.Tab. 5 - Ore di benessere/disagio termico (espresso come media± deviazione standard) di ogni indice biometeorologico: Ap-parent Temperature (AT), Humidex (H) e Indice di Thom (DI) durante il periodo estivo.
39-48 Petralli:Layout 1 8-07-2015 13:13 Pagina 43
44
Ital
ian
Jour
nal o
f Agr
omet
eoro
logy
- 2/
2015
Riv
ista
Ita
liana
di A
grom
eteo
rolo
gia
- 2/2
015
on thermal comfort was the same for each index: a10 % increase of green area can cause a discomfortreduction of approximately 30 hours during thesummer period in Florence. The diurnal variation of all the indices (mean ± stan-dard deviation) was also observed during one of thehottest day of summer 2010 in Florence (10th July2010) (Fig. 3A, 3B and 3C). Thermal comfort vari-ability among the sites is given by the standard devia-tion varying between 1.1 °C and 2.8°C (AT), 1.5 °Cand 3.3 °C (H) and 0.6 °C and 1.6 °C (DI). On aver-age all the sensors recorded values higher than the
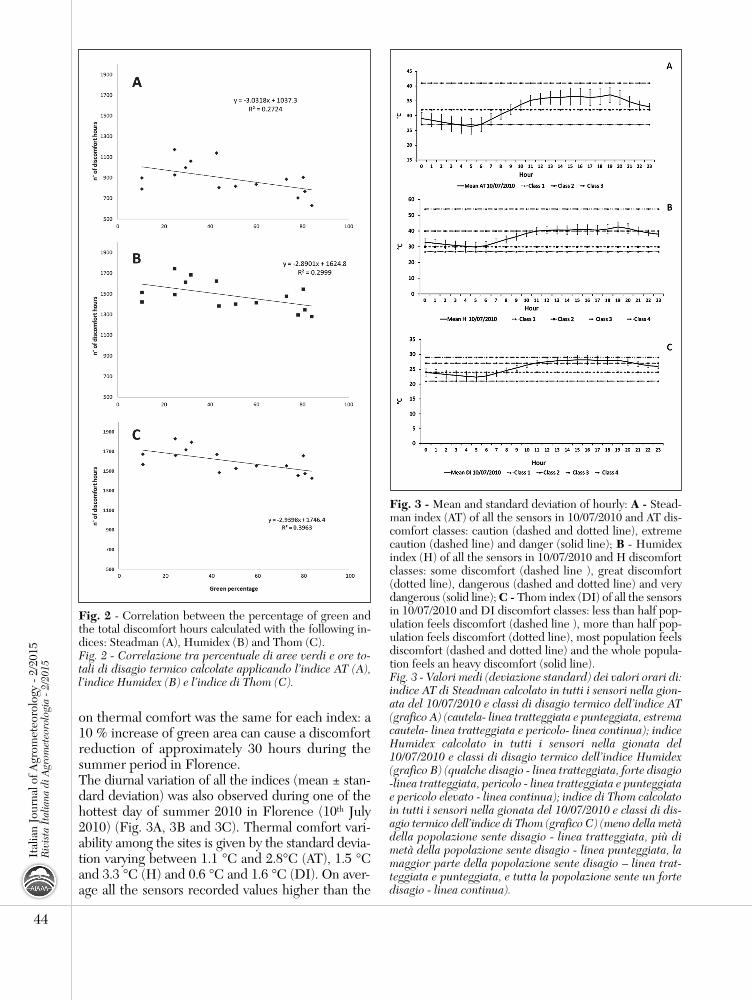
Fig. 2 - Correlation between the percentage of green andthe total discomfort hours calculated with the following in-dices: Steadman (A), Humidex (B) and Thom (C).Fig. 2 - Correlazione tra percentuale di aree verdi e ore to-tali di disagio termico calcolate applicando l’indice AT (A),l’indice Humidex (B) e l’indice di Thom (C).
Fig. 3 - Mean and standard deviation of hourly: A - Stead-man index (AT) of all the sensors in 10/07/2010 and AT dis-comfort classes: caution (dashed and dotted line), extremecaution (dashed line) and danger (solid line); B - Humidexindex (H) of all the sensors in 10/07/2010 and H discomfortclasses: some discomfort (dashed line ), great discomfort(dotted line), dangerous (dashed and dotted line) and verydangerous (solid line); C - Thom index (DI) of all the sensorsin 10/07/2010 and DI discomfort classes: less than half pop-ulation feels discomfort (dashed line ), more than half pop-ulation feels discomfort (dotted line), most population feelsdiscomfort (dashed and dotted line) and the whole popula-tion feels an heavy discomfort (solid line).Fig. 3 - Valori medi (deviazione standard) dei valori orari di:indice AT di Steadman calcolato in tutti i sensori nella gion-ata del 10/07/2010 e classi di disagio termico dell’indice AT(grafico A) (cautela- linea tratteggiata e punteggiata, estremacautela- linea tratteggiata e pericolo- linea continua); indiceHumidex calcolato in tutti i sensori nella gionata del10/07/2010 e classi di disagio termico dell’indice Humidex(grafico B) (qualche disagio - linea tratteggiata, forte disagio-linea tratteggiata, pericolo - linea tratteggiata e punteggiatae pericolo elevato - linea continua); indice di Thom calcolatoin tutti i sensori nella gionata del 10/07/2010 e classi di dis-agio termico dell’indice di Thom (grafico C) (meno della metàdella popolazione sente disagio - linea tratteggiata, più dimetà della popolazione sente disagio - linea punteggiata, lamaggior parte della popolazione sente disagio – linea trat-teggiata e punteggiata, e tutta la popolazione sente un fortedisagio - linea continua).
39-48 Petralli:Layout 1 29-06-2015 13:04 Pagina 44
comfort threshold for all the 24 hours, except for ATSteadman where no discomfort was registered be-tween 2 a.m. and 6 a.m in the greenest sites of the city.
4. DISCUSSION The major findings of this study are:1. The quantification of the total summer amount of
hours of thermal discomfort of Florence (Italy).2. The application of three different and widely used
comfort indices (AT, H and DI) shows a strongthermal variability among urban areas of Florence;this variability can result in a difference of 541 dis-comfort hours for Steadman, 464 for Humidex and402 hours for Thom between the hottest and thecoolest site during summer season.
3. Percentage of green surrounding the station af-fects significantly thermal comfort. A 10 % in-crease of green could avoid 30 hours of summerdiscomfort.
4. The effect of the presence of green areas on ther-mal comfort was almost the same for each indexanalyzed.
The bioclimatic situation and thermal comfort is oneof the major issue that future planning authoritieswill argue. In the last few years many authors haveunderlined the effect of the presence of green orhigh albedo materials on urban air temperature aswell as Urban Heat Island (UHI) mitigation (Taha,1997; Susca et al., 2011).The color of surfaces influ-ences surface temperatures by affecting the albedoof a material: darker surfaces have low albedo andadsorb more solar radiation, while lighter surfaceshave higher albedo and reflect more sunlight (Sailor,1995). On the other hand, the presence of greencontribute to reduce air temperature in urban envi-ronment with shade and evapotranspiration (Taha,1997). A recent review of the evidence of the use ofgreen to cool cities confirms the presence of lowertemperatures inside and near the urban park than anon-green site, but also confirms the need of ahigher number of empirical research to demon-strate the cooling effect of green areas (Bowler etal., 2010). As regard green areas, it is important to distinguishif the green area is covered by trees or by grass: inthe first case, the effect on thermal comfort is posi-tive during the day because of the shade providedby trees crowns reducing the amount of solar radi-ation that reaches human body; while, if it is cov-ered by grass, the positive effect on thermal comfortis stronger during nighttime because of the strongheat loss of grass after the sunset (Bowler et al.,2010; Petralli et al, 2014). As regard thermal com-
fort, the use of trees and albedo material in urbanenvironment have opposite effects (Errel et al.,2014; Shashua-Bar et al., 2010; Noro et al, 2014a;Noro et al., 2014b). Errel and collaborators (2014)evidence that the use of high-albedo materials inurban canyon surfaces lowers air temperature, butat the same time increases the radiant loads, so thatpedestrian thermal comfort is reduced. The resultsof our study quantify the difference in terms of ther-mal comfort that is possible to find during summerperiod in Florence, as well as the benefits in termsof thermal comfort of an increase of green. Resultsrelated to the quantification of the total summeramount of hours of thermal discomfort of the cityof Florence is linked to the index used and to thesite of data collecting. The difference in the amountof discomfort hours according to the index used isvery high, and is linked to the discomfort scale as-sociated to each index. The differences betweenthermal indices is investigated all over the World,especially as regards the effectiveness of each indexas best predictor for heat-related morbidity andmortality (Morabito et al., 2014). The choice of theindex results fundamental: it should be representa-tive of the discomfort felt by citizen living in thestudy area, or be representative of the effects thatdiscomfort has on their health. In this way it is pos-sible to spread an information that can be widelyused and understood by the whole population , bythe local authorities and by policymakers. As regardthe quantification of thermal discomfort of Flo-rence, only one year of data is not sufficient to givea representative information about the quantifica-tion of thermal discomfort of the city, so in futurestudies a higher number of years will be included.On the contrary, it is possible to argue about theintra-urban thermal comfort variability observed inFlorence. This variability is mainly linked to thepresence of green areas, in fact, a 10 % increase ingreen space in an area of 250 m radius, leads to areduction of about 30 hours of thermal discomfortin the entire summer period in the same area of thecity. But local urban temperature may be affectedby other urban parameters, such as street aspect ra-tios (H/W) as well as the sky view factor (Oke,1988), so it will be interesting to investigate the re-lationship between thermal comfort and otherurban parameters in future studies.
5. CONCLUSIONS This study represents a first step towards the analy-sis of the quantification of summer thermal dis-comfort for a city together with the evaluation ofthe intra-urban variability of this parameter. Both
45
Ital
ian
Jour
nal o
f Agr
omet
eoro
logy
- 2/
2015
Riv
ista
Ita
liana
di A
grom
eteo
rolo
gia
- 2/2
015
39-48 Petralli:Layout 1 29-06-2015 13:04 Pagina 45
those findings can be used by planners and policy-makers in order to understand the needs of the cityin terms of thermal stress mitigation. While thequantification of the effect of an increase of 10 %in an area of 250 m radius could be used as a plan-ning indicator for the quantification of the bene-fits that an urban transformation can bring to localpopulation. Future studies on this topic could leadto the elaboration of urban maps of thermal com-fort, that can be an useful tool to identify the areasof the city that need to be transformed to imple-ment local wellbeing of citizens.
AKNOWLEDGMENTS This study was supported by “MeteoSalute Project,”Regional Health System of Tuscany and by “SMAR-Turban - Monitoring system and territorial urbanresearch” Project co-financed by the Regional Gov-ernment of Tuscany (POR CReO Bando UnicoR&S 2012) and the European Regional Develop-ment Fund (ERDF).
REFERENCESAli-Toudert F., Mayer H., 2005. Thermal comfort
in urban streets with trees under hot summerconditions. In: Proc. 22th Int. Conf. Passive LowEnergy Architect, Beirut, Lebanon 13-16: 699-704.
Arnfield A.J., 2003. Two decades of urban climateresearch: A review of turbulence, exchanges ofenergy and water, and the urban heat island. In-ternational Journal of Climatology, 23: 1-26.
Basu R and Samet J.R., 2002. Relation between El-evated Ambient Temperature and Mortality: AReview of the Epidemiologic Evidence. Epi-demiol Reviews, 24(2): 190-202.
Blazejczyk K., Epstein Y., Jendritzky G., Staiger H.and Tinz B., 2012. Comparison of UTCI to se-lected thermal indices. International Journal ofBiometeorology, 56: 515-535.
Bowler D.E., Buyung-Ali L., Knight T.M., PullinA.S., 2010. Urban greening to cool towns andcities: A systematic review of the empirical evi-dence. Landscape and Urban Planning,97(3):147-155.
Bottyan Z., Kircsi A., Szegedi S., Unger J., 2005.The relationship between built-up areas and thespatial development of the mean maximumurban heat island in Debrecem, Hungary. Inter-national Journal of Climatology, 25: 405-418.
Cartalis C., Synodinou A., Proedrou M., Tsangra-soulis A., Santamouris M., 2001. Modificationsin energy demand in urban areas as a result ofclimate changes: an assessment for the South-
east Mediterranean region. Energy Conversionand Management, 42 (14): 1647-1656.
Charalampopoulos I., Tsiros I., Chronopoulou-Sereli A., Matzarakis A., 2012. Analysis of ther-mal bioclimate in various urban configurationsin Athens. Greece Urban Ecosyst,doi:10.1007/s11252-012-0252-5.
Chen L., Ng E., An X., Ren C., Lee M., Wang U.and He Z., 2012. Sky view factor analysis ofstreet canyons and its implications for daytimeintra-urban air temperature differentials in high-rise, high-density urban areas of Hong Kong: aGIS-based simulation approach. InternationalJournal of Climatology, 32(1): 121-136.
Chen L., Ng E., 2012. Outdoor thermal comfortand outdoor activities: A review of research inthe past decade. Cities, 29: 118-125.
Cohen P., Potchter O., Matzarakis A., 2012. Dailyand seasonal climatic conditions of green urbanopen spaces in the Mediterranean climate andtheir impact on human comfort. Building Envi-ronment, 51:285-295.
Conti S., Meli P., Minelli G., Solimini R., ToccaceliV., Vichi M., Beltrano C., Perini L., 2005. Epi-demiologic study of mortality during the Sum-mer 2003 heat wave in Italy. EnvironmentalResearch, 98(3): 390-399.
Coutts A.M., Beringer J., Tapper N.J., 2007. Impactof Increasing Urban Density on Local Climate:Spatial and temporal Variations in the SurfaceEnergy Balance in Melbourne, Australia. Jour-nal of Applied Meteorology and Climatology, 46:477-493.
Eliasson I., 1996. Intra-urban nocturnal tempera-ture differences: a multivariate approach. Cli-mate research, 7: 21-30.
Errel E., Pearlmutter D., Boneh D., Bar Kutiel P.,2014. Effect of high-albedo materials on pedes-trian heat stress in urban street canyons. UrbanClimate, 10(2): 367-386.
Gosling S. N., McGregor G. R., and Lowe J. A.,2009. Climate change and heat-related mortal-ity in six cities. Part 2: Climate model evaluationand projected impacts from changes in the meanand variability of temperature with climatechange. International Journal of Biometeorol-ogy, 53: 31-51.
Hassid S., Santamouris M., Papanikolaou M.,Linardi A., Klitsikas N., Georgakis C., Assi-makopoulos D.N., 2000. The effect of theAthens heat island on air conditioning load. En-ergy and Buildings, 32: 131-141.
Holmer B., Throsson S. and Eliasson I., 2007.Cooling rates, sky view factors and the develop-
46
Ital
ian
Jour
nal o
f Agr
omet
eoro
logy
- 2/
2015
Riv
ista
Ita
liana
di A
grom
eteo
rolo
gia
- 2/2
015
39-48 Petralli:Layout 1 29-06-2015 13:04 Pagina 46
ment of intra-urban air temperature differ-ences. Geografiska Annaler: Series A, PhysicalGeography, 89(4): 237-248.
Holst J. and Mayer H., 2011. Impacts of street de-sign parameters on human-biometeorologicalvariables. Meteorologische Zeitschrift, 20(5):541-552.
Johansson E. and Emmanuel R., 2006. The influ-ence of urban design on outdoor thermal com-fort in the hot, humid city of Colombo, SriLanka. International Journal of Biometeorology,51(2): 119-133.
Kestens Y., Brand A., Fournier M., Goudreau S.,Kosatsky T., Maloley M., Smargiassi A., 2011.Modelling the variation of land surface temper-ature as determinant of risk of heat-relatedhealth events. International Journal of HealthGeographics, 2011, 10:7.
Kilbourne E.M., 1997. Heat waves and hot envi-ronments. Oxford University Press, New York.
Lin B., Li X., Zhu Y., Qin Y., 2008. Numerical sim-ulation studies of the different vegetation pat-terns’ effects on outdoor pedestrian thermalcomfort. J Wind Eng Ind Aerodyn, 96:1707-1718.
Lindberg F. and Grimmond C.S.B. (2011). The in-fluence of vegetation and building morphologyon shadow patterns and mean radiant tempera-tures in urban areas: model development andevaluation. Theoretical and Applied Climatology,105:311-323.
Loughnan M., Nicholls N., Tapper N.J., 2012. Map-ping Heat Health Risks in Urban Areas. Inter-national Journal of Population Research. doi:http://dx.doi.org/10.1155/2012/518687.
Massetti L., Petralli M., Brandani G., Orlandini S.,2014. An approach to evaluate the intra-urbanthermal variability in summer using an urban in-dicator. Environmental Pollution, 192: 259-265.
Massetti L., Petralli M., Orlandini S., 2015. The ef-fect of urban morphology on Tilia x europaeaflowering. Urban Forestry & Urban Greening,DOI: 10.1016/j.ufug.2014.10.005.
Masterton J.M., and Richardson F. A., 1979. Humidex,A Method of Quantifying Human Discomfort Dueto Excessive Heat and Humidity, CLI 1-79, Envi-ronment Canada, Atmospheric Environment Serv-ice, Downsview, Ontario, 45 pp.
Mather J.R., 1974. Climatology: Fundamentals andApplications. McGraw-Hill, USA.
McGregor G.R., 2012. Human biometeorology.Progress in Physical Geography, 36(1): 93-109.
Morabito M., Crisci A., Messeri A., Capecchi V.,Modesti P.A., Gensini G., Orlandini S., 2014.
Environmental temperature and thermal in-dices: what is the most effective predictor ofheat-related mortality in different geographicalcontexts? The Scientific World Journal. ArticleID 961750.
Neil K., Wu J., Bang C. Faeth S., 2014. Urbaniza-tion affects plant flowering phenology and polli-nator community: effects of water availabilityand land cover. Ecological Processes, 3:17 doi:10.1186/s13717-014-0017-6.
Noro M., Busato F., Lazzarin R., 2014a. UHI effectin the city of Padua: simulations and mitigationstrategies using the RayMan and ENVImetmodel. Geographia Polonica 87(4): 517-530, doi:10.7163/GPol.2014.35.
Noro M., Lazzarin R., Busato F., 2014b. Urban heatisland in Padua, Italy: experimental and theoret-ical analysis. Indoor and Built Environment. doi:10.1177/1420326X13517404.
Oke T.R., 1976. The distinction between canopyand boundary layer urban heat island. Atmos-phere 14: 268-277.
Oke T.R., Johnson D.G., Steyn D.G., Watson I.D.,1991. Simulation of surface urban heat islandunder ‘ideal’ conditions at night – part 2: diagno-sis and causation. Boundary-Layer Meteorology56, 339-358.
Oke T. R. 1988. The urban energy balance. Pro -gress in Physical Geography December,12:471-508.
Oke T.R., 2004. Initial guidance to obtain repre-sentative meteorological observations at urbansites. IOM Report 81, World Meteorological Or-ganization, Geneva.
Petralli M., Massetti L. and Orlandini S. 2011. Fiveyears of thermal intra-urban monitoring in Flo-rence (Italy) and application of climatological in-dices. Theoretical and Applied Climatology,104(3-4): 349-356.
Petralli M., Morabito M., Cecchi L., Crisci A. andOrlandini S., 2012. Urban morbidity in summer:ambulance dispatch data, periodicity andweather. Central European Journal of Medicine7(6): 775-782.
Petralli M., Massetti L., Brandani G. and OrlandiniS., 2014. Urban planning indicators: Useful toolsto measure the effect of urbanization and vegeta-tion on summer air temperatures. InternationalJournal of Climatology, 34 (4):1236-1244.
Potchter O., Cohen P., Bitan A., 2006. Climatic be-havior of various urban parks during hot andhumid summer in the Mediterranean city of TelAviv, Israel. International Journal of Climatology,26:1695-1711.
47
Ital
ian
Jour
nal o
f Agr
omet
eoro
logy
- 2/
2015
Riv
ista
Ita
liana
di A
grom
eteo
rolo
gia
- 2/2
015
39-48 Petralli:Layout 1 29-06-2015 13:04 Pagina 47
Sailor D. J., 1995. Simulated urban climate responseto modifications in surface albedo and vegetativecover. Journal of Applied Meteorology, 34(7):1694-1704.
Santamouris M., Papanikolaou N., Livada I., Ko-ronakis I., Georgakis C., Argiriou A., Assi-makopoulos D.N., 2001. On the impact of urbanclimate to the energy consumption of buildings.Solar Energy, 70 (3),201-216.
Santamouris M., Pavlou K., Synnefa A., Niachou K.,Kolokotsa D., 2007. Recent progress on passivecooling techniques. Advanced technological de-velopments to improve survivability levels inlowincome households. Energy and Buildings,39: 859-866.
Shashua-Bar L., Pearlmutter D., Erell E., 2011. Theinfluence of trees and grass on outdoor thermalcomfort in a hot-arid environment. InternationalJournal of Climatology, 31: 1498-1506.
Shashua-Bar L., Potchter O., Bitan A., BoltanskyD., Yaakov Y., 2010. Micro-climate modeling ofstreet tree species within the varied urban mor-phology in the Mediterranean city of Tel Aviv.International Journal of Climatology, 30: 44-57.
Spronken-Smith R.A., Oke, TR., 1999. Scale mod-elling of nocturnal cooling in urban parks.Boundary-Layer Meteorology 93(2): 287-312.
Stathopoulou E., Mihalakakou G., Santamouris M.,Bagiorgas H.S., 2008. Impact of temperature ontropospheric ozone concentration levels in urbanenvironments. Journal of Earth System Science,117 (3), 227-236.
Steadman R.G., 1979. The Assessment of Sultri-ness. Part I: A Temperature-Humidity Index
Based on Human Physiology and Clothing Sci-ence. Journal of Applied Meteorology, 18,861-873.
Steadman R.G., 1994. Norms of apparent tempera-ture in Australia. Australian MeteorologicalMagazine, 43: 1-16.
Susca T., Gaffin S. R., Dell’Osso G.R., 2011. Positiveeffects of vegetation: Urban heat island andgreen roofs. Environmental Pollution. 159(8-9):2119-2126.
Taha H., 1997. Urban climates and heat islands:albedo, evapotranspiration, and anthropogenicheat. Energy and Buildings, 25: 99-103.
Thom E.C. and Bosen J.F., 1959. The discomfortindex. Weatherwise, 12: 57-60.
Unger J., 2004. Intra-urban relationship betweensurface geometry and urban heat island: re-view and new approach. Climate Research,27: 253-264.
Vanos J. K., Warland J. S., Gillespie T. J., SlaterG.A., Brown R.D. and Kenny N.A., 2012.Human Energy Budget Modeling in UrbanParks in Toronto and Applications to EmergencyHeat Stress Preparedness. Journal of AppliedMeteorology and Climatology, 51(9): 1639-1653.
Yan Z., Li Z., Li Q., Jones P., 2010. Effect of sitechange and urbanization in the Beijing temper-ature series 1977-2006. International Journal ofClimatology, 30: 1226-1234 .
Zauli Sajani S., Garaffoni G., Goldoni C.A., RanziA., Tibaldi S., Lauriola P., 2002. Mortality andbioclimatic discomfort in Emilia-Romagna, Italy.Journal of Epidemiology and CommunityHealth, 56 (7) 536-7.
48
Ital
ian
Jour
nal o
f Agr
omet
eoro
logy
- 2/
2015
Riv
ista
Ita
liana
di A
grom
eteo
rolo
gia
- 2/2
015
39-48 Petralli:Layout 1 29-06-2015 13:04 Pagina 48