Embed Size (px)
Citation preview

Thermal Comfort and market niches for apartment buildings:Impact of the current Thermal Regulation in the private real estate market in Santiago de Chile
Felipe Encinas1, André De Herde1, Carlos Marmolejo2, Carlos Aguirre2
1 Architecture et ClimatUniversité Catholique de LouvainLouvain-la-Neuve, BelgiumLouvain la Neuve, Belgium
2 Centro de Política de Suelo y ValoracionesUniversidad Politécnica de CataluñaBarcelona Spain
SET 2009 - 8th International Conference on Sustainable Energy Technologies Aachen, 31st August to 3rd September 2009
Barcelona, Spain

National Thermal Regulation [TR] and their stages01. CONTEXT
1st stage of TR comes into
Definition of 15 building
Definition of 15 architectural
2nd stage of TR comes into force
Official energy certification
CCTE v2.0, software for
2000 2001 2002 2007 2008 2009-2010
TR comes into force- roofs
building typologies
architectural layouts (robots) from building typologies
comes into force - walls- vent. floors- windows
certification rating system for buildings
software for thermal energy calculation and certification of
Building permits, new dwellings, 2006Typologies
Building permits,new dwellings
yp gbuildings
Building permits, new dwellings, 2006Typologies
Building permits,new dwellings
NATIONAL SANTIAGO REGIONS
number % number % number %
Houses 106 054 65 0% 30 638 42 7% 75 416 82 5%
Typologies new dwellings, 1994-1998
number number %
Houses 10 389 540 79 9%
NATIONAL SANTIAGO REGIONS
number % number % number %
Houses 106 054 65 0% 30 638 42 7% 75 416 82 5%
Typologies new dwellings, 1994-1998
number number %
Houses 10 389 540 79 9% Houses 106,054 65.0% 30,638 42.7% 75,416 82,5%
Apartments 57,182 35.0% 41,156 57.3% 16,026 17,5%
TOTAL 163,236 100% 71,794 100% 91,422 100%
Houses 10 389,540 79.9%
Apartments 5 98,070 20.1%
TOTAL* 15 487,610 100%
Houses 106,054 65.0% 30,638 42.7% 75,416 82,5%
Apartments 57,182 35.0% 41,156 57.3% 16,026 17,5%
TOTAL 163,236 100% 71,794 100% 91,422 100%
Houses 10 389,540 79.9%
Apartments 5 98,070 20.1%
TOTAL* 15 487,610 100%
SET 2009 - 8th International Conference on Sustainable Energy Technologies Aachen, 31st August to 3rd September 2009
Source: Own elaboration based on IC (2001) Source: Own elaboration based on INE (2007)* Equivalent to 73,9% of total building permits

2nd Stage of the National Thermal Regulation [TR]01. CONTEXT
BUILDING ENVELOPE
OPAQUE ELEMENTS GLAZING SURFACES
THERMAL ZONESMaximum allowable U-value
Maximum allowable glazing percentage regarding vertical building
envelope
N° EXAMPLES OF CITIESROOFS WALLS
VENTILATEDFLOORS
SINGLE GLAZING
DOUBLE GLAZING
[W/ 2K] [W/ 2K] [W/ 2K]3.6 W/m2K ≥ U U ≤ 2.4
[W/m2K] [W/m2K] [W/m2K]> 2.4 W/m2K W/m2K
1 Iquique (20°32’S) 0.84 4.0 3.60 50% 60% 80%
2 Calama (22°28’S) 0 60 3 0 0 87 40% 60% 80%2 Calama (22 28 S) 0.60 3.0 0.87 40% 60% 80%
3 Santiago (33°27’S) 0.47 1.9 0.70 25% 60% 80%
4 Concepción (36°47’S) 0.38 1.7 0.60 21% 60% 75%
5 Temuco (38°46’S) 0.33 1.6 0.50 18% 51% 70%
6 Puerto Montt (41°28’S) 0.28 1.1 0.39 14% 37% 55%
7 Punta Arenas (53°80’S) 0.25 0.6 0.32 12% 28% 37%
SET 2009 - 8th International Conference on Sustainable Energy Technologies Aachen, 31st August to 3rd September 2009
7 Punta Arenas (53 80 S) 0.25 0.6 0.32 12% 28% 37%
Source: Own elaboration based on Diario Oficial (4th January 2007)

How to give compliance to the regulation in Santiago?01. CONTEXT
Unifamiliar HousesCOMPONENTS
U-VALUE*SIZE U VALUE
TRADE NAME MATERIAL
SIZE
LARGE WIDTH HIGH
[mm] [mm] [mm] [W/m2K]
* Source: MINVU, IC (2006)
Extra Titán Reforzado Estructural Brick 290 140 94 1.90
Apartment buildings
COMPONENTSU-VALUE*THERMAL
TRADENAME MATERIAL
THICKNESS DENSITY THERMALCONDUCTIVITY
[mm] [kg/m3] [W/mK] [W/m2K]
Gypsum board 10 700 0 26
PolyplakKnauf
Gypsum board 10 700 0.26
1.88Expandedpolystyrene foam 10 10 0.043
Reinforcedt 150 2400 1.63
SET 2009 - 8th International Conference on Sustainable Energy Technologies Aachen, 31st August to 3rd September 2009
concrete 150 2400 1.63
* Calculated by means of NCh 853 Of. 91

Impact of the National Thermal Regulation in the private real estate market in Santiago01. CONTEXT
THREE FACTS:
a) The assumptions considered during the elaboration of the 2nd stage of the TR related toa) The assumptions considered during the elaboration of the 2 d stage of the TR – related to the participation of apartment building in the real estate market – nowadays are not completely valid, especially when the focus is Santiago.
b) The application of the 2nd stage of the TR practically have not impact in the houses market, since the requirement could be satisfied using only bricks (without thermal insulation) in the building envelope. On the contrary, in apartment buildings, it is necessary to incorporate al least 10 mm of thermal insulation in external walls to give compliance to the regulation.
c) The National Thermal Regulation was designed exclusively based on winter comfort criteria (monthly heating degree-hours). Overheating phenomena for cooling season were not considered.
SET 2009 - 8th International Conference on Sustainable Energy Technologies Aachen, 31st August to 3rd September 2009

Impact of the National Thermal Regulation in the private real estate market in Santiago01. CONTEXT
THREE QUESTIONS:
a) Is it possible to generate more representative building typologies regarding the private reala) Is it possible to generate more representative building typologies, regarding the private real estate market in Santiago?
“Energy Lord Cochrane” Building30.35 m2 useful surface
“Estocolmo” Building128.84 m2 useful surface
b) What has been the impact of the Thermal Regulation in the thermal behaviour of new
3.42 m2 terrace surface1,105 UF
46.84 m2 terrace surface7,500 UF
) p gapartment buildings in Santiago?
c) How the summer comfort of new apartment buildings in Santiago has been affected by the
SET 2009 - 8th International Conference on Sustainable Energy Technologies Aachen, 31st August to 3rd September 2009
introduction of a Thermal Regulation, designed exclusively for the heating season?

Description of the database02. MARKET NICHES DEFINITION BY MEANS OF A MODEL-BASED CLUSTERING
Portal Inmobiliario.com Database, corresponding to 25,711 apartments for sale in Santiago, during the period 10 000
15.000
20.000
2003-2008.
Important: 2nd Stage of the TR comes into force on 4th January 2007
0
5.000
10.000
2003-2006 (Before TR) 2007-2009 (After TR)force on 4th January 2007
SET 2009 - 8th International Conference on Sustainable Energy Technologies Aachen, 31st August to 3rd September 2009

Description of the database02. MARKET NICHES DEFINITION BY MEANS OF A MODEL-BASED CLUSTERING
CASES NUMBER 16 813 MIN MAX MODE
Average values to apartments for sale in Santiago for the period 2003-2006
CASES NUMBER 8 898 MIN MAX MODE
Average values to apartments for sale in Santiago for the period 2007-2009
CASES NUMBER 16,813
MIN MAX MEAN STANDARDDEVIATION
Useful surface [m2] 17 81 279 00 63 03 27 90
MIN MAX MODE
Main central hall 1 4 2
Security 1 3 1
CASES NUMBER 8,898
MIN MAX MEAN STANDARDDEVIATION
Useful surface [m2] 18 41 309 22 59 44 28 73
MIN MAX MODE
Main central hall 1 4 2
Security 1 3 2Useful surface [m2] 17.81 279.00 63.03 27.90
Terrace surface [m2] 0 155.26 7.72 7.70
Total Surface [m2] 17.81 321.50 70.75 33.11
Loft or duplex 0 1 1
Green areas 0 1 0Additional parking facilities 0 1 0
Useful surface [m2] 18.41 309.22 59.44 28.73
Terrace surface [m2] 0 181.39 6.79 8.36
Total Surface [m2] 18.41 354.16 66.23 35.21
Loft or duplex 0 1 0
Green areas 0 1 1Additional parking facilities 0 1 0
Number of floors 1 29 8.85 5.02
Number of rooms 1 5 2.17 0.92
facilitiesQuality finish for kitchen 1 4 2
Service rooms 0 3 0
Number of floors 1 26 9.03 6.09
Number of rooms 1 5 2.25 0.85
facilitiesQuality finish for kitchen 1 4 2
Service rooms 0 4 0Number of bathrooms 1 5 1.78 0.69
Price [UF]* 556 16,240 2,591 1,512
Price [UF/m2]* 16 64 114 21 40 33 10 59
Central heating 0 1 1
Loggia 0 1 0
Floating floor 0 1 1
Number of bathrooms 1 5 1.73 0.70
Price [UF]* 567 22,500 2,464 1,773
Price [UF/m2]* 15 23 90 93 39 79 9 95
Central heating 0 1 1
Loggia 0 1 0
Floating floor 0 1 1Price [UF/m ] 16.64 114.21 40.33 10.59Carpet floor 0 1 1
Quality finish 1 4 3Parking and 0 1 0
* 1 UF = EUR 27.3 according to Central Bank of Chile (http://bcentral.cl), 15th June 2009
Price [UF/m ] 15.23 90.93 39.79 9.95Carpet floor 0 1 1
Quality finish 1 4 3Parking and 0 1 0
SET 2009 - 8th International Conference on Sustainable Energy Technologies Aachen, 31st August to 3rd September 2009
storage rooms 0 1 0storage rooms 0 1 0

Comparison of both periods02. MARKET NICHES DEFINITION BY MEANS OF A MODEL-BASED CLUSTERING
ANALYSIS BETWEEN GROUPS
Variance Analysis (ANOVA)
Variable Groups F - test Statistical Significance
Price [UF/m2]2003 – 2006 (before TR)
36.48 1.56 E-092007 – 2007 (after TR)2007 2007 (after TR)
Levene Test for Equality of Variances
M-ESTIMATORS
Variable Groups Huber’s M-Estimator
Tukey’sBiweight
Hampel’sM-Estimator
Andrews’ Wave
Price [UF/m2]2003 – 2006 (before TR) 39.5393 39,2211 39.6484 39.2128
2007 – 2007 (after TR) 39.4805 39.3062 39.5344 39.3004
a) There is not a significant change in the real estate values and products with the introduction of the Thermal Regulation.
b) Probably the extra cost for incorporating Thermal Regulation improvements was absorbed in
SET 2009 - 8th International Conference on Sustainable Energy Technologies Aachen, 31st August to 3rd September 2009
b) Probably, the extra cost for incorporating Thermal Regulation improvements was absorbed in the profit margin of real estate developers.
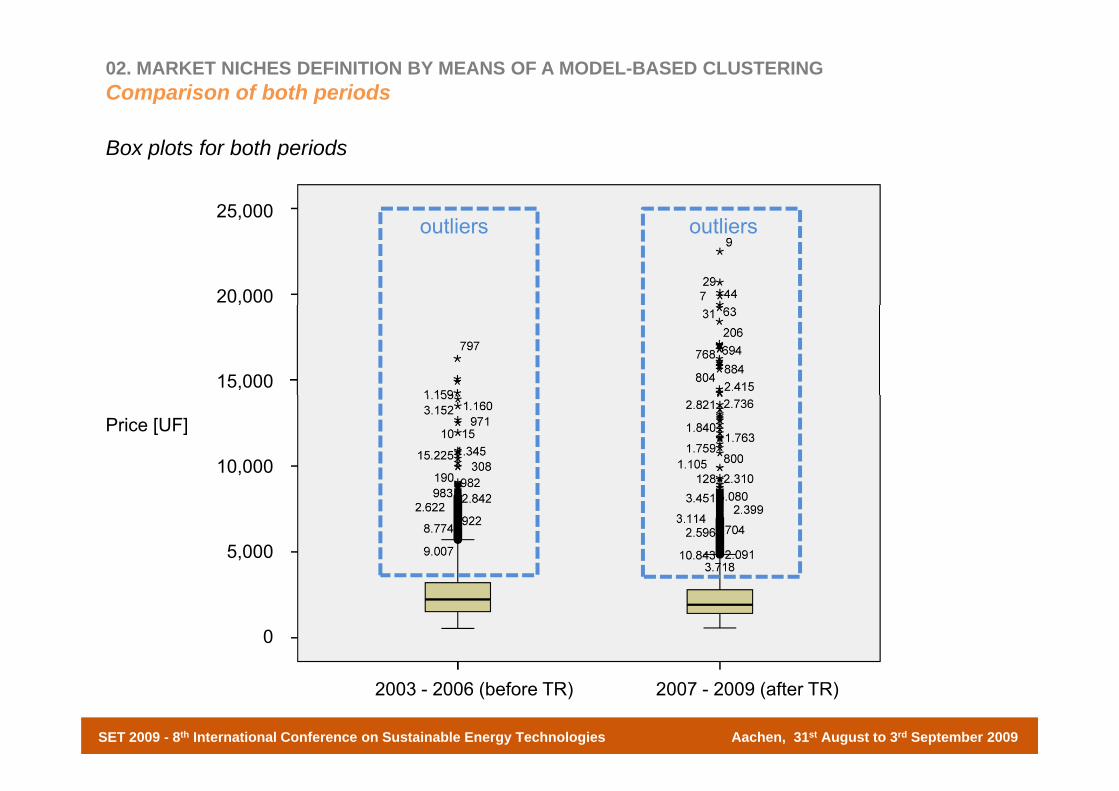
02. MARKET NICHES DEFINITION BY MEANS OF A MODEL-BASED CLUSTERINGComparison of both periods
Box plots for both periods
25,00025,000
20,000
outliers outliers
15,000
10,000
Price [UF]
5,000
0
SET 2009 - 8th International Conference on Sustainable Energy Technologies Aachen, 31st August to 3rd September 2009
2003 - 2006 (before TR) 2007 - 2009 (after TR)
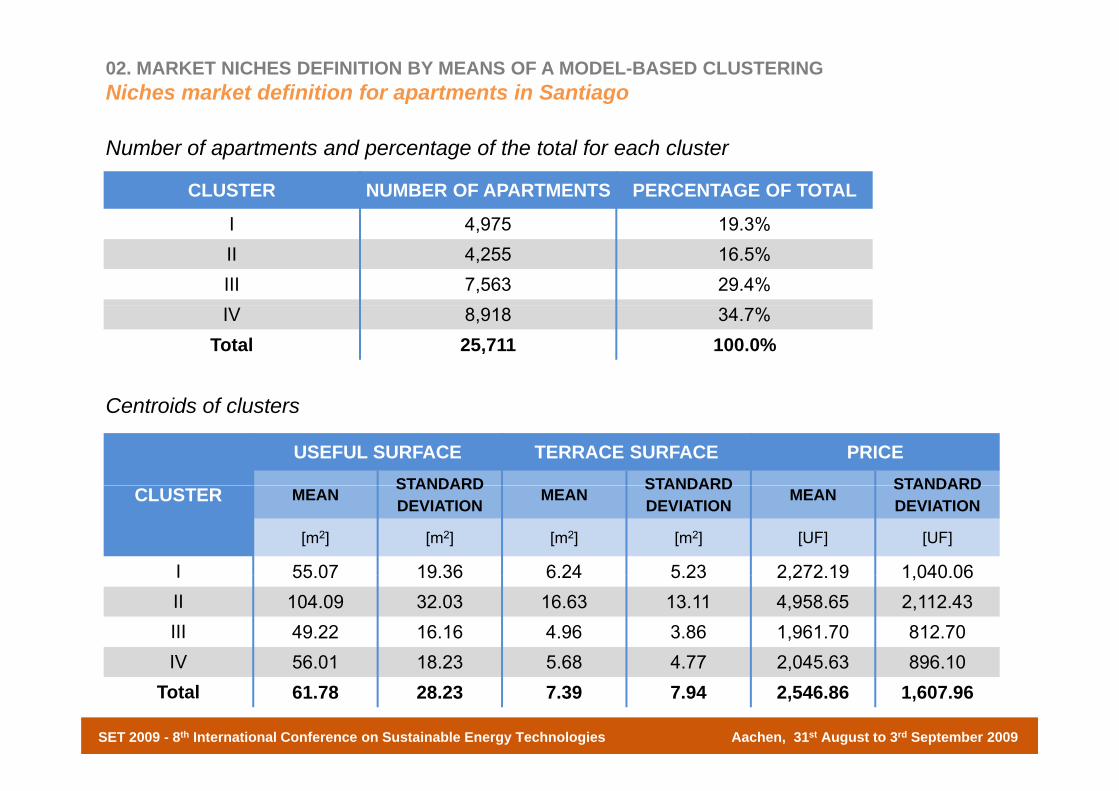
Niches market definition for apartments in Santiago02. MARKET NICHES DEFINITION BY MEANS OF A MODEL-BASED CLUSTERING
Number of apartments and percentage of the total for each cluster
CLUSTER NUMBER OF APARTMENTS PERCENTAGE OF TOTAL
I 4,975 19.3%II 4,255 16.5%III 7,563 29.4%IV 8,918 34.7%
Total 25,711 100.0%
USEFUL SURFACE TERRACE SURFACE PRICESTANDARD STANDARD STANDARD
Centroids of clusters
CLUSTER MEAN STANDARD DEVIATION MEAN STANDARD
DEVIATION MEAN STANDARD DEVIATION
[m2] [m2] [m2] [m2] [UF] [UF]
I 55 07 19 36 6 24 5 23 2 272 19 1 040 06I 55.07 19.36 6.24 5.23 2,272.19 1,040.06II 104.09 32.03 16.63 13.11 4,958.65 2,112.43III 49.22 16.16 4.96 3.86 1,961.70 812.70IV 56 01 18 23 5 68 4 77 2 045 63 896 10
SET 2009 - 8th International Conference on Sustainable Energy Technologies Aachen, 31st August to 3rd September 2009
IV 56.01 18.23 5.68 4.77 2,045.63 896.10Total 61.78 28.23 7.39 7.94 2,546.86 1,607.96

Description of the models used in the thermal simulations03. THERMAL BEHAVIOUR OF CLUSTERS
cluster I cluster II cluster III cluster IVa & IVbN
N
N
N
N
Living-dining room Kitchen Bedroom 1 Bedroom 2Bathroom 1 Bathroom 2 Closet Loggia 0 1 2 5 m
NN
SET 2009 - 8th International Conference on Sustainable Energy Technologies Aachen, 31st August to 3rd September 2009
Bathroom 1 Bathroom 2 Closet LoggiaTerrace (exterior)
0 1 2 5 m

Description of the models used in the thermal simulations03. THERMAL BEHAVIOUR OF CLUSTERS
BUILDING ELEMENTS
Three scenarios regarding Thermal Regulation [TR]
SCENARIOS
WINDOWS EXTERNAL WALLS
MATERIAL U VALUE
COMPONENTS
U VALUEMATERIAL U-VALUE U-VALUEMATERIAL THICKNESS DENSITY THERMAL
CONDUCTIVITY
[W/m2K] [mm] [kg/m3] [W/mK] [W/m2K]
S1 Before 2nd
stage of TRSingle glazing 5,8 Reinforced concrete 200 2400 1,63 3,41
Gypsum board 10 700 0,26
S2 After 2nd
stage of TRSingle glazing 5,8 1,25Expanded
polystyrene foam 20 10 0,043
Reinforced concrete 200 2400 1,63
S3
After 2nd
stage of TR and double
Double glazing 2,8
Gypsum board 10 700 0,26
1,25Expandedpolystyrene foam 20 10 0,043
SET 2009 - 8th International Conference on Sustainable Energy Technologies Aachen, 31st August to 3rd September 2009
and double glazing
glazing polystyrene foam
Reinforced concrete 200 2400 1,63

Description of the models used in the thermal simulations03. THERMAL BEHAVIOUR OF CLUSTERS
Different building elements
External wall: Reinforced concrete with or without interior thermal insulation (according to the scenario)
Windows: single or double glazing (according to the scenario) Cluster IVa & IVbParty wall (adiabatic): reinforced concrete
Internal wall 1: gypsum board partition with thermal insulation
Internal wall 2: reinforced concrete
SET 2009 - 8th International Conference on Sustainable Energy Technologies Aachen, 31st August to 3rd September 2009
Internal wall 2: reinforced concrete
Slab (adiabatic): concrete slab and floating floor

03. THERMAL BEHAVIOUR OF CLUSTERSResults in terms of winter and summer thermal comfort
I t f th Th l R l ti ( t i l ti f th i S2 & S3)
HEATING DEGREE HOURS OVERHEATING DEGREE HOURS HEATING DEGREE HOURS OVERHEATING DEGREE HOURS
Impact of the Thermal Regulation (extra-insulation of the scenarios S2 & S3)
HEATING DEGREE HOURS OVERHEATING DEGREE HOURS HEATING DEGREE HOURS OVERHEATING DEGREE HOURS
How can I reduce this overheating (as consequence of the insulation increase)?
CLUSTERS SCENARIOS(WINTER COMFORT) (SUMMER COMFORT)
Degree-hours below 20°C
% reduction compared to S1
Degree-hours over 26°C
% reduction compared to S1
CLUSTERS SCENARIOS(WINTER COMFORT) (SUMMER COMFORT)
Degree-hours below 20°C
% reduction compared to S1
Degree-hours over 26°C
% reduction compared to S1
CLUSTERS SCENARIOS(WINTER COMFORT) (SUMMER COMFORT)
Degree-hours below 20°C
% reduction compared to S1
Degree-hours over 26°C
% reduction compared to S1
CLUSTERS SCENARIOS(WINTER COMFORT) (SUMMER COMFORT)
Degree-hours below 20°C
% reduction compared to S1
Degree-hours over 26°C
% reduction compared to S1
IS1 63,972 - - - 23,346 - - -S2 52,853 17% 31,694 - 36%S3 41,191 36% 47,474 - 103%
IS1 63,972 - - - 23,346 - - -S2 52,853 17% 31,694 - 36%S3 41,191 36% 47,474 - 103%
IS1 63,972 - - - 23,346 - - -S2 52,853 17% 31,694 - 36%S3 41,191 36% 47,474 - 103%
IS1 63,972 - - - 23,346 - - -S2 52,853 17% 31,694 - 36%S3 41,191 36% 47,474 - 103%
IIS1 73,008 - - - 17,948 - - -S2 63,677 13% 24,402 - 36%S3 48,925 33% 35,419 - 97%S1 90 513 20 569
IIS1 73,008 - - - 17,948 - - -S2 63,677 13% 24,402 - 36%S3 48,925 33% 35,419 - 97%S1 90 513 20 569
IIS1 73,008 - - - 17,948 - - -S2 63,677 13% 24,402 - 36%S3 48,925 33% 35,419 - 97%S1 90 513 20 569
IIS1 73,008 - - - 17,948 - - -S2 63,677 13% 24,402 - 36%S3 48,925 33% 35,419 - 97%S1 90 513 20 569
IIIS1 90,513 - - - 20,569 - - -S2 86,860 4% 22,744 - 11%S3 69,431 23% 37,171 - 81%S1 80,430 - - - 30,459 - - -
IIIS1 90,513 - - - 20,569 - - -S2 86,860 4% 22,744 - 11%S3 69,431 23% 37,171 - 81%S1 80,430 - - - 30,459 - - -
IIIS1 90,513 - - - 20,569 - - -S2 86,860 4% 22,744 - 11%S3 69,431 23% 37,171 - 81%S1 80,430 - - - 30,459 - - -
IIIS1 90,513 - - - 20,569 - - -S2 86,860 4% 22,744 - 11%S3 69,431 23% 37,171 - 81%S1 80,430 - - - 30,459 - - -
IVa, ,
S2 73,769 8% 37,418 - 23%S3 58,809 27% 57,351 - 88%S1 69,515 - - - 52,188 - - -
IVa, ,
S2 73,769 8% 37,418 - 23%S3 58,809 27% 57,351 - 88%S1 69,515 - - - 52,188 - - -
IVa, ,
S2 73,769 8% 37,418 - 23%S3 58,809 27% 57,351 - 88%S1 69,515 - - - 52,188 - - -
IVa, ,
S2 73,769 8% 37,418 - 23%S3 58,809 27% 57,351 - 88%S1 69,515 - - - 52,188 - - -
SET 2009 - 8th International Conference on Sustainable Energy Technologies Aachen, 31st August to 3rd September 2009
IVb S2 62,972 9% 61,233 - 17%S3 48,263 31% 87,009 - 67%
IVb S2 62,972 9% 61,233 - 17%S3 48,263 31% 87,009 - 67%
IVb S2 62,972 9% 61,233 - 17%S3 48,263 31% 87,009 - 67%
IVb S2 62,972 9% 61,233 - 17%S3 48,263 31% 87,009 - 67%
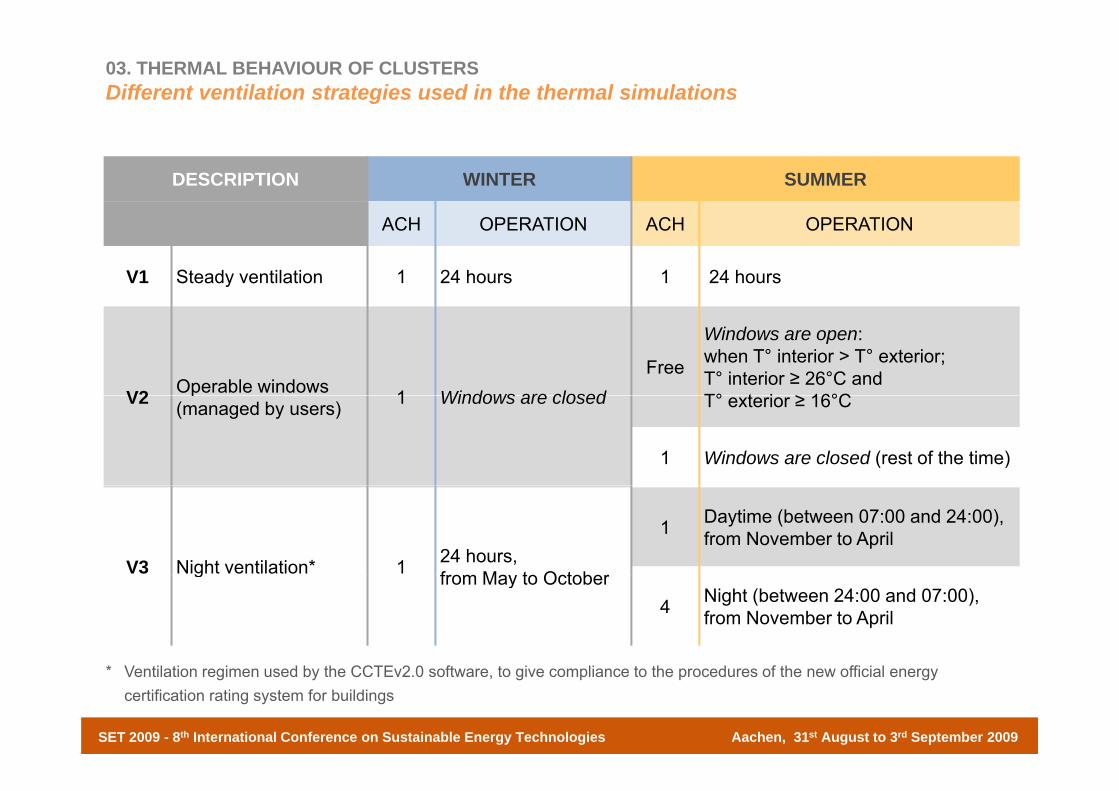
03. THERMAL BEHAVIOUR OF CLUSTERSDifferent ventilation strategies used in the thermal simulations
DESCRIPTION WINTER SUMMER
ACH OPERATION ACH OPERATION
V1 Steady ventilation 1 24 hours 1 24 hours
V2 Operable windows 1 Windows are closedFree
Windows are open: when T° interior > T° exterior; T° interior ≥ 26°C and T° t i ≥ 16°CV2 p
(managed by users) 1 Windows are closed T° exterior ≥ 16°C
1 Windows are closed (rest of the time)
V3 Night ventilation* 1 24 hours, from May to October
1 Daytime (between 07:00 and 24:00), from November to April
g from May to October4 Night (between 24:00 and 07:00),
from November to April
SET 2009 - 8th International Conference on Sustainable Energy Technologies Aachen, 31st August to 3rd September 2009
* Ventilation regimen used by the CCTEv2.0 software, to give compliance to the procedures of the new official energy certification rating system for buildings

03. THERMAL BEHAVIOUR OF CLUSTERSResults of the simulations considering ventilation strategies
CLUSTER SCENARIOS VENTILATION STRATEGIES
OVERHEATING DEGREE HOURS (SUMMER COMFORT)
Degree-hours over 26°C
% reduction d t V1
CLUSTER SCENARIOS VENTILATION STRATEGIES
OVERHEATING DEGREE HOURS (SUMMER COMFORT)
Degree-hours over 26°C
% reduction d t V1
CLUSTER SCENARIOS VENTILATION STRATEGIES
OVERHEATING DEGREE HOURS (SUMMER COMFORT)
Degree-hours over 26°C
% reduction d t V1
CLUSTER SCENARIOS VENTILATION STRATEGIES
OVERHEATING DEGREE HOURS (SUMMER COMFORT)
Degree-hours over 26°C
% reduction d t V1
CLUSTER SCENARIOS VENTILATION STRATEGIES
OVERHEATING DEGREE HOURS (SUMMER COMFORT)
Degree-hours over 26°C
% reduction d t V126°C compared to V1
S1V1 23,346 - - -V2 15,922 32%V3 10 673 54%
26°C compared to V1
S1V1 23,346 - - -V2 15,922 32%V3 10 673 54%
26°C compared to V1
S1V1 23,346 - - -V2 15,922 32%V3 10 673 54%
26°C compared to V1
S1V1 23,346 - - -V2 15,922 32%V3 10 673 54%
26°C compared to V1
S1V1 23,346 - - -V2 15,922 32%V3 10 673 54%
I
V3 10,673 54%
S2V1 31,694 - - -V2 19,685 37%V3 13,307 58%
I
V3 10,673 54%
S2V1 31,694 - - -V2 19,685 37%V3 13,307 58%
I
V3 10,673 54%
S2V1 31,694 - - -V2 19,685 37%V3 13,307 58%
I
V3 10,673 54%
S2V1 31,694 - - -V2 19,685 37%V3 13,307 58%
I
V3 10,673 54%
S2V1 31,694 - - -V2 19,685 37%V3 13,307 58%
S3V1 47,475 - - -V2 26,179 45%V3 17,657 63%
S3V1 47,475 - - -V2 26,179 45%V3 17,657 63%
S3V1 47,475 - - -V2 26,179 45%V3 17,657 63%
S3V1 47,475 - - -V2 26,179 45%V3 17,657 63%
S3V1 47,475 - - -V2 26,179 45%V3 17,657 63%
a) The percentage of reduction both V2 and V3 in comparison to V1 is more effective when the envelope is insulated, such as in the S2 and S3 scenarios.
b) With intensive night ventilation (V3) overheating due to application of Thermal Regulationb) With intensive night ventilation (V3), overheating due to application of Thermal Regulation and double glazing (S3) could be importantly reduced in comparison with the naturally ventilated initial scenario (S1-V2)
SET 2009 - 8th International Conference on Sustainable Energy Technologies Aachen, 31st August to 3rd September 2009
c) V3 is much more effective in absolute terms, but due to this corresponds typically to a normative approach, could be much less real than V2.

03. THERMAL BEHAVIOUR OF CLUSTERSResults of the simulations considering ventilation strategies
14000
16000C
)
10000
12000
g (o
ver 2
6°C
8000
10000
Pre‐RT / V1
over
heat
ing
S1 / V1
Cluster I:
4000
6000 Pre‐RT / V2
Pre‐RT / V3
e-ho
urs
of o
S1 / V2
S1 / V3
2000
4000Post‐RT+DVH / V
Post‐RT+DVH / V
Deg
re S3 / V1
S3 / V2
0
Living comedor Cocina Dormitorio 1 Dormitorio 2
Post‐RT+DVH / V
Living-dining room Kitchen Bedroom 1 Bedroom 2
S3 / V3
SET 2009 - 8th International Conference on Sustainable Energy Technologies Aachen, 31st August to 3rd September 2009
c) V3 is much more effective in absolute terms, but due to this corresponds typically to a normative approach, could be much less real than V2.

03. THERMAL BEHAVIOUR OF CLUSTERSResults of the simulations considering ventilation strategies
30
35Temperature variation of Cluster I for different ventilation strategies and S3 in four summer days
25
30
15
20
5
10
day 1 day 2 day 3 day 4
V1 [°C] V2 [°C] V3 [°C] Summer comfort band (22.6-26.6°C) according to EN 15251, based on adaptive modelExternal Temperature [°C]
d) Neither of the ventilation strategies is able to reduce completely overheating during daytimed) Neither of the ventilation strategies is able to reduce completely overheating during daytime (reaching the summer comfort band).
e) Could be interesting to identify which clusters can reach summer comfort using just passive cooling techniques For that it is clear that it is necessary to integrate other measures in the
SET 2009 - 8th International Conference on Sustainable Energy Technologies Aachen, 31st August to 3rd September 2009
cooling techniques. For that, it is clear that it is necessary to integrate other measures in the study, such as solar protection and thermal inertia.

03. THERMAL BEHAVIOUR OF CLUSTERSResults of the simulations considering ventilation strategies
a) The decision of the current TR of incorporating thermal insulation in the external envelope of t t i S ti i t t i i t f t diti
CONCLUSIONS
apartments in Santiago appears as appropriate to improve winter comfort conditions. However, overheating could be an important problem, if users are not aware of the role of natural ventilation in the thermal behaviour of apartments in summer.
b) Due to the achieved improvements related to the 2nd stage of TR are still limited, there is an important future challenge to introduce most restrictive requirements in the regulation and encouraging the use of double glazing.g g g g
FURTHER RESEARCH
c) The incorporation of other passive cooling techniques in the study such as solar protectionc) The incorporation of other passive cooling techniques in the study, such as solar protection and thermal inertia (combined to the studied ventilation strategies), to define how it is possible reach summer comfort without the use of air conditioning.
d) A survey study of ventilation habits for apartments in Santiago is proposed as further research. The ventilation strategies used in this article just are boundary models (which define optimum and minimum performances related to ventilation), which should be compared to a
SET 2009 - 8th International Conference on Sustainable Energy Technologies Aachen, 31st August to 3rd September 2009
most realistic behaviour.

Thermal Comfort and market niches for apartment buildings:Impact of the current Thermal Regulation in the private real estate market in Santiago de Chile
Thank you for your attention.
Felipe Encinas PinoMSc ArchitectPhD StudentPhD StudentUniversité Catholique de LouvainArchitecture et ClimatLouvain-la-Neuve, Belgium
SET 2009 - 8th International Conference on Sustainable Energy Technologies Aachen, 31st August to 3rd September 2009