Embed Size (px)
Citation preview
Thermal Conductivity Gauge XEN-TCG3880 for gas type measurement and vacuum measurement
Xensor Integration bv Smart Sensor Devices
Distributieweg 28 2645 EJ Delfgauw The Netherlands
Phone +31 (0)15-2578040 Founded 18 May 1988 Fax +31 (0)15-2578050 Trade reg. 27227437 Email [email protected] Site www.xensor.nl
ABN-AMRO 60 50 40 311 IBAN NL42ABNA0605040311
VAT NL 009122746 B01
copyright Xensor Integration 19 March 2018 page 1 of 39
XEN-TCG3880 mounted in LCC-20 (left) and TO-5 (right)
Content
1 Introduction ............................................................................................. 2
1.1 Short description ........................................................................................................ 2
1.2 Applications ............................................................................................................... 2
2 Technical data ....................................................................................... 3
3 Packaging information .......................................................................... 4
3.1 TO-5 header .............................................................................................................. 4
3.2 TO-5 + filter cap ......................................................................................................... 5
3.3 Pt100 / Pt1000 version .............................................................................................. 5
3.4 LCC-20 ...................................................................................................................... 6
3.5 KF-16 flange .............................................................................................................. 7
3.6 Calibration adapter (XEN-85030) .............................................................................. 8
4 Choosing a Xensor Thermal Conductivity Gauge ................................... 10
4.1 Selection guide for the Xensor TCG, ordering oriented .......................................... 11
4.2 Selection guide for the Xensor TCG, application oriented ...................................... 12
4.3 Overview of the XEN-TCG3880 versions ................................................................ 13
4.3.1 Standard version ................................................................................................. 13 4.3.2 Naked die ............................................................................................................ 14 4.3.3 Platinum resistance thermometer Pt1000 or Pt100 ............................................ 14 4.3.4 Roof ..................................................................................................................... 15 4.3.5 Welded cap with filter .......................................................................................... 15 4.3.6 KF-16 flange ........................................................................................................ 15 4.3.7 LCC-20nn (non magnetic) ................................................................................... 16 4.3.8 Gold metallization ................................................................................................ 16
5 Extended description and general notes on use ..................................... 17
5.1 Sensor description ................................................................................................... 17
5.2 Sensor operation principle ....................................................................................... 17
5.3 Temperature coefficient of the XEN-TCG3880 ....................................................... 19

Thermal Conductivity Gauge XEN-TCG3880 for gas type measurement and vacuum measurement
Xensor Integration bv Smart Sensor Devices
Distributieweg 28 2645 EJ Delfgauw The Netherlands
Phone +31 (0)15-2578040 Founded 18 May 1988 Fax +31 (0)15-2578050 Trade reg. 27227437 Email [email protected] Site www.xensor.nl
ABN-AMRO 60 50 40 311 IBAN NL42ABNA0605040311
VAT NL 009122746 B01
copyright Xensor Integration 19 March 2018 page 2 of 39
5.4 Electronics and Biasing of the XEN-TCG3880 ........................................................ 21
6 Application: gas sensing .................................................................... 23
6.1 Introduction .............................................................................................................. 23
6.2 Output curves for gas mixtures ............................................................................... 23
6.3 Sensitivity, noise, drift, accuracy and resolution ..................................................... 25
6.4 Humidity effects ....................................................................................................... 26
6.5 Pressure effects ....................................................................................................... 27
6.6 Xenon sensing (Xe) ................................................................................................. 28
6.7 Formula for binary gas mixtures .............................................................................. 29
6.8 Thermal conductivities of gases .............................................................................. 31
7 Application: vacuum sensor ............................................................... 32
8 Thermal data for some gases ............................................................. 36
1 Introduction
1.1 Short description
The XEN-TCG3880 is a thermal conductivity gauge (TCG) made using silicon technology. The
sensor chip consists of a silicon rim of 2.50 3.33 mm, 0.3 mm thick, in which a silicon-nitride membrane is created. In the center is a heater, with a sensor element measuring its temperature. The chip measures the thermal conductance between the ambient and the center of the mem-brane, and this depends on several parameters, such as pressure, gas type, and material depo-sitions on the membrane. This dependence upon physical parameters allows the TCG to measure such quantities as absolute pressure, gas type and gas mixture composition. The standard housing for the XEN-TCG3880 is a TO-5 10-pins header with a cap having a 5 mm diameter hole with filter, other housings are available on request. The XEN-TCG3880Pt has a class B Pt100 platinum temperature sensor on the TO-5 housing, next to the chip. For data see Table 2.1, for a photograph see Connection diagrams in Chap. 3.
1.2 Applications
Gas type measurement:
Measurement of thermal conductivity and gas type
Measurement of concentration of Helium, CO2, etc, in air and other gases
Measurement of binary gas-mixture composition
Vacuum measurement:
Vacuum measurement between 10 mPa and 10 kPa
Sealed gas-enclosure leakage See Chap. 4 for a selection guide helping to choose the right configuration for the application at hand.
Thermal Conductivity Gauge XEN-TCG3880 for gas type measurement and vacuum measurement
Xensor Integration bv Smart Sensor Devices
Distributieweg 28 2645 EJ Delfgauw The Netherlands
Phone +31 (0)15-2578040 Founded 18 May 1988 Fax +31 (0)15-2578050 Trade reg. 27227437 Email [email protected] Site www.xensor.nl
ABN-AMRO 60 50 40 311 IBAN NL42ABNA0605040311
VAT NL 009122746 B01
copyright Xensor Integration 19 March 2018 page 3 of 39
2 Technical data
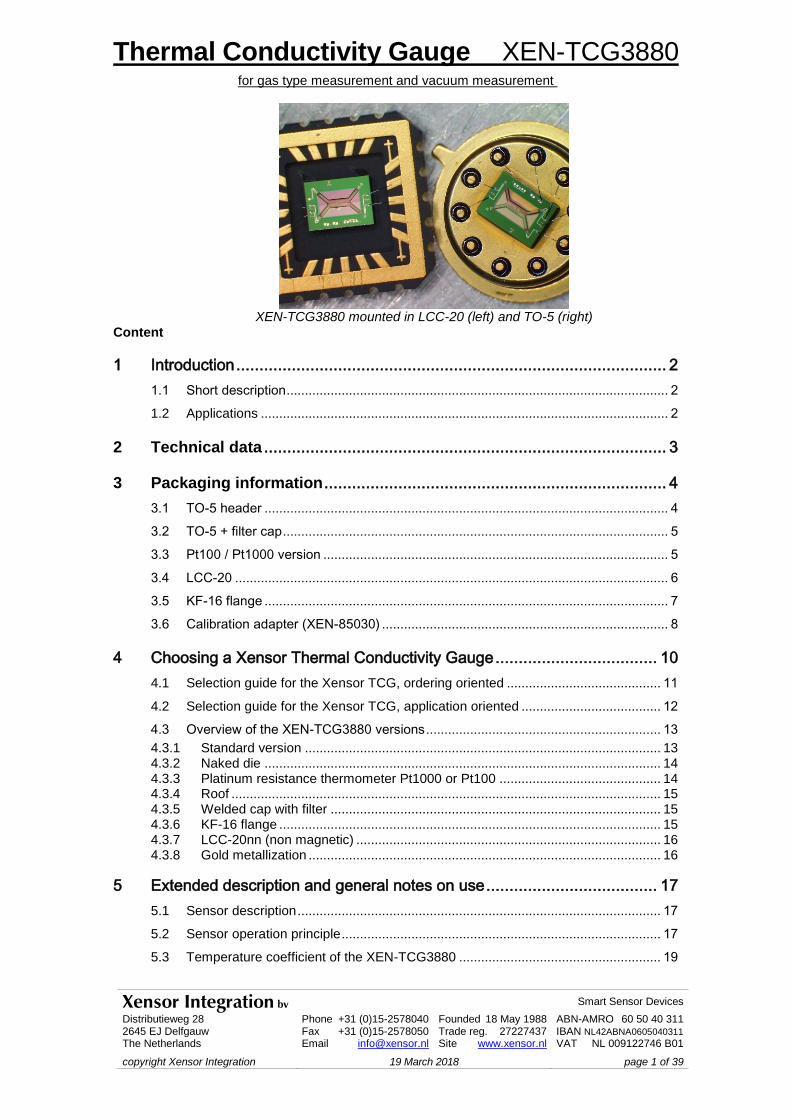
Table 2.1: Specifications (22 oC and 1 V power supply) Parameter typ* unit symbol notes
Dimensions
size naked die 2.50 x 3.33 mm2
thickness naked die 0.3 mm
thickness membrane 1 µm
weight 0.72 g XEN-TCG3880 on TO-5
weight 1.05 g XEN-TCG3880 on TO-5 + cap + filter
Output
in vacuum at 0 mbar 130 V/W depending on production batch
temperature coefficient (0 Pa) -0.06 %/K
in air at 100 kPa 30 V/W no upper heat sink
in air at 100 kPa 6 V/W with upper heat sink at 20 µm
in helium at 100 kPa 7 V/W
in air, 10 MPa -13 % change compared to output 100 kPa, R-version
in helium, 10 MPa -2 % change compared to output 100 kPa, R-version
Time constant
in air 9 ms
in vacuum 36 ms
Stability
short term 10 ppm 1 day, good temp + RH stabilization
long term 1200 ppm 1 year, temperature & Rel. Humidity correction
Thermopile
resistance 55 k Rtp
effective sensitivity 1.3 mV/K Stp Referred to temperature of heater
intrinsic sensitivity 2.4 mV/K Average Seebeck coefficient 0.2 mV/K, 12 leads
temperature coefficient 0.05 %/K
Heater
resistance 0.6 k Rheat
temperature coefficient 0.1 %/K Of heater resistance
Thermal resistance
membrane 100 kK/W vacuum output divided by thermopile sensitivity
temperature coefficient -0.11 %/K in vacuum
membrane + gas 23 kK/W air
temperature coefficient -0.08 %/K air
Maximum heating voltage Uheat
in air 2.5 V
in vacuum 1 V
Sensor ambient temperature Without guarantee for lifetime
minimum -250 oC probably no significant change in output
-250 to -273 oC reduced output
maximum 240 oC tested on similar devices, short times
Heater maximum temperature 250 oC Longer term no drift, absolute maximum rating
XEN-TCG3880Pt
Pt100 class B ± 0.3 oC Error at 0 oC
* values in italics: estimates, not measured.
Thermal Conductivity Gauge XEN-TCG3880 for gas type measurement and vacuum measurement
Xensor Integration bv Smart Sensor Devices
Distributieweg 28 2645 EJ Delfgauw The Netherlands
Phone +31 (0)15-2578040 Founded 18 May 1988 Fax +31 (0)15-2578050 Trade reg. 27227437 Email [email protected] Site www.xensor.nl
ABN-AMRO 60 50 40 311 IBAN NL42ABNA0605040311
VAT NL 009122746 B01
copyright Xensor Integration 19 March 2018 page 4 of 39
3 Packaging information
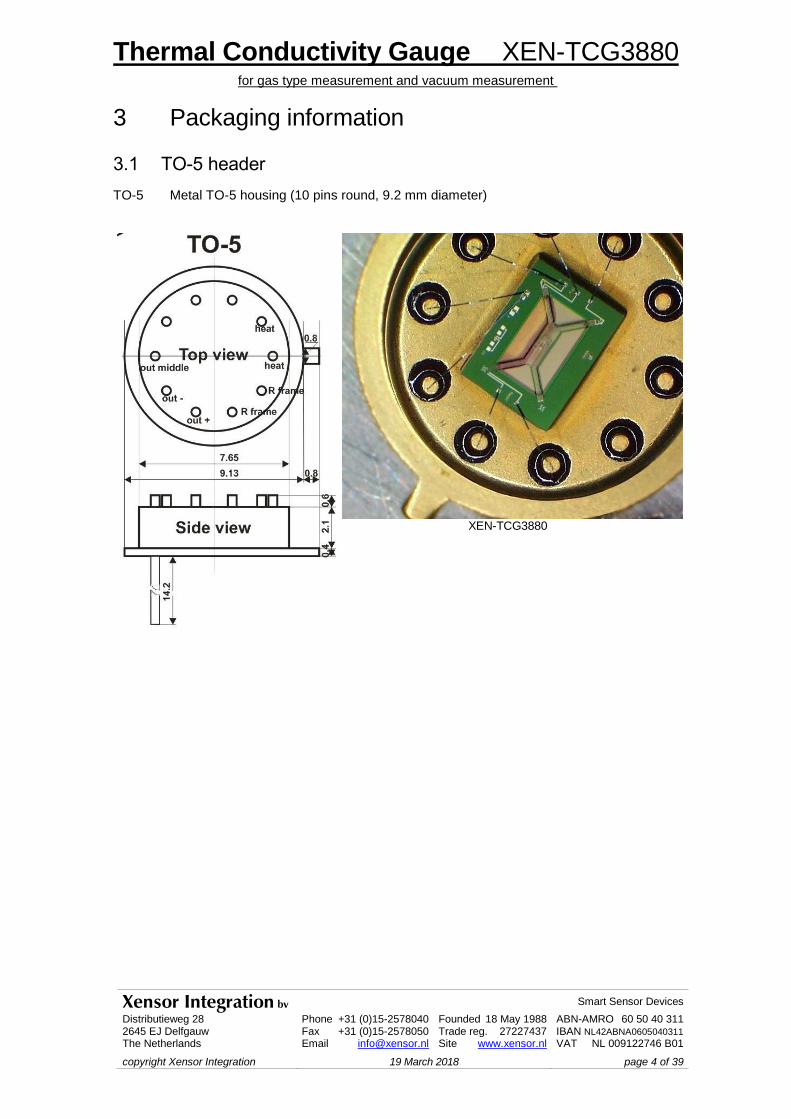
3.1 TO-5 header
TO-5 Metal TO-5 housing (10 pins round, 9.2 mm diameter)
XEN-TCG3880
Thermal Conductivity Gauge XEN-TCG3880 for gas type measurement and vacuum measurement
Xensor Integration bv Smart Sensor Devices
Distributieweg 28 2645 EJ Delfgauw The Netherlands
Phone +31 (0)15-2578040 Founded 18 May 1988 Fax +31 (0)15-2578050 Trade reg. 27227437 Email [email protected] Site www.xensor.nl
ABN-AMRO 60 50 40 311 IBAN NL42ABNA0605040311
VAT NL 009122746 B01
copyright Xensor Integration 19 March 2018 page 5 of 39
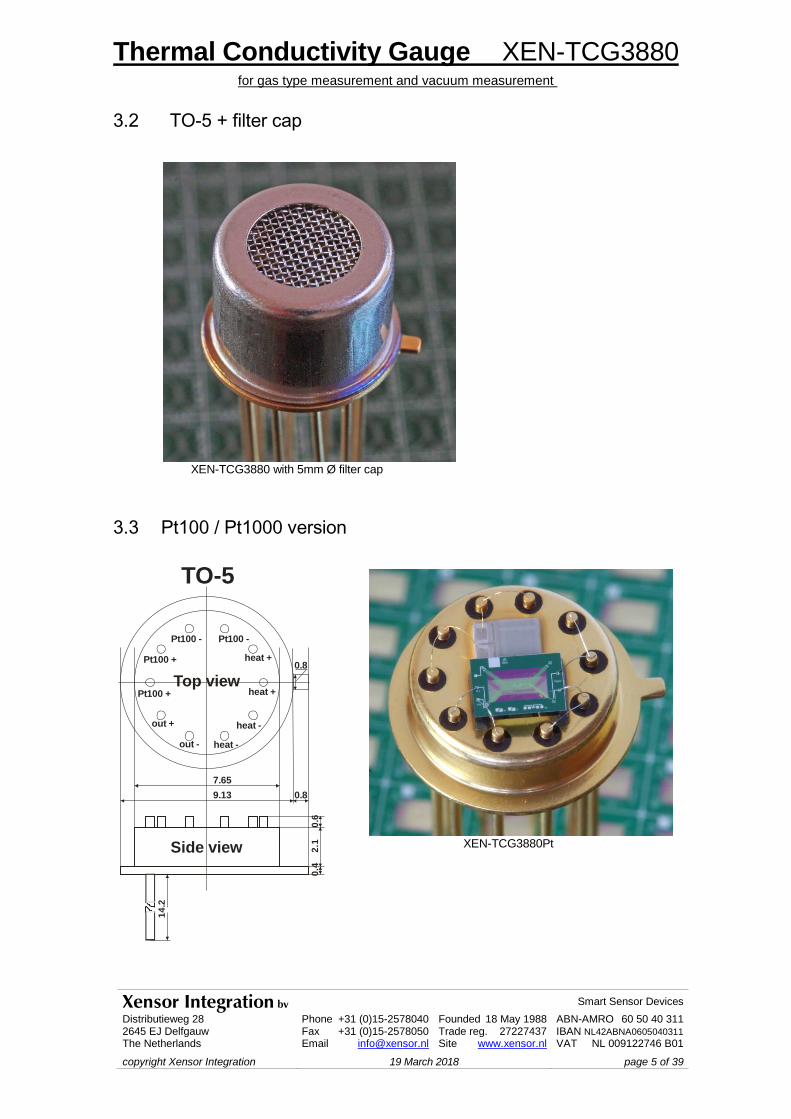
3.2 TO-5 + filter cap
XEN-TCG3880 with 5mm Ø filter cap
3.3 Pt100 / Pt1000 version
out -
out +
Pt100 +
Pt100 +
Pt100 - Pt100 -
heat +
heat +
heat -
heat -
Top view
TO-5
Side view
7.65
9.13 0.8
14
.2
2.1
0.4
0.6
0.8
XEN-TCG3880Pt
Thermal Conductivity Gauge XEN-TCG3880 for gas type measurement and vacuum measurement
Xensor Integration bv Smart Sensor Devices
Distributieweg 28 2645 EJ Delfgauw The Netherlands
Phone +31 (0)15-2578040 Founded 18 May 1988 Fax +31 (0)15-2578050 Trade reg. 27227437 Email [email protected] Site www.xensor.nl
ABN-AMRO 60 50 40 311 IBAN NL42ABNA0605040311
VAT NL 009122746 B01
copyright Xensor Integration 19 March 2018 page 6 of 39
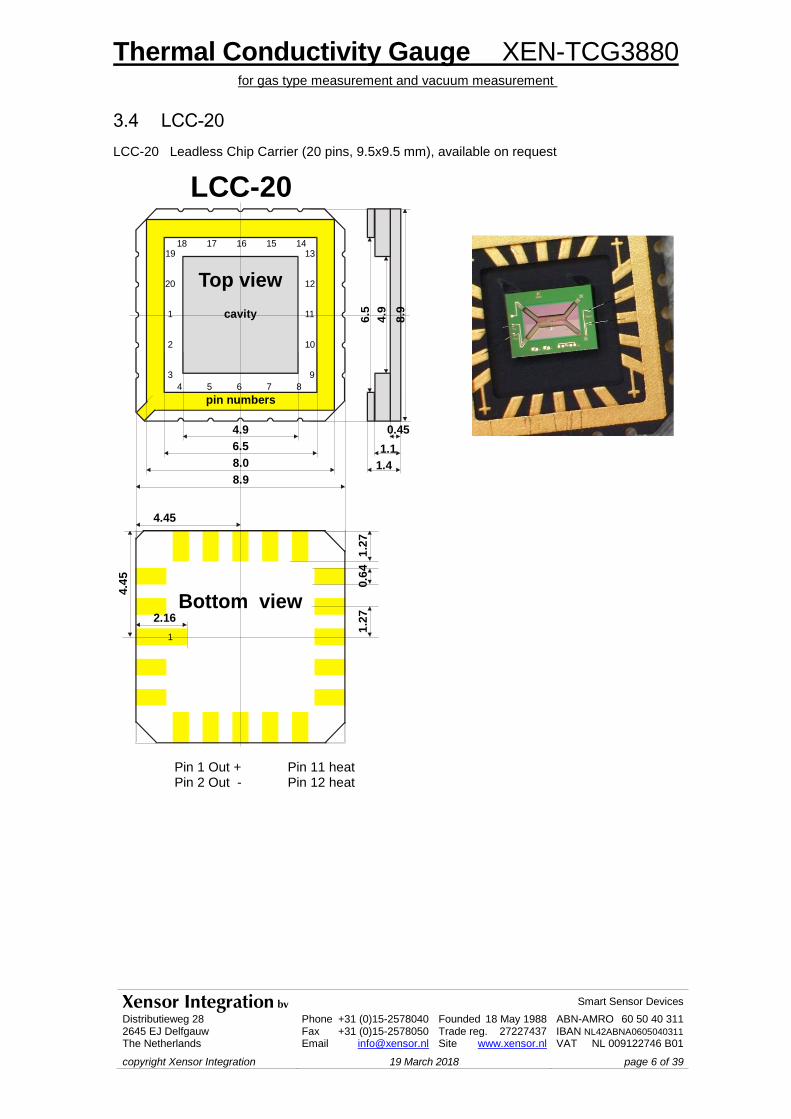
3.4 LCC-20
LCC-20 Leadless Chip Carrier (20 pins, 9.5x9.5 mm), available on request
LCC-20
Top view
Bottom view
4.9 0.45
1.1
1.4
6.5
8.0
8.9
2.16
4.45
1.2
7
4.9
6.5
4.4
5
1.2
70.6
4
cavity
4
3
2
1
1
20
19 13
12
11
10
9
18 17 16 15 14
5 6 7 8
pin numbers8
.9
Pin 1 Out + Pin 11 heat Pin 2 Out - Pin 12 heat
Thermal Conductivity Gauge XEN-TCG3880 for gas type measurement and vacuum measurement
Xensor Integration bv Smart Sensor Devices
Distributieweg 28 2645 EJ Delfgauw The Netherlands
Phone +31 (0)15-2578040 Founded 18 May 1988 Fax +31 (0)15-2578050 Trade reg. 27227437 Email [email protected] Site www.xensor.nl
ABN-AMRO 60 50 40 311 IBAN NL42ABNA0605040311
VAT NL 009122746 B01
copyright Xensor Integration 19 March 2018 page 7 of 39
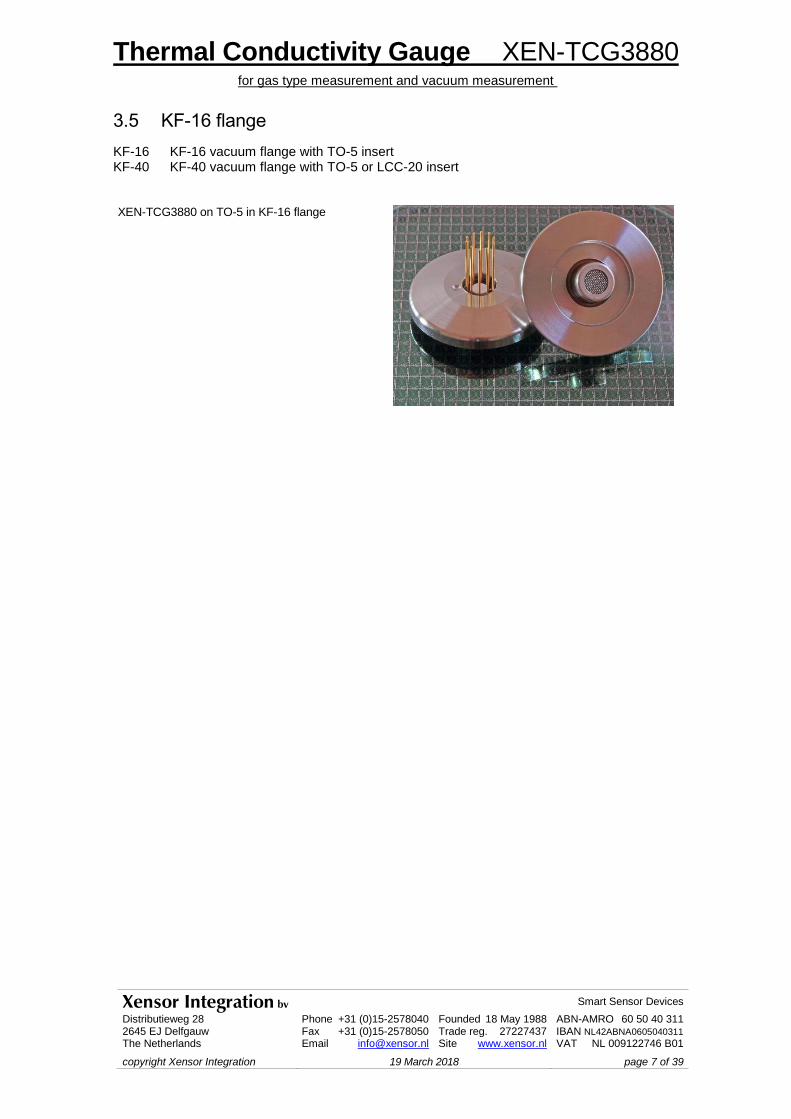
3.5 KF-16 flange
KF-16 KF-16 vacuum flange with TO-5 insert KF-40 KF-40 vacuum flange with TO-5 or LCC-20 insert XEN-TCG3880 on TO-5 in KF-16 flange

Thermal Conductivity Gauge XEN-TCG3880 for gas type measurement and vacuum measurement
Xensor Integration bv Smart Sensor Devices
Distributieweg 28 2645 EJ Delfgauw The Netherlands
Phone +31 (0)15-2578040 Founded 18 May 1988 Fax +31 (0)15-2578050 Trade reg. 27227437 Email [email protected] Site www.xensor.nl
ABN-AMRO 60 50 40 311 IBAN NL42ABNA0605040311
VAT NL 009122746 B01
copyright Xensor Integration 19 March 2018 page 8 of 39
3.6 Calibration adapter (XEN-85030)
For the XEN-TCG3880 and XEN-5320 a calibration adapter is available. The calibration adapter is made of ABS material and fabricated using 3D-printing techniques. There are 5 versions:
XEN-85030-W
XEN-85030-N
XEN-85030-WH
XEN-85030-NH
XEN-85030-U XEN-85030-W: the standard version, shown in Fig. 3.1 has a wide channel (4.5 mm diameter). XEN-85030-N: the narrow version is shown in Fig. 3.2 and resembles the wide version, but has a channel of 2 mm diameter. This reduces the dead volume of the calibration adapter and this version is intended for fast measurements. Both these versions have a size of about 60x15x20 mm3, without the 4 mm brass tube connect-ors, see Fig. 3.2 & 3.3. Horizontal and vertical holes, all 3 mm Ø, allow fixing of the calibration adapter. XEN-85030-WH: this is the XEN-85030-W version for the XEN-5320 with housing. XEN-85030-NH: this is the XEN-85030-N version for the XEN-5320 with housing. XEN-85030-U: a U-shaped calibration adapter that will accept 4 devices at the same time, see Figs. 3.4 and 3.5. The size of this adapter is 62×55×18 mm3.
Figure 3.1: ABS Calibration adapter XEN-85030-W with wide channel (4.5 mm, left), and with XEN-5320 mounted, sensing element with cap.
Thermal Conductivity Gauge XEN-TCG3880 for gas type measurement and vacuum measurement
Xensor Integration bv Smart Sensor Devices
Distributieweg 28 2645 EJ Delfgauw The Netherlands
Phone +31 (0)15-2578040 Founded 18 May 1988 Fax +31 (0)15-2578050 Trade reg. 27227437 Email [email protected] Site www.xensor.nl
ABN-AMRO 60 50 40 311 IBAN NL42ABNA0605040311
VAT NL 009122746 B01
copyright Xensor Integration 19 March 2018 page 9 of 39
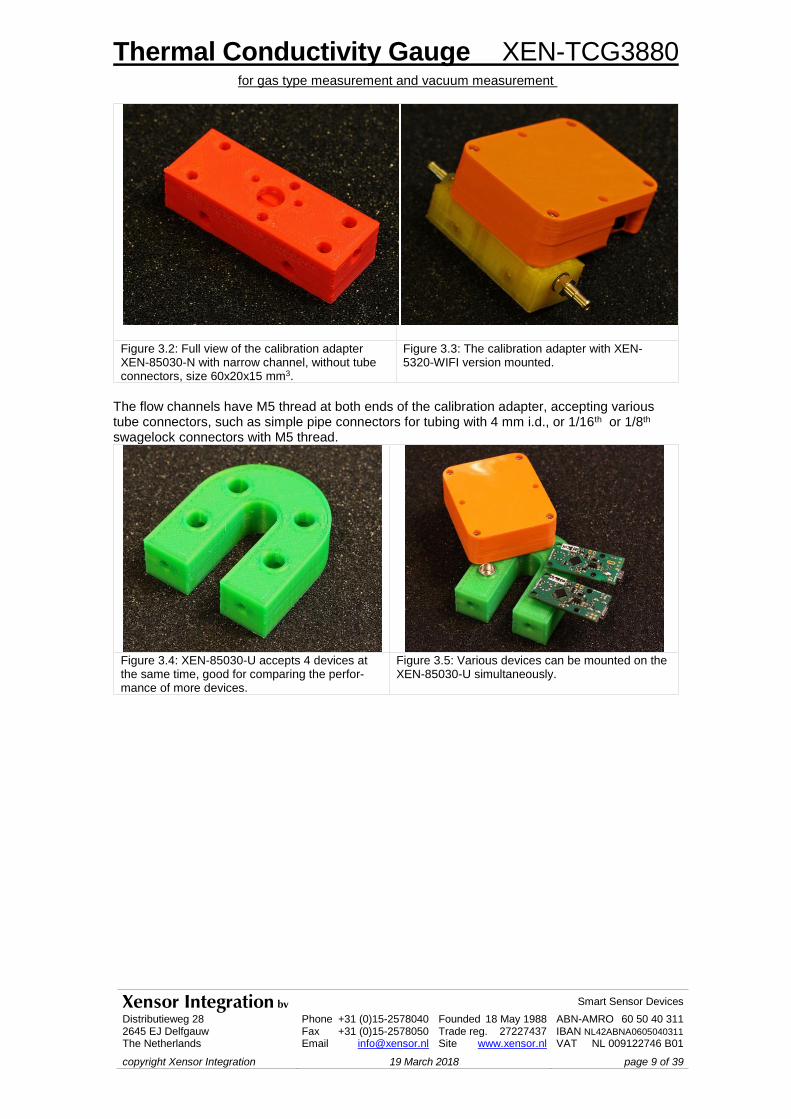
Figure 3.2: Full view of the calibration adapter XEN-85030-N with narrow channel, without tube connectors, size 60x20x15 mm3.
Figure 3.3: The calibration adapter with XEN-5320-WIFI version mounted.
The flow channels have M5 thread at both ends of the calibration adapter, accepting various tube connectors, such as simple pipe connectors for tubing with 4 mm i.d., or 1/16th or 1/8th swagelock connectors with M5 thread.
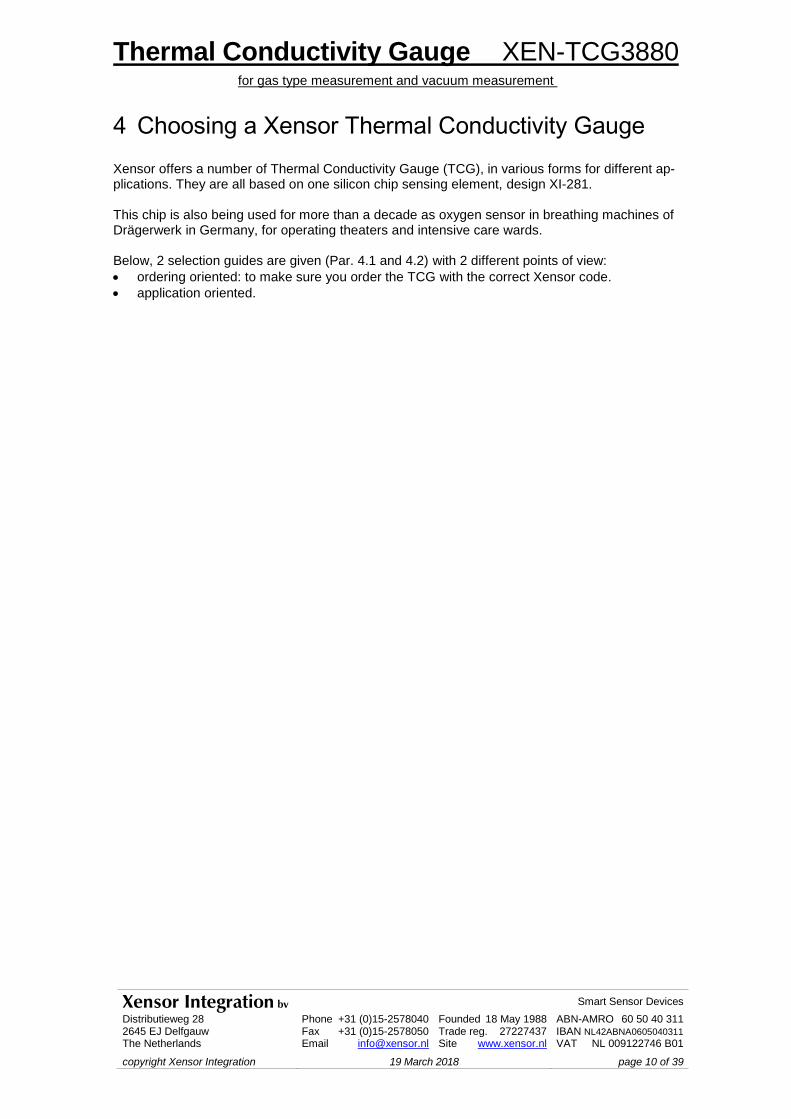
Figure 3.4: XEN-85030-U accepts 4 devices at the same time, good for comparing the perfor-mance of more devices.
Figure 3.5: Various devices can be mounted on the XEN-85030-U simultaneously.
Thermal Conductivity Gauge XEN-TCG3880 for gas type measurement and vacuum measurement
Xensor Integration bv Smart Sensor Devices
Distributieweg 28 2645 EJ Delfgauw The Netherlands
Phone +31 (0)15-2578040 Founded 18 May 1988 Fax +31 (0)15-2578050 Trade reg. 27227437 Email [email protected] Site www.xensor.nl
ABN-AMRO 60 50 40 311 IBAN NL42ABNA0605040311
VAT NL 009122746 B01
copyright Xensor Integration 19 March 2018 page 10 of 39
4 Choosing a Xensor Thermal Conductivity Gauge
Xensor offers a number of Thermal Conductivity Gauge (TCG), in various forms for different ap-plications. They are all based on one silicon chip sensing element, design XI-281. This chip is also being used for more than a decade as oxygen sensor in breathing machines of Drägerwerk in Germany, for operating theaters and intensive care wards. Below, 2 selection guides are given (Par. 4.1 and 4.2) with 2 different points of view:
ordering oriented: to make sure you order the TCG with the correct Xensor code.
application oriented.

Thermal Conductivity Gauge XEN-TCG3880 for gas type measurement and vacuum measurement
Xensor Integration bv Smart Sensor Devices
Distributieweg 28 2645 EJ Delfgauw The Netherlands
Phone +31 (0)15-2578040 Founded 18 May 1988 Fax +31 (0)15-2578050 Trade reg. 27227437 Email [email protected] Site www.xensor.nl
ABN-AMRO 60 50 40 311 IBAN NL42ABNA0605040311
VAT NL 009122746 B01
copyright Xensor Integration 19 March 2018 page 11 of 39
4.1 Selection guide for the Xensor TCG, ordering oriented
To order the correct TCG, you can use the 5 steps below. In brackets a code is given to indicate the chosen option. 1) Choose between:
a. the sensing element, without electronics (XEN-TCG3880). Go to step 4).
b. the sensing element with read-out electronics (XEN-5320 series).
2) Choose the desired version with read-out electronics (see the data sheets for these devices
for more details, www.xensor.nl/index.php/products/product-overview):
a. XEN-5320-U(H): USB /analog output (definition of the analog output optional). Options are
burst output and τ-measurement.
Size 4 x 2 cm, PCB only. Housing (H) optional.
b. XEN-5320-W: WIFI / USB output.
Size 6 x 5 x 2.2 cm, PCB and battery in housing.
3) Choose options for the versions with read-out electronics:
a. Make the choices of step 5) for the sensing element on the PCB board.
b. For XEN-5320: choose what parameter and range the analog output will represent, and
choose the digital output calibration curve (gas type).
c. For all versions: indicate if special calibration curves are required (other than He, H2, general
or vacuum).
d. The standard sensing element on read-out electronics is the P2-R-W version (see step 5)
directly soldered onto the PCB (without socket).
For non standard sensing elements, a socket is added on the PCB for exchanging sensing
elements.
e. When not using the TO-5 header, contact Xensor for a customized version.
4) Choose the housing of the sensing element:
a. Naked die (N), no housing.
b. Standard TO-5 header (also standard for the read-out electronics versions).
c. Optional LCC-20 ceramic housing (LCC).
d. Customized housing: contact Xensor. See also the webpage on Hydrogen Specials.
5) Choose additional options for the sensing element (see Par. 4.2):
a. For naked die: available is a silicon carrier or silicon beams to ventilate the etched cavity.
b. For all versions: option is a silicon roof to reduce flow sensitivity (R).
c. For all versions: gold metallization and wire bonds (G) to reduce corrosion sensitivity.
d. For TO-5 / LCC-20 versions: temperature measurement element Pt100 or Pt1000 (P2 or P3).
e. For TO-5 versions: welded cap with a 5 mm Ø filter to mechanically protect and reduce flow
sensitivity (W). Time constant t90 is typically 0.5 s, without cap typically 0.1 s.
f. For TO-5 versions: KF-16 vacuum flange (KF16), includes (W).
g. For TO-5 versions: calibration adapter to conduct flow over the sensing element (XEN-
85030).
h. For TO-5 versions: ultra-fast sensing construction (U), time constant typically < 0.05 s.
i. For TO-5 versions: a TO-5 10-pins socket is available (XEN-80010) and a PCB-mounted ver-
sion (XEN-80011).
Thermal Conductivity Gauge XEN-TCG3880 for gas type measurement and vacuum measurement
Xensor Integration bv Smart Sensor Devices
Distributieweg 28 2645 EJ Delfgauw The Netherlands
Phone +31 (0)15-2578040 Founded 18 May 1988 Fax +31 (0)15-2578050 Trade reg. 27227437 Email [email protected] Site www.xensor.nl
ABN-AMRO 60 50 40 311 IBAN NL42ABNA0605040311
VAT NL 009122746 B01
copyright Xensor Integration 19 March 2018 page 12 of 39
4.2 Selection guide for the Xensor TCG, application oriented
Choose a sensing element without or with read-out electronics and options, according to your requirements.
Requirement Choice Small naked die (N, 3.3 x 2.5 x 0.3 mm3 excluding bonding wires)
die in housing (LCC-20, 9 x 9 x 1 mm3 or TO-5, ≈10 x 10 x 10 mm3),
XEN-5320-USB (4 x 2 x 1 cm3)
Fast ultra-fast sensing element (U, <0.05 s);
sensing element without cap (0.2 s);
XEN-5320 with high&burst data rate (up to 60 & 750 Hz) and the above;
standard version with cap time constant ca 0.5 s, depending on gas type
Flow insensitive silicon roof (R), and/or cap with filter (W).
Mechanically protected TO-5 with cap with filter
Analog output sensing element only;
XEN-5320-USB and use analog output
Digital output XEN-5320 USB or WIFI
Corrosion insensitive gold metallization and gold bonding wires (G)
Temperature measurement Pt100 (P2) or Pt1000 (P3)
RH measurement XEN-5320
Burst or τ-measurement XEN-5320-USB (1.3 ms interval)
One binary gas mix XEN-5320
Various gas mixes XEN-5320
Measure gas in tube flow calibration adapter XEN-85030

Thermal Conductivity Gauge XEN-TCG3880 for gas type measurement and vacuum measurement
Xensor Integration bv Smart Sensor Devices
Distributieweg 28 2645 EJ Delfgauw The Netherlands
Phone +31 (0)15-2578040 Founded 18 May 1988 Fax +31 (0)15-2578050 Trade reg. 27227437 Email [email protected] Site www.xensor.nl
ABN-AMRO 60 50 40 311 IBAN NL42ABNA0605040311
VAT NL 009122746 B01
copyright Xensor Integration 19 March 2018 page 13 of 39
4.3 Overview of the XEN-TCG3880 versions
Choosing the right XEN-TCG3880 version The XEN-TCG3880 is widely used for measuring binary gas composition or vacuum pressure. Table 4.1 gives the various options to select from, and the code for that. Below Table 4.1 some examples are given of applications, and which version is optimal for that application. Table 4.1: XEN-TCG3880 versions
Version Pt1000 (or Pt100) Roof Welded grounded cap with filter Housing / others
Standard version XEN-TCG3880
no no Separate cap TO-5
Add following letters:
-N no no no Naked die
-P2 Pt100
-P3 Pt1000
-R Option Roof
-W Option Option Welded cap
-KF Option Option Included TO-5 + KF16 flange
-LCC Option Option no LCC-20nn
-G Option Option Option Gold metallization
4.3.1 Standard version
In the standard version a 10-pins TO-5 header is taken, a silicon carrier (Fig. 4.2) is glued on the header, and the sensor chip (Fig. 4.2), with a micro-machined membrane, is glued on the carrier. The carrier serves to ventilate the etched cavity underneath the membrane. The sensor chip is electrically connected to the TO-5 header with aluminum bonding wires. See Fig. 4.1
Figure 4.1: XEN-TCG3880 Standard Figure 4.2: XEN-TCG3880-N Naked die + Si carrier
Thermal Conductivity Gauge XEN-TCG3880 for gas type measurement and vacuum measurement
Xensor Integration bv Smart Sensor Devices
Distributieweg 28 2645 EJ Delfgauw The Netherlands
Phone +31 (0)15-2578040 Founded 18 May 1988 Fax +31 (0)15-2578050 Trade reg. 27227437 Email [email protected] Site www.xensor.nl
ABN-AMRO 60 50 40 311 IBAN NL42ABNA0605040311
VAT NL 009122746 B01
copyright Xensor Integration 19 March 2018 page 14 of 39
4.3.2 Naked die
Many customers use naked die (Fig. 4.2) to include in their own packages to monitor the pres-sure after vacuum sealing. It is recommended to make a calibration curve of the naked die mounted in the package when first applying the sensor (see the Par. on Application as a vac-uum sensor). This can serve as a guide to estimate the pressure of subsequent devices. The best accuracy is obtained at pressures between 0.1 Pa and 1 kPa. To order add ‘N’ to the sensor code. Compatible with G. Pt1000 or Pt100 and roofs can be or-dered separately, also the silicon carriers (see Fig. 4.2) can be ordered separately. Naked die are shipped on Gel Pak trays, to release the chips gently evacuate from below the tray, see Fig. 4.3.
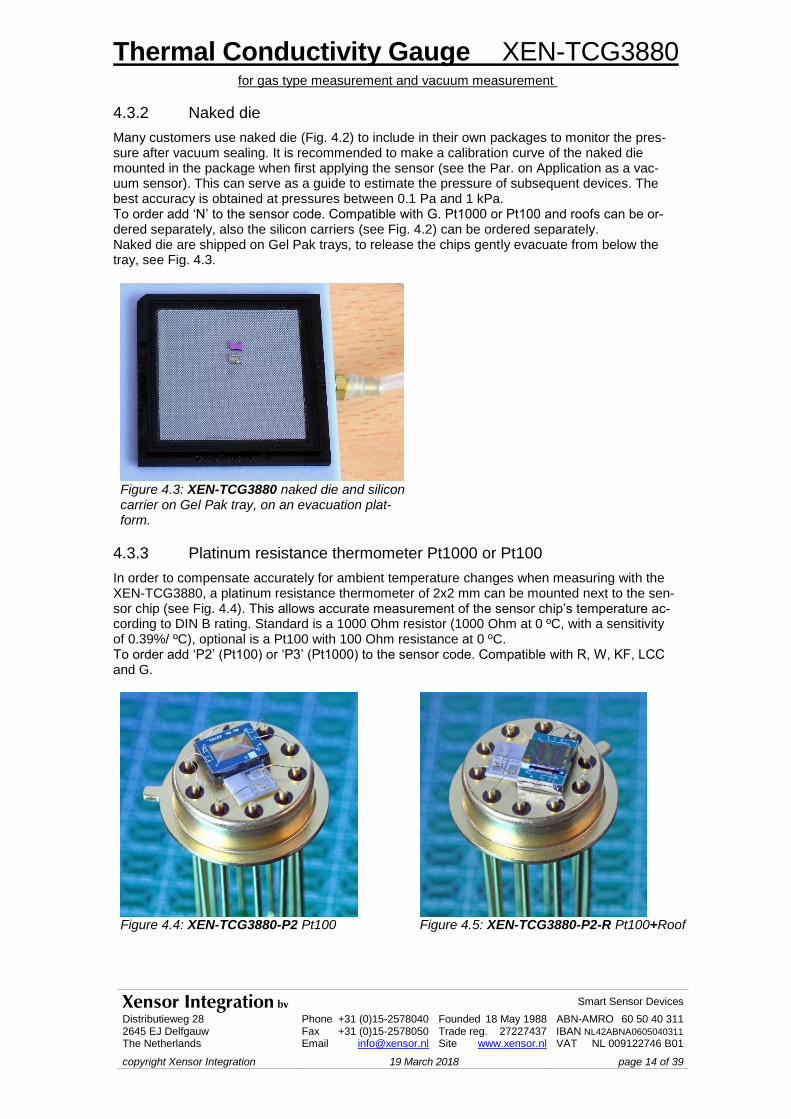
Figure 4.3: XEN-TCG3880 naked die and silicon carrier on Gel Pak tray, on an evacuation plat-form.
4.3.3 Platinum resistance thermometer Pt1000 or Pt100
In order to compensate accurately for ambient temperature changes when measuring with the XEN-TCG3880, a platinum resistance thermometer of 2x2 mm can be mounted next to the sen-sor chip (see Fig. 4.4). This allows accurate measurement of the sensor chip’s temperature ac-cording to DIN B rating. Standard is a 1000 Ohm resistor (1000 Ohm at 0 ºC, with a sensitivity of 0.39%/ ºC), optional is a Pt100 with 100 Ohm resistance at 0 ºC. To order add ‘P2’ (Pt100) or ‘P3’ (Pt1000) to the sensor code. Compatible with R, W, KF, LCC and G.
Figure 4.4: XEN-TCG3880-P2 Pt100 Figure 4.5: XEN-TCG3880-P2-R Pt100+Roof
Thermal Conductivity Gauge XEN-TCG3880 for gas type measurement and vacuum measurement
Xensor Integration bv Smart Sensor Devices
Distributieweg 28 2645 EJ Delfgauw The Netherlands
Phone +31 (0)15-2578040 Founded 18 May 1988 Fax +31 (0)15-2578050 Trade reg. 27227437 Email [email protected] Site www.xensor.nl
ABN-AMRO 60 50 40 311 IBAN NL42ABNA0605040311
VAT NL 009122746 B01
copyright Xensor Integration 19 March 2018 page 15 of 39
4.3.4 Roof
A so called roof is a silicon heat sink glued over the hot spot of the membrane, to create a heat sink at 100 μm distance from the membrane (see Fig. 4.5). This has two applications. Firstly, any gas flows present around the sensor are blocked by the roof from reaching the hot mem-brane, so the flow sensitivity of the sensor is drastically diminished. The roof option is therefore interesting when measuring in the presence of flows. Secondly, the heat sink close by increases the upper vacuum pressure at which the sensor can measure by roughly a factor 3. So, the roof option can also be of interest when using the sensor as a vacuum sensor. To order add ‘R’ to the sensor code. Compatible with P2, P3, W, KF, LCC and G.
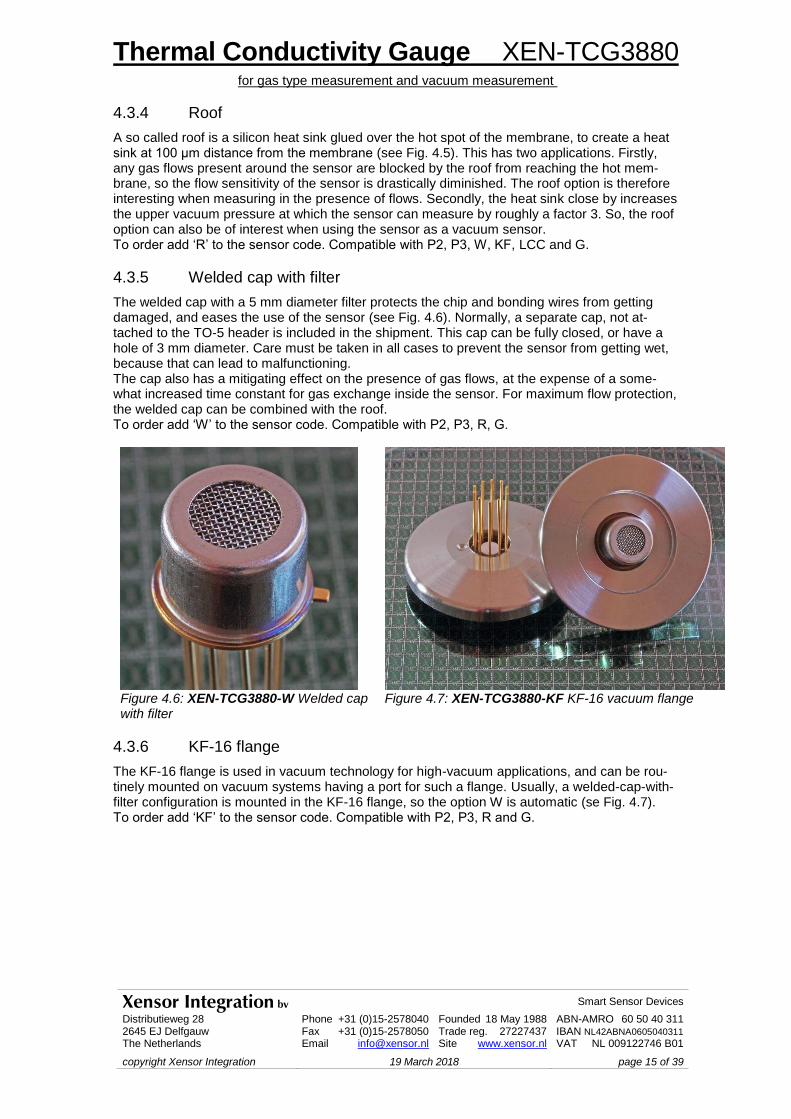
4.3.5 Welded cap with filter
The welded cap with a 5 mm diameter filter protects the chip and bonding wires from getting damaged, and eases the use of the sensor (see Fig. 4.6). Normally, a separate cap, not at-tached to the TO-5 header is included in the shipment. This cap can be fully closed, or have a hole of 3 mm diameter. Care must be taken in all cases to prevent the sensor from getting wet, because that can lead to malfunctioning. The cap also has a mitigating effect on the presence of gas flows, at the expense of a some-what increased time constant for gas exchange inside the sensor. For maximum flow protection, the welded cap can be combined with the roof. To order add ‘W’ to the sensor code. Compatible with P2, P3, R, G.
Figure 4.6: XEN-TCG3880-W Welded cap with filter
Figure 4.7: XEN-TCG3880-KF KF-16 vacuum flange
4.3.6 KF-16 flange
The KF-16 flange is used in vacuum technology for high-vacuum applications, and can be rou-tinely mounted on vacuum systems having a port for such a flange. Usually, a welded-cap-with-filter configuration is mounted in the KF-16 flange, so the option W is automatic (se Fig. 4.7). To order add ‘KF’ to the sensor code. Compatible with P2, P3, R and G.
Thermal Conductivity Gauge XEN-TCG3880 for gas type measurement and vacuum measurement
Xensor Integration bv Smart Sensor Devices
Distributieweg 28 2645 EJ Delfgauw The Netherlands
Phone +31 (0)15-2578040 Founded 18 May 1988 Fax +31 (0)15-2578050 Trade reg. 27227437 Email [email protected] Site www.xensor.nl
ABN-AMRO 60 50 40 311 IBAN NL42ABNA0605040311
VAT NL 009122746 B01
copyright Xensor Integration 19 March 2018 page 16 of 39
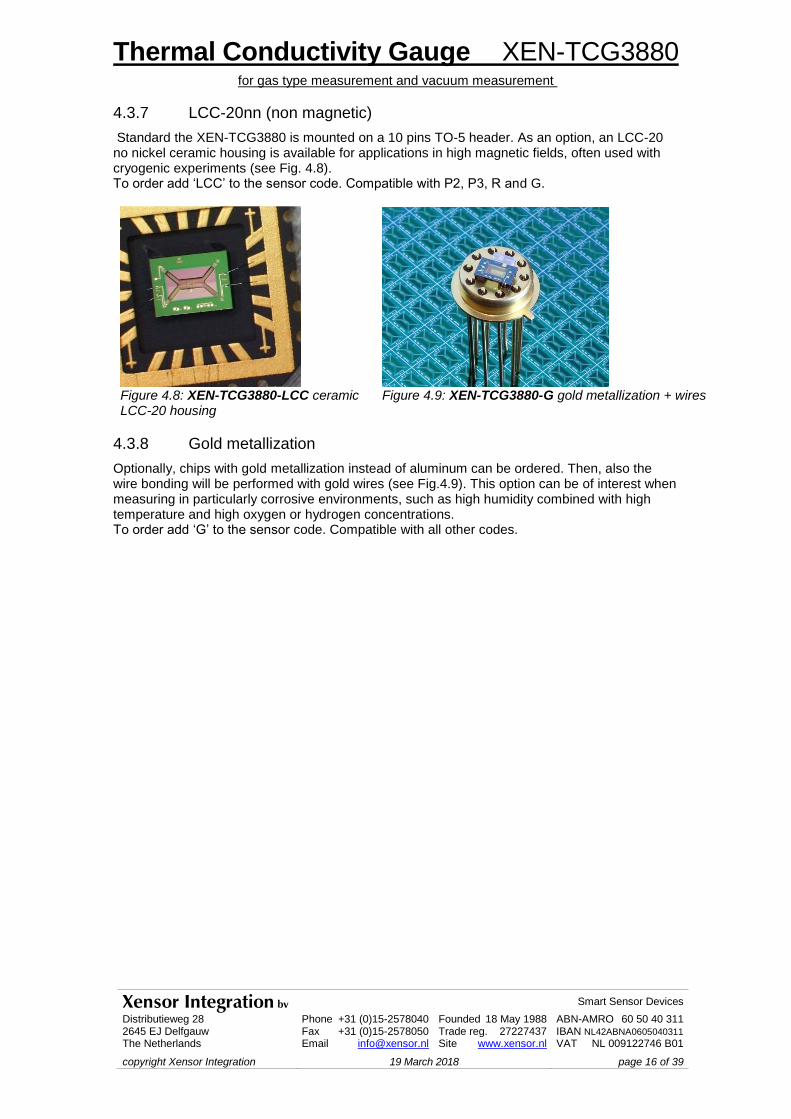
4.3.7 LCC-20nn (non magnetic)
Standard the XEN-TCG3880 is mounted on a 10 pins TO-5 header. As an option, an LCC-20 no nickel ceramic housing is available for applications in high magnetic fields, often used with cryogenic experiments (see Fig. 4.8). To order add ‘LCC’ to the sensor code. Compatible with P2, P3, R and G.
Figure 4.8: XEN-TCG3880-LCC ceramic LCC-20 housing
Figure 4.9: XEN-TCG3880-G gold metallization + wires
4.3.8 Gold metallization
Optionally, chips with gold metallization instead of aluminum can be ordered. Then, also the wire bonding will be performed with gold wires (see Fig.4.9). This option can be of interest when measuring in particularly corrosive environments, such as high humidity combined with high temperature and high oxygen or hydrogen concentrations. To order add ‘G’ to the sensor code. Compatible with all other codes.

Thermal Conductivity Gauge XEN-TCG3880 for gas type measurement and vacuum measurement
Xensor Integration bv Smart Sensor Devices
Distributieweg 28 2645 EJ Delfgauw The Netherlands
Phone +31 (0)15-2578040 Founded 18 May 1988 Fax +31 (0)15-2578050 Trade reg. 27227437 Email [email protected] Site www.xensor.nl
ABN-AMRO 60 50 40 311 IBAN NL42ABNA0605040311
VAT NL 009122746 B01
copyright Xensor Integration 19 March 2018 page 17 of 39
5 Extended description and general notes on use
5.1 Sensor description
The thermal conductivity gauge XEN-TCG3880 is a thin-film-thermopile thermal conductivity sensor closely related to the traditional thermocouple gauge and the Pirani gauge. It has been designed with a silicon-nitride closed-membrane structure to give high sensitivity and resolution. The measurement principle relies on the decrease in effective thermal resistance between the sensitive area of the sensor and the ambient, caused by the thermal conductance of the surrounding gas. As such, it can measure:
type of gas molecules (thermal conductivity measurement).
pressure of the gas molecules (vacuum measurement). The stability and accuracy of the thin-film-thermopile vacuum sensors compare favorably with standard Pirani gauges. The sensor is standard mounted in a TO-5 header, but different housings (such as LCC-20 and encapsulation in KF-16 and KF-40 vacuum flanges) are also available.
5.2 Sensor operation principle
The thermal conductivity gauge performs a measurement of the thermal resistance between the hot junctions of its thermopile in the center of the membrane, and the cold junctions on the thick rim of the chip. This is achieved by heating the center of the membrane using the heater resistor Rheat. The resulting temperature increase of the center is measured by the thermopile. The actual temperature increase depends upon the effective thermal resistance between membrane center and ambient, this is influenced by factors such as thermal resistance of the membrane, that of the ambient gas, any present gas flows, and (usually negligible) emitted radiation. Care must be taken to avoid significant incident radiation. The basic theory of the XEN-TCG3880 measurement operation is given by the following formulae:
Uout = Pin Stp / (Gmem + Ggas) where Uout is the output voltage of the sensor's thermopile in Volt, Pin is the input heating power in Watt, which is given by
Pin = Uheat Iheat = Uheat2 /Rheat = Iheat
2 Rheat with Uheat as the heating voltage over and Iheat as the heating current through the heating re-sistance Rheat. Note, that the value of Rheat is temperature dependent, so that the power dissipated in Rheat is also temperature dependent, if the heating is performed from a pure voltage or current source. To eliminate in first order this temperature dependence of Pin, you can heat from a voltage (or current) source with an internal series resistance equal to Rheat. Another approach is to have a temperature-independent series resistance Rseries, and measure the voltage Useries across that resistance. The input power is then given by:
Pin = Uheat Iheat = Uheat x Useries /Rseries
The thermopile sensitivity Stp is determined by the technology and thermoelectric characteristics of the sensor, in the case of XEN-TCG3880 it consists of 12 thermostrips, 6 n-type and 6 p-type polysilicon strips which each give a sensitivity of about 0.2 mV/K. In total, the intrinsic thermopile sensitivity is about 2.4 mV/K. However, the thermopile does not exactly measure the temperature of the heater, and the effective sensitivity of the thermopile, when measuring the heater temper-ature increase versus the silicon frame is only 1.3 mV/K. These values are dependent upon tem-perature.
Thermal Conductivity Gauge XEN-TCG3880 for gas type measurement and vacuum measurement
Xensor Integration bv Smart Sensor Devices
Distributieweg 28 2645 EJ Delfgauw The Netherlands
Phone +31 (0)15-2578040 Founded 18 May 1988 Fax +31 (0)15-2578050 Trade reg. 27227437 Email [email protected] Site www.xensor.nl
ABN-AMRO 60 50 40 311 IBAN NL42ABNA0605040311
VAT NL 009122746 B01
copyright Xensor Integration 19 March 2018 page 18 of 39
Finally, the output signal (or transfer which is the output voltage divided by the input power) also depends on the thermal conductance to the ambient. This conductance is built-up by three com-ponents. The first component is the thermal conductance through the membrane Gmem, which is some-what temperature dependent but otherwise fixed. The component important for the sensing action is the thermal conductance through the am-bient gas Ggas. It is the exact value of this last conductance which we want to determine. Around atmospheric pressure (1013 mbar) it is independent of the pressure, and solely a function of gas composition. At pressures below 1 bar, it becomes dependent upon the absolute pressure, and there the sensor can be used for pressure measurement. At elevated pressures (1-100 bar) and room temperature there is usually only a slight dependence of the thermal conductivity of gases on pressures (increasing by some percents), but this is not true for gases (such as Xenon) whose critical point lies near room temperature and in the 1-100 bar range). Note, that flow can increase the heat taken away from the membrane, just as in a regular flow sensor. As such, the XEN-TCG3880 can also be used for flow sensing. If you want to measure only gas composition, any flows over the membrane are best avoided, therefore. A third component is the thermal conductance through infrared radiation Grad, but this can usually be neglected. It has not been included in the formulae. The thermal conductance Ggas is described below, in which we assume that a heat sink is present above and below the membrane of the sensor. For very low pressures the thermal conductance G between two parallel plates (in W/m2K) is given by: G = GoP where Go is the thermal conductivity in W/m2KPa, and P the pressure in Pa. For atmospheric pressures G is given by: G = K / d where K is the thermal conductivity (in W/Km) and d is the distance between the plates. For the whole pressure range the formula becomes: G = Go {(PPt)/(P+Pt)} Where Pt is the transition pressure, where the thermal conductance in the molecular regime
equals that in the viscous regime. Pt depends, upon other things, upon the free mean path between collisions of the molecules and the plate distance d. Table 5.1 gives the transition pres-sure and free mean paths for several gases. For vacuum sensors, the value of Pt should be as high as possible, and the plate distance should therefore be as low as possible. This can be achieved by attaching a heat sink very close above the membrane of the XEN-TCG3880, at for
instance, 30 m distance. This will increase the Pt by a factor of 10 compared to the heat sink
below the membrane at 300 m. Table 5.1: Thermal conductivity and free mean paths for selected gases
Gas type at 1 Pa in mm
Pt at 0.3 mm
in Pa
Go
in W/m2KPa
K
in mW/Km
G (1 bar, d 0.3 mm)
in W/m2K
argon 7.1 90 0.66 18.0 60 helium 19.8 600 0.84 151.0 500 nitrogen 6.7 90 0.95 25.7 86 oxygen 7.3 90 1.00 26.2 87 water vapor 4.6 35 1.90 19.9 66
Thermal Conductivity Gauge XEN-TCG3880 for gas type measurement and vacuum measurement
Xensor Integration bv Smart Sensor Devices
Distributieweg 28 2645 EJ Delfgauw The Netherlands
Phone +31 (0)15-2578040 Founded 18 May 1988 Fax +31 (0)15-2578050 Trade reg. 27227437 Email [email protected] Site www.xensor.nl
ABN-AMRO 60 50 40 311 IBAN NL42ABNA0605040311
VAT NL 009122746 B01
copyright Xensor Integration 19 March 2018 page 19 of 39
5.3 Temperature coefficient of the XEN-TCG3880
To get an idea of the Temperature Coefficient (TC) of the XEN-TCG3880 we will evaluate the output voltage Utp (in V) of the XEN-TCG3880 thermopile as given by the following formula:
Uout = Utp = Pin Ns Rth
where Pin is the input power in W, Ns is the sensitivity of the thermopile in V/K (N is the number
of strips and s is the average Seebeck coefficient per strip) and Rth is the thermal resistance in K/W. All these three factors are temperature dependent.
TC of the power Power is supplied by biasing the polysilicon heating resistor Rh ( 600 ). The temperature co-
efficient of this resistor is about 0.1 %/K (0.6 /K). If we bias with a temperature-independent voltage Uh, the power is equal to Uh
2/Rh and the temperature coefficient of the power is –0.1 %/K, the inverse of that of the heating resistor. If we bias with a current Ih (or from a voltage source with a large resistance in series), the power is Ih2Rh and the TC is now +0.1 %/K, the same as the TC of Rh.
This allows us to vary the overall TC by 0.1 %/K by using either voltage or current biasing. By biasing from a voltage source with a series resistance equal to Rh the TC of the power becomes approximately zero.
TC of the thermopile The thermopile sensitivity Ns has a technologically determined TC, and for the XEN-TCG3880 it is approximately +0.15 %/K at room temperature. This means that the thermopile output will rise approximately 0.15%/K for a given temperature difference across the thermopile.
TC of the thermal resistance The most complicated factor is the thermal resistance. The thermal resistance and its TC de-pend upon the use of the sensor. In vacuum At low pressures (1 Pa or less), the thermal resistance is almost completely determined by the membrane. For the XEN-TCG3880, the thermal resistance of the membrane is determined largely by the (low-stress LPCVD) silicon-nitride. That means that the TC in vacuum is deter-mined by that of the SiN (which is estimated to be +0.05 %/K). Using the XEN-TCG3880 as gas type sensor When using the TCG to determine gas type or gas mixtures, the situation is different. For air at atmospheric pressure (100 kPa), the output of the TCG is only 25% of the output at 0 Pa. That means that the thermal conductance Gth to the ambient (the inverse of the thermal re-sistance) is roughly determined for 75% by gas conduction. Thus, the TC of the gas conduction will contribute for 75% to the TC of the thermal resistance. The TC of the thermal conductivity of gases is typically of the order of +0.3 %/K at room temperature, which means that the thermal resistance due to gas conductance will decrease with increasing temperature. For air, with a TC of the conductivity of 0.29 %/K, assuming that the membrane resistance will increase at a rate
of 0.05 %/K, this will give a TC of Rth of 0.250.05%/K + 0.75-0.29%/K = -0.2 %/K. When the sensor is immersed in pure helium, the situation becomes different again. The output is decreased by another factor of 4, because of the high thermal conductivity of helium. Now, Rth is almost entirely determined by the helium, and the TC of Rth also. The TC of the conductivity of helium is about 0.24 %/K at room temperature, so that the TC of Rth is now slightly larger at –0.24 %/K.
Thermal Conductivity Gauge XEN-TCG3880 for gas type measurement and vacuum measurement
Xensor Integration bv Smart Sensor Devices
Distributieweg 28 2645 EJ Delfgauw The Netherlands
Phone +31 (0)15-2578040 Founded 18 May 1988 Fax +31 (0)15-2578050 Trade reg. 27227437 Email [email protected] Site www.xensor.nl
ABN-AMRO 60 50 40 311 IBAN NL42ABNA0605040311
VAT NL 009122746 B01
copyright Xensor Integration 19 March 2018 page 20 of 39
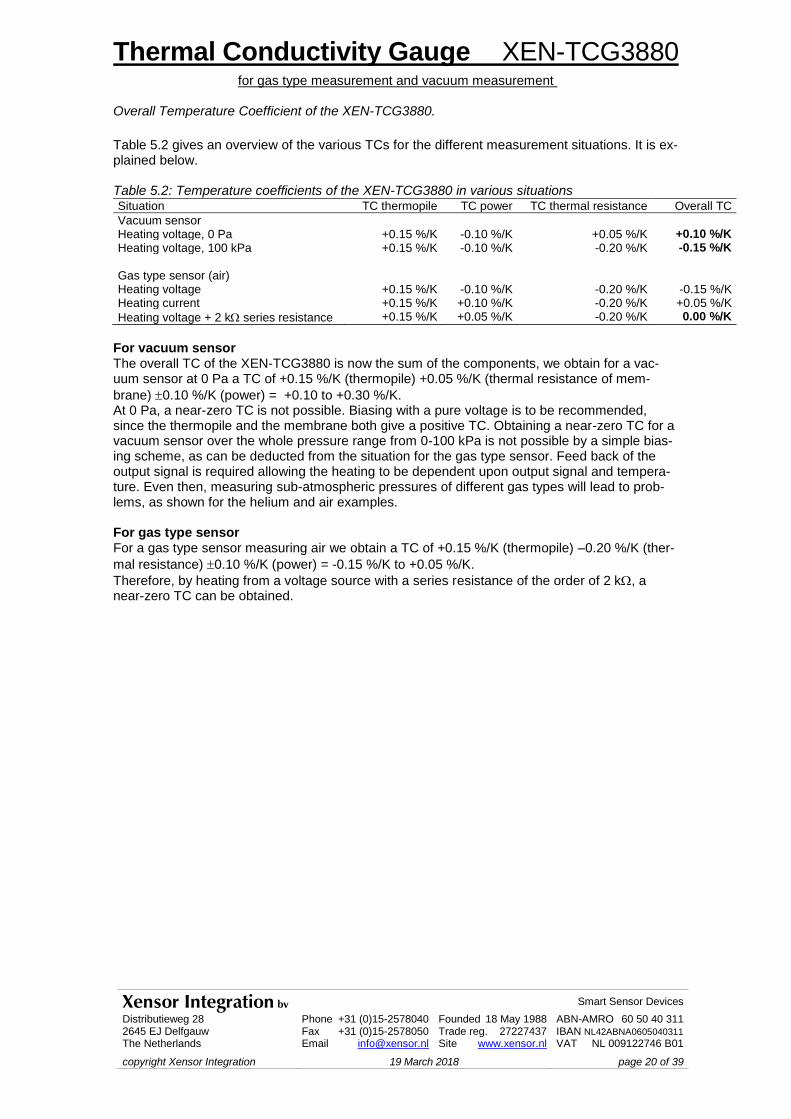
Overall Temperature Coefficient of the XEN-TCG3880.
Table 5.2 gives an overview of the various TCs for the different measurement situations. It is ex-plained below. Table 5.2: Temperature coefficients of the XEN-TCG3880 in various situations Situation TC thermopile TC power TC thermal resistance Overall TC
Vacuum sensor
Heating voltage, 0 Pa +0.15 %/K -0.10 %/K +0.05 %/K +0.10 %/K
Heating voltage, 100 kPa +0.15 %/K -0.10 %/K -0.20 %/K -0.15 %/K
Gas type sensor (air)
Heating voltage +0.15 %/K -0.10 %/K -0.20 %/K -0.15 %/K Heating current +0.15 %/K +0.10 %/K -0.20 %/K +0.05 %/K
Heating voltage + 2 k series resistance +0.15 %/K +0.05 %/K -0.20 %/K 0.00 %/K
For vacuum sensor The overall TC of the XEN-TCG3880 is now the sum of the components, we obtain for a vac-uum sensor at 0 Pa a TC of +0.15 %/K (thermopile) +0.05 %/K (thermal resistance of mem-
brane) 0.10 %/K (power) = +0.10 to +0.30 %/K. At 0 Pa, a near-zero TC is not possible. Biasing with a pure voltage is to be recommended, since the thermopile and the membrane both give a positive TC. Obtaining a near-zero TC for a vacuum sensor over the whole pressure range from 0-100 kPa is not possible by a simple bias-ing scheme, as can be deducted from the situation for the gas type sensor. Feed back of the output signal is required allowing the heating to be dependent upon output signal and tempera-ture. Even then, measuring sub-atmospheric pressures of different gas types will lead to prob-lems, as shown for the helium and air examples. For gas type sensor For a gas type sensor measuring air we obtain a TC of +0.15 %/K (thermopile) –0.20 %/K (ther-
mal resistance) 0.10 %/K (power) = -0.15 %/K to +0.05 %/K.
Therefore, by heating from a voltage source with a series resistance of the order of 2 k, a near-zero TC can be obtained.
Thermal Conductivity Gauge XEN-TCG3880 for gas type measurement and vacuum measurement
Xensor Integration bv Smart Sensor Devices
Distributieweg 28 2645 EJ Delfgauw The Netherlands
Phone +31 (0)15-2578040 Founded 18 May 1988 Fax +31 (0)15-2578050 Trade reg. 27227437 Email [email protected] Site www.xensor.nl
ABN-AMRO 60 50 40 311 IBAN NL42ABNA0605040311
VAT NL 009122746 B01
copyright Xensor Integration 19 March 2018 page 21 of 39
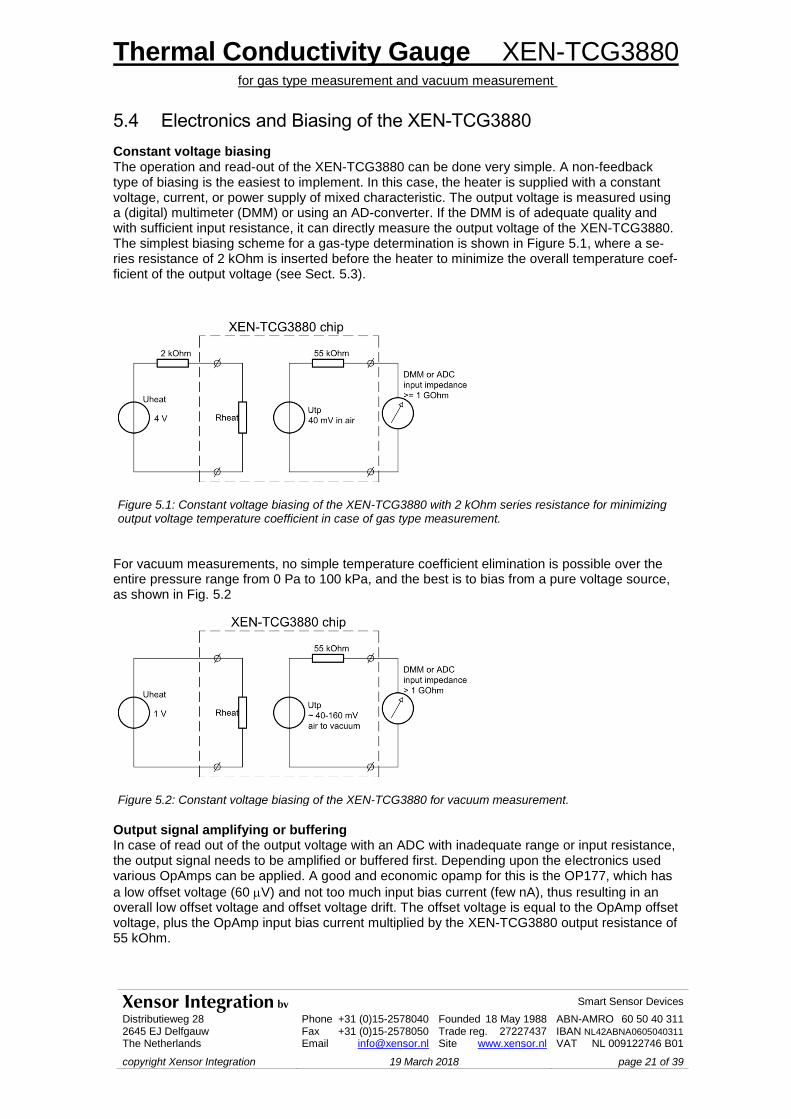
5.4 Electronics and Biasing of the XEN-TCG3880
Constant voltage biasing The operation and read-out of the XEN-TCG3880 can be done very simple. A non-feedback type of biasing is the easiest to implement. In this case, the heater is supplied with a constant voltage, current, or power supply of mixed characteristic. The output voltage is measured using a (digital) multimeter (DMM) or using an AD-converter. If the DMM is of adequate quality and with sufficient input resistance, it can directly measure the output voltage of the XEN-TCG3880. The simplest biasing scheme for a gas-type determination is shown in Figure 5.1, where a se-ries resistance of 2 kOhm is inserted before the heater to minimize the overall temperature coef-ficient of the output voltage (see Sect. 5.3).
For vacuum measurements, no simple temperature coefficient elimination is possible over the entire pressure range from 0 Pa to 100 kPa, and the best is to bias from a pure voltage source, as shown in Fig. 5.2
Figure 5.2: Constant voltage biasing of the XEN-TCG3880 for vacuum measurement.
Output signal amplifying or buffering In case of read out of the output voltage with an ADC with inadequate range or input resistance, the output signal needs to be amplified or buffered first. Depending upon the electronics used various OpAmps can be applied. A good and economic opamp for this is the OP177, which has
a low offset voltage (60 V) and not too much input bias current (few nA), thus resulting in an overall low offset voltage and offset voltage drift. The offset voltage is equal to the OpAmp offset voltage, plus the OpAmp input bias current multiplied by the XEN-TCG3880 output resistance of 55 kOhm.
Figure 5.1: Constant voltage biasing of the XEN-TCG3880 with 2 kOhm series resistance for minimizing output voltage temperature coefficient in case of gas type measurement.
Thermal Conductivity Gauge XEN-TCG3880 for gas type measurement and vacuum measurement
Xensor Integration bv Smart Sensor Devices
Distributieweg 28 2645 EJ Delfgauw The Netherlands
Phone +31 (0)15-2578040 Founded 18 May 1988 Fax +31 (0)15-2578050 Trade reg. 27227437 Email [email protected] Site www.xensor.nl
ABN-AMRO 60 50 40 311 IBAN NL42ABNA0605040311
VAT NL 009122746 B01
copyright Xensor Integration 19 March 2018 page 22 of 39
The OP177 has, however, the disadvantage that it does not have a rail-to-rail input or output voltage. For applications where you want to use a single 0-5 V power supply, other OpAmps with rail-to-rail operation at 0-5 V power supply are preferred. Here you should also consider the offset voltage and the input bias current of the OpAmp. Chopper stabilized OpAmps with very
low offset (1 V) and very low input bias currents (picoAmps) can also be interesting in combi-nation with the XEN-TCG3880. Usually speed and slew rate are of less importance, while noise, particularly for chopper OpAmps, might be of importance. A good loop gain can be important to obtain a good input impedance and thus a good accuracy. Feedback biasing Using feedback, the output voltage of the sensor can be stabilized or given a predetermined pattern by electronically adjusting the biasing of the heater. Here, more elaborate electronics can be required with a DAC imposing the desired output voltage to be compared with the actual output voltage. Such electronics are beyond the scope of this application note.

Thermal Conductivity Gauge XEN-TCG3880 for gas type measurement and vacuum measurement
Xensor Integration bv Smart Sensor Devices
Distributieweg 28 2645 EJ Delfgauw The Netherlands
Phone +31 (0)15-2578040 Founded 18 May 1988 Fax +31 (0)15-2578050 Trade reg. 27227437 Email [email protected] Site www.xensor.nl
ABN-AMRO 60 50 40 311 IBAN NL42ABNA0605040311
VAT NL 009122746 B01
copyright Xensor Integration 19 March 2018 page 23 of 39
6 Application: gas sensing
6.1 Introduction
One of the main applications of the XEN-TCG3880 is gas composition measurement. Measure-ment of hydrogen in air or nitrogen and helium in air or oxygen is particularly attractive, due to the fact that the thermal conductivities of hydrogen (180 mW/Km) and helium (150 mW/Km) are so very different from air, nitrogen and oxygen (26 mW/Km). Application of hydrogen measurement is found in leak detection where hydrogen is used as tracer gas (helium is also used for this application). But also unwanted leakage of hydrogen out of fuel cells or hydrogen storage tanks can be detected very well using thermal conductivity gauges. Helium measurement is applied in lung function measurement equipment, where the total volume of a human's (or animal's?) lung can be determined by a helium dilution measurement. Another application is found in diving, where air-helium or oxygen-helium mixtures are used for deep dives, the sensor can be used for measurement of the composition of the diving mix. An application that is not possible is the detection of carbonmonoxide (CO), for safety applica-tions. Because the thermal conductivity of air and CO are practically the same, detection of CO in air is very difficult using thermal conductivity, while trace amounts of CO in the 30-ppm range can already be dangerous.
6.2 Output curves for gas mixtures
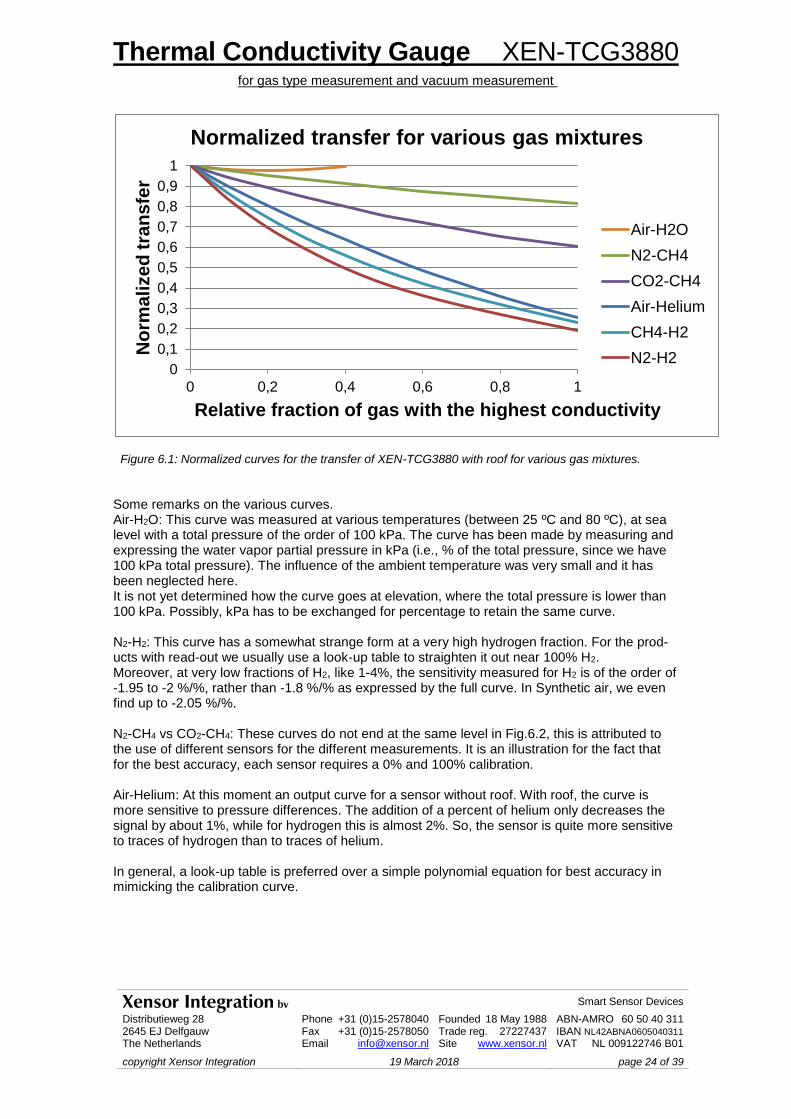
Below, the normalized curves of the sensor’s output voltage or transfer (output voltage divided by the input power in V/W) are given for various gas mixtures. The typical inaccuracy of such curves is of the order of 1-3% Full Scale. To reach this inaccuracy level, it is always recom-mended that the user calibrates his sensor at 0% and 100% of either gas in the binary mixture. The calibration curves that are given below are not traceable to any national or international standards. Traceable calibration curves can be provided on request, for specific sensors. Xensor offers the XEN-TCG3880 with or without a silicon roof, which is a silicon heat sink at ap-proximately 100 μm distance from the sensitive membrane. The presence or absence of the roof slightly changes the transfer of the sensor, so care must be taken to use the appropriate curve. The general curve is now of the form :
S = So {1 + b1 B + b2 B2 + b3 B3} where S is the transfer in V/W of the sensor for the mixture, So is the transfer for 100% gas A, and B is the fraction (between 0 and 1) of gas B being mixed into gas A. In Fig. 6.1 some nor-malized curves are shown, Table 6.1 gives the curve coefficients. Fig.6.2 gives the same curves, but now not normalized. Table 6.1: Typical values for gas-mixture calibration curves of the XEN-TCG3880
Gas A Gas B So (A) So (B) b1 b2 b3 Roof V or V/W Air H2O 21 V/W To 40% H2O -0.245 0.75 -0.42 Yes V/W N2 CH4 21 V/W 17.2 V/W -0.239 +0.054 - Yes V/W CO2 CH4 29.5 V/W 17.7 V/W -0.572 +0.175 - Yes V/W Air Helium 21 V/W 4.9 V/W -1.0203 +0.2752 - No V CH4 N2 17 V/W 3.94 V/W -1.464 1.035 -0.34 Yes V/W N2 H2 21 V/W 4.0 V/W -1.8* +1.6 -0.61 Yes V/W
* For small fraction of H2 in N2 a sensitivity of the order of -1.95%/% is found, rather than -1.8%/%. For different measurements different sensors have been used, so S0 values can differ.
Thermal Conductivity Gauge XEN-TCG3880 for gas type measurement and vacuum measurement
Xensor Integration bv Smart Sensor Devices
Distributieweg 28 2645 EJ Delfgauw The Netherlands
Phone +31 (0)15-2578040 Founded 18 May 1988 Fax +31 (0)15-2578050 Trade reg. 27227437 Email [email protected] Site www.xensor.nl
ABN-AMRO 60 50 40 311 IBAN NL42ABNA0605040311
VAT NL 009122746 B01
copyright Xensor Integration 19 March 2018 page 24 of 39
Figure 6.1: Normalized curves for the transfer of XEN-TCG3880 with roof for various gas mixtures.
Some remarks on the various curves. Air-H2O: This curve was measured at various temperatures (between 25 ºC and 80 ºC), at sea level with a total pressure of the order of 100 kPa. The curve has been made by measuring and expressing the water vapor partial pressure in kPa (i.e., % of the total pressure, since we have 100 kPa total pressure). The influence of the ambient temperature was very small and it has been neglected here. It is not yet determined how the curve goes at elevation, where the total pressure is lower than 100 kPa. Possibly, kPa has to be exchanged for percentage to retain the same curve. N2-H2: This curve has a somewhat strange form at a very high hydrogen fraction. For the prod-ucts with read-out we usually use a look-up table to straighten it out near 100% H2. Moreover, at very low fractions of H2, like 1-4%, the sensitivity measured for H2 is of the order of -1.95 to -2 %/%, rather than -1.8 %/% as expressed by the full curve. In Synthetic air, we even find up to -2.05 %/%. N2-CH4 vs CO2-CH4: These curves do not end at the same level in Fig.6.2, this is attributed to the use of different sensors for the different measurements. It is an illustration for the fact that for the best accuracy, each sensor requires a 0% and 100% calibration. Air-Helium: At this moment an output curve for a sensor without roof. With roof, the curve is more sensitive to pressure differences. The addition of a percent of helium only decreases the signal by about 1%, while for hydrogen this is almost 2%. So, the sensor is quite more sensitive to traces of hydrogen than to traces of helium. In general, a look-up table is preferred over a simple polynomial equation for best accuracy in mimicking the calibration curve.
0
0,1
0,2
0,3
0,4
0,5
0,6
0,7
0,8
0,9
1
0 0,2 0,4 0,6 0,8 1
No
rma
lize
d t
ran
sfe
r
Relative fraction of gas with the highest conductivity
Normalized transfer for various gas mixtures
Air-H2O
N2-CH4
CO2-CH4
Air-Helium
CH4-H2
N2-H2

Thermal Conductivity Gauge XEN-TCG3880 for gas type measurement and vacuum measurement
Xensor Integration bv Smart Sensor Devices
Distributieweg 28 2645 EJ Delfgauw The Netherlands
Phone +31 (0)15-2578040 Founded 18 May 1988 Fax +31 (0)15-2578050 Trade reg. 27227437 Email [email protected] Site www.xensor.nl
ABN-AMRO 60 50 40 311 IBAN NL42ABNA0605040311
VAT NL 009122746 B01
copyright Xensor Integration 19 March 2018 page 25 of 39
Figure 6.2: Transfer of XEN-TCG3880 for various gas mixtures.
6.3 Sensitivity, noise, drift, accuracy and resolution
Given the curves above, what can we say about various parameters, such as sensitivity, noise, drift, accuracy and resolution? The sensitivity for traces of gas B in gas A is given by the coefficient b1, and ranges between values of 0.24 %/% for water vapor and CH4 in air or N2, up to 1 %/% for helium in air and 2% for hydrogen in air (or nitrogen). What does this mean for the resolution of the sensor. The Johnson noise of the sensing ele-ment is about 30 nVrms when measuring with a 1 Hz bandwidth. With an output voltage of the order of 30 mV, this means an rms-noise of 1 ppm. This implies, with a typical sensitivity of 1 %/% (= 1 ppm/ppm), that on the short term a resolution of 1 ppm helium in air is feasible. On a minute to minute basis, there is usually more drift than that, caused by daily temperature fluctuations. When everything is done to minimize such effects, a drift of only 1 ppm/day is fea-sible. On the long term, measurements have shown a drift of the order of 300 ppm/year. On the long term an inaccuracy of the signal of the order of 100-1000 ppm should therefore be reckoned with. Long term tests with sensors with read-out (XEN-5320) show a typical drift of the order of 1000-2000 ppm of the transfer per year. This also includes the drift of all electronic parts used to measure the transfer. These sensors with read-out show a short-term noise of the order of a few hundred ppm, this then is the resolution of these products. As mentioned above, the typical inaccuracy of the curves used to calculate the gas concentra-tion is estimated to be 1-3%FS. Comparison of the measurement of a 50.1% helium - 49.9% ni-trogen gas mixture from a calibrated bottle with a mixture generated by 2 Mass Flow Controllers indicated a difference of the order of 0.3% helium indication. Differences between various XEN-5320-U sensors (XEN-TCG3880-P2-R-W plus electronics) are usually below 1% FS. The 0-100% nitrogen-hydrogen curve is slightly different from the 0-1% change when measured with gas-mixture bottles. Here, an inaccuracy of the order of 1% FS can be expected.
0
5
10
15
20
25
30
0 0,2 0,4 0,6 0,8 1
Tra
ns
fer
(V/W
)
Fraction of second gas
Transfer of XEN-TCG3880 for various gas mixtures
CO2-CH4
Air-H2O
N2-CH4
Air-Helium
N2-H2
CH4-H2
Thermal Conductivity Gauge XEN-TCG3880 for gas type measurement and vacuum measurement
Xensor Integration bv Smart Sensor Devices
Distributieweg 28 2645 EJ Delfgauw The Netherlands
Phone +31 (0)15-2578040 Founded 18 May 1988 Fax +31 (0)15-2578050 Trade reg. 27227437 Email [email protected] Site www.xensor.nl
ABN-AMRO 60 50 40 311 IBAN NL42ABNA0605040311
VAT NL 009122746 B01
copyright Xensor Integration 19 March 2018 page 26 of 39
6.4 Humidity effects
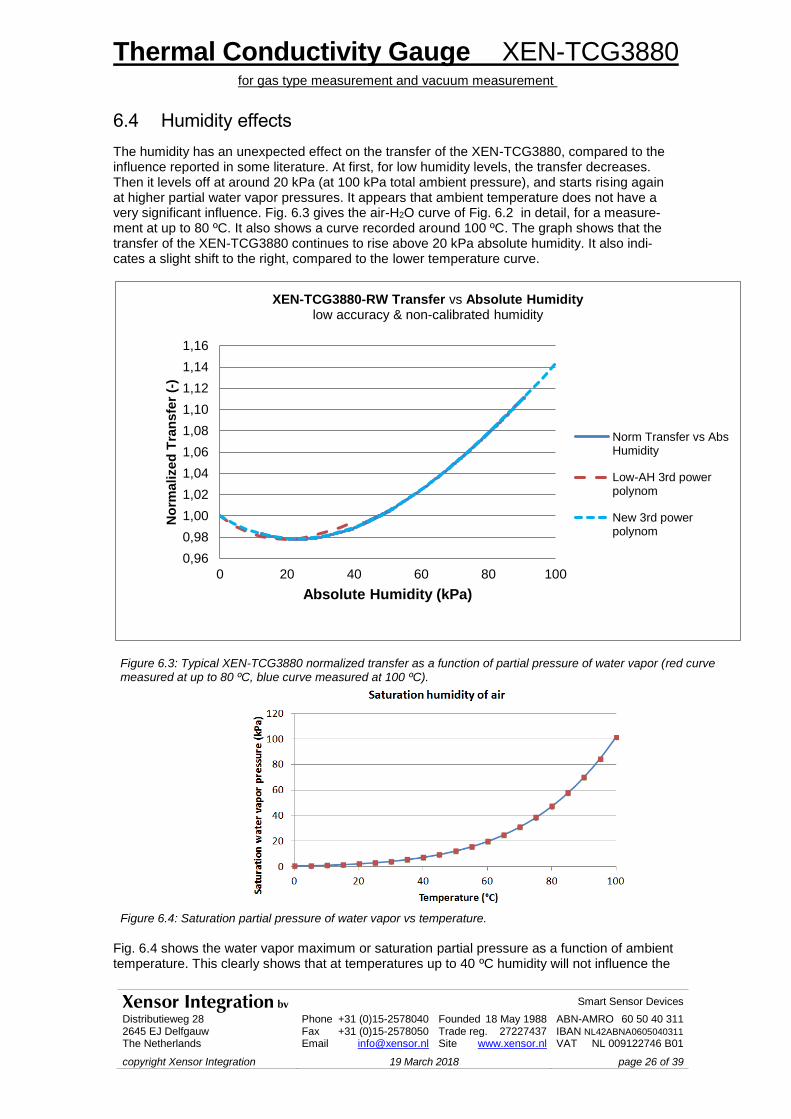
The humidity has an unexpected effect on the transfer of the XEN-TCG3880, compared to the influence reported in some literature. At first, for low humidity levels, the transfer decreases. Then it levels off at around 20 kPa (at 100 kPa total ambient pressure), and starts rising again at higher partial water vapor pressures. It appears that ambient temperature does not have a very significant influence. Fig. 6.3 gives the air-H2O curve of Fig. 6.2 in detail, for a measure-ment at up to 80 ºC. It also shows a curve recorded around 100 ºC. The graph shows that the transfer of the XEN-TCG3880 continues to rise above 20 kPa absolute humidity. It also indi-cates a slight shift to the right, compared to the lower temperature curve.
Figure 6.3: Typical XEN-TCG3880 normalized transfer as a function of partial pressure of water vapor (red curve measured at up to 80 ºC, blue curve measured at 100 ºC).
Figure 6.4: Saturation partial pressure of water vapor vs temperature.
Fig. 6.4 shows the water vapor maximum or saturation partial pressure as a function of ambient temperature. This clearly shows that at temperatures up to 40 ºC humidity will not influence the
0,96
0,98
1,00
1,02
1,04
1,06
1,08
1,10
1,12
1,14
1,16
0 20 40 60 80 100
No
rmalized
Tra
nsfe
r (-
)
Absolute Humidity (kPa)
XEN-TCG3880-RW Transfer vs Absolute Humiditylow accuracy & non-calibrated humidity
Norm Transfer vs AbsHumidity
Low-AH 3rd powerpolynom
New 3rd powerpolynom
Thermal Conductivity Gauge XEN-TCG3880 for gas type measurement and vacuum measurement
Xensor Integration bv Smart Sensor Devices
Distributieweg 28 2645 EJ Delfgauw The Netherlands
Phone +31 (0)15-2578040 Founded 18 May 1988 Fax +31 (0)15-2578050 Trade reg. 27227437 Email [email protected] Site www.xensor.nl
ABN-AMRO 60 50 40 311 IBAN NL42ABNA0605040311
VAT NL 009122746 B01
copyright Xensor Integration 19 March 2018 page 27 of 39
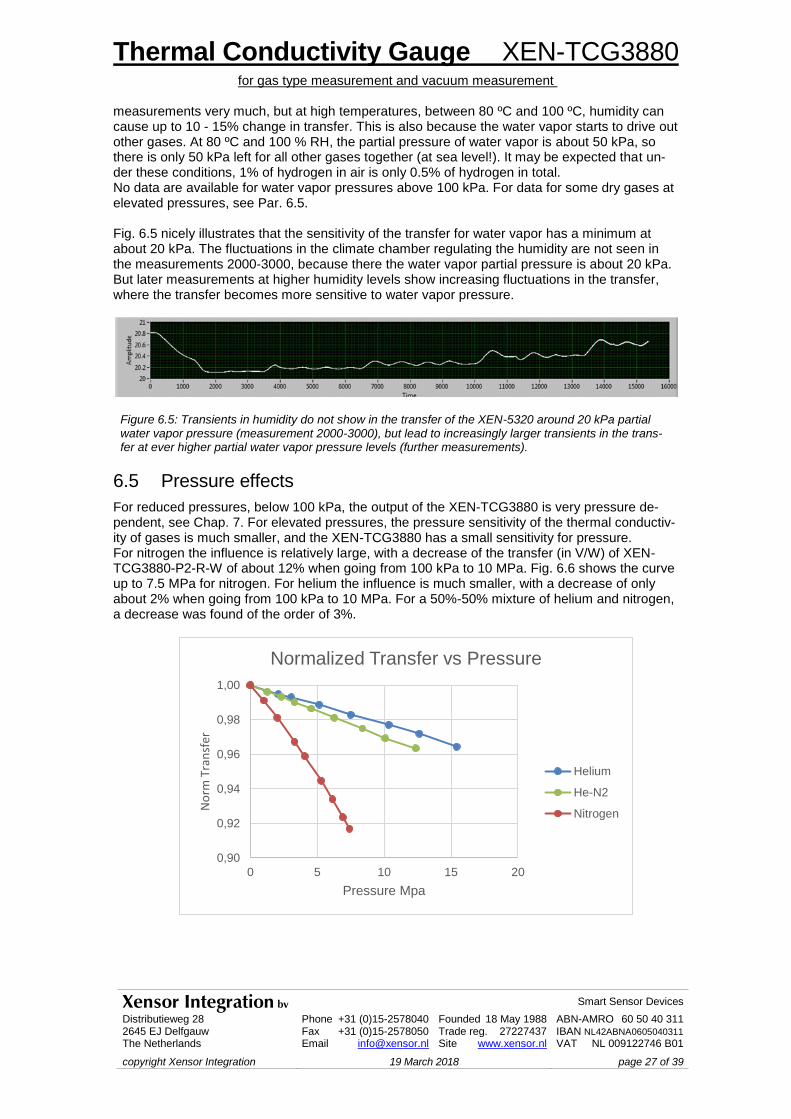
measurements very much, but at high temperatures, between 80 ºC and 100 ºC, humidity can cause up to 10 - 15% change in transfer. This is also because the water vapor starts to drive out other gases. At 80 ºC and 100 % RH, the partial pressure of water vapor is about 50 kPa, so there is only 50 kPa left for all other gases together (at sea level!). It may be expected that un-der these conditions, 1% of hydrogen in air is only 0.5% of hydrogen in total. No data are available for water vapor pressures above 100 kPa. For data for some dry gases at elevated pressures, see Par. 6.5. Fig. 6.5 nicely illustrates that the sensitivity of the transfer for water vapor has a minimum at about 20 kPa. The fluctuations in the climate chamber regulating the humidity are not seen in the measurements 2000-3000, because there the water vapor partial pressure is about 20 kPa. But later measurements at higher humidity levels show increasing fluctuations in the transfer, where the transfer becomes more sensitive to water vapor pressure.
Figure 6.5: Transients in humidity do not show in the transfer of the XEN-5320 around 20 kPa partial water vapor pressure (measurement 2000-3000), but lead to increasingly larger transients in the trans-fer at ever higher partial water vapor pressure levels (further measurements).
6.5 Pressure effects
For reduced pressures, below 100 kPa, the output of the XEN-TCG3880 is very pressure de-pendent, see Chap. 7. For elevated pressures, the pressure sensitivity of the thermal conductiv-ity of gases is much smaller, and the XEN-TCG3880 has a small sensitivity for pressure. For nitrogen the influence is relatively large, with a decrease of the transfer (in V/W) of XEN-TCG3880-P2-R-W of about 12% when going from 100 kPa to 10 MPa. Fig. 6.6 shows the curve up to 7.5 MPa for nitrogen. For helium the influence is much smaller, with a decrease of only about 2% when going from 100 kPa to 10 MPa. For a 50%-50% mixture of helium and nitrogen, a decrease was found of the order of 3%.
0,90
0,92
0,94
0,96
0,98
1,00
0 5 10 15 20
No
rm T
ran
sfer
Pressure Mpa
Normalized Transfer vs Pressure
Helium
He-N2
Nitrogen
Thermal Conductivity Gauge XEN-TCG3880 for gas type measurement and vacuum measurement
Xensor Integration bv Smart Sensor Devices
Distributieweg 28 2645 EJ Delfgauw The Netherlands
Phone +31 (0)15-2578040 Founded 18 May 1988 Fax +31 (0)15-2578050 Trade reg. 27227437 Email [email protected] Site www.xensor.nl
ABN-AMRO 60 50 40 311 IBAN NL42ABNA0605040311
VAT NL 009122746 B01
copyright Xensor Integration 19 March 2018 page 28 of 39
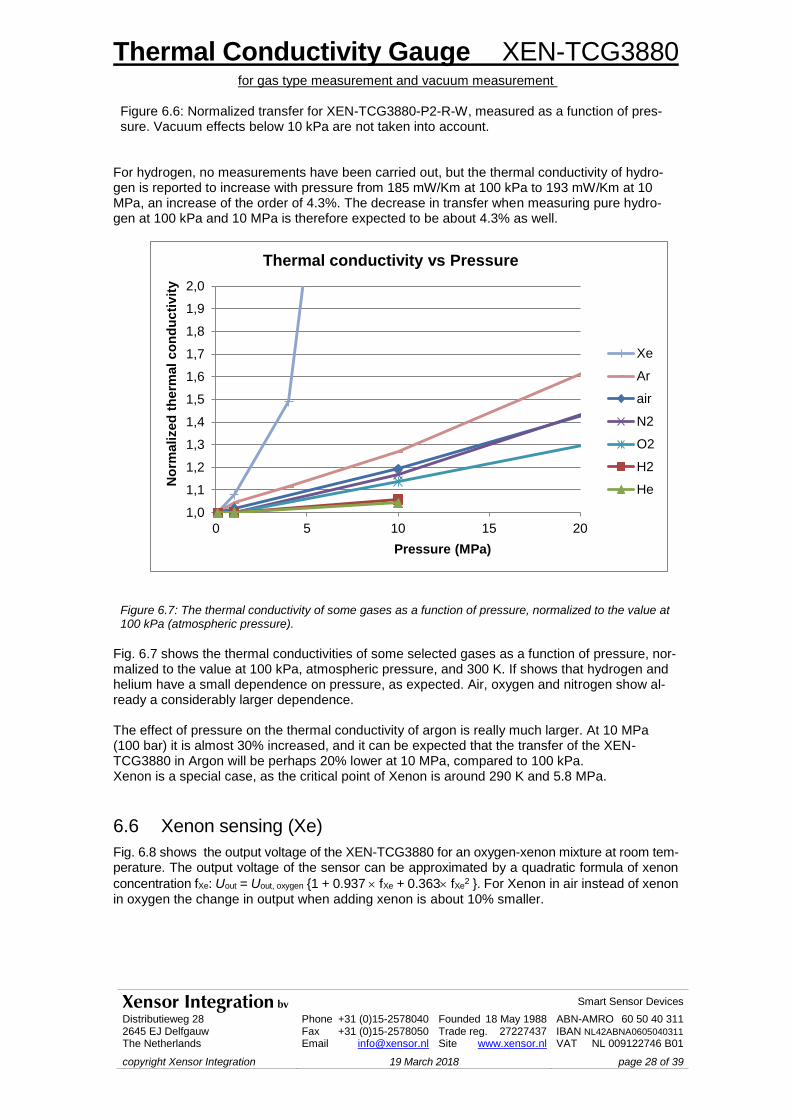
Figure 6.6: Normalized transfer for XEN-TCG3880-P2-R-W, measured as a function of pres-sure. Vacuum effects below 10 kPa are not taken into account.
For hydrogen, no measurements have been carried out, but the thermal conductivity of hydro-gen is reported to increase with pressure from 185 mW/Km at 100 kPa to 193 mW/Km at 10 MPa, an increase of the order of 4.3%. The decrease in transfer when measuring pure hydro-gen at 100 kPa and 10 MPa is therefore expected to be about 4.3% as well.
Figure 6.7: The thermal conductivity of some gases as a function of pressure, normalized to the value at 100 kPa (atmospheric pressure).
Fig. 6.7 shows the thermal conductivities of some selected gases as a function of pressure, nor-malized to the value at 100 kPa, atmospheric pressure, and 300 K. If shows that hydrogen and helium have a small dependence on pressure, as expected. Air, oxygen and nitrogen show al-ready a considerably larger dependence. The effect of pressure on the thermal conductivity of argon is really much larger. At 10 MPa (100 bar) it is almost 30% increased, and it can be expected that the transfer of the XEN-TCG3880 in Argon will be perhaps 20% lower at 10 MPa, compared to 100 kPa. Xenon is a special case, as the critical point of Xenon is around 290 K and 5.8 MPa.
6.6 Xenon sensing (Xe)
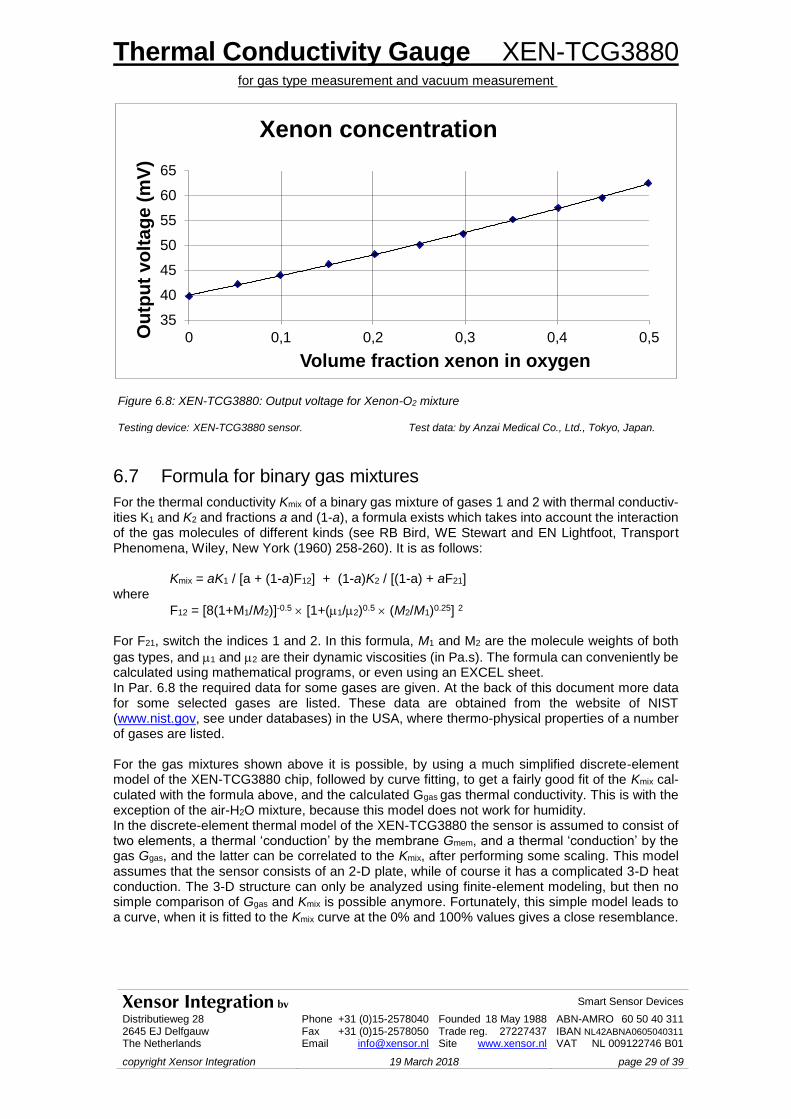
Fig. 6.8 shows the output voltage of the XEN-TCG3880 for an oxygen-xenon mixture at room tem-perature. The output voltage of the sensor can be approximated by a quadratic formula of xenon
concentration fXe: Uout = Uout, oxygen {1 + 0.937 fXe + 0.363 fXe2 }. For Xenon in air instead of xenon
in oxygen the change in output when adding xenon is about 10% smaller.
1,0
1,1
1,2
1,3
1,4
1,5
1,6
1,7
1,8
1,9
2,0
0 5 10 15 20
No
rmalized
th
erm
al
co
nd
ucti
vit
y
Pressure (MPa)
Thermal conductivity vs Pressure
Xe
Ar
air
N2
O2
H2
He
Thermal Conductivity Gauge XEN-TCG3880 for gas type measurement and vacuum measurement
Xensor Integration bv Smart Sensor Devices
Distributieweg 28 2645 EJ Delfgauw The Netherlands
Phone +31 (0)15-2578040 Founded 18 May 1988 Fax +31 (0)15-2578050 Trade reg. 27227437 Email [email protected] Site www.xensor.nl
ABN-AMRO 60 50 40 311 IBAN NL42ABNA0605040311
VAT NL 009122746 B01
copyright Xensor Integration 19 March 2018 page 29 of 39
Figure 6.8: XEN-TCG3880: Output voltage for Xenon-O2 mixture Testing device: XEN-TCG3880 sensor. Test data: by Anzai Medical Co., Ltd., Tokyo, Japan.
6.7 Formula for binary gas mixtures
For the thermal conductivity Kmix of a binary gas mixture of gases 1 and 2 with thermal conductiv-ities K1 and K2 and fractions a and (1-a), a formula exists which takes into account the interaction of the gas molecules of different kinds (see RB Bird, WE Stewart and EN Lightfoot, Transport Phenomena, Wiley, New York (1960) 258-260). It is as follows: Kmix = aK1 / [a + (1-a)F12] + (1-a)K2 / [(1-a) + aF21] where
F12 = [8(1+M1/M2)]-0.5 [1+(1/2)0.5 (M2/M1)0.25] 2 For F21, switch the indices 1 and 2. In this formula, M1 and M2 are the molecule weights of both
gas types, and 1 and 2 are their dynamic viscosities (in Pa.s). The formula can conveniently be calculated using mathematical programs, or even using an EXCEL sheet. In Par. 6.8 the required data for some gases are given. At the back of this document more data for some selected gases are listed. These data are obtained from the website of NIST (www.nist.gov, see under databases) in the USA, where thermo-physical properties of a number of gases are listed. For the gas mixtures shown above it is possible, by using a much simplified discrete-element model of the XEN-TCG3880 chip, followed by curve fitting, to get a fairly good fit of the Kmix cal-culated with the formula above, and the calculated Ggas gas thermal conductivity. This is with the exception of the air-H2O mixture, because this model does not work for humidity. In the discrete-element thermal model of the XEN-TCG3880 the sensor is assumed to consist of two elements, a thermal ‘conduction’ by the membrane Gmem, and a thermal ‘conduction’ by the gas Ggas, and the latter can be correlated to the Kmix, after performing some scaling. This model assumes that the sensor consists of an 2-D plate, while of course it has a complicated 3-D heat conduction. The 3-D structure can only be analyzed using finite-element modeling, but then no simple comparison of Ggas and Kmix is possible anymore. Fortunately, this simple model leads to a curve, when it is fitted to the Kmix curve at the 0% and 100% values gives a close resemblance.
35
40
45
50
55
60
65
0 0,1 0,2 0,3 0,4 0,5Ou
tpu
t vo
lta
ge
(m
V)
Volume fraction xenon in oxygen
Xenon concentration
Thermal Conductivity Gauge XEN-TCG3880 for gas type measurement and vacuum measurement
Xensor Integration bv Smart Sensor Devices
Distributieweg 28 2645 EJ Delfgauw The Netherlands
Phone +31 (0)15-2578040 Founded 18 May 1988 Fax +31 (0)15-2578050 Trade reg. 27227437 Email [email protected] Site www.xensor.nl
ABN-AMRO 60 50 40 311 IBAN NL42ABNA0605040311
VAT NL 009122746 B01
copyright Xensor Integration 19 March 2018 page 30 of 39
Figure 6.9: Discrete-element representation of the thermal characteristics of the XEN-TCG3880, with in-put power Pin and thermopile output voltage Uout.
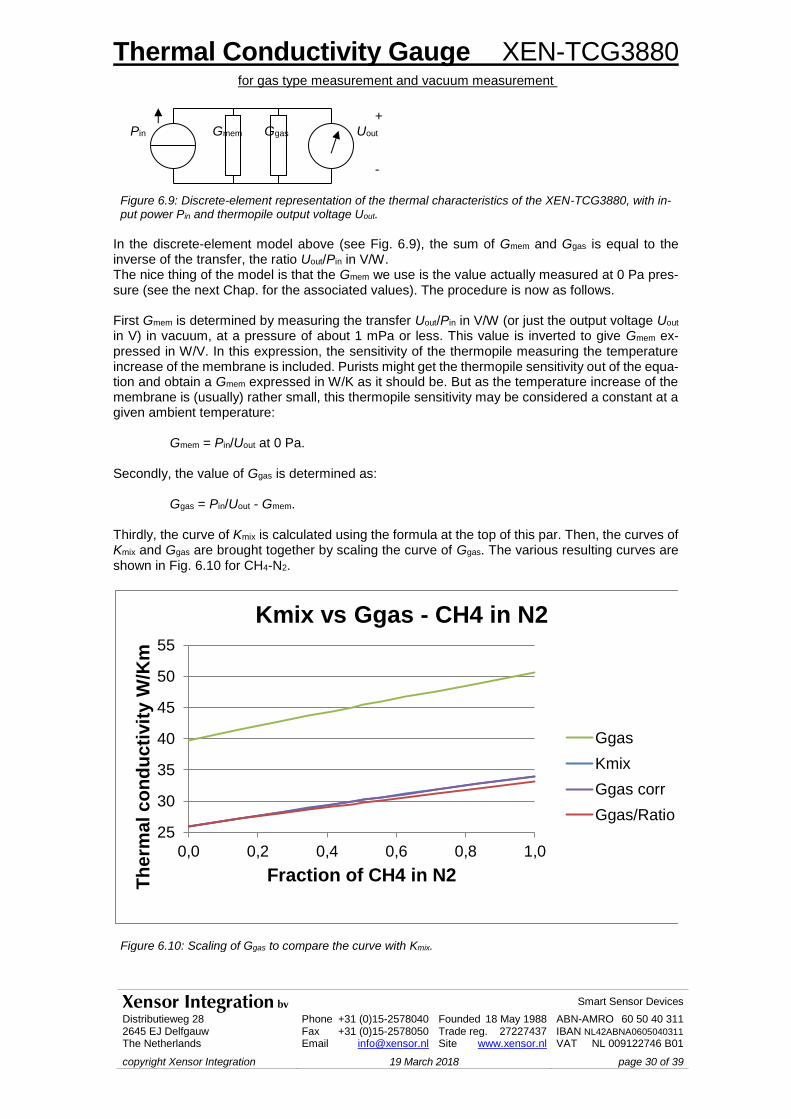
In the discrete-element model above (see Fig. 6.9), the sum of Gmem and Ggas is equal to the inverse of the transfer, the ratio Uout/Pin in V/W. The nice thing of the model is that the Gmem we use is the value actually measured at 0 Pa pres-sure (see the next Chap. for the associated values). The procedure is now as follows. First Gmem is determined by measuring the transfer Uout/Pin in V/W (or just the output voltage Uout in V) in vacuum, at a pressure of about 1 mPa or less. This value is inverted to give Gmem ex-pressed in W/V. In this expression, the sensitivity of the thermopile measuring the temperature increase of the membrane is included. Purists might get the thermopile sensitivity out of the equa-tion and obtain a Gmem expressed in W/K as it should be. But as the temperature increase of the membrane is (usually) rather small, this thermopile sensitivity may be considered a constant at a given ambient temperature: Gmem = Pin/Uout at 0 Pa. Secondly, the value of Ggas is determined as: Ggas = Pin/Uout - Gmem. Thirdly, the curve of Kmix is calculated using the formula at the top of this par. Then, the curves of Kmix and Ggas are brought together by scaling the curve of Ggas. The various resulting curves are shown in Fig. 6.10 for CH4-N2.
Figure 6.10: Scaling of Ggas to compare the curve with Kmix.
+ Pin Gmem Ggas Uout
-
25
30
35
40
45
50
55
0,0 0,2 0,4 0,6 0,8 1,0
Th
erm
al c
on
du
cti
vit
y W
/Km
Fraction of CH4 in N2
Kmix vs Ggas - CH4 in N2
Ggas
Kmix
Ggas corr
Ggas/Ratio
Thermal Conductivity Gauge XEN-TCG3880 for gas type measurement and vacuum measurement
Xensor Integration bv Smart Sensor Devices
Distributieweg 28 2645 EJ Delfgauw The Netherlands
Phone +31 (0)15-2578040 Founded 18 May 1988 Fax +31 (0)15-2578050 Trade reg. 27227437 Email [email protected] Site www.xensor.nl
ABN-AMRO 60 50 40 311 IBAN NL42ABNA0605040311
VAT NL 009122746 B01
copyright Xensor Integration 19 March 2018 page 31 of 39
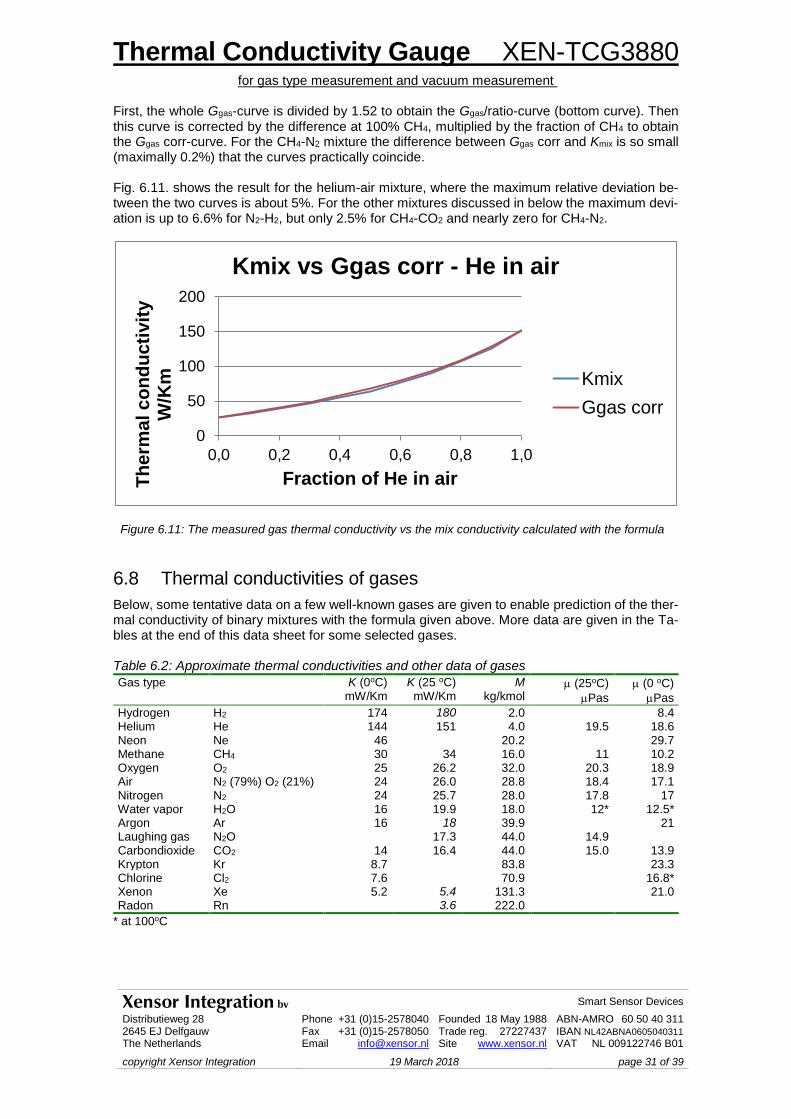
First, the whole Ggas-curve is divided by 1.52 to obtain the Ggas/ratio-curve (bottom curve). Then this curve is corrected by the difference at 100% CH4, multiplied by the fraction of CH4 to obtain the Ggas corr-curve. For the CH4-N2 mixture the difference between Ggas corr and Kmix is so small (maximally 0.2%) that the curves practically coincide. Fig. 6.11. shows the result for the helium-air mixture, where the maximum relative deviation be-tween the two curves is about 5%. For the other mixtures discussed in below the maximum devi-ation is up to 6.6% for N2-H2, but only 2.5% for CH4-CO2 and nearly zero for CH4-N2.
Figure 6.11: The measured gas thermal conductivity vs the mix conductivity calculated with the formula
6.8 Thermal conductivities of gases
Below, some tentative data on a few well-known gases are given to enable prediction of the ther-mal conductivity of binary mixtures with the formula given above. More data are given in the Ta-bles at the end of this data sheet for some selected gases. Table 6.2: Approximate thermal conductivities and other data of gases
Gas type K (0oC) mW/Km
K (25 oC) mW/Km
M kg/kmol
(25oC)
Pas
(0 oC)
Pas
Hydrogen H2 174 180 2.0 8.4 Helium He 144 151 4.0 19.5 18.6 Neon Ne 46 20.2 29.7 Methane CH4 30 34 16.0 11 10.2 Oxygen O2 25 26.2 32.0 20.3 18.9 Air N2 (79%) O2 (21%) 24 26.0 28.8 18.4 17.1 Nitrogen N2 24 25.7 28.0 17.8 17 Water vapor H2O 16 19.9 18.0 12* 12.5* Argon Ar 16 18 39.9 21 Laughing gas N2O 17.3 44.0 14.9 Carbondioxide CO2 14 16.4 44.0 15.0 13.9 Krypton Kr 8.7 83.8 23.3 Chlorine Cl2 7.6 70.9 16.8* Xenon Xe 5.2 5.4 131.3 21.0 Radon Rn 3.6 222.0
* at 100oC
0
50
100
150
200
0,0 0,2 0,4 0,6 0,8 1,0
Th
erm
al c
on
du
cti
vit
y
W/K
m
Fraction of He in air
Kmix vs Ggas corr - He in air
Kmix
Ggas corr
Thermal Conductivity Gauge XEN-TCG3880 for gas type measurement and vacuum measurement
Xensor Integration bv Smart Sensor Devices
Distributieweg 28 2645 EJ Delfgauw The Netherlands
Phone +31 (0)15-2578040 Founded 18 May 1988 Fax +31 (0)15-2578050 Trade reg. 27227437 Email [email protected] Site www.xensor.nl
ABN-AMRO 60 50 40 311 IBAN NL42ABNA0605040311
VAT NL 009122746 B01
copyright Xensor Integration 19 March 2018 page 32 of 39
7 Application: vacuum sensor
The XEN-TCG3880 can also be applied as a vacuum sensor, for instance where traditional Pirani gauges and thermocouple gauges are used. With any gaseous ambient, the transfer of the device will start to increase when the ambient pressure falls below 10 kPa. With special measures, such as a heat sink very close to the membrane (a so-called roof), this upper limit of the sensor may be increased up to atmospheric pressure (100 kPa). Then, the transfer is a function of pressure, until the thermal conduction by the ambient gas be-comes so low, that any further changes fall below the noise and instability limit. This constitutes the lower limit of the sensor, and will be around 10 mPa. So, the operational range of the sensor is of the order of 7 decades. At the lower limit of 10 mPa and the upper limit of 100 kPa, the sensitivity of the sensor is reduced. In the intermediate region, e.g. between 1 Pa and 1 kPa, good measurement accuracy can be obtained, and the pressure can be determined with a typical error of below 1%.
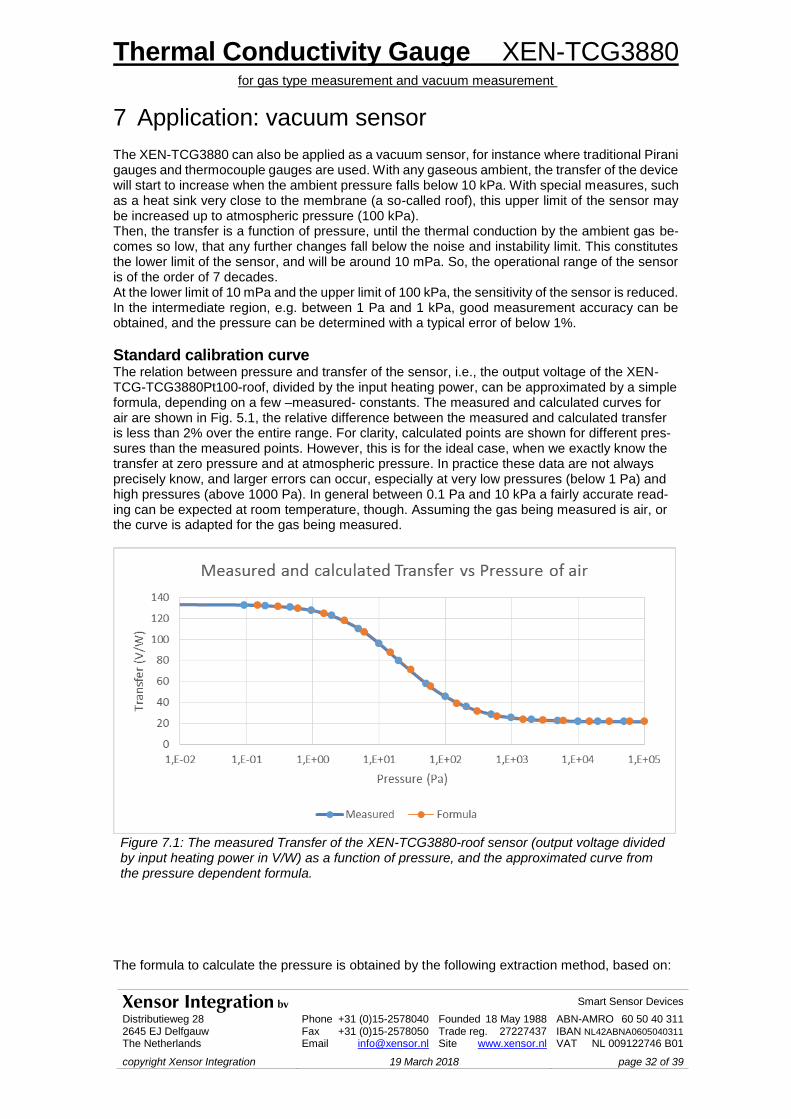
Standard calibration curve The relation between pressure and transfer of the sensor, i.e., the output voltage of the XEN-TCG-TCG3880Pt100-roof, divided by the input heating power, can be approximated by a simple formula, depending on a few –measured- constants. The measured and calculated curves for air are shown in Fig. 5.1, the relative difference between the measured and calculated transfer is less than 2% over the entire range. For clarity, calculated points are shown for different pres-sures than the measured points. However, this is for the ideal case, when we exactly know the transfer at zero pressure and at atmospheric pressure. In practice these data are not always precisely know, and larger errors can occur, especially at very low pressures (below 1 Pa) and high pressures (above 1000 Pa). In general between 0.1 Pa and 10 kPa a fairly accurate read-ing can be expected at room temperature, though. Assuming the gas being measured is air, or the curve is adapted for the gas being measured.
Figure 7.1: The measured Transfer of the XEN-TCG3880-roof sensor (output voltage divided by input heating power in V/W) as a function of pressure, and the approximated curve from the pressure dependent formula.
The formula to calculate the pressure is obtained by the following extraction method, based on:
Thermal Conductivity Gauge XEN-TCG3880 for gas type measurement and vacuum measurement
Xensor Integration bv Smart Sensor Devices
Distributieweg 28 2645 EJ Delfgauw The Netherlands
Phone +31 (0)15-2578040 Founded 18 May 1988 Fax +31 (0)15-2578050 Trade reg. 27227437 Email [email protected] Site www.xensor.nl
ABN-AMRO 60 50 40 311 IBAN NL42ABNA0605040311
VAT NL 009122746 B01
copyright Xensor Integration 19 March 2018 page 33 of 39
the measured transfer at zero pressure;
the measured sensitivity at low pressures;
the measured output signal at atmospheric pressure;
two transition pressures that are derived by curve fitting. Then the method goes as follows: The residual membrane conductance Gmem is calculated by inverting the zero-pressure transfer:
(1) Gmem = 1/Transfer0 Pa
The total conductance Gtot is at any pressure the inverse of the transfer and is the sum of the membrane conductance and the gas conductance (this is a simplification that may not be physi-cally correct, but yields a good working formula):
(2) Gtot = 1/Transfer = Gmem + Ggas The low-pressure sensitivity Go is calculated at a low pressure P around 0.5 Pa:
(3) Go = Ggas≈0.5 Pa/P≈0.5 Pa = (Gtot - Gmem)≈0.5 Pa/P≈0.5 Pa The sum of the transition pressures Pt1 and Pt2 is calculated by dividing the transfer at high pressure by the low-pressure sensitivity:
(4) Pt1 + Pt2 = 2×(Gtot - Gmem)100kPa/ Go
Then the approximating curve for the inverse of the transfer, the total conductance Gtot, is given by:
(5) Gtot = Gmem + Ggas = Gmem + Go {½P×Pt1/(P+Pt1) + ½P×Pt2/(P+Pt2) }
In the low pressure limit, this formula approaches the formula for gas conductance that is pro-portional to pressure:
(6) Gtot, low pressures = Gmem + Go P In the high pressure limit, this this formula approaches the formula for gas conductance that is independent of pressure:
(7) Gtot = Gmem + Go {½ Pt1+ ½ Pt2}
Thermal Conductivity Gauge XEN-TCG3880 for gas type measurement and vacuum measurement
Xensor Integration bv Smart Sensor Devices
Distributieweg 28 2645 EJ Delfgauw The Netherlands
Phone +31 (0)15-2578040 Founded 18 May 1988 Fax +31 (0)15-2578050 Trade reg. 27227437 Email [email protected] Site www.xensor.nl
ABN-AMRO 60 50 40 311 IBAN NL42ABNA0605040311
VAT NL 009122746 B01
copyright Xensor Integration 19 March 2018 page 34 of 39
Fig. 7.1 shows a measurement for the XEN-TCG3880 roof with a heat sink on top of the mem-brane (roof) at 100 µm distance, and the calculated curve with the following parameters: Table 7.1: Parameters to approximate the vacuum response of XEN-TCG3880-roof
Parameter Value Units Remarks
Measured Transfer at zero pressure 133.32 V/W Transfer at low pressure 130.49 V/W At 0.456 Pa air pressure Transfer at atmospheric pressure 21.63 V/W For air
Calculated Gmem 7.50 mW/V Go 0.3568 mW/V/Pa For air Pt1 + Pt2 217.1 Pa
Curve-fitted Pt1 17.5 Pa Curve fitted Pt2 199.6 Pa Curve fitted
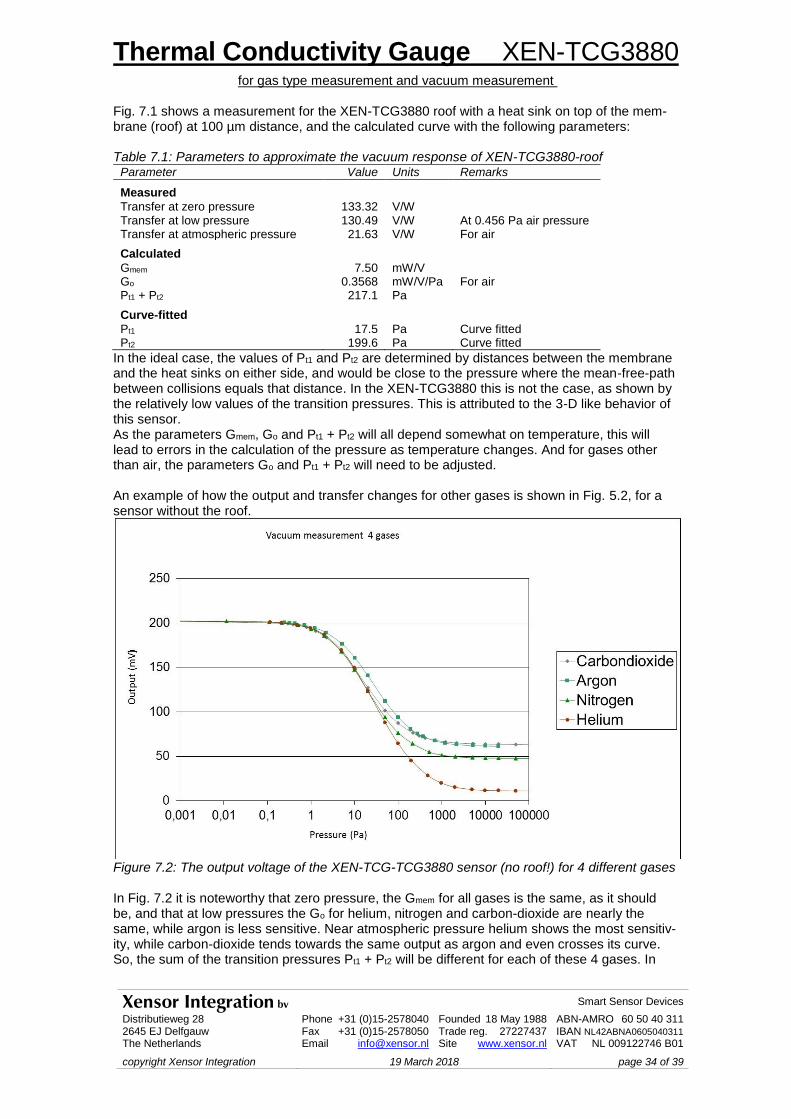
In the ideal case, the values of Pt1 and Pt2 are determined by distances between the membrane and the heat sinks on either side, and would be close to the pressure where the mean-free-path between collisions equals that distance. In the XEN-TCG3880 this is not the case, as shown by the relatively low values of the transition pressures. This is attributed to the 3-D like behavior of this sensor. As the parameters Gmem, Go and Pt1 + Pt2 will all depend somewhat on temperature, this will lead to errors in the calculation of the pressure as temperature changes. And for gases other than air, the parameters Go and Pt1 + Pt2 will need to be adjusted. An example of how the output and transfer changes for other gases is shown in Fig. 5.2, for a sensor without the roof.
Figure 7.2: The output voltage of the XEN-TCG-TCG3880 sensor (no roof!) for 4 different gases
In Fig. 7.2 it is noteworthy that zero pressure, the Gmem for all gases is the same, as it should be, and that at low pressures the Go for helium, nitrogen and carbon-dioxide are nearly the same, while argon is less sensitive. Near atmospheric pressure helium shows the most sensitiv-ity, while carbon-dioxide tends towards the same output as argon and even crosses its curve. So, the sum of the transition pressures Pt1 + Pt2 will be different for each of these 4 gases. In
Thermal Conductivity Gauge XEN-TCG3880 for gas type measurement and vacuum measurement
Xensor Integration bv Smart Sensor Devices
Distributieweg 28 2645 EJ Delfgauw The Netherlands
Phone +31 (0)15-2578040 Founded 18 May 1988 Fax +31 (0)15-2578050 Trade reg. 27227437 Email [email protected] Site www.xensor.nl
ABN-AMRO 60 50 40 311 IBAN NL42ABNA0605040311
VAT NL 009122746 B01
copyright Xensor Integration 19 March 2018 page 35 of 39
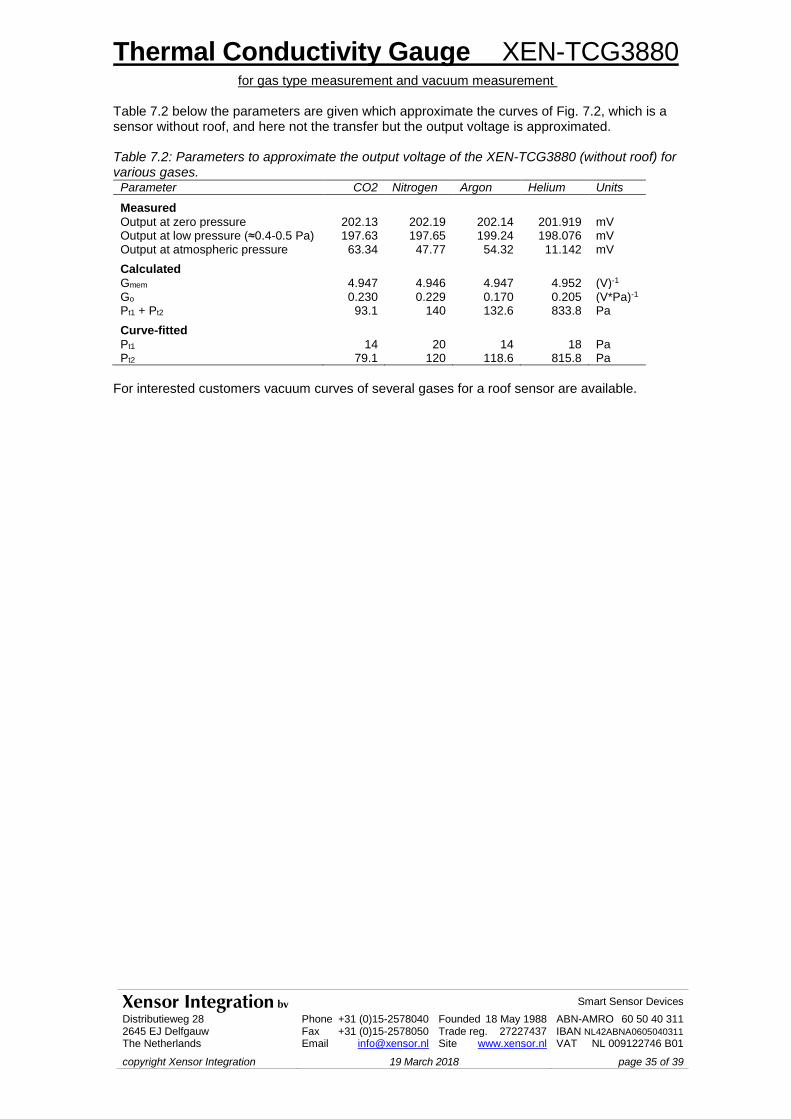
Table 7.2 below the parameters are given which approximate the curves of Fig. 7.2, which is a sensor without roof, and here not the transfer but the output voltage is approximated. Table 7.2: Parameters to approximate the output voltage of the XEN-TCG3880 (without roof) for various gases.
Parameter CO2 Nitrogen Argon Helium Units
Measured Output at zero pressure 202.13 202.19 202.14 201.919 mV Output at low pressure (≈0.4-0.5 Pa) 197.63 197.65 199.24 198.076 mV Output at atmospheric pressure 63.34 47.77 54.32 11.142 mV
Calculated Gmem 4.947 4.946 4.947 4.952 (V)-1
Go 0.230 0.229 0.170 0.205 (V*Pa)-1
Pt1 + Pt2 93.1 140 132.6 833.8 Pa
Curve-fitted Pt1 14 20 14 18 Pa Pt2 79.1 120 118.6 815.8 Pa
For interested customers vacuum curves of several gases for a roof sensor are available.
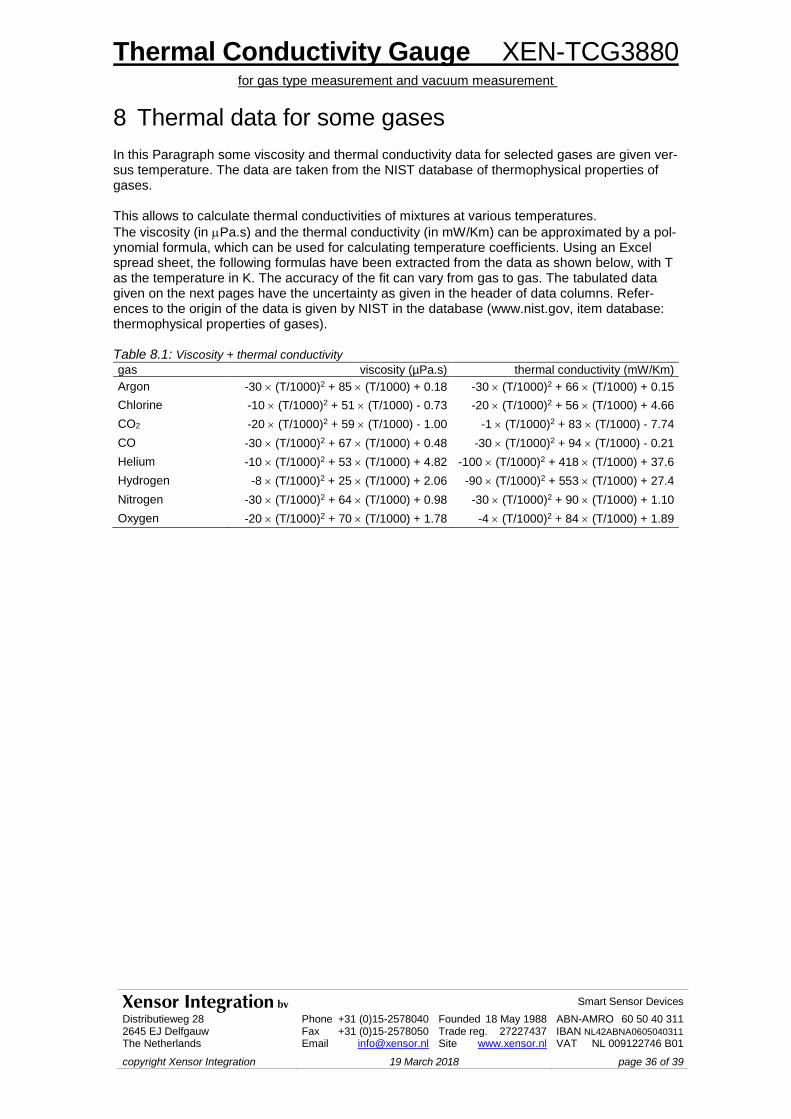
Thermal Conductivity Gauge XEN-TCG3880 for gas type measurement and vacuum measurement
Xensor Integration bv Smart Sensor Devices
Distributieweg 28 2645 EJ Delfgauw The Netherlands
Phone +31 (0)15-2578040 Founded 18 May 1988 Fax +31 (0)15-2578050 Trade reg. 27227437 Email [email protected] Site www.xensor.nl
ABN-AMRO 60 50 40 311 IBAN NL42ABNA0605040311
VAT NL 009122746 B01
copyright Xensor Integration 19 March 2018 page 36 of 39
8 Thermal data for some gases
In this Paragraph some viscosity and thermal conductivity data for selected gases are given ver-sus temperature. The data are taken from the NIST database of thermophysical properties of gases. This allows to calculate thermal conductivities of mixtures at various temperatures.
The viscosity (in Pa.s) and the thermal conductivity (in mW/Km) can be approximated by a pol-ynomial formula, which can be used for calculating temperature coefficients. Using an Excel spread sheet, the following formulas have been extracted from the data as shown below, with T as the temperature in K. The accuracy of the fit can vary from gas to gas. The tabulated data given on the next pages have the uncertainty as given in the header of data columns. Refer-ences to the origin of the data is given by NIST in the database (www.nist.gov, item database: thermophysical properties of gases). Table 8.1: Viscosity + thermal conductivity gas viscosity (µPa.s) thermal conductivity (mW/Km)
Argon -30 (T/1000)2 + 85 (T/1000) + 0.18 -30 (T/1000)2 + 66 (T/1000) + 0.15
Chlorine -10 (T/1000)2 + 51 (T/1000) - 0.73 -20 (T/1000)2 + 56 (T/1000) + 4.66
CO2 -20 (T/1000)2 + 59 (T/1000) - 1.00 -1 (T/1000)2 + 83 (T/1000) - 7.74
CO -30 (T/1000)2 + 67 (T/1000) + 0.48 -30 (T/1000)2 + 94 (T/1000) - 0.21
Helium -10 (T/1000)2 + 53 (T/1000) + 4.82 -100 (T/1000)2 + 418 (T/1000) + 37.6
Hydrogen -8 (T/1000)2 + 25 (T/1000) + 2.06 -90 (T/1000)2 + 553 (T/1000) + 27.4
Nitrogen -30 (T/1000)2 + 64 (T/1000) + 0.98 -30 (T/1000)2 + 90 (T/1000) + 1.10
Oxygen -20 (T/1000)2 + 70 (T/1000) + 1.78 -4 (T/1000)2 + 84 (T/1000) + 1.89
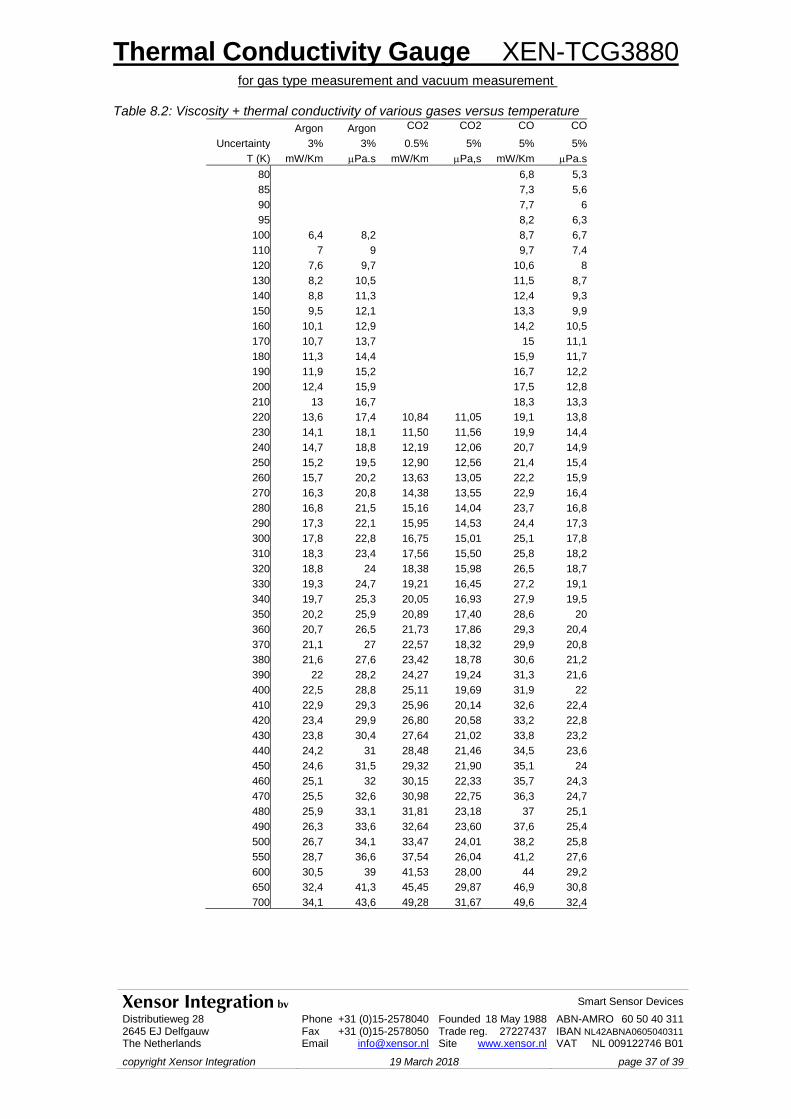
Thermal Conductivity Gauge XEN-TCG3880 for gas type measurement and vacuum measurement
Xensor Integration bv Smart Sensor Devices
Distributieweg 28 2645 EJ Delfgauw The Netherlands
Phone +31 (0)15-2578040 Founded 18 May 1988 Fax +31 (0)15-2578050 Trade reg. 27227437 Email [email protected] Site www.xensor.nl
ABN-AMRO 60 50 40 311 IBAN NL42ABNA0605040311
VAT NL 009122746 B01
copyright Xensor Integration 19 March 2018 page 37 of 39
Table 8.2: Viscosity + thermal conductivity of various gases versus temperature
Argon Argon CO2 CO2 CO CO
Uncertainty 3% 3% 0.5% 5% 5% 5%
T (K) mW/Km Pa.s mW/Km Pa,s mW/Km Pa.s
80 6,8 5,3
85 7,3 5,6
90 7,7 6
95 8,2 6,3
100 6,4 8,2 8,7 6,7
110 7 9 9,7 7,4
120 7,6 9,7 10,6 8
130 8,2 10,5 11,5 8,7
140 8,8 11,3 12,4 9,3
150 9,5 12,1 13,3 9,9
160 10,1 12,9 14,2 10,5
170 10,7 13,7 15 11,1
180 11,3 14,4 15,9 11,7
190 11,9 15,2 16,7 12,2
200 12,4 15,9 17,5 12,8
210 13 16,7 18,3 13,3
220 13,6 17,4 10,84 11,05 19,1 13,8
230 14,1 18,1 11,50 11,56 19,9 14,4
240 14,7 18,8 12,19 12,06 20,7 14,9
250 15,2 19,5 12,90 12,56 21,4 15,4
260 15,7 20,2 13,63 13,05 22,2 15,9
270 16,3 20,8 14,38 13,55 22,9 16,4
280 16,8 21,5 15,16 14,04 23,7 16,8
290 17,3 22,1 15,95 14,53 24,4 17,3
300 17,8 22,8 16,75 15,01 25,1 17,8
310 18,3 23,4 17,56 15,50 25,8 18,2
320 18,8 24 18,38 15,98 26,5 18,7
330 19,3 24,7 19,21 16,45 27,2 19,1
340 19,7 25,3 20,05 16,93 27,9 19,5
350 20,2 25,9 20,89 17,40 28,6 20
360 20,7 26,5 21,73 17,86 29,3 20,4
370 21,1 27 22,57 18,32 29,9 20,8
380 21,6 27,6 23,42 18,78 30,6 21,2
390 22 28,2 24,27 19,24 31,3 21,6
400 22,5 28,8 25,11 19,69 31,9 22
410 22,9 29,3 25,96 20,14 32,6 22,4
420 23,4 29,9 26,80 20,58 33,2 22,8
430 23,8 30,4 27,64 21,02 33,8 23,2
440 24,2 31 28,48 21,46 34,5 23,6
450 24,6 31,5 29,32 21,90 35,1 24
460 25,1 32 30,15 22,33 35,7 24,3
470 25,5 32,6 30,98 22,75 36,3 24,7
480 25,9 33,1 31,81 23,18 37 25,1
490 26,3 33,6 32,64 23,60 37,6 25,4
500 26,7 34,1 33,47 24,01 38,2 25,8
550 28,7 36,6 37,54 26,04 41,2 27,6
600 30,5 39 41,53 28,00 44 29,2
650 32,4 41,3 45,45 29,87 46,9 30,8
700 34,1 43,6 49,28 31,67 49,6 32,4
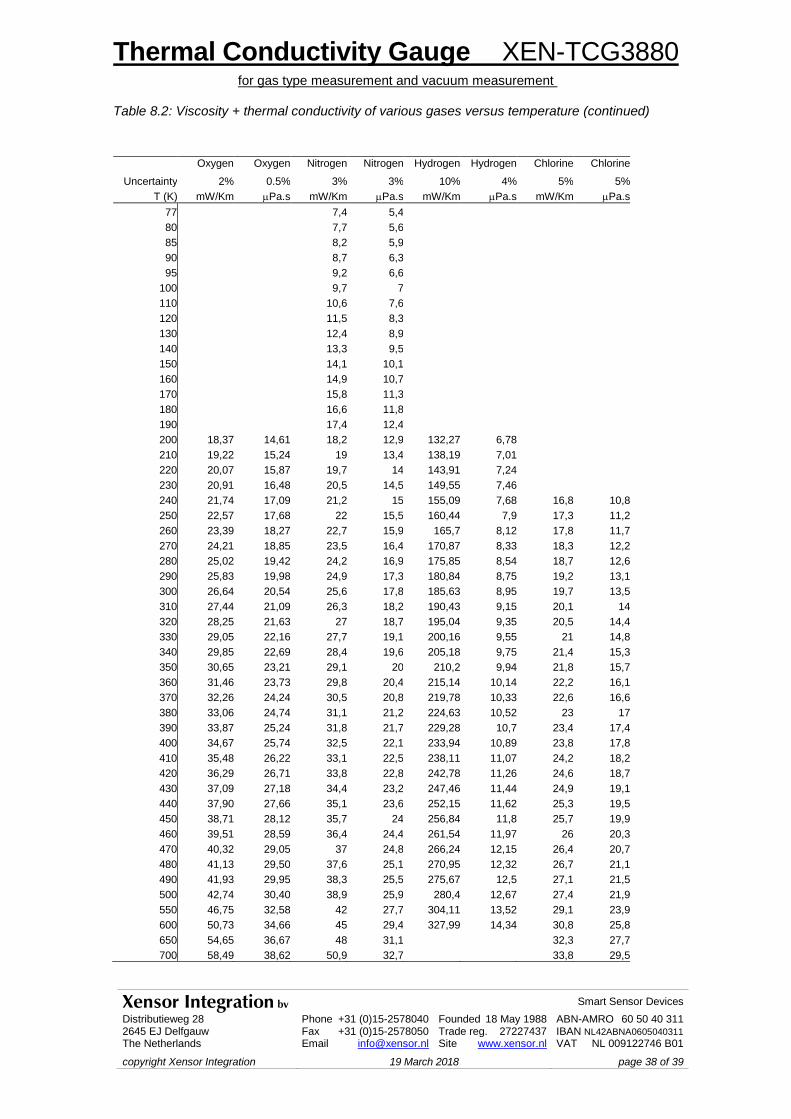
Thermal Conductivity Gauge XEN-TCG3880 for gas type measurement and vacuum measurement
Xensor Integration bv Smart Sensor Devices
Distributieweg 28 2645 EJ Delfgauw The Netherlands
Phone +31 (0)15-2578040 Founded 18 May 1988 Fax +31 (0)15-2578050 Trade reg. 27227437 Email [email protected] Site www.xensor.nl
ABN-AMRO 60 50 40 311 IBAN NL42ABNA0605040311
VAT NL 009122746 B01
copyright Xensor Integration 19 March 2018 page 38 of 39
Table 8.2: Viscosity + thermal conductivity of various gases versus temperature (continued)
Oxygen Oxygen Nitrogen Nitrogen Hydrogen Hydrogen Chlorine Chlorine
Uncertainty 2% 0.5% 3% 3% 10% 4% 5% 5%
T (K) mW/Km Pa.s mW/Km Pa.s mW/Km Pa.s mW/Km Pa.s
77 7,4 5,4
80 7,7 5,6
85 8,2 5,9
90 8,7 6,3
95 9,2 6,6
100 9,7 7
110 10,6 7,6
120 11,5 8,3
130 12,4 8,9
140 13,3 9,5
150 14,1 10,1
160 14,9 10,7
170 15,8 11,3
180 16,6 11,8
190 17,4 12,4
200 18,37 14,61 18,2 12,9 132,27 6,78
210 19,22 15,24 19 13,4 138,19 7,01
220 20,07 15,87 19,7 14 143,91 7,24
230 20,91 16,48 20,5 14,5 149,55 7,46
240 21,74 17,09 21,2 15 155,09 7,68 16,8 10,8
250 22,57 17,68 22 15,5 160,44 7,9 17,3 11,2
260 23,39 18,27 22,7 15,9 165,7 8,12 17,8 11,7
270 24,21 18,85 23,5 16,4 170,87 8,33 18,3 12,2
280 25,02 19,42 24,2 16,9 175,85 8,54 18,7 12,6
290 25,83 19,98 24,9 17,3 180,84 8,75 19,2 13,1
300 26,64 20,54 25,6 17,8 185,63 8,95 19,7 13,5
310 27,44 21,09 26,3 18,2 190,43 9,15 20,1 14
320 28,25 21,63 27 18,7 195,04 9,35 20,5 14,4
330 29,05 22,16 27,7 19,1 200,16 9,55 21 14,8
340 29,85 22,69 28,4 19,6 205,18 9,75 21,4 15,3
350 30,65 23,21 29,1 20 210,2 9,94 21,8 15,7
360 31,46 23,73 29,8 20,4 215,14 10,14 22,2 16,1
370 32,26 24,24 30,5 20,8 219,78 10,33 22,6 16,6
380 33,06 24,74 31,1 21,2 224,63 10,52 23 17
390 33,87 25,24 31,8 21,7 229,28 10,7 23,4 17,4
400 34,67 25,74 32,5 22,1 233,94 10,89 23,8 17,8
410 35,48 26,22 33,1 22,5 238,11 11,07 24,2 18,2
420 36,29 26,71 33,8 22,8 242,78 11,26 24,6 18,7
430 37,09 27,18 34,4 23,2 247,46 11,44 24,9 19,1
440 37,90 27,66 35,1 23,6 252,15 11,62 25,3 19,5
450 38,71 28,12 35,7 24 256,84 11,8 25,7 19,9
460 39,51 28,59 36,4 24,4 261,54 11,97 26 20,3
470 40,32 29,05 37 24,8 266,24 12,15 26,4 20,7
480 41,13 29,50 37,6 25,1 270,95 12,32 26,7 21,1
490 41,93 29,95 38,3 25,5 275,67 12,5 27,1 21,5
500 42,74 30,40 38,9 25,9 280,4 12,67 27,4 21,9
550 46,75 32,58 42 27,7 304,11 13,52 29,1 23,9
600 50,73 34,66 45 29,4 327,99 14,34 30,8 25,8
650 54,65 36,67 48 31,1 32,3 27,7
700 58,49 38,62 50,9 32,7 33,8 29,5
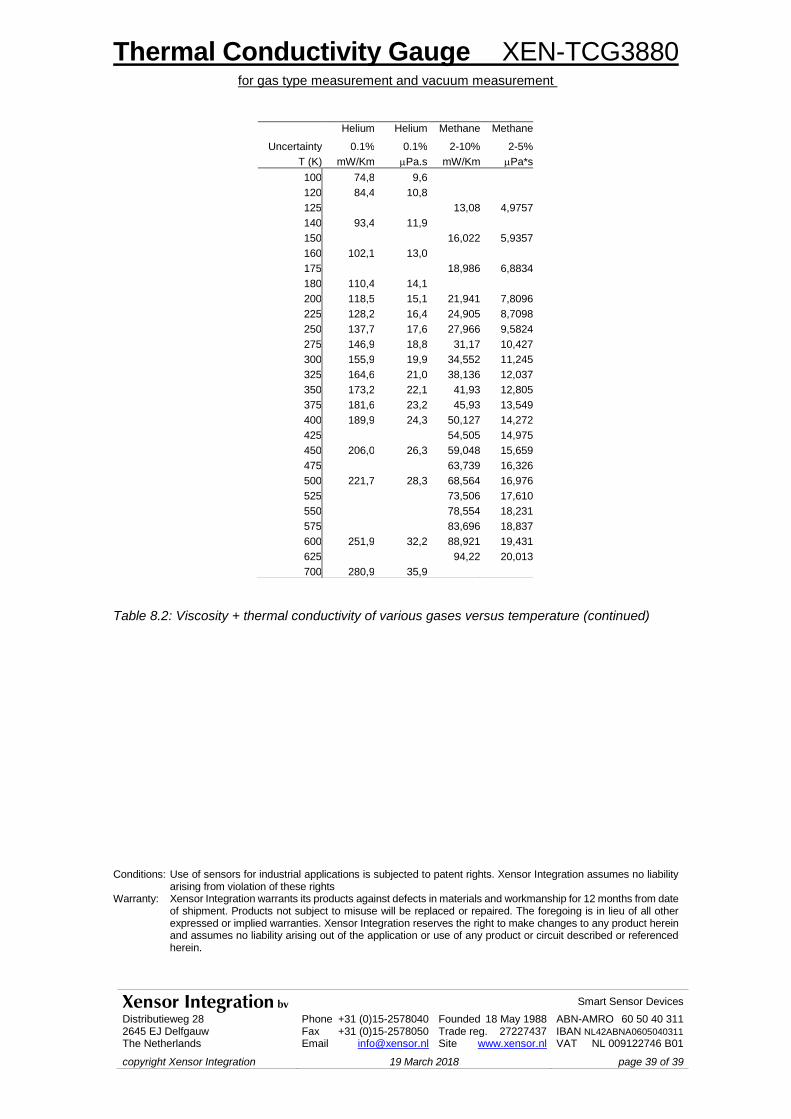
Thermal Conductivity Gauge XEN-TCG3880 for gas type measurement and vacuum measurement
Xensor Integration bv Smart Sensor Devices
Distributieweg 28 2645 EJ Delfgauw The Netherlands
Phone +31 (0)15-2578040 Founded 18 May 1988 Fax +31 (0)15-2578050 Trade reg. 27227437 Email [email protected] Site www.xensor.nl
ABN-AMRO 60 50 40 311 IBAN NL42ABNA0605040311
VAT NL 009122746 B01
copyright Xensor Integration 19 March 2018 page 39 of 39
Table 8.2: Viscosity + thermal conductivity of various gases versus temperature (continued) Conditions: Use of sensors for industrial applications is subjected to patent rights. Xensor Integration assumes no liability
arising from violation of these rights Warranty: Xensor Integration warrants its products against defects in materials and workmanship for 12 months from date
of shipment. Products not subject to misuse will be replaced or repaired. The foregoing is in lieu of all other expressed or implied warranties. Xensor Integration reserves the right to make changes to any product herein and assumes no liability arising out of the application or use of any product or circuit described or referenced herein.
Helium Helium Methane Methane
Uncertainty 0.1% 0.1% 2-10% 2-5%
T (K) mW/Km Pa.s mW/Km Pa*s
100 74,8 9,6
120 84,4 10,8
125 13,08 4,9757
140 93,4 11,9
150 16,022 5,9357
160 102,1 13,0
175 18,986 6,8834
180 110,4 14,1
200 118,5 15,1 21,941 7,8096
225 128,2 16,4 24,905 8,7098
250 137,7 17,6 27,966 9,5824
275 146,9 18,8 31,17 10,427
300 155,9 19,9 34,552 11,245
325 164,6 21,0 38,136 12,037
350 173,2 22,1 41,93 12,805
375 181,6 23,2 45,93 13,549
400 189,9 24,3 50,127 14,272
425 54,505 14,975
450 206,0 26,3 59,048 15,659
475 63,739 16,326
500 221,7 28,3 68,564 16,976
525 73,506 17,610
550 78,554 18,231
575 83,696 18,837
600 251,9 32,2 88,921 19,431
625 94,22 20,013
700 280,9 35,9