Embed Size (px)
Citation preview

THERMAL DISSOCIATION OF METHANEUSING A SOLAR COUPLED AEROSOL FLOW REACTOR
Alan W. Weimer, Jaimee Dahl, and Joseph TamburiniUniversity of Colorado, Department of Chemical Engineering
Boulder, CO 80309-0424
Allan Lewandowski, Roland Pitts, and Carl BinghamNational Renewable Energy Laboratory
Golden, CO 80401-3393
Gregory C. GlatzmaierPeak Design
Evergreen, CO 80439
Abstract
A solar-thermal aerosol flow reactor has been constructed, installed and tested at the High-FluxSolar Furnace (HFSF) at the National Renewable Energy Laboratory (NREL). “Proof-of-concept” experiments were successfully carried out for the dissociation of methane to producehydrogen and carbon black. Approximately 90% dissociation of methane was achieved in a25-mm diameter quartz reaction tube illuminated with a solar flux of 2400 kW/m2 (or suns).Preliminary economics for a 1,000,000 kg/yr solar-thermal hydrogen plant were evaluated usinga discount cash flow analysis that required a 15% Internal Rate of Return (IRR). If either productis the sole source of revenue, the required selling price for hydrogen was $27/MBtu($0.092/kWhr or $25.6/GJ) and for carbon black it was $0.55/lb ($1.21/kg). If both products aresold, and carbon black is sold for $0.35/lb ($0.77/kg), the required selling price for hydrogen was$10/MBtu ($9.47/GJ or $0.034/kWhr). Both the experimental and economic results are veryencouraging and support further work to address the technical issues and to develop the process.

Introduction
The primary driver for the development of renewable energy strategies is current concern overthe potential, irreversible environmental damage that may occur with the continued oraccelerated use of fossil fuels. Movement toward a hydrogen (H2) based economy is an essentialcomponent of an international program to address that concern and will, in addition, addressconcerns over pollution in cities and associated health costs. However, current methods forproducing H2 incur a large environmental liability because fossil fuels are burned to supply theenergy to reform methane (CH4). We propose an alternate strategy using highly concentratedsunlight as the energy source that does not result in an increase of environmental liability.Indeed, it represents a route for utilizing current natural gas reserves that fixes carbon as well asincreasing the energy content of the fuel. The research presented here is oriented at developing acost-effective, solar-thermal method of deriving H2 from natural gas.
Background
Steinberg [1986, 1987, 1994, 1995, 1998, 1999] and Steinberg and co-workers [Steinberg andCheng, 1989] have been major proponents of the thermal decomposition of CH4 process for H2
production. Methane (CH4) is dissociated to carbon (C) black and H2 according to:
CH4 è C + 2H2 ∆H298K = 74.9 kJ/mol (1)
Methane (CH4) is a preferred choice for the production of H2 from a hydrocarbon because of itshigh H to C ratio (H/C = 4), availability, and low cost. Furthermore, the C produced can be soldas a co-product into the carbon black market (inks, paints, tires, batteries, etc.) or sequestered,stored, and used as a clean fuel for electrical power generation. The sequestering or storing ofsolid C requires much less development than sequestering gaseous CO2.
Gibbs free energy minimization calculations have been carried out (P = 0.1 MPa;873 K ≤ T ≤ 2273 K) for the CH4 dissociation system (i.e. CH4 + heat è equilibrium products)to determine equilibrium products. The concentrations of chemical species reaching a state ofchemical equilibrium from reaction or partial reaction at atmospheric pressure for variousreaction temperatures have been calculated using the F*A*C*T equilibrium code EQUILIB(Thompson et al., 1985]. Thermodynamically favored products (Figure 1) indicate dissociationabove 600 K and that temperatures T > 1600 K are required to achieve nearly completedissociation. Although not shown, trace products at 1600 K include C2H2, C2H4, C4H8, C3H6,C2H6, and other species at concentrations < 40 ppm.
There are several alternatives to supply the energy required to drive reaction (1). In thecommercial “Thermal Black Process” [Donnet, 1976], the energy is provided by burning CH4
with air to heat a fire brick furnace to temperatures as high as 1673 K. Once hot, the air is shutoff and the CH4 decomposes according to reaction (1) until the wall temperature drops to below1073 K. The system is operated semi-continuously with CH4 burned in one sequence of the cycleto supply the heat necessary to carry out the decomposition in the second sequence. This processhas been practiced for many years for the production of carbon black. The H2 produced is used asa fuel to heat the furnace and the CH4 feedstock.

Pohleny and Scott (1962) used a fluidized bed/riser thermal decomposition reactor process thatuses iron oxide for heat transfer and as a catalyst. Carbon collected on the iron oxide particles inthe fluidized bed is burned off in the riser reactor for reheating the iron oxide particles that arerecirculated to the endothermic fluidized bed reactor. Hydrogen is produced continuously by thedecomposition occurring in the fluidized bed.
Gaudermack and Lynum (1996) and Bromberg et al. (1998) used a plasma torch to supply thenecessary energy to decompose CH4 and produce a continuous stream of H2. The plasma gas isH2 that is recirculated from the process. Although no CO2 is liberated from the process reactoritself, electricity is required to produce the plasma. When the electrical power is produced fromnatural gas fuel combustion, even in an efficient combined cycle plant, the overall thermalefficiency is significantly reduced and the CO2 emission per unit energy is significantlyincreased.
In another process [Steinberg, 1995a], a molten metal bath reactor (such as tin or copper) is usedto transfer heat to CH4 that is bubbled through the molten metal. The reactor is heated bycombustion products (CH4 or H2 burned with air) that flow through an internal heat exchanger.In this process, it is proposed to capture carbon in the liquid metal and to separate it from themetal by density difference, skimming the carbon off from the surface much as slag is skimmedoff the surface of molten iron in a conventional blast furnace.
Although thermodynamics can predict when a reaction will not occur, it cannot predict whether areaction will indeed occur in practice. Activation energies, transport processes (e.g. heating rate),and other reaction kinetic considerations are needed in order to determine if a reaction can becompleted for a given amount of time in a chemical reactor design. Such kinetic data have beenreported for reaction (1) using electrically heated pilot-scale aerosol flow reactors [Matovich,1977].
0
0.5
1
1.5
2
500 1000 1500 2000
Temperature (K)
Mo
les
of
Sp
ecie
sC
H2
CH4
T > 1500 K
Figure 1. Primary Methane Decomposition Equilibrium Products P = 0.1 MPa

Matovich (1977) showed that the decomposition of CH4 could be carried to completion in a shortresidence time aerosol reaction tube at temperatures T > 2088 K. The reactor consisted of a0.0762-m diameter x 0.914-m long (3 inch ID x 3 ft long) graphite aerosol reaction tube heatedindirectly by radiation from external electrodes heated directly by electrical resistance. Laterstudies included work carried out in 0.305-m ID x 3.66-m long (1 ft ID x 12 ft long) reactiontubes [Lee et al., 1984]. A small amount of carbon black was introduced in the CH4 feed streamto serve as a radiation-absorbing target to initiate the pyrolytic reaction. Due to the hightemperatures involved and the difficulty in heating a gas to those temperatures (by convectionfrom the reactor walls), the carbon particles are the key to this process.
Reactions were carried out in the temperature range of 1533 < T < 2144 K with residence timesbetween approximately 0.1 and 1.5 seconds. The fraction of CH4 dissociated was determined bymeasuring the thermal conductivity of the effluent gas after filtering the carbon black particlesfrom the sample. Hydrogen (H2) flowed radially through a porous reaction tube, providing afluid-wall to prevent carbon black from depositing on the wall. The residence time in the reactorwas controlled by the inlet flow of CH4, the radial flow of H2, and the reactor temperature. Somereported results [Matovich, 1977] where data were available for both a minimum residence time(tr(min)) of 0.2 s and a maximum residence time (tr(max)) of 1 s are summarized in Figure 2. It isclear from these results that residence time has little effect on dissociation for temperaturesT > 1900 K and that complete dissociation can be achieved in aerosol flow reactors fortemperatures greater than approximately 2100 K for reaction times of t = 0.2 s.
Residence time doesn’timpact results for T > 1900 K
50
60
70
80
90
100
1500 1600 1700 1800 1900 2000 2100 2200
Temperature (K)
Per
cen
t M
eth
ane
Dis
soci
atio
n
tr(max) = 1 s
tr(min) = 0.2 s
Range ofresidence time
Figure 2. Effect of Residence Time & Temperature

The process investigated here is the high-temperature thermal dissociation of CH4 using a solar-thermal aerosol flow reactor. The energy required to drive reaction (1) is supplied byconcentrated sunlight. An experimental reactor apparatus was constructed and interfaced toNREL’s HFSF [Jenkins et al., 1996; Lewandowski, 1993; Lewandowski et al., 1991; and Pitts etal., 1993]. There is no need for auxiliary cooling at the optical source. The reactor is operated asa cold wall process, because the beam is delivered directly on target. In addition, the control ofsolar radiation (on/off) is almost instantaneous. Absorbing surfaces exposed to concentrated solarradiation can reach temperatures of between 1000 K and 3000 K in fractions of a second. Theprocess produces H2 using high efficiency direct solar-thermal heating with no associated CO2
generation.
Experimental Work
High-Flux Solar Furnace
The HFSF facility (Figure 3) at NREL in Golden, CO was used for this research. NREL is theprimary national laboratory in the United States for renewable energy research. The HFSF uses aseries of mirrors that concentrate sunlight to a focused beam at maximum power levels of 10 kWinto an approximate diameter of 10 cm. The solar furnace’s long focal length and its off-axisdesign give researchers flexibility and control over the delivered flux. It operates with a heliostatthat has an area of 31.8 m2 and a 92% solar-weighted reflectivity. The heliostat reflects sunlightto a primary concentrator consisting of 25 hexagonal facets that are spherical mirrors ground to a14.6-m radius of curvature. The total surface area of the primary concentrator is 12.5 m2 and itreflects radiation from the entire solar spectrum (300 nm to 2500 nm). Under optimal conditions,the primary concentrator can achieve maximum flux intensities of 2,500 suns. Secondaryconcentrators that achieve intensities of more than 20,000 suns and refractive designsapproaching 50,000 suns can be installed at the primary concentrator’s focal point to increase theintensity further. The furnace is easily capable of delivering flux densities on the order of 100-1000 W/cm2. No secondary solar concentration was used in these studies.
Figure 3. High-Flux Solar Furnace Schematic

Reactor System
Proof-of-concept experiments were carried out using a modified reactor system originally builtfor previous experiments in fullerene production [Mischler et al., 1997]. The reactor consists of aparticle and gas feed mechanism, quartz reactor tube, an internal graphite “target” feed tube, anda filter housing. The reactor operates at atmospheric pressure with gas flow driven and controlledthrough a series of mass flow controllers. An in-line Horiba model TCA-300 H2 detector wasinserted downstream of the particle filter. This detector is based on thermal conductivitymeasurements and was calibrated for 5 % H2 in argon (Ar). Gas samples were also taken andanalyzed using an off-line gas chromatograph (GC). CH4 and produced H2 were kept outsideflammability limits by operating with a dilute 5% CH4 in Ar feed gas mixture and a pure Arpurge stream. The temperature inside the quartz tube reactor is exceedingly difficult todetermine. However, the temperature of the quartz tube is carefully monitored using an infraredcamera positioned on the side of the reactor. The quartz temperature is monitored to avoidwarping or even melting the reactor wall with concentrated sunlight. A schematic of the reactorsystem is shown in Figure 4.
A key aspect of the reactor operation is the heating means for the feed CH4. The reactor has beendesigned for three alternative heating methods: (1) heating a 6 mm OD x 3 mm thick “target”graphite tube with concentrated sunlight, the heated target then heating the CH4-containing feedgas by conduction; (2) heating the “target” graphite tube, but with radiation absorbing finecarbon black particles suspended in the CH4-containing feed gas stream so the inside wall of the
Fluid-wall gas (Ar)
Nozzles
Process gas(Ar/CH4) Feed Particles (Carbon Black, C)
Quartz glass
Particle cloud
C, Ar, H2
ConcentratedSunlight(2000 X)
Spinning Brush Particle Feeder
Graphite tube
Figure 4. Schematic of Solar-thermal Aerosol Flow Reactor
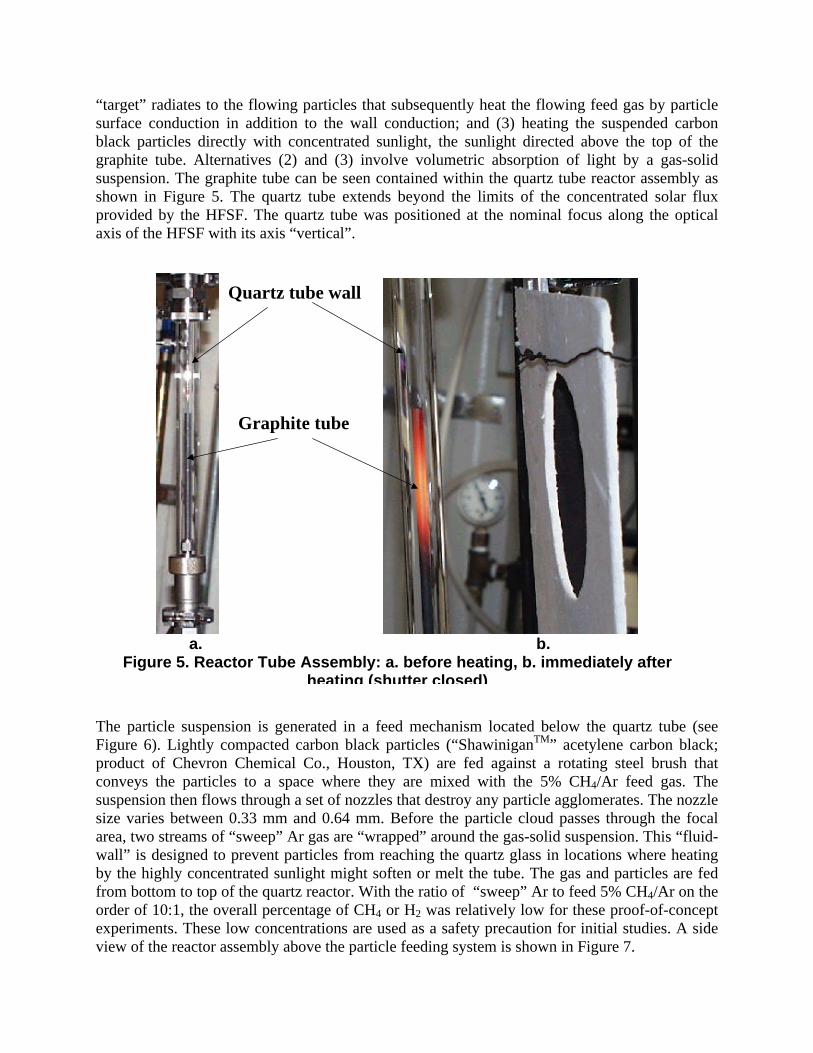
“target” radiates to the flowing particles that subsequently heat the flowing feed gas by particlesurface conduction in addition to the wall conduction; and (3) heating the suspended carbonblack particles directly with concentrated sunlight, the sunlight directed above the top of thegraphite tube. Alternatives (2) and (3) involve volumetric absorption of light by a gas-solidsuspension. The graphite tube can be seen contained within the quartz tube reactor assembly asshown in Figure 5. The quartz tube extends beyond the limits of the concentrated solar fluxprovided by the HFSF. The quartz tube was positioned at the nominal focus along the opticalaxis of the HFSF with its axis “vertical”.
The particle suspension is generated in a feed mechanism located below the quartz tube (seeFigure 6). Lightly compacted carbon black particles (“ShawiniganTM” acetylene carbon black;product of Chevron Chemical Co., Houston, TX) are fed against a rotating steel brush thatconveys the particles to a space where they are mixed with the 5% CH4/Ar feed gas. Thesuspension then flows through a set of nozzles that destroy any particle agglomerates. The nozzlesize varies between 0.33 mm and 0.64 mm. Before the particle cloud passes through the focalarea, two streams of “sweep” Ar gas are “wrapped” around the gas-solid suspension. This “fluid-wall” is designed to prevent particles from reaching the quartz glass in locations where heatingby the highly concentrated sunlight might soften or melt the tube. The gas and particles are fedfrom bottom to top of the quartz reactor. With the ratio of “sweep” Ar to feed 5% CH4/Ar on theorder of 10:1, the overall percentage of CH4 or H2 was relatively low for these proof-of-conceptexperiments. These low concentrations are used as a safety precaution for initial studies. A sideview of the reactor assembly above the particle feeding system is shown in Figure 7.
Quartz tube wall
Graphite tube
a. b.Figure 5. Reactor Tube Assembly: a. before heating, b. immediately after
heating (shutter closed)

Figure 6. Particle Feeding System (below reactor assembly)
Figure 7. Reactor Assembly (above particle feeding system)

Proof-of-concept Results and Discussion
The signal response for a typical experiment is shown in Figure 8. This was a very clear day withdirect normal irradiance at approximately 1000 W/m2. The estimated flux on the target (reactor)was about 2400 kW/m2 or 2400 suns. The gas temperature was monitored by a thermocoupledownstream of the reactor and the quartz temperature was monitored with an infrared videocamera (IR in Figure 8). First the flow of sweep argon gas was initiated at 2 slpm (standard litersper minute), then the particle feed and 5 mol % CH4/Ar (at a flow of 0.1 slpm) were started atabout 4 minutes (0.22 mol % CH4/Ar total). The particles and CH4/Ar feed gas mixture enteredthe reaction tube through a 0.15-m long internal graphite tube as described earlier. A change inthe H2 % can be seen since the thermal conductivity of CH4 is higher than argon (there is a timedelay for the flow to reach the H2 detector of about 20 to 30 seconds). This signal was allowed tosteady, then the concentrated sunlight was introduced by opening a fast-acting shutter. A nearlyimmediate increase in the H2 signal can be seen in the dashed trace. The shutter was closed atabout 11 minutes and a corresponding decrease in the H2 signal can be seen. At 16 minutes theflow of CH4/Ar feed gas was stopped, then restarted, stopped again and restarted at 0.2 slpm at18 minutes (0.45 mol % CH4/Ar total). The changes in the H2 signal clearly indicate that the H2
production is following these flow manipulations. A sample bag was filled for subsequentanalysis from about 20 to 25 minutes. The shutter was closed at about 27 minutes. Thesubsequent off-line GC analysis (0.8 mol % H2, 180 ppm CH4, 180 ppm C2H2, 520 ppm C2H4,0.06 mol % CO, 0.05 mol % CO2, 1.5 mol % air, balance Ar) of the collected gas sampleindicated an 88 % dissociation of methane. The air was introduced when the sample bag wasdetached from the collection valve and possibly also when attaching it to the GC system. The COand CO2 indicate that there is some air in the system. The ethylene and acetylene are incompletereaction products. At the flows of CH4 and Ar in this experiment, complete dissociation of CH4
to H2 would have yielded 0.91 mol % H2. These results indicate that, with constant solar flux, anincrease in the CH4 feed rate results in an increase in the H2 synthesis rate.
0
500
1000
1500
2000
2500
0 10 20 30 40Time, minutes
Tem
p, o
C o
r F
lux,
kW
/m2
0.0
0.2
0.4
0.6
0.8
1.0%
H2
Flux IR Temp % Hydrogen
Figure 8. Signal Response to Solar Flux (with particle feed)
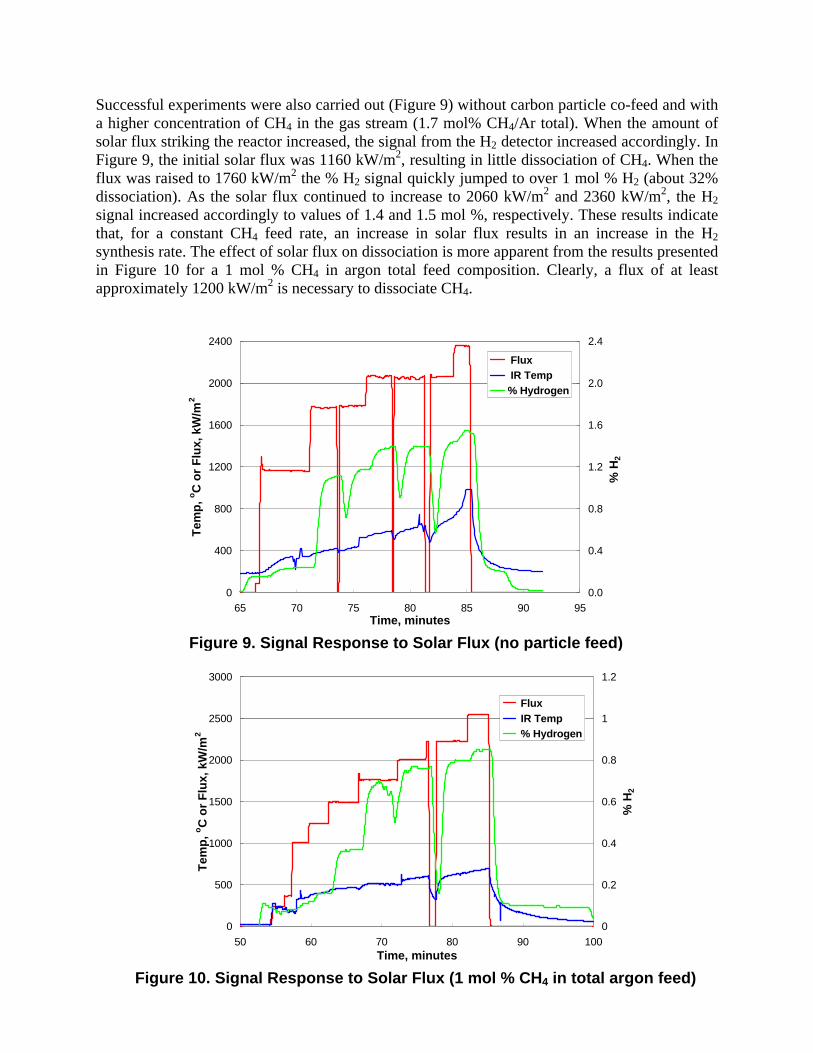
Successful experiments were also carried out (Figure 9) without carbon particle co-feed and witha higher concentration of CH4 in the gas stream (1.7 mol% CH4/Ar total). When the amount ofsolar flux striking the reactor increased, the signal from the H2 detector increased accordingly. InFigure 9, the initial solar flux was 1160 kW/m2, resulting in little dissociation of CH4. When theflux was raised to 1760 kW/m2 the % H2 signal quickly jumped to over 1 mol % H2 (about 32%dissociation). As the solar flux continued to increase to 2060 kW/m2 and 2360 kW/m2, the H2
signal increased accordingly to values of 1.4 and 1.5 mol %, respectively. These results indicatethat, for a constant CH4 feed rate, an increase in solar flux results in an increase in the H2
synthesis rate. The effect of solar flux on dissociation is more apparent from the results presentedin Figure 10 for a 1 mol % CH4 in argon total feed composition. Clearly, a flux of at leastapproximately 1200 kW/m2 is necessary to dissociate CH4.
0
400
800
1200
1600
2000
2400
65 70 75 80 85 90 95Time, minutes
Tem
p, o
C o
r F
lux,
kW
/m2
0.0
0.4
0.8
1.2
1.6
2.0
2.4
% H
2
Flux IR Temp% Hydrogen
Figure 9. Signal Response to Solar Flux (no particle feed)
0
500
1000
1500
2000
2500
3000
50 60 70 80 90 100Time, minutes
Tem
p, o
C o
r F
lux,
kW
/m2
0
0.2
0.4
0.6
0.8
1
1.2
% H
2
Flux IR Temp % Hydrogen
Figure 10. Signal Response to Solar Flux (1 mol % CH4 in total argon feed)

Process Design and Cost Analysis
A preliminary plant design was developed for a solar-coupled process for the thermaldecomposition of methane to hydrogen and carbon black. The process economics were evaluatedusing discount cash flow analysis. Cash flow analysis determines the required selling prices ofthe hydrogen and carbon black products. The sales price of these products must generatesufficient revenue to pay for annual operating expenses and the initial capital investment, andprovide an acceptable internal rate of return over the lifetime of the process.
Since some of the specific design factors and process costs were not known exactly, these factorsand costs were treated as parameters in the analysis. This approach provides insight into how theprocess economics depends on the values of these factors and costs and determines which factorsand costs are most important in determining the overall process economics.
A preliminary evaluation of the current carbon black commercial market was also performed todetermine current market sizes for the various grades of carbon black products and theircorresponding selling prices. Results from the process design, economic analysis, and marketevaluation were used to draw conclusions and make recommendation s for future research andprocess development.
Process Plant Design
The solar-coupled plant is envisioned to have many of the same unit operations as those of acurrent commercial carbon black plant [Wang, 1993]. A schematic of the plant is shown inFig. 11. The reactor is mounted on top of the tower which receives concentrated solar from afield of tracking mirrors or heliostats. The concentrated solar energy provides the energy needsfor the process and eliminates the need for partial combustion of the feed. The feed for thisprocess is natural gas, which is preheated in the heat exchanger by the product stream. Naturalgas, recycled hydrogen and carbon particles enter the top of the reactor and flow downwardwhere they are heated directly with solar flux. Decomposition of the natural gas results in aproduct stream consisting of carbon black and hydrogen.
A water quench is not used in this design to maintain a pure stream of carbon black andhydrogen. The product stream flows through the tube side of the heat exchanger and is cooled toabout 200oC (473 K) before entering the bag houses. The carbon black is separated in the baghouses and transferred to the storage tanks in the same manner as that of the commercial carbonblack process. Hydrogen gas exits the top of the bag houses at near ambient temperature andpressure. A portion of the hydrogen gas is recycled back to the reactor and fed separately to flowpast the reactor window and prevent deposition of carbon black. This process design and analysisdoes not include unit operations for the compression and storage of the hydrogen gas product.
Operation of a solar-coupled plant will be continuous but will only operate when sufficient solarirradiance is available. This fraction of time is referred to as the solar capacity factor and varieswith geographic location. Capacity factors for locations that are favorable for solar processes,such as the desert southwest portion of the United States, have been measured to be as high as0.41. For this work, the capacity factor was varied from 0.28 to 0.41. Limited operation of the

solar-coupled plant results in higher capital costs as compared to a continuous operation plantwith the same annual production capacity.
Cash Flow Analysis
Cash flow analysis was performed to determine process economics for the solar-coupled process.The analysis consisted of determining the fixed capital and annual operating costs for the processas a function of key design and cost parameters. These parameters included 1) heliostat cost,2) annual production rate, 3) reaction temperature, 4) reaction residence time, 5) hydrogenfraction recycled, 6) reactor thermal efficiency, and 7) solar capacity factor. The methods fordetermining these costs are described below.
After fixed capital and annual operating costs for each case were determined, cash flow analysiswas performed to determine the required selling prices for hydrogen and carbon black. The cashflow analysis had the following assumptions:
1. Project lifetime: 21 years2. Construction period: 1 year3. Working capital: 10% of total capital4. Capital depreciated, 10% per year5. Tax rate: 28%6. Internal rate of return (IRR): 15%
Carbon black, hydrogen
Carbon black storage tanks
Bag houses Pneumatic conveyor
Blower
Hydrogen product
Reactor
Heat Ex
Solar heliostat field
Tower
Natural gas
Natural gas
Hydrogen recycle
Heliostat field
Figure 11. Solar-thermal Processing: a. schematic of aerosol CH4 dissociationprocess, b. photograph of 10 MW Barstow, CA facility
a.
b.

Cash flow analysis determined the required selling prices of hydrogen and carbon black toachieve a net present value of zero at the end of the lifetime of the process. This approach isconsistent with the method used by the Hydrogen Program to assess the economics of hydrogenproduction processes [Mann, 1995]. For all cases, the hydrogen that was produced was assumedto have an energy content of 39.4 kWhr/kg (0.0611 MBtu/lb), which corresponds to its higherheating value (HHV). The final hydrogen product was at ambient temperature and pressure.
Capital Cost Estimation
The capital equipment items for the process included the land, heliostats and tower, reactor, heatexchanger, bag houses, pneumatic conveyor, blower, and storage tanks. For each item, apurchase cost was determined. Methods for calculating purchase costs for each item aredescribed below. The purchase cost included shipping and sales taxes. The fixed capital cost foreach item was determined by multiplying the purchase cost by an inflation factor, a set of directand indirect cost factors, and a contingency and fee. These factors varied with equipment itemand values and are summarized in Table 1. For each item, the fixed capital cost was determinedby the formula:
Fixed Capital Cost = Purchase cost*FInflation*(1+FDirect+FIndirect)*(1+FContingency&Fee) (2)
Each item had an inflation factor based on the year from which purchase costs were obtained. Allinflation factors were based on cost indices taken from Chemical Engineering (2000). Theheliostat, tower, and reactor purchase costs were based on current (2000) cost estimates so thefactor for those items was 1. The bag house costs were determined from an estimation procedurebased on 1987 costs [Turner et al., 1987a,b]. Purchase costs for the remainder of the equipmentitems were based on cost tables for January 1990 taken from Peters & Timmerhaus (1991).
The purchase price of land was assumed to be current (Year 2000) at $500/1000m2. Since thecost of land improvement was factored into the cost of equipment, all of the direct and indirectcost factors were taken to be 0 for land. For this item, the fixed capital and purchase costs wereequal. The quantity of land required for the process was determined from the required heliostatarea. The ratio of required land area to heliostat area was 6 to account for reasonable spacingbetween heliostats.
Table 1. Capital Cost Factors for Purchased Capital Equipment
Factors Heliostats & Tower Reactor Bag Houses Heat EX, etc
Inflation 1 (2000) 1 (2000) 1.56 (1987) 1.41 (1990)
DirectFoundation prep. 0 0 0.1 0.1Support housing 0 0.08 0 0
Installation 0 0.39 0.39 0.39Electrical & piping 0 0.41 0.41 0.41Instrum & controls 0 0.15 0.15 0.15Service facilities 0.1 0.55 0.55 0.55

Factors Heliostats & Tower Reactor Bag Houses Heat EX, etc
IndirectEngineering 0.1 0.32 0.32 0.32Construction 0.1 0.34 0.34 0.34
Contingency & fee 0.1 0.15 0.15 0.15
The purchase cost for heliostats and tower were assumed to include most of the direct costfactors listed in Table 1. A cost factor was included for the cost of service facilities. Because thecapital expense for these items is much greater than that of the process equipment, the indirectcost factors and contingency & fee were assumed to be less for these items. The tower wasassumed to cost $7,500/m of height. This cost is based on estimates from Epstein et al. (1996).The estimated cost for heliostats varies widely depending on the size of the plant and state ofmaturity of the solar industry. For this reason, heliostat cost was made a parameter in thisanalysis. Values from $50/m2 to $1000/m2 were evaluated. Epstein et al. (1996) reported avendor heliostat quotation of $150/m2 (for 60,800 m2 of heliostat) installed, but not including thefoundation, wiring, or site development.
The tower height was determined from the heliostat area according to the formula [PrecisionGlassblowing, 2000]:
Height = 10*(heliostat area/1000)0.5 (3)
This formula accounts for the need to increase the tower height as the heliostat area increases.This is done to prevent shading between heliostats. The heliostat area was determined from therequired reactor power, the available solar resource, and several efficiency factors, whichaccount for energy losses as the power is delivered to the reactor. Heliostat area was determinedusing the expression:
Heliostat area = Powerreactor/Efficiencyreactor/Efficiencyheliostat/Resouce (4)
In this formula, Powerreactor is the required reactor power in kW. Efficiencyreactor is the thermalefficiency of the reactor. It accounts for thermal energy losses through the reactor walls andwindow. Most of the loss results from radiation losses through the window. This efficiency wasevaluated as a parameter with values of 0.3, 0.5, and 0.7. Efficiencyheliostat is the efficiency of theheliostats. It accounts for reflectivity losses (about 5%), projected area losses due to the anglebetween the incident sunlight and the target reactor and soiling due to dust and dirt. Values forthis efficiency vary depending on the location of the heliostat and tower relative to the positionof the sun in the sky. An average value for all of the heliostats was assumed to be 0.69. Resourceis the average solar resource that is available when the plant is operating. For this analysis, thesolar resource was assumed to be 0.75 kW/m2. Once reactor power is known, values for heliostatarea and tower height, along with their corresponding fixed capital costs can be determined fromthe above formulas.

The reactor was assumed to be a vertical, cylindrical design with some portion or all of thereactor length consisting of a quartz wall that is supported inside a steel housing. A portion of thelength would not have the steel housing and would function as the window. A cost factor wasincluded for the steel housing and insulation. There was no cost factor for foundation preparationsince the reactor is mounted on top of the tower. The purchase cost was based on cost estimatesobtained from a local vender [Precision Glassblowing, 2000] for quartz tubing having diametersof 1, 2, 2.5, 3, and 3.5 ft (i.e. 0.305, 0.61, 0.762, 0.914, and 1.07 m). For all sizes, the cost of thequartz tubing, on a volume basis, varied from $900/ft3 to $1,200/ft3 ($31,780 to $42,373/m3).The purchase cost of the reactor was chosen to be $1,100/ft3 or $38,870/m3. The purchase cost ofthe reactor was assumed to be linear with reactor volume.
The key factors for determining the reactor volume were the volumetric flow rate and reactorresidence time. Since the molar and volumetric flow rates increase as the decomposition ofmethane proceeds, these flow rates were based on product flow rates. Direct heating of thereactants in the reactor is expected to allow for very short residence times. The residence timewas evaluated as a parameter with conservative values from 1 to 4 seconds, although fractions ofa second have been shown to be sufficient (Figure 2). The total volumetric flow rate depends onthe instantaneous molar flow rate of methane, the fraction of recycled hydrogen, and the reactortemperature and pressure. The instantaneous molar flow rate of methane was determined fromthe annual production of hydrogen, using the solar capacity factor to account for the actualoperating time. The total molar flow rate through the reactor assumed that all methane isconverted to hydrogen and accounts for the additional molar flow due to recycled hydrogen. Thetotal volumetric flow rate was determined from the total molar flow rate, reactor temperature andpressure, using the ideal gas law as the state function. Reactor pressure was atmospheric for allcases. Reactor temperature was varied as a parameter from 1,600 to 1,900oC (1873 to 2173 K).
To determine heliostat area, total reactor power was also determined. This was based on theinstantaneous molar flow rate of methane, the molar heat of reaction, and the energy required toheat methane to the reaction temperature. Values for the heat of reaction and enthalpy formethane as a function of temperature were obtained from Roine (1997). A portion of the sensibleenergy in the products is recovered in the heat exchanger. This recovered power is accounted foras a credit in the total reactor power calculation.
A summary of the equipment size and equipment fixed capital cost according to equation (2) foreach piece of equipment is included in Table 2 for the base case of 1,000,000 kg H2/yr. The totalequipment fixed capital investment is $7,941,000.
Table 2. Summary of Fixed Capital Equipment Cost (Base Case)
Equipment Size Fixed Capital Cost
Land: 72,608 m2 $36,300Heliostat: 12,101 m2 $4,360,000Tower: 35 m $376,000Reactor: 3.13 MWth, 10.4 m3 $1,513,000Heat Exchanger: 795 m2 $620,000

Equipment Size Fixed Capital Cost
Baghouse Filter: 117 m2 $137,000Other EquipmentPneumatic Conveyer:Storage Tanks:& Blower:
1000 kg/hr115 m3
2.36 m3/s (5,000 acfm)
Other Equipment Total:$936,000
Total Equipment: $7,941,000
The operating and maintenance (O&M) costs for the process were determined for each majorequipment item. The annual cost of natural gas ($594,000/yr @ $3.00/1000 scf) was alsodetermined. For each item, the number of labor hours per day or per some measure of equipmentsize or production capacity was estimated. This yielded a 7.5 operator/labor force with a fully-burdened labor rate of $40/hour/operator. Supervision labor was estimated at 15% of the totalO&M labor.
Base Case
A base case for the process was developed in which the most likely values for the parameterswere used. The parameter values for the base case are given in Table 3.
Table 3. Parameter Values for the Base Case
Parameter Value
Annual hydrogen production 1,000,000 kg/yrHeliostat cost $250/m2
Fraction of hydrogen recycled 0.2Reactor temperature 1,600oC
(1873 K)Reactor residence time 1 secondReactor thermal efficiency 0.5Solar capacity factor 0.28
Cash flow analysis determined the required selling prices of hydrogen and carbon black toachieve a net present value of zero at the end of the lifetime of the plant. A graph of the annualand cumulative discount cash flow over the lifetime of the process is shown in Fig. 12.
Various price combinations for hydrogen and carbon black were determined. The extreme casesare hydrogen sales only where the price of carbon black is $0/kg and carbon black sales onlywhere the hydrogen price is $0/kWhr. Intermediate cases set the price for carbon black and therequired price for hydrogen was determined. A summary of these results is presented in Table 4.

Table 4. Required Sales Prices for Hydrogen and Carbon Black for Base Case.
Case Hydrogen Selling Price Carbon Black Selling Price($/MBtu) ($/kWhr) ($/GJ) ($/lb) ($/kg)
1 27 0.0922 26.2 0.00 0.002 20 0.0683 19.0 0.15 0.333 15 0.0512 14.2 0.25 0.554 10 0.0341 9.5 0.35 0.775 5 0.0171 4.8 0.45 0.996 0 0 0 0.55 1.21
Results show that if only hydrogen is sold, the price must be $27/MBtu ($0.0922/kWhr or$26.2/GJ). If only carbon black is sold, the price must be $0.55/lb ($1.21/kg).
Another scenario was considered in which the solar capital and operating costs were set to 0 andthe hydrogen product was assumed to provide the thermal energy requirements for the process.The hydrogen byproduct in the conventional process is often used in this manner. For thisscenario, the hydrogen price would be $0.0/kWhr. Since the process is not solar-coupled, thecapacity factor can be increased from 0.28 to 0.95, indicating the plant would operate 95% of thetime. The selling price of carbon black was determined using several values for reactor residence
(10,000)
(8,000)
(6,000)
(4,000)
(2,000)
0
2,000
1 3 5 7 9 11 13 15 17 19 21
Year
Dis
cou
nt
Cas
h (
K$)
AnnualCumulative
Figure 12. Annual and Cumulative Discount Cash Flow (Base Case)
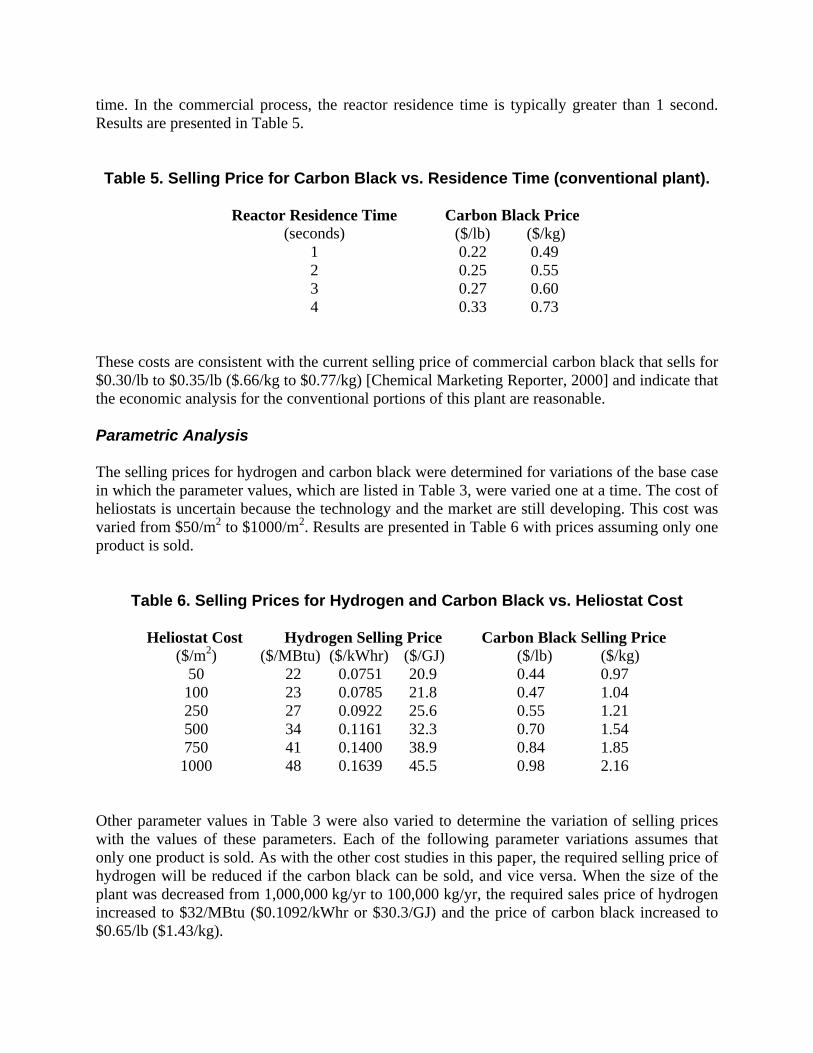
time. In the commercial process, the reactor residence time is typically greater than 1 second.Results are presented in Table 5.
Table 5. Selling Price for Carbon Black vs. Residence Time (conventional plant).
Carbon Black PriceReactor Residence Time(seconds) ($/lb) ($/kg)
1 0.22 0.492 0.25 0.553 0.27 0.604 0.33 0.73
These costs are consistent with the current selling price of commercial carbon black that sells for$0.30/lb to $0.35/lb ($.66/kg to $0.77/kg) [Chemical Marketing Reporter, 2000] and indicate thatthe economic analysis for the conventional portions of this plant are reasonable.
Parametric Analysis
The selling prices for hydrogen and carbon black were determined for variations of the base casein which the parameter values, which are listed in Table 3, were varied one at a time. The cost ofheliostats is uncertain because the technology and the market are still developing. This cost wasvaried from $50/m2 to $1000/m2. Results are presented in Table 6 with prices assuming only oneproduct is sold.
Table 6. Selling Prices for Hydrogen and Carbon Black vs. Heliostat Cost
Heliostat Cost Hydrogen Selling Price Carbon Black Selling Price($/m2) ($/MBtu) ($/kWhr) ($/GJ) ($/lb) ($/kg)
50 22 0.0751 20.9 0.44 0.97100 23 0.0785 21.8 0.47 1.04250 27 0.0922 25.6 0.55 1.21500 34 0.1161 32.3 0.70 1.54750 41 0.1400 38.9 0.84 1.851000 48 0.1639 45.5 0.98 2.16
Other parameter values in Table 3 were also varied to determine the variation of selling priceswith the values of these parameters. Each of the following parameter variations assumes thatonly one product is sold. As with the other cost studies in this paper, the required selling price ofhydrogen will be reduced if the carbon black can be sold, and vice versa. When the size of theplant was decreased from 1,000,000 kg/yr to 100,000 kg/yr, the required sales price of hydrogenincreased to $32/MBtu ($0.1092/kWhr or $30.3/GJ) and the price of carbon black increased to$0.65/lb ($1.43/kg).
A portion of the hydrogen product must be recycled back to the reactor in order to keep thewindow clean and cool. Increasing the recycled fraction increases the total gas volumetric flowthrough the reactor and therefore, reactor size and cost. When the fraction of recycled hydrogenincreased from 0.2 to 0.5, the sales price of hydrogen increased to $29/MBtu ($0.099/kWhr or$27.5/GJ) and the sales price of carbon black increased to $0.59/lb ($1.30/kg). Increasing thereactor temperature may improve the carbon black product quality. Increasing the reactortemperature also increases total gas volumetric flow through the reactor. When the reactortemperature is increased to 1,900oC (2173 K) the hydrogen price increased to $29/MBtu($0.099/kWhr or $27.5/GJ) and the carbon black price to $0.58/lb ($1.28/kg). Increasing thereactor residence time may allow for lower operating temperatures but also increases reactorsize. Increasing the residence time to 2 seconds increased the hydrogen sales price to $32/MBtu($0.1092/kWhr or $30.3/GJ) and the carbon black sales price to $0.65/lb ($1.43/kg).
Decreasing the reactor thermal efficiency increases the thermal energy requirement for thereaction, and therefore, the size of the heliostat field. Decreasing this efficiency from 0.5 to 0.25increased the sales price of hydrogen to $39/MBtu ($0.133/kWhr or $36.9/GJ) and the sales priceof carbon black to $0.79/lb ($1.74/kg).
The solar capacity factor will also impact the economics of the process. Values for this factorhave been measured to be as high as 0.41 in areas of very high solar irradiance. Increasing thecapacity factor from 0.28 to 0.41 decreases the price of hydrogen to $22/MBtu ($0.075/kWhr or$20.8/GJ) and the price of carbon black to $0.44/lb (0.97/kg).
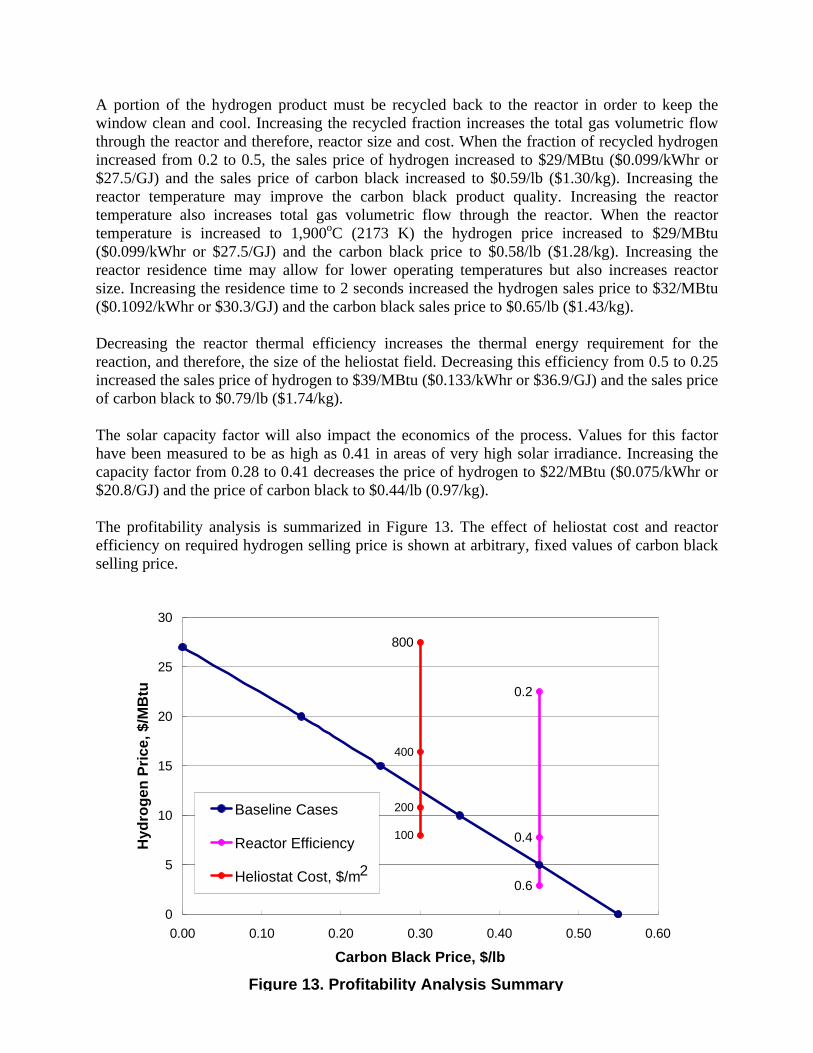
The profitability analysis is summarized in Figure 13. The effect of heliostat cost and reactorefficiency on required hydrogen selling price is shown at arbitrary, fixed values of carbon blackselling price.
0.4
0.6
0.2
800
400
200
100
0
5
10
15
20
25
30
0.00 0.10 0.20 0.30 0.40 0.50 0.60
Carbon Black Price, $/lb
Hyd
rog
en P
rice
, $/M
Btu
Baseline Cases
Reactor Efficiency
Heliostat Cost, $/m 2
Figure 13. Profitability Analysis Summary
Market Analysis for Carbon Black
A preliminary evaluation of the current carbon black commercial market was also performed todetermine current market sizes for the various grades of carbon black products and theircorresponding selling prices. Applications for carbon black include the reinforcement of rubber,use as black pigment, and as a conductive additive to rubber and plastic products [Kirk-Othmer,1991]. World production of carbon black in 1989 was greater than 6 million metric tons. UnitedStates production was about 1.6 million metric tons. About 70% of the carbon black that isproduced is used in the reinforcement of rubber for tires, 20% is used in other rubber products,and the remaining 10% in non-rubber products. Carbon black used for rubber reinforcement sellsfor about $0.30/lb to $0.35/lb ($0.66/kg to $0.77/kg) [Chemical Marketing Reporter, 2000].
The non-rubber applications include additives to plastics, printing inks, paint, and paper. Aspecial electrically conductive grade of carbon black sells for prices that are considerably higherthan those that are used in rubber reinforcement. Electrically conductive grades are used toproduce conductive and antistatic polymer composites. Applications include antistatic carpeting,floor tile, heating elements, videotapes and disks, and electrical shielding. Markets for theseapplications are increasing faster, on a percentage basis, than those for conventional uses. Thecurrent price for a higher grade of carbon black (Thermax) is $0.78/lb [Canadian CarbonCompany, 2000]. An even higher grade of carbon black produced from acetylene sells for$1.40/lb [Chevron Chemical Company, 2000].
In 1989, the total market for specialty grade carbon blacks was 126,000 metric tons or126,000,000 kg. A solar-coupled hydrogen production plant, which produces 1,000,000 kg/yr ofhydrogen, will produce 3,000,000 kg/yr of carbon black. This represents about 2.4% of thecurrent United States market for higher-grade carbon blacks. The addition of this productioncapacity to the current market would not have a significant impact on the price of higher-gradecarbon blacks and since this market is increasing faster than other carbon black markets, demandfor the additional production capacity should be easy to identify.
Summary and Conclusions
The objectives of this work were to carry out “proof-of-concept” experiments at the NRELHFSF, develop a preliminary design for a solar-coupled process for the thermal decomposition ofmethane to hydrogen and carbon black, and to evaluate the process economics using discountcash flow analysis. The initial results are encouraging and have demonstrated that the processworks in principle. High conversions have been achieved using a solar-thermal reactor notdesigned for the specific process using only modest solar concentration levels.
The conceptualized plant design includes the same major equipment components as currentcommercial carbon black production plants. These components include a high temperaturereactor, heat exchanger, bag house filters, pneumatic conveyor, blower, and storage tanks. Inaddition, the process includes a solar heliostat field and tower to provide the thermal energyneeds of the process. The process design and economic analysis contain enough refinement todetermine how the price of hydrogen and carbon black vary with the values of several key

process parameters and costs. Parametric analysis provides insight into how the processeconomics depends on the values of these factors and costs and determines which factors andcosts are most important in determining the overall process economics.
Results of the discount cash flow analysis show that the required single product selling price forhydrogen for the base case 1,000,000 kg/yr hydrogen plant is $27/MBtu ($0.0922/kWhr or$25.6/GJ) and for carbon black is $0.55/lb ($1.21/kg). These prices assume that only one productis sold. If both products are sold, then the selling price for each decreases. For example, sellingprices of $10/MBtu ($0.0341/kWhr or $9.5/GJ) for hydrogen and $0.35/lb ($0.77/kg) for carbonblack meet the discounted cash flow requirements. An analysis of the price of carbon black whenthe solar costs are set to 0 and the hydrogen is used to provide the thermal energy needs of theprocess indicates that the selling price for carbon black needs to be in the range of $0.22/lb to$0.33/lb ($0.49/kg to $0.73/kg). These results are consistent with the current prices forcommercial carbon black.
The selling prices were determined as a function of heliostat costs because the cost of heliostatsis uncertain due to a developing technology and market. The heliostat cost was varied from$50/m2 to $1000/m2. The hydrogen price varied from $22/MBtu ($0.075/kWhr or $20.8/GJ) to$48/MBtu ($0.164/kWhr or $45.6/GJ) to while the carbon black price varied from $0.44/lb($0.97/kg) to $0.98/lb ($2.16/kg). Variation of the prices with other process parameters showedthat the prices did not vary dramatically with changes in plant size, hydrogen fraction recycled,reactor temperature and residence time. The prices did increase significantly when the thermalefficiency of the reactor was decreased. This is due to the need for a larger heliostat field as thereactor efficiency decreases.
A preliminary evaluation of the current carbon black commercial market was also performed todetermine current market sizes for the various grades of carbon black products and theircorresponding selling prices. About 90% of the carbon black that is produced worldwide is usedfor rubber reinforcement. About 10% is considered specialty grade carbon black and is used asadditives in plastics, printing inks, paint, and paper. The current price for a higher grade ofcarbon blacks is about $0.78/lb ($1.72/kg). A solar-coupled hydrogen production plant, whichproduces 1,000,000 kg/yr of hydrogen, will produce about 2.4% of the current United Statesmarket for higher-grade carbon blacks. Since this market is increasing faster than other carbonblack markets, demand for the additional production capacity should be easy to identify.
The encouraging experimental results and attractive economic analysis indicate that this processwarrants further investigation. The sensitivity of the hydrogen selling price to reactor efficiencypoints out the need to focus on reactor design and performance in the next stages of the project.
Acknowledgement
The authors want to thank the DOE Hydrogen Program and The University of Colorado forfinancially supporting this work under Grants DE-FC36-99GO10454 and DE-PS36-99GO10383.

References
Bromberg, L., D. Cohn, and A. Rabinovich. 1998. “Plasma Reforming of Methane,” Energy &Fuels, 12, 11-18.
Canadian Carbon Company. 2000. Personal Communication. Cancarb Limited, 1702 Brier ParkCrescent NW, Medicine Hat, Alberta, Canada T1A 7G1 (www.CanCarb.com).
Chemical Engineering. 2000. McGraw-Hill Publishing Co. (New York).
Chemical Marketing Reporter. 2000.
Chevron Chemical Company. 2000, Personal Communication, Houston, TX
Donnet, J.B. 1976. Carbon Black, 16-18, Marcel Dekker, New York.
Epstein, M., A. Yogev, I. Hodara, and A. Segal. 1996. “Results of a Feasibility Study on thePossible Use of The Solar Tower Technology at the Dead Sea Works,” in Solar ThermalConcentrating Technologies (Proceedings of the 8th International Symposium, October, 6-11,Koln, Germany (M. Becker and M. Bohmer, editors).
Gaudermack, B. and S. Lynum. 1996. “Hydrogen Production from Natural Gas Without Releaseof CO2 to the Atmosphere,” Proceedings of the 11th World Hydrogen Energy Conference, 511-523, Coco Beach, Florida (June, 1996).
Jenkins, D., R. Winston, J. O’Gallagher, C. Bingham, A. Lewandowski, R. Pitts, and K. Scholl.1996. “Recent Testing of Secondary Concentrators at NREL’s High-Flux Solar Furnace,” ASMEJ. of Solar Energy Engineering, 29-33.
Kirk-Othmer Encylopedia of Chemical Technologies. 1991. 4th ed., 4, 1037-1072, John Wiley &Sons.
Lee, K.W., W.R. Schofield, and D. Scott Lewis. 1984. “Mobile Reactor Destroys Toxic WastesChemical Engineering, 46 – 47, April 2, 1984.
Lewandowski, A. 1993. “Deposition of Diamond-Like Carbon Films and Other MaterialsProcesses Using a Solar Furnace,” Mat. Tech., 8, 237-249.
Lewandowski, A., C. Bingham, J. O’Gallagher, R. Winston, and D. Sagie. 1991. “PerformanceCharacteristics of the SERI High-Flux Solar Furnace,” Solar Energy Materials, 24, 550-563.
Mann, M.K. 1995. “Technical and Economic Assessment of Producing Hydrogen by ReformingSyngas from the Battelle Indirectly Heated Biomass Gasifier,” NREL/TP-431-8143, 10-13.
Matovich, E. 1977. “High Temperature Chemical Reaction Processes Utilizing Fluid-WallU.S. Patent 4056602 (Nov. 1, 1977).

Mischler, D., R. Pitts, C. Fields, C. Bingham, M. Heben, and A. Lewandowski. 1997. “SolarProduction of Fullerenes from a Powdered Graphite Source,” presented at the InternationalSymposium on Solar Chemistry,” Villigen, Switzerland, October 6-7.
Peters, M.S. and K.D. Timmerhaus. 1991. Plant Design & Economics for Chemical Engineers,4th ed. McGraw-Hill, Inc. (New York).
Pohleny, J.B. and N.H. Scott. 1962. “Method of Hydrogen Production by CatalyticDecomposition of a Gaseous Hydrogen Stream,” Chemical Engineering, 69, 90-91.
Pitts, J.R., E. Tracy, Y. Shinton, and C.L. Fields. 1993. “Application of Solar Energy to SurfaceModification Processes,” Critical Reviews in Surface Chemistry, 2 (4), 247.
Roine, A. 1997. Outokumpu HSC Chemistry for Windows Version 3.0.
Steinberg, M. 1986. “The Direct Use of Natural Gas for Conversion of Carbonaceous RawMaterials to Fuels and Chemical Feedstocks,” Int. J. Hydrogen Energy, 11, 715-720.
Steinberg, M. 1987. “A Low Cost High Energy Density Carbon Black Fuel Mix for HeatEnergy Sources, 9, 161-171.
Steinberg, M. 1994. “Fossil Fuel and Greenhouse Gas Mitigation Technologies,” Int. J.Hydrogen Energy, 19, 659-665.
Steinberg, M. 1995a. “The Carnol Process for CO2 Mitigation from Power Plants and theTransportation Sector,” Brookhaven National Laboratory Report BNL 62835, Upton, NY.
Steinberg, M. 1995b. “The Hy-C Process (Thermal Decomposition of Natural Gas) Potentiallythe Lowest Cost source of Hydrogen with the Least CO2 Emission,” Energy Convers. Mgmt., 36(6-9), 791-796.
Steinberg, M. 1998. “Production of Hydrogen and Methanol from Natural Gas with ReducedCO2 Emission,” Int. J. Hydrogen Energy, 23, 419-425.
Steinberg, M. 1999. “Fossil Fuel Decarbonization Technology for Mitigating Global Warming,”Int. J. Hydrogen Energy, 24, 771-777.
Steinberg, M. and H.C. Cheng. 1989. “Modern and Prospective Technologies for HydrogenProduction from Fossil Fuels,” Int. J. Hydrogen Energy, 14, 797-820.
Turner, J.H., A.S. Viner, J.D. McKenna, R.E. Jenkins, and W.M. Vatavuk. 1987a. “Sizing andCosting of Fabric Filters, Part 1: Sizing Considerations,” JAPCA, 37 (6), 749-759.
Turner, J.H., A.S. Viner, J.D. McKenna, R.E. Jenkins, and W.M. Vatavuk. 1987b. “Sizing andCosting of Fabric Filters, Part 1: Costing Considerations,” JAPCA, 37 (9), 1105-1112.
Wang, J. 1993. Carbon Black (2nd ed.), Marcel Dekker.


![Exploring methane-hydrate formation and dissociation in ...archimer.ifremer.fr/doc/00245/35580/34209.pdf · hydrate research, Sun et al. [36] highlighted the difficulties of investigating](https://img.pdfslide.net/doc/110x75/5aad7cd37f8b9a8d678e3cd7/exploring-methane-hydrate-formation-and-dissociation-in-research-sun-et-al.jpg)


![Hydrate thermal dissociation behavior and dissociation enthalpies in methane … · mole basis, methane hydrate consists of 85.69(± 0.14)% water and 14.31(± 0.14)% methane [2]](https://img.pdfslide.net/doc/110x75/5fbd4df89eb682309316b186/hydrate-thermal-dissociation-behavior-and-dissociation-enthalpies-in-methane-mole.jpg)