Embed Size (px)
Citation preview
Thermal Effects of the Surface Heat Flux on Cloud Systems over the Tibetan Plateau inBoreal Summer
JINGHUA CHEN,a,b,c XIAOQING WU,a,d YAN YIN,a CHUNSONG LU,a HUI XIAO,e QIAN HUANG,a
AND LIPING DENGf
aCollaborative Innovation Center on Forecast and Evaluation of Meteorological Disasters, Key Laboratory for Aerosol-Cloud-
Precipitation of China Meteorological Administration, Nanjing University of Information Science and Technology, Nanjing, ChinabKey Laboratory of Meteorology and Ecological Environment of Hebei Province, Shijiazhuang, China
cPlateau Atmosphere and Environment Key Laboratory of Sichuan Province, Chengdu, ChinadDepartment of Geological and Atmospheric Sciences, Iowa State University, Ames, Iowa
eGuangzhou Institute of Tropical and Marine Meteorology, China Meteorological Administration, Guangzhou, ChinafCollege of Ocean and Meteorology, Guangdong Ocean University, Zhanjiang, China
(Manuscript received 13 September 2018, in final form 8 May 2019)
ABSTRACT
The influence of surface heat fluxes on the generation and development of cloud and precipitation and its
relative importance to the large-scale circulation patterns are investigated via cloud-resolving model (CRM)
simulations over the Tibetan Plateau (TP) during boreal summer. Over the lowland (e.g., along the middle
and lower reaches of the Yangtze River), the dynamical and thermal properties of the atmosphere take more
responsibility than the surface heat fluxes for the triggering of heavy rainfall events. However, the surface
thermal driving force is a necessary criterion for the triggering of heavy rainfall in the eastern and western TP
(ETP andWTP). Strong surface heat fluxes can trigger shallow convections in the TP. Furthermore, moisture
that is mainly transported from the southern tropical ocean has a greater influence on the heavy rainfall events
of the WTP than those of the ETP. Cloud microphysical processes are substantially less active and heavy
rainfall cannot be produced when surface heat fluxes are weakened by half in magnitude over the TP. In
addition, surface heating effects are largely responsible for the high occurrence frequency of convection
during the afternoon, and the cloud tops of convective systems show a positive relationship with the intensity
of surface heat fluxes.
1. Introduction
Surface radiation and energy budgets are critical
components of any land surface model that character-
izes hydrological, ecological, and biogeochemical pro-
cesses (e.g., Liang et al. 2010). In addition, land energy
budgets can influence the triggering and development of
clouds, which can, in turn, affect local energy budgets
and the surface heat fluxes via the modulation of solar
radiation, longwave radiation, and precipitation. Par-
ticularly, the strong surface heat fluxes can benefit the
formation and development of clouds during the warm
season. This issue has been paid great attention over the
Tibetan Plateau (TP) because of its peculiar thermal
characteristics and physical links to the East Asian
monsoon, which affects approximately one-third of the
world’s population (e.g., Duan and Wu 2005; Hsu et al.
2014; Wang and Liang 2008). The TP is an expansive
highland with an average elevation of more than 4000m
above sea level and low vegetation coverage. Conse-
quently, strong surface heat fluxes are directly injected
into the middle troposphere, influencing the cloud and
precipitation climatology over the TP (e.g., Chen et al.
2015; R. Ma et al. 2018). Furthermore, the thermal ef-
fects of the large-scale orography of the TP influence the
weather and climate downstream (e.g., Li et al. 2014)
and are regarded as a crucial factor in the formation of
the South Asian summer monsoon (e.g., Wu et al. 2015).
The surface heat fluxes, including sensible and latent
heat fluxes, are among the important factors in the oc-
currence of boundary layer clouds (e.g., Ek andHoltslag
2004). The moistening and heating of shallow cumuli in
the boundary layer can provide favorable conditions for
the triggering of deep convection (e.g., Gentine et al.
2013;Wu et al. 2009). Furthermore, the air mass near theCorresponding authors: Jinghua Chen, [email protected];
Chunsong Lu, [email protected]
1 AUGUST 2019 CHEN ET AL . 4699
DOI: 10.1175/JCLI-D-18-0604.1
� 2019 American Meteorological Society. For information regarding reuse of this content and general copyright information, consult the AMS CopyrightPolicy (www.ametsoc.org/PUBSReuseLicenses).
Unauthenticated | Downloaded 12/12/21 07:55 AM UTC

surface can be lifted upward by the strong surface sen-
sible heat over the TP, which is a branch of the meridi-
onal circulation between the TP and the Indian Ocean
(e.g., G. Wu et al. 2007, 2012). According to Xu et al.
(2014), the vapor from the tropical ocean can be trans-
ported northward and rise up to the TP through a con-
ditional instability of the second kind (CISK)-like
mechanism. Previous studies (e.g., Chen et al. 2015; Luo
andYanai 1984) have verified the important influence of
surface heat fluxes on clouds and precipitation over the
TP. In addition, different patterns of the diurnal cycle in
precipitation have been observed between the TP and
other regions (e.g., Bao et al. 2011; Hu et al. 2010; Xu
and Zipser 2011), and differences in diabatic heating
(e.g., surface heating effects) have been regarded as the
initiator of these differences in the precipitation diurnal
cycle between the TP and the lowlands (e.g., Bao
et al. 2011).
Previous modeling and observational studies (e.g.,
Jabouille et al. 1996; Wu and Guimond 2006) have
shown that the enhancement of surface heat fluxes by
the precipitating deep convection is a subgrid process for
cloud resolving simulation. A recent study demon-
strated that the surface fluxes and radiative heating have
opposite effects on precipitation in a radiative–
convective equilibrium experiment over the tropical
ocean (e.g., Anber et al. 2015). There are substantial
differences in surface heat fluxes between the TP and
the lowlands (e.g., East China), for example, the TP
shows greater sensible heating fluxes during the daytime
and has stronger diurnal cycle signal in surface heating
fluxes (e.g., Chen et al. 2015). Ground-based observa-
tions at a station atop the TP showed that the surface
sensible heat flux dominates the energy transfer from
Earth’s surface into the atmosphere, which can signifi-
cantly influence convective clouds (e.g., Zhou et al.
2011). Furthermore, an accelerating warming trend has
appeared over the TP under the background of global
warming (e.g., Duan and Xiao 2015), which has imposed
potential influences on land surface processes and sur-
face heat fluxes. The TP is a great heat source in boreal
summer, and this is considered as one of the important
driving forces for the active convection during the warm
season (Xu et al. 2014; Jiang et al. 2016; Pan et al. 2019).
The surface heat fluxes (including sensible heat flux and
latent heat flux) make an important contribution to the
heating source in boreal summer (e.g., Chen et al. 2015).
The accurate estimation of surface heat fluxes is im-
portant for weather and climate simulations over the
TP. However, different datasets show different sur-
face heat fluxes values over the TP (e.g., Zhu et al.
2012) that can affect cloud and precipitation systems.
Meanwhile, the responses of the physical processes in
cloud and the relative importance between surface heat
fluxes and the large-scale environment continue to re-
quire further study for the better understanding of
these processes over the TP.
In this study, a series of simulations are conducted to
investigate the responses of the cloud system to the
surface heat fluxes over the TP. The model and experi-
mental designs are introduced in section 2. The simula-
tion results and interpretation are given in section 3,
followed by conclusions and a discussion in section 4.
2. Model descriptions and experimental designs
a. Model descriptions
The model used in this work is a two-dimensional
cloud-resolving model (CRM), which is an anelastic
cloud model developed by Clark et al. (1996) with
imposed large-scale forcing and modifications to
physical processes that are important for the long-term
simulation of cloud systems (e.g., Grabowski et al.
1996; X. Wu et al. 1998, 1999, 2007). The Kessler-type
bulk warm rain parameterization (Kessler 1969)
and the Koenig–Murray bulk ice parameterization
(Koenig and Murray 1976) are included in the model.
Two classes of ice, referred to as ice A and ice B, are
considered by themodel, for which both themixing ratio
and the number concentration conservation equations
are solved. The ice A field (typically associated with
unrimed or lightly rimed ice particles) is formed by the
heterogeneous nucleation of pristine ice crystals, and ice
B is usually associated with heavily rimed particles (e.g.,
graupel) of fast-falling velocity and high-density, that
originate from the interaction of the rain field with iceA.
The surface heat fluxes in the model are calculated by
the parameterization based on the study of Liu et al.
(1979). However, this parameterization was developed
for tropical ocean regions and is not necessarily suitable
over land. Surface heat fluxes are determined mainly by
land surface properties (i.e., soil temperature and
moisture) and the surface air properties (i.e., tempera-
ture, moisture, and wind). Moreover, land surface
properties and surface air properties can affect one an-
other, which results in a great challenge in accurately
estimating surface heat fluxes. Typically, a land model
can estimate surface heat fluxes (e.g., Niu et al. 2011;
Draper et al. 2018). However, the model used in this
study is currently not coupled with a land model. For
simplification, the surface heat fluxes are prescribed by
the ERA-Interim dataset in the model. The more de-
tailed information regarding this model is available in
the related literature (e.g., Clark et al. 1996; Chen
et al. 2017).
4700 JOURNAL OF CL IMATE VOLUME 32
Unauthenticated | Downloaded 12/12/21 07:55 AM UTC
b. Data and experimental design
The large-scale forcing terms used to drive the model
mimic the effects of large-scale flow on the temperature
and moisture fields as deduced from large-scale budgets
(e.g., Yanai et al. 1973; Grabowski et al. 1996). In this
study, the large-scale horizontal and vertical advection
of temperature and moisture is computed from the
ERA-Interim reanalysis (hereafter ERAINT; Dee et al.
2011). The p velocity is recalculated from the horizontal
divergence by vertically integrating the continuity
equations because of the result’s sensibility to the ver-
tical velocity. Detailed descriptions of the calculation
processes are available in Yanai and Tomita (1998) and
Chen et al. (2015).
According to the study of Ueda et al. (2003), there
is a large heat source in the eastern TP with an ampli-
tude about 2 times those over the western plateau in
May, and the heating over the western TP becomes
weaker in July compared to May. Additionally, the
land over the eastern part is mostly covered with veg-
etation, while it is primarily barren land in the western
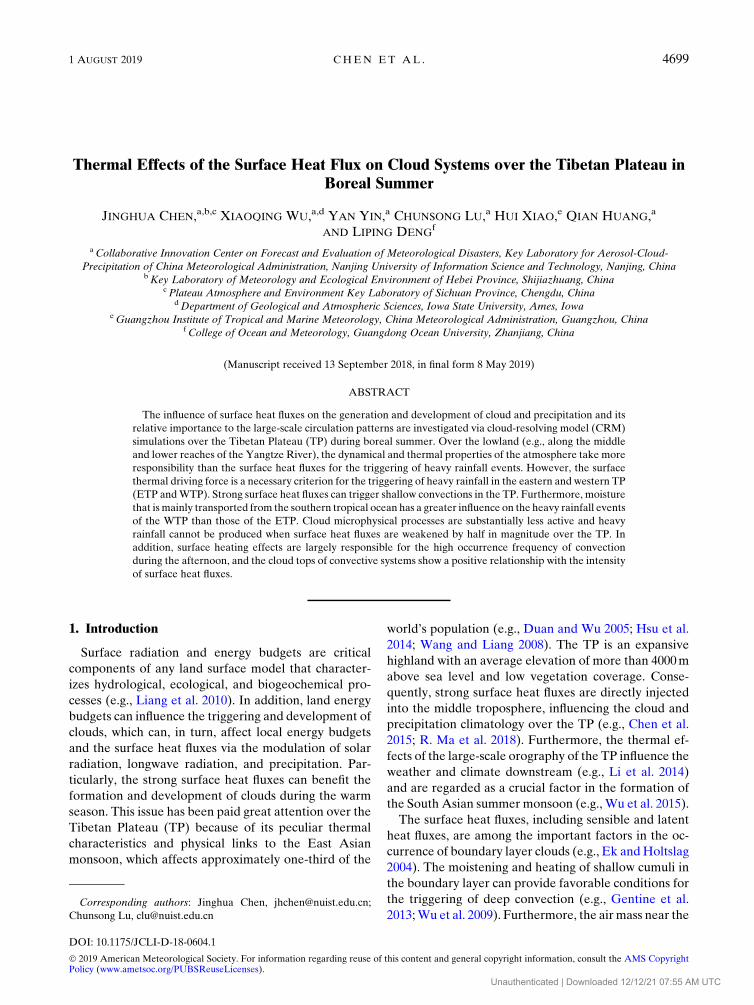
part (e.g., Cui and Graf 2009). Therefore, the TP is
separated into the eastern TP (ETP) and western TP
(WTP) (Fig. 1). To highlight the cloud particular re-
sponses to the surface heat fluxes over the TP, the
middle and lower reaches of the Yangtze River
(MLYR) is selected for comparison. The MLYR is a
flatland in East China and is famous in the meteoro-
logical field for the mei-yu period, which often covers
mid-June to mid-July with substantial year-to-year
variations (e.g., Lau et al. 1988; Ding and Chan 2005;
Xu et al. 2009; Luo et al. 2013; Wang et al. 2018). A 30-
day simulation period, which contains several strong
convective activities, is selected for each region. A
control simulation (Run00) and five sensitivity simu-
lations (Run01–Run05) are conducted for each region,
as shown in Table 1. As discussed by Zhu et al. (2012),
there are nonnegligible differences in the values of
surface heat fluxes between different datasets, and the
difference can be as great as 2 times. Therefore, dou-
bled and halved surface heat fluxes are used in the
sensitive simulation. Considering that shallow clouds
can be triggered by strong surface heat fluxes, a finer
horizontal resolution is needed to capture these small-
scale clouds. Therefore, all simulations are conducted
in a domain of 600 km with a grid of 500m and a time
step of 5 s. The cloud responses to surface heating ef-
fects are investigated by shutting down the effects of
large-scale forcing in Run01, Run03, and Run05. The
comparison between the simulations with or without
large-scale forcing enabled the exploration of the cloud
responses to large-scale circulation patterns.
3. Results
Figure 2 shows the time series of the large-scale
forcing for temperature and moisture, the horizontal
wind field, and vertical velocity over three regions. A
strong upward motion generally indicates the convec-
tive activity, which can result in heavy rain during the
summer. The west wind prevails from 2 km above
ground level (AGL) with a strong jet concentrated at
the range of 4–12 km AGL over the TP. Compared to
the lowlands of East China, the upward motion is more
frequent but weaker. Consequently, the large-scale
forcing is concentrated below 6 km AGL with weak
intensity over the TP. Over the lowlands (Fig. 2a), the
strong large-scale forcing of temperature (.8Kday21)
and moisture (.6 g kg21 day21) can reach as high as
12 km AGL, which corresponds to the strong upward
motion (Fig. 2b).
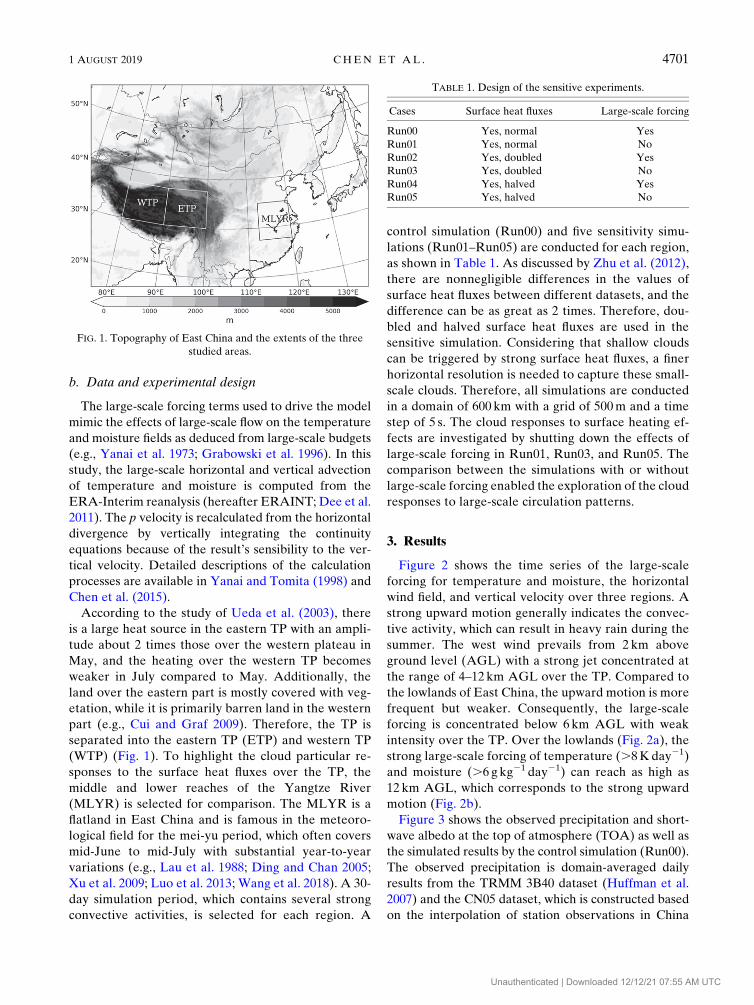
Figure 3 shows the observed precipitation and short-
wave albedo at the top of atmosphere (TOA) as well as
the simulated results by the control simulation (Run00).
The observed precipitation is domain-averaged daily
results from the TRMM 3B40 dataset (Huffman et al.
2007) and the CN05 dataset, which is constructed based
on the interpolation of station observations in China
FIG. 1. Topography of East China and the extents of the three
studied areas.
TABLE 1. Design of the sensitive experiments.
Cases Surface heat fluxes Large-scale forcing
Run00 Yes, normal Yes
Run01 Yes, normal No
Run02 Yes, doubled Yes
Run03 Yes, doubled No
Run04 Yes, halved Yes
Run05 Yes, halved No
1 AUGUST 2019 CHEN ET AL . 4701
Unauthenticated | Downloaded 12/12/21 07:55 AM UTC

(Wu and Gao 2013). The domain-averaged 3-h albedo is
calculated from the Clouds and the Earth’s Radiant
Energy System (CERES) dataset (Wielicki et al. 1996).
The TOA albedo can be affected by the cloud cover and
the vertically integrated cloud water (including cloud
water content and cloud ice content). Hydrometeors are
typically abundant in deep clouds, resulting in elevated
albedos. There were four heavy precipitation processes
on 8, 16, 20, and 23 July over the MLYR as demon-
strated by TRMM observations (Fig. 3a), which were
reproduced by the control run. These rainfall events
were responses to the strong large-scale forcing
(Figs. 2a,b). The albedo shows correspondingly dramatic
variations during these rainfall events (Fig. 3d), sug-
gesting that the rapidly increasing albedo was primarily
caused by deep convection over the MLYR. The results
are very similar to the previously 3-km resolution sim-
ulation with the same period for the same region (Chen
et al. 2017).
To assess the simulated results over the TP, a par-
ticular precipitation dataset for the TP is included for
comparison. This dataset merges the Ensemble Multi-
Satellite Precipitation Dataset using the Dynamic
Bayesian Model Averaging scheme (EMSPD-DBMA)
over the Tibetan Plateau (Y. Ma et al. 2018a,b). It is
noticed that the EMSPD-DBMA agrees with ground-
based observation (CN05) well over the ETP while
shows less agreement over the WTP (Figs. 3b,c). The
satellite may underestimate the little rainfall events,
which is more often over the WTP, is a possible reason
for this. Meanwhile, the rare ground stations can affect
the accuracy of the ground-based observed results
(CN05) over the WTP. As shown in Figs. 3b and 3c, the
model can simulate the major characteristics of the
rainfall evolution with wet biases and the CRM results
are closer to the ground-based observation (CN05).
Compared to the MLYR, there is less rainfall and
larger averaged albedo over the TP, suggesting the
appearance of shallow convections. Moreover, there is
no dramatic variation in albedo during the rainfall
period over the TP, implying that deep convection is
relatively weak in intensity and small in size (e.g., Luo
et al. 2011; Qie et al. 2014). Notably, the biases of
precipitation and albedo increase over the TP. A de-
crease in reliability of reanalysis (e.g., Bao and Zhang
2013; Chen et al. 2017) is a possible reason for the
FIG. 2. Time series of the large-scale forcing for (a),(c),(e) temperature (shaded, K day21) and moisture (contoured, g kg21 day21,
contour values at 212, 29, 26, 23, 3, 6, 9, 12 with negative values in dashed lines), and (b),(d),(f) the wind field (green contoured for
north–south and red contoured for east–west, m s21, contour values at218,212,26, 6, 12, 18 with negative values in dashed lines) and the
vertical velocity (shaded, hPa h21). (a),(b) The MLYR; (c),(d) the WTP; (e),(f) the ETP.
4702 JOURNAL OF CL IMATE VOLUME 32
Unauthenticated | Downloaded 12/12/21 07:55 AM UTC
exaggerated biases over the TP, particularly for the
WTP (e.g., rare ground stations can affect the perfor-
mance of the reanalysis dataset over the WTP). There
are even differences between the three observed da-
tasets over the WTP, suggesting that there are great
uncertainties in the retrieval datasets and simulation
over the WTP. As denoted by previous studies (e.g.,
Grabowski et al. 1996), the periodic boundary condi-
tion used in this model will cycle clouds in the model
domain, which may be a possible reason for the wet
biases. Additionally, the eastward phase propagation
of precipitation and cloudiness is found downstream of
the eastern TP (Wang et al. 2005; Yu et al. 2007; Zhou
et al. 2008; Xu and Zipser 2011). The propagation
process of precipitation and cloudiness may cause ad-
ditional wet biases over the TPwhen amodel employs a
periodic boundary condition.
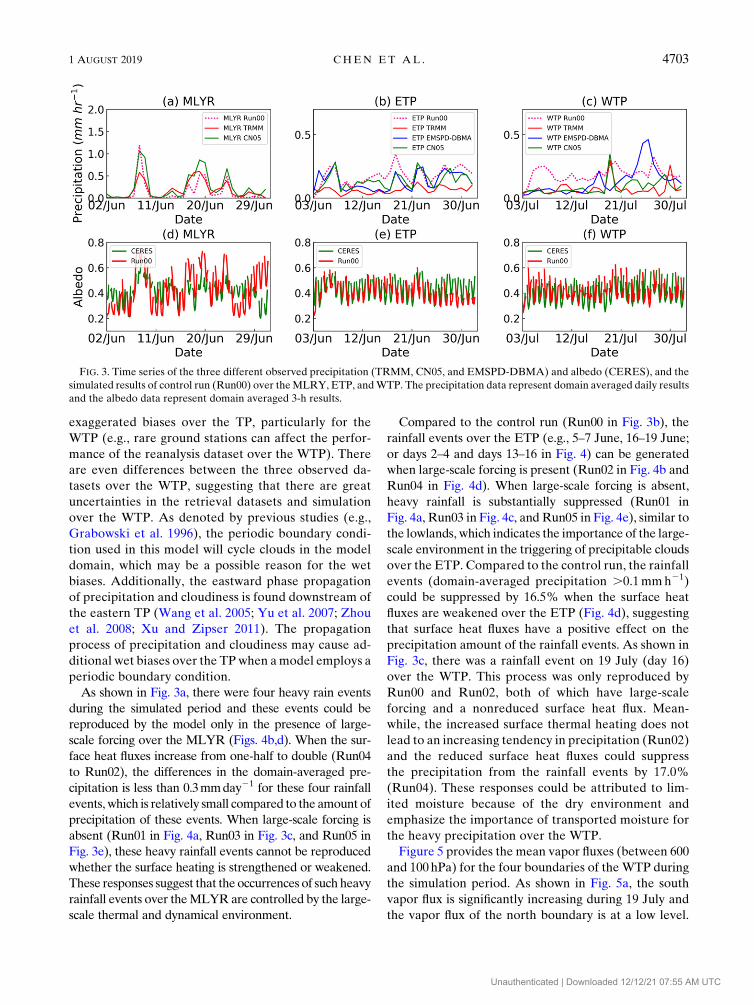
As shown in Fig. 3a, there were four heavy rain events
during the simulated period and these events could be
reproduced by the model only in the presence of large-
scale forcing over the MLYR (Figs. 4b,d). When the sur-
face heat fluxes increase from one-half to double (Run04
to Run02), the differences in the domain-averaged pre-
cipitation is less than 0.3mmday21 for these four rainfall
events, which is relatively small compared to the amount of
precipitation of these events. When large-scale forcing is
absent (Run01 in Fig. 4a, Run03 in Fig. 3c, and Run05 in
Fig. 3e), these heavy rainfall events cannot be reproduced
whether the surface heating is strengthened or weakened.
These responses suggest that the occurrences of such heavy
rainfall events over theMLYR are controlled by the large-
scale thermal and dynamical environment.
Compared to the control run (Run00 in Fig. 3b), the
rainfall events over the ETP (e.g., 5–7 June, 16–19 June;
or days 2–4 and days 13–16 in Fig. 4) can be generated
when large-scale forcing is present (Run02 in Fig. 4b and
Run04 in Fig. 4d). When large-scale forcing is absent,
heavy rainfall is substantially suppressed (Run01 in
Fig. 4a, Run03 in Fig. 4c, and Run05 in Fig. 4e), similar to
the lowlands, which indicates the importance of the large-
scale environment in the triggering of precipitable clouds
over the ETP. Compared to the control run, the rainfall
events (domain-averaged precipitation .0.1mmh21)
could be suppressed by 16.5% when the surface heat
fluxes are weakened over the ETP (Fig. 4d), suggesting
that surface heat fluxes have a positive effect on the
precipitation amount of the rainfall events. As shown in
Fig. 3c, there was a rainfall event on 19 July (day 16)
over the WTP. This process was only reproduced by
Run00 and Run02, both of which have large-scale
forcing and a nonreduced surface heat flux. Mean-
while, the increased surface thermal heating does not
lead to an increasing tendency in precipitation (Run02)
and the reduced surface heat fluxes could suppress
the precipitation from the rainfall events by 17.0%
(Run04). These responses could be attributed to lim-
ited moisture because of the dry environment and
emphasize the importance of transported moisture for
the heavy precipitation over the WTP.
Figure 5 provides the mean vapor fluxes (between 600
and 100hPa) for the four boundaries of the WTP during
the simulation period. As shown in Fig. 5a, the south
vapor flux is significantly increasing during 19 July and
the vapor flux of the north boundary is at a low level.
FIG. 3. Time series of the three different observed precipitation (TRMM, CN05, and EMSPD-DBMA) and albedo (CERES), and the
simulated results of control run (Run00) over theMLRY, ETP, andWTP. The precipitation data represent domain averaged daily results
and the albedo data represent domain averaged 3-h results.
1 AUGUST 2019 CHEN ET AL . 4703
Unauthenticated | Downloaded 12/12/21 07:55 AM UTC
Meanwhile, the vapor from the west side is increasing
while the east side is also at a high level because of the
prevailing westerly flow. The domain net vapor flux
shows a peak around 19 July (Fig. 5b), indicating the
importance of the transported vapor for this rainfall
event. The net vapor flux from south–north shows a
greater value than that of the east–west boundary during
this rainfall event (rainfall on 19 July) over the WTP. Xu
et al. (2003) has reported the water vapor transport at the
western boundary of the Tibetan Plateau and considered
this as an important player in the torrential rain in the
Yangtze River valley. Furthermore, heavy precipitation
can occur as a result of the large-scale forcing even if
surface heating is weakened (e.g., 28 July or day 25 of
Run04, Fig. 3c) over the WTP. This is mostly a result of
the moistened environment because of the vapor trans-
ported by large-scale circulation during this period
(Figs. 5a,b). Otherwise, strong surface thermal forcing
mostly triggers dry convection without the transported
moisture over the WTP.
To further investigate the moisture transport from the
south during heavy rainfall events in the WTP, the me-
ridional cross sections for zonal mean (808–908E) spe-
cific humidity and north–south wind component at the
FIG. 4. (a)–(e) Time series of precipitation differences between the sensitive experiments (Run01–05) and control Run00 experiments
for the MLYR, ETP, andWTP. The abscissas are the days since the simulation started. The left ordinate is for the MLYR and the right is
for the ETP and WTP.
FIG. 5. Mean vapor fluxes (600–100 hPa) for the four boundaries of WTP during the simu-
lation period. (a) The vapor fluxes for four boundaries of the WTP and (b) the net vapor fluxes
from south–north, west–east, and the entire domain.
4704 JOURNAL OF CL IMATE VOLUME 32
Unauthenticated | Downloaded 12/12/21 07:55 AM UTC
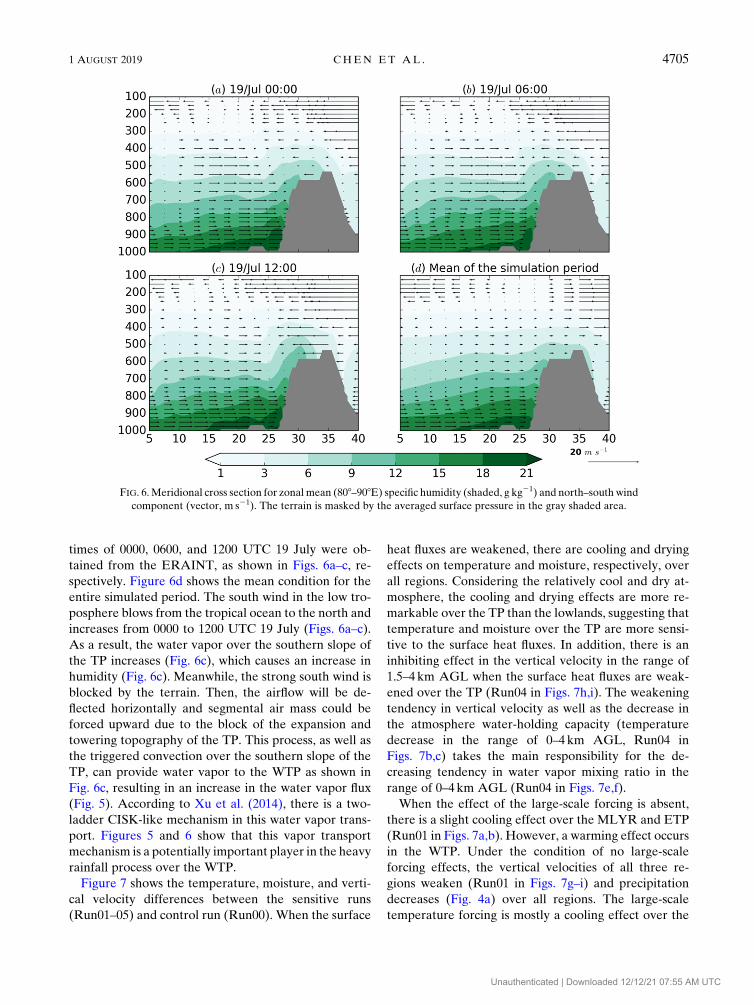
times of 0000, 0600, and 1200 UTC 19 July were ob-
tained from the ERAINT, as shown in Figs. 6a–c, re-
spectively. Figure 6d shows the mean condition for the
entire simulated period. The south wind in the low tro-
posphere blows from the tropical ocean to the north and
increases from 0000 to 1200 UTC 19 July (Figs. 6a–c).
As a result, the water vapor over the southern slope of
the TP increases (Fig. 6c), which causes an increase in
humidity (Fig. 6c). Meanwhile, the strong south wind is
blocked by the terrain. Then, the airflow will be de-
flected horizontally and segmental air mass could be
forced upward due to the block of the expansion and
towering topography of the TP. This process, as well as
the triggered convection over the southern slope of the
TP, can provide water vapor to the WTP as shown in
Fig. 6c, resulting in an increase in the water vapor flux
(Fig. 5). According to Xu et al. (2014), there is a two-
ladder CISK-like mechanism in this water vapor trans-
port. Figures 5 and 6 show that this vapor transport
mechanism is a potentially important player in the heavy
rainfall process over the WTP.
Figure 7 shows the temperature, moisture, and verti-
cal velocity differences between the sensitive runs
(Run01–05) and control run (Run00). When the surface
heat fluxes are weakened, there are cooling and drying
effects on temperature and moisture, respectively, over
all regions. Considering the relatively cool and dry at-
mosphere, the cooling and drying effects are more re-
markable over the TP than the lowlands, suggesting that
temperature and moisture over the TP are more sensi-
tive to the surface heat fluxes. In addition, there is an
inhibiting effect in the vertical velocity in the range of
1.5–4 km AGL when the surface heat fluxes are weak-
ened over the TP (Run04 in Figs. 7h,i). The weakening
tendency in vertical velocity as well as the decrease in
the atmosphere water-holding capacity (temperature
decrease in the range of 0–4km AGL, Run04 in
Figs. 7b,c) takes the main responsibility for the de-
creasing tendency in water vapor mixing ratio in the
range of 0–4 km AGL (Run04 in Figs. 7e,f).
When the effect of the large-scale forcing is absent,
there is a slight cooling effect over the MLYR and ETP
(Run01 in Figs. 7a,b). However, a warming effect occurs
in the WTP. Under the condition of no large-scale
forcing effects, the vertical velocities of all three re-
gions weaken (Run01 in Figs. 7g–i) and precipitation
decreases (Fig. 4a) over all regions. The large-scale
temperature forcing is mostly a cooling effect over the
FIG. 6.Meridional cross section for zonal mean (808–908E) specific humidity (shaded, g kg21) and north–south wind
component (vector, m s21). The terrain is masked by the averaged surface pressure in the gray shaded area.
1 AUGUST 2019 CHEN ET AL . 4705
Unauthenticated | Downloaded 12/12/21 07:55 AM UTC

FIG. 7. Difference between the sensitive run (Run01–05) and control run (Run00) in the vertical profiles for
temperature (T, K), water mixing ratio (qy, g kg21), and vertical velocity (w, m s21) over the MLYR, ETP,
and WTP.
4706 JOURNAL OF CL IMATE VOLUME 32
Unauthenticated | Downloaded 12/12/21 07:55 AM UTC

three regions (Figs. 2a–c). The large-scale cooling and
moistening can induce cloud and precipitation along
with releasing latent heat, which leads to a warming
effect and cancel out the large-scale cooling.Meanwhile,
more hydrometeor or precipitation makes a favorable
condition for the evaporation processes, which prefer to
induce a cooling tendency and enhance the cooling ef-
fects. The apparent effects are the total effects of the
both the direct large-scale cooling and the feedbacks,
which could be either cooling or warming. When large-
scale forcing is absent, there are cooling effects over the
MLYR and ETP. This implies that there is a total warm
effect when the large-scale forcing is present, which
means that the latent heating effect due to the devel-
opment of the cloud and precipitation is more important
than the cooling effect in these regions. Over theWTP, a
warm effect occurs in the absence of large-scale forcing,
implying a total cooling effect when the large-scale
forcing is present. This suggests that latent heating ef-
fect, which is a result of the hydrometeor generation in
the development of the cloud and precipitation, shows a
weak influence in normal condition over the WTP.
Another notable characteristic is that Run03 shows the
greatest warming effect (Fig. 7c) over the WTP while
Run02 shows the greatest warming effects over the
MLYR and ETP (Figs. 7a,b). This corresponds to the
strong heating effect because of the surface heat fluxes
over the WTP and agrees with the diagnostic results
(e.g., Chen et al. 2015).
Over the TP, there are remarkable diurnal variations
in various meteorological elements (including the sur-
face heat fluxes) (Yanai and Li 1994; R. Ma et al. 2018).
The strong surface thermal driving force cannot only
induce convective activities but also lead to deep plan-
etary boundary layer (PBL) over the TP (Chen et al.
2013). Meanwhile, the development of the PBL is
strongly related to the convective activities in the
boundary layer (Yang et al. 2004). Observational results
show that the convection over the TP can evolve from
dry shallow convection in the morning to wet deep
convection in the afternoon (Yang et al. 2004). Here, the
PBL is investigated by comparing the PBL height of
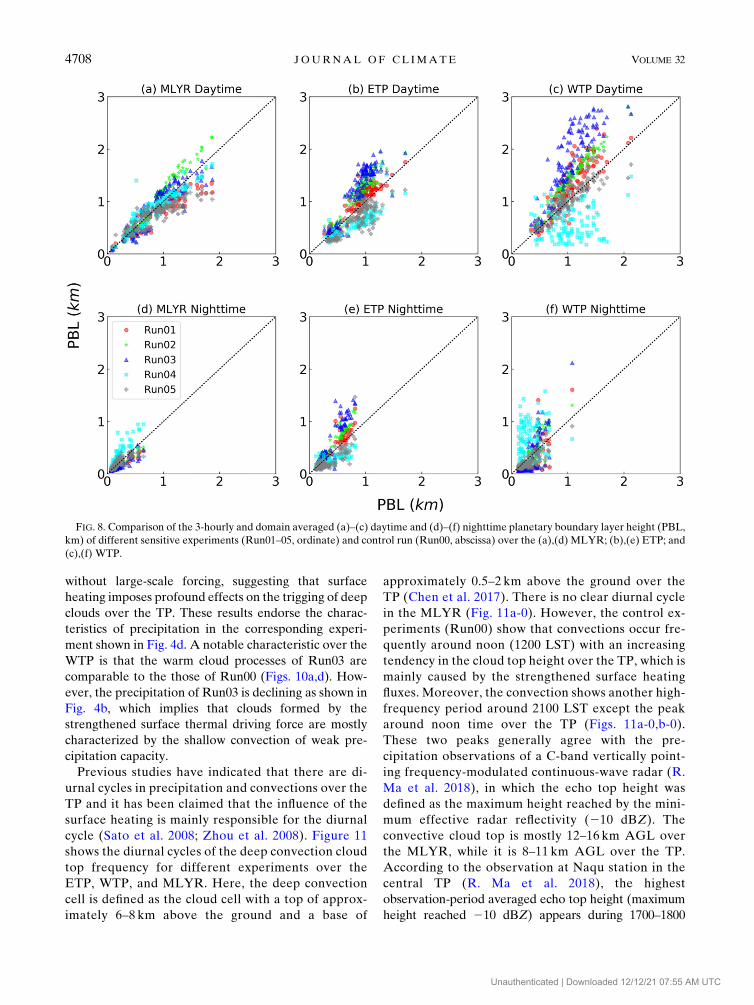
sensitive runs and the control run, as shown in Fig. 8.
Over the lowlands, the PBL is suppressed during both
the daytime and nighttime when large-scale forcing is
absent (Run01 and Run05 in Figs. 8a,d). The PBL cloud
develop deeper over the TP when the large-scale forcing
is absent (Run01 in Figs. 8b,c). Meanwhile, enhanced
surface heat fluxes (Run02) can promote the develop-
ment of the boundary layer (deeper than 1km) during
the daytime over the MLYR (Fig. 8a). Over the TP,
stronger surface heat fluxes can induce deeper PBL
(Run02 in Figs. 8b,c,e,f). This effect is significant during
the daytime (Run02 in Figs. 8b,c) and is more apparent
when the large-scale forcing is extremely weak (Run01
and Run03 in Figs. 8b,c) over the TP. When large-scale
forcing is present and the surface heat fluxes are weak-
ened (Run04), these three regions show different re-
sponses. There is no significant change in the daytime
PBL height over the MLYR while the daytime PBL is
suppressed over the TP (Run04 in Figs. 8b,c), by asmuch
as;50%. Compared to the control run, similar daytime
PBL heights are simulated by sensitive experiments over
the MLYR (Run04 in Fig. 8a). The weakened surface
heat fluxes show a total inhibiting effect on the PBL over
the ETP (Run04 in Figs. 8b,e). However, there are a
inhibiting effect during the daytime and a accelerative
effect during the nighttime over the WTP (Run04 in
Figs. 8c,f). Usually, the PBL reaches its maximum height
during the daytime and its minimum height during the
nighttime. There is a strong diurnal cycle in the surface
heat flux with strong surface heat fluxes around noon-
time and negative sensible heat fluxes during the night
over the WTP. These characteristics of the surface heat
fluxes over the TP have been reported by previous
studies (e.g., Ma et al. 2005). The negative sensible heat
flux will impose a cooling effect on the atmosphere and
restrains the development of the PBL. Halved surface
heat fluxes will weaken the cooling effect and inhibiting
effect for the PBL development due to the negative
sensible heat flux in the night over the WTP. This is one
of the possible reasons for deeper nighttime PBL of Run
04 (Fig. 8f). Meanwhile, this may weaken the suppres-
sion effects of the negative surface heat fluxes for the
cloud development and may result in an increasing
tendency in precipitation over the WTP (days 6, 23, and
25 in Fig. 4d).
Figures 9 and 10 show the heating profiles due to the
condensation, evaporation, deposition and freezing,
sublimation, and fusion of all cloud systems for different
experiments over the ETP and WTP, respectively. The
absence of the large-scale forcing causes the weakening
of the phase transition in the cloud (Run01 in Figs. 9b
and 10b). When the large-scale forcing is absent, the
phase transition and its maximum altitude show a posi-
tive relationship with the strength of the surface heat
fluxes (Run01 and Run03 in Figs. 9c and 10c). As shown
in Figs. 9d and 10d, intensive surface heating can pro-
mote the development of warm cloud processes because
of the heating and upward-motion due to increased en-
ergy. The weakened surface heat fluxes cause an in-
hibitory effect on the development of cloud over the TP
regardless of whether large-scale forcing is present
(Figs. 9e,f and 10e,f). Furthermore, the weakened sur-
face heat fluxes cause a more dramatic contraction in
cloud phase change processes compared to a situation
1 AUGUST 2019 CHEN ET AL . 4707
Unauthenticated | Downloaded 12/12/21 07:55 AM UTC
without large-scale forcing, suggesting that surface
heating imposes profound effects on the trigging of deep
clouds over the TP. These results endorse the charac-
teristics of precipitation in the corresponding experi-
ment shown in Fig. 4d. A notable characteristic over the
WTP is that the warm cloud processes of Run03 are
comparable to the those of Run00 (Figs. 10a,d). How-
ever, the precipitation of Run03 is declining as shown in
Fig. 4b, which implies that clouds formed by the
strengthened surface thermal driving force are mostly
characterized by the shallow convection of weak pre-
cipitation capacity.
Previous studies have indicated that there are di-
urnal cycles in precipitation and convections over the
TP and it has been claimed that the influence of the
surface heating is mainly responsible for the diurnal
cycle (Sato et al. 2008; Zhou et al. 2008). Figure 11
shows the diurnal cycles of the deep convection cloud
top frequency for different experiments over the
ETP, WTP, and MLYR. Here, the deep convection
cell is defined as the cloud cell with a top of approx-
imately 6–8 km above the ground and a base of
approximately 0.5–2 km above the ground over the
TP (Chen et al. 2017). There is no clear diurnal cycle
in the MLYR (Fig. 11a-0). However, the control ex-
periments (Run00) show that convections occur fre-
quently around noon (1200 LST) with an increasing
tendency in the cloud top height over the TP, which is
mainly caused by the strengthened surface heating
fluxes. Moreover, the convection shows another high-
frequency period around 2100 LST except the peak
around noon time over the TP (Figs. 11a-0,b-0).
These two peaks generally agree with the pre-
cipitation observations of a C-band vertically point-
ing frequency-modulated continuous-wave radar (R.
Ma et al. 2018), in which the echo top height was
defined as the maximum height reached by the mini-
mum effective radar reflectivity (210 dBZ). The
convective cloud top is mostly 12–16 km AGL over
the MLYR, while it is 8–11 km AGL over the TP.
According to the observation at Naqu station in the
central TP (R. Ma et al. 2018), the highest
observation-period averaged echo top height (maximum
height reached 210 dBZ) appears during 1700–1800
FIG. 8. Comparison of the 3-hourly and domain averaged (a)–(c) daytime and (d)–(f) nighttime planetary boundary layer height (PBL,
km) of different sensitive experiments (Run01–05, ordinate) and control run (Run00, abscissa) over the (a),(d) MLYR; (b),(e) ETP; and
(c),(f) WTP.
4708 JOURNAL OF CL IMATE VOLUME 32
Unauthenticated | Downloaded 12/12/21 07:55 AM UTC
LST with a median value of 8.25km AGL and the large
reflectivity (35–40 dBZ) in during a precipitation event
can extend up to 11km AGL. The simulation results
agree these observations in the cloud height with differ-
ence in the peak time, which may be caused by the defi-
nition of the cloud top and the statistical samples of cloud
types.Adeeper troposphere and affluentmoisture lead to
more development space and motive force for the con-
vections over the MLYR. Over the MLYR, the diurnal
cycle of deep convection becomes clear and shows a
peak around noon (1200 LST in Figs. 11a-1,a-3,a-5)
when the influence of large-scale forcing is absent or
the surface heat fluxes are enhanced. However,
there is no conspicuous diurnal cycle in the deep
convection in the control run (Run00 in Fig. 11a-0),
implying that large-scale forcing actually dominates
the diurnal characteristics of the convections over
the MLYR.
FIG. 9. Domain and time (30 day) averaged profiles for the heating effects due to the condensation (Cond, red solid), evaporation (Evap,
black dotted), deposition and freezing (Dep1Frez, green solid), sublimation (Sub, blue dash), and fusion (Fus,magenta solid) of different
experiments over the ETP. (a)–(f) Run00–Run05, respectively.
1 AUGUST 2019 CHEN ET AL . 4709
Unauthenticated | Downloaded 12/12/21 07:55 AM UTC

Without the influence of large-scale forcing, con-
vection is concentrated during the day, and the con-
vective cloud top height shows an increasing tendency
along with the strengthening of the solar radiation
over the TP (Figs. 11b-1,b-3,b-5,c-1,c-3,c-5). The in-
tensive surface heating force significantly increases the
height of the convection (Run01, Run03, and Run05 in
Fig. 11) over the TP. However, the total precipitation
amounts of these experiments (Run01, Run03, and
Run05 in Fig. 4) are similar in the WTP, which suggest
that the intensive surface heating does not lead to an
increasing tendency in rainfall although the deep
convection can develop to a higher level. This is mainly
because of the limited moisture condition over the
WTP. Figures 11b-0 and 11c-0 show that there is an-
other convective peak around 2100–2400 LST over the
TP. It is found that this peak disappears when the ef-
fects of large-scale circulation are absent (Figs. 11b-
1,b-3,b-5,c-1,c-3,c-5), implying that convective clouds
during this period are possibly controlled by other
FIG. 10. As in Fig. 9, but for the WTP.
4710 JOURNAL OF CL IMATE VOLUME 32
Unauthenticated | Downloaded 12/12/21 07:55 AM UTC
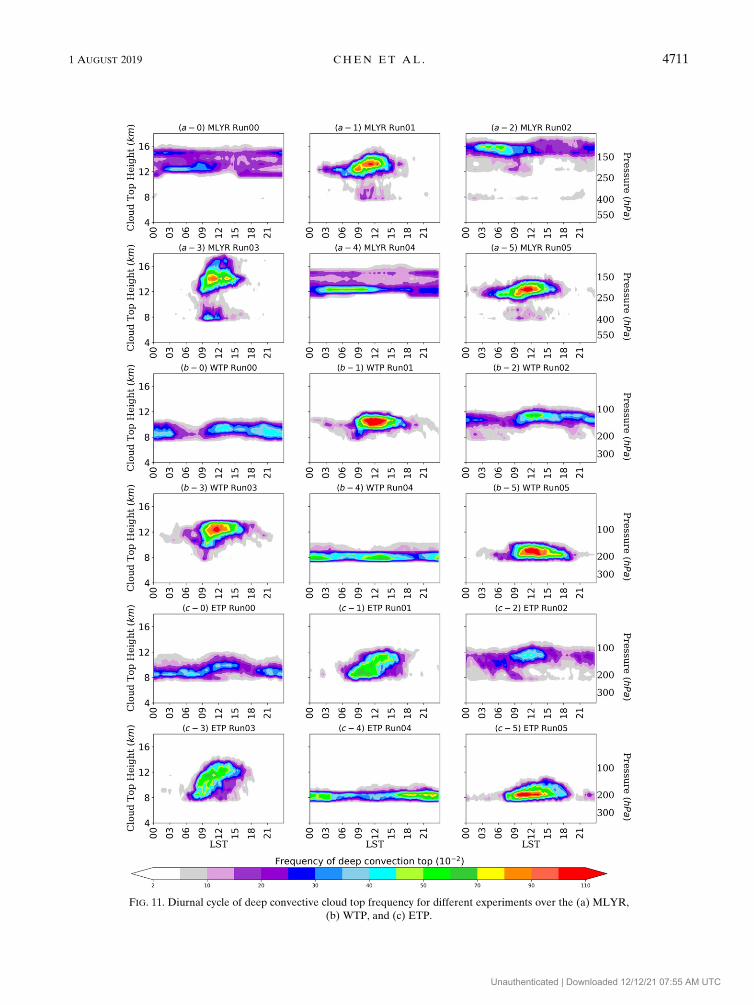
FIG. 11. Diurnal cycle of deep convective cloud top frequency for different experiments over the (a) MLYR,
(b) WTP, and (c) ETP.
1 AUGUST 2019 CHEN ET AL . 4711
Unauthenticated | Downloaded 12/12/21 07:55 AM UTC
factors, for example, large-scale circulation patterns
and the local circulation (e.g., Fujinami et al. 2005).
4. Conclusions and discussion
The effects of surface heat flux on the development of
clouds and precipitation over the TP are discussed via a
series of sensitive numerical experiments using the
cloud-resolving model. The role of surface heat fluxes in
the development of deep convection is investigated and
compared to the influences of the large-scale circulation.
The highlighted conclusions are as follows.
Large-scale synoptic patterns are mainly re-
sponsible for the heavy convective rainfall over East
China (e.g., the middle and lower reaches of the
Yangtze River) while other factors (e.g., surface heat
fluxes) have influence on the triggering of heavy
rainfall. However, both large-scale circulation and
surface heat flux are the necessary criteria for heavy
rainfall over the TP. Intensive surface heating will
result in the shallow convective cloud over the TP.
However, these clouds are weak in terms of pre-
cipitation capacity because of the dry environment.
Precipitation could be suppressed by more than 16%
when the surface heat fluxes are halved over the TP.
The heavy rainfall events over the WTP show a
greater dependence on horizontal advection of mois-
ture from outside than over the ETP.
Strong surface thermal forcing has positive effects on
the development of PBL and convection over the TP,
and it will affect the activeness of the in-cloud micro-
physical processes and elevates the peak altitude of the
warm phase transition processes (e.g., condensation
and evaporation). The enhanced surface heat flux can
induce a deeper PBL and be benefit to trigger con-
vection, but make little contribution to the pre-
cipitation due to the dry environment over the TP.
Both the warm and ice cloud microphysical processes
(e.g., condensation, sublimation, and deposition) are
dramatically restricted when surface heat fluxes are
weakened by a half. A diurnal convective cloud top is
discovered over the TP. The convection reaches its
most energetic period around noon over the TP, which
is mainly caused by the diurnal variation in the surface
heat fluxes. A convection peak around noon still ap-
pears under the condition of weekend surface heat
fluxes over the WTP, while this peak diminishes over
the ETP under a similar situation.
The relationship between the surface thermal
forcing, cloud and precipitation processes is a com-
plex interactive process with feedback and read-
justment to another. In this study, surface heat fluxes
are obtained from the ERA-Interim reanalysis and
were prescribed and changed simultaneously in the
model, which does not consider the interactions be-
tween the change in surface heat fluxes and clouds.
This could be investigated by coupling a land surface
model to the simulating system. Additionally, in-
cluding ground-based observations of the surface
heat flux would help evaluate the model performance
over the TP.
Acknowledgments. This study was supported by the
NationalKeyR&DProgramofChina (2017YFA0604000),
the National Natural Science Foundation of China
(41705118, 41775136, 41775096, 41875071, 41705120), the
Natural Science Fund for Colleges and Universities in
Jiangsu Province (17KJB170010), the Natural Science
Foundation of Jiangsu Province (BK20170945), the Startup
Foundation for Introducing Talent of NUIST (2016r041),
China Scholarship Council, and Open fund by the Key
Laboratory for Aerosol-Cloud-Precipitation of CMA-
NUIST (KDW1602).
REFERENCES
Anber, U., S. Wang, and A. Sobel, 2015: Effect of surface fluxes
versus radiative heating on tropical deep convection. J. Atmos.
Sci., 72, 3378–3388, https://doi.org/10.1175/JAS-D-14-0253.1.
Bao, X., and F. Zhang, 2013: Evaluation of NCEP–CFSR, NCEP–
NCAR, ERA-Interim, and ERA-40 reanalysis datasets
against independent sounding observations over the Tibetan
Plateau. J. Climate, 26, 206–214, https://doi.org/10.1175/JCLI-
D-12-00056.1.
——, ——, and J. Sun, 2011: Diurnal variations of warm-season
precipitation east of the Tibetan Plateau over China. Mon.
Wea. Rev., 139, 2790–2810, https://doi.org/10.1175/MWR-D-
11-00006.1.
Chen, J., X. Wu, Y. Yin, and H. Xiao, 2015: Characteristics of heat
sources and clouds over easternChina and theTibetan Plateau
in boreal summer. J. Climate, 28, 7279–7296, https://doi.org/
10.1175/JCLI-D-14-00859.1.
——, ——, ——, Q. Huang, and H. Xiao, 2017: Characteristics of
cloud systems over the Tibetan Plateau and east China during
boreal summer. J. Climate, 30, 3117–3137, https://doi.org/
10.1175/JCLI-D-16-0169.1.
Chen, X., J. A. Añel, Z. Su, L. de la Torre, H. Kelder, J. van Peet,
andY.Ma, 2013: The deep atmospheric boundary layer and its
significance to the stratosphere and troposphere exchange
over the Tibetan Plateau. PLOS ONE, 8, e56909, https://
doi.org/10.1371/journal.pone.0056909.
Clark, T.,W.Hall, and J.Coen, 1996: Source code documentation for
the Clark-Hall Cloud-Scale Model Code Version G3CH01.
NCAR Tech. Note NCAR/TN-4261STR, 137 pp., https://
doi.org/10.5065/D67W694V.
Cui, X., and H.-F. Graf, 2009: Recent land cover changes on the
Tibetan Plateau: A review.Climatic Change, 94, 47–61, https://
doi.org/10.1007/s10584-009-9556-8.
Dee, D. P., and Coauthors, 2011: The ERA-Interim reanalysis:
Configuration and performance of the data assimilation sys-
tem.Quart. J. Roy. Meteor. Soc., 137, 553–597, https://doi.org/
10.1002/qj.828.
4712 JOURNAL OF CL IMATE VOLUME 32
Unauthenticated | Downloaded 12/12/21 07:55 AM UTC
Ding, Y., and J. C. L. Chan, 2005: The East Asian summer mon-
soon: An overview.Meteor. Atmos. Phys., 89, 117–142, https://
doi.org/10.1007/s00703-005-0125-z.
Draper, C. S., R. H. Reichle, andR.D. Koster, 2018: Assessment of
MERRA-2 land surface energy flux estimates. J. Climate, 31,
671–691, https://doi.org/10.1175/JCLI-D-17-0121.1.
Duan, A. M., and G. X. Wu, 2005: Role of the Tibetan Plateau
thermal forcing in the summer climate patterns over sub-
tropical Asia. Climate Dyn., 24, 793–807, https://doi.org/
10.1007/s00382-004-0488-8.
——, and Z. Xiao, 2015: Does the climate warming hiatus exist over the
Tibetan Plateau? Sci. Rep., 5, 13711, https://doi.org/10.1038/srep13711.Ek, M. B., andA.A.M. Holtslag, 2004: Influence of soil moisture on
boundary layer cloud development. J. Hydrometeor., 5, 86–99,
https://doi.org/10.1175/1525-7541(2004)005,0086:IOSMOB.2.0.
CO;2.
Fujinami, H., S. Nomura, and T. Yasunari, 2005: Characteristics of
diurnal variations in convection and precipitation over the
southern Tibetan Plateau during summer. SOLA, 1, 49–52,
https://doi.org/10.2151/sola.2005-014.
Gentine, P., A. A. M. Holtslag, F. D’Andrea, and M. Ek, 2013:
Surface and atmospheric controls on the onset of moist con-
vection over land. J. Hydrometeor., 14, 1443–1462, https://
doi.org/10.1175/JHM-D-12-0137.1.
Grabowski, W. W., X. Wu, and M. W. Moncrieff, 1996: Cloud-
resolving modeling of tropical cloud systems during phase III
of GATE. Part I: Two-dimensional experiments. J. Atmos.
Sci., 53, 3684–3709, https://doi.org/10.1175/1520-0469(1996)
053,3684:CRMOTC.2.0.CO;2.
Hsu, H.-H., T. Zhou, and J. Matsumoto, 2014: East Asian, Indo-
china and Western North Pacific Summer Monsoon - An up-
date. Asia-Pac. J. Atmos. Sci., 50, 45–68, https://doi.org/
10.1007/s13143-014-0027-4.
Hu, L., S. Yang, Y. Li, and S. Gao, 2010: Diurnal variability of
precipitation depth over the Tibetan Plateau and its sur-
rounding regions. Adv. Atmos. Sci., 27, 115–122, https://
doi.org/10.1007/s00376-009-8193-5.
Huffman, G. J., D. T. Bolvin, E. J. Nelkin, D. B.Wolff, R. F. Adler,
G. Gu, Y. Hong, K. P. Bowman, and E. F. Stocker, 2007: The
TRMMMultisatellite Precipitation Analysis (TMPA): Quasi-
global, multiyear, combined-sensor precipitation estimates at
fine scales. J. Hydrometeor., 8, 38–55, https://doi.org/10.1175/
JHM560.1.
Jabouille, P., J. L. Redelsperger, and J. P. Lafore, 1996: Modification
of surface fluxes by atmospheric convection in the TOGA
COARE region. Mon. Wea. Rev., 124, 816–837, https://doi.org/
10.1175/1520-0493(1996)124,0816:MOSFBA.2.0.CO;2.
Jiang, X., Y. Li, S. Yang, K. Yang, and J. Chen, 2016: Interannual
variation of summer atmospheric heat source over the Tibetan
Plateau and the role of convection around the western Mari-
time Continent. J. Climate, 29, 121–138, https://doi.org/10.1175/
JCLI-D-15-0181.1.
Kessler, E., Ed., 1969:On the Distribution and Continuity of Water
Substance in Atmospheric Circulation. Meteor. Monogr., No.
32, Amer. Meteor. Soc., 84 pp.
Koenig, L. R., and F. W. Murray, 1976: Ice-bearing cumulus cloud
evolution: Numerical simulation and general comparison
against observations. J. Appl. Meteor., 15, 747–762, https://
doi.org/10.1175/1520-0450(1976)015,0747:IBCCEN.2.0.CO;2.
Lau, K., G. J. Yang, and S. H. Shen, 1988: Seasonal and intra-
seasonal climatology of summer monsoon rainfall over East
Asia. Mon. Wea. Rev., 116, 18–37, https://doi.org/10.1175/
1520-0493(1988)116,0018:SAICOS.2.0.CO;2.
Li, X., Y. Luo, and Z. Guan, 2014: The persistent heavy rainfall
over southern China in June 2010: Evolution of synoptic
systems and the effects of the Tibetan Plateau heating.
J. Meteor. Res, 28, 540–560, https://doi.org/10.1007/s13351-
014-3284-3.
Liang, S., K. Wang, X. Zhang, and M. Wild, 2010: Review on es-
timation of land surface radiation and energy budgets from
ground measurement, remote sensing and model simulations.
IEEE J. Sel. Top. Appl. Earth Obs. Remote Sens., 3, 225–240,
https://doi.org/10.1109/JSTARS.2010.2048556.
Liu, W. T., K. B. Katsaros, and J. A. Businger, 1979: Bulk param-
eterization of air-sea exchanges of heat and water vapor in-
cluding the molecular constraints at the interface. J. Atmos.
Sci., 36, 1722–1735, https://doi.org/10.1175/1520-0469(1979)
036,1722:BPOASE.2.0.CO;2.
Luo, H., and M. Yanai, 1984: The large-scale circulation and heat
sources over the Tibetan Plateau and surrounding areas dur-
ing the early summer of 1979. Part II: Heat and moisture
budgets. Mon. Wea. Rev., 112, 966–989, https://doi.org/
10.1175/1520-0493(1984)112,0966:TLSCAH.2.0.CO;2.
Luo, Y., R. Zhang, W. Qian, Z. Luo, and X. Hu, 2011: In-
tercomparison of deep convection over the Tibetan Plateau–
Asian monsoon region and subtropical North America in
boreal summer using CloudSat/CALIPSO data. J. Climate, 24,
2164–2177, https://doi.org/10.1175/2010JCLI4032.1.
——, H. Wang, R. Zhang, W. Qian, and Z. Luo, 2013: Comparison
of rainfall characteristics and convective properties of mon-
soon precipitation systems over south China and the Yangtze
and Huai River basin. J. Climate, 26, 110–132, https://doi.org/
10.1175/JCLI-D-12-00100.1.
Ma, R., Y. Luo, and H. Wang, 2018: Classification and diurnal
variations of precipitation echoes observed by a C-band
vertically-pointing radar in central Tibetan Plateau during
TIPEX-III 2014-IOP. J. Meteor. Res, 32, 985–1001, https://
doi.org/10.1007/s13351-018-8084-8.
Ma, Y., and Coauthors, 2005: Diurnal and inter-monthly variation
of land surface heat fluxes over the central Tibetan Plateau
area. Theor. Appl. Climatol., 80, 259–273, https://doi.org/
10.1007/s00704-004-0104-1.
——, and Coauthors, 2018a: Performance of optimally merged
multisatellite precipitation products using the dynamic
Bayesianmodel averaging scheme over the Tibetan Plateau. J.
Geophys. Res. Atmos., 123, 814–834, https://doi.org/10.1002/
2017JD026648.
——, Y. Yang, Z. Han, G. Tang, L. Maguire, Z. Chu, and Y. Hong,
2018b: Comprehensive evaluation of EnsembleMulti-Satellite
Precipitation Dataset using the Dynamic Bayesian Model
Averaging scheme over the Tibetan Plateau. J. Hydrol., 556,
634–644, https://doi.org/10.1016/j.jhydrol.2017.11.050.
Niu, G., and Coauthors, 2011: The community Noah land surface
model with multiparameterization options (Noah-MP): 1.
Model description and evaluation with local-scale measure-
ments. J. Geophys. Res., 116, D12109, https://doi.org/10.1029/
2010JD015139.
Pan, C., B. Zhu, J. Gao, H. Kang, and T. Zhu, 2019: Quantitative
identification of moisture sources over the Tibetan Plateau
and the relationship between thermal forcing and moisture
transport. Climate Dyn., 52, 181–196, https://doi.org/10.1007/
s00382-018-4130-6.
Qie, X., X. Wu, T. Yuan, J. Bian, and D. Lu, 2014: Comprehensive
pattern of deep convective systems over the Tibetan Plateau–
SouthAsianmonsoon region based onTRMMData. J.Climate,
27, 6612–6626, https://doi.org/10.1175/JCLI-D-14-00076.1.
1 AUGUST 2019 CHEN ET AL . 4713
Unauthenticated | Downloaded 12/12/21 07:55 AM UTC
Sato, T., T. Yoshikane, M. Satoh, H. Miura, and H. Fujinami, 2008:
Resolution dependency of the diurnal cycle of convective
clouds over the Tibetan Plateau in a mesoscale model.
J. Meteor. Soc. Japan, 86A, 17–31, https://doi.org/10.2151/
jmsj.86A.17.
Ueda, H., H. Kamahori, and N. Yamazaki, 2003: Seasonal con-
trasting features of heat and moisture budgets between
the eastern and western Tibetan Plateau during the GAME
IOP. J. Climate, 16, 2309–2324, https://doi.org/10.1175/
2757.1.
Wang, C. C., G. T. J. Chen, and R. E. Carbone, 2005: Variability of
warm season cloud episodes over East Asia based on GMS
infrared brightness temperature observations. Mon. Wea.
Rev., 133, 1478–1500, https://doi.org/10.1175/MWR2928.1.
Wang, K., and S. Liang, 2008: An improved method for estimating
global evapotranspiration based on satellite determination of
surface net radiation, vegetation index, temperature, and soil
moisture. J. Hydrometeor., 9, 712–727, https://doi.org/10.1175/
2007JHM911.1.
Wang, Y., L. Zhang, J. Peng, and J. Guan, 2018: Mesoscale gravity
waves in the mei-yu front system. J. Atmos. Sci., 75, 587–609,
https://doi.org/10.1175/JAS-D-17-0012.1.
Wielicki, B. A., B. R. Barkstrom, E. F. Harrison, R. B. Lee, G. L.
Smith, and J. E. Cooper, 1996: Clouds and the Earth’s Radiant
Energy System (CERES): An Earth observing system exper-
iment. Bull. Amer. Meteor. Soc., 77, 853–868, https://doi.org/10.1175/1520-0477(1996)077,0853:CATERE.2.0.CO;2.
Wu, C.-M., B. Stevens, and A. Arakawa, 2009: What controls the
transition from shallow to deep convection? J. Atmos. Sci., 66,
1793–1806, https://doi.org/10.1175/2008JAS2945.1.
Wu, G., and Coauthors, 2007: The influence of mechanical
and thermal forcing by the Tibetan Plateau on Asian cli-
mate. J. Hydrometeor., 8, 770–789, https://doi.org/10.1175/
JHM609.1.
——, Y. Liu, B. He, Q. Bao, A. Duan, and F.-F. Jin, 2012: Thermal
controls on the Asian summer monsoon. Sci. Rep., 2, 1–7,
https://doi.org/10.1038/srep00404.
——, and Coauthors, 2015: Tibetan Plateau climate dynamics:
Recent research progress and outlook. Natl. Sci. Rev., 2, 100–
116, https://doi.org/10.1093/nsr/nwu045.
Wu, J., and X. J. Gao, 2013: A gridded daily observation dataset
over China region and comparison with the other datasets (in
Chinese with English abstract). Chin. J. Geophys., 56 (4),
1102–1111.
Wu,X., and S.Guimond, 2006: Two- and Three-dimensional cloud-
resolving model simulations of the mesoscale enhancement of
surface heat fluxes by precipitating deep convection.
J. Climate, 19, 139–149, https://doi.org/10.1175/JCL3610.1.
——, W. W. Grabowski, and M. W. Moncrieff, 1998: Long-term be-
havior of cloud systems inTOGACOAREand their interactions
with radiative and surface processes. Part I: Two-dimensional
modeling study. J. Atmos. Sci., 55, 2693–2714, https://doi.org/10.1175/1520-0469(1998)055,2693:LTBOCS.2.0.CO;2.
——, W. D. Hall, W. W. Grabowski, M. W. Moncrieff, W. D.
Collins, and J. T. Kiehl, 1999: Long-term behavior of cloud
systems in TOGA COARE and their interactions with radi-
ative and surface processes. Part II: Effects of Icemicrophysics
on cloud–radiation interaction. J. Atmos. Sci., 56, 3177–3195,
https://doi.org/10.1175/1520-0469(1999)056,3177:LTBOCS.2.0.
CO;2.
——, X. Z. Liang, and S. Park, 2007: Cloud-resolving model sim-
ulations over the ARMSGP.Mon. Wea. Rev., 135, 2841–2853,https://doi.org/10.1175/MWR3438.1.
Xu, W., and E. J. Zipser, 2011: Diurnal variations of precipitation,
deep convection, and lightning over and east of the eastern
Tibetan Plateau. J. Climate, 24, 448–465, https://doi.org/
10.1175/2010JCLI3719.1.
——, ——, and C. Liu, 2009: Rainfall characteristics and convec-
tive properties of Mei-Yu precipitation systems over south
China, Taiwan, and the South China Sea. Part I: TRMM
Observations.Mon.Wea. Rev., 137, 4261–4275, https://doi.org/
10.1175/2009MWR2982.1.
Xu, X., Q. Miao, J. Wang, and X. Zhang, 2003: The water vapor
transport model at the regional boundary during the Meiyu
period. Adv. Atmos. Sci., 20, 333–342, https://doi.org/10.1007/
BF02690791.
——, T. Zhao, C. Lu, Y. Guo, B. Chen, R. Liu, Y. Li, and X. Shi,
2014: An important mechanism sustaining the atmospheric
‘‘water tower’’ over the Tibetan Plateau. Atmos. Chem.
Phys., 14, 18 255–18 275, https://doi.org/10.5194/acpd-14-18255-
2014.
Yanai, M., and C. Li, 1994: Mechanism of heating and the
boundary layer over the Tibetan Plateau. Mon. Wea. Rev.,
122, 305–323, https://doi.org/10.1175/1520-0493(1994)122,0305:
MOHATB.2.0.CO;2.
——, and T. Tomita, 1998: Seasonal and interannual variability
of atmospheric heat sources and moisture sinks as de-
termined from NCEP–NCAR reanalysis. J. Climate, 11,463–482, https://doi.org/10.1175/1520-0442(1998)011,0463:
SAIVOA.2.0.CO;2.
——, S. Esbensen, and J.-H. Chu, 1973: Determination of bulk
properties of tropical cloud clusters from large-scale heat and
moisture budgets. J. Atmos. Sci., 30, 611–627, https://doi.org/
10.1175/1520-0469(1973)030,0611:DOBPOT.2.0.CO;2.
Yang, K., T. Koike, H. Fujii, T. Tamura, X. Xu, L. Bian, and
M. Zhou, 2004: The daytime evolution of the atmospheric
boundary layer and convection over the Tibetan Plateau: ob-
servations and simulations. J. Meteor. Soc. Japan, 82, 1777–
1792, https://doi.org/10.2151/jmsj.82.1777.
Yu, R., T. Zhou, A. Xiong, Y. Zhu, and J. Li, 2007: Diurnal
variations of summer precipitation over contiguous China.
Geophys. Res. Lett., 34, L01704, https://doi.org/10.1029/
2006gl028129.
Zhou, D., R. Eigenmann, W. Babel, T. Foken, and Y. Ma, 2011:
The study of near-ground free convection conditions at Nam
Co station on the Tibetan Plateau.Theor. Appl. Climatol., 105,
217–228, https://doi.org/10.1007/s00704-010-0393-5.
Zhou, T., R. Yu, H. Chen, A. Dai, and Y. Pan, 2008: Summer
precipitation frequency, intensity, and diurnal cycle over
China: A comparison of satellite data with rain gauge obser-
vations. J. Climate, 21, 3997–4010, https://doi.org/10.1175/
2008JCLI2028.1.
Zhu, X. Y., Y. M. Liu, and G. X. Wu, 2012: An assessment of
summer sensible heat flux on the Tibetan Plateau from eight
data sets. Sci. China Earth Sci., 55, 779–786, https://doi.org/
10.1007/s11430-012-4379-2.
4714 JOURNAL OF CL IMATE VOLUME 32
Unauthenticated | Downloaded 12/12/21 07:55 AM UTC


![AME 60634 Int. Heat Trans. D. B. Go 1 Heat Transfer Rates heat flux [W/m 2 ] thermal conductivity [W/m-K] temperature gradient [K/m] heat flux [W/m 2 ]](https://img.pdfslide.net/doc/110x75/56649db55503460f94aa7133/ame-60634-int-heat-trans-d-b-go-1-heat-transfer-rates-heat-flux-wm-2.jpg)