Embed Size (px)
Citation preview

University of Massachusetts Amherst
From the SelectedWorks of Ajla Aksamija
2018
Thermal, Energy and Daylight Analysis ofDifferent Types of Double Skin Façades inVarious ClimatesDr. Ajla Aksamija, University of Mass
Available at: https://works.bepress.com/ajla_aksamija/146/

1 JOURNAL OF FACADE DESIGN & ENGINEERING VOLUME 6 / NUMBER 1 / 2018
Thermal, energy and daylight analysis of different types of double skin façades in various climates
Ajla Aksamija
Department of Architecture, University of Massachusetts, Amherst
AbstractThis article explores the thermal, energy, and daylighting performance of double skin façades (DSFs) in different climate types, specifically focusing on three typologies: box window, corridor, and multi-storey DSFs. These systems were investigated and analysed to determine how different DSFs perform in comparison to each other, as well as a typical curtain wall (single skin glazed façade used as a baseline), in a multitude of climate applications. The utilised research methods included two-dimensional heat transfer analysis (Finite Element Method analysis), Computational Fluid Dynamics (CFD) analysis, energy modelling, and daylight simulations. Heat transfer analysis was used to determine heat transfer coefficients (U-values) of all analysed façade types, as well as temperature gra-dients through the façades for four exterior environmental conditions. CFD analysis investigated three-dimensional heat flow, airflow, and air velocity within the air cavity of DSFs. Energy modelling and daylight simulations were conducted for an office space that was enclosed by the analysed façade types. Individual energy models were developed for each façade type and for fifteen different climates representing various climate zones and subzones, from very hot to arctic. For daylighting simulations, multiple models were developed to study investigated typologies of DSFs, depth of air cavity between the two skins, orientations and four climate types, as well as dif-ferent sky conditions. Results indicate that there is not a lot of variation in thermal performance of the different DSF types, but that all DSF façades would have significantly improved thermal performance compared to the baseline single skin façade. Energy modelling results indicate significant differences in performance between the DSFs and single skin façade, but fewer variations between the different typologies of investigated DSFs. Moreover, the results show the effect of DSFs in different climate types on energy perfor-mance, heating, cooling, and lighting loads. Daylighting results indicate that all types of DSFs would decrease daylight levels compared to a conventional curtain wall, however, the differences between lighting levels are also dependent on the orientation, air cavity depth, façade type and climate.
KeywordsDouble skin façades, energy consumption, energy use intensity, daylight, simulations, finite element method (FEM) analysis, computa-tional fluid dynamics (CFD), energy modelling
DOI 10.7480/jfde.2018.1.1527

2 JOURNAL OF FACADE DESIGN & ENGINEERING VOLUME 6 / NUMBER 1 / 2018
Box window
Corridor
Shaft box
Multi stor y
Double-skinfacade type
Natural
Mechanical
Hybrid
Ventilationmode
Exhaust air
Supply air
Static air buffer
External air curtain
Airflowpattern
Internal air curtain
FIg. 1 Classification of double skin façades.
1 INTRODUCTION
Double skin façades (DSFs) are an emerging type of building façades, aimed to improve thermal
performance of glazed envelopes. Different from a conventional single glazed façade configuration,
DSFs consist of three distinct layers – interior glazed wall system, ventilated air cavity, and exterior
glazed wall system. The ventilated air cavity serves as a thermal buffer between interior and
exterior glazed walls. Basic DSF types are box window, corridor, shaft box, and multi-storey façades
(Aksamija, 2013). The physical behaviour of the DSFs depends on the typology, as well as on the
ventilation mode of the air cavity and material components. Ventilation mode can include natural
ventilation, mechanical, and mixed mode. Double skin façades are classified according to ways the
air cavity is partitioned (the façade type), the ventilation mode, and the airflow pattern, as seen in
Figure 1. These three variables can be combined in numerous ways for a wide variety of design
possibilities. The selection of the type of glazing, the width and partitioning of the air cavity, and
ventilation mode depends on climate, building orientation, and design requirements.
Basic DSF types include:
– Box window façades, which have horizontal partitions at each floor level, as well as vertical partitions
between windows. Each air cavity is typically ventilated naturally.
– Corridor façades, which have uninterrupted horizontal air cavities for each floor level, but are
physically partitioned at the floor levels. All three ventilation modes are possible.
– Shaft box façades, which are similar to corridor façades, but use vertical shafts for natural stack-
effect ventilation. Hybrid-mode ventilation is often used for this façade type.
– Multi-storey façades, which have uninterrupted air cavities spanning the full height and width of the
façade. All three ventilation modes can be used.
DSFs have been primarily used in cold and temperate climates, although there are some examples
in warmer climate types. The objective of this research was to investigate the thermal and
energy performance of DSFs across all climates (fifteen different climate zones, representing
heating-dominated, cooling-dominated, and mixed climates), and to determine the behaviour
of three different types (box window, corridor type, and multi-storey DSFs). Diagrams, as well as
partial elevations, sections, and plans for these DSF types are shown in Figures 2 to 5. Daylighting
performance of DSFs was also investigated at different latitudes, orientations, and cavity depths.

3 JOURNAL OF FACADE DESIGN & ENGINEERING VOLUME 6 / NUMBER 1 / 2018
FIg. 2 Diagram showing investigated façade types, where the basic components and airflow patterns are indicated.
FIg. 3 Box window DSF.

4 JOURNAL OF FACADE DESIGN & ENGINEERING VOLUME 6 / NUMBER 1 / 2018
FIg. 4 Corridor type DSF.
2 LITERATURE REVIEW
There is significant research available relating to the thermal and energy performance of DSFs in
temperate and colder climates, as evident in a previously published literature review by Pomponi,
Piroozfar, Southall, Ashton, and Farr (2016). This literature review provided an overview of a number
of research articles focusing on energy performance analysis of DSFs in temperate climates.
Energy savings for heating and cooling were compared across different DSF types, but the study
could not verify the impact of DSF types on energy consumption for lighting.
gratia and Herde (2007) looked extensively at DSFs in a temperate climate, analysing behaviour for
various orientations, and how applying the DSF affected heating and cooling loads. Another study
was conducted to compare a DSF to other façade alternatives for a specific building application in
central Europe (gelesz & Reith, 2015). The authors simulated box window DSF and its single skin
alternative, and the results indicate that DSF can reduce energy consumption by 7% on average.
In addition, closed cavities have overheating problems even on the coldest days, when oriented
in a southerly direction. Thermal performance in regard to interior cavity temperatures was also
analysed as part of this study. Cavity temperatures were shown to increase in colder seasons when
compared to external temperatures, but also overheat when external temperatures are hotter, even
with the application of shading during those summer conditions.

5 JOURNAL OF FACADE DESIGN & ENGINEERING VOLUME 6 / NUMBER 1 / 2018
FIg. 5 Multi-storey DSF.
For hot climate areas, summer ventilation for DSF leads to increased cooling loads (Eicker, Fux,
Bauer, Mei, & Infield, 2008). Zhou and Chen (2010) looked at applying ventilated DSFs in hot and cold
climate zones in China. Wong et al. (2005) studied the performance of DSF in Singapore by using
energy and CFD simulations. guardo, Coussirat, Valero, and Egusquiza (2011) used CFD simulations
and comparative analysis to evaluate horizontal and vertical ventilation schemes for a DSF in
a Mediterranean climate. Brandl, Mach, grobbauer, and Hochenauer (2014) studied the airflow
characteristics and temperature profile of multifunctional façade elements through comprehensive
analysis and comparison by using CFD models, and the results identified that the ventilation effects
of side openings can help decrease cavity temperature.
Studies have also been conducted that look specifically at a comparison of thermal comfort in single
skin glazed façades compared to DSF, where thermal comfort is defined as 80% of individuals not
expressing dissatisfaction with interior temperature (ASHRAE, 2013a). The Predicted Mean Vote-
Percentage of People Dissatisfied (PMV-PPD) method is typically used to quantify thermal comfort,
and acceptable limits for discomfort are within 20% range (ASHRAE, 2013). Wong et al. (2005) looked
specifically at a typical office building application on two specific days of the year in Singapore to
represent Singapore’s two main seasons, June for the warm and dry season, and December for
the cool and rainy season. Results showed a baseline percentage of people dissatisfied (PPD) in a
single façade building application as being 24.5% in June, and 22% in December. The application of
a DSF using only stacking effect (without mechanical ventilation) decreased PPD to 19.6% in June,

6 JOURNAL OF FACADE DESIGN & ENGINEERING VOLUME 6 / NUMBER 1 / 2018
and 18% in December, equalling an average of 5% of people showing greater satisfaction. The same
double skin façade with mechanical ventilation was then tested. The PPD decreased slightly in June
to 19.5%, and in December remained at 18%. This evidence points to the application of a DSF to
enhance thermal comfort. This study did not look specifically at calculating the U-value of the DSF
when addressing thermal performance.
Viljoen, Dubiel, Wilson, and Fontoynont (1997) studied a 32-storey Brussels DSF office building and
simulated thirteen DSF assemblies using scale models and computer simulations. Simulations
assumed unobstructed sky view, and assessed how far the daylit zone could extend into the office.
A comparative study between a scale model and computer simulations using Radiance provided results.
It was concluded that the components of a DSF, a light shelf, reflectivity, perforation of materials, and
location of walkways had significant effects on interior daylighting. Findings also indicated that glazing
orientation and surface area would have significant impacts on daylighting. The findings of this study
are applicable to buildings with DSFs, but lack comparison with single glazed façade daylighting.
Shameri et al. (2013) simulated the daylighting conditions of twelve existing DSF offices located in
tropical, subtropical, and temperate climate zones. The analysed façades had cavity depths ranging
from 0.8 m (2.6 ft) to 2.5 m (8.2 ft), with glazed values ranging from 70% to 100%. The research
concluded that daylighting values inside the DSF offices were at comfortable levels. However, all DSF
models failed to achieve standard indoor illuminance requirements of the office space. Kim and Song
(2007) conducted simulations to assess the performance of a daylight dimming control installed
in an office with a DSF. The simulations placed photosensors at three different locations, three
shielding conditions, and three sky conditions. They found that a partially shielded condition with
clear and partly cloudy skies showed adequate dimming function in a DSF structure.
Konis (2013) evaluated a 56,206 m² (605,000 ft2) office building in San Francisco. Both the northwest
and southeast façades are fully glazed with two different DSFs, where the southeast DSF consisted
of perforated metal panels allowing solar transmission of 50%, and the northwest façade consisted
of a DSF with laminated glass and plastic fins. Subjective responses on daylighting were paired
with simultaneous measurements of global horizontal illuminance, and vertical luminance. Daylight
illuminance levels were calculated by subtracting electrical lighting contributions from physical
illuminance measurements. Daylight transmission to the core zones was found to be insufficient
based on subjective and physical measures. Daylight only contributed 15% of the total illuminance
measured in core zones. Although façade light transmission was significantly reduced, daylighting
in perimeter zones was considered sufficient and met or exceeded the anticipated energy reduction
target of 25%. Respondents also indicated adequate lighting even below common thresholds. Visual
comfort responses indicated that glare analysis should be incorporated into design simulations.
There is lack of research that systematically compares thermal, energy, and daylight performance
of different types of DSFs in all climate types. Additionally, studies that systematically investigate
thermal and energy performance of DSFs façades in all types of climates currently do not exist.
Moreover, studies that also investigate different typologies of DSFs and their energy performance
are currently limited. Few studies have evaluated the effect of DSFs on daylighting. Most studies
indirectly address daylighting while evaluating the performance of other effects of DSFs, leading
to limited results and evaluations that pertain to specific buildings. A broader understanding of
DSF impacts on daylighting is unavailable. Therefore, this research study focused on addressing
these gaps in knowledge.
7 JOURNAL OF FACADE DESIGN & ENGINEERING VOLUME 6 / NUMBER 1 / 2018
3 RESEARCH OBJECTIVES AND METHODOLOGY
The objectives of this research were: 1) to investigate the thermal performance of different types
of DSFs (in relation to single skin glazed façade, and based on differences between individual DSF
typologies); 2) to investigate effects on energy performance in all climate types; and 3) to investigate
daylighting performance of DSFs. Research questions that were addressed include:
– What is the thermal performance of different types of DSFs, specifically in terms of heat transfer
coefficients (U-values)?
– How does the outside temperature affect the oscillation of temperatures in the air cavity between
internal and external glazing in different types of DSFs?
– What is the effect of outside temperature and solar radiation on airflow patterns and air velocity in
the air cavity for different types of DSFs?
– What is the effect of different types of DSFs on energy consumption for commercial office spaces
in all climate types?
– How do DSFs influence the heating and cooling loads in different types of climates? What are the
energy saving potentials for different DSFs? How is energy consumption for lighting impacted by
different types of DSFs?
– How does the daylighting performance of DSFs compare to conventional single skin façades? How
are daylighting values impacted at different orientations? How does the air cavity depth influence
daylight performance of DSFs?
3.1 HEAT TRANSFER ANALYSIS
The heat transfer analysis utilised a 2D finite element method analysis, using THERM and WINDOW
modelling software programs. THERM was developed by Lawrence Berkeley National Laboratory (LBNL),
and it is widely used for thermal analysis of façade systems. WINDOW was also developed by LBNL,
and it is interoperable with THERM. It can be used to calculate optical and thermal properties of glazing
systems. THERM calculates conductive heat transfer, considering interior and exterior environmental
conditions, and the conductive properties of air and materials in the façade assembly. The benefit of the
software is that it can determine thermal gradients, heat flux, and U-value of various façade assemblies.
Another benefit is that the properties of glazing units can be imported from WINDOW. The drawback is
that it only considers conductive heat transfer, and calculation is performed in two dimensions.
PROPERTIES STANDARD CURTAIN WALL m (ft)
BOX WINDOW DSF m (ft)
CORRIDOR TYPE DSF m (ft)
MULTI-STOREY m (ft)
Height 3.1 (10) 3.1 (10) 3.1 (10) 6.1 (20)
Cavity depth N/A .31 (1) .31 (1) .31 (1)
Upper opening width (box window and corridor type)
N/A .31 (1) .31 (1) N/A
Lower opening width (box window and corridor type)
N/A .15 (.5) .15 (.5) N/A
TABLE 1 Basic geometry and dimensions of analysed façade systems.
8 JOURNAL OF FACADE DESIGN & ENGINEERING VOLUME 6 / NUMBER 1 / 2018
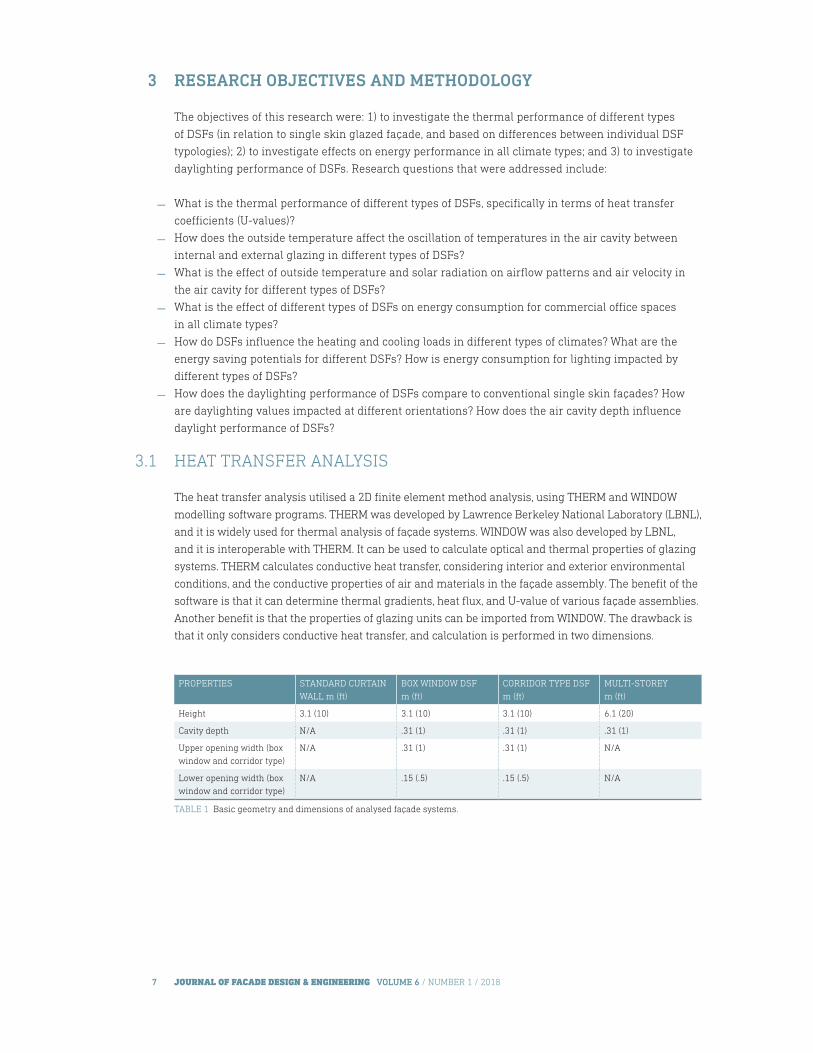
FAÇADE ELEMENT MATERIAL TYPE THERMAL CONDUCTIVITY W/m-°C (Btu/h-ft-°F)
Mullions Aluminium alloy (oxidised) 525.2 (92.5)
Mullion gasket Silicone 1.65 (0.29)
Box window and corridor type cavity partitions Aluminium alloy (oxidised) 525.2 (92.5)
TABLE 2 Material properties of opaque façade elements.
gLAZINg ELEMENT gLAZINg TYPE U-VALUE W/m²-°C (Btu/h-ft2-°F)
SHgC VISUAL TRANSMITTANCE
Exterior façade glazing 1.25 cm (1/2 in) tempered glass 18.4 (3.24) 0.44 0.79
Interior façade glazing 2.50 cm (1 in) double insulated low-e glazing with argon
6.02 (1.06) 0.35 0.63
TABLE 3 Properties of glazing.
The different analysed façades (single skin, as well as different types of DSF) were initially drafted
as 2D sections in CAD, and then imported as an underlay in THERM to develop thermal analysis
models. THERM relies on detailed 2D representations of all components and materials, placement
of appropriate materials, definitions of material properties, and application of boundary conditions
that represent exterior and interior environmental conditions. Table 1 and Figure 6 identify major
characteristics of simulated DSFs, and their geometric properties.
All DSF façade systems used 2.5 cm (1 in.) double low-e insulated glazing unit (IgU) with argon gas fill
on the inside of the façade, and 1.25 cm (0.5 in.) single tempered glazing on the outside. It was assumed
that the air cavity between the two skins would rely only on natural ventilation and stack effect, where
openings at the bottom and top of the façade would be used to ventilate the cavity. The single skin
façade consisted of a 2.5 cm (1 in.) double air low-e IgU. The properties of IgUs were calculated in
WINDOW and imported into THERM. The framing members for the typical curtain wall and the interior
layer of the DSF included aluminium alloy (oxidised) mullions. The outer layer of the DSFs did not
include aluminium framing members—the assumption was that structural silicone would be used for
glazing, and that the structural support for the outside skin would be provided by point-supports and
cables. For the box window DSF, the assumption was that the horizontal and vertical division panels
between floors and individual windows would be constructed out of aluminium. For the corridor DSF,
the assumption was that the horizontal division panels between floors would also be constructed out of
aluminium with an equivalent thermal conductivity. Material properties are listed in Tables 2 and 3.
Each façade type was simulated for four different exterior temperatures: 32°C (90°F), 16°C (60°F),
-1°C (30°F) and -18°C (0°F), in order to represent various climatic conditions. These values were
chosen to represent typical winter conditions in colder climates, intermediate conditions (fall/spring)
in temperate and warmer climates, and summer conditions in warm climates. Both sections and
plans were simulated for all façade types, since this particular method uses 2D heat transfer analysis.
The interior temperature was held constant at 20°C (68°F). Results were represented as thermal
gradients, indicating temperature differentials within the cavity. The results were analysed in section
and plan views, and are discussed in more detail in later sections of this article. U-values were also
calculated, where the simulation inputs for environmental conditions were determined based on
the NFRC 100-2004 Standard, with an exterior temperature of -18°C (0°F) and interior temperature
of 21°C (70°F). The results were evaluated to determine the relative thermal performance of
investigated façade types and compare the calculated U-values. Therefore, twenty different models
were developed, where results for sixteen models were used to determine thermal gradients for
various exterior environmental conditions, and four models were used to calculate U-values.

9 JOURNAL OF FACADE DESIGN & ENGINEERING VOLUME 6 / NUMBER 1 / 2018
FIg. 6 Sectional diagram of DSF, showing components of simulated models.
3.2 COMPUTATIONAL FLUID DYNAMICS ANALYSIS
Computational Fluid Dynamics (CFD) analysis implements numerical simulation methods to
seek solutions to fluid flow problems. The advantage of the CFD method in evaluating airflow and
heat transfer is that it allows 3D model application, and it can be used to study various building
components, effects of natural and mechanical ventilation, as well as solar radiation on building
performance. For this study, Ansys Fluent CFD simulation program was used, where models for the
investigated DSF types were developed using the same dimensions, components, and materials
properties as THERM heat transfer analysis.
Different scenarios were developed to simulate how box window, corridor, and multi-storey DSFs
perform under various environmental conditions. For each façade type, different models were
developed to represent exterior temperatures of 32°C (90°F), 16°C (60°F), -1°C (30°F), and -18°C (0°F),
while the interior temperature was constant at 20°C (68°F). The geometries were built as 3D models
in Rhino modelling software, and imported into Fluent. A homogenous mesh with fine grids was
implemented for all models. Also, the exterior and interior surfaces, as well inlets and outlets were
identified for the meshed models.
Fluent provides two options for solvers: pressure-based and density-based. The pressure-based
solvers take momentum and pressure as the primary variables in calculations, and are applicable for
a wide arrangement of applications to investigate flow patterns. Pressure-based solvers also require
less computing power. The density-based solver takes into account density, energy, momentum,
and is applicable to situations where high speed compressible flow with combustion, hypersonic
flows, or shock interactions are present. The applied solver in this study was pressure-based, since
it is suitable to understand the velocity and flow patterns in the DSF air cavities. To mimic the real
environment, gravity was set as -9.8 m/s on the Z axis. Boundary conditions for each identified
façade component were set according to different temperature scenarios. The vertical sides of the

10 JOURNAL OF FACADE DESIGN & ENGINEERING VOLUME 6 / NUMBER 1 / 2018
Exterior temperature 32°C (90°F) 16°C (60°F) -1°C (30°F) -18°C (0°F)
Direct solar irradiation (kW/m2) 0.90 0.90 0.90 0.85
Diffuse solar radiation on vertical surface (kW/m2)
0.08 0.08 0.06 0.06
Ground reflected solar radiation on vertical surface (kW/m2)
0.10 0.08 0.05 0.40
Wind speed (m/s) 3.9 4.7 4.9 5.2
TABLE 4 Solar radiation and wind speed inputs for the CFD analysis, based on exterior temperature conditions.
DSFs were identified as adiabatic and the velocity input for air inlet depends on wind speed in
different seasons. CFD can account for exterior wind and solar radiation (unlike 2D heat transfer
analysis using THERM). Therefore, changes in velocity and airflow pattern, as well as changes in
temperature within the air cavity can be simulated. The inputs for wind speed and solar radiation
were determined based on analysing climate data for several cities in the U.S., and the daily average
values in January, March, May, and July. Inputs for solar radiation and wind speed, based on exterior
temperature conditions, are listed in Table 4.
Since the simulations are performed in three dimensions, the sides of the DSF models were
assumed to be enclosed, and the ventilation openings were identical to dimensions shown in Table
1. The exterior thermal boundary was exposed to both radiative and convective heat flux, and the
internal thermal boundary was exposed to convective heat flux. The simulations were performed,
and the results consisted of thermal gradients and velocity within the cavity for each type of DSF
and exterior temperature conditions, indicating heat transfer and airflow patterns. Sixteen different
models were developed, representing four façade types and four exterior environmental conditions.
The results were analysed, and are discussed in detail in a later section.
3.3 ENERgY MODELLINg
The methodology for energy modelling consisted of building individual simulation models for
each type of investigated façade, which would enclose a commercial south-oriented office space.
Energy modelling was performed in Design Builder, and geometry for the models was created
in Revit. Design Builder calculates heating and cooling loads using a heat balance method,
while lighting loads consider solar distribution and visible light transmittance. The air cavities
within the DSFs were modelled as separate zones without additional cooling or heating, relying
only on natural ventilation. Each type of DSF had three variations (without openings, openings-
holes, and openings-vents), representing different ventilation modes and airflow patterns for the
air cavity. Models without openings represented static air buffer airflow pattern, while models
with openings represented natural ventilated cavities that can operate as external air curtain.
Mechanical ventilation or mixed mode ventilation of the cavity was not considered. Table 5 shows
representative cities that were chosen for energy modelling in order to investigate the effects on
energy consumption in different climates. Therefore, ten different models were developed for tested
climates, resulting in 150 models.

11 JOURNAL OF FACADE DESIGN & ENGINEERING VOLUME 6 / NUMBER 1 / 2018
CLIMATE ZONE CITY STATE ZONE REgION
1 1A Miami Florida Very hot Moist
2 2A Houston Texas Hot Moist
3 2B Phoenix Arizona Hot Dry
4 3A Memphis Tennessee Warm Moist
5 3B El Paso Texas Warm Dry
6 3C San Francisco California Warm Marine
7 4A Baltimore Maryland Mixed Moist
8 4B Albuquerque New Mexico Mixed Dry
9 4C Salem Oregon Mixed Marine
10 5A Chicago Illinois Cool Moist
11 5B Boise Idaho Cool Dry
12 6A Burlington Vermont Cold Moist
13 6B Helena Montana Cold Dry
14 7 Duluth Minnesota Very cold -
15 8 Fairbanks Alaska Subarctic -
TABLE 5 Climate zones and representative cities that were incorporated into energy modelling simulations.
The dimensions and material properties of the façades were identical to previously discussed
characteristics. The baseline model was a standard curtain wall, and all other models were enclosed
by the different types of DSF (box window, corridor type and multi-storey). The energy models
represented a single zone per floor, totalling 148.6 m2 (1,600 ft2) per floor, with a 12.2 m (40 ft) wide
and 12.2 m (40 ft) deep office space. Models were developed for a four-storey application in order to
investigate the effects of height on the performance of multi-storey DSFs.
The inputs for occupancy loads, system loads, equipment loads, lighting, and ventilation were
based on ASHRAE 90.1 energy code and recommendations prescribed by ASHRAE 189 standard
(ASHRAE, 2014; ASHRAE 2013b). The material properties and optical properties of glazing were
identical to heat transfer analysis. Operating schedule was based on a typical office space operation
(weekday schedule from 8 AM to 6 PM). The heating, ventilation and air-conditioning (HVAC) system
consisted of a packaged heating/cooling pump with direct expansion (DX) coils, and natural gas
used for heating. The results were calculated for all models, where total annual energy consumption
was determined for each individual scenario, as well as the heating, cooling, and lighting loads.
In addition, Energy Usage Intensity (EUI) was determined for all scenarios. The results are discussed
in more detail in a later section.
3.4 DAYLIgHT ANALYSIS
Modelling and simulation tools were used to evaluate daylighting performance for all investigated
façade types. A detailed model of an office space was created in Revit, with identical dimensions as
the energy modelling. The baseline model was a standard curtain wall, while all other models were
enclosed by different types of DSF (box window, corridor type, and multi-storey). Each DSF was tested
with .6 m (2 ft) and .9 m (3 ft) cavities. These cavity depths were chosen for daylight analysis because
deeper cavities are needed for access and maintenance, but would reduce daylighting. The objective
was to quantify the impacts of different cavity depths on daylighting. All models were also simulated
at four different orientations (north, south, east, and west). Interior materials consisted of white paint

12 JOURNAL OF FACADE DESIGN & ENGINEERING VOLUME 6 / NUMBER 1 / 2018
on walls, carpet as flooring, and acoustic tile for the ceiling. The models were then imported into
Ecotect, where the Radiance plug-in was used to calculate illuminance levels. Four U.S. cities were
evaluated: Duluth, Chicago, San Francisco, and Miami. These cities were chosen for their different
latitudes. Each simulation model was tested under different sky conditions, considering overcast
sky (for January simulations), partly cloudy (for October simulations), and sunny conditions (for July
simulations) for each location, with global illuminance values derived from the weather file. A dataset
of 336 simulations was produced.
4 RESULTS
4.1 HEAT TRANSFER ANALYSIS RESULTS
The results of the 2D heat transfer analysis consisted of two sets of data—the first set of data
indicated thermal gradients through investigated façade systems for four exterior environmental
conditions, and the second set of data demonstrated U-values. Figures 7 to 10 show thermal
gradients for DSF types and four exterior environmental conditions, with air temperatures of 32°C
(90°F), 16°C (60°F), -1°C (30°F) and -18°C (0°F) used as external boundary conditions.
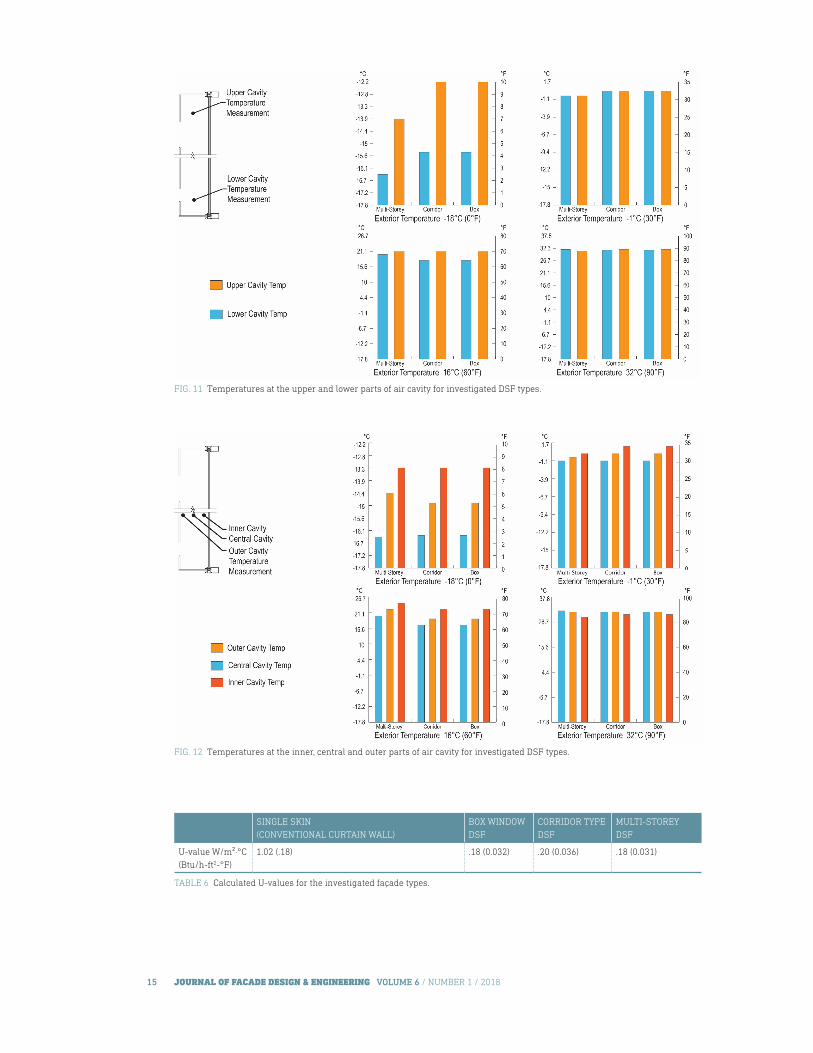
Figure 11 indicates temperatures within upper and lower parts of cavities for all three DSF types, and
for all four exterior environmental conditions. Results indicate that for lower exterior temperatures
of -1°C (30°F) and -18°C (0°F), there is a larger difference in temperature within the lower and
upper parts of the air cavity. As the exterior temperature increases, such as 16°C (60°F) and 32°C
(90°F), there is less differentiation between the lower and upper parts of the air cavity. Another
observation is that there is slight variation in results based on the DSF typology. For example, the
multi-storey DSF shows smaller discrepancies than corridor type or box window DSF. Figure 12
indicates temperatures within the outer, inner, and central part of the cavity for the four investigated
external air temperatures.
Heat transfer coefficients (U-values) were calculated for conventional curtain wall, as well as three
investigated DSF types. The air cavity was assumed to be closed for U-value calculations. Table 6
shows the results, indicating the relative thermal performance of each investigated façade type.
All DSF types have much lower U-value than a standard curtain wall. The differences between
different DSF typologies are relatively small; however, a multi-storey DSF would have the smallest
U-value, followed by the box window and corridor type DSFs. Nevertheless, the significant difference
between U-values of DSF types and conventional curtain walls suggests that all types of DSFs would
provide savings in heating and cooling loads due to improved thermal performance for the majority
of building types and climates.

13 JOURNAL OF FACADE DESIGN & ENGINEERING VOLUME 6 / NUMBER 1 / 2018
FIg. 7 Thermal gradients for DSF types: exterior temperature of -18°C (0°F).
FIg. 8 Thermal gradients for DSF types: exterior temperature of -1°C (30°F).

14 JOURNAL OF FACADE DESIGN & ENGINEERING VOLUME 6 / NUMBER 1 / 2018
FIg. 9 Thermal gradients for DSF types: exterior temperature of 16°C (60°F).
FIg. 10 Thermal gradients for DSF types: exterior temperature of 32°C (90°F).
15 JOURNAL OF FACADE DESIGN & ENGINEERING VOLUME 6 / NUMBER 1 / 2018
FIg. 11 Temperatures at the upper and lower parts of air cavity for investigated DSF types.
FIg. 12 Temperatures at the inner, central and outer parts of air cavity for investigated DSF types.
SINgLE SKIN (CONVENTIONAL CURTAIN WALL)
BOX WINDOW DSF
CORRIDOR TYPE DSF
MULTI-STOREY DSF
U-value W/m²·°C (Btu/h-ft2-°F)
1.02 (.18) .18 (0.032) .20 (0.036) .18 (0.031)
TABLE 6 Calculated U-values for the investigated façade types.
16 JOURNAL OF FACADE DESIGN & ENGINEERING VOLUME 6 / NUMBER 1 / 2018
4.2 COMPUTATIONAL FLUID DYNAMICS ANALYSIS RESULTS
The results of CFD analysis indicated temperature gradients within the air cavity of the investigated
DSF types in 3D form, as well as air velocity and airflow patterns. CFD analysis results for multi-
storey DSFs show that when the exterior temperature was -18°C (0°F), the temperature in the
air cavity fluctuated between -17.7°C (0.2°F) and -15.3°C (4.4°F). The upper part of the cavity
demonstrated a higher temperature, as seen in Figure 13. The velocity was relatively stable within
the air cavity. Inlet velocity was 4.9 m/s and outlet velocity was 5.9 m/s, and the increased velocity
value may be due to the stack effect, since the warmer air rises. When the exterior temperature
was increased to -1°C (30°F), air temperature inside the cavity was between -1°C (30.2°F) and 2.9°C
(37.2°F). If the exterior temperature was increased to 16°C (60°F) or 32°C (90°F), temperatures within
the cavity fall within the range between 15.7°C (60.2°F) and 19.7°C (67.5°F), and 32.3°C (90.2°F)
and 36.2°C (97.2°F). The simulation results demonstrate a consistent temperature change pattern.
Within the cavity of a multi-storey DSF, there is a temperature fluctuation caused by solar radiation,
exterior and interior temperature, as well as the ventilation effects. However, the temperature change
is not significant mainly because of the configuration characteristics of the multi-storey DSF.
Compared to multi-storey, the corridor type DSF showed a similar rising trend in cavity temperature
(Fig.14). With an exterior temperature of -18°C (0°F), the cavity area’s temperature fluctuated between
-17.7°C (0.1°F) and -17.3°C (0.8°F). With exterior temperature of -1°C (30°F), the temperature inside the
cavity was between -7.3°C (18.9°F) and 1.8°C (35.2°F), which is lower than the temperature gradient
for the multi-storey DSF. In addition, with exterior temperatures of 16°C (60°F) and 32°C (90°F), the
temperatures within the cavity area fluctuated between 15.6°C (60.1°F) and 16.3°C (61.4°F), and 31.7°C
(89.1°F) and 33.8°C (92.8°F), respectively. The cavity temperature also showed discrepancies in the
lower and the upper parts. The higher temperature in the upper part of DSF cavity indicates that the
warm air rises. Moreover, airflow patterns were different from the multi-storey DSF due to the addition
of horizontal partitions between floors. This caused more turbulence within the air cavity.
The results for the box DSF indicate that the cavity temperatures are relatively constant (Fig.15).
With an exterior temperature of -18°C (0°F), the temperature within the cavity fluctuates between
-17.7°C (0.1°F) and -17°C (1.4°F). When the exterior temperature increased to 16°C (60°F), the cavity
temperature showed a range between 15.5°C (59.9°F) and 15.6°C (60.1°F). Also, for the exterior
temperature of 32°C (90°F), the cavity temperature was between 32.2°C (89.9°F) and 32.3°C (90.1°F).
The smaller ranges in temperatures could be due to the geometry and components of the box
window DSF, since this typology has horizontal and vertical divisions that limit the movement of air
within the cavity. However, these components influence airflow patterns and create patterns that are
more turbulent than other types of DSFs.
CFD analysis and THERM analysis provided slightly different results for temperatures within the air
cavity in all DSF cases. This is caused by the fact that THERM considers 2D convective heat transfer,
while CFD analysis considers 3D heat transfer and takes into account radiation, convection, and the
effects of wind on a naturally ventilated system. Tables 7, 8 and 9 compare results for all analysed
DSF façades under different external environmental conditions, where temperatures within the air
cavity are listed for both simulation methods.

17 JOURNAL OF FACADE DESIGN & ENGINEERING VOLUME 6 / NUMBER 1 / 2018
FIg. 13 Results of the CFD analysis, showing temperature within air cavity and airflow pattern for multi-storey DSF.
Exterior temperature 32 °C (90°F) 16 °C (60°F) -1 °C (30°F) -18 °C (0°F)
CFD analysis air cavity temperature range °C (°F)
32.3 to 36.2(90.2 to 97.2)
15.6 to 19.7(60.2 to 67.5)
-1 to 2.8(30.2 to 37.2)
-17.7 to 15.8(0.18 to 3.48)
THERM analysis air cavity temperature range °C (°F)
27.8 to 29.4(82.0 to 85.0)
20 to 23.9(68.0 to 75.0)
-1.1 to 0(30.0 to 32.0)
-16.4 to 13.3(2.50 to 8.00)
TABLE 7 Comparison of CFD and THERM analysis results for multi-storey DSF.
Exterior temperature 32 °C (90°F) 16 °C (60°F) -1 °C (30°F) -18 °C (0°F)
CFD analysis air cavity temperature range °C (°F)
32.7 to 34.9(90.9 to 94.8)
16.4 to 19.3(61.6 to 66.7)
-1.1 to 1.5(30.1 to 34.7)
-17.7 to 15(0.0 to 5.0)
THERM analysis air cavity temperature range °C (°F)
28.3 to 29.3(83.0 to 84.7)
16.7 to 22.8(62.0 to 73.0)
-1.1 to 1.1(30.0 to 34.0)
-16.3 to -13.3(2.60 to 8.00)
TABLE 8 Comparison of CFD and THERM analysis results for corridor type DSF.
Exterior temperature 32 °C (90°F) 16 °C (60°F) -1 °C (30°F) -18 °C (0°F)
CFD analysis air cavity temperature range °C (°F)
32.2 to 32.3(90.0 to 90.1)
15.6 to 15.6(60.0 to 60.1)
-1.1 to 1.1(30.0 to 30.1)
-17.7 to 17.7(0.0 to 0.1)
THERM analysis air cavity temperature range °C (°F)
28.3 to 29.3(83.0 to 84.7)
16.7 to 22.8(62.0 to 73.0)
-1.1 to 15.6(30.0 to 34.0)
-16.3 to 13.3(2.60 to 8.00)
TABLE 9 Comparison of CFD and THERM analysis results for box window DSF.

18 JOURNAL OF FACADE DESIGN & ENGINEERING VOLUME 6 / NUMBER 1 / 2018
FIg. 14 Results of the CFD analysis, showing temperature within air cavity and airflow pattern for corridor type DSF.
FIg. 15 Results of the CFD analysis, showing temperature within air cavity and airflow pattern for box window DSF.

19 JOURNAL OF FACADE DESIGN & ENGINEERING VOLUME 6 / NUMBER 1 / 2018
4.3 ENERgY MODELLINg RESULTS
Although benefits of DSFs in temperate and heating dominated climates have been reported in
numerous earlier studies as discussed by Pomponi et al. (2016), this study investigated the effects
of DSFs on energy consumption in all climate types. As stated earlier, the methodology consisted of
modelling the EUI and annual energy consumption of a south-oriented office space, which would
be enclosed by the investigated façade types. Four levels were simulated to accurately depict the
application of the multi-storey façade. Energy consumption for heating, cooling, and interior lighting
was calculated, as well as the average EUI.
Table 10 shows the percentage of energy savings for each type of DSF across all climate types,
compared to a single skin curtain wall. Figures 16 to 18 show the EUI for all façade types, for the
three DSF variations (without openings, holes, and vents), in all climates. All DSF types performed
better than the base case, a single skin conventional curtain wall, with the exception of the multi-
storey DSF with holes in climate zone 6B. The DSF types without openings resulted in similar
savings within the same climate zone. In all climate types, the box window DSF performed better
than the other DSF types. Hotter, drier climates saw the greatest energy savings (2B Phoenix: 30%),
while humid climates saw lower savings compared to dry or marine climates in the same zone
(2A Houston: 19%). Box window saw the greatest variation in savings within the subtypes (without
openings, holes, and vents), while multi-storey saw the least variation in savings. This may be caused
by the variations in façade components, since box window DSF includes horizontal and vertical
divisions in the air cavity, and multi-storey does not have any divisions. These elements influence
temperature gradients, air flow within the cavity, and visible light transmittance to the interior space.
CLIMATE ZONE CORRIDOR BOX WINDOW MULTI-STOREY
wo/ openings
holes vents wo/ openings
holes vents wo/ openings
holes vents
1A (Miami) 14% 13% 15% 15% 19% 21% 13% 11% 13%
2A (Houston) 14% 14% 15% 16% 19% 19% 14% 12% 13%
2B (Phoenix) 25% 23% 27% 26% 28% 30% 22% 20% 22%
3A (Memphis) 17% 16% 17% 18% 21% 21% 16% 18% 16%
3B (El Paso) 23% 21% 25% 25% 27% 28% 20% 18% 20%
3C (San Francisco) 22% 21% 23% 24% 27% 28% 20% 17% 19%
4A (Baltimore) 14% 15% 13% 14% 20% 18% 13% 12% 13%
4B (Albuquerque) 23% 22% 24 24% 27% 28% 20% 18% 20%
4C (Salem) 18% 19% 17% 19% 23% 22% 17% 16% 17%
5A (Chicago) 16% 16% 14% 17% 17% 14% 15% 15% 12%
5B (Boise) 20% 20% 20% 21% 26% 26% 18% 17% 18%
6A (Burlington) 15% 17% 14% 15% 22% 20% 15% 15% 15%
6B (Helena) 16% 18% 15% 17% 24% 22% 16% 0% 16%
7 (Duluth) 16% 18% 14% 16% 25% 22% 16% 16% 16%
8 (Fairbanks) 21% 22% 20% 21% 29% 28% 21% 20% 20%
TABLE 10 Amount of energy savings in EUI as a percentage, compared to the single skin façade type.

20 JOURNAL OF FACADE DESIGN & ENGINEERING VOLUME 6 / NUMBER 1 / 2018
0 20 40 60 80 100 120
Base case (single skin), four levelsCorridor DSF, four levels, without openingsBox window DSF, four levels, without openingsMulti stor y DSF, four levels, without openings
Zone 1A (Miami)
Zone 2A (Houston)
Zone 2B (Phoenix)
Zone 3A (Memphis)
Zone 3B (El Paso)
Zone 3C (San Francisco)
Zone 4A (Baltimore)
Zone 4B (Albuquerque)
Zone 4C (Salem)
Zone 5A (Chicago)
Zone 5B (Boise)
Zone 6A (Burlington)
Zone 6B (Helena)
Zone 7 (Duluth)
Zone 8 (Fairbanks)
63 126 189 252 315 3780
20 40 60 80 100 1200
Energy Usage Intensity (kW/m2)
Energy Usage Intensity (kBtu/ft2)
FIg. 16 EUI for investigated façade scenarios, considering DSFs without openings.

21 JOURNAL OF FACADE DESIGN & ENGINEERING VOLUME 6 / NUMBER 1 / 2018
0 20 4060
80 100 120
Base case (single skin), four levelsCorridor DSF, four levels, with openings (holes)Box window DSF, four levels, with openings (holes)Multi stor y DSF, four levels, with openings (holes)
Zone 1A (Miami)
Zone 2A (Houston)
Zone 2B (Phoenix)
Zone 3A (Memphis)
Zone 3B (El Paso)
Zone 3C (San Francisco)
Zone 4A (Baltimore)
Zone 4B (Albuquerque)
Zone 4C (Salem)
Zone 5A (Chicago)
Zone 5B (Boise)
Zone 6A (Burlington)
Zone 6B (Helena)
Zone 7 (Duluth)
Zone 8 (Fairbanks)
6063 126 189 252 315 3780
20 40 60 80 100 1200
Energy Usage Intensity (kW/m2)
Energy Usage Intensity (kBtu/ft2)
FIg. 17 EUI for investigated façade scenarios, considering DSFs with openings (holes).

22 JOURNAL OF FACADE DESIGN & ENGINEERING VOLUME 6 / NUMBER 1 / 2018
0 20 4060
80 100 120
Base case (single skin), four levelsCorridor DSF, four levels, with openings (vents)Box window DSF, four levels, with openings (vents)Multi stor y DSF, four levels, with openings (vents)
Zone 1A (Miami)
Zone 2A (Houston)
Zone 2B (Phoenix)
Zone 3A (Memphis)
Zone 3B (El Paso)
Zone 3C (San Francisco)
Zone 4A (Baltimore)
Zone 4B (Albuquerque)
Zone 4C (Salem)
Zone 5A (Chicago)
Zone 5B (Boise)
Zone 6A (Burlington)
Zone 6B (Helena)
Zone 7 (Duluth)
Zone 8 (Fairbanks)
6063 126 189 252 315 3780
20 40 60 80 100 1200
Energy Usage Intensity (kW/m2)
Energy Usage Intensity (kBtu/ft2)
FIg. 18 EUI for investigated façade scenarios, considering DSFs with openings (vents).

23 JOURNAL OF FACADE DESIGN & ENGINEERING VOLUME 6 / NUMBER 1 / 2018
CLIMATE ZONE CORRIDOR BOX WINDOW MULTI-STOREY
wo/ openings
holes vents wo/ openings
holes vents wo/ openings
holes vents
1A (Miami) -79% -54% -106% -78% -61% -115% -69% -62% -69%
2A (Houston) -87% -63% -112% -85% -68% -103% -76% -70% -76%
2B (Phoenix) -54% -37% -71% -51% -36% -58% -58% -49% -58%
3A (Memphis) -68% -49% -89% -67% -50% -77% -62% -56% -62%
3B (El Paso) -64% -46% -83% -61% -46% -72% -49% -57% -66%
3C (San Francisco) -59% -44% -75% -57% -43% -65% -58% -52% 58%
4A (Baltimore) -62% -45% -82% -60% -44% -70% -59% -54% -59%
4B (Albuquerque) -63% -47% -79% -59% -45% -67% -71% -61% -71%
4C (Salem) -62% -46% -79% -59% -43% -65% -59% -54% -59%
5A (Chicago) -53% -44% -77% -47% -39% -74% -50% -34% -92%
5B (Boise) -58 -44% -72% -55% -39% -58% -60% -54% -60%
6A (Burlington) -58%% -43% -75% -56% -40% -66% -54% -50% -54%
6B (Helena) -50% -38% -64% -47% -33% -52% -53% -55% -53%
7 (Duluth) -60% -45% -76% -57% -41% -63% -57% -52% -57%
8 (Fairbanks) -27% -19% -35% -25% -10% -21% -27% -25% -27%
TABLE 11 Energy savings for lighting loads (as a percentage), compared to single skin façade.
Table 11 shows the impact on lighting loads for all DSF types and climate types, compared to a single
skin. Lighting usage has increased across all DSFs and climate types, as seen in Figures 19 to 21.
Locations at lower latitudes saw the worst performance, due to higher sun angles. Locations at
higher latitudes saw better performance due to lower sun angles. The corridor DSF type with vents
was found to be the worst performer in all but two climate zones. The corridor DSF type with holes
was found to be the best performer in four of the warmer climate zones, while the box window with
holes was the best performer in 11 out of 15 climate zones.
With the exception of climate zone 3C, warmer climates saw lower energy savings in cooling
than colder climates, as seen in Figures 19 to 21. Humid climates also saw lower energy savings
compared to dry or marine climates in the same zone. In all but one zone (4A), the box window with
vents was the best performer, while the multi-storey with holes was the worst performer across all
climate types. Climate zone 3C saw similar savings to zone 8, as seen in Table 12.
Warmer climate zones saw greater energy savings in heating, while colder zones saw the least
savings (with the exception of zone 5A). Zone 1A saw the greatest variation in savings (89% to -73%),
while zone 8 saw the lowest variation (31% to 38%). The best performing DSF types were corridor
with holes, and box window with holes. The worst performing DSF types were corridor with vents,
and box window with vents, as shown in Table 13.

24 JOURNAL OF FACADE DESIGN & ENGINEERING VOLUME 6 / NUMBER 1 / 2018
0 100 200 300 400 500 600 700
HeatingCoolingLighting
Zone 1A (Miami)
Zone 2A (Houston)
Zone 2B (Phoenix)
Zone 3A (Memphis)
Zone 3B (El Paso)
Zone 3C (San Francisco)
Zone 4A (Baltimore)
Zone 4B (Albuquerque)
Zone 4C (Salem)
Zone 5A (Chicago)
Zone 5B (Boise)
Zone 6A (Burlington)
Zone 6B (Helena)
Zone 7 (Duluth)
Zone 8 (Fairbanks)
123412341234123412341234123412341234123412341234123412341234
1234
Base case (single skin), four levelsCorridor DSF, four levels, without openingsBox window DSF, four levels, without openingsMulti stor y DSF, four levels, without openings
0 95 190 284 379 474 568 663
Energy consumption (GJ)
Energy consumption (MBtu)
FIg. 19 Energy consumption for investigated façade scenarios, considering DSFs without openings.

25 JOURNAL OF FACADE DESIGN & ENGINEERING VOLUME 6 / NUMBER 1 / 2018
0 100 200 300 400 500 600 700
HeatingCoolingLighting
Zone 1A (Miami)
Zone 2A (Houston)
Zone 2B (Phoenix)
Zone 3A (Memphis)
Zone 3B (El Paso)
Zone 3C (San Francisco)
Zone 4A (Baltimore)
Zone 4B (Albuquerque)
Zone 4C (Salem)
Zone 5A (Chicago)
Zone 5B (Boise)
Zone 6A (Burlington)
Zone 6B (Helena)
Zone 7 (Duluth)
Zone 8 (Fairbanks)
123412341234123412341234123412341234123412341234123412341234
1234
Base case (single skin), four levelsCorridor DSF, four levels, with openings (holes)Box window DSF, four levels, with openings (holes)Multi stor y DSF, four levels, with openings (holes)
0 95 190 284 379 474 568 663
Energy consumption (GJ)
Energy consumption (MBtu)
FIg. 20 Energy consumption for investigated façade scenarios, considering DSFs with openings (holes).

26 JOURNAL OF FACADE DESIGN & ENGINEERING VOLUME 6 / NUMBER 1 / 2018
0 100 200 300 400 500 600 700
HeatingCoolingLighting
Zone 1A (Miami)
Zone 2A (Houston)
Zone 2B (Phoenix)
Zone 3A (Memphis)
Zone 3B (El Paso)
Zone 3C (San Francisco)
Zone 4A (Baltimore)
Zone 4B (Albuquerque)
Zone 4C (Salem)
Zone 5A (Chicago)
Zone 5B (Boise)
Zone 6A (Burlington)
Zone 6B (Helena)
Zone 7 (Duluth)
Zone 8 (Fairbanks)
123412341234123412341234123412341234123412341234123412341234
1234
Base case (single skin), four levelsCorridor DSF, four levels, with openings (vents)Box window DSF, four levels, with openings (vents)Multi stor y DSF, four levels, with openings (vents)
0 95 190 284 379 474 568 663
Energy consumption (GJ)
Energy consumption (MBtu)
FIg. 21 Energy consumption for investigated façade scenarios, considering DSFs with openings (vents).

27 JOURNAL OF FACADE DESIGN & ENGINEERING VOLUME 6 / NUMBER 1 / 2018
CLIMATE ZONE CORRIDOR BOX WINDOW MULTI-STOREY
wo/ openings
holes vents wo/ openings
holes vents wo/ openings
holes vents
1A (Miami) 28% 26% 30% 29% 32% 36% 26% 23% 26%
2A (Houston) 30% 28% 32% 31% 33% 35% 28% 25% 28%
2B (Phoenix) 40% 37% 44% 42% 42% 46% 38% 35% 38%
3A (Memphis) 35% 32% 37% 36% 36% 39% 33% 29% 33%
3B (El Paso) 43% 39% 47% 45% 45% 50% 40% 35% 40%
3C (San Francisco) 61% 54% 68% 66% 63% 72% 56% 49% 56%
4A (Baltimore) 37% 34% 42% 37% 34% 40% 35% 31% 35%
4B (Albuquerque) 49% 44% 54% 51% 50% 56% 45% 40% 45%
4C (Salem) 51% 47% 56% 54% 53% 58% 48% 42% 48%
5A (Chicago) 35% 31% 40% 38% 37% 44% 34% 28% 38%
5B (Boise) 51% 46% 55% 53% 51% 57% 47% 42% 47%
6A (Burlington) 42% 38% 46% 45% 44% 48% 39% 34% 39%
6B (Helena) 53% 48% 58% 56% 54% 60% 49% 36% 49%
7 (Duluth) 47% 42% 51% 50% 48% 54% 43% 37% 43%
8 (Fairbanks) 62% 55% 68% 65% 62% 70% 57% 51% 57%
TABLE 12 Energy savings for cooling loads (as a percentage), compared to single skin façade.
CLIMATE ZONE CORRIDOR BOX WINDOW MULTI-STOREY
wo/ openings
holes vents wo/ openings
holes vents wo/ openings
holes vents
1A (Miami) 68% 89% 38% 50% 39% -73% 69% 82% 68%
2A (Houston) 54% 59% 49% 50% 66% 59% 53% 55% 53%
2B (Phoenix) 52% 65% 34% 42% 52% 30% 52% 59% 51%
3A (Memphis) 30% 36% 25% 27% 47% 40 31% 33% 31%
3B (El Paso) 29% 48% 6% 17% 41% 12% 31% 38% 30%
3C (San Francisco) 33% 50% 15% 22% 32% 8% 35% 43% 34%
4A (Baltimore) 22% 29% 16% 19% 35% 28% 24% 26% 24%
4B (Albuquerque) 23% 38% 6% 15% 30% 7% 25% 31% 25%
4C (Salem) 34% 39% 31% 33% 39% 35% 35% 36% 35%
5A (Chicago) 6% 11% -1% 3% 5% -6% 5% 8% 0%
5B (Boise) 30% 36% 25% 28% 43% 37% 31% 33% 31%
6A (Burlington) 30% 33% 27% 29% 37% 34% 31% 32% 31
6B (Helena) 26% 31% 20% 23% 37% 30% 27% 0% 27%
7 (Duluth) 30% 33% 28% 29% 40% 36% 31% 32% 31%
8 (Fairbanks) 31% 33% 31% 31% 33% 38% 32% 31% 31%
TABLE 13 Energy savings for heating loads (as a percentage), compared to single skin façade.
28 JOURNAL OF FACADE DESIGN & ENGINEERING VOLUME 6 / NUMBER 1 / 2018
4.4 DAYLIgHT ANALYSIS RESULTS
Overall, DSFs reduced the amount of daylight compared to single skin glazed façade. All DSFs show
a decreasing amount of daylight as the distance from the façade increases inside the building.
However, as the distance from the perimeter increases, the difference in daylighting between the
DSF façades and the typical single glazed façade decreases.
Duluth exhibited lower lighting levels in the northern and eastern orientations compared to other
cities. In the southern and western orientations, it experienced higher lighting levels, due to the
lower sun angles and light reaching farther into the space. In the same orientations during the fall
and winter, Duluth experienced similar or lower lighting levels than the other cities. Chicago’s results
were similar to those observed in Duluth. North and east façades had considerably lower lighting
levels than the south and west, regardless of the time of year. Daylight performance of the single skin
façade is best, followed by the multi-storey DSF, the corridor DSF, and finally the box DSF. However,
there is some variation. The box DSF outperforms the multi-storey DSF and the corridor DSF when
using a 0.6 m (2 ft) cavity. Its daylight values closest to the perimeter are lower in most cases
compared to multi-storey and corridor DSFs, but it retains higher values as the distance from the
perimeter increases. The multi-storey DSF consistently has the highest daylight values closest to the
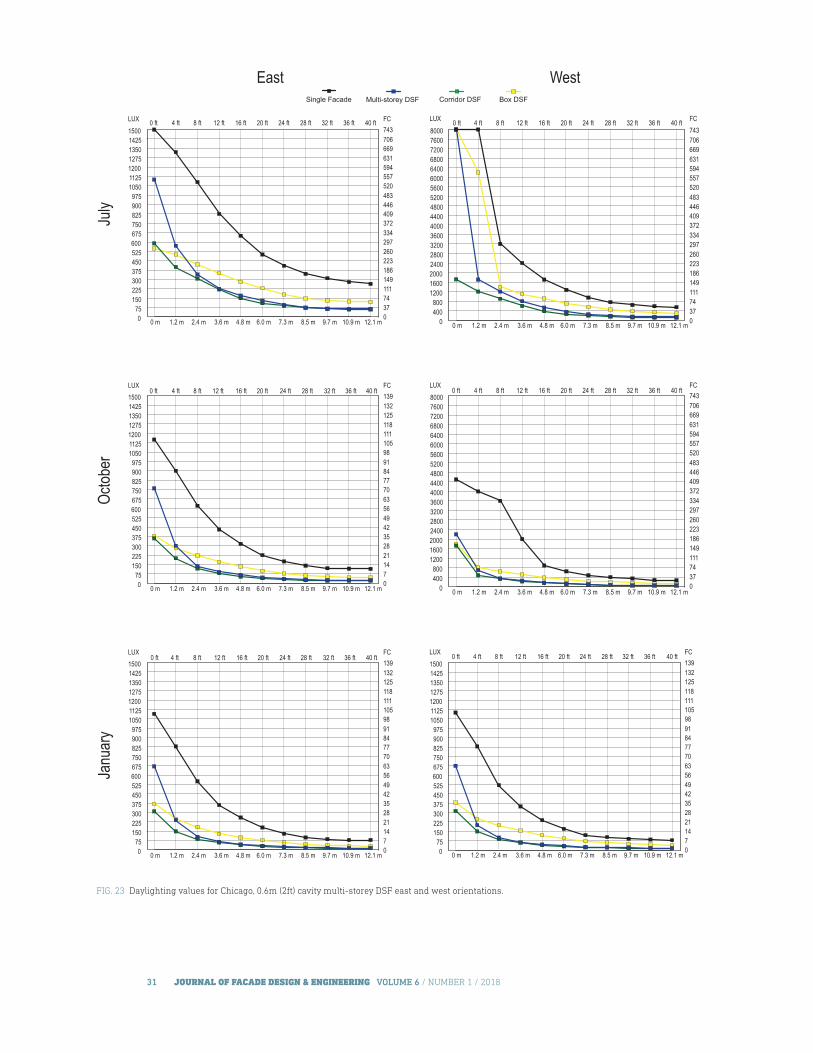
façade, but reduces as the distance from the façade increases, as seen in Figures 22 and 23. For San
Francisco, DSF performance during summer months is worse compared to previously mentioned
cities, as the decreasing latitude results in the sun being higher in the sky. The box window DSF
with a 0.6 m (2 ft) cavity brings in the most amount of light across the full 12.2 m (40 ft) depth of the
space, except within the first 0.3m (1 ft), where the multi-storey DSF outperforms all others. In July,
the one with a westerly orientation experiences the greatest variation in light levels (as seen in
Figure 23), while all orientations during January experience the least variation. The multi-storey DSF
performs best with a 0.9 m (3 ft) cavity depth and outperforms all other DSFs with this depth. Miami’s
daylighting results are unique in comparison to other locations. The north and east façades feature
lower lighting levels than the south and west during summer months, as is typically with the other
locations. The southern façade is the only orientation that does not have very high daylight levels
during July, for all façade types, while the western orientation has extremely high values during
the summer months. In general, the daylighting performance of the single skin façade is the best,
followed by the multi-storey DSF, the corridor DSF, and finally the box DSF. The box DSF appears to
most effectively transmit light into the interior when a 0.6 m (2 ft) cavity is used. The box DSF with
a 0.9 m (3 ft) cavity performs poorly when compared to other façade types. The multi-storeey DSF
performs best close to the perimeter, but daylight levels significantly reduce farther into the space.
Both the multi-storey DSF and corridor DSF perform better than the box DSF close to the façade,
but values quickly diminish as distance increases. Miami features winter lighting levels that are
higher than the other analysed cities. The north orientation during the winter months sees the most
consistency in lighting levels for all DSF types in the 0.6 m (2 ft) cavity.
Daylighting performance was also analysed using a 500 lux (46 fc) threshold to see what percentage
of the 12.2 m (40 ft) x 12.2 m (40 ft) office space floor would be adequately daylit for each façade type.
The north façade data indicates that the multi-storey and corridor DSF perform better with a 0.9 m
(3 ft) cavity, while the box window performs best with a 0.6 m (2 ft) cavity, as seen in Table 14. During
the month of July, the northern locations saw greater variation in the result of the DSF types (Duluth:
0% to 30%), while southern locations saw more uniform results across five of the six DSF

29 JOURNAL OF FACADE DESIGN & ENGINEERING VOLUME 6 / NUMBER 1 / 2018
ORIENTATION TIME FAÇADE TYPE DULUTH CHICAgO SAN FRANCISCO MIAMI
North July Single 46% 54% 56% 57%
Multi-storey with.6 m (2 ft) air cavity 7% 14% 17% 24%
Multi-storey with .9 m (3 ft) air cavity 30% 33% 35% 37%
Corridor with.6 m (2 ft) air cavity 6% 7% 8% 21%
Corridor with .9 m (3 ft) air cavity 13% 14% 16% 22%
Box window with.6 m (2 ft) air cavity 10% 13% 17% 22%
Box window with .9 m (3 ft) air cavity 0% 0% 0% 4%
October Single 18% 24% 23% 30%
Multi-storey with.6 m (2 ft) air cavity 4% 5% 4% 7%
Multi-storey with .9 m (3 ft) air cavity 5% 7% 8% 17%
Corridor with.6 m (2 ft) air cavity 0% 0% 0% 2%
Corridor with .9 m (3 ft) air cavity 0% 0% 3% 1%
Box window with.6 m (2 ft) air cavity 0% 0% 0% 0%
Box window with .9 m (3 ft) air cavity 0% 0% 0% 0%
January Single 17% 24% 27% 52%
Multi-storey with.6 m (2 ft) air cavity 3% 4% 6% 8%
Multi-storey with .9 m (3 ft) air cavity 0% 5% 14% 20%
Corridor with.6 m (2 ft) air cavity 0% 0% 0% 2%
Corridor with .9 m (3 ft) air cavity 0% 0% 5% 7%
Box window with.6 m (2 ft) air cavity 0% 0% 0% 6%
Box window with .9 m (3 ft) air cavity 0% 0% 0% 0%
TABLE 14 Percent of the floor area that has an illuminance value of 500 lux (46 fc) or more at ground level in a northern orientation.
ORIENTATION TIME FAÇADE TYPE DULUTH CHICAgO SAN FRANCISCO MIAMI
East July Single 46% 50% 54% 55%
Multi-storey with.6 m (2 ft) air cavity 7% 13% 15% 16%
Multi-storey with .9 m (3 ft) air cavity 27% 30% 31% 36%
Corridor with.6 m (2 ft) air cavity 0% 6% 8% 10%
Corridor with .9 m (3 ft) air cavity 16% 17% 24% 20%
Box window with.6 m (2 ft) air cavity 6% 10% 20% 24%
Box window with .9 m (3 ft) air cavity 0% 0% 0% 0%
October Single 23% 27% 29% 31%
Multi-storey with.6 m (2 ft) air cavity 7% 6% 7% 7%
Multi-storey with .9 m (3 ft) air cavity 11% 12% 26% 20%
Corridor with.6 m (2 ft) air cavity 0% 0% 0% 0%
Corridor with .9 m (3 ft) air cavity 0% 0% 3% 4%
Box window with.6 m (2 ft) air cavity 0% 0% 0% 1%
Box window with .9 m (3 ft) air cavity 0% 0% 0% 0%
January Single 16% 23% 26% 33%
Multi-storey with.6 m (2 ft) air cavity 7% 4% 5% 8%
Multi-storey with .9 m (3 ft) air cavity 0% 4% 14% 23%
Corridor with.6 m (2 ft) air cavity 0% 0% 0% 2%
Corridor with .9 m (3 ft) air cavity 0% 1% 1% 7%
Box window with.6 m (2 ft) air cavity 0% 0% 0% 6%
Box window with .9 m (3 ft) air cavity 0% 0% 0% 0%
TABLE 15 Percent of the floor area that has an illuminance value of 500 lux (46 fc) or more at ground level in an eastern orientation.

30 JOURNAL OF FACADE DESIGN & ENGINEERING VOLUME 6 / NUMBER 1 / 2018
North
July
Octob
erJa
nuar
y
South
0400800
120016002000240028003200360040004400480052005600600064006800720076008000
Box DSFCorridor DSFMultistory DSFSingle Facade40ft36ft32ft28ft24ft20ft16ft12ft8ft4ft0ftLUX FC
0 m 1.2 m 2.4 m 3.6 m 4.8 m 6.0 m 7.3 m 8.5 m 9.7 m 10.9 m 12.1 m 03774111149186223260297334372409446483520557594631669706743
0400800
120016002000240028003200360040004400480052005600600064006800720076008000
0400800120016002000240028003200360040004400480052005600600064006800720076008000
Box DSFCorridor DSFMultistory DSFSingle Facade
40 ft36 ft32 ft28 ft24 ft20 ft16 ft12 ft8 ft4 ft0 ftFC
0 m 1.2 m 2.4 m 3.6 m 4.8 m 6.0 m 7.3 m 8.5 m 9.7 m 10.9 m 12.1 m03774111149186223260297334372409446483520557594631669706743
LUX
075
150225300375450525600675750825900975
1050112512001275135014251500
Box DSFCorridor DSFMultistory DSFSingle Facade
40 ft36 ft32 ft28 ft24 ft20 ft16 ft12 ft8 ft4 ft0 ftFC
0 m 1.2 m 2.4 m 3.6 m 4.8 m 6.0 m 7.3 m 8.5 m 9.7 m 10.9 m 12.1 m
LUX
0714212835424956637077849198105111118125132139
075
150225300375450525600675750825900975
1050112512001275135014251500
Box DSFCorridor DSFMultistory DSFSingle Facade40ft36ft32ft28ft24ft20ft16ft12ft8ft4ft0ft FC
0 m 1.2 m 2.4 m 3.6 m 4.8 m 6.0 m 7.3 m 8.5 m 9.7 m 10.9 m 12.1 m
LUX
0714212835424956637077849198105111118125132139
075
150225300375450525600675750825900975
1050112512001275135014251500
Box DSFCorridor DSFMultistory DSFSingle Facade
40ft36ft32ft28ft24ft20ft16ft12ft8ft4ft0ft FC
0 m 1.2 m 2.4 m 3.6 m 4.8 m 6.0 m 7.3 m 8.5 m 9.7 m 10.9 m 12.1 m
LUX
0714212835424956637077849198105111118125132139
075
150225300375450525600675750825900975
1050112512001275135014251500
Box DSFCorridor DSFMultistory DSFSingle Facade
40 ft36 ft32 ft28 ft24 ft20 ft16 ft12 ft8 ft4 ft0 ftFC
0 m 1.2 m 2.4 m 3.6 m 4.8 m 6.0 m 7.3 m 8.5 m 9.7 m 10.9 m 12.1 m
LUX
0714212835424956637077849198105111118125132139
Box DSFCorridor DSFMulti stor y DSFSingle Facade
FIg. 22 Daylighting values for Chicago, .6m (2ft) cavity multi-storey DSF north and south orientations.
31 JOURNAL OF FACADE DESIGN & ENGINEERING VOLUME 6 / NUMBER 1 / 2018
EastJu
lyOc
tober
Janu
ary
West
075
150225300375450525600675750825900975
1050112512001275135014251500
Box DSFCorridor DSFMultistory DSFSingle Facade
40 ft36 ft32 ft28 ft24 ft20 ft16 ft12 ft8 ft4 ft0 ft FC
0 m 1.2 m 2.4 m 3.6 m 4.8 m 6.0 m 7.3 m 8.5 m 9.7 m 10.9 m 12.1 m03774111149186223260297334372409446483520557594631669706743
LUX
075
150225300375450525600675750825900975
1050112512001275135014251500
Box DSFCorridor DSFMultistory DSFSingle Facade
40 ft36 ft32 ft28 ft24 ft20 ft16 ft12 ft8 ft4 ft0 ftFC
0 m 1.2 m 2.4 m 3.6 m 4.8 m 6.0 m 7.3 m 8.5 m 9.7 m 10.9 m 12.1 m
LUX
0714212835424956637077849198105111118125132139
075
150225300375450525600675750825900975
1050112512001275135014251500
Box DSFCorridor DSFMultistory DSFSingle Facade
40 ft36 ft32 ft28 ft24 ft20 ft16 ft12 ft8 ft4 ft0 ftFC
0 m 1.2 m 2.4 m 3.6 m 4.8 m 6.0 m 7.3 m 8.5 m 9.7 m 10.9 m 12.1 m0714212835424956637077849198105111118125132139
LUX
0400800
120016002000240028003200360040004400480052005600600064006800720076008000
Box DSFCorridor DSFMultistory DSFSingle Facade
40 ft36 ft32 ft28 ft24 ft20 ft16 ft12 ft8 ft4 ft0 ftLUX FC
0 m 1.2 m 2.4 m 3.6 m 4.8 m 6.0 m 7.3 m 8.5 m 9.7 m 10.9 m 12.1 m 03774111149186223260297334372409446483520557594631669706743
0400800
120016002000240028003200360040004400480052005600600064006800720076008000
Box DSFCorridor DSFMultistory DSFSingle Facade
40 ft36 ft32 ft28 ft24 ft20 ft16 ft12 ft8 ft4 ft0 ftLUX FC
0 m 1.2 m 2.4 m 3.6 m 4.8 m 6.0 m 7.3 m 8.5 m 9.7 m 10.9 m 12.1 m03774111149186223260297334372409446483520557594631669706743
075
150225300375450525600675750825900975
1050112512001275135014251500
Box DSFCorridor DSFMultistory DSFSingle Facade
40 ft36 ft32 ft28 ft24 ft20 ft16 ft12 ft8 ft4 ft0 ft FC
0 m 1.2 m 2.4 m 3.6 m 4.8 m 6.0 m 7.3 m 8.5 m 9.7 m 10.9 m 12.1 m
LUX
0714212835424956637077849198105111118125132139
Box DSFCorridor DSFMulti stor y DSFSingle Facade
FIg. 23 Daylighting values for Chicago, 0.6m (2ft) cavity multi-storey DSF east and west orientations.

32 JOURNAL OF FACADE DESIGN & ENGINEERING VOLUME 6 / NUMBER 1 / 2018
types (Miami: 21% to 37%). During intermediate and winter months, the daylighting performance at
higher latitudes decreased significantly, while performance in lower latitudes saw less of a reduction.
In January, 54% of the results showed that there would not be sufficient daylight within the interior
space. There is a significant reduction in performance between the 0.9 m (3 ft) and 0.6 m (2 ft)
multi-storey façade during summer months. During the intermediate and winter months 0.6 m (2 ft)
multi-storey DSFs perform more consistently across all latitudes than their 0.9 m (3 ft) counterpart,
although at reduced light levels. The 0.9 m (3 ft) box DSF is the poorest performer.
The east façade performs similarly to the northern façade, as seen in Table 15. Data indicated that
the multi-storey with a 0.9 m (3 ft) cavity performs the best in most cases, out of all DSF types.
The multi-storey with a 0.9 m (3 ft) cavity during July naturally illuminates 27 - 36% of the office
space. During intermediate months, it daylights 11 to 20% of the floor area, while during winter
months it provides 0 to 23% daylighting. This façade shows less variation in daylighting values in
Miami across seasons, while northern latitudes see a larger variation from summer to winter. The 0.6
m (2 ft) multi-storey DSF shows minimal variation in daylight percentages; observed values decrease
during intermediate and winter months, but remain relatively consistent across latitudes, unlike
steep drop-offs in values observed with the 0.9 m (3 ft) multi-storey DSF (particularly in the winter).
The 0.9 m (3 ft) box window DSF performs poorly with daylight percentages of 0% observed across
all times of year. The 0.6 m (2 ft) box window and corridor DSFs admit some daylight during summer
months (0 to 24%), but admit an average of 0% during intermediate and winter months.
The southern orientation provides significantly higher daylighting percentages than north or eastern
orientations, as seen in Table 16. It was observed that locations in higher latitudes saw greater
light levels during July and October, while lower latitudes saw greater levels during the winter.
Both summer and intermediate results indicate that significant daylighting can be achieved, with
less variation across seasons compared to the other orientations. However, winter months show a
significant reduction in daylighting values. Data indicates that the 0.9 m (3 ft) cavity multi-storey
DSF performs best out of all DSF types, with the summer months seeing 37 to 46% of the space
daylit above the threshold. During intermediate months, daylighting values range from 40 to 49%
of the floor area, while the values during winter range from 0 to 20%. The second best performing
DSF varies for each season. The 0.9 m (3 ft) corridor DSF performs best in the summer, while the
0.6 m (2 ft) box window performs best in October and the 0.6 m (2 ft) multi-storey in the winter.
The northern latitudes saw less variation across all DSF types than the southern latitudes. Winter
months provide the lowest levels of daylighting, with daylit floor percentages hovering around
0% for more than half of the DSF types. Overall, southern oriented DSFs perform best during
intermediate and summer months.
The results for west orientation indicate that it has the highest potential for DSF daylighting during
summer months, as seen in Table 17. However, all of the data indicated large amounts of glare in the
first 0 to 1.2 m (0 to 4 ft) from the façade. This contributed to higher light levels deeper in the space,
but if solar shading is used to reduce glare, light levels will be reduced further into the space. This
was the only orientation in which the single glazed façade resulted in values of 100% for all climates.
During the summer, the 0.6 m (2 ft) box window DSF performed the best in Duluth (67%) and Chicago
(66%), while the 0.9 m (3 ft) multi-storey DSF performed the best in San Francisco (54%) and Miami
(52%). During the intermediate months, the 0.9 m (3 ft) multi-storey DSF performed the best (35
to 37%), while in January it performed the best in all locations except Duluth. Minimal daylighting
percentages are provided during winter months (although higher than north and east orientations).

33 JOURNAL OF FACADE DESIGN & ENGINEERING VOLUME 6 / NUMBER 1 / 2018
ORIENTATION TIME FAÇADE TYPE DULUTH CHICAgO SAN FRANCISCO MIAMI
South July Single 70% 70% 60% 55%
Multi-storey with.6 m (2 ft) air cavity 34% 25% 24% 24%
Multi-storey with .9 m (3 ft) air cavity 46% 45% 45% 37%
Corridor with.6 m (2 ft) air cavity 25% 18% 17% 13%
Corridor with .9 m (3 ft) air cavity 42% 30% 29% 28%
Box window with.6 m (2 ft) air cavity 40% 38% 33% 24%
Box window with .9 m (3 ft) air cavity 23% 20% 15% 11%
October Single 63% 60% 64% 64%
Multi-storey with.6 m (2 ft) air cavity 18% 16% 20% 18%
Multi-storey with .9 m (3 ft) air cavity 49% 42% 44% 40%
Corridor with.6 m (2 ft) air cavity 18% 14% 15% 15%
Corridor with .9 m (3 ft) air cavity 37% 30% 30% 30%
Box window with.6 m (2 ft) air cavity 38% 37% 38% 34%
Box window with .9 m (3 ft) air cavity 36% 24% 20% 20%
January Single 17% 22% 26% 33%
Multi-storey with.6 m (2 ft) air cavity 3% 4% 6% 8%
Multi-storey with .9 m (3 ft) air cavity 0% 5% 15% 20%
Corridor with.6 m (2 ft) air cavity 0% 0% 0% 2%
Corridor with .9 m (3 ft) air cavity 0% 0% 1% 7%
Box window with.6 m (2 ft) air cavity 0% 0% 0% 6%
Box window with .9 m (3 ft) air cavity 0% 0% 0% 0%
TABLE 16 Percent of the floor area that has an illuminance value of 500 lux (46 fc) or more at ground level in a southern orientation.
ORIENTATION TIME FAÇADE TYPE DULUTH CHICAgO SAN FRANCISCO MIAMI
West July Single 100% 100% 100% 100%
Multi-storey with.6 m (2 ft) air cavity 40% 42% 36% 36%
Multi-storey with .9 m (3 ft) air cavity 51% 56% 54% 52%
Corridor with.6 m (2 ft) air cavity 33% 35% 30% 27%
Corridor with .9 m (3 ft) air cavity 43% 46% 44% 37%
Box window with.6 m (2 ft) air cavity 67% 66% 50% 47%
Box window with .9 m (3 ft) air cavity 29% 36% 28% 27%
October Single 49% 58% 49% 56%
Multi-storey with.6 m (2 ft) air cavity 7% 15% 16% 17%
Multi-storey with .9 m (3 ft) air cavity 37% 35% 36% 37%
Corridor with.6 m (2 ft) air cavity 8% 10% 10% 13%
Corridor with .9 m (3 ft) air cavity 27% 29% 27% 27%
Box window with.6 m (2 ft) air cavity 25% 32% 28% 30%
Box window with .9 m (3 ft) air cavity 7% 14% 16% 15%
January Single 17% 22% 27% 32%
Multi-storey with.6 m (2 ft) air cavity 3% 4% 5% 8%
Multi-storey with .9 m (3 ft) air cavity 0% 5% 13% 20%
Corridor with.6 m (2 ft) air cavity 0% 0% 0% 2%
Corridor with .9 m (3 ft) air cavity 0% 0% 0% 7%
Box window with.6 m (2 ft) air cavity 0% 0% 0% 6%
Box window with .9 m (3 ft) air cavity 0% 0% 0% 0%
TABLE 17 Percent of the floor area that has an illuminance value of 500 lux (46 fc) or more at ground level in a western orientation.

34 JOURNAL OF FACADE DESIGN & ENGINEERING VOLUME 6 / NUMBER 1 / 2018
FIg. 24 Radiance illuminance plan renderings for Chicago, 0.6m (2ft) cavity multi-storey DSF north and south orientations.

35 JOURNAL OF FACADE DESIGN & ENGINEERING VOLUME 6 / NUMBER 1 / 2018
FIg. 25 Radiance illuminance plan renderings for Chicago, 0.6m (2ft) cavity multi-storey DSF east and west orientations.

36 JOURNAL OF FACADE DESIGN & ENGINEERING VOLUME 6 / NUMBER 1 / 2018
FIg. 26 Radiance illuminance interior renderings for Chicago, 0.6m (2ft) cavity multi-storey DSF north and south orientations.

37 JOURNAL OF FACADE DESIGN & ENGINEERING VOLUME 6 / NUMBER 1 / 2018
FIg. 27 Radiance illuminance interior renderings for Chicago, 0.6m (2ft) cavity multi-storey DSF east and west orientations.

38 JOURNAL OF FACADE DESIGN & ENGINEERING VOLUME 6 / NUMBER 1 / 2018
5 CONCLUSION
The purpose of this research was to investigate thermal, energy, and daylight performance of
different types of DSFs in various climates. The research addressed several aspects: 1) thermal
performance of different types of DSFs (box window, corridor type, and multi-storey); 2) the effects
of outside temperature and solar radiation on air cavity temperature and airflow patterns within the
air cavity of different types of DSFs; 3) energy performance of DSFs in various climate types; 4) the
effects of DSFs on heating, cooling, and lighting loads; and 5) daylight performance of DSFs, taking
into account façade characteristics, orientation, and different sky conditions.
Research methods consisted of simulations and modelling, with different modelling techniques
being used for specific parts of the study. Specifically, 2D heat transfer analysis was used to
investigate the thermal behaviour of analysed façade types under varying exterior temperatures, and
to calculate heat transfer coefficients. CFD analysis was used to determine 3D heat flow within the air
cavity of investigated DSFs, as well as airflow patterns and air velocity. Energy modelling was used
to investigate energy performance, where south-oriented office space was modelled for all different
climate types, which would be enclosed by the investigated façades. The base case considered
a single skin façade, consisting of a standard curtain wall. Daylight simulations were used to
investigate daylight performance.
Results of heat transfer analysis show that all DSF types have much lower U-values than a standard
curtain wall, indicating that these façade types would have improved thermal performance.
The differences between different DSF typologies are relatively small. Multi-storey DSF has the
smallest U-value, followed by box window and corridor type DSF. Results of CFD analysis showed
that solar radiation would have an impact on the temperature and air flow within the air cavity of
investigated DSFs. Within the cavity of multi-storey DSF, there is a temperature fluctuation caused
by solar radiation, exterior and interior temperature, as well as the ventilation effects. However,
the temperature change is not significant, mainly because of the configuration characteristics of
the multi-storey DSF. The corridor DSF had a more turbulent air flow pattern within the air cavity.
Box window DSF had the smallest ranges in temperatures of the air cavity, which could be caused by
the geometry and components, since this type has horizontal and vertical divisions that limit the heat
transfer through the cavity. However, this DSF type exhibited more turbulence within the air cavity
compared to other DSFs. Comparison of 2D heat transfer and CFD analysis results indicated slight
variations in results, which can be attributed to different calculation methods.
Results of energy modelling showed that all DSF types would improve energy performance compared
to the base case scenario (standard curtain wall). However, the energy savings vary depending on
the climate and DSF type. In heating-dominated climates, heating loads are significantly reduced,
as well as cooling loads due to lower U-values of investigated DSFs. In cooling-dominated climates,
cooling loads are also lower for DSFs. Results also indicate that there is very little variation in
energy consumption between different types of DSFs (box window, corridor type, and multi-
storey DSF). The box window DSF type with openings (holes and vents) was found to be the best
performing in terms of reducing EUI across all climate types. The multi-storey DSF with holes
was found to be the worst performing for EUI across all climate types. All DSF types saw increased
energy consumption for lighting, due to the geometry and additional façade layer. As expected,
southern climates saw greater energy usage due to high sun angles, while northern climates fared
better due to lower sun angles.

39 JOURNAL OF FACADE DESIGN & ENGINEERING VOLUME 6 / NUMBER 1 / 2018
Results indicate that all types of DSFs would decrease daylight levels compared to a conventional
curtain wall; however, the differences between lighting levels are dependent on the orientation, air
cavity depth, façade type, and climate. Moreover, the results show that the discrepancies are largest
in the area closest to the glazed façade, and that the differences between lighting levels decrease
with the depth of the interior space. Results indicate that latitude and sky conditions are important
for daylight performance of DSFs, as well as façade orientation. DSFs provide most daylighting
during summer months, with the highest values observed in south and west orientations. DSFs
provide most daylighting during intermediate months in south and west orientations, with minimal
daylighting provided in north and east orientations. DSF daylighting during winter months is
consistently low in all orientations, due to overcast sky conditions. Cavity depth appears to influence
DSF daylighting in ways that were not anticipated. Multi-storey and corridor type DSFs showed
noticeably better performance with 0.9 m (3 ft) cavities, compared to 0.6 m (2 ft) cavities. Box window
DSFs showed better performance in a 0.6 m (2 ft) configuration than with a 1.9 m (3 ft) cavity.
The results of this research can be used in design decision making when implementing DSFs.
Specifically, a selection of DSF typologies that are suitable for specific climate types, as well as air
cavity depth and orientation can be made, taking into account the effects on thermal performance,
energy, and daylight.
References
Aksamija, A. (2013). Sustainable façades: design methods for high-performance building envelopes. Hoboken, NJ: John Wiley & Sons.ASHRAE. (2014). ANSI/ASHRAE/IES/USGBC Standard 189-2014. Standard for the design of high-performance green buildings.
Atlanta, gA: American Society of Heating, Refrigerating, and Air Conditioning Engineers.ASHRAE. (2013a). ANSI/ASHRAE Standard 55-2013. Thermal environmental conditions for human occupancy. Atlanta, gA: Ameri-
can Society of Heating, Refrigerating, and Air Conditioning Engineers.ASHRAE. (2013b). ANSI/ASHRAE/IES Standard 90.1-2013. Energy standard for buildings except low-rise residential buildings.
Atlanta, gA: American Society of Heating, Refrigerating, and Air Conditioning Engineers.Brandl, D., Mach, T., grobbauer, M., & Hochenauer, C. (2014). Analysis of ventilation effects and the thermal behavior of multifunc-
tional façade elements with 3D CFD models. Energy and Buildings, 85: 305–320.Bueno, B., Wienold, J., Katsifaraki, A., & Kuhn, T. (2015). A Radiance-based modelling approach to assess the thermal and daylight-
ing performance of complex fenestration systems in office spaces. Energy and Buildings, 94(1), 10-20. Eicker, U., Fux, V., Bauer, U., Mei, L., & D. Infield. (2008). Façades and summer performance of buildings. Energy and Buildings, 40,
600-611.gelesz, A., & Reith, A. (2015). Climate-based performance evaluation of double skin façades by building energy modelling in Cen-
tral Europe. Energy Procedia, 78, 555-560.gratia, E., & De Herde, A. (2007). Are energy consumptions decreased with the addition of a double-skin? Energy and Buildings, 39,
605-619.guardo, A, Coussirat, M., Valero, C., & Egusquiza, E. (2011). Assessment of the performance of lateral ventilation in double-glazed
façades in Mediterranean climates. Energy and Buildings, 43, 2539-2547.Kim, S., & Song, K. (2007). Determining photosensor conditions of a daylight dimming control system using different double-skin
envelope configurations. Indoor Built Environment, 16, 411-425.Konis, K. (2013). Evaluating daylighting effectiveness and occupant visual comfort in a side-lit open-plan office building in San
Francisco, California. Building and Environment, 59, 662-677. NFRC (2004). NFRC 100-2004: Procedure for determining fenestration product U-factors. Washington, DC: National Fenestration
Rating Council.Pomponi, F., Piroozfar, P., Southall, R., Ashton, P., & Farr, E. (2016). Energy performance of double-skin façades in temperate cli-
mates: a systematic review and meta-analysis. Renewable and Sustainable Energy Reviews, 54, 1525-1536.Shameri, M., Alghoul, M., Elayeb O., Fauzi, M., Zain, M., Alrubaih, S., Amir, H., & Sopian, K. (2013). Daylighting characteristics of
existing double-skin façade office buildings. Energy and Buildings, 59, 279-286. Viljoen, A., Dubiel, J., Wilson, M., & Fontoynont, M. (1997). Investigations for improving the daylighting potential of double-skinned
office buildings. Solar Energy, 59(4), 179-194. Zhou, J., & Youming Chen. (2010). A review on applying ventilated double-skin façade to buildings in hot-summer and cold-winter
zone in China. Renewable and Sustainable Energy Reviews, 14, 1321-1328.


![NUMERICAL ANALYSIS OF THERMAL SPRAY COATING PROCESSraiith.iith.ac.in/766/1/ME10M09.pdf · thermal conductivity [6]. 1.3 Different Methods of Thermal Spraying There are different types](https://img.pdfslide.net/doc/110x75/606b6207416417364335f80a/numerical-analysis-of-thermal-spray-coating-thermal-conductivity-6-13-different.jpg)