Embed Size (px)
Citation preview
Department of Applied Geology
Thermal History and Deep Overpressure Modelling in the Northern
Carnarvon Basin, North West Shelf, Australia
ACKNOWLEDGEMENTS I wish to extend my gratitude to the following people and organisations for their assistance and support during the course of this study. – Professor Mike F. Middleton, my principal supervisor, for his supervision and
supporting my study at the Centre of Excellence in Petroleum Geology (CEPG), Department of Applied Geology, Curtin University of Technology, for giving me the benefit of numerous discussions and guidance throughout this doctoral program, providing invaluable assistance and feedback, correcting paper drafts, reading all chapters including detailed comments and providing funding for my stipend and capital expenses for hardware and software costs, attendance of academic activities and thesis preparation costs.
– Professor Robert Alexander, my previous supervisor, who encouraged me to
apply for an International Postgraduate Research Scholarship (IPRS) and a Curtin University of Technology Scholarship (CUTS), for supporting my study at the Centre for Petroleum and Environmental Organic Geochemistry (CPEOG), Department of Applied Chemistry, Curtin University of Technology, and for his guidance in various aspects of petroleum organic geochemistry and financial support.
– Associate Professor Lindsay Collins, my co-supervisor, who encouraged me to
undertake the course and for his guidance and assistance, and kindness to me through my research study.
– Professor Robert I. Kagi who encouraged me to apply for IPRS and CUTS,
supported and guided my organic geochemical laboratory work. – Associate Professor Alan M. Tait for his discussions, suggestions, reviewed
papers, corrected all chapters of my thesis and English language assistance. – Dr. Alex R. Kaiko who took a kind interest in my work, provided some technical
advice, assisted in sampling and reviewed papers. – Dr. Chunqing Jiang for his geochemical analyses of source rock samples and for
many useful discussions. – Dr. Trever Bastow for his analysis of GC-MS of a source rock sample.
– Mr. Garrie Meddings for assistance in thin section preparations of claystone, and
Mr. Dale Longman for free use of the CSIRO Chemical Laboratory facilities. – The Department of Employment, Education and Training of the Australian
government who awarded me an IPRS covering my tuition fees and health cover for my family.
– Curtin University of Technology who awarded me a CUTS providing a living
allowance.
– China University of Geosciences for supporting my studies in Australia. – The American Association of Petroleum Geologists who awarded me a grant-in
aid of the AAPG Foundation (1999) to assist in my study of source rocks. – The Department of Minerals and Energy of Western Australia who provided me
with great help in collecting open-file data. – Platte River Associates, Inc. for their support on providing the academic loan of
the BasinMod software package for basin modelling, for frequent answering questions and providing technical assistance.
– The Australian Geological Survey Organization for their help in supplying about
1600 km interpreted deep seismic data, some velocity data and some digital well-log data.
– The Geological Survey of Canada, Calgary who provided free geochemical
analyses of Rock-Eval, GC and GC-MS for 17 source rock samples. – BHP Petroleum Pty. Ltd. for supplying 5 interpreted seismic lines. – CSIRO Petroleum who supplied the Eq VR (FAMM) data in 8 wells to support
this study. I wish to extend my thanks to all those who assisted me during this study, particularly, Professor Richard R. Hillis, Dr. Nancy Hunter, Dr. Maowen Li, Dr. Samuelsson, J., Dr. Peter R. Tingate, Dr. John Kennard, Dr. Daniel M. Jarvie, Ms. Rosie Emms, Ms. Henrietta Wong, Dr Lila W. Gurba and Mr. Ken Whitbread. My grateful thanks are also extended to all staff of CEPG and Department of Applied Geology at Curtin for their benevolence and help, particularly, Associate Professor Peter A. Cawood, Professor Simon A. Wilde, Professor Krishna K Sappal, Dr. Zhongrong Zhu, Mrs. Annette Labrooy and Mr. Peter Glover, and to Ph.D. students: Mr. Marcus Sweetapple, Mr. Tingguang Song, Mr. Xiao'ou Zhang, Mrs. Min Xu, Mr. Matthew Great and Mr. Annamalai Mahizhnan. Likewise, I wish to record my appreciation for help from all members of CPEOG and Department of Applied Chemistry at Curtin, particularly, Mr. Geoff Chidlow, Mr. Ian Sills, Dr. Ben van Aarssen, Dr. Michale Audino and Mrs. Joyce Wong. Finally, I wish to thank my wife, Juan Liu, and my son, Chen He, for their unwavering support, encouragement and patience that also made this study possible. I would also like to thank my parents and sisters for their encouragement and great support through this study.
ABSTRACT
The Northern Carnarvon Basin is the richest petroleum province in Australia. About
50 gas/condensate and oil fields, associated mainly with Jurassic source rocks, have
been discovered in the sub-basins and on the Rankin Platform since 1964. The basin
is located at the southern end of the North West Shelf of Australia. It can be mainly
subdivided into the Exmouth, Barrow, Dampier and Beagle Sub-basins, the Rankin
Platform and Exmouth Plateau. The sub-basins are rift-related grabens and half-
grabens developed during the Jurassic to the earliest Cretaceous and contain over 10
kilometres of Mesozoic and Cainozoic sedimentary rocks, among which are several
thousand meters of Jurassic rocks. The formations of the Jurassic and the lower part
of the Barrow Group of Early Cretaceous age in the sub-basins of the Northern
Carnarvon Basin were found to be overpressured with excess pressures of 5-29 MPa
at depths of 2900-3600 m indicated by repeat formation tests (RFTs) and drill stem
tests (DSTs). The characteristics of organic matter, thermal history and thermal
maturity, pressure seal and overpressure evolution in the sub-basins are crucial to a
proper understanding of the nature and dynamic processes of hydrocarbon
generation and migration in the basin.
Based on organic geochemical data, the important source rocks in the basin are
Jurassic organic-rich fine-grained rocks including the Murat Siltstone, the rift-
related Athol Formation and Dingo Claystone. The Mungaroo Formation of the
Middle-Upper Triassic contains gas-generating source rocks. These formations are
recognised to be organic rich based on 1256 values of the total organic carbon
content (TOC, %) from 17 wells. Average TOC values (calculated from samples
with TOC < 15 %) are about 2.19 % in the Mungaroo Formation, about 2.09 % in
the Murat Siltstone and about 1.74 % in the Athol Formation and Dingo Claystone.
Data from kerogen element analysis, Rock-Eval pyrolysis, visual kerogen
composition and some biomarkers have been used to evaluate the kerogen type in
the basin. It appears that type III kerogen is the dominant organic-matter type in the
Triassic and Jurassic source rocks, while the Dingo Claystone may contain some oil-
prone organic matter.
The vitrinite reflectance (Ro) data in some wells of the Northern Carnarvon Basin
are anomalously low. As a major thermal maturity indicator, the anomalously low
Ro data seriously hinder the assessment of thermal maturity in the basin. This study
differs from other studies in that it has paid more attention to Rock-Eval Tmax data.
Therefore, problems affecting Tmax data in evaluating thermal maturity were
investigated. A case study of contaminated Rock-Eval data in Bambra-2 and thermal
modelling using Tmax data in 16 wells from different tectonic subdivisions were
carried out. The major problems for using Tmax data were found to be contamination
by drilling-mud additives, natural bitumen and suppression due to hydrogen index
(HI) > 150 in some wells. Although the data reveal uncertainties and there is about
!3-10 % error for thermal modelling by using the proposed relationship of Ro and
Tmax, the "reliable" Tmax data are found to be important, and useful to assess thermal
maturity and reduce the influence of unexpectedly low Ro data.
This study analyzed the characteristics of deep overpressured zones and top pressure
seals, in detail, in 7 wells based on the observed fluid pressure data and
petrophysical data. The deep overpressured system (depth greater than 2650-3000
m) in the Jurassic formations and the lower part of the Barrow Group is shown by
the measured fluid pressure data including RFTs, DSTs and mud weights. The
highly overpressured Jurassic fine-grained rocks also exhibit well-log responses of
high sonic transit times and low formation resistivities. The deep overpressured
zone, however, may not necessarily be caused by anomalously high porosities due to
undercompaction. The porosities in the deep overpressured Jurassic rocks may be
significantly less than the well-log derived porosities, which may indicate that the
sonic-log and resistivity-log also directly respond to the overpressuring in the deep
overpressured fine-grained rocks of the sub-basins. Based on the profiles of fluid
pressure and well-log data in 5 wells of the Barrow Sub-basin, a top pressure seal
was interpreted to be consistent with the transitional pressure zone in the Barrow
Sub-basin. This top pressure seal was observed to consist of a rock layer of 60-80 %
claystone and siltstone. The depths of the rock layer range from 2650 m to 3300 m
with thicknesses of 300-500 m and temperatures of 110-135 oC. Based on the well-
log data, measured porosity and sandstone diagenesis, the rock layer seems to be
well compacted and cemented with a porosity range of about 2-5 % and calculated
permeabilities of about 10-19-10-22 m2.
This study performed thermal history and maturity modelling in 14 wells using the
BasinMod 1D software. It was found that the thermal maturity data in 4 wells are
consistent with the maturity curves predicted by the rifting heat flow history
associated with the tectonic regime of this basin. The maximum heat flows during
the rift event of the Jurassic and earliest Cretaceous possibly ranged from 60-70
mW/m2 along the sub-basins and 70-80 mW/m2 on the southern and central
Exmouth Plateau. This study also carried out two case studies of thermal maturity
and thermal modelling within the deep overpressured system in the Barrow and
Bambra wells of the Barrow Sub-basin. These case studies were aimed at
understanding whether overpressure has a determinable influence on thermal
maturation in this region. It was found that there is no evidence for overpressure-
related retardation of thermal maturity in the deep overpressured system, based on
the measured maturity, biomarker maturity parameters and 1D thermal modelling.
Therefore, based on the data analysed, overpressure is an insignificant factor in
thermal maturity and hydrocarbon generation in this basin.
Three seismic lines in the Exmouth, Barrow and Dampier Sub-basins were selected
and converted to depth cross-sections, and then 2D geological models were created
for overpressure evolution modelling. A major object of these 2D geological models
was to define the critical faults. A top pressure seal was also detected based on the
2D model of the Barrow Sub-basin. Two-dimensional overpressure modelling was
performed using the BasinMod 2D software. The mathematical 2D model takes into
consideration compaction, fluid thermal expansion, pressure produced by
hydrocarbon generation and quartz cementation. The sealed overpressured
conditions can be modelled with fault sealing, bottom pressure seal (permeabilities
of 10-23-10-25 m2) and top pressure seal (permeabilities of 10-19-10-22 m2). The
modelling supports the development of a top pressure seal with quartz cementation.
The 2D modelling suggests the rapid sedimentation rates can cause compaction
disequilibrium in the fine-grained rocks, which may be a mechanism for
overpressure generation during the Jurassic to the Early Cretaceous.
The data suggest that the present-day deep overpressure is not associated with the
porosity anomaly due to compaction disequilibrium and that compaction may be
much less important than recurrent pressure charges because most of the porosity in
the Jurassic source rocks has been lost through compaction and deposition rates
have been very slow since the beginning of the Cainozoic.
Three simple 1D models were developed and applied to estimate how rapidly the
overpressure dissipates. The results suggest that the present day overpressure would
be almost dissipated after 2 million years with a pressure seal with an average
permeability of 10-22 m2 (10-7 md). On the basis of numerous accumulations of oil
and gas to be expelled from the overpressured Jurassic source rocks in the basin and
the pressure seal modelling, it seems that the top pressure seal with permeabilities of
10-19-10-22 m2 (10-4-10-7 md) is not enough to retain the deep overpressure for tens of
millions of years without pressure recharging. Only if the permeabilities were 10-23
m2 (10-8 md) or less, would a long-lived overpressured system be preserved. This
study suggests that hydrocarbon generation, especially gas generation and thermal
expansion, within sealed conditions of low-permeability is a likely major cause for
maintaining the deep overpressure over the past tens of millions of years.
Keywords: Thermal history; Deep overpressure; Type III kerogen; Rock-Eval Tmax;
Thermal maturity; Palaeoheatflow modelling; Pressure seal; 2D deep overpressure
modelling; Pressure behaviour modelling; Overpressure generation; Northern
Carnarvon Basin
TABLE OF CONTENTS ACKNOWLEDGEMENTS ................................................................................... i ABSTRACT .......................................................................................................... iii LIST OF FIGURES.............................................................................................. xi LIST OF TABLES............................................................................................. xxii Part I Introduction and Regional Geology ....................................... 1 CHAPTER 1 INTRODUCTION ..................................................................... 2 1.1 Previous work and background of this study .................................................... 2
1.1.1 Previous work.......................................................................................... 2 1.1.2 Background of this study......................................................................... 4
1.2 Aims and objectives .......................................................................................... 6 1.2.1 Aims ........................................................................................................ 6 1.2.2 Objectives................................................................................................ 6
1.3 Methodology ..................................................................................................... 7 1.3.1 Geological method .................................................................................. 9 1.3.2 Basin modelling....................................................................................... 9
1.4 Data sources and sets....................................................................................... 11 1.4.1 Data sources .......................................................................................... 11 1.4.2 Data sets ................................................................................................ 13
CHAPTER 2 REGIONAL GEOLOGY ........................................................ 17 2.1 Location of study area ..................................................................................... 17 2.2 Stratigraphy ..................................................................................................... 17
2.2.1 Triassic .................................................................................................. 18 2.2.2 Jurassic .................................................................................................. 21 2.2.3 Cretaceous ............................................................................................. 22 2.2.4 Cainozoic............................................................................................... 23
2.3 Tectonic subdivisions, structures and faults.................................................... 24 2.3.1 Tectonic subdivisions ............................................................................ 24
2.3.2 Structures and faults .............................................................................. 24 2.4 Geological evolution ....................................................................................... 26
2.4.1 Pre-rift phase ......................................................................................... 26 2.4.2 Syn-rift phase ........................................................................................ 27 2.4.3 Post-rift phase........................................................................................ 29
Part II Source Rocks, Rock-Eval Tmax and Deep Overpressure................................................................................................... 30 CHAPTER 3 SOURCE ROCKS AND ORGANIC MATTER ................... 31 3.1 Source rocks .................................................................................................... 31 3.2 Richness of organic matter .............................................................................. 32 3.3 Type of organic matter .................................................................................... 38 3.4 Summary ......................................................................................................... 48
CHAPTER 4 ASSESSMENT OF ROCK-EVAL Tmax DATA IN THE BAMBRA-2 WELL: A CASE STUDY OF THE CONTAMINATED ROCK-EVAL DATA .......................................................................................... 49 4.1 Introduction ..................................................................................................... 49 4.2 Sources of Rock-Eval data .............................................................................. 51 4.3 Gas chromatography (GC) analysis ................................................................ 51 4.4 Discussion ....................................................................................................... 54 4.5 Summary ......................................................................................................... 58 CHAPTER 5 DEEP OVERPRESSURED SYSTEM AND TOP PRESSURE SEAL............................................................................................... 59 5.1 Introduction ..................................................................................................... 59 5.2 Overpressure and petrophysical data............................................................... 59
5.2.1 Measured fluid pressure data for overpressure ..................................... 60 5.2.2 Well-log data for overpressure.............................................................. 61 5.2.3 Petrophysical expression of the deep overpressured zone .................... 65
5.2.3.1 Jurassic overpressure in the Barrow Sub-basin ........................ 65 5.2.3.2 Jurassic overpressure in the Exmouth Sub-basin...................... 69 5.2.3.3 Jurassic overpressure in the Dampier Sub-basin ...................... 69 5.2.3.4 Overpressure in the Barrow Group of the Barrow Sub-basin... 70
5.3 Top pressure seal in the Barrow Sub-basin ..................................................... 71 5.4 Summary ......................................................................................................... 74 Part III One-dimensional Thermal History Modelling .................... 76 CHAPTER 6 ONE-DIMENSIONAL MODELS AND DATA SETS ......... 77 6.1 One-dimensional models ................................................................................. 77
6.1.1 Geohistory/burial history....................................................................... 77 6.1.2 Tectonic subsidence .............................................................................. 77 6.1.3 Heat flow ............................................................................................... 78 6.1.4 Temperature and thermal maturity ........................................................ 80
6.2 Data sets .......................................................................................................... 81 6.2.1 Stratigraphic data and porosity-depth relationship................................ 81 6.2.2 Geothermal parameters ......................................................................... 82 6.2.3 Thermal maturity................................................................................... 83 6.2.4 Eroded thickness ................................................................................... 84 6.2.5 Palaeobathymetry and sea-level variations ........................................... 85
CHAPTER 7 ONE-DIMENSIONAL HEAT FLOW AND THERMAL MATURITY MODELLING .............................................................................. 86 7.1 Introduction ..................................................................................................... 86 7.2 Data used in the study ..................................................................................... 88 7.3 Relationship between vitrinite reflectance (Ro) and Rock-Eval Tmax.............. 89 7.4 Modelling of tectonic subsidence and sedimentation rates ............................. 93 7.5 Modelling of heat flow and thermal maturity ................................................. 93
7.5.1 Thermal modelling for 2 wells in the Exmouth Sub-basin ................... 93 7.5.1.1 Jurabi-1 thermal modelling....................................................... 93 7.5.1.2 Zeewulf-1 thermal modelling ................................................... 97
7.5.2 Thermal modelling for 2 wells in the Barrow Sub-basin ...................... 98

7.5.2.1 Anchor-1 thermal modelling..................................................... 98 7.5.2.2 Bowers-1 thermal modelling .................................................... 98
7.5.3 Thermal modelling for 3 wells in the Dampier and Beagle Sub-basins ............................................................................... 103
7.5.3.1 Rosemary-1 thermal modelling .............................................. 103 7.5.3.2 Madeleine-1 thermal modelling.............................................. 103 7.5.3.3 Depuch-1 thermal modelling .................................................. 106
7.5.4 Thermal modelling for 2 wells on the Rankin Platform...................... 110 7.5.4.1 North Gorgon-1 thermal modelling ........................................ 110 7.5.4.2 North Rankin-1 thermal modelling......................................... 112
7.5.5 Thermal modelling for 2 wells on the Exmouth Plateau..................... 115 7.5.5.1 Investigator-1 thermal modelling............................................ 115 7.5.5.2 Jupiter-1 thermal modelling.................................................... 118
7.6 Summary ....................................................................................................... 118 CHAPTER 8 THERMAL MATURITY AND THERMAL MODELLING WITHIN THE OVERPRESSURED JURASSIC ROCKS IN THE BARROW AND BAMBRA WELLS................................. 122 8.1 Introduction ................................................................................................... 122 8.2 Thermal maturity........................................................................................... 124 8.3 Data sets for thermal maturity modelling...................................................... 126 8.4 Thermal maturity modelling.......................................................................... 131
8.4.1 Barrow-1 thermal modelling ............................................................... 131 8.4.2 Barrow Deep-1 thermal modelling...................................................... 133 8.4.3 Bambra-2 thermal modelling .............................................................. 138
8.5 Discussion ..................................................................................................... 144 8.6 Summary ....................................................................................................... 147 Part IV Two-dimensional Models, Deep Overpressure Modelling and Pressure Behaviour Modelling ................................ 148 CHAPATER 9 TWO-DIMENSIONAL MODELS AND DATA REQUIREMENTS FOR DEEP OVERPRESSURE MODELLING ........... 149 9.1 BasinMod 2D ................................................................................................ 149
9.1.1 Governing equations in the BasinMod 2D.......................................... 149 9.1.2 The models used in BasinMod 2D ...................................................... 151
9.2 Depth conversion for cross-sections and two-dimensional geological models .......................................................................................................... 153
9.2.1 Depth conversion for cross-sections ................................................... 153 9.2.2 Two-dimensional geological models .................................................. 155
9.3 Porosity and permeability.............................................................................. 158 9.4 Boundary conditions and data requirements ................................................. 164
9.4.1 Boundary conditions ........................................................................... 164 9.4.2 Data requirements ............................................................................... 165 9.4.3 Data sets .............................................................................................. 166
CHAPATER 10 TWO-DIMENSIONAL DEEP OVERPRESSURE MODELLING AND PRESSURE BEHAVIOUR MODELLING ................ 169 10.1 Introduction ................................................................................................. 169 10.2 Two-dimensional overpressure modelling in the Barrow Sub-basin .......... 173
10.2.1 Correlation between the predicted values and the observed data...... 173 10.2.1.1 Data from Bambra-2 for correlation ..................................... 173 10.2.1.2 Data from West Tryal Rocks-1 for correlation ..................... 175
10.2.2 Results of the BasinMod 2D modelling ............................................ 175 10.2.2.1 Sedimentation rates............................................................... 175 10.2.2.2 Porosity and permeability ..................................................... 175 10.2.2.3 Fluid pressure........................................................................ 182 10.2.2.4 General discussion ................................................................ 183
10.3 Two-dimensional overpressure modelling in the Exmouth Sub-basin ....... 186 10.3.1 Correlation between the calculated values and the observed data .... 186
10.3.1.1 Fluid pressure correlation ..................................................... 186 10.3.1.2 Temperature and maturity correlation .................................. 186
10.3.2 Results of the BasinMod 2D modelling ............................................ 189 10.3.2.1 Sedimentation rates............................................................... 189 10.3.2.2 Porosity and permeability ..................................................... 189 10.3.2.3 Fluid pressure........................................................................ 190
10.4 Two-dimensional overpressure modelling in the Dampier Sub-basin ........ 195 10.4.1 Correlation between the calculated values and the observed data .... 198
10.4.1.1 Fluid pressure correlation ..................................................... 198 10.4.1.2 Temperature and maturity correlation .................................. 198
10.4.2 Results of the BasinMod 2D modelling ............................................ 198 10.4.2.1 Sedimentation rates............................................................... 198 10.4.2.2 Porosity and permeability ..................................................... 201 10.4.2.3 Fluid pressure........................................................................ 202
10.5 Pressure behaviour modelling ..................................................................... 207 10.6 Discussion ................................................................................................... 211
10.6.1 Pressure seal ...................................................................................... 211 10.6.2 Possible major mechanisms for the deep overpressure ..................... 215
10.6.2.1 Compaction disequilibrium................................................... 215 10.6.2.2 Hydrocarbon generation ....................................................... 217
10.7 Summary ..................................................................................................... 218 CONCLUSIONS AND LIMITATIONS ......................................................... 220 REFERENCES .................................................................................................. 227 WELL COMPLETION REPORTS ................................................................ 249 Appendix 1 Measured bulk density and matrix density for 6 claystone samples from the conventional core in Bambra-2............................................... 252 Appendix 2 110/11 seismic line (interpreted by Australian Geological Survey Organisation) in the Exmouth Sub-basin ................................................ 253 Appendix 3 101R/09 seismic line (interpreted by Australian Geological Survey Organisation) in the Dampier Sub-basin................................................. 254 Appendix 4 Horizon legend for 110/11 and 101R/09 seismic lines................... 255
Appendix 5 List of published papers and conference presentations during this study .................................................................................................. 256
LIST OF TABLES Table Page 1-1 Samples from the Bambra-2 well for geochemical analyses .......................... 12 1-2 The data from 23 wells in the Northern Carnarvon Basin for the
modelling ........................................................................................................ 15 1-3 Seismic lines used in this study collected from the Department of
Minerals and Energy of Western Australia .................................................... 16 3-1 Statistics of total organic matter (TOC, %) in 17 wells from various
tectonic subdivisions of the Northern Carnarvon Basin ................................. 33 3-2 Visual compositions of organic matter (%) from organic petrographic
analyses........................................................................................................... 42 3-3 Molecular parameters of organic source for paraffinic oils and rocks in
the Barrow Sub-basin ..................................................................................... 44 4-1 Rock-Eval pyrolysis results for Jurassic core samples from Bambra-2 in
the Barrow Sub-basin ..................................................................................... 52 4-2 Rock-Eval pyrolysis results for the Jurassic drill cuttings (claystone)
from Bambra-2 in the Barrow Sub-basin........................................................ 54 5-1 Measured high fluid pressures in four studied wells in the Northern
Carnarvon Basin ............................................................................................. 61 5-2 Measured total porosity and horizontal permeability values from the
conventional core (claystone) in Bambra-2 .................................................... 62 5-3 Measured porosity and permeability values for the conventional core
samples (sandstone) in the Bambra-1 well ..................................................... 62 5-4 Porosity evaluations based on density and neutron log data for
sandstones of the Barrow Group in West Barrow-2....................................... 62 5-5 Tops of the Jurassic overpressured zone in five wells in three sub-basins ..... 71 5-6 Temperatures at the top of the deep overpressured zone in seven wells in
three sub-basins .............................................................................................. 71 5-7 Average compositions of minerals from the conventional core samples
(sandstone) in the Bambra-1 well ................................................................... 73 6-1 Some present-day thermal parameters of 14 wells for 1D thermal
modelling in the Northern Carnarvon Basin................................................... 80
6-2 Default matrix thermal conductivity and matrix heat capacity in the
BasinMod 1D.................................................................................................. 83 6-3 Eq VR data in four wells used in this study.................................................... 84 7-1 The eleven wells for thermal modelling in the Northern Carnarvon Basin .... 89 7-2 Ro and Rock-Eval pyrolysis data for five wells in the Northern
Carnarvon Basin ............................................................................................. 92 8-1 Measured vitrinite reflectance for three wells and Eq VR values for the
Barrow-1 well in the Barrow Sub-basin ....................................................... 127 8-2 Rock-Eval pyrolysis data for the cuttings samples in the Barrow Deep-1
well in the Barrow Sub-basin ....................................................................... 127 8-3 Rock-Eval pyrolysis data for the cuttings and core samples in the
Barrow-1 well in the Barrow Sub-basin ....................................................... 128 8-4 Molecular parameters of thermal maturity for rocks in the Barrow and
Bambra areas ................................................................................................ 129 8-5 The percentages of four lithologies for various formations of the two
selected wells in the Barrow Sub-basin ........................................................ 130 8-6 Formation temperatures for the Bambra-2 and Barrow Deep-1 wells in
the Barrow Sub-basin ................................................................................... 130 8-7 Examples for the difficulty of distinguishing vitrinite and inertinite in
the samples of Bambra-2 .............................................................................. 146 9-1 Important constants applied in BasinMod 2D............................................... 151 9-2 Porosity and permeability in sandstones from 12 wells in the Northern
Carnarvon Basin ........................................................................................... 164 10-1 Measured formation temperatures from three wells in the Exmouth
Sub-basin ...................................................................................................... 189 10-2 Measured BHTs from three wells in the Dampier Sub-basin ..................... 201 10-3 The heat flow values required for fitting the measured maturity data
from the 1D BasinMod modelling and the BasinMod 2D modelling in three sub-basins ............................................................................................ 219
LIST OF FIGURES Figure Page 1-1 Gas, gas/condensate and oil fields in the Carnarvon Basin prior to 1997
(after Hocking et al., 1987; Baillie and Jacobson, 1997; Petroleum
Division, Department of Minerals and Energy, Western Australia, 1999)....... 3
1-2 Generalised ideal and work process of basin modelling for the thermal
history and overpressure modelling in this study. ............................................ 8 1-3 Database of seismic lines and well locations in the Northern Carnarvon
Basin. .............................................................................................................. 14 2-1 Sedimentary basins of Western Australia (after Trendall and Cockbain,
1990; Hocking et al., 1994; Purcell and Purcell, 1994).................................. 18 2-2 The Exmouth, Barrow, Dampier and Beagle Sub-basins, Rankin Platform
and Exmouth Plateau in the Northern Carnarvon Basin with adjacent three abyssal plains (after AGSO North West Shelf Study Group, 1994; Polomka et al., 1999). Also showing the cross-section of the Exmouth and Barrow Sub-basins, Alpha Arch and Exmouth Plateau (simplified from Tindale et al., 1998). See Fig. 1-3 for well locations............................. 19
2-3 Generalized stratigraphic column of the sub-basins in the Northern
Carnarvon Basin (after Blevin et al., 1994; Labutis, 1994; Stagg and Colwell, 1994; Polomka et al., 1999). ............................................................ 20
2-4 Tectonic subdivisions, structures and faults of the North Carnarvon Basin
(after Stagg and Colwell, 1988)...................................................................... 25 3-1 A map shows well locations and the tectonic subdivisions in the Northern Carnarvon Basin (after Woodside Offshore Petroleum, 1988; Scott, 1992)................................................................................................................ 34 3-2 Histogram of total organic matter for the Gearle Siltstone, Windalia
Radiolarite and Muderong Shale in the Northerm Carnarvon Basin.............. 35 3-3 Histogram of total organic matter for the Barrow Group in the Northern
Carnarvon Basin. ............................................................................................ 35 3-4 Histogram of total organic matter for the Dupuy Formation, Dingo
Claystone and Athol Formation in the Northern Carnarvon Basin. ............... 36 3-5 Histogram of total organic matter for the Murat Siltstone in the Northern
Carnarvon Basin. ............................................................................................ 36 3-6 Histogram of total organic matter for the Mungaroo Formation in the
Northern Carnarvon Basin. ............................................................................. 37
3-7 Plots of atomic H/C versus atomic O/C and hydrogen index versus Tmax show mainly type III organic matter in the samples from three wells
within the Exmouth Sub-basin. See Fig. 3-1 for well locations... .................. 39 3-8 Plots of hydrogen index versus Tmax show kerogen type for the samples
from six wells in the Barrow and Dampier Sub-basins. See Fig. 3-1 for well locations. ................................................................................................. 40
3-9 Diagrams of HI (hydrogen index) versus Tmax and S2 versus TOC show
the characteristics of organic matter in the samples from the Depuch-1 well of the Beagle Sub-basin. The numbers show that the samples with relatively high HI values are generally consistent with relatively high TOC or coals. a: HI=167; b: HI=171; c: HI=51; d: HI=190. See Fig. 3-1 for the well location.. ...................................................................................... 41
3-10 Diagrams of HI (hydrogen index) versus Tmax and S2 versus TOC show
the characteristics of organic matter within the Mungaroo Formation in three wells on the Rankin Platform and Exmouth Plateau. Samples with number 1, 2 and 3 are coal-bearing samples.1: TOC=13.7 %; 2: TOC=13.3 %; 3: TOC=20.7 %. See Fig. 3-1 for well locations..................... 41
3-11 Geochemical profiles of the Jurassic source rocks in the Jurabi-1 well of
the Exmouth Sub-basin. TOC: Total organic carbon; S1: Free hydrocarbons (mg HC/g rock); S2: Pyrolysable hydrocarbons (mg HC/g rock); Hydrogen index: S2%100/TOC; Tmax: Temperature at the top of S2 peak; Production index: S1/S1+S2. Type of hydrocarbon generated for immature stage................................................................................................ 45
3-12 Geochemical profiles of the Middle-Upper Jurassic and the lower part of
the Barrow Group for the Barrow Deep-1 and Barrow-1 wells in the Barrow Sub-basin. TOC: Total organic carbon; S1: Free hydrocarbons (mg HC/g rock); S2: Pyrolysable hydrocarbons (mg HC/g rock); Hydrogen index: S2%100/TOC; Tmax: Temperature at the top of S2 peak; Production index: S1/S1+S2. Type of hydrocarbon generated for immature stage. See Fig. 3-1 for well locations.............................................................. 46
3-13 Geochemical profiles of the Middle-Upper Jurassic and Lower
Cretaceous in the Depuch-1 well of the Beagle Sub-basin. TOC: Total organic carbon; S1: Free hydrocarbons (mg HC/g rock); S2: Pyrolysable hydrocarbons (mg HC/g rock); Hydrogen index: S2%100/TOC; Tmax: Temperature at the top of S2 peak; Production index: S1/S1+S2. .................... 47
4-1 Well profiles for total organic matter (TOC), hydrogen index
(HI=S2%100/TOC), Rock-Eval Tmax, S1 (free hydrocarbons) and production index (PI= S1/S1+S2) values versus depth for 280 cuttings samples and 27 side-wall cores and 4 conventional core samples in the Bambra-2 well. CC: Conventional core samples; SWC (1): SWC samples with normal and acceptable Tmax values; SWC (2): SWC samples with
low and three abnormal Tmax values. See Table 1 for the Rock-Eval data in the core samples.......................................................................................... 53
4-2 Six examples of saturated hydrocarbon distributions from gas
chromatography for two uncontaminated conventional core samples (A and B), three contaminated side-wall cores (C, E and F) and one contaminated cuttings (D) in the Bambra-2 well. EOM: Extractable organic matter (mg/g TOC). A, B, C and F from AMDEL (1983); D and E from GSCC (2000). ..................................................................................... 55
5-1 Profiles of fluid pressure versus depth in Barrow Deep-1; sonic transit
times and formation resistivities within claystone and silty claystone versus depth in Barrow Deep-1/Barrow-1. DST: Drill stem test.................... 66
5-2 Profiles of fluid pressure versus depth; sonic, resistivity and density log
data within claystone and silty claystone versus depth in Bambra-1. RFT: Repeat formation test; LOT: Leak-off test. .................................................... 66
5-3 Profiles of fluid pressure versus depth; sonic transit times and formation
resistivities within claystone and silty claystone versus depth in Bambra-2. RFT: Repeat formation test; LOT: Leak-off test. ....................................... 67
5-4 Profiles of fluid pressure versus depth; sonic, resistivity and density log
data within claystone and silty claystone versus depth in Jurabi-1. LOT: Leak-off test.................................................................................................... 67
5-5 The profile of fluid pressure versus depth in Dampier-1. DST: Drill stem
test................................................................................................................... 68 5-6 Profiles of fluid pressure versus depth; sonic, resistivity and density log
data within claystone and silty claystone versus depth in West Barrow-1/1A. LOT: Leak-off test. ............................................................................... 68
5-7 Profiles of fluid pressure versus depth; sonic transit times within
claystone and silty claystone versus depth in West Barrow-2. RFT: Repeat formation test. ..................................................................................... 68
6-1 A map shows the locations of the modelled wells and the tectonic subdivisions in the Northern Carnarvon Basin (after Woodside Offshore Petroleum, 1988; Scott, 1992)......................................................... 82 7-1 A map showing the locations of the modelled wells in the Northern
Carnarvon Basin (after Woodside Offshore Petroleum, 1988; Scott, 1992). .............................................................................................................. 89
7-2 Relationship between Tmax and vitrinite reflectance (Ro) from coal and
type III kerogen within the Triassic (Tr.) and Jurassic (Ju.) formation in the Northern Carnarvon Basin. ....................................................................... 91
7-3 A plot of hydrogen index (HI) versus Tmax showing that the maturity data in Fig. 7-2 are associated with type III of organic matter without coal-related samples. Tr.-Triassic; Ju.-Jurassic. ..................................................... 91
7-4 Calculated tectonic subsidence curves and sedimentation rates for Barrow
Deep-1 and Bambra-2, showing the phases of syn-rift and post-rift. ............. 94 7-5 Jurabi-1 thermal maturity modelling showing the measured maturity data
and calculated maturity curves (A). Also showing the rift heat flow profile (B). Curve 1: The modelled maturity curve obtained from the rift heat flow history; Curve 2: The calculated maturity curve using the constant heat flow history (52.1 mW/m2 and seabed temperature of 23 oC). .................................................................................................................. 96
7-6 The modelled geohistory and histories of temperature and maturity using
the rift-related heat flow history for the Jurabi-1 well.................................... 97 7-7 Zeewulf-1 thermal maturity modelling showing the measured maturity
data and the calculated maturity curve using the constant thermal history. ... 99 7-8 The modelled geohistory and histories of temperature and thermal
maturity using the current heat flow and seafloor temperature for the Zeewulf-1 well................................................................................................ 99
7-9 Anchor-1 thermal maturity modelling showing the measured maturity
data and the calculated maturity curve using the constant heat flow history. .......................................................................................................... 100
7-10 The modelled geohistory and histories of temperature and thermal
maturity using the current heat flow and seabed temperature for the Anchor-1 well. .............................................................................................. 100
7-11 Bowers-1 thermal maturity modelling showing the observed maturity
data and modelled maturity curves (A). Also showing the rift heat flow model (B). Curve 1: The modelled maturity curve obtained from the rift heat flow history; Curve 2: The calculated maturity curve using the current heat flow of 55.3 mW/m2 and seabed temperature of 21 oC. Ro (1) and Ro (2) were measured by Robertson Research Australia Pty. Ltd. and Keiraville Konsultants, respectively. ..................................................... 101
7-12 The calculated geohistory and thermal effect history using the rift-
related heat flow history for the Bowers-1 well. .......................................... 102 7-13 Rosemary-1 thermal maturity modelling showing the measured maturity
data and the modelled maturity curve using the constant current heat flow history. .......................................................................................................... 104
7-14 The modelled geohistory and histories of temperature and thermal
maturity using current heat flow and seabed temperature for the Rosemary-1 well. .......................................................................................... 104
7-15 Madeleine-1 thermal maturity modelling showing the observed maturity
data and modelled maturity curve obtained from the constant current heat flow history. The maturity curve can be modelled using the rift heat flow history as well (see B). Ro (1): Ro data from core and cuttings samples were measured by Robertson Research Australia Pty. Ltd.; Ro (2): Ro data from core samples were measured by Woodside Petroleum. Winning: Winning Group (Valanginian to early Late Cretaceous).............. 105
7-16 The modelled histories of burial, temperature and thermal maturity for
the Madeleine-1 well using the constant current heat flow (A) and the rift-associated heat flow history (B). ............................................................ 107
7-17 The modelled cumulative oil and gas generation from the Dingo
Claystone and Athol Formation using the constant current heat flow history at the site of the Madeleine-1 well.................................................... 108
7-18 The modelled cumulative oil and gas generation from the Dingo
Claystone and Athol Formation using the rift-related heat flow history in the Madeleine-1 well. ................................................................................... 109
7-19 Depuch-1 thermal maturity modelling showing a general match between
the observed and modelled maturity using the constant current heat flow and seafloor temperature............................................................................... 111
7-20 The modelled geohistory and thermal effect using the current heat flow
and seafloor temperature for the Depuch-1 well. ......................................... 111 7-21 North Gorgon-1 thermal maturity modelling showing a fit to the
measured maturity data indicating that the maturity data corresponds with the current heat flow of 57.1 mW/m2 and seafloor temperature 20 oC, irrespective of a missing section from 0 to 3200 m...................................... 113
7-22 The modelled geohistory and histories of temperature and thermal
maturity using the constant current heat flow and seafloor temperature for the North Gorgon-1 well............................................................................... 113
7-23 North Rankin-1 thermal maturity modelling showing a fit to the
measured maturity data indicating that the maturity data corresponds with the current heat flow of 53.5 mW/m2 and seafloor temperature 21 oC, irrespective of a missing section from 0 m to 2000 m. Also showing the thermal evolution of the Mungaroo Formation. Winning: Winning Group (Valanginian to early Late Cretaceous). ....................................................... 114
7-24 The modelled geohistory and thermal effect using the current heat flow
and seafloor temperature for the North Rankin-1 well. ................................ 115 7-25 Investigator-1 thermal maturity modelling showing the observed
maturity data and modelled maturity curves (A). Also showing the rift heat flow model (B). Curve 1: The calculated maturity curve obtained from the rift heat flow history; Curve 2: The calculated maturity curve
using the current heat flow of 56.8 mW/m2 and seabed temperature of 5.5 oC. ........................................................................................................... 116
7-26 The modelled geohistory and histories of temperature and thermal
maturity using the rift-related heat flow history for the Investigator-1 well. .............................................................................................................. 117
7-27 Jupiter-1 thermal maturity modelling showing the observed maturity
data and modelled maturity curves (A). Also showing the rift heat flow model (B). Curve 1: The calculated maturity curve obtained from the rift heat flow history; Curve 2: The calculated maturity curve using the constant heat flow history (54.3 mW/m2 and seabed temperature of 5 oC). ................................................................................................................ 119
7-28 The modelled geohistory and histories of temperature and thermal
maturity using the rift-related heat flow history for the Jupiter-1 well. ....... 120 8-1 Profiles of fluid pressure, Tmax, TOC (total organic carbon) and hydrogen
index (S2×100/TOC) versus depth for the Barrow-1 and Barrow Deep-1 wells. RILD: Deep Induction Log. ............................................................... 125
8-2 Profiles of fluid pressure, Tmax data versus depth for the Bambra-2 well.
Cores (1): SWC and conventional core samples with the normal and acceptable Tmax values, see Table 4-1 for the Rock-Eval data; Cores (2): SWC with the contaminated Tmax values.................................................... 125
8-3 Barrow-1 thermal maturity modelling showing the measured maturity
data and the calculated maturity curve obtained from the present heat flow and surface temperature. The formation temperatures are the corrected bottom hole temperatures. See Table 8-1 for Ro and Eq VR data................................................................................................................ 132
8-4 The modelled geohistory and histories of temperature and thermal
maturity using the current heat flow and surface temperature for the Barrow-1 well. .............................................................................................. 132
8-5 Barrow Deep-1 thermal maturity modelling showing the observed
maturity data and the modelled maturity curve obtained from the current heat flow and surface temperature. Assumed Tmax error ! 2-10 oC for uncertainty. See Table 8-1 for Ro (1) and Ro (2). ......................................... 134
8-6 The modelled geohistory and histories of temperature and thermal
maturity using the current heat flow and surface temperature for the Barrow Deep-1 well...................................................................................... 134
8-7 The modelled cumulative oil and gas generation from the Dingo
Claystone and Athol Formation using the constant current heat flow history in the Barrow Deep-1 well................................................................ 135
8-8 Barrow Deep-1 thermal maturity modelling showing the observed maturity data and the modelled maturity curve obtained from the rift-related heat flow history (see Fig. 8-10). Assumed Tmax error ! 2-10 oC for uncertainty. See Table 8-1 for Ro (1) and Ro (2)..................................... 136
8-9 The modelled geohistory and histories of temperature and thermal
maturity using the rift-related heat flow history (see Fig. 8-10) for the Barrow Deep-1 well...................................................................................... 136
8-10 The modelled cumulative oil and gas generation from the Dingo
Claystone and Athol Formation using the rift heat flow history in the Barrow Deep-1 well...................................................................................... 137
8-11 Bambra-2 thermal maturity modelling showing the measured maturity
data and calculated maturity curve obtained from the present heat flow and seafloor temperature. Tmax (1): Normal and acceptable Tmax values and assumed error ! 2-10 oC for uncertainty; Tmax (2): Low Tmax values (contaminated). See Table 8-1 for Ro data, and Table 4-1 for Tmax (1) and Tmax (2) data. ................................................................................................. 140
8-12 The modelled geohistory and histories of temperature and thermal
maturity using the current heat flow value and surface temperature for the Bambra-2 well. ............................................................................................. 140
8-13 The modelled cumulative oil and gas generation from the Dingo
Claystone and Athol Formation using the constant current heat flow history in the Bambra-2 well. ....................................................................... 141
8-14 Bambra-2 thermal maturity modelling showing the measured maturity
data and calculated maturity curve obtained from the rift-related heat flow history (see Fig. 8-16). Tmax (1): Normal and acceptable Tmax values and assumed error ! 2-10 oC for uncertainty; Tmax (2): Low Tmax values (contaminated). See Table 8-1 for Ro data, and Table 4-1 for Tmax (1) and Tmax (2) data. ................................................................................................. 142
8-15 The modelled geohistory and histories of temperature and thermal
maturity using the rift heat flow history (see Fig. 8-16) for the Bambra-2 well. .............................................................................................................. 142
8-16 The modelled cumulative oil and gas generation from the Dingo
Claystone and Athol Formation using the rift heat flow history in the Bambra-2 well. ............................................................................................. 143
9-1 A map showing sub-basins and locations of the modelled cross-sections
and wells in the Northern Carnarvon Basin (after Woodside Offshore Petroleum, 1998; Scott, 1992). ..................................................................... 153
9-2 Correlation between two time-depth relationships from well velocity surveys and seismic velocity data at approximate locations of the Zeewulf-1, Novara-1 and Ottrim-1 wells along the 110/11 seismic line in the Exmouth Sub-basin. Relationship 1: The time-depth relationship from
well velocity surveys; Relationship 2: The time-depth relationship from seismic velocity data..................................................................................... 156
9-3 Correlation between two time-depth relationships from well velocity
surveys and seismic velocity data at approximate locations of the Goodwyn-7, Rosermary-1 and Hampton-1 wells along the 101R/09 seismic line in the Dampier Sub-basin. Relationship 1: The time-depth relationship from well velocity surveys; Relationship 2: The time-depth relationship from seismic velocity data. ....................................................... 157
9-4 Correlation between two time-depth relationships from well velocity
surveys and seismic velocity data at approximate locations of the West Tryal Rocks-1and Bambra-2 wells along the AB seismic line in the Barrow Sub-basin. Relationship 1: The time-depth relationship from well velocity surveys; Relationship 2: The time-depth relationship from seismic velocity data..................................................................................... 158
9-5 The 2D model of the A-B cross-section used to model overpressure in the
Barrow Sub-basin. ........................................................................................ 159 9-6 The 2D model of the 110/11 cross-section used to model overpressure in
the Exmouth Sub-basin................................................................................. 160 9-7 The 2D model of the 101R/09 cross-section used to model overpressure
in the Dampier Sub-basin. ............................................................................ 161 9-8 Plots of the measured porosity values of claystone, siltstone, sandstone
and carbonate versus present-day depth from some wells of the Northern Carnarvon Basin. .......................................................................................... 163
9-9 The relationship between the measured vertical permeability and
horizontal permeability values in the Northern Carnarvon Basin. ............... 165 10-1 Correlation between the modelled curves and the observed porosities,
fluid pressures, temperatures and maturity values at the site of Bambra-2 along the cross-section in the Barrow Sub-basin. Numbers 1-12 represent different formations. ..................................................................................... 174
10-2 Correlation between the modelled curves and the observed fluid
pressures, temperatures and maturity values at the well site of West Tryal Rocks-1 along the cross-section in the Barrow Sub-basin. .......................... 176
10-3-1 A series of the modelled chronological plots of porosity and
permeability at x-distance of 50000 m of the cross-section (see Fig. 9-5 for the location) in the Barrow Sub-basin. Numbers 1-6 represent different formations. ..................................................................................... 178
10-3-2 A series of the modelled chronological plots of porosity and permeability at x-distance of 50000 m of the cross-section (see Fig. 9-5 for the location) in the Barrow Sub-basin. Numbers 1-12 represent different formations. ..................................................................................... 179
10-4 Four profiles of the modelled porosity at 145 Ma (A), 120 Ma (B), 65
Ma (C) and present-day (D) for the cross-section in the Barrow Sub-basin. ............................................................................................................. 180
10-5 Four profiles of the modelled vertical permeability at 145 Ma (A), 120
Ma (B), 65 Ma (C) and present-day (D) for the cross-section in the Barrow Sub-basin. ........................................................................................ 181
10-6-1 The modelled chronological profiles of the deep overpressure
evolution for the cross-section in the Barrow Sub-basin. Arrows show water flow direction. (A) 160 Ma, (B) 145 Ma, (C) 136 Ma and (D) 120 Ma. ................................................................................................................ 184
10-6-2 The modelled chronological profiles of the deep overpressure
evolution for the cross-section in the Barrow Sub-basin. Arrows show water flow direction. (E) 90 Ma, (F) 65 Ma, (G) 24 Ma and (H) Present-day................................................................................................................. 185
10-7 Correlation between the modelled fluid pressures and the measured fluid
pressures, including RFT pressures and mud weights, at the well sites of Zeewulf-1, Novara-1 and Outtrim-1 along the 110/11 cross-section in the Exmouth Sub-basin....................................................................................... 187
10-8 Correlation between the modelled temperature and maturity curves and
the observed formation temperatures and vitrinite reflectance data at the three well sites of Zeewulf-1, Novara-1 and Outtrim-1 along the 110/11 cross-section in the Exmouth Sub-basin....................................................... 188
10-9-1 Four modelled profiles of porosity evolution at 160 Ma (A), 145 Ma
(B), 136 Ma (C) and 120 Ma (D) for the 110/11 cross-section in the Exmouth Sub-basin....................................................................................... 191
10-9-2 Four modelled profiles of porosity evolution at 90 Ma (E), 65 Ma (F),
24 Ma (G) and 0 Ma (H) for the 110/11 cross-section in the Exmouth Sub-basin. ..................................................................................................... 192
10-10-1 Four modelled profiles of vertical permeability evolution at 160 Ma
(A), 145 Ma (B), 136 Ma (C) and 120 Ma (D) for the 110/11 cross-section in the Exmouth Sub-basin. ............................................................... 193
10-10-2 Four modelled profiles of vertical permeability evolution at 90 Ma
(E), 65 Ma (F), 24 Ma (G) and 0 Ma (H) for the 110/11 cross-section in the Exmouth Sub-basin................................................................................. 194
10-11-1 Four modelled profiles of the excess pressure at 160 Ma (A), 145 Ma
(B), 136 Ma (C) and 120 Ma (D) for the deep overpressure evolution along the 110/11 cross-section in the Exmouth Sub-basin. Arrows show water flow direction. ..................................................................................... 196
10-11-2 Four modelled profiles of the excess pressure at 90 Ma (E), 65 Ma (F), 24 Ma (G) and 0 Ma (H) for the deep overpressure evolution along the 110/11 cross-section in the Exmouth Sub-basin. Arrows show water flow direction................................................................................................ 197
10-12 Correlation between the modelled fluid pressures and the measured
fluid pressures, including RFT pressures and mud weight pressures, at the three well sites of Goodwyn-7, Rosemary-1 and Hampton-1along the 101R/09 cross-section in the Dampier Sub-basin......................................... 199
10-13 Correlation between the modelled temperature and maturity curves and
the observed formation temperatures and thermal maturity data at the well sites of Goodwyn-7, Rosemary-1 and Hampton-1 along the 101R/09 cross-section in the Dampier Sub-basin. ...................................................... 200
10-14-1 Four modelled profiles of porosity evolution at 160 Ma (A), 145 Ma
(B), 136 Ma (C) and 120 Ma (D) for the 101R/09 cross-section in the Dampier Sub-basin. ...................................................................................... 203
10-14-2 Four modelled profiles of porosity evolution at 90 Ma (E), 65 Ma
(F), 24 Ma (G) and 0 Ma (H) for the 101R/09 cross-section in the Dampier Sub-basin. ...................................................................................... 204
10-15-1 Four modelled profiles of vertical permeability evolution at 160 Ma
(A), 145 Ma (B), 136 Ma (C) and 120 Ma (D) for the 101R/09 cross-section in the Dampier Sub-basin. ................................................................ 205
10-15-2 Four modelled profiles of vertical permeability evolution at 90 Ma
(E), 65 Ma (F), 24 Ma (G) and 0 Ma (H) for the 101R/09 cross-section in the Dampier Sub-basin. ................................................................................ 206
10-16-1 Four modelled profiles of the excess pressure at 160 Ma (A), 145 Ma
(B), 136 Ma (C) and 120 Ma (D) for the deep overpressure evolution along the 101R/09 cross-section in the Dampier Sub-basin. Arrows show water flow direction. ..................................................................................... 208
10-16-2 Four modelled profiles of the excess pressure at 90 Ma (E), 65 Ma
(F), 24 Ma (G) and 0 Ma (H) for the deep overpressure evolution along the 101R/09 cross-section in the Dampier Sub-basin. Arrows show water flow direction................................................................................................ 209
10-17 A graph showing the conditions of the modelling based on Equation
(10-1), and depth versus excess pressure (Pex) for various times after initial application of the excess pressure zone (<P) between 3000 m and 6000 m. The porosity ( ) and permeability (k) of the various layers used are illustrated. ............................................................................................... 212
10-18 A graph of depth versus excess pressure (Pex) for various times after
initial application of the excess pressure zone (<P) between 3000 m and
6000 m. The porosity ( ) and permeability (k) of the various layers used are illustrated. ............................................................................................... 212
10-19 A graph of depth versus excess pressure (Pex) for various times after
initial application of the excess pressure zone (<P) between 3000 m and 6000 m. The porosity ( ) and permeability (k) of the various layers used are illustrated. ............................................................................................... 214
10-20 Maximum time (in years) over which a layer of given thickness and
permeability may confine excess pressures. Shaded area indicates approximate permeability required to sustain a 100-1000-m-thick seal over geologic time (Deming, 1994).............................................................. 214
Sheng HE
This thesis is presented for the Degree of
Doctor of Philosophy of
Curtin University of Technology
June 2002

Chapter 1 Introduction
2
____________________________
Part I
Introduction and Regional Geology ____________________________
Chapter 1 Introduction
3
CHAPTER 1 INTRODUCTION
1.1 Previous work and background of this study
1.1.1 Previous work
The Northern Carnarvon Basin, the most important gas and oil province in
Australia, is located at the southern end of the North West Shelf, Western Australia.
Petroleum exploration in the basin commenced in 1924 (Hocking et al., 1987). In
1953 the first exploration well, Rough Range-1, was drilled by WAPET (Western
Australian Petroleum Pty. Ltd.) on the Rough Range Anticline in the Exmouth Sub-
basin and it brought the first flowing oil in Australian history (Hocking et al., 1987).
The Barrow Island Anticline in the Barrow Sub-basin had been found in 1954 and a
well, Barrow-1, was drilled by WAPET in 1964 on the Anticline. This was the first
commercial oilfield in the Northern Carnarvon Basin associated with Upper Jurassic
sandstone reservoirs (Campbell et al., 1984). Production started in 1966 (Baillie and
Jacobson, 1997). The first offshore well, Legendre-1 in Western Australian waters
was drilled by Woodside (Woodside Offshore Petroleum Pty. Ltd.) in 1968 in the
Dampier Sub-basin and obtained oil flow to the surface at a rate of 160 m3/day from
Lower Cretaceous sandstones (Vincent and Tilbury, 1988). In 1971, Woodsite
made the first discovery on the Rankin Platform, the large North Rankin gas field
with sandstone reservoirs of Late Triassic to Early Jurassic age (Beston, 1986;
Cockbain, 1989). The large Goodwyn gas and condensate field (reservoir in the
Mungaroo Formation) was also discovered in 1971 by Woodside (Vincent and
Tilbury, 1988). The West Tryal Rocks gas field (reservoir in the Mungaroo
Formation) was discovered in 1972 by WAPET (McClure et al., 1988) and the large
Gorgon gas field with reservoirs in the Late Triassic and earliest Cretaceous, was
discovered in 1981 by WAPET (Campbell and Smith, 1982; McClure et al., 1988).
From the early 1970s to the 1990s, intensive petroleum exploration has led to a
series of discoveries of gas, gas/condensate and oil fields. Up to 1999,
approximately 50 gas, gas/condensate and oil fields had been discovered in the
Northern Carnarvon Basin (Fig. 1-1) (Hocking et al., 1987; Kopsen, 1994; le
Poidevin and Lowden, 1994; Baillie and Jacobson, 1997; Petroleum Division of the
Chapter 1 Introduction
4
Department of Minerals and Energy, Western Australia, 1999), while some gas
and/or oil accumulations still wait to be developed.
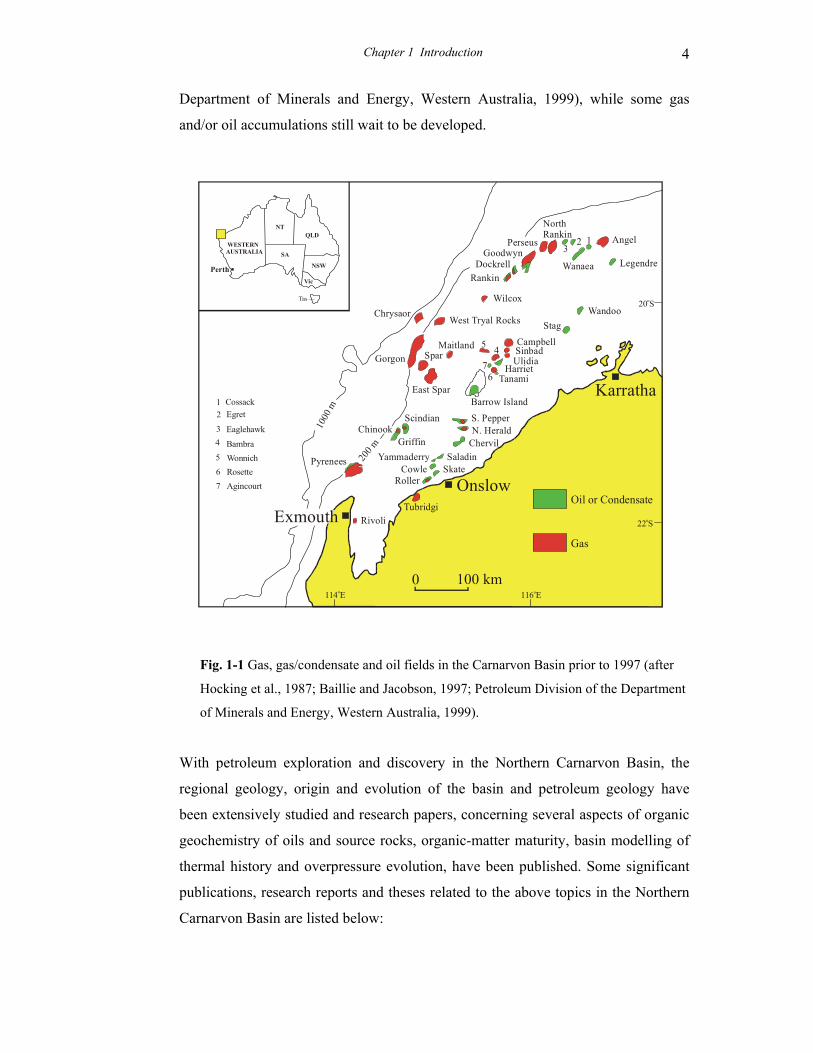
Fig. 1-1 Gas, gas/condensate and oil fields in the Carnarvon Basin prior to 1997 (after
Hocking et al., 1987; Baillie and Jacobson, 1997; Petroleum Division of the Department
of Minerals and Energy, Western Australia, 1999).
With petroleum exploration and discovery in the Northern Carnarvon Basin, the
regional geology, origin and evolution of the basin and petroleum geology have
been extensively studied and research papers, concerning several aspects of organic
geochemistry of oils and source rocks, organic-matter maturity, basin modelling of
thermal history and overpressure evolution, have been published. Some significant
publications, research reports and theses related to the above topics in the Northern
Carnarvon Basin are listed below:
1000
m
200 m
Onslow
Karratha
Oil or Condensate
0 100 km
Angel
LegendreWanaea
NorthRankin
PerseusGoodwyn
DockrellRankin
WandooStag
WilcoxChrysaor
Gorgon
West Tryal Rocks
SparMaitland
East Spar
Pyrenees
RivoliTubridgi
RollerSkate
Yammaderry SaladinChervilN. HeraldS. PepperBarrow Island
Scindian
Griffin
CampbellSinbadUlidia
HarrietTanami
123
45
67
CossackEgret
Eaglehawk
Agincourt
WonnichBambra
Rosette
12
34
5
67
WESTERNAUSTRALIA
Perth
Chinook
20 So
22 So
114 Eo 116 Eo
ExmouthGas
NTQLD
SA
NSW
Vic
Cowle
Chapter 1 Introduction
5
1. Petroleum organic geochemistry and geochemical correlation (Powell and
McKirdy, 1972, 1973a, 1973b; Brikké, 1982; Volkman et al., 1983; van Aarssen
et al., 1996; Pitchford et al., 1999; van Aarssen et al., 1999).
2. Source rocks and organic matter (Scott, 1992, 1994; Gorter, 1994; Teerman,
1994).
3. Thermal maturation and suppression of vitrinite reflectance (Ro) (Cook and
Kantsler, 1980; Volkman et al., 1983; Alexander et al., 1988; Wilkins et al.,
1992a, 1992b, 1995; Kaiko and Tingate, 1996; Kaiko, 1998; Samuelsson and
Middleton, 1998).
4. Overpressure (Horstman, 1988; Zaunbrecher, 1994; Yassir, 1996; Swarbrick and
Hillis, 1999; van Ruth et al., 2000; Tingate et al., 2001)
5. Thermal and maturity modelling (Swift et al., 1988; Alexander et al., 1990;
Wilkins et al., 1994; Ghori, 1995; Kaiko and Tingate, 1996; Kaiko, 1998; 2000;
Samuelsson and Middleton, 1998; Tindale et al., 1998)
6. Two-dimensional modelling of petroleum system (Vear, 1998) and two-
dimensional overpressure modelling (Bekele et al., 2001).
1.1.2 Background of this study
The Northern Carnarvon Basin can be subdivided into the Exmouth, Barrow,
Dampier and Beagle Sub-basins, the Rankin Platform and the Exmouth Plateau (e.g.
Hocking et al., 1994). These tectonic subdivisions were developed by rifting during
the Jurassic-Early Cretaceous on the Pre-Triassic basement (e.g. Barber, 1982;
Hocking et al., 1987; Westphal and Aigner, 1997). Although different tectonic
models for the evolution of the Northern Carnarvon Basin were proposed by Stagg
and Colwell (1994), and Daim and Lennox (1998), the conceptual model for this
study is based on a rift tectonic setting and thermal regime (e.g. McKenzie, 1978;
Middleton and Hunt, 1989). Direct evidence of thermal maturity experienced during
rifting in most sub-basin wells may have been removed by burial in a later sag-phase
Chapter 1 Introduction
6
deposition in the Barrow-Dampier Sub-basins (Kaiko and Tingate, 1996). However,
there is still an absence of studies for evidence of rift heat flow in the Northern
Carnarvon Basin.
According to well-drilling records and interpretations of seismic data, the
sedimentary rocks associated with the syn-rift phase in the sub-basins are up to 7000
m thick. The Jurassic rift-related sequence is dominated by organic-rich claystones
and siltstones which are recognized as the most important source rocks in the sub-
basins (e.g. McClure et al., 1988; Parry and Smith, 1988; Baillie and Jacobson,
1997; Ellis et al., 1999). However, the richness, type and maturity of organic matter
in the Jurassic source rocks have not been well understood.
On the basis of studies of maturity and thermal modelling (e.g. Wilkins et al., 1992a;
Kaiko and Tingate, 1996; Samuelsson and Middleton, 1998), vitrinite reflectance
(Ro), as a major maturity indicator, in some wells is considered to be significantly
suppressed by perhydrous effects through marine influenced suppression and/or
inaccurate identification of vitrinite, and shows an anomalously small increase with
depth. So far, Rock-Eval Tmax values, as a maturity indicator, have not been well
studied in this basin. It could be useful to constrain the anomalously low vitrinite
reflectance and to assess thermal maturity.
The anomalously low Ro profiles in the Barrow and Bambra wells occur within the
overpressured Jurassic sequence (Kopsen and McGann, 1985). Swarbrick and Hillis
(1999) suggest that the overpressure may retard the thermal maturation of the
Jurassic source rocks and delay the petroleum generation and charging time
predicated by basin modelling. Therefore, whether thermal maturity and
hydrocarbon generation in the sealed overpressured compartments are retarded by
the overpressuring has remained a question. Further study is indicated.
Overpressure in the Northern Carnarvon Basin has been studied by Horstman
(1988), Zaunbrecher (1994), van Ruth et al. (2000) and Tingate et al. (2001). Its
presence in the Jurassic section and the lower part of the Barrow Group of the
earliest Cretaceous is confirmed by the measured fluid pressure data. Tingate et al.
(2001) stated that all overpressure occurrences are accompanied by an increase in
Chapter 1 Introduction
7
sonic transit time and that disequilibrium compaction is the dominant mechanism for
the overpressure. Recently, Bekele et al. (2001) have carried out numerical 2D basin
modelling to reconstruct the overpressure generation in the Barrow Sub-basin. They
proposed that compaction disequilibrium and the permeability of shale layers are
dominant controls on overpressures, while the contribution to the maximum pressure
anomaly by organic maturation is approximately 15 %. However, the features and
formation of pressure seal, interpretation of well-log data for the deep overpressured
system and top pressure seal, and the processes of deep overpressure generation and
maintenance in the Jurassic sequence with varying major mechanisms are still
poorly understood.
1.2 Aims and objectives
1.2.1 Aims
The heat flow history and overpressure build-up in the Jurassic sequence are
intrinsically related to the dynamic processes (extension, rapid subsidence and
sedimentation, thermal input and fluid flow) of the basin. Geotemperature and fluid
overpressure are recognized as essential agents for hydrocarbon generation and
migration, which interact with the basin evolution. Based on the discussion above,
the studies of thermal history modelling and overpressure evolution in the rift-
related basin aim at significantly increasing understanding of (1) palaeoheatflow and
thermal maturity, (2) thermal maturity and petroleum generation in the Jurassic
overpressured system, and (3) the origins and processes of development and
preservation of the deep overpressured system.
1.2.2 Objectives
This research has been carried out with the following objectives.
1. Collection of data on total organic carbon content of source rocks, type and
maturity of organic matter, especially in the Jurassic source rocks.
Chapter 1 Introduction
8
2. Assessment of Rock-Eval Tmax data for thermal maturity study and thermal
modelling.
3. Analyses of the characteristics of the deep overpressured system and top
pressure seal.
4. Interpretation of well-log data for the deep overpressured system and top
pressure seal.
5. One-dimensional modelling for thermal history associated with the rift heat flow
(McKenzie, 1978; Jarvis and McKenzie, 1980) in some selected wells.
6. Studies of thermal maturity and thermal modelling in the Jurassic sealed
overpressured system.
7. Seismic data interpretation and depth conversion for 2D geological models.
8. Two-dimensional overpressure modelling for three cross-sections in the
Exmouth, Barrow and Dampier Sub-basins, and one-dimensional pressure
behavior modelling in low-permeability (10-18-10-22 m2) environments.
1.3 Methodology
Heat-flow and fluid pressure are the principal agents in sedimentary basin evolution.
In the processes of basin development, the most significant geochemical and
geophysical phenomena of self-organization are petroleum generation, migration
and accumulation, which are closely related to geothermal and geopressure histories.
Organic-matter maturation and hydrocarbon generation are controlled by chemical
reaction kinetics which are primarily temperature and time dependent (e.g. Hunt,
1979, 1991, 1996; Waples, 1980; Middleton, 1982; Tissot and Welte, 1984;
Burnham and Sweeney, 1989; Sweeney and Burnham, 1990; Barker, 1996;
Cranganu and Deming, 1996; Schenk et al, 1997). It is well-known that petroleum
migration is governed by physical and physiochemical processes in relation to
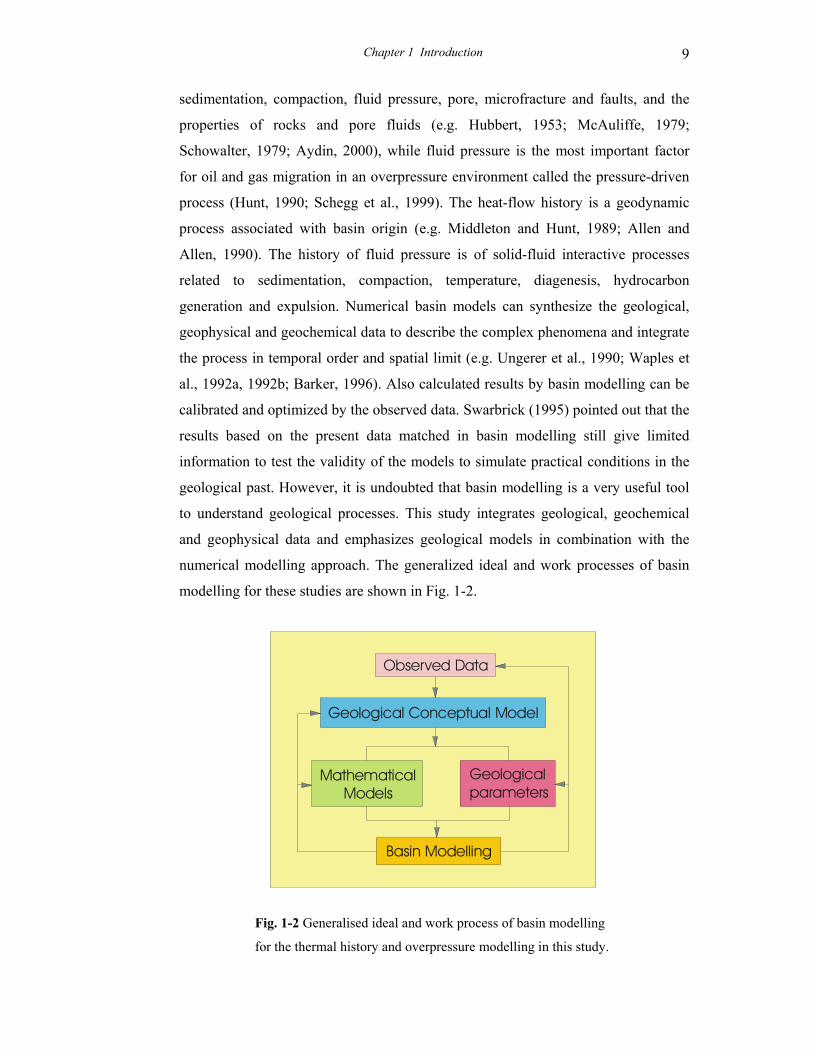
Chapter 1 Introduction
9
sedimentation, compaction, fluid pressure, pore, microfracture and faults, and the
properties of rocks and pore fluids (e.g. Hubbert, 1953; McAuliffe, 1979;
Schowalter, 1979; Aydin, 2000), while fluid pressure is the most important factor
for oil and gas migration in an overpressure environment called the pressure-driven
process (Hunt, 1990; Schegg et al., 1999). The heat-flow history is a geodynamic
process associated with basin origin (e.g. Middleton and Hunt, 1989; Allen and
Allen, 1990). The history of fluid pressure is of solid-fluid interactive processes
related to sedimentation, compaction, temperature, diagenesis, hydrocarbon
generation and expulsion. Numerical basin models can synthesize the geological,
geophysical and geochemical data to describe the complex phenomena and integrate
the process in temporal order and spatial limit (e.g. Ungerer et al., 1990; Waples et
al., 1992a, 1992b; Barker, 1996). Also calculated results by basin modelling can be
calibrated and optimized by the observed data. Swarbrick (1995) pointed out that the
results based on the present data matched in basin modelling still give limited
information to test the validity of the models to simulate practical conditions in the
geological past. However, it is undoubted that basin modelling is a very useful tool
to understand geological processes. This study integrates geological, geochemical
and geophysical data and emphasizes geological models in combination with the
numerical modelling approach. The generalized ideal and work processes of basin
modelling for these studies are shown in Fig. 1-2.
Fig. 1-2 Generalised ideal and work process of basin modelling
for the thermal history and overpressure modelling in this study.
Observed Data
Geological Conceptual Model
Geological parameters
Mathematical Models
Basin Modelling
Chapter 1 Introduction
10
1.3.1 Geological method
The geological method aims at creating a conceptual geological model of the basin
evolution on the basis of previous works and using geological, geochemical and
geophysical data collected from various sources, selecting and studying geological
variables as well as their relationships.
(1) Basic geological processes: tectonic, subsidence, deposition, uplift and erosion.
(2) The present thermal state including the present temperatures and heat-flows.
(3) The measured fluid pressure, formation compaction, the properties of the
boundaries and the distribution of faults etc.
(4) Organic-matter parameters including total organic carbon, kerogen type and
thermal maturity.
(5) Characteristics of measured porosity and well-log-derived porosity from
claystone, and porosity and permeability from sandstones.
1.3.2 Basin modelling
Basin modelling is the study of dynamic and interactive geological processes using
the BasinMod 1D and 2D software package. The software used in this study aims at
applying a mathematical method to describe and calculate sedimentation,
compaction, cementation, heat transfer, hydrocarbon generation, fluid pressure
evolution and fluid flow through geological time.
Mathematical method
(1) The equations of backstripping (decompaction) and tectonic subsidence were
used to reconstruct burial history or geohistory and subsidence.
Chapter 1 Introduction
11
(2) The kinetic model of quartz cementation and porosity loss (Walderhaug, 1996)
was applied to calculate porosity associated with the cementation in the rock
layer of the top pressure seal in 2D modelling
(3) The kinetic model of the Arrhenius first-order parallel-reaction (Burnham,
1989) and the chemical kinetic model of vitrinite reflectance (Sweeney and
Burnham, 1990) were selected to describe the temperature and time
dependence, and to calculate thermal maturity and hydrocarbon generation.
(4) The volumetric change model of organic matter during thermal evolution of
solid kerogen into gas, oil and residue was used to calculate generation
pressure.
(5) The pressure-controlled model (Düppenbecker et al., 1991) was selected for
calculation of hydrocarbon expulsion in 2D overpressure modelling.
(6) The transient heat flow equation (governing equation) was used to describe
thermal conduction and convection.
(7) The pressure equation (governing equation) was used to calculate fluid
pressure (overpressure generation and preservation) as a function of formation
compaction, temperature (fluid thermal expansion) and hydraulic conductivity.
(8) Multiphase fluid flow equations (governing equation) were used to model the
processes of compaction-driven water flow direction.
Numerical modelling
Numerical modelling was carried out for thermal history reconstruction and
overpressure evolution. The modelled results were correlated with the observed data
for the calibration and optimization of geological parameters so that acceptable
results were produced including the histories of burial, subsidence, heat flow,
temperature, thermal maturity, hydrocarbon generation, and overpressure generation
and maintenance.
Chapter 1 Introduction
12
The numerical modelling was performed using the BasinMod 1D software (version
7.06) and 2D software (version 4.61) by Platte River Associates, Inc. Parameters
and models used in the BasinMod software package can be selected or modified by
users. The theory, methodology and default parameters in the BasinMod software
are given in the BasinMod reference manuals (Platte River Associates, Inc., 1996,
1998a, 1998b).
1.4 Data sources and sets
1.4.1 Data sources
The data used for this study were collected from different sources including open
files, research reports and published literature. Most well data, including well
completion reports, geochemical data, formation temperatures, pore fluid pressures
and well logs, were taken from open files at the Department of Minerals and Energy
of Western Australia (DMEWA). Seismic data (3100 km) were collected from open
files at either the Australian Geological Survey Organisation (AGSO) or the
DMEWA. Velocity data of 101R/09 and 110/11 deep seismic lines were supplied by
AGSO. Five cross-sections of interpreted seismic lines in the Exmouth Sub-basin
and the Exmouth Plateau were also provided by BHP Petroleum. Some default
values, including initial porosity, matrix density, grain size, matrix thermal
conductivity, fluid conductivity, matrix heat capacity, kerogen kinetic parameters
etc., were provided by the BasinMod 1D and 2D softwares.
Additionally, experimental analyses in this study include: Rock-Eval pyrolysis, gas
chromatography (GC), gas chromatography-mass spectrometry (GC-MS) and
claystone density measurements for samples from a conventional core, side-wall
cores and cuttings in the Bambra-2 well (Table 1-1). The Rock-Eval pyrolysis was
carried out at the Geological Survey of Canada, Calgary. The GC and GC-MS were
analyzed at the Geological Survey of Canada, Calgary and Curtin University of
Technology. The claystone density was measured at Curtin University of
Technology.
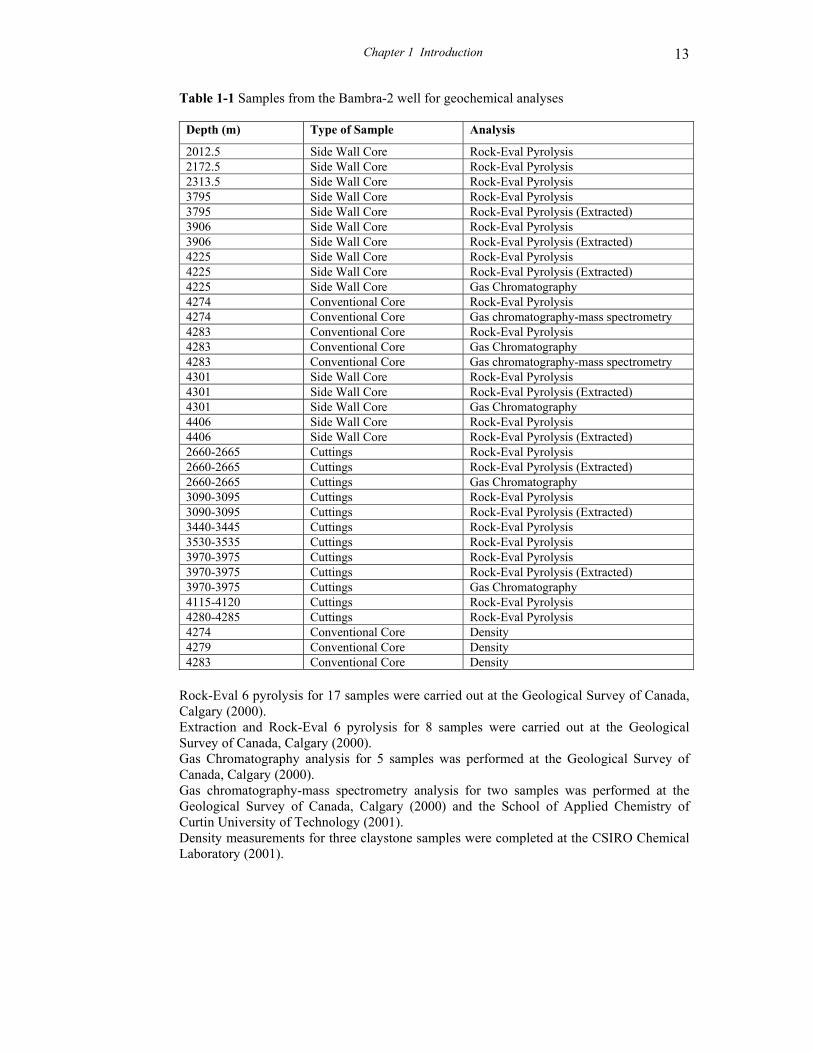
Chapter 1 Introduction
13
Table 1-1 Samples from the Bambra-2 well for geochemical analyses
Depth (m) Type of Sample Analysis
2012.5 Side Wall Core Rock-Eval Pyrolysis 2172.5 Side Wall Core Rock-Eval Pyrolysis 2313.5 Side Wall Core Rock-Eval Pyrolysis 3795 Side Wall Core Rock-Eval Pyrolysis 3795 Side Wall Core Rock-Eval Pyrolysis (Extracted) 3906 Side Wall Core Rock-Eval Pyrolysis 3906 Side Wall Core Rock-Eval Pyrolysis (Extracted) 4225 Side Wall Core Rock-Eval Pyrolysis 4225 Side Wall Core Rock-Eval Pyrolysis (Extracted) 4225 Side Wall Core Gas Chromatography 4274 Conventional Core Rock-Eval Pyrolysis 4274 Conventional Core Gas chromatography-mass spectrometry 4283 Conventional Core Rock-Eval Pyrolysis 4283 Conventional Core Gas Chromatography 4283 Conventional Core Gas chromatography-mass spectrometry 4301 Side Wall Core Rock-Eval Pyrolysis 4301 Side Wall Core Rock-Eval Pyrolysis (Extracted) 4301 Side Wall Core Gas Chromatography 4406 Side Wall Core Rock-Eval Pyrolysis 4406 Side Wall Core Rock-Eval Pyrolysis (Extracted) 2660-2665 Cuttings Rock-Eval Pyrolysis 2660-2665 Cuttings Rock-Eval Pyrolysis (Extracted) 2660-2665 Cuttings Gas Chromatography 3090-3095 Cuttings Rock-Eval Pyrolysis 3090-3095 Cuttings Rock-Eval Pyrolysis (Extracted) 3440-3445 Cuttings Rock-Eval Pyrolysis 3530-3535 Cuttings Rock-Eval Pyrolysis 3970-3975 Cuttings Rock-Eval Pyrolysis 3970-3975 Cuttings Rock-Eval Pyrolysis (Extracted) 3970-3975 Cuttings Gas Chromatography 4115-4120 Cuttings Rock-Eval Pyrolysis 4280-4285 Cuttings Rock-Eval Pyrolysis 4274 Conventional Core Density 4279 Conventional Core Density 4283 Conventional Core Density
Rock-Eval 6 pyrolysis for 17 samples were carried out at the Geological Survey of Canada, Calgary (2000). Extraction and Rock-Eval 6 pyrolysis for 8 samples were carried out at the Geological Survey of Canada, Calgary (2000). Gas Chromatography analysis for 5 samples was performed at the Geological Survey of Canada, Calgary (2000). Gas chromatography-mass spectrometry analysis for two samples was performed at the Geological Survey of Canada, Calgary (2000) and the School of Applied Chemistry of Curtin University of Technology (2001). Density measurements for three claystone samples were completed at the CSIRO Chemical Laboratory (2001).
Chapter 1 Introduction
14
1.4.2 Data sets
A total of 67 exploration well completion reports were reviewed with 41 wells being
further studied for heat flow histories. The data sets of 14 wells from their well
completion reports were available for 1D modelling of the heat flow histories using
the BasinMod 1D software. The data sets of 8 wells from their well completion
reports (among them, 3 wells used for 1D modelling) were used in 2D modelling.
These wells used in the modelling were drilled in different tectonic subdivisions
between 1964 and 1984 by various companies (Fig. 1-3 and Table 1-2).
1600 km of interpreted migrated deep seismic data from AGSO (Fig. 1-3), acquired
between 1990 and 1992, were reviewed. 1500 km of migrated seismic lines, with a
time record of 5 to 6 seconds TWT, were also reviewed. These seismic lines had
been acquired between 1978 and 1991, and were collected from DMEWA and
AGSO (Fig. 1-3). Three seismic lines, 110/11, 101R/09 and A-B were selected for
2D modelling. Line A-B, in the Barrow Sub-basin, was assembled from eight lines
shown in table 1-3 and is about 120 km long. Lone 110/11 is in the Exmouth Sub-
basin and about 150 km long. Line 101R/09 is in the Dampier Sub-basin and about
135 km long. These seismic lines were converted from time to depth cross-sections
based on well velocity surveys and seismic velocity data for two-dimensional
overpressure modelling.
The data sets of organic-matter richness, type and maturity were derived from 17
exploration wells in the basin. The values of porosity and permeability were
collected from 59 wells in the basin.
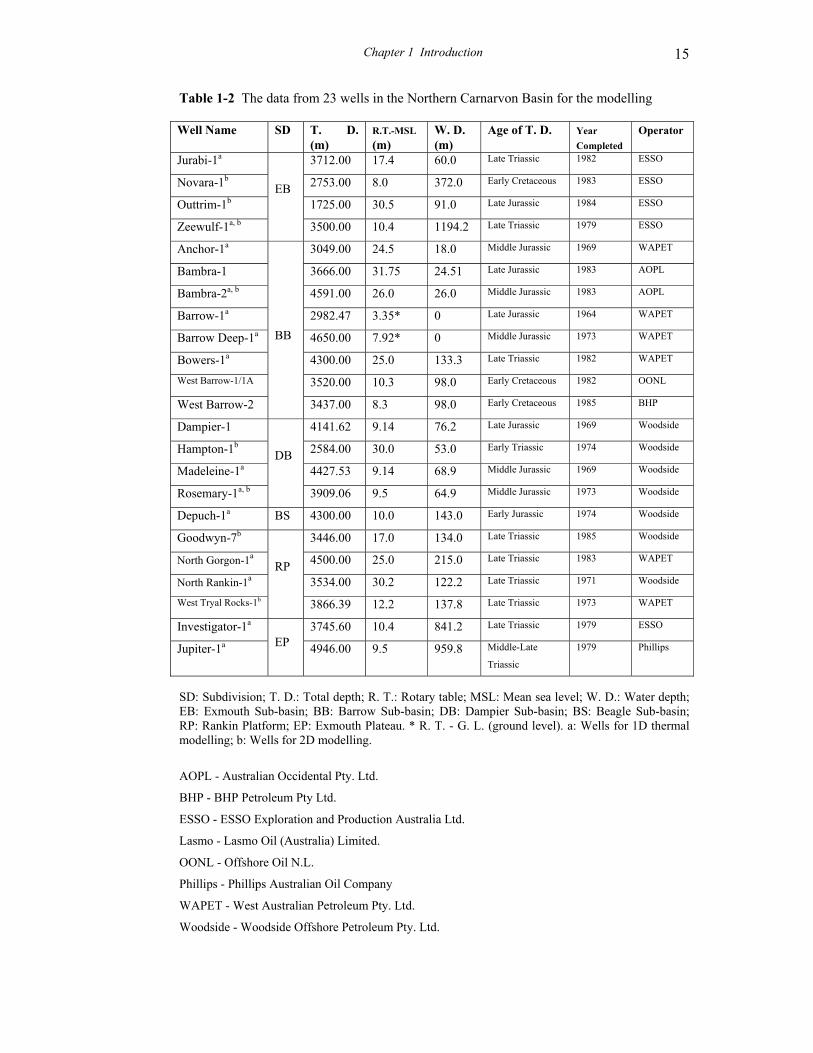
Chapter 1 Introduction
15
Table 1-2 The data from 23 wells in the Northern Carnarvon Basin for the modelling Well Name SD T. D.
(m) R.T.-MSL (m)
W. D. (m)
Age of T. D. Year Completed
Operator
Jurabi-1a 3712.00 17.4 60.0 Late Triassic 1982 ESSO
Novara-1b 2753.00 8.0 372.0 Early Cretaceous 1983 ESSO
Outtrim-1b 1725.00 30.5 91.0 Late Jurassic 1984 ESSO
Zeewulf-1a, b
EB
3500.00 10.4 1194.2 Late Triassic 1979 ESSO
Anchor-1a 3049.00 24.5 18.0 Middle Jurassic 1969 WAPET
Bambra-1 3666.00 31.75 24.51 Late Jurassic 1983 AOPL
Bambra-2a, b 4591.00 26.0 26.0 Middle Jurassic 1983 AOPL
Barrow-1a 2982.47 3.35* 0 Late Jurassic 1964 WAPET
Barrow Deep-1a 4650.00 7.92* 0 Middle Jurassic 1973 WAPET
Bowers-1a 4300.00 25.0 133.3 Late Triassic 1982 WAPET
West Barrow-1/1A 3520.00 10.3 98.0 Early Cretaceous 1982 OONL
West Barrow-2
BB
3437.00 8.3 98.0 Early Cretaceous 1985 BHP
Dampier-1 4141.62 9.14 76.2 Late Jurassic 1969 Woodside
Hampton-1b 2584.00 30.0 53.0 Early Triassic 1974 Woodside
Madeleine-1a 4427.53 9.14 68.9 Middle Jurassic 1969 Woodside
Rosemary-1a, b
DB
3909.06 9.5 64.9 Middle Jurassic 1973 Woodside
Depuch-1a BS 4300.00 10.0 143.0 Early Jurassic 1974 Woodside
Goodwyn-7b 3446.00 17.0 134.0 Late Triassic 1985 Woodside
North Gorgon-1a 4500.00 25.0 215.0 Late Triassic 1983 WAPET
North Rankin-1a 3534.00 30.2 122.2 Late Triassic 1971 Woodside
West Tryal Rocks-1b
RP
3866.39 12.2 137.8 Late Triassic 1973 WAPET
Investigator-1a 3745.60 10.4 841.2 Late Triassic 1979 ESSO
Jupiter-1a
EP 4946.00 9.5 959.8 Middle-Late
Triassic
1979 Phillips
SD: Subdivision; T. D.: Total depth; R. T.: Rotary table; MSL: Mean sea level; W. D.: Water depth; EB: Exmouth Sub-basin; BB: Barrow Sub-basin; DB: Dampier Sub-basin; BS: Beagle Sub-basin; RP: Rankin Platform; EP: Exmouth Plateau. * R. T. - G. L. (ground level). a: Wells for 1D thermal modelling; b: Wells for 2D modelling.
AOPL - Australian Occidental Pty. Ltd.
BHP - BHP Petroleum Pty Ltd.
ESSO - ESSO Exploration and Production Australia Ltd.
Lasmo - Lasmo Oil (Australia) Limited.
OONL - Offshore Oil N.L.
Phillips - Phillips Australian Oil Company
WAPET - West Australian Petroleum Pty. Ltd.
Woodside - Woodside Offshore Petroleum Pty. Ltd.
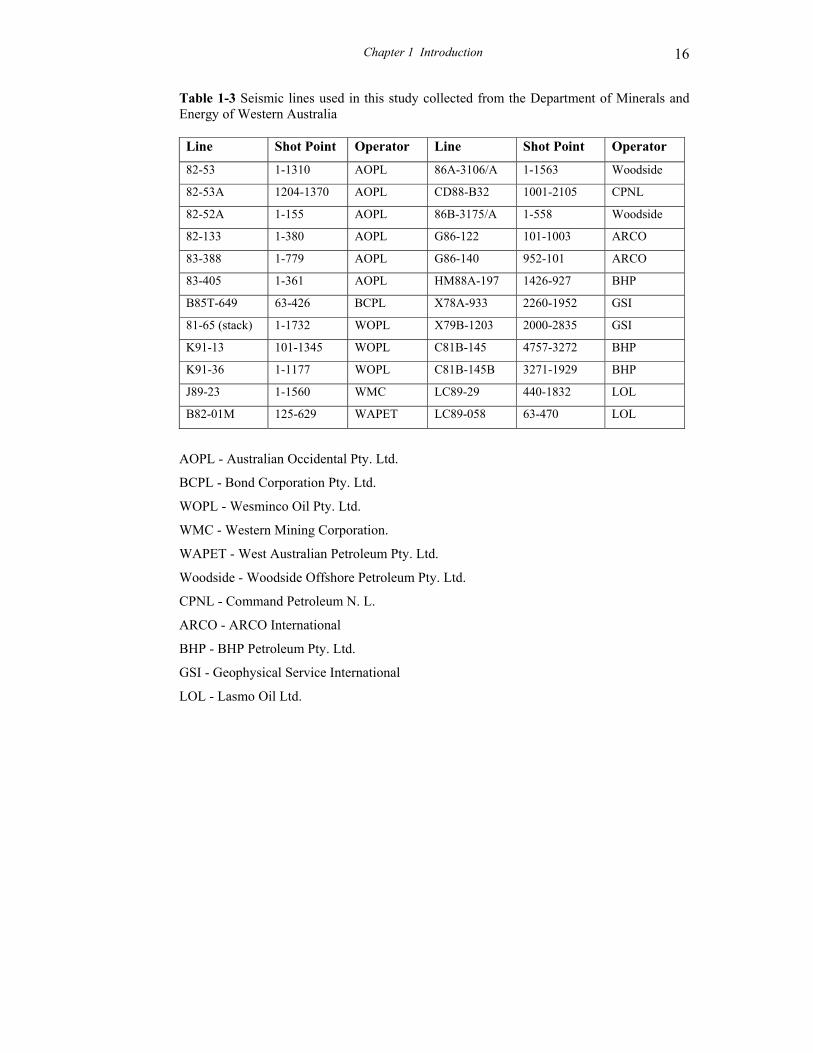
Chapter 1 Introduction
16
Table 1-3 Seismic lines used in this study collected from the Department of Minerals and Energy of Western Australia Line Shot Point Operator Line Shot Point Operator
82-53 1-1310 AOPL 86A-3106/A 1-1563 Woodside
82-53A 1204-1370 AOPL CD88-B32 1001-2105 CPNL
82-52A 1-155 AOPL 86B-3175/A 1-558 Woodside
82-133 1-380 AOPL G86-122 101-1003 ARCO
83-388 1-779 AOPL G86-140 952-101 ARCO
83-405 1-361 AOPL HM88A-197 1426-927 BHP
B85T-649 63-426 BCPL X78A-933 2260-1952 GSI
81-65 (stack) 1-1732 WOPL X79B-1203 2000-2835 GSI
K91-13 101-1345 WOPL C81B-145 4757-3272 BHP
K91-36 1-1177 WOPL C81B-145B 3271-1929 BHP
J89-23 1-1560 WMC LC89-29 440-1832 LOL
B82-01M 125-629 WAPET LC89-058 63-470 LOL
AOPL - Australian Occidental Pty. Ltd.
BCPL - Bond Corporation Pty. Ltd.
WOPL - Wesminco Oil Pty. Ltd.
WMC - Western Mining Corporation.
WAPET - West Australian Petroleum Pty. Ltd.
Woodside - Woodside Offshore Petroleum Pty. Ltd.
CPNL - Command Petroleum N. L.
ARCO - ARCO International
BHP - BHP Petroleum Pty. Ltd.
GSI - Geophysical Service International
LOL - Lasmo Oil Ltd.

Chapter 1 Introduction
17
Chapter 10 Regional Geology 17
CHAPTER 2 REGIONAL GEOLOGY
2.1 Location of study area
The Northern Carnarvon Basin is one of a series of extensional basins that form the
North West Shelf of Australia. It is located at the southern end of the North West
Shelf (Fig. 2-1). Geologically, it belongs to the Westralian Superbasin which is
composed of the Perth, Northern Carnarvon, Offshore Canning, Browse and
Northern Bonaparte basins (Yeates et al., 1987). It stretches from the Precambrian
Craton in the east to a continental-oceanic crustal boundary in the north, west and
the southwest, with, respectively, the Argo, Gascoyne and Cuvier Abyssal Plains
(Hocking, et al., 1987; AGSO North West Shelf Study Group, 1994) (Fig. 2-2). The
basin is transitional towards the Canning Basin in the northeast, and the Southern
Carnarvon Basin in the south (Figures 2-1 and 2-2). The main tectonic subdivisions
of the Northern Carnarvon Basin (Fig. 2-2) are the Exmouth, Barrow, Dampier and
Beagle sub-basins, the Rankin Platform and the Exmouth Plateau (Hocking, 1988).
These subdivisions are commonly referred to as the Mesozoic-Cainozoic basin over
the pre-Triassic basement. Sediments usually extend to the continental-oceanic crust
boundary.
2.2 Stratigraphy
The Northern Carnarvon Basin contains thick Mesozoic and Cainozoic sedimentary
rocks overlying the pre-Triassic basement. The sub-basins contain up to 12 km of
Mesozoic-Cainozoic sediments. The generalized stratigraphic column of the
Mesozoic and Cainozoic in the Northern Carnarvon Basin, especially for the sub-
basins, based on Barber (1994), Labutis (1994), Stagg and Colwell (1994) and
Polomka et al. (1999), is shown in Fig. 2-3. There are thinner (non-existent in
places) Middle-Upper Jurassic syn-rift sedimentary rocks on the Rankin Platform
and the Exmouth Plateau.
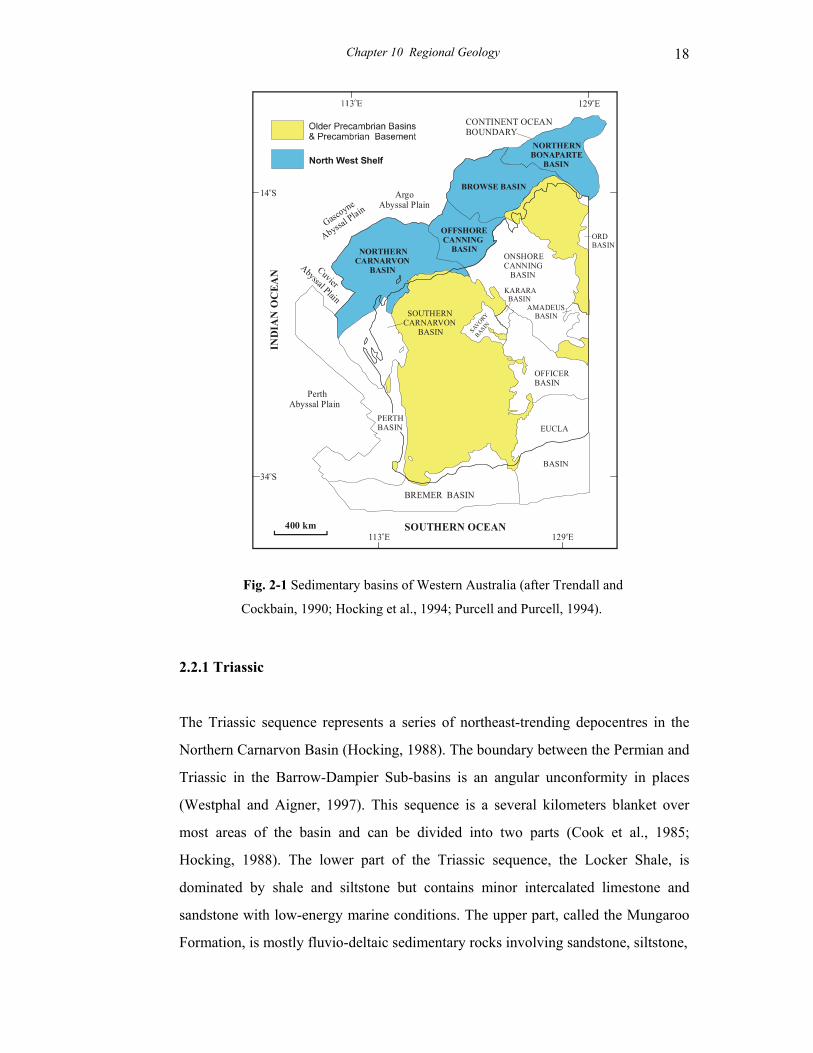
Chapter 10 Regional Geology 18
Fig. 2-1 Sedimentary basins of Western Australia (after Trendall and
Cockbain, 1990; Hocking et al., 1994; Purcell and Purcell, 1994).
2.2.1 Triassic
The Triassic sequence represents a series of northeast-trending depocentres in the
Northern Carnarvon Basin (Hocking, 1988). The boundary between the Permian and
Triassic in the Barrow-Dampier Sub-basins is an angular unconformity in places
(Westphal and Aigner, 1997). This sequence is a several kilometers blanket over
most areas of the basin and can be divided into two parts (Cook et al., 1985;
Hocking, 1988). The lower part of the Triassic sequence, the Locker Shale, is
dominated by shale and siltstone but contains minor intercalated limestone and
sandstone with low-energy marine conditions. The upper part, called the Mungaroo
Formation, is mostly fluvio-deltaic sedimentary rocks involving sandstone, siltstone,
400 km
14 So
129 Eo113 Eo
34 So
NORTHERNBONAPARTE BASIN
BROWSE BASIN
OFFSHORE CANNING BASIN
ONSHORECANNING BASIN
AMADEUS BASIN
NORTHERNCARNARVON BASIN
BREMER BASIN
EUCLA
BASINSAVORY
BASIN
CONTINENT OCEANBOUNDARY
ORDBASIN
OFFICERBASIN
Argo Abyssal Plain
Gasc
oyne
Abyssal Plain
Cuvier
Abyssal Plain
PerthAbyssal Plain
129 Eo
KARARA BASIN
IND
IAN
OC
EAN
SOUTHERN OCEAN
SOUTHERNCARNARVON BASIN
North West Shelf
PERTHBASIN
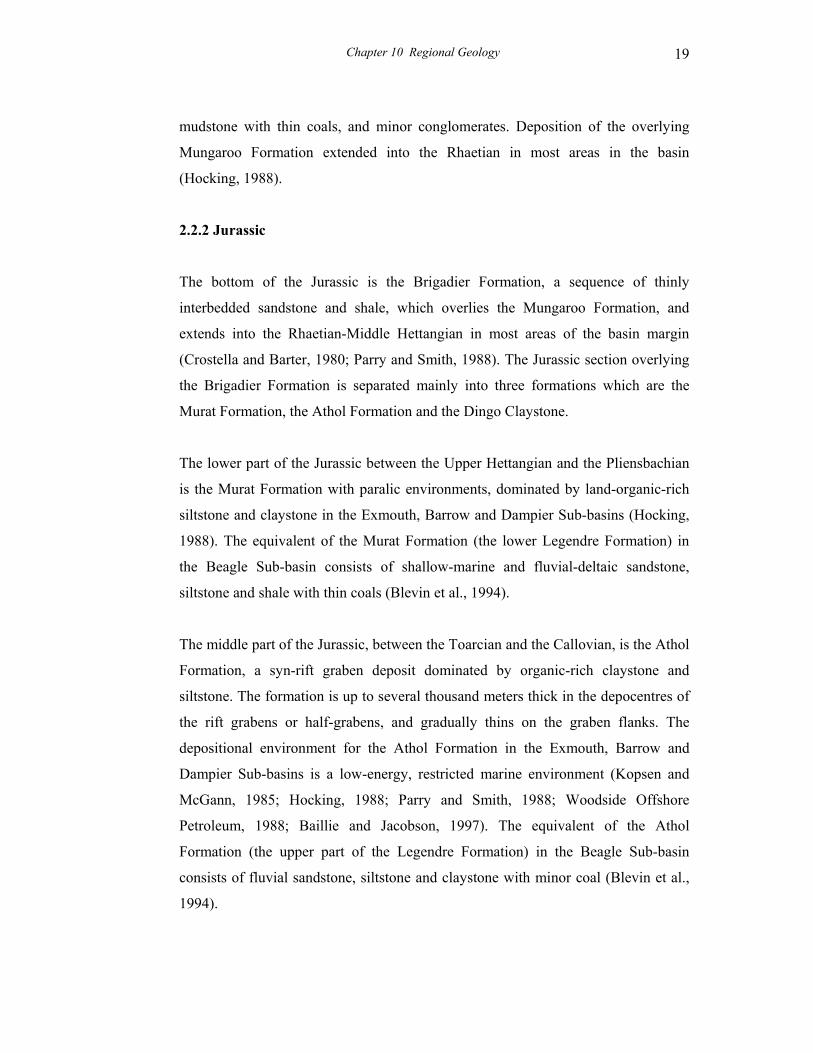
Chapter 10 Regional Geology 19
mudstone with thin coals, and minor conglomerates. Deposition of the overlying
Mungaroo Formation extended into the Rhaetian in most areas in the basin
(Hocking, 1988).
2.2.2 Jurassic
The bottom of the Jurassic is the Brigadier Formation, a sequence of thinly
interbedded sandstone and shale, which overlies the Mungaroo Formation, and
extends into the Rhaetian-Middle Hettangian in most areas of the basin margin
(Crostella and Barter, 1980; Parry and Smith, 1988). The Jurassic section overlying
the Brigadier Formation is separated mainly into three formations which are the
Murat Formation, the Athol Formation and the Dingo Claystone.
The lower part of the Jurassic between the Upper Hettangian and the Pliensbachian
is the Murat Formation with paralic environments, dominated by land-organic-rich
siltstone and claystone in the Exmouth, Barrow and Dampier Sub-basins (Hocking,
1988). The equivalent of the Murat Formation (the lower Legendre Formation) in
the Beagle Sub-basin consists of shallow-marine and fluvial-deltaic sandstone,
siltstone and shale with thin coals (Blevin et al., 1994).
The middle part of the Jurassic, between the Toarcian and the Callovian, is the Athol
Formation, a syn-rift graben deposit dominated by organic-rich claystone and
siltstone. The formation is up to several thousand meters thick in the depocentres of
the rift grabens or half-grabens, and gradually thins on the graben flanks. The
depositional environment for the Athol Formation in the Exmouth, Barrow and
Dampier Sub-basins is a low-energy, restricted marine environment (Kopsen and
McGann, 1985; Hocking, 1988; Parry and Smith, 1988; Woodside Offshore
Petroleum, 1988; Baillie and Jacobson, 1997). The equivalent of the Athol
Formation (the upper part of the Legendre Formation) in the Beagle Sub-basin
consists of fluvial sandstone, siltstone and claystone with minor coal (Blevin et al.,
1994).
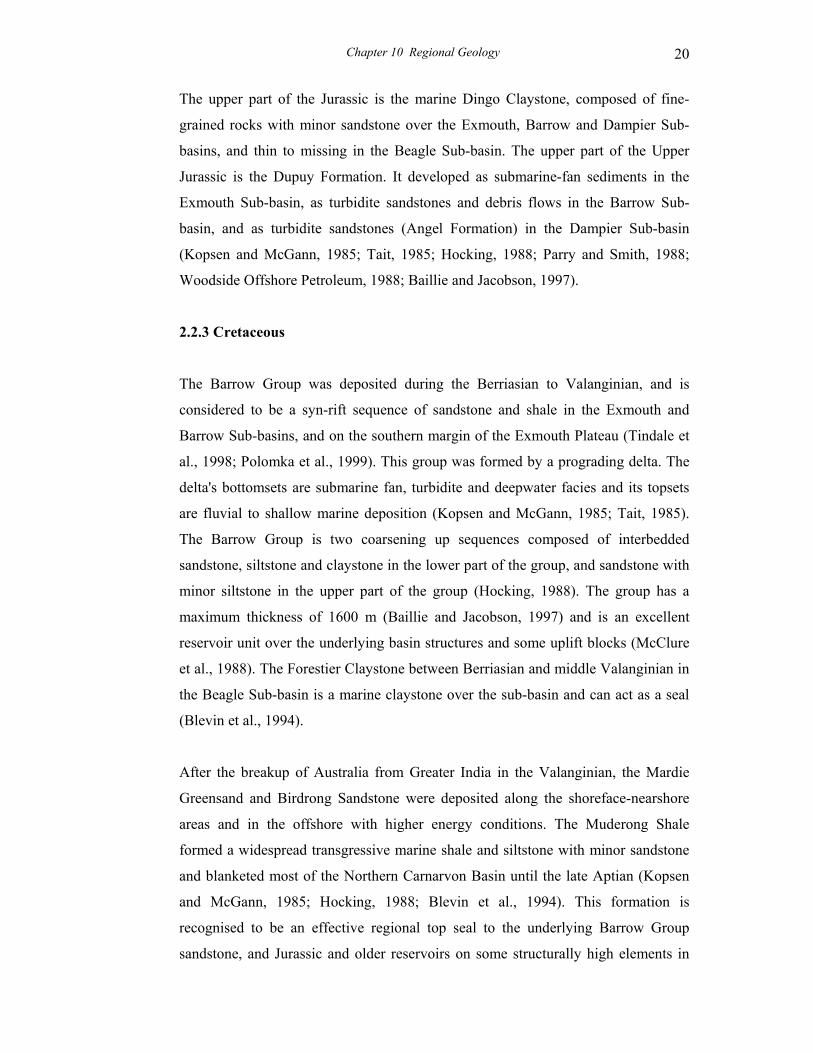
Chapter 10 Regional Geology 20
The upper part of the Jurassic is the marine Dingo Claystone, composed of fine-
grained rocks with minor sandstone over the Exmouth, Barrow and Dampier Sub-
basins, and thin to missing in the Beagle Sub-basin. The upper part of the Upper
Jurassic is the Dupuy Formation. It developed as submarine-fan sediments in the
Exmouth Sub-basin, as turbidite sandstones and debris flows in the Barrow Sub-
basin, and as turbidite sandstones (Angel Formation) in the Dampier Sub-basin
(Kopsen and McGann, 1985; Tait, 1985; Hocking, 1988; Parry and Smith, 1988;
Woodside Offshore Petroleum, 1988; Baillie and Jacobson, 1997).
2.2.3 Cretaceous
The Barrow Group was deposited during the Berriasian to Valanginian, and is
considered to be a syn-rift sequence of sandstone and shale in the Exmouth and
Barrow Sub-basins, and on the southern margin of the Exmouth Plateau (Tindale et
al., 1998; Polomka et al., 1999). This group was formed by a prograding delta. The
delta's bottomsets are submarine fan, turbidite and deepwater facies and its topsets
are fluvial to shallow marine deposition (Kopsen and McGann, 1985; Tait, 1985).
The Barrow Group is two coarsening up sequences composed of interbedded
sandstone, siltstone and claystone in the lower part of the group, and sandstone with
minor siltstone in the upper part of the group (Hocking, 1988). The group has a
maximum thickness of 1600 m (Baillie and Jacobson, 1997) and is an excellent
reservoir unit over the underlying basin structures and some uplift blocks (McClure
et al., 1988). The Forestier Claystone between Berriasian and middle Valanginian in
the Beagle Sub-basin is a marine claystone over the sub-basin and can act as a seal
(Blevin et al., 1994).
After the breakup of Australia from Greater India in the Valanginian, the Mardie
Greensand and Birdrong Sandstone were deposited along the shoreface-nearshore
areas and in the offshore with higher energy conditions. The Muderong Shale
formed a widespread transgressive marine shale and siltstone with minor sandstone
and blanketed most of the Northern Carnarvon Basin until the late Aptian (Kopsen
and McGann, 1985; Hocking, 1988; Blevin et al., 1994). This formation is
recognised to be an effective regional top seal to the underlying Barrow Group
sandstone, and Jurassic and older reservoirs on some structurally high elements in
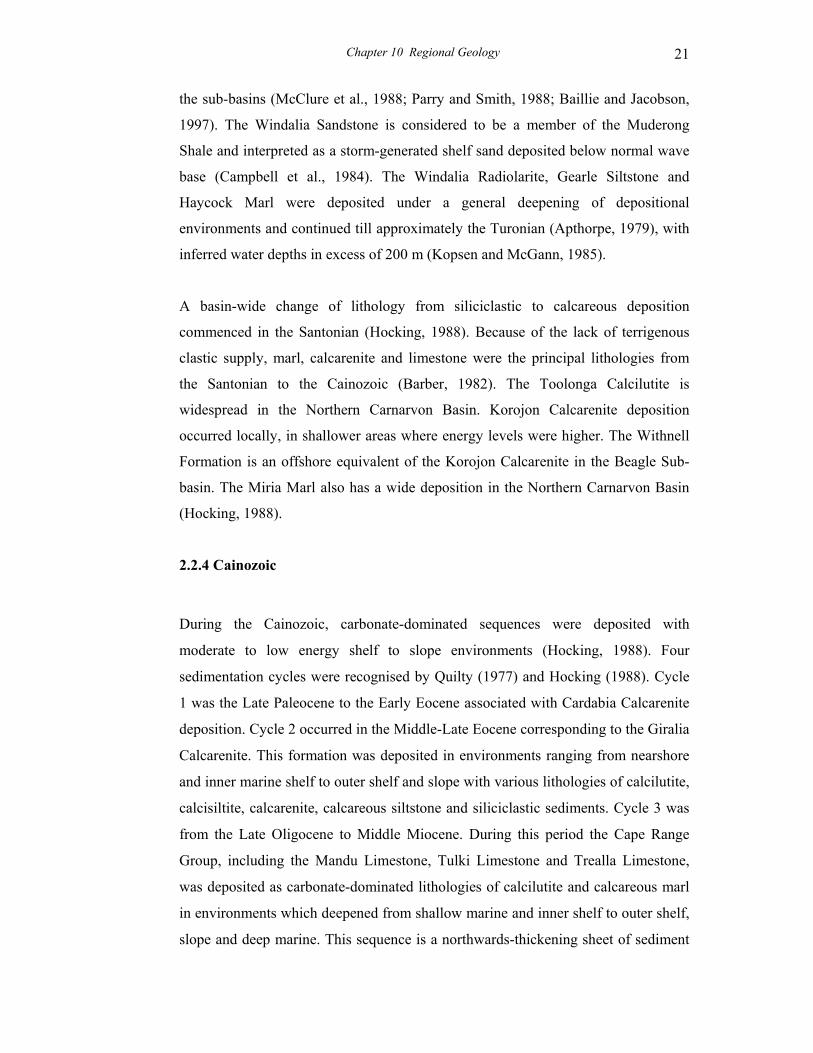
Chapter 10 Regional Geology 21
the sub-basins (McClure et al., 1988; Parry and Smith, 1988; Baillie and Jacobson,
1997). The Windalia Sandstone is considered to be a member of the Muderong
Shale and interpreted as a storm-generated shelf sand deposited below normal wave
base (Campbell et al., 1984). The Windalia Radiolarite, Gearle Siltstone and
Haycock Marl were deposited under a general deepening of depositional
environments and continued till approximately the Turonian (Apthorpe, 1979), with
inferred water depths in excess of 200 m (Kopsen and McGann, 1985).
A basin-wide change of lithology from siliciclastic to calcareous deposition
commenced in the Santonian (Hocking, 1988). Because of the lack of terrigenous
clastic supply, marl, calcarenite and limestone were the principal lithologies from
the Santonian to the Cainozoic (Barber, 1982). The Toolonga Calcilutite is
widespread in the Northern Carnarvon Basin. Korojon Calcarenite deposition
occurred locally, in shallower areas where energy levels were higher. The Withnell
Formation is an offshore equivalent of the Korojon Calcarenite in the Beagle Sub-
basin. The Miria Marl also has a wide deposition in the Northern Carnarvon Basin
(Hocking, 1988).
2.2.4 Cainozoic
During the Cainozoic, carbonate-dominated sequences were deposited with
moderate to low energy shelf to slope environments (Hocking, 1988). Four
sedimentation cycles were recognised by Quilty (1977) and Hocking (1988). Cycle
1 was the Late Paleocene to the Early Eocene associated with Cardabia Calcarenite
deposition. Cycle 2 occurred in the Middle-Late Eocene corresponding to the Giralia
Calcarenite. This formation was deposited in environments ranging from nearshore
and inner marine shelf to outer shelf and slope with various lithologies of calcilutite,
calcisiltite, calcarenite, calcareous siltstone and siliciclastic sediments. Cycle 3 was
from the Late Oligocene to Middle Miocene. During this period the Cape Range
Group, including the Mandu Limestone, Tulki Limestone and Trealla Limestone,
was deposited as carbonate-dominated lithologies of calcilutite and calcareous marl
in environments which deepened from shallow marine and inner shelf to outer shelf,
slope and deep marine. This sequence is a northwards-thickening sheet of sediment
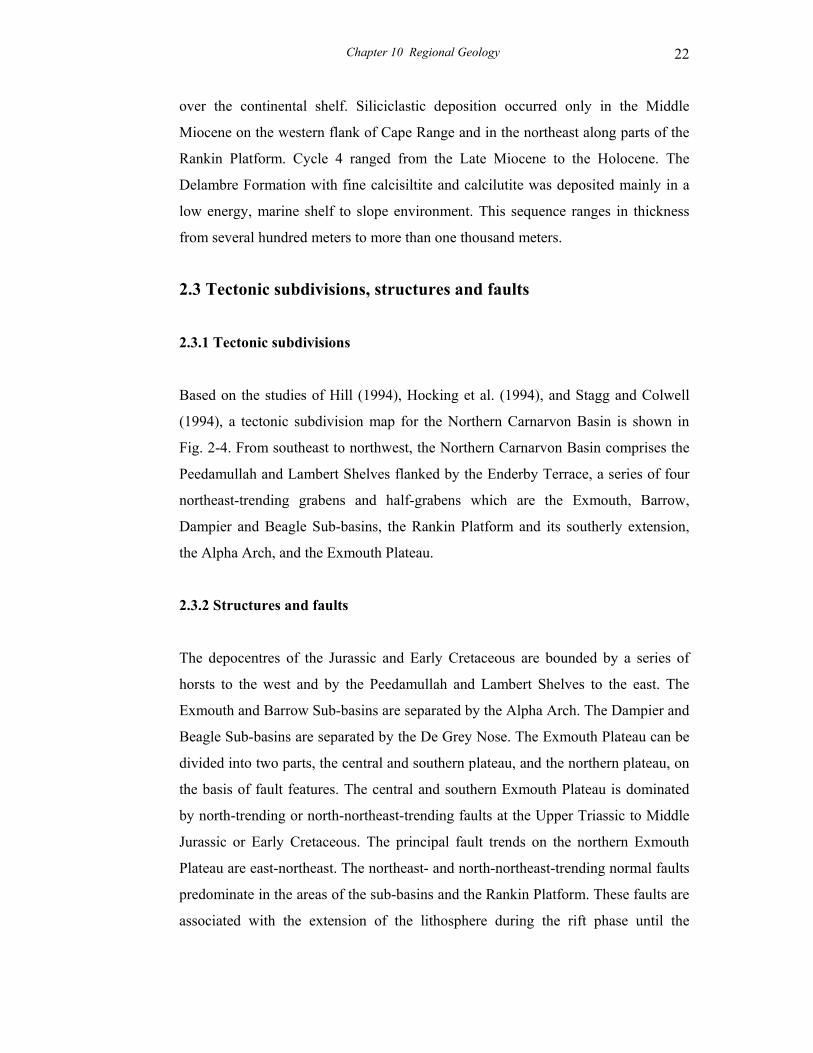
Chapter 10 Regional Geology 22
over the continental shelf. Siliciclastic deposition occurred only in the Middle
Miocene on the western flank of Cape Range and in the northeast along parts of the
Rankin Platform. Cycle 4 ranged from the Late Miocene to the Holocene. The
Delambre Formation with fine calcisiltite and calcilutite was deposited mainly in a
low energy, marine shelf to slope environment. This sequence ranges in thickness
from several hundred meters to more than one thousand meters.
2.3 Tectonic subdivisions, structures and faults
2.3.1 Tectonic subdivisions
Based on the studies of Hill (1994), Hocking et al. (1994), and Stagg and Colwell
(1994), a tectonic subdivision map for the Northern Carnarvon Basin is shown in
Fig. 2-4. From southeast to northwest, the Northern Carnarvon Basin comprises the
Peedamullah and Lambert Shelves flanked by the Enderby Terrace, a series of four
northeast-trending grabens and half-grabens which are the Exmouth, Barrow,
Dampier and Beagle Sub-basins, the Rankin Platform and its southerly extension,
the Alpha Arch, and the Exmouth Plateau.
2.3.2 Structures and faults
The depocentres of the Jurassic and Early Cretaceous are bounded by a series of
horsts to the west and by the Peedamullah and Lambert Shelves to the east. The
Exmouth and Barrow Sub-basins are separated by the Alpha Arch. The Dampier and
Beagle Sub-basins are separated by the De Grey Nose. The Exmouth Plateau can be
divided into two parts, the central and southern plateau, and the northern plateau, on
the basis of fault features. The central and southern Exmouth Plateau is dominated
by north-trending or north-northeast-trending faults at the Upper Triassic to Middle
Jurassic or Early Cretaceous. The principal fault trends on the northern Exmouth
Plateau are east-northeast. The northeast- and north-northeast-trending normal faults
predominate in the areas of the sub-basins and the Rankin Platform. These faults are
associated with the extension of the lithosphere during the rift phase until the
Chapter 10 Regional Geology 23
breakup of Gondwana. There are several fault systems, including the Rankin Fault
System, the Flinders Fault System and the Rosemary Fault System. The Flinders and Rosemary Fault Systems extend along the east flanks of the Barrow and Dampier
Sub-basins and consist of high-angle faults that may be antithetic to the Rankin
Fault System. There are several anticlines, structural arches and noses along the
eastern margin of the basin.
2.4 Geological evolution
The geological evolution of the Northern Carnarvon Basin, as a part of the
Northwest Shelf, commenced in the Late Palaeozoic. During this time the North
West Shelf belonged to the eastern part of Gondwana and formed part of the
southern Tethyan continental margin (Exon and Colwell, 1994; Westphal and
Aigner, 1997). Falvey and Mutter (1981) believed that the subsidence of the
continental margin occurred as an intracratonic phase, which started in the Permian
and resulted in the Westralian Superbasin on the southern margin of Tethys (Yeates
et al., 1987). A previous extension of the superbasin terminated in the Late Permian.
Thus, the geological evolution of the Northern Carnarvon Basin from the Triassic
can be divided into three major phases: (1) a pre-rift phase which occurred during
the Triassic, (2) a syn-rift phase which occurred during the Early Jurassic until a
complete continental breakup of Gondwana in the earliest Cretaceous, and (3) a
post-rift phase as a passive continental margin from the Early Cretaceous to the
Cainozoic when the basin experienced various short episodes of compression due to
the convergence between the Australian and Asian plates.
2.4.1 Pre-rift phase
The Triassic section shows little, or no evidence, of syn-depositional extensional
faulting along the entire North West Shelf (Etheridge and O'Brien, 1994; Westphal
and Aigner, 1997) and, thus, a tectonically calm period is thought to have taken
place in the Triassic (Falvey and Mutter, 1981; Barber, 1982; Westphal and Aigner,
1997). Based on seismic data, Barber (1982) and the AGSO North West Shelf Study
Group (1994) interpreted the presence of several kilometres of Triassic sedimentary
Chapter 10 Regional Geology 24
rocks nearly everywhere on the continental margin. The lower part of the Triassic
sequence is composed of the marine Locker Shale (Barber, 1982). The Mungaroo
Formation, the upper part of the Triassic rocks, is mostly of fluvio-deltaic origin.
The top of the Mungaroo Formation consists of shallow-marine siliciclastics and
shallow-marine carbonates on the Exmouth Plateau (Barber, 1982; Cook et al.,
1985; Colwell et al., 1994; Exon and Colwell, 1994). The Murat Siltstone of the
Lower Jurassic is a pre-rift shallow marine succession deposited over the sub-basin
area. Several hundred meters of this sequence were probably deposited on the
Exmouth Plateau and eroded during the Middle Jurassic (Barber, 1982).
2.4.2 Syn-rift phase
The early rift is interpreted to have commenced in the Latest Triassic to the earliest
Jurassic based on K/Ar ages from three volcanic samples on the Wombat Plateau
dated from 213 to 192 Ma (von Stackelberg et al., 1980; Exon and Colwell, 1994;
Westphal and Aigner, 1997). Hocking et al. (1987) considered that the rifting
recommenced in either the latest Triassic or the earliest Jurassic. Boyd et al. (1993)
considered that the rift occurred from Hettangian to Callovian, and a second rift and
final breakup took place between Callovian and Hauterivian. The extension in the
sub-basins of the Northern Carnarvon Basin began in the Early Jurassic (about 190
Ma), until the continental breakup of Gondwana in the Late Jurassic and
Valanginian (Barber, 1982; Westphal and Aigner, 1997; Tindale et al., 1998;
Polomka et al., 1999). The extension finally caused the separation of Australia from
Greater India in the Callovian-Valanginian (Exon and Colwell, 1994; Westphal and
Aigner, 1997). The rifting led to a series of four NE-SW to NNE-SSW-trending rift
grabens and half-grabens (sub-basins) with rapid subsidence and deposition,
numerous parallel normal faults and the block-faulted structures of the Rankin
Platform (Barber, 1982). Differential subsidence occurred due to the extension
resulting in the accumulation of thick fine-grained sequences in the sub-basins,
whereas several hundred metres to 2500 metres of sediments were eroded on the
shoulders of rift grabens along the Rankin Platform, the Peedamullah and Lambert
Shelves (Barber, 1982; Kopsen and McGann, 1985; Hocking, 1988; Westphal and
Aigner, 1997; Crostella et al., 2000). Tindale et al. (1998) considered that the
Jurassic syn-rift sequence is either absent or highly condensed across the Exmouth
Chapter 10 Regional Geology 25
Plateau. Based on regional deep seismic data interpreted by AGSO on the Exmouth
Plateau, a number of small-scale faulted half-grabens developed during rifting. The
faults controlled deposition, and up to one thousand metres of Jurassic syn-rift
sequence were deposited on the downthrown sides of these faults, while syn-rift
sediments are thin, or absent, on the upthrown side of the faults. Erosion of several
hundred metres has been interpreted on the structural highs of the Exmouth Plateau
as a result of rifting (Barber, 1982).
The earliest continental breakup of Gondwana occurred at about 160 Ma (Veevers
and Li, 1991), or at about 155 Ma (Ludden, 1992), to the north of the basin where
the Argo Abyssal Plain formed the earliest part of the Indian Ocean. Seafloor
spreading (further extension) has been proposed to have begun in the Valanginian,
ca. 136 Ma (Müller et al., 1998), or 132.5 Ma (Veevers and Li, 1991), associated
with separation of Australia and Greater India, and the formation of the Gascoyne
and Cuvier Abyssal Plains to the west and southwest of the basin. The breakup times
were widely accompanied by volcanism along the outer Western Australian margin
(Exon and Colwell, 1994). The actual continental breakup is commonly dated as
being concomitant with an unconformity, called the “main unconformity” in the
Northern Carnarvon Basin. As a result of the breakup, the main unconformity in the
Beagle Sub-basin is the contact between the Callovian and the Oxfordian sequences
(Blevin et al., 1994). The main unconformity in the Dampier Sub-basin is within the
Oxfordian sequence (Vincent and Tilbury, 1988; Barber, 1994). An important
unconformity in the Exmouth and Barrow Sub-basins is the boundary between the
Barrow Group and the Winning Group (Valanginian to early Late Cretaceous)
(Westphal and Aigner, 1997; Tindale et al., 1998; Polomka et al., 1999). The
thickness of the Upper Jurassic to the lowest Cretaceous sedimentary rocks varies
considerably in the Northern Carnarvon Basin. During this period, the sequences are
considered to be syn-rift deposits in the Exmouth and Barrow Sub-basins (Tindale et
al., 1998). On the Exmouth Plateau, the Oxfordian to Tithonian interval is a thin
sequence (condensed sedimentary section). During the Late Jurassic, the Rankin
Platform remained a positive area above sea-level (Barber, 1982). In the earliest
Cretaceous before the Valanginian breakup, a syn-rift sequence (Barrow Group) was
deposited in the Exmouth and Barrow Sub-basins, and over the southern margin of
the Exmouth Plateau, while several localised Triassic fault blocks of the Rankin
Chapter 10 Regional Geology 26
Platform still remained elevated above sea-level (Barber, 1982). The marginal areas
of the basin were subjected to erosion (Hocking, 1988).
2.4.3 Post-rift phase
Following the breakup of Australia from Greater India, the basin developed as a
passive continental margin and underwent a thermal subsidence phase as a result of
cooling in the lithosphere. Thermal subsidence commenced in the north of the basin
and progressively shifted to the south. During the Cretaceous, several periods of
minor uplift and erosion (structural inversion) occurred in the basin (Tindale et al.,
1998). From the Santonian, calcilutite, calcarenite and marl became the prime
lithologies due to peneplanation of the continental provenance areas (Barber, 1982).
During the Cainozoic, northwest Australia experienced various short and localised
episodes of compression during the Cainozoic which have been interpreted as a
result of tectonic stresses generated from the convergence of Australian and Asian
plates (Westphal and Aigner, 1997). This compression caused localised structural
deformation and strike-slip faulting throughout the North West Shelf (Kopsen and
McGann, 1985; Cockbain, 1989; Tindale et al., 1998). However, the effects of these
tectonic events on the entire Northern Carnarvon Basin are considered to be small
and of brief duration (Westphal and Aigner, 1997; Keep et al., 1998). The
carbonate-dominated Cainozoic sequence with minor siliciclastic sediments was
deposited over the basin (Hocking, 1988).
Chapter 3 Source Rocks and Organic Matter 31
____________________________
Part II
Source Rocks, Rock-Eval Tmax and Deep Overpressure ____________________________
Chapter 3 Source Rocks and Organic Matter 32
CHAPTER 3 SOURCE ROCKS AND ORGANIC MATTER
3.1 Source rocks
The potential source rocks and characteristics of the organic matter in the Triassic,
Jurassic and Lower Cretaceous in the Northern Carnarvon Basin have been studied
by Scott (1992, 1994), and discussed by a number of researchers (e.g. Powell and
McKirdy, 1973a; Volkman et al., 1983; Cook et al., 1985; Kopsen and McGann,
1985; Parry and Smith, 1988; Woodside Offshore Petroleum, 1988).
The Triassic source rocks can be separated into two parts. The lower part (Locker
Shale) appears to contain oil-potential organic matter deposited in a marine
environment (Barber, 1982; Scott, 1992, 1994). The upper part (Mungaroo
Formation) is composed of a coaly sequence of fluvio-deltaic facies, and sources gas
and condensate. However, the very top of the Mungaroo Formation had some
marine influence (Cook et al., 1985).
The Jurassic sequences, including the Murat Siltstone, Athol Formation and Dingo
Claystone, are the most important source rocks in the sub-basins of the Northern
Carnarvon Basin (McClure et al., 1988; Parry and Smith, 1988; Baillie and
Jacobson, 1997). The Lower-Middle Jurassic rocks in the sub-basins are composed
of paralic-marginal marine lithofacies containing a large amount of woody, land-
derived organic matter and are thus considered to form predominately
gas/condensate-prone source rocks (Scott, 1992). The Dingo Claystone of the Upper
Jurassic contains mixed terrestrial and marine organic matter (gas and oil-prone
source) deposited in a near-shore environment (Powell and McKirdy, 1973a;
Volkman et al., 1983), with somewhat less terrestrial input than the Lower-Middle
Jurassic (Kopsen and McGann, 1985; Parry and Smith, 1988; van Aarssen et al.,
1996). Geochemical evidence reveals a general similarity in the compositions of the
condensates and oils from the Triassic, Jurassic and Cretaceous reservoirs in the
Dampier Sub-basin and on the Rankin Platform, and also suggests that the
hydrocarbons have been generated from these Jurassic source rocks with the mixed

Chapter 3 Source Rocks and Organic Matter 33
nonmarine and marine organic matter (Powell and McKirdy, 1973a). Volkman et al.
(1983) and van Aarssen et al. (1996) proposed that the Upper Jurassic source rock is
the most important oil source in the Barrow Sub-basin, based on the oil-source rock
correlation. Furthermore, van Aarssen et al. (1996) suggested that these oils and
condensates from the Barrow Sub-basin, correlated with samples from the Koolinda-
1 well, were sourced from an interval of the source rocks of Middle-Upper
Oxfordian age. It is recognized that the kerogen of the Upper Jurassic from wells
drilled on structural highs, and basin margins, is mainly derived from terrestrial
higher plants (Kopsen and McGann, 1985; Parry and Smith, 1988). Kopsen and
McGann (1985) stated that the Lower Cretaceous has some oil-prone source rocks
within the Barrow Group and the lower part of the marine Muderong Shale in the
Barrow-Dampier Sub-basins.
3.2 Richness of organic matter
The organic matter richness of source rocks is estimated usually using the total
organic carbon content (TOC, %), although the TOC is residual TOC when dealing
with mature source rocks as the overall converting efficiency of organic carbon is
generally less than 15 wt.% (Hunt, 1979). Quantity of organic matter in source rocks
can be calculated using a universal conversion factor of 1.22 (Barker, 1996). The
study has collected 1256 values of TOC from 17 wells in the various tectonic
subdivisions of the Northern Carnarvon Basin (see Table 3-1 and Fig. 3-1). The
distributions of TOC at different intervals of the potential source rocks are shown in
histograms (Figures 3-2 to 3-6).
Figure 3-2 shows that 206 TOC values in the Cretaceous Gearle Siltstone, Windalia
Radioarite and Muderong Shale mainly range from 0.5 % to 3 %, and that values
between 1 and 2 % cover more than 50 % of the shale samples. About 80 % of the
samples have more than 1 % TOC. Figure 3-3 and Table 3-1 show that most TOC
values in the Barrow Group range from 0.1 to 3.7 %. About 60 % of the samples in
this group are higher than 1.0 % TOC, but about 40 % are lower than 1.0 % TOC.
An average TOC value in the Barrow Group is 1.30 %.

Chapter 3 Source Rocks and Organic Matter 34
Figure 3-4 shows that 582 TOC values in the Dupuy Formation, Dingo Claystone
and Athol Formation of the syn-rift Jurassic mostly range from 0.5 % to 3.5 %. The
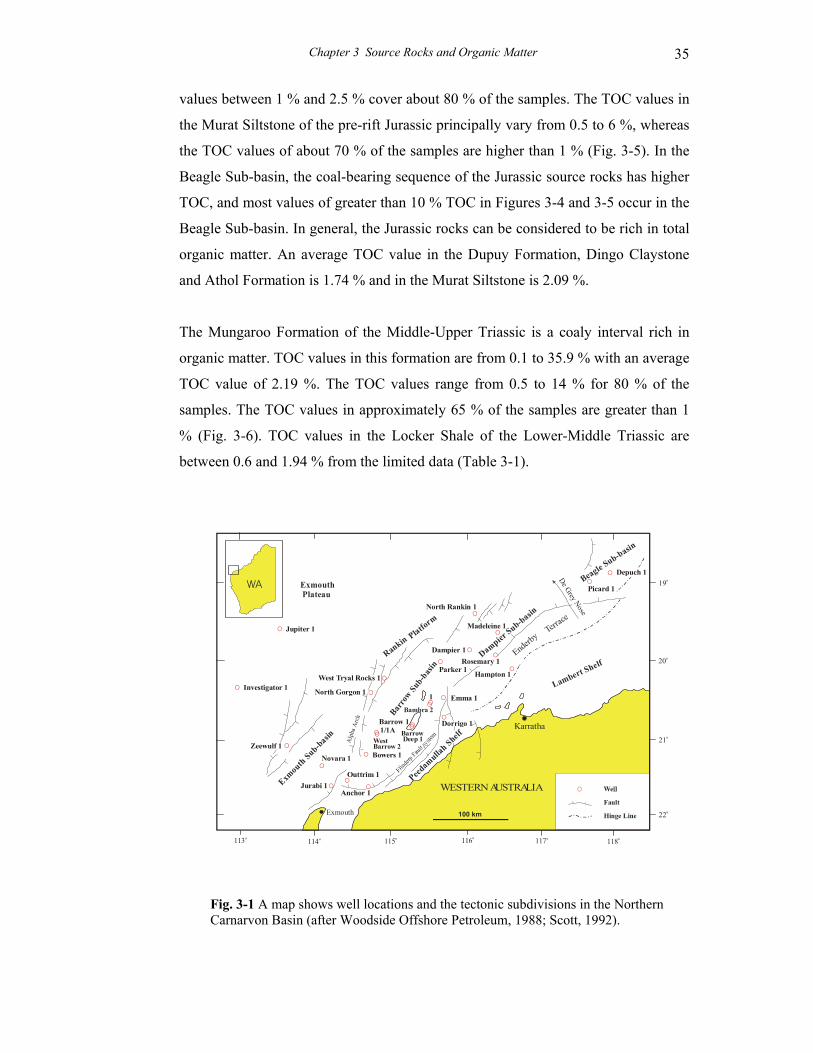
Chapter 3 Source Rocks and Organic Matter 35
values between 1 % and 2.5 % cover about 80 % of the samples. The TOC values in
the Murat Siltstone of the pre-rift Jurassic principally vary from 0.5 to 6 %, whereas
the TOC values of about 70 % of the samples are higher than 1 % (Fig. 3-5). In the
Beagle Sub-basin, the coal-bearing sequence of the Jurassic source rocks has higher
TOC, and most values of greater than 10 % TOC in Figures 3-4 and 3-5 occur in the
Beagle Sub-basin. In general, the Jurassic rocks can be considered to be rich in total
organic matter. An average TOC value in the Dupuy Formation, Dingo Claystone
and Athol Formation is 1.74 % and in the Murat Siltstone is 2.09 %.
The Mungaroo Formation of the Middle-Upper Triassic is a coaly interval rich in
organic matter. TOC values in this formation are from 0.1 to 35.9 % with an average
TOC value of 2.19 %. The TOC values range from 0.5 to 14 % for 80 % of the
samples. The TOC values in approximately 65 % of the samples are greater than 1
% (Fig. 3-6). TOC values in the Locker Shale of the Lower-Middle Triassic are
between 0.6 and 1.94 % from the limited data (Table 3-1).
Fig. 3-1 A map shows well locations and the tectonic subdivisions in the Northern Carnarvon Basin (after Woodside Offshore Petroleum, 1988; Scott, 1992).
O
OO
O
O
O
O
Rankin Platform
Beagle Sub-basin
Enderby
Terrace
Lambert Shelf
WESTERN AUSTRALIA
100 km
Karratha
ExmouthFault
Hinge Line
Bambra 2
North Rankin 1
117o113o
22o
20o
Exmouth Plateau
Jupiter 1
Investigator 1
Depuch 1
Madeleine 1
North Gorgon 1
Jurabi 1
115o
21o
19o
118o116o114o
OBarrowDeep 1
Bowers 1
Anchor 1
Peedamulla
h Shelf
De Grey Nose
WA
O
ODampier 1
O
OWest Tryal Rocks 1O
O
OBarrow 1
O
O
O
O
O
O
Outtrim 1
Zeewulf 1
O
Dorrigo 1
Hampton 1
Novara 1
Exmouth Sub-basin A
lpha
Arc
h Barro
w Sub-
basin Rosemary 1
Dampier Sub-basin
OPicard 1
OParker 1
Emma 1O1
OOWest Barrow 2
1/1A
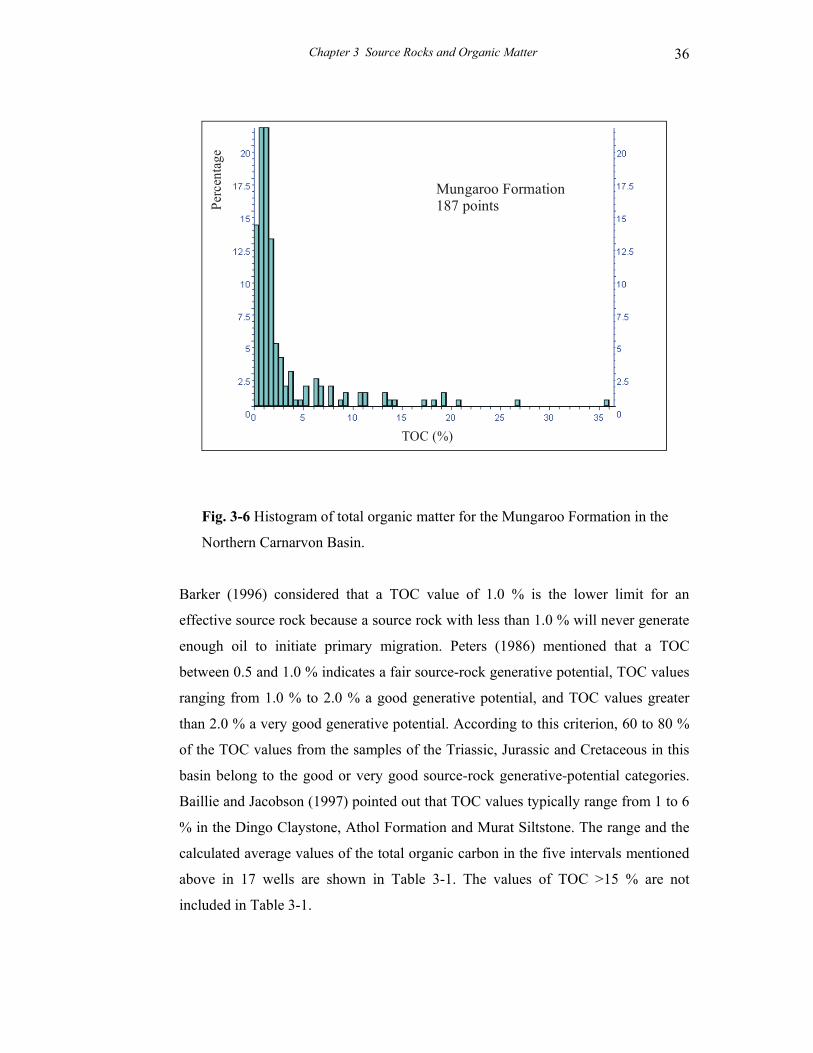
Chapter 3 Source Rocks and Organic Matter 36
Fig. 3-6 Histogram of total organic matter for the Mungaroo Formation in the
Northern Carnarvon Basin.
Barker (1996) considered that a TOC value of 1.0 % is the lower limit for an
effective source rock because a source rock with less than 1.0 % will never generate
enough oil to initiate primary migration. Peters (1986) mentioned that a TOC
between 0.5 and 1.0 % indicates a fair source-rock generative potential, TOC values
ranging from 1.0 % to 2.0 % a good generative potential, and TOC values greater
than 2.0 % a very good generative potential. According to this criterion, 60 to 80 %
of the TOC values from the samples of the Triassic, Jurassic and Cretaceous in this
basin belong to the good or very good source-rock generative-potential categories.
Baillie and Jacobson (1997) pointed out that TOC values typically range from 1 to 6
% in the Dingo Claystone, Athol Formation and Murat Siltstone. The range and the
calculated average values of the total organic carbon in the five intervals mentioned
above in 17 wells are shown in Table 3-1. The values of TOC >15 % are not
included in Table 3-1.
Mungaroo Formation187 points
TOC (%)
Perc
enta
ge
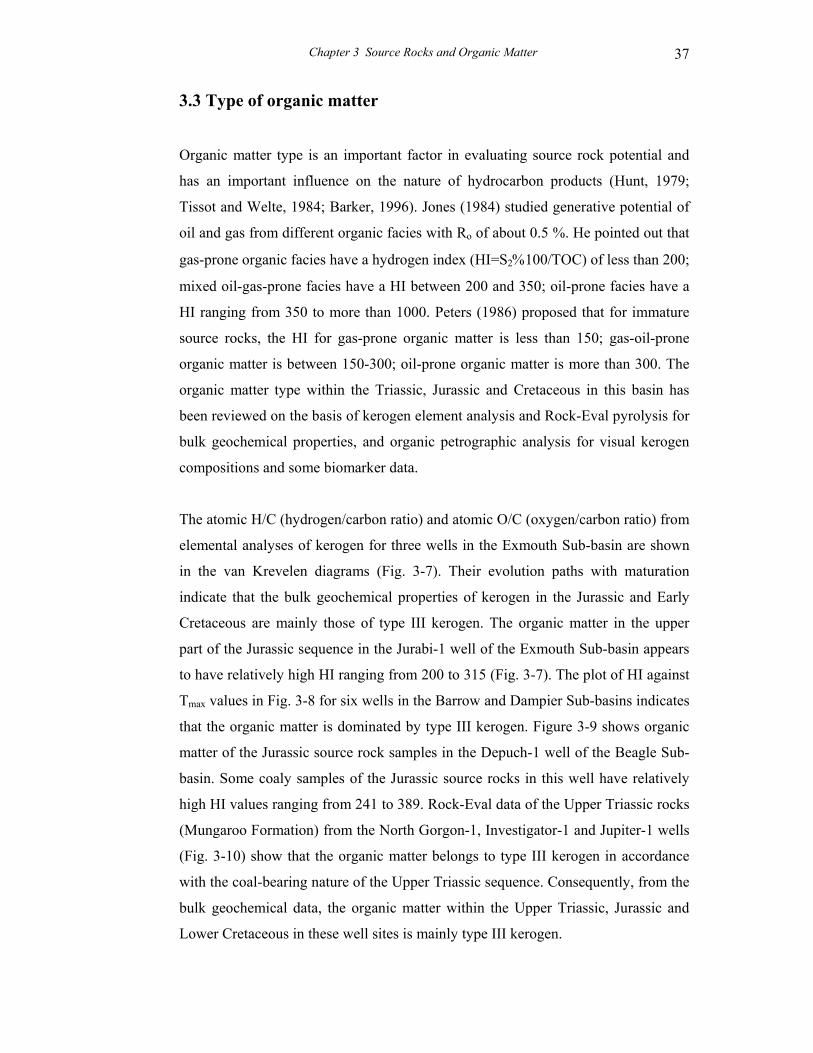
Chapter 3 Source Rocks and Organic Matter 37
3.3 Type of organic matter
Organic matter type is an important factor in evaluating source rock potential and
has an important influence on the nature of hydrocarbon products (Hunt, 1979;
Tissot and Welte, 1984; Barker, 1996). Jones (1984) studied generative potential of
oil and gas from different organic facies with Ro of about 0.5 %. He pointed out that
gas-prone organic facies have a hydrogen index (HI=S2%100/TOC) of less than 200;
mixed oil-gas-prone facies have a HI between 200 and 350; oil-prone facies have a
HI ranging from 350 to more than 1000. Peters (1986) proposed that for immature
source rocks, the HI for gas-prone organic matter is less than 150; gas-oil-prone
organic matter is between 150-300; oil-prone organic matter is more than 300. The
organic matter type within the Triassic, Jurassic and Cretaceous in this basin has
been reviewed on the basis of kerogen element analysis and Rock-Eval pyrolysis for
bulk geochemical properties, and organic petrographic analysis for visual kerogen
compositions and some biomarker data.
The atomic H/C (hydrogen/carbon ratio) and atomic O/C (oxygen/carbon ratio) from
elemental analyses of kerogen for three wells in the Exmouth Sub-basin are shown
in the van Krevelen diagrams (Fig. 3-7). Their evolution paths with maturation
indicate that the bulk geochemical properties of kerogen in the Jurassic and Early
Cretaceous are mainly those of type III kerogen. The organic matter in the upper
part of the Jurassic sequence in the Jurabi-1 well of the Exmouth Sub-basin appears
to have relatively high HI ranging from 200 to 315 (Fig. 3-7). The plot of HI against
Tmax values in Fig. 3-8 for six wells in the Barrow and Dampier Sub-basins indicates
that the organic matter is dominated by type III kerogen. Figure 3-9 shows organic
matter of the Jurassic source rock samples in the Depuch-1 well of the Beagle Sub-
basin. Some coaly samples of the Jurassic source rocks in this well have relatively
high HI values ranging from 241 to 389. Rock-Eval data of the Upper Triassic rocks
(Mungaroo Formation) from the North Gorgon-1, Investigator-1 and Jupiter-1 wells
(Fig. 3-10) show that the organic matter belongs to type III kerogen in accordance
with the coal-bearing nature of the Upper Triassic sequence. Consequently, from the
bulk geochemical data, the organic matter within the Upper Triassic, Jurassic and
Lower Cretaceous in these well sites is mainly type III kerogen.
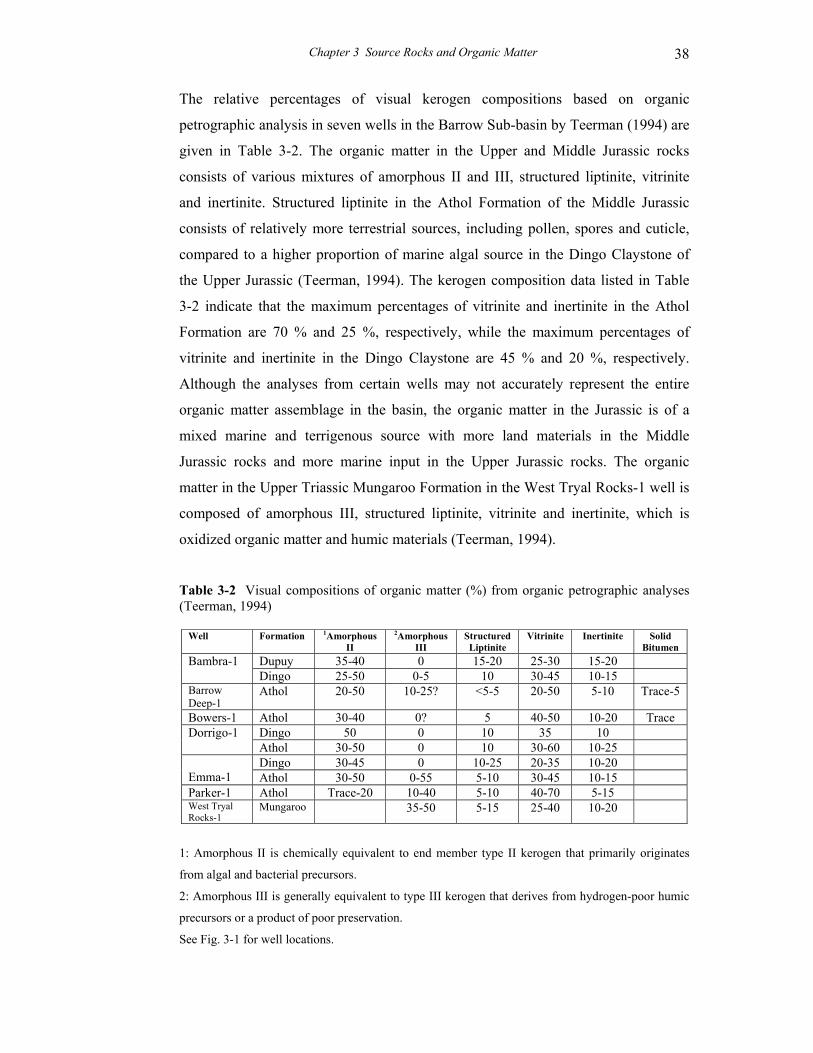
Chapter 3 Source Rocks and Organic Matter 38
The relative percentages of visual kerogen compositions based on organic
petrographic analysis in seven wells in the Barrow Sub-basin by Teerman (1994) are
given in Table 3-2. The organic matter in the Upper and Middle Jurassic rocks
consists of various mixtures of amorphous II and III, structured liptinite, vitrinite
and inertinite. Structured liptinite in the Athol Formation of the Middle Jurassic
consists of relatively more terrestrial sources, including pollen, spores and cuticle,
compared to a higher proportion of marine algal source in the Dingo Claystone of
the Upper Jurassic (Teerman, 1994). The kerogen composition data listed in Table
3-2 indicate that the maximum percentages of vitrinite and inertinite in the Athol
Formation are 70 % and 25 %, respectively, while the maximum percentages of
vitrinite and inertinite in the Dingo Claystone are 45 % and 20 %, respectively.
Although the analyses from certain wells may not accurately represent the entire
organic matter assemblage in the basin, the organic matter in the Jurassic is of a
mixed marine and terrigenous source with more land materials in the Middle
Jurassic rocks and more marine input in the Upper Jurassic rocks. The organic
matter in the Upper Triassic Mungaroo Formation in the West Tryal Rocks-1 well is
composed of amorphous III, structured liptinite, vitrinite and inertinite, which is
oxidized organic matter and humic materials (Teerman, 1994).
Table 3-2 Visual compositions of organic matter (%) from organic petrographic analyses (Teerman, 1994)
Well Formation 1Amorphous II
2Amorphous III
Structured Liptinite
Vitrinite Inertinite Solid Bitumen
Dupuy 35-40 0 15-20 25-30 15-20 Bambra-1 Dingo 25-50 0-5 10 30-45 10-15
Barrow Deep-1
Athol 20-50 10-25? <5-5 20-50 5-10 Trace-5
Bowers-1 Athol 30-40 0? 5 40-50 10-20 Trace Dingo 50 0 10 35 10 Dorrigo-1 Athol 30-50 0 10 30-60 10-25 Dingo 30-45 0 10-25 20-35 10-20
Emma-1 Athol 30-50 0-55 5-10 30-45 10-15 Parker-1 Athol Trace-20 10-40 5-10 40-70 5-15 West Tryal Rocks-1
Mungaroo 35-50 5-15 25-40 10-20
1: Amorphous II is chemically equivalent to end member type II kerogen that primarily originates
from algal and bacterial precursors.
2: Amorphous III is generally equivalent to type III kerogen that derives from hydrogen-poor humic
precursors or a product of poor preservation.
See Fig. 3-1 for well locations.
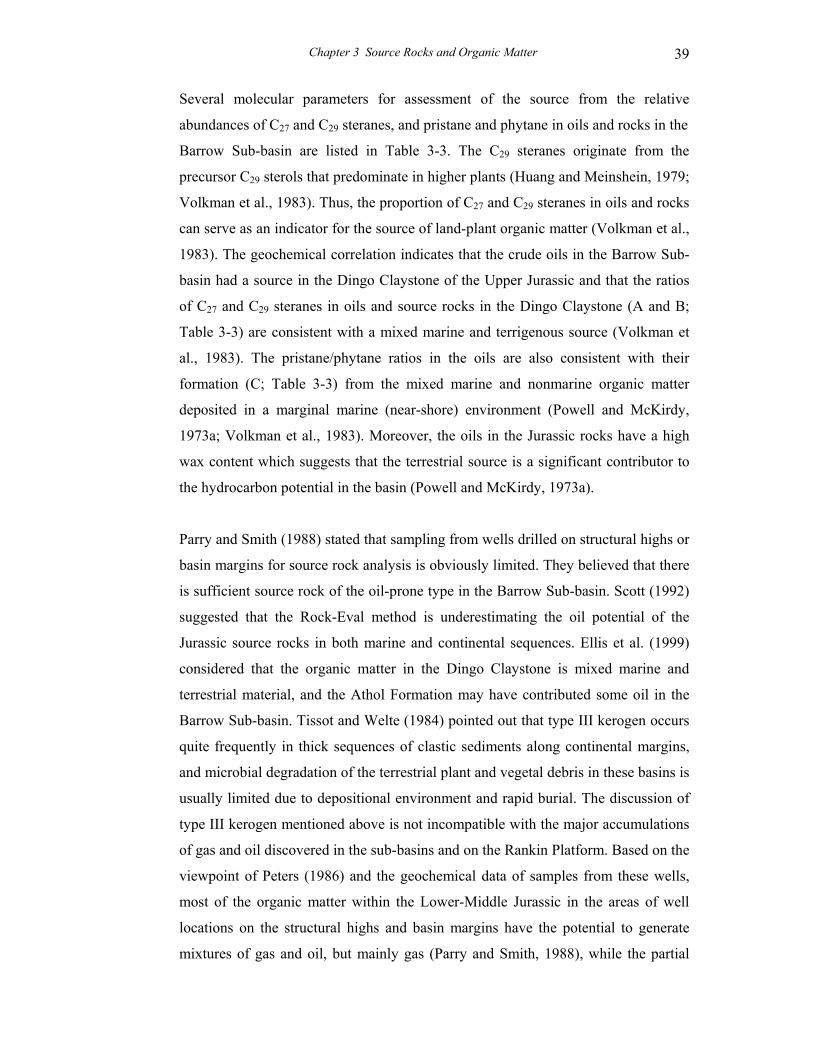
Chapter 3 Source Rocks and Organic Matter 39
Several molecular parameters for assessment of the source from the relative
abundances of C27 and C29 steranes, and pristane and phytane in oils and rocks in the
Barrow Sub-basin are listed in Table 3-3. The C29 steranes originate from the
precursor C29 sterols that predominate in higher plants (Huang and Meinshein, 1979;
Volkman et al., 1983). Thus, the proportion of C27 and C29 steranes in oils and rocks
can serve as an indicator for the source of land-plant organic matter (Volkman et al.,
1983). The geochemical correlation indicates that the crude oils in the Barrow Sub-
basin had a source in the Dingo Claystone of the Upper Jurassic and that the ratios
of C27 and C29 steranes in oils and source rocks in the Dingo Claystone (A and B;
Table 3-3) are consistent with a mixed marine and terrigenous source (Volkman et
al., 1983). The pristane/phytane ratios in the oils are also consistent with their
formation (C; Table 3-3) from the mixed marine and nonmarine organic matter
deposited in a marginal marine (near-shore) environment (Powell and McKirdy,
1973a; Volkman et al., 1983). Moreover, the oils in the Jurassic rocks have a high
wax content which suggests that the terrestrial source is a significant contributor to
the hydrocarbon potential in the basin (Powell and McKirdy, 1973a).
Parry and Smith (1988) stated that sampling from wells drilled on structural highs or
basin margins for source rock analysis is obviously limited. They believed that there
is sufficient source rock of the oil-prone type in the Barrow Sub-basin. Scott (1992)
suggested that the Rock-Eval method is underestimating the oil potential of the
Jurassic source rocks in both marine and continental sequences. Ellis et al. (1999)
considered that the organic matter in the Dingo Claystone is mixed marine and
terrestrial material, and the Athol Formation may have contributed some oil in the
Barrow Sub-basin. Tissot and Welte (1984) pointed out that type III kerogen occurs
quite frequently in thick sequences of clastic sediments along continental margins,
and microbial degradation of the terrestrial plant and vegetal debris in these basins is
usually limited due to depositional environment and rapid burial. The discussion of
type III kerogen mentioned above is not incompatible with the major accumulations
of gas and oil discovered in the sub-basins and on the Rankin Platform. Based on the
viewpoint of Peters (1986) and the geochemical data of samples from these wells,
most of the organic matter within the Lower-Middle Jurassic in the areas of well
locations on the structural highs and basin margins have the potential to generate
mixtures of gas and oil, but mainly gas (Parry and Smith, 1988), while the partial
Chapter 3 Source Rocks and Organic Matter 40
organic matter in the Upper Jurassic source rocks from the organic facies in the
depocentres of the Barrow-Dampier Sub-basins is likely to be more oil-prone. The
kerogen within the Upper Triassic coaly sequence is primarily gas-prone organic
matter.
Table 3-3 Molecular parameters of organic source for paraffinic oils and rocks in the
Barrow Sub-basin
Well Sample Depth (m) Formation A B C
Barrowa Oil 1890 Dupuy (SS) 0.80 1.70 3.10
Barrowa Oil 2010 Dupuy (SS) 0.94 1.20 2.80
Bambra-1b Condensate (RFT) 2051 Barrow (SS) 1.25 0.81 3.46
Bambra-1b Oil 2053.25 Barrow (SS) 1.41 0.88 2.81
Bambra-1b Oil (RFT) 3640.5 Dingo (SS) 0.60 0.56 2.54
Bambra-2b Oil (DST) 2032-2033.5 Barrow (SS) 0.86 1.27 2.39
Bambra-2b Oil (DST) 2037-2038.5 Barrow (SS) 0.88 1.09 1.90
Barrow-1a Core 10 1036 Barrow (ST) 0.54 0.90 2.50
Barrow-1a Core 34 2402 Dingo (ST) 1.00 1.20 2.40
Barrow-1a Core 37 2835 Dingo (CS) 1.30 1.50 2.30
Bambra-1b Core 2715.5 Dupuy (CS) 0.66 0.47 2.40
Bambra-1b Core 2727.8 Dupuy (CS) 0.76 0.82 2.79
Bambra-1b Cuttings 3610 Dingo (CS) 1.00 0.55 2.53
Bambra-2c Core 4274 Athol (CS) 0.79 0.53 1.85
Bambra-2d Core 4283 Athol (CS) 0.93 1.11 3.16
RFT: Repeat formation test; DST: Drill stem test; SS: Sandstone; ST: Siltstone; CS: Claystone. A: C27 (20R)-5α(H), 14α(H), 17α(H)-sterane / C29 (20R)-5α(H), 14α(H), 17α(H)-sterane B: C27 (20R)-13β(H), 17α(H)-diasterane / C29 (20R)-13β(H), 17α(H)-diasterane C: Pristane / Phytane a: Data were taken from Volkman et al. (1983). b: Data were collected from well-completion reports. c: Data were analyzed at Curtin University of Technology (2001). d: Date were analyzed at the Geological Survey of Canada, Calgary (2001). See Fig. 3-1 for well locations.
Figures 3-11, 3-12 and 3-13 are three typical geochemical profiles of the Jurassic
source rocks from the Rock-Eval pyrolysis data for Jurabi-1 in the Exmouth Sub-
basin, Barrow Deep-1/ Barrow-1 in the Barrow Sub-basin and Depuch-1 in the
Beagle Sub-basin.
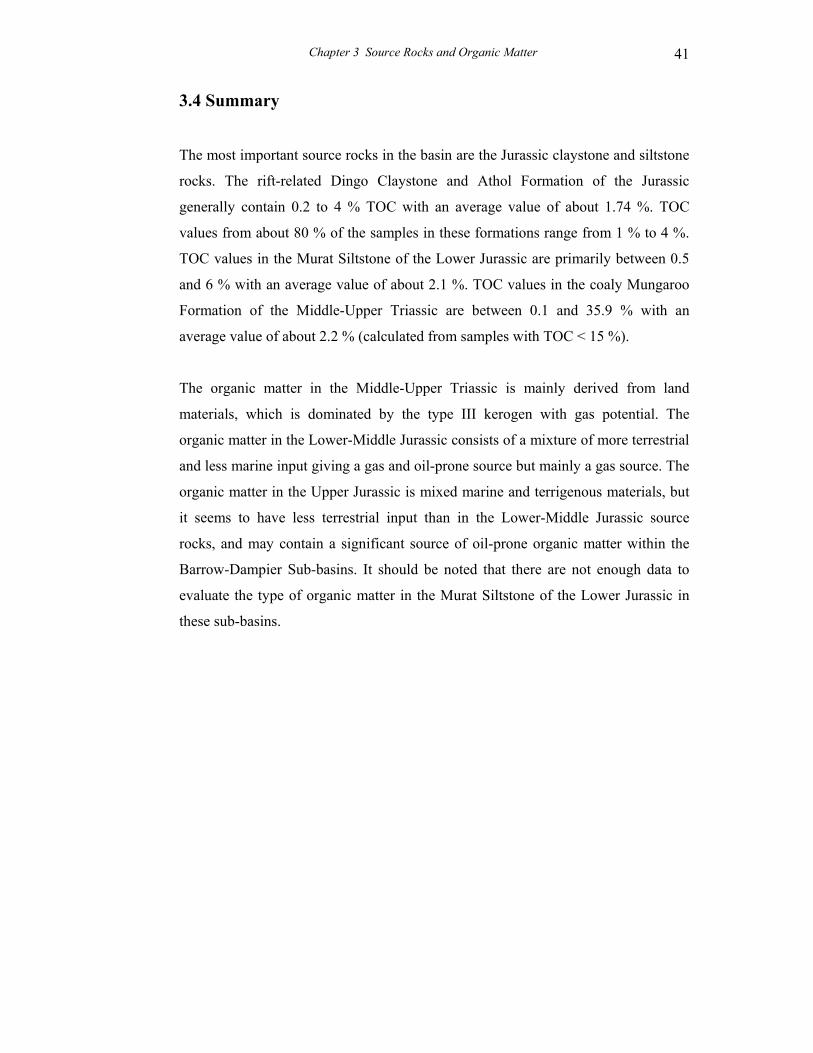
Chapter 3 Source Rocks and Organic Matter 41
3.4 Summary
The most important source rocks in the basin are the Jurassic claystone and siltstone
rocks. The rift-related Dingo Claystone and Athol Formation of the Jurassic
generally contain 0.2 to 4 % TOC with an average value of about 1.74 %. TOC
values from about 80 % of the samples in these formations range from 1 % to 4 %.
TOC values in the Murat Siltstone of the Lower Jurassic are primarily between 0.5
and 6 % with an average value of about 2.1 %. TOC values in the coaly Mungaroo
Formation of the Middle-Upper Triassic are between 0.1 and 35.9 % with an
average value of about 2.2 % (calculated from samples with TOC < 15 %).
The organic matter in the Middle-Upper Triassic is mainly derived from land
materials, which is dominated by the type III kerogen with gas potential. The
organic matter in the Lower-Middle Jurassic consists of a mixture of more terrestrial
and less marine input giving a gas and oil-prone source but mainly a gas source. The
organic matter in the Upper Jurassic is mixed marine and terrigenous materials, but
it seems to have less terrestrial input than in the Lower-Middle Jurassic source
rocks, and may contain a significant source of oil-prone organic matter within the
Barrow-Dampier Sub-basins. It should be noted that there are not enough data to
evaluate the type of organic matter in the Murat Siltstone of the Lower Jurassic in
these sub-basins.
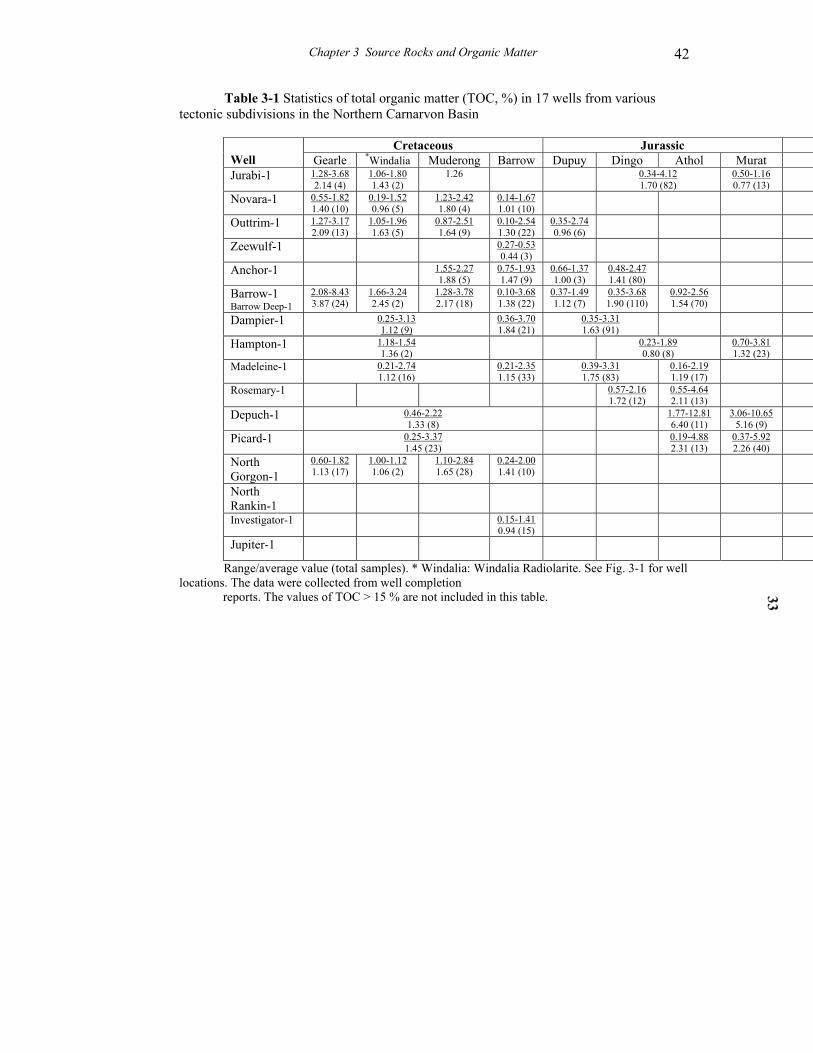
Chapter 3 Source Rocks and Organic Matter 42
Table 3-1 Statistics of total organic matter (TOC, %) in 17 wells from various tectonic subdivisions in the Northern Carnarvon Basin
Cretaceous Jurassic Well Gearle *Windalia Muderong Barrow Dupuy Dingo Athol Murat Jurabi-1 1.28-3.68
2.14 (4) 1.06-1.80 1.43 (2)
1.26 0.34-4.12 1.70 (82)
0.50-1.16 0.77 (13)
Novara-1 0.55-1.82 1.40 (10)
0.19-1.52 0.96 (5)
1.23-2.42 1.80 (4)
0.14-1.67 1.01 (10)
Outtrim-1 1.27-3.17 2.09 (13)
1.05-1.96 1.63 (5)
0.87-2.51 1.64 (9)
0.10-2.54 1.30 (22)
0.35-2.74 0.96 (6)
Zeewulf-1 0.27-0.53 0.44 (3)
Anchor-1 1.55-2.27 1.88 (5)
0.75-1.93 1.47 (9)
0.66-1.37 1.00 (3)
0.48-2.47 1.41 (80)
Barrow-1 Barrow Deep-1
2.08-8.43 3.87 (24)
1.66-3.24 2.45 (2)
1.28-3.78 2.17 (18)
0.10-3.68 1.38 (22)
0.37-1.49 1.12 (7)
0.35-3.68 1.90 (110)
0.92-2.56 1.54 (70)
Dampier-1 0.25-3.13 1.12 (9)
0.36-3.70 1.84 (21)
0.35-3.31 1.63 (91)
Hampton-1 1.18-1.54 1.36 (2)
0.23-1.89 0.80 (8)
0.70-3.81 1.32 (23)
Madeleine-1 0.21-2.74 1.12 (16)
0.21-2.35 1.15 (33)
0.39-3.31 1.75 (83)
0.16-2.19 1.19 (17)
Rosemary-1 0.57-2.16 1.72 (12)
0.55-4.64 2.11 (13)
Depuch-1 0.46-2.22 1.33 (8)
1.77-12.81 6.40 (11)
3.06-10.65 5.16 (9)
Picard-1 0.25-3.37 1.45 (23)
0.19-4.88 2.31 (13)
0.37-5.92 2.26 (40)
North Gorgon-1
0.60-1.82 1.13 (17)
1.00-1.12 1.06 (2)
1.10-2.84 1.65 (28)
0.24-2.00 1.41 (10)
North Rankin-1
Investigator-1 0.15-1.41 0.94 (15)
Jupiter-1
Range/average value (total samples). * Windalia: Windalia Radiolarite. See Fig. 3-1 for well locations. The data were collected from well completion reports. The values of TOC > 15 % are not included in this table.
33
Chapter 4 Assessment of Rock-Eval Tmax Data in Bambra-2
49
CHAPTER 4 ASSESSMENT OF ROCK-EVAL TMAX DATA IN
THE BAMBRA-2 WELL: A CASE STUDY OF THE
CONTAMINATED ROCK-EVAL DATA
4.1 Introduction
Rock-Eval Tmax (oC) is the temperature at which the S2 (mg HC/g rock) peak reaches
its maximum amount of hydrocarbon generation during Rock-Eval pyrolysis (e.g.
Espitalié et al., 1984; Peters, 1986; Tissot et al., 1987). When reliable values are
obtained, Rock-Eval Tmax increases progressively with thermal maturity (e.g.
Espitalié et al., 1984; Tissot and Welte, 1984; Waples, 1985; Peters, 1986). Tissot
and Welte (1984), Peters (1986), and Hunt (1996) have also recognized factors that
influence Tmax values, such as organic matter types, contamination, and the mineral
matrix. Peters (1986) stressed that many maturity parameters, especially Tmax,
depend on the type of organic matter from which they are derived. Tissot et al.
(1987) proposed that Tmax is a good maturation indicator between 420 and 460 oC in
type II kerogen, and between 400 and 600 oC in terrestrially derived type III
kerogen. It has also been shown that Tmax values can be correlated to vitrinite
reflectance for humic coal and type III kerogen (Teichmüller and Durand, 1983;
Espitalié et al., 1984; Waples, 1985; Tissot et al., 1987).
Hunt (1996) and Peters (1986) pointed out that contaminants, such as drilling-mud
additives and natural bitumen, can raise or lower Tmax values depending on their
composition and the relative kerogen concentration. Hunt (1996) reported that heavy
hydrocarbons can cause multiple S2 peaks. He also reported that Tmax values of
about 365 to 375 oC within an interval of 600 metres in a well offshore Louisiana
(Gulf Coast) were derived from cuttings contaminated with cetane (C16H34) due to
the presence of diesel in the mud. Bordenave et al. (1993) reported an example
showing that the Tmax has no meaning when the total organic carbon (TOC) is lower
than 0.3 % and S2 lower than 0.5 mg HC/g rock, especially if an oil base mud is
used. Peters (1986) reported Tmax values for drilling-mud additives, such as walnut
hulls which have a Tmax value of 425 oC. A recent study by Daniel M. Jarvie
Chapter 4 Assessment of Rock-Eval Tmax Data in Bambra-2
50
indicates that walnut hulls will give a Tmax value of about 335 to 360 oC (personal
communication, 2001). Clementz (1979) reported that solid bitumen and the heavy-
end fraction of petroleum produce a measurable response in the S2 temperature
range from 350 to 450 oC. Kruge (1983) also stated that heavy bitumen can affect
the S2 peak causing abnormal Tmax values. Vandenbroucke et al. (1993) showed that
the Tmax values measured on kerogen in the overpressured zone of the Handil field,
Mahakam Delta, Indonesia, are significantly lower than the values measured on the
coal samples, because the organic matter contains a significant percentage of
pyrobitumen. Snowdon (1995) pointed out that Tmax might be suppressed about 1 oC
for each 50 hydrogen index (HI=S2×100/TOC) increment, when it is above 100 to
150 for typical type III organic matter. Peters (1986) noted that samples dominated
by recycled organic matter with equivalent low maturity (Ro < 0.6 %) show
variations in Tmax up to about 10o C.
It has been shown, however, that the use of solvent extraction techniques prior to
Rock-Eval pyrolysis may produce more accurate Tmax values (Clementz, 1979;
Kruge, 1983; Peters, 1986; Tissot et al., 1987). Solvent extraction removes
extraneous and indigenous hydrocarbons that both elute in the S1 (free
hydrocarbons, mg HC/g rock) peak and sometimes carry over into the S2 peak
(Clementz, 1979). Extraction provides a relatively "clean" sample for Rock-Eval
pyrolysis and increased accuracy in Tmax measurements.
This study demonstrates that the cuttings below about 3300 metres in the Bambra-2
well are strongly contaminated, possibly by drilling-mud additives, yielding Tmax
values much lower than those from conventional core and some side-wall core
samples. It also demonstrates that some side-wall cores are also contaminated by
drilling-mud additives such as diesel. Since the measured vitrinite reflectance values
for the Upper-Middle Jurassic source rocks in the Bambra-2 well are anomalously
low (e.g. Kopsen and McGann, 1985; Kaiko and Tingate, 1996) and the Jurassic
sequence is highly overpressured (e.g. Kopsen and McGann, 1985; Tingate et al.,
2001), the case study for the reliability of Rock-Eval Tmax data is significant for
evaluation of the thermal maturity in this well.
Chapter 4 Assessment of Rock-Eval Tmax Data in Bambra-2
51
4.2 Sources of Rock-Eval data
The Bambra-2 well is located in the Barrow Sub-basin of the Northern Carnarvon
Basin, North West Shelf of Western Australia (Fig. 3-1). The well was drilled to a
total depth of 4591 metres (RT) within Middle Jurassic rocks (Fig. 4-1). The
Jurassic sediments are considered to be major source rocks dominated by land-
derived organic matter (e.g. Kopsen and McGann, 1985; Scott, 1992). Rock-Eval
data from 280 cuttings, 21 side-wall cores and 2 conventional core samples, and 4
gas chromatograms (GC) of saturated hydrocarbon fractions were obtained from the
Bambra-2 well. The majority of the Rock-Eval data were measured using standard
methods by the Australian Mineral Development Laboratories (AMDEL) in 1983. In
addition four side-wall core samples, two conventional core samples, and four
cuttings samples, were analyzed with Rock-Eval 6 pyrolysis, using standard
methods at the Geological Survey of Canada, Calgary (GSCC) in 2000. The four
side-wall core samples and three of the cuttings samples were also extracted in a
Soxhlet extraction apparatus using an azeotropic mixture of chloroform:methanol
(87:13) for 24 hours to remove soluble organic matter (both diesel contaminants and
indigenous) in order to examine the effect of the additives on Tmax values. The
Rock-Eval data are shown in Fig. 4-1, Table 4-1 (Rock-Eval data from the
conventional core and the side-wall core samples) and Table 4-2 (Rock-Eval data
from the cuttings samples).
4.3 Gas Chromatography (GC) Analysis
Based on the Bambra-2 Well Completion Report, 5 % and 6 % (by volume) of
diesel was added to the drilling mud at 2424 and 4486 metres respectively (Fig. 4-
1). It was also noted in the well completion report that diesel was present in trace
amounts in the mud system during the drilling from about 3100 to 4485 metres.
Figure 4-2 shows the distinct characteristics of the saturated hydrocarbon fractions
from GC analysis for two conventional core samples (uncontaminated) and from
three examples of side-wall core samples and one cuttings sample. Based on the
distribution of saturated hydrocarbons in Fig. 4-2, these traces indicate that the SWC
and cuttings samples were both contaminated by diesel in the drilling mud. The
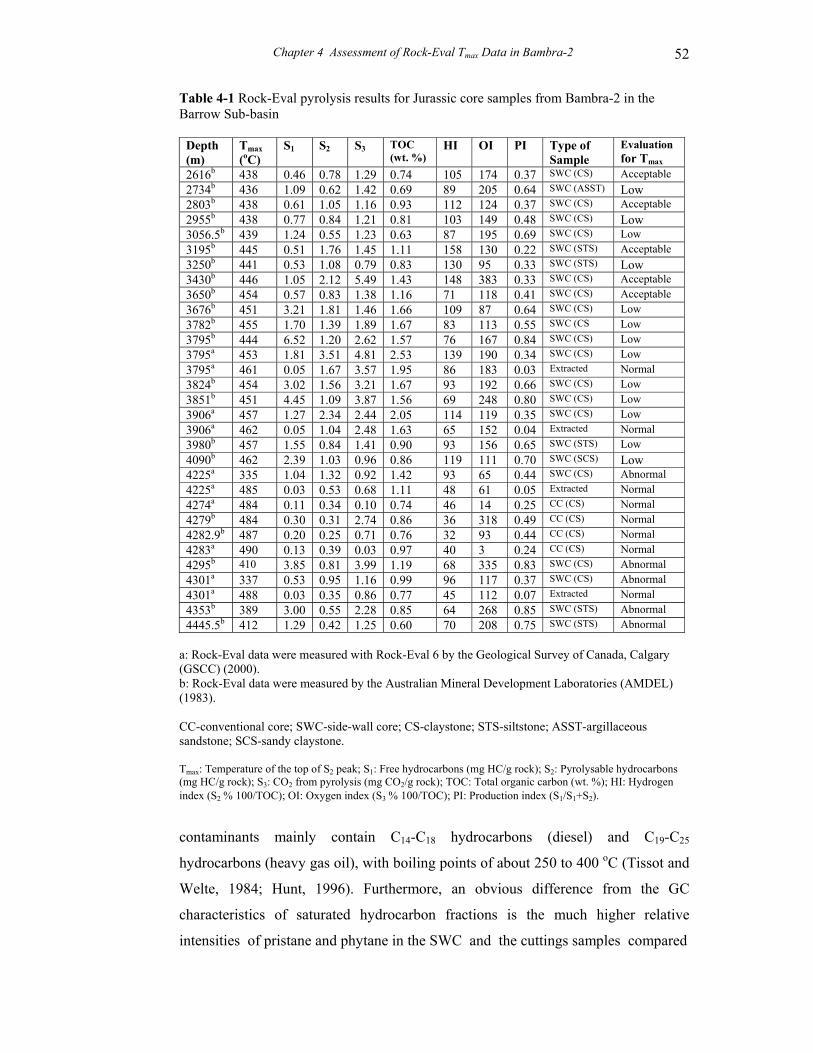
Chapter 4 Assessment of Rock-Eval Tmax Data in Bambra-2
52
Table 4-1 Rock-Eval pyrolysis results for Jurassic core samples from Bambra-2 in the Barrow Sub-basin
Depth (m)
Tmax (oC)
S1 S2 S3 TOC (wt. %)
HI OI PI Type of Sample
Evaluation for Tmax
2616b 438 0.46 0.78 1.29 0.74 105 174 0.37 SWC (CS) Acceptable 2734b 436 1.09 0.62 1.42 0.69 89 205 0.64 SWC (ASST) Low 2803b 438 0.61 1.05 1.16 0.93 112 124 0.37 SWC (CS) Acceptable 2955b 438 0.77 0.84 1.21 0.81 103 149 0.48 SWC (CS) Low 3056.5b 439 1.24 0.55 1.23 0.63 87 195 0.69 SWC (CS) Low 3195b 445 0.51 1.76 1.45 1.11 158 130 0.22 SWC (STS) Acceptable 3250b 441 0.53 1.08 0.79 0.83 130 95 0.33 SWC (STS) Low 3430b 446 1.05 2.12 5.49 1.43 148 383 0.33 SWC (CS) Acceptable 3650b 454 0.57 0.83 1.38 1.16 71 118 0.41 SWC (CS) Acceptable 3676b 451 3.21 1.81 1.46 1.66 109 87 0.64 SWC (CS) Low 3782b 455 1.70 1.39 1.89 1.67 83 113 0.55 SWC (CS Low 3795b 444 6.52 1.20 2.62 1.57 76 167 0.84 SWC (CS) Low 3795a 453 1.81 3.51 4.81 2.53 139 190 0.34 SWC (CS) Low 3795a 461 0.05 1.67 3.57 1.95 86 183 0.03 Extracted Normal 3824b 454 3.02 1.56 3.21 1.67 93 192 0.66 SWC (CS) Low 3851b 451 4.45 1.09 3.87 1.56 69 248 0.80 SWC (CS) Low 3906a 457 1.27 2.34 2.44 2.05 114 119 0.35 SWC (CS) Low 3906a 462 0.05 1.04 2.48 1.63 65 152 0.04 Extracted Normal 3980b 457 1.55 0.84 1.41 0.90 93 156 0.65 SWC (STS) Low 4090b 462 2.39 1.03 0.96 0.86 119 111 0.70 SWC (SCS) Low 4225a 335 1.04 1.32 0.92 1.42 93 65 0.44 SWC (CS) Abnormal 4225a 485 0.03 0.53 0.68 1.11 48 61 0.05 Extracted Normal 4274a 484 0.11 0.34 0.10 0.74 46 14 0.25 CC (CS) Normal 4279b 484 0.30 0.31 2.74 0.86 36 318 0.49 CC (CS) Normal 4282.9b 487 0.20 0.25 0.71 0.76 32 93 0.44 CC (CS) Normal 4283a 490 0.13 0.39 0.03 0.97 40 3 0.24 CC (CS) Normal 4295b 410 3.85 0.81 3.99 1.19 68 335 0.83 SWC (CS) Abnormal 4301a 337 0.53 0.95 1.16 0.99 96 117 0.37 SWC (CS) Abnormal 4301a 488 0.03 0.35 0.86 0.77 45 112 0.07 Extracted Normal 4353b 389 3.00 0.55 2.28 0.85 64 268 0.85 SWC (STS) Abnormal 4445.5b 412 1.29 0.42 1.25 0.60 70 208 0.75 SWC (STS) Abnormal
a: Rock-Eval data were measured with Rock-Eval 6 by the Geological Survey of Canada, Calgary (GSCC) (2000). b: Rock-Eval data were measured by the Australian Mineral Development Laboratories (AMDEL) (1983). CC-conventional core; SWC-side-wall core; CS-claystone; STS-siltstone; ASST-argillaceous sandstone; SCS-sandy claystone. Tmax: Temperature of the top of S2 peak; S1: Free hydrocarbons (mg HC/g rock); S2: Pyrolysable hydrocarbons (mg HC/g rock); S3: CO2 from pyrolysis (mg CO2/g rock); TOC: Total organic carbon (wt. %); HI: Hydrogen index (S2 % 100/TOC); OI: Oxygen index (S3 % 100/TOC); PI: Production index (S1/S1+S2).
contaminants mainly contain C14-C18 hydrocarbons (diesel) and C19-C25
hydrocarbons (heavy gas oil), with boiling points of about 250 to 400 oC (Tissot and
Welte, 1984; Hunt, 1996). Furthermore, an obvious difference from the GC
characteristics of saturated hydrocarbon fractions is the much higher relative
intensities of pristane and phytane in the SWC and the cuttings samples compared

Chapter 4 Assessment of Rock-Eval Tmax Data in Bambra-2
53
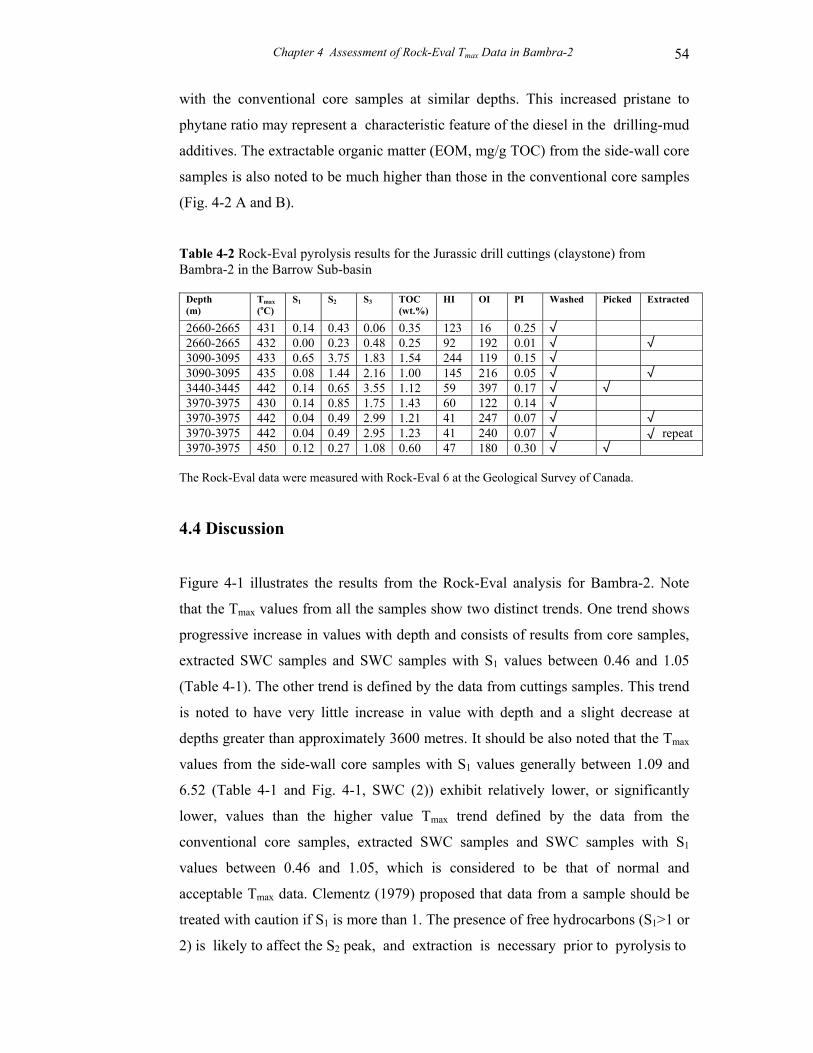
Chapter 4 Assessment of Rock-Eval Tmax Data in Bambra-2
54
with the conventional core samples at similar depths. This increased pristane to
phytane ratio may represent a characteristic feature of the diesel in the drilling-mud
additives. The extractable organic matter (EOM, mg/g TOC) from the side-wall core
samples is also noted to be much higher than those in the conventional core samples
(Fig. 4-2 A and B).
Table 4-2 Rock-Eval pyrolysis results for the Jurassic drill cuttings (claystone) from Bambra-2 in the Barrow Sub-basin
Depth (m)
Tmax (oC)
S1 S2 S3 TOC (wt.%)
HI OI PI Washed Picked Extracted
2660-2665 431 0.14 0.43 0.06 0.35 123 16 0.25 √ 2660-2665 432 0.00 0.23 0.48 0.25 92 192 0.01 √ √ 3090-3095 433 0.65 3.75 1.83 1.54 244 119 0.15 √ 3090-3095 435 0.08 1.44 2.16 1.00 145 216 0.05 √ √ 3440-3445 442 0.14 0.65 3.55 1.12 59 397 0.17 √ √ 3970-3975 430 0.14 0.85 1.75 1.43 60 122 0.14 √ 3970-3975 442 0.04 0.49 2.99 1.21 41 247 0.07 √ √
3970-3975 442 0.04 0.49 2.95 1.23 41 240 0.07 √ √ repeat 3970-3975 450 0.12 0.27 1.08 0.60 47 180 0.30 √ √
The Rock-Eval data were measured with Rock-Eval 6 at the Geological Survey of Canada.
4.4 Discussion
Figure 4-1 illustrates the results from the Rock-Eval analysis for Bambra-2. Note
that the Tmax values from all the samples show two distinct trends. One trend shows
progressive increase in values with depth and consists of results from core samples,
extracted SWC samples and SWC samples with S1 values between 0.46 and 1.05
(Table 4-1). The other trend is defined by the data from cuttings samples. This trend
is noted to have very little increase in value with depth and a slight decrease at
depths greater than approximately 3600 metres. It should be also noted that the Tmax
values from the side-wall core samples with S1 values generally between 1.09 and
6.52 (Table 4-1 and Fig. 4-1, SWC (2)) exhibit relatively lower, or significantly
lower, values than the higher value Tmax trend defined by the data from the
conventional core samples, extracted SWC samples and SWC samples with S1
values between 0.46 and 1.05, which is considered to be that of normal and
acceptable Tmax data. Clementz (1979) proposed that data from a sample should be
treated with caution if S1 is more than 1. The presence of free hydrocarbons (S1>1 or
2) is likely to affect the S2 peak, and extraction is necessary prior to pyrolysis to

Chapter 4 Assessment of Rock-Eval Tmax Data in Bambra-2
55
Chapter 4 Assessment of Rock-Eval Tmax Data in Bambra-2
56
avoid misinterpretation of the Rock-Eval data (Kruge, 1983). The extracted samples
can generally give more reliable Tmax values (Clementz, 1979; Kruge, 1983; Peters,
1986; Tissot et al., 1987). Tmax values for some unextracted side-wall core samples
with relatively low S1 values are considered acceptable, based on the increasing Tmax
trend (Fig. 4-1). The relatively low and abnormally low Tmax values (<
approximately 415 oC) from the side-wall cores, especially those with S1 values
more than 1 and anomalously high PI (production indices=S1/S1+S2) (Table 4-1), are
thought to be caused by the diesel added to the mud at 2424 and 4486 metres. The
observation of bitumen in thin- sections of the source rocks suggests that the
difference of S2 values between the extracted and unextracted SWC samples (the
lower Tmax values in SWC) may be influenced by natural heavy bitumen to some
extent. This problem may be overcome by solvent extraction prior to pyrolysis (e.g.
Clementz, 1979; Kruge, 1983). In fact, if the S2 peak is shifted and/or altered by any
additive, the Tmax value may be dramatically affected.
Comparisons of the Rock-Eval data from the cuttings, the side-wall cores and the
conventional core samples indicate that total organic carbon and hydrogen indices in
the cuttings and the side-wall cores are likely to be increased by organic
contaminants such as the diesel (Fig. 4-1 and Table 4-1). Anomalously high PI in
the cuttings between 2424 and 3076 metres, and from 4486 metres to total depth, are
related to the diesel contaminated drilling mud. This is reflected in the low Tmax
values from the cuttings samples, especially from about 3300 metres to total depth
which are much lower than those from the Tmax trend defined by the conventional
core samples, extracted SWC samples and SWC samples with S1 values between
0.46 and 1.05 (Table 4-1; Fig. 4-1). The Tmax values from the cuttings samples,
between 2424 and 3100 metres, generally range from 430 oC to 439 oC. Between
about 3100 and 4430 metres, they generally range from 415 oC to 439 oC with the
lowest value being 334 oC. In the depth interval from about 4430 to 4500 metres, the
Tmax values from the cuttings samples range from 436 oC to 468 oC, which is
significantly higher than the shallower Tmax values but these values are still also
obviously lower than those from the conventional core samples and extracted SWC
samples. From 4500 metres to total depth, the cuttings samples are considered to be
heavily contaminated by the diesel. This is indicated by the anomalously low Tmax
values of 383 to 401 oC (Fig. 4-1).
Chapter 4 Assessment of Rock-Eval Tmax Data in Bambra-2
57
Four cuttings samples were washed and air-dried for Rock-Eval 6 pyrolysis, and a duplicate sample for three of them was also extracted for additional Rock-Eval 6 pyrolysis. Table 4-2 shows that the Tmax values for the washed cuttings range from 430 oC to 433 oC. The values for the washed and extracted cuttings range from 432 oC to 442 oC. Two cuttings samples at 3440-3445 metres and 3970-3975 metres were also picked free of contaminants after being water-washed and air-dried, and the two Tmax values of 442 oC and 450 oC obtained from Rock-Eval 6 pyrolysis (Table 4-2), which are significantly higher than the previous trend from cuttings (Fig.4-1). It should be noted that although these values are still lower than those indicated by the conventional core and extracted SWC trend, it does indicate a marked increase from the samples that had not been picked. The results from picked and extracted samples strongly suggest that at least part of the difference in Tmax values between the cuttings samples and the core samples may have been caused by the contamination by the diesel and other drilling-mud additives. It also indicates that even when dealing with extracted cuttings samples other factors may influence the results, therefore, care should be taken in the final interpretation of the results. Additionally, for the cuttings samples, between approximately 4500 and 4591 metres, it would seem that contamination by the diesel is likely to be the major cause for the higher S1 and PI with correspondingly low Tmax values ranging between 383 and 410 oC (Fig. 4-1).
Based on the analysis of migrated hydrocarbon in the Barrow Group from the well completion report, the Tmax values over the upper part of the group between 2000 and 2300 metres (Fig. 4-1) may be suppressed by 2 to 10 oC by the natural hydrocarbon compared to the Tmax trend from the core samples which increase regularly with depth. The Tmax values in the top part of the Barrow Group and the Muderong Shale between 1630 and 2000 metres (Fig. 4-1) may be related to recycled organic matter to some extent, which may cause the Tmax values to rise by up to several degrees compared to the "normal" Tmax trend. Although depositional environment and organic facies may also influence the Tmax values, the influence should be minor in the present Tmax data, because of the type III kerogen and clastic lithologies in this well.
Hunt (1996) proposed that Tmax values should be rejected if HI is less than 50 mg
HC/g TOC or if S2 is less than 0.2 mg HC/g rock. However, Tmax values from the
conventional core samples from 4274 to 4283 metres in Table 4-1 are 484 to 490 oC
Chapter 4 Assessment of Rock-Eval Tmax Data in Bambra-2
58
with HI ranging from 32 to 46 and S2 ranging from 0.25 to 0.39. These Tmax values
should be considered normal results for three reasons. Firstly, two examples of gas
chromatograms of saturated fractions from the conventional core samples at 4274.2
and 4282.9 metres in Fig. 4-2 show that the organic matter is obviously mature (e.g.
Allan and Douglas, 1977). Thus, thermal maturity is the major cause of the low HI.
Secondly, the Tmax from the solvent extracted side-wall cores at 4225 and 4301
metres give similar Tmax values to the conventional core samples (Table 4-1), and
the Tmax values of 485 oC and 488 oC indicate a high maturity level. Finally, average
vitrinite reflectance values of 1.45 % to 1.74 % were measured in the conventional
core sample at 4274 metres by Dr. L.W. Gurba (University of New South Wales)
and Dr. Alex Kaiko (Curtin University of Technology), corresponding to Tmax
values of 470 to 490 oC (Teichmüller and Durand, 1983; Espitalié et al., 1984;
Tissot et al., 1987). Obviously, the Tmax values of the conventional core samples are
in agreement with the higher maturity assessment from the vitrinite reflectance
measurements.
4.5 Summary
In this study, it was found that the main problems to affect Tmax data in the Bambra-
2 well included (1) contamination by drilling mud additives, (2) natural
hydrocarbons, and (3) recycled organic matter. The cuttings samples in the Barrow
Group may be contaminated by natural hydrocarbons, resulting in their Tmax values
being 2 to 10 oC lower than the regularly increasing Tmax trend from core samples.
The Tmax values in the cuttings in the Jurassic section, especially from about 3300
metres to total depth, within the higher maturity interval, in the Bambra-2 well, were
significantly lowered by contamination by drilling-mud additives, including diesel.
The GC analysis indicates that the use of diesel in drilling mud is considered to be
the major cause for the abnormal and low Tmax values in the side-wall cores.
Generally, the Tmax values, from the SWC with S1<1, the solvent extracted SWC and
the conventional core samples, provide a relatively reliable maturity trend in this
well. This study indicates that higher quality Rock-Eval Tmax results are obtained
from the conventional core samples and the relatively cleaned samples. The study
also suggests that samples with a HI between 30 and 50 in higher maturity zones
should provide valid Tmax values in this case.
Chapter 5 Deep Overpressure and Top Pressure Seal 59
CHAPTER 5 DEEP OVERPRESSURED SYSTEM AND
TOP PRESSURE SEAL
5.1 Introduction
Overpressure distribution in the Northern Carnarvon Basin has been investigated by
Horstman (1988), Zaunbrecher (1994), Yassir (1996), van Ruth et al. (2000) and
Tingate et al. (2001). Overpressure in the Northern Carnarvon Basin is observed in
the Early Cretaceous Muderong Shale and Barrow Group, the Jurassic sequences
and the Mungaroo Formation of Triassic age (Zaunbrecher, 1994; Tingate et al.,
2001). This study focuses on the fluid pressure modelling in the deep overpressured
system in the Jurassic section in the sub-basins of the Northern Carnarvon Basin.
The deep overpressured system is evidenced by the measured fluid pressure data,
including repeat formation tests (RFT) and drill stem tests (DST), and is also
confirmed by mud weights and well-log responses associated with high sonic transit
times and low resistivity values in the Jurassic fine-grained rocks.
A pressure seal within a rock layer is defined as capable of confining anomalous
pressure over geological time (e.g. Hunt, 1990; Deming, 1994). Hunt (1990) stated
that the tops of many compartment seals in clastic rocks appear to consist of
multiple bands of calcite mineralization along a thermocline where temperatures
range from 90 oC to 100 oC. The pressure seal is a cement diagenetic layer
(Weedman et al., 1996), and the cementation process causes the precipitation of
minerals in the pore space (Wangen, 2000). Weedman et al. (1996) noted that most
of the cement diagenesis occurred before the pressure seal became effective as a
permeability barrier. Quartz overgrowth precipitation forms at 80-110 oC (Bjørlykke
and Egeberg, 1993; Walderhaug, 1996; Weedman et al., 1996), and the calcite
cement precipitation forms at about 100-135 oC (Weedman et al., 1996).
5.2 Overpressure and petrophysical data
Relevant data from eight wells are used in this study. The wells in the Barrow Sub-
basin are clustered in three groups (1) “Barrow Island” (Barrow-1 and Barrow
Chapter 5 Deep Overpressure and Top Pressure Seal 60
Deep-1, which is a deeper well close to Barrow-1), (2) the “Bambra location”
(Bambra-1 and Bambra-2), and (3) the “West Barrow location” (West Barrow-1/1A
and West Barrow-2). The selected Jurabi-1 well is in the Exmouth Sub-basin and the
Dampier-1 well is in the Dampier Sub-basin. Figure 3-1 shows the locations of these
wells. Pressure data from Barrow Deep-1 have been used in a previously published
studied by Tingate et al. (2001).
5.2.1 Measured fluid pressure data for overpressure
Overpressure is the condition when pore-fluid pressure exceeds hydrostatic pressure
(a static column of water or brine) for a given depth (Dickinson, 1953; Bradley,
1975). The hydrostatic pressure gradient of a fresh water column is 0.0098 MPa/m
(0.43 psi/ft) (Hunt, 1990). Hunt (1990) pointed out that the pressure/depth gradient
of a saturated salt solution is 0.012 MPa/m (0.53 psi/ft), and any pressures outside
this limit are considered to exhibit abnormally high fluid pressure (overpressure).
Usually the fluid pressures are measured by repeat formation tests (RFT) and drill
stem tests (DST) at specific depths in permeable formations, and these are valuable
control points for fluid pressures in a pressure profile from an individual well. The
RFT is specifically designed to evaluate formation pressures (Swarbrick, 1995).
Mud weight can act as a rough approximation for the trend of fluid pressure within a
well because it is used to overbalance pore fluid pressures by a small amount during
drilling. It is important to distinguish and discard data that reflect a significantly
overbalanced drilling condition. Horstman (1988) indicated that on the North West
Shelf a formation is considered to be overpressured if a mud weight of 0.0125
MPa/m (1.25 g/cm3 Specific Gravity) is encountered. van Ruth et al. (2000)
considered that the mud pressure is a fairly reliable indicator of pore pressure in
permeable formations of the North West Shelf. They also proposed that the mud
weight gradient of 0.0125 MPa/m demarcates the boundary between the
overpressured and normally pressured regimes in the North West Shelf basins.
However, it must be remembered that mud weight is often only the "best guess" of
the drilling engineers as to where the overpressured formations are situated.
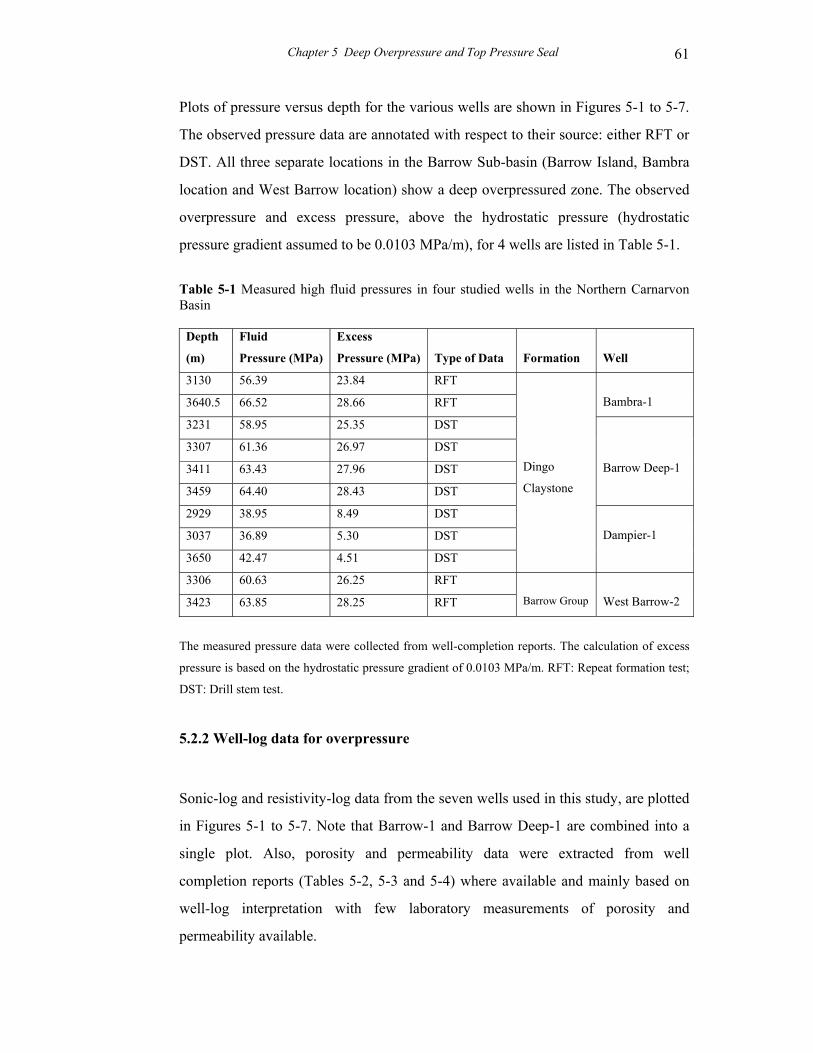
Chapter 5 Deep Overpressure and Top Pressure Seal 61
Plots of pressure versus depth for the various wells are shown in Figures 5-1 to 5-7.
The observed pressure data are annotated with respect to their source: either RFT or
DST. All three separate locations in the Barrow Sub-basin (Barrow Island, Bambra
location and West Barrow location) show a deep overpressured zone. The observed
overpressure and excess pressure, above the hydrostatic pressure (hydrostatic
pressure gradient assumed to be 0.0103 MPa/m), for 4 wells are listed in Table 5-1.
Table 5-1 Measured high fluid pressures in four studied wells in the Northern Carnarvon Basin
Depth
(m)
Fluid
Pressure (MPa)
Excess
Pressure (MPa)
Type of Data
Formation
Well
3130 56.39 23.84 RFT
3640.5 66.52 28.66 RFT
Bambra-1
3231 58.95 25.35 DST
3307 61.36 26.97 DST
3411 63.43 27.96 DST
3459 64.40 28.43 DST
Barrow Deep-1
2929 38.95 8.49 DST
3037 36.89 5.30 DST
3650 42.47 4.51 DST
Dingo
Claystone
Dampier-1
3306 60.63 26.25 RFT
3423 63.85 28.25 RFT
Barrow Group
West Barrow-2
The measured pressure data were collected from well-completion reports. The calculation of excess
pressure is based on the hydrostatic pressure gradient of 0.0103 MPa/m. RFT: Repeat formation test;
DST: Drill stem test.
5.2.2 Well-log data for overpressure
Sonic-log and resistivity-log data from the seven wells used in this study, are plotted
in Figures 5-1 to 5-7. Note that Barrow-1 and Barrow Deep-1 are combined into a
single plot. Also, porosity and permeability data were extracted from well
completion reports (Tables 5-2, 5-3 and 5-4) where available and mainly based on
well-log interpretation with few laboratory measurements of porosity and
permeability available.
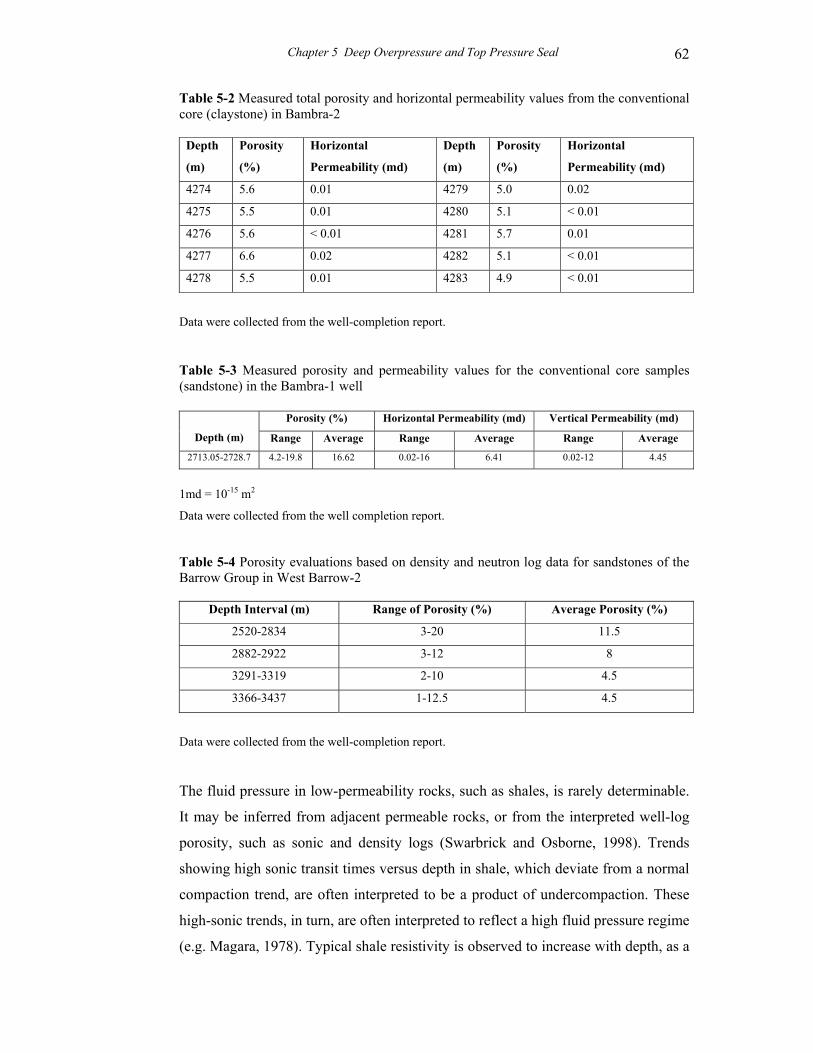
Chapter 5 Deep Overpressure and Top Pressure Seal 62
Table 5-2 Measured total porosity and horizontal permeability values from the conventional core (claystone) in Bambra-2
Depth
(m)
Porosity
(%)
Horizontal
Permeability (md)
Depth
(m)
Porosity
(%)
Horizontal
Permeability (md)
4274 5.6 0.01 4279 5.0 0.02
4275 5.5 0.01 4280 5.1 < 0.01
4276 5.6 < 0.01 4281 5.7 0.01
4277 6.6 0.02 4282 5.1 < 0.01
4278 5.5 0.01 4283 4.9 < 0.01
Data were collected from the well-completion report.
Table 5-3 Measured porosity and permeability values for the conventional core samples (sandstone) in the Bambra-1 well
Porosity (%) Horizontal Permeability (md) Vertical Permeability (md)
Depth (m) Range Average Range Average Range Average
2713.05-2728.7 4.2-19.8 16.62 0.02-16 6.41 0.02-12 4.45
1md = 10-15 m2
Data were collected from the well completion report.
Table 5-4 Porosity evaluations based on density and neutron log data for sandstones of the Barrow Group in West Barrow-2
Depth Interval (m) Range of Porosity (%) Average Porosity (%)
2520-2834 3-20 11.5
2882-2922 3-12 8
3291-3319 2-10 4.5
3366-3437 1-12.5 4.5
Data were collected from the well-completion report.
The fluid pressure in low-permeability rocks, such as shales, is rarely determinable.
It may be inferred from adjacent permeable rocks, or from the interpreted well-log
porosity, such as sonic and density logs (Swarbrick and Osborne, 1998). Trends
showing high sonic transit times versus depth in shale, which deviate from a normal
compaction trend, are often interpreted to be a product of undercompaction. These
high-sonic trends, in turn, are often interpreted to reflect a high fluid pressure regime
(e.g. Magara, 1978). Typical shale resistivity is observed to increase with depth, as a
Chapter 5 Deep Overpressure and Top Pressure Seal 63
complex function of decrease of saline-, bound- and pore-water volume versus a
relative increase of electrically conductive clay minerals. However, in many
overpressured zones, shale resistivity has been observed to decrease with depth (e.g.
Bigelow, 1994a; Hermanrud et al. 1998).
Hermanrud et al. (1998) proposed that both sonic and resistivity logs may also be
influenced by textural changes induced by overpressuring in shales without
abnormally high porosities from wells on Haltenbanken, offshore Mid-Norway.
They suggested that resistivity logs might respond directly to fluid overpressuring
because of increase fluid connectivity in the microfractures of the overpressured
shales rather than "indirectly" to anomalous shale porosity, as predicted by the
undercompaction mechanism. They also suggested that the sonic-log produces a
higher transit time (lower formation velocity), because of reduced transport capacity
in the matrix of the overpressured rocks.
In evaluating porosity and permeability of the fine-grained (clay-dominated) rocks
for the studied wells in the Barrow and Exmouth Sub-basins, intervals with gamma-
ray values greater than 80 API units in Cretaceous formations and greater than 90
API units in Jurassic sequences were selected. These gamma-ray values reflect
typical "shale-base-lines" for these sequences. The resistivity analysis was based on
the deep induction log (RILD). Induction logs can be run in all types of drilling mud
(Bigelow, 1994a). It was assumed that the deep induction log records relatively
accurate formation resistivity values in thick (> 1.5 m), resistive zones with true
formation resistivity values less than 100 ohm/meters (Asquith and Gibson, 1983).
The lithologies in the Jurassic overpressured system are dominated by massive
organic-rich claystones and siltstones. Tingate et al. (2001) stated that all
overpressure occurrences are accompanied by an increase in sonic transit time.
These well-log data, in combination with the measured high fluid pressures in the
Jurassic sandstones, can be explained by overpressuring in the Jurassic fine-grained
rocks.
In the Barrow Sub-basin, on the basis of the available density-log data at 2800-3660
metres in Bambra-1 (Fig. 5-3), the bulk density-log readings in the Jurassic
overpressured sequence are about 2.57-2.63 kg/m3 without any abnormal trend.
Chapter 5 Deep Overpressure and Top Pressure Seal 64
Thus, the density-log-derived porosities could be smaller than 6 % in the observed
overpressured compartment, which are significantly less than the calculated sonic-
derived porosities of 13 to 18 % and resistivity-derived porosities of 9 to 11 % in the
compartment of this well. The measurements of total porosity from a conventional
core (claystone) between 4274 and 4283 metres in the overpressured system in
Bambra-2 range from 4.9 % to 6.6 % (Table 5-2). The ranges of the measured bulk
density and matrix density for the core are 2.55 and 2.56 kg/m3 and 2.63 to 2.64
kg/m3, respectively. However, the calculated sonic-derived and resistivity-derived
porosities are 13.5 to 17.6 % (sonic transit times: 279 to 295 3s/m) and 11.6 to12.5
% (resistivity values: 2.31 to 2.71 ohmm), respectively, at this specific depth
interval in this well. Again, the overpressured zone of the lower part of the Barrow
Group in the West Barrow wells is also associated with high sonic transit times and
low resistivity values in mudstones (Figures 5-6 and 5-7). However, the average
bulk density-log readings for the fine-grained rocks are about 2.55 to 2.65 kg/m3,
and do not exhibit a density (or porosity) anomaly within the overpressured zone
(3000 metres to a total depth of 3520 metres) in West Barrow-1/1A (Fig. 5-6).
In the Exmouth Sub-basin, the density-log from 3200 to 3550 metres within the
major Jurassic overpressured zone in Jurabi-1 (Fig. 5-4) indicates that the bulk
density values range from 2.60 kg/m3 to 2.65 kg/m3, which in turn suggest that the
porosities in the overpressured interval could be lower than 4 %. However, the
sonic-derived and resistivity-derived porosities are estimated to be 6 to 12 % from
the sonic transit times of 250 to 275 3s/m and 7.8 to 9.6 % from resistivity values
of 3.9 to 5.9 ohmm, respectively. The results illustrate that the porosities in situ in
the main overpressured zone are also lower than the calculated porosities based on
the sonic-log and resistivity-log data in the fine-grained rocks.
The correlation of the acoustic, electric, density well-log data and the measured porosities in the claystone and siltstone-dominated highly overpressured zone suggests that the actual porosity values are likely to be significantly lower than the sonic-log and resistivity-log-derived porosities in these cases. This also suggests that the present-day Jurassic overpressured source rocks do not have a significant porosity anomaly due to underpressure. In other words, it seems that most of the porosity in the overpressured source section has been lost through compaction. This
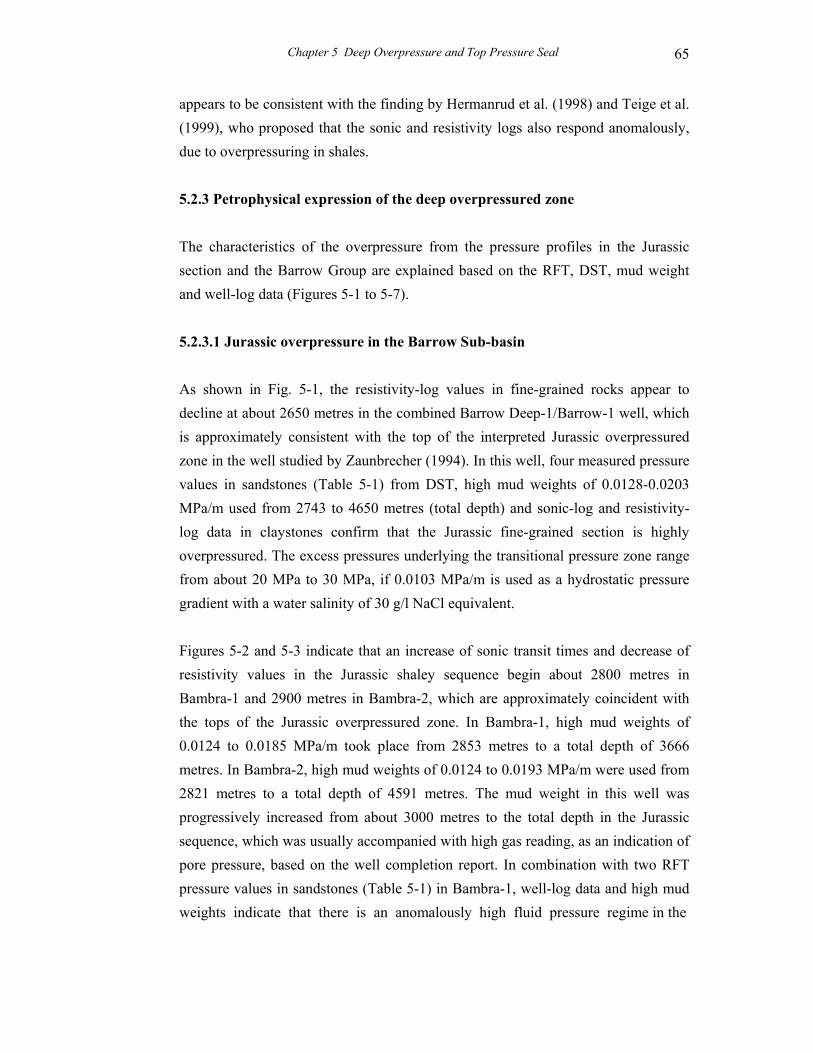
Chapter 5 Deep Overpressure and Top Pressure Seal 65
appears to be consistent with the finding by Hermanrud et al. (1998) and Teige et al. (1999), who proposed that the sonic and resistivity logs also respond anomalously, due to overpressuring in shales. 5.2.3 Petrophysical expression of the deep overpressured zone The characteristics of the overpressure from the pressure profiles in the Jurassic section and the Barrow Group are explained based on the RFT, DST, mud weight and well-log data (Figures 5-1 to 5-7). 5.2.3.1 Jurassic overpressure in the Barrow Sub-basin As shown in Fig. 5-1, the resistivity-log values in fine-grained rocks appear to decline at about 2650 metres in the combined Barrow Deep-1/Barrow-1 well, which is approximately consistent with the top of the interpreted Jurassic overpressured zone in the well studied by Zaunbrecher (1994). In this well, four measured pressure values in sandstones (Table 5-1) from DST, high mud weights of 0.0128-0.0203 MPa/m used from 2743 to 4650 metres (total depth) and sonic-log and resistivity-log data in claystones confirm that the Jurassic fine-grained section is highly overpressured. The excess pressures underlying the transitional pressure zone range from about 20 MPa to 30 MPa, if 0.0103 MPa/m is used as a hydrostatic pressure gradient with a water salinity of 30 g/l NaCl equivalent. Figures 5-2 and 5-3 indicate that an increase of sonic transit times and decrease of resistivity values in the Jurassic shaley sequence begin about 2800 metres in Bambra-1 and 2900 metres in Bambra-2, which are approximately coincident with the tops of the Jurassic overpressured zone. In Bambra-1, high mud weights of 0.0124 to 0.0185 MPa/m took place from 2853 metres to a total depth of 3666 metres. In Bambra-2, high mud weights of 0.0124 to 0.0193 MPa/m were used from 2821 metres to a total depth of 4591 metres. The mud weight in this well was progressively increased from about 3000 metres to the total depth in the Jurassic sequence, which was usually accompanied with high gas reading, as an indication of pore pressure, based on the well completion report. In combination with two RFT pressure values in sandstones (Table 5-1) in Bambra-1, well-log data and high mud weights indicate that there is an anomalously high fluid pressure regime in the
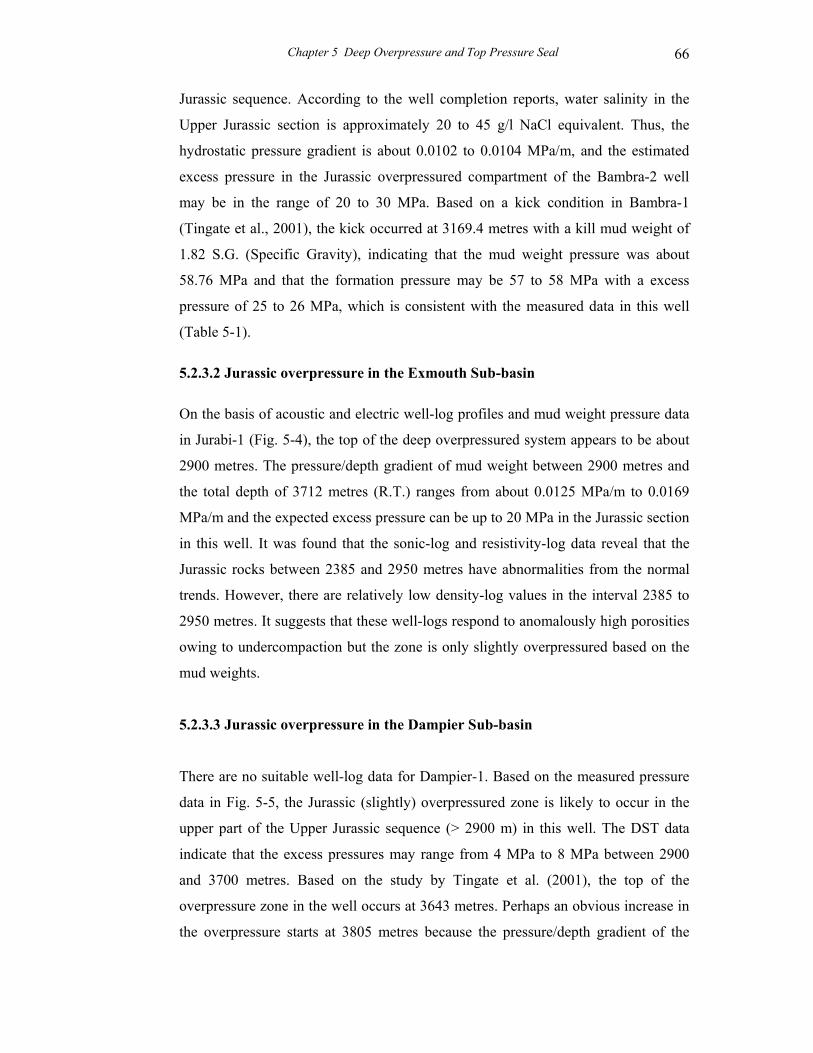
Chapter 5 Deep Overpressure and Top Pressure Seal 66
Jurassic sequence. According to the well completion reports, water salinity in the
Upper Jurassic section is approximately 20 to 45 g/l NaCl equivalent. Thus, the
hydrostatic pressure gradient is about 0.0102 to 0.0104 MPa/m, and the estimated
excess pressure in the Jurassic overpressured compartment of the Bambra-2 well
may be in the range of 20 to 30 MPa. Based on a kick condition in Bambra-1
(Tingate et al., 2001), the kick occurred at 3169.4 metres with a kill mud weight of
1.82 S.G. (Specific Gravity), indicating that the mud weight pressure was about
58.76 MPa and that the formation pressure may be 57 to 58 MPa with a excess
pressure of 25 to 26 MPa, which is consistent with the measured data in this well
(Table 5-1).
5.2.3.2 Jurassic overpressure in the Exmouth Sub-basin
On the basis of acoustic and electric well-log profiles and mud weight pressure data
in Jurabi-1 (Fig. 5-4), the top of the deep overpressured system appears to be about
2900 metres. The pressure/depth gradient of mud weight between 2900 metres and
the total depth of 3712 metres (R.T.) ranges from about 0.0125 MPa/m to 0.0169
MPa/m and the expected excess pressure can be up to 20 MPa in the Jurassic section
in this well. It was found that the sonic-log and resistivity-log data reveal that the
Jurassic rocks between 2385 and 2950 metres have abnormalities from the normal
trends. However, there are relatively low density-log values in the interval 2385 to
2950 metres. It suggests that these well-logs respond to anomalously high porosities
owing to undercompaction but the zone is only slightly overpressured based on the
mud weights.
5.2.3.3 Jurassic overpressure in the Dampier Sub-basin
There are no suitable well-log data for Dampier-1. Based on the measured pressure
data in Fig. 5-5, the Jurassic (slightly) overpressured zone is likely to occur in the
upper part of the Upper Jurassic sequence (> 2900 m) in this well. The DST data
indicate that the excess pressures may range from 4 MPa to 8 MPa between 2900
and 3700 metres. Based on the study by Tingate et al. (2001), the top of the
overpressure zone in the well occurs at 3643 metres. Perhaps an obvious increase in
the overpressure starts at 3805 metres because the pressure/depth gradient of the
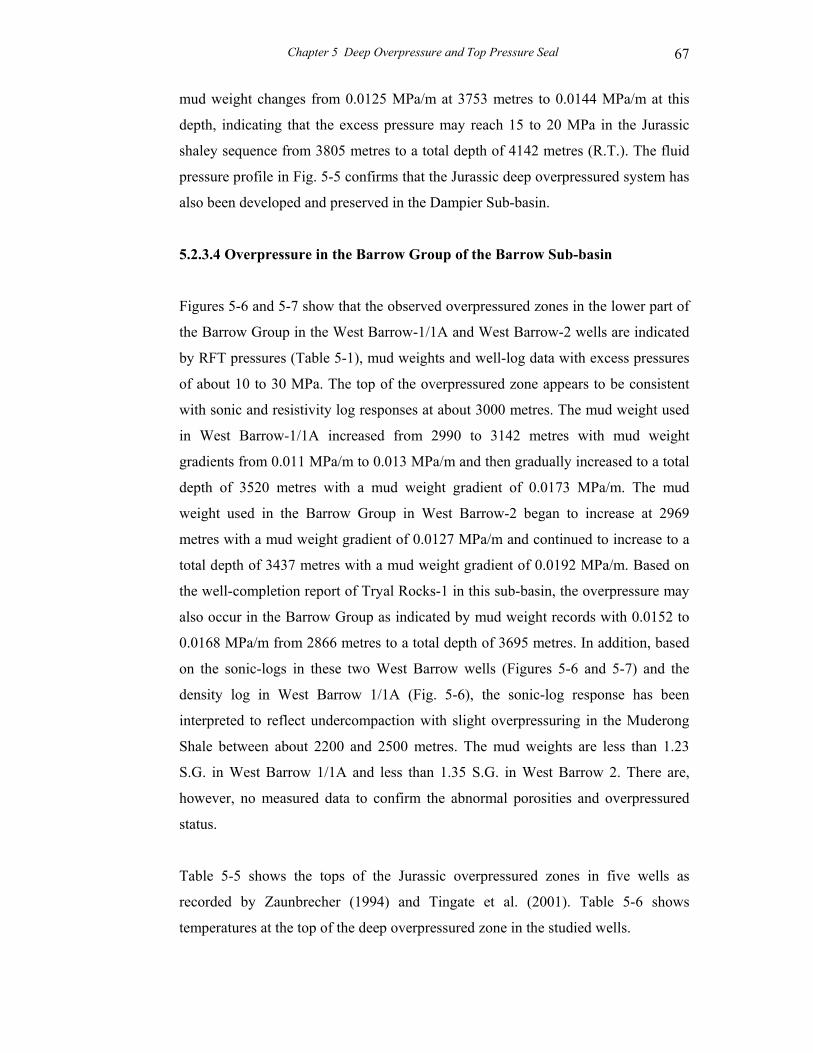
Chapter 5 Deep Overpressure and Top Pressure Seal 67
mud weight changes from 0.0125 MPa/m at 3753 metres to 0.0144 MPa/m at this
depth, indicating that the excess pressure may reach 15 to 20 MPa in the Jurassic
shaley sequence from 3805 metres to a total depth of 4142 metres (R.T.). The fluid
pressure profile in Fig. 5-5 confirms that the Jurassic deep overpressured system has
also been developed and preserved in the Dampier Sub-basin.
5.2.3.4 Overpressure in the Barrow Group of the Barrow Sub-basin
Figures 5-6 and 5-7 show that the observed overpressured zones in the lower part of
the Barrow Group in the West Barrow-1/1A and West Barrow-2 wells are indicated
by RFT pressures (Table 5-1), mud weights and well-log data with excess pressures
of about 10 to 30 MPa. The top of the overpressured zone appears to be consistent
with sonic and resistivity log responses at about 3000 metres. The mud weight used
in West Barrow-1/1A increased from 2990 to 3142 metres with mud weight
gradients from 0.011 MPa/m to 0.013 MPa/m and then gradually increased to a total
depth of 3520 metres with a mud weight gradient of 0.0173 MPa/m. The mud
weight used in the Barrow Group in West Barrow-2 began to increase at 2969
metres with a mud weight gradient of 0.0127 MPa/m and continued to increase to a
total depth of 3437 metres with a mud weight gradient of 0.0192 MPa/m. Based on
the well-completion report of Tryal Rocks-1 in this sub-basin, the overpressure may
also occur in the Barrow Group as indicated by mud weight records with 0.0152 to
0.0168 MPa/m from 2866 metres to a total depth of 3695 metres. In addition, based
on the sonic-logs in these two West Barrow wells (Figures 5-6 and 5-7) and the
density log in West Barrow 1/1A (Fig. 5-6), the sonic-log response has been
interpreted to reflect undercompaction with slight overpressuring in the Muderong
Shale between about 2200 and 2500 metres. The mud weights are less than 1.23
S.G. in West Barrow 1/1A and less than 1.35 S.G. in West Barrow 2. There are,
however, no measured data to confirm the abnormal porosities and overpressured
status.
Table 5-5 shows the tops of the Jurassic overpressured zones in five wells as
recorded by Zaunbrecher (1994) and Tingate et al. (2001). Table 5-6 shows
temperatures at the top of the deep overpressured zone in the studied wells.
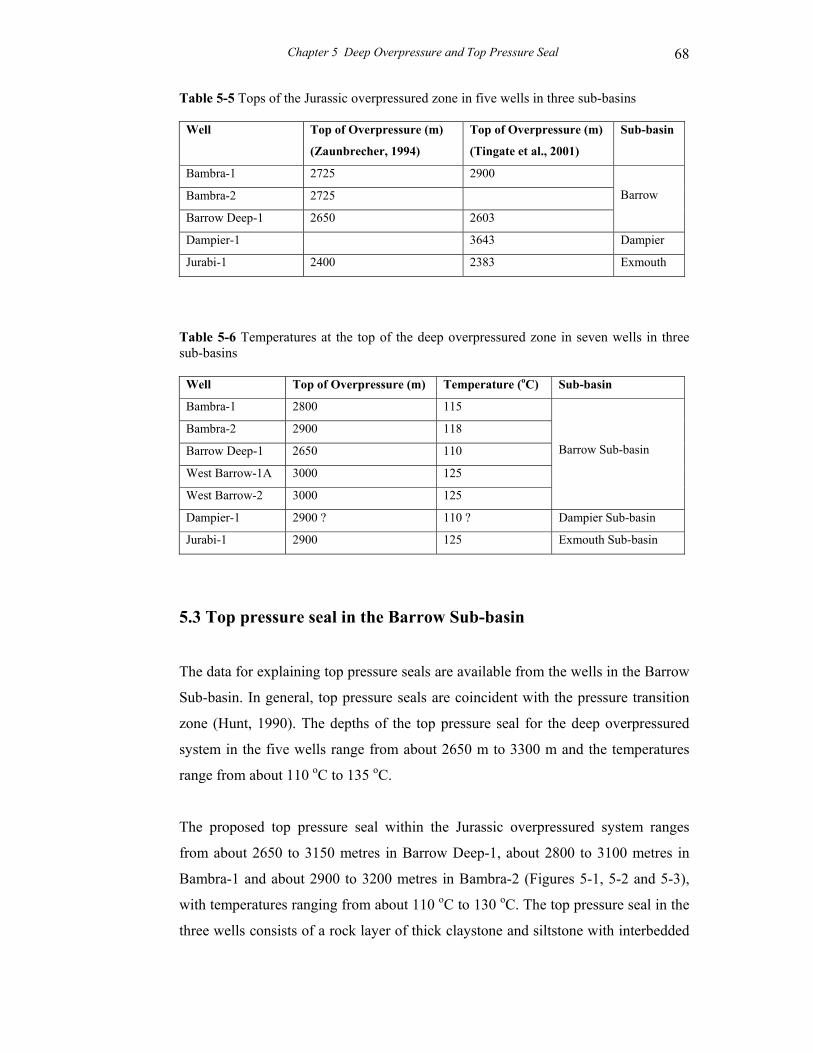
Chapter 5 Deep Overpressure and Top Pressure Seal 68
Table 5-5 Tops of the Jurassic overpressured zone in five wells in three sub-basins
Well Top of Overpressure (m)
(Zaunbrecher, 1994)
Top of Overpressure (m)
(Tingate et al., 2001)
Sub-basin
Bambra-1 2725 2900
Bambra-2 2725
Barrow Deep-1 2650 2603
Barrow
Dampier-1 3643 Dampier
Jurabi-1 2400 2383 Exmouth
Table 5-6 Temperatures at the top of the deep overpressured zone in seven wells in three sub-basins
Well Top of Overpressure (m) Temperature (oC) Sub-basin
Bambra-1 2800 115
Bambra-2 2900 118
Barrow Deep-1 2650 110
West Barrow-1A 3000 125
West Barrow-2 3000 125
Barrow Sub-basin
Dampier-1 2900 ? 110 ? Dampier Sub-basin
Jurabi-1 2900 125 Exmouth Sub-basin
5.3 Top pressure seal in the Barrow Sub-basin
The data for explaining top pressure seals are available from the wells in the Barrow
Sub-basin. In general, top pressure seals are coincident with the pressure transition
zone (Hunt, 1990). The depths of the top pressure seal for the deep overpressured
system in the five wells range from about 2650 m to 3300 m and the temperatures
range from about 110 oC to 135 oC.
The proposed top pressure seal within the Jurassic overpressured system ranges
from about 2650 to 3150 metres in Barrow Deep-1, about 2800 to 3100 metres in
Bambra-1 and about 2900 to 3200 metres in Bambra-2 (Figures 5-1, 5-2 and 5-3),
with temperatures ranging from about 110 oC to 130 oC. The top pressure seal in the
three wells consists of a rock layer of thick claystone and siltstone with interbedded
Chapter 5 Deep Overpressure and Top Pressure Seal 69
sandstone and thin limestone. The rock layer contains about 60 to 80 % claystone
and siltstone and its thickness varies from about 300 to 500 metres.
Figures 5-6 and 5-7 show that the top pressure seal in the Barrow Group of West
Barrow-1/1A and West Barrow-2 may range from 3000 to 3300 metres with
temperatures between 125-135 oC. The rock layer of the pressure seal contains about
80 % claystone and siltstone with thin sandstone and its thickness is about 300
metres.
The sandstones inside or near the deep overpressured system appear to have
extensive cementation, which in turn leads to a significant decrease in porosity and
permeability in the sandstones. Wulff (1991) studied the cementation of sandstone
in a conventional core at 2713 to 2730 m just overlying the interpreted pressure seal
in Bambra-1. The main mineral compositions of the sandstones collected from
Wulff (1991) and the well completion report are shown in Table 5-7. This Upper
Jurassic fine sandstone is cemented with moderately abundant authigenic quartz
overgrowths, siderite and calcite/dolomite, resulting in quite low permeability
compared with porosity as listed in Table 5-3.
Based on the well-completion report of West Barrow-2, the ranges of well-log-
derived porosities in the sandstones from the Barrow Group are given in Table 5-4.
Secondary silica cement and interstitial detrital clay has severely reduced the
primary porosity in the sandstones between 2882 and 3319 metres in comparison to
the sandstones at 2520 to 2834 metres. Extensive silica and clay cementation has
filled in almost all pore voids, resulting in negligible effective porosity in the
sandstones from the interval 3366 to 3437 metres in this well. The claystone and
silty claystone in the rock layer of the top pressure seal were strongly compacted
according to the density-log data (Figures 5-2 and 5-6). The density values in the top
pressure seal are 2.57 to 2.63 kg/m3 in Bambra-1 and 2.55 to 2.63 kg/m3 in West
Barrrow-1/1A. Based on the density-log data in the interval of the top pressure seals
and the measured matrix density (2.63-2.64 kg/m3) for the Jurassic claystone core
(4274-4283 m) in Bambra-2 (Appendix 1), the claystone porosities within the top
pressure seal can be assessed to be 5 %, thus the permeability values are
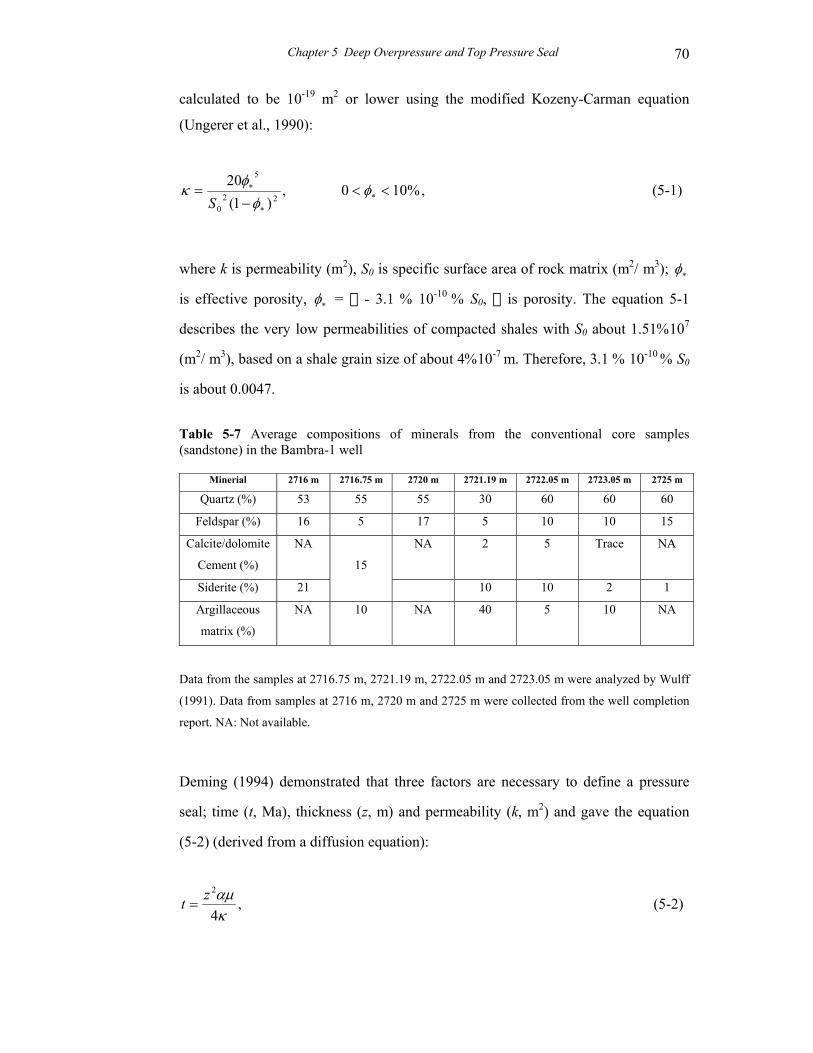
Chapter 5 Deep Overpressure and Top Pressure Seal 70
calculated to be 10-19 m2 or lower using the modified Kozeny-Carman equation
(Ungerer et al., 1990):
,%100,)1(
2022
0
5
<<−
= ∗∗
∗ φφ
φκ
S (5-1)
where k is permeability (m2), S0 is specific surface area of rock matrix (m2/ m3); ∗φ
is effective porosity, ∗φ = - 3.1 % 10-10 % S0, is porosity. The equation 5-1
describes the very low permeabilities of compacted shales with S0 about 1.51%107
(m2/ m3), based on a shale grain size of about 4%10-7 m. Therefore, 3.1 % 10-10 % S0
is about 0.0047.
Table 5-7 Average compositions of minerals from the conventional core samples (sandstone) in the Bambra-1 well
Minerial 2716 m 2716.75 m 2720 m 2721.19 m 2722.05 m 2723.05 m 2725 m
Quartz (%) 53 55 55 30 60 60 60
Feldspar (%) 16 5 17 5 10 10 15
Calcite/dolomite
Cement (%)
NA NA 2 5 Trace NA
Siderite (%) 21
15
10 10 2 1
Argillaceous
matrix (%)
NA 10 NA 40 5 10 NA
Data from the samples at 2716.75 m, 2721.19 m, 2722.05 m and 2723.05 m were analyzed by Wulff
(1991). Data from samples at 2716 m, 2720 m and 2725 m were collected from the well completion
report. NA: Not available.
Deming (1994) demonstrated that three factors are necessary to define a pressure
seal; time (t, Ma), thickness (z, m) and permeability (k, m2) and gave the equation
(5-2) (derived from a diffusion equation):
,4
2
καµzt = (5-2)
Chapter 5 Deep Overpressure and Top Pressure Seal 71
where is rock compressibility (10-10 < > 10-8 Pa-1) (Neuzil, 1986; Ge and Garven,
1992), is dynamic viscosity of pure water (about 3.0 % 10-4 Pa∃s at 95 oC). If the
compressibility value for shale is 10-9 Pa-1, then,
,104.2)( 272
−××=κzt (5-3)
As described by the equation, the time over which a seal may confine a pressure
transient is directly proportional to the square of the seal thickness (z) and inversely
proportional to the seal permeability (k). If the time span required for the pressure
seal unit (about 300 to 500 metres thick) to confine the overpressure in the Jurassic
sequence is considered to be 1 to 100 Ma, the calculated permeabilities range from
about 10-22 m2 to 10-24 m2. An error as large as a factor of 10 could occur due to
uncertainties in the values used for rock compressibility (Deming, 1994). Based on
the calculation of Deming (1994), without pressure recharge, a 500-m-thick pressure
seal unit with permeability of 10-22 m2 can maintain overpressure for several million
years at best.
5.4 Summary
The Jurassic sequence in the sub-basins of the Northern Carnarvon Basin is highly
overpressured with excess pressure between about 10-30 MPa as indicated by DSTs,
RFTs and mud weights. A deep overpressured system commonly has associated
high sonic transit times and low resistivity values in the fine-grained rocks. The
response of the sonic-log and resistivity-log to the fine-grained rocks in the study
area further supports the overpressured regime in the Jurassic source rocks. The
overpressure is also found in specific zones in the Barrow Group of the Barrow Sub-
basin.
This study suggests that the sonic and resistivity logs may respond anomalously to
the overpressuring in the thick claystone and siltstone in these sub-basins, and also
suggests that the deep overpressured system is not associated with high porosities
that could be derived from the sonic-log and resistivity-log data by conventional
Chapter 5 Deep Overpressure and Top Pressure Seal 72
interpretation procedures. It seems that the deep overpressured zone at present is
related to relatively high density, and that the porosity is likely to be less than 6 !1 %
based on the density-log and measured claystone porosities.
The top pressure seals, associated with pressure transition zones, consist of a rock
layer with 60 to 80 % claystone and siltstone, 20 to 40 % sandstone, and thin
carbonate units within the Barrow Group and Upper Jurassic strata in the Barrow
Sub-basin. The rock layer appears to be well compacted and cemented by quartz
overgrowths and calcite which have relatively high density values. The top of the
deep overpressured system can vary from about 2650 to 3000 metres with
temperatures between 110 oC and 125 oC. The thickness of the rock layer varies
from about 300 to 500 metres in the Barrow Sub-basin. The estimated porosities in
the claystone of the rock layer are 2 to 5 % based on well-log data and some
measured porosity values, and thus the calculated permeability may range from
about 10-19 m2 to 10-22 m2.
Chapter 6 One-dimensional Models and Data Sets
77
____________________________
Part III One-dimensional Thermal History Modelling ____________________________
Chapter 6 One-dimensional Models and Data Sets
78
CHAPTER 6 ONE-DIMENSIONAL MODELS AND
DATA SETS
6.1 One-dimensional models
One-dimensional modelling aims at reconstructing thermal and maturity histories in
this study. The primary models and calculations include geohistory/burial history,
heat flow, temperature and thermal maturity (Platte River Associates, Inc., 1996).
6.1.1 Geohistory/burial history
The quantitative analysis of geohistory/burial history through time is used to
reconstruct thermal and maturity histories. This analysis aims at producing time-
depth histories and sedimentation rates. The correction of decompaction needs to be
carried out for geohistory/burial history analysis. The reconstruction of geohistory
also needs the data of palaeobathymetry and sea level fluctuations. Decompaction
(backstripping) is based on the skeletal (solid grain) volume being constant, while
the rock volume is changed with depth of burial due to the loss of porosity (Allen
and Allen, 1990). Thus, the integrated equation is given:
[ ] [ ] ,)(1)(1 4
3
2
1
dzzdzzz
z
z
z ∫∫ −=− φφ (6-1)
where z1 and z2 are the top and bottom depths of a rock layer at a given time, z3 and
z4 are new depths of the rock layer at another time, is porosity that is a function of
depth (z).
6.1.2 Tectonic subsidence
A tectonic subsidence curve is useful in explaining the basin-forming mechanism.
Tectonic subsidence can be obtained after the removal of the subsidence due to the
sediment load and corrections for variations in water depth and eustatic sea-level
changes. It reflects the lithospheric isostatic processes which cause basins to form
Chapter 6 One-dimensional Models and Data Sets
79
and is considered as the subsidence by tectonic effects, which backstrips (removes)
the sediment load and replaces its load only by a column of water (Lerche, 1990;
Joy, 1992). Tectonic subsidence is calculated using the equation of Steckler and
Watts (1978):
( ) ,
−
∆−∆−+
−−
=wm
wd
wm
sms SLSLWHT
ρρρ
ρρρρ
(6-2)
where Ts is the tectonic subsidence, H is the sedimentary layer thickness of the
column corrected for compaction, Wd is the palaeo-water depth, <SL is the change in
palaeo-sea level relative to the present-day sea level, m, s, and w are the densities
of mantle, sediments and water, respectively.
6.1.3 Heat flow
The thermal history in a sedimentary basin relies on the heat flow from the mantle
and radiogenic heat produced in the crust (Lachenbruch, 1970). Allen and Allen
(1990) stated that geothermal evolution is controlled by the basal heat flow history
of the basin, physical properties of the lithosphere, and heat generation from
radioactive sources within the sediments and regional water flow. The increase in
heat flow during rifting is related to the lithospheric thinning, which influences heat
entering the basin from the asthenosphere. The heat transfer modes in sedimentary
rocks are conduction related to lithology, porosity and nature of pore fluids, and
convection related to compaction-driven flow, gravity-driven flow and anomalous
heat intrusion. In this study a one-dimensional model is used where the heat flow is
transferred by vertical conduction and lateral influence is ignored. The boundary
conditions of the thermal data are provided in Table 6-1. Both rift heat flow and
constant heat flow models can be evaluated by comparing the measured maturity
data with the calculated maturity curves.
In the BasinMod 1D software, two basic assumptions for heat flow histories can be
adopted: (1) steady state, a constant heat flow over time, and (2) non-steady state, a
variable heat flow over time such as a rift heat flow history.
Chapter 6 One-dimensional Models and Data Sets
80
Steady state heat flow was calculated using a heat flow/thermal conductivity model:
,dzdTkflowHeat = (6-3)
where k is thermal conductivity; T is temperature (oK); z is depth (m).
Transient heat flow was calculated using the transient diffusion equation and Heat
transfer is assumed to be by vertical conduction using the equation:
,dtdTcQ
dzdTk
dzd
=
+ (6-4)
where T is temperature (oK); k is thermal conductivity; c is heat capacity; t is time.
The BasinMod 1D provides a modified Jarvis and McKenzie (1980) algorithm to
calculate rift heat flow.
,)(exp)1(1)(1
22211
∆−−×−+= ∑
∞
=
+
n
nn a
kttnnbz
kTtF ππ (6-5)
,sin)1(2 1
−=
+
βπ
πβ n
nnnb
n
n (6-6)
where F(t) is heat flow at surface at time t; t is time of rifting; k is thermal
conductivity; kT1/z is heat flow prior to rifting, based on present day heat flow; a is
thickness of lithosphere, fixed at 125 km.
A factor is required for the calculation of rifting heat flow in the BasinMod 1D,
which is defined as:
= initial lithospheric thickness / lithospheric thickness immediately after
stretching
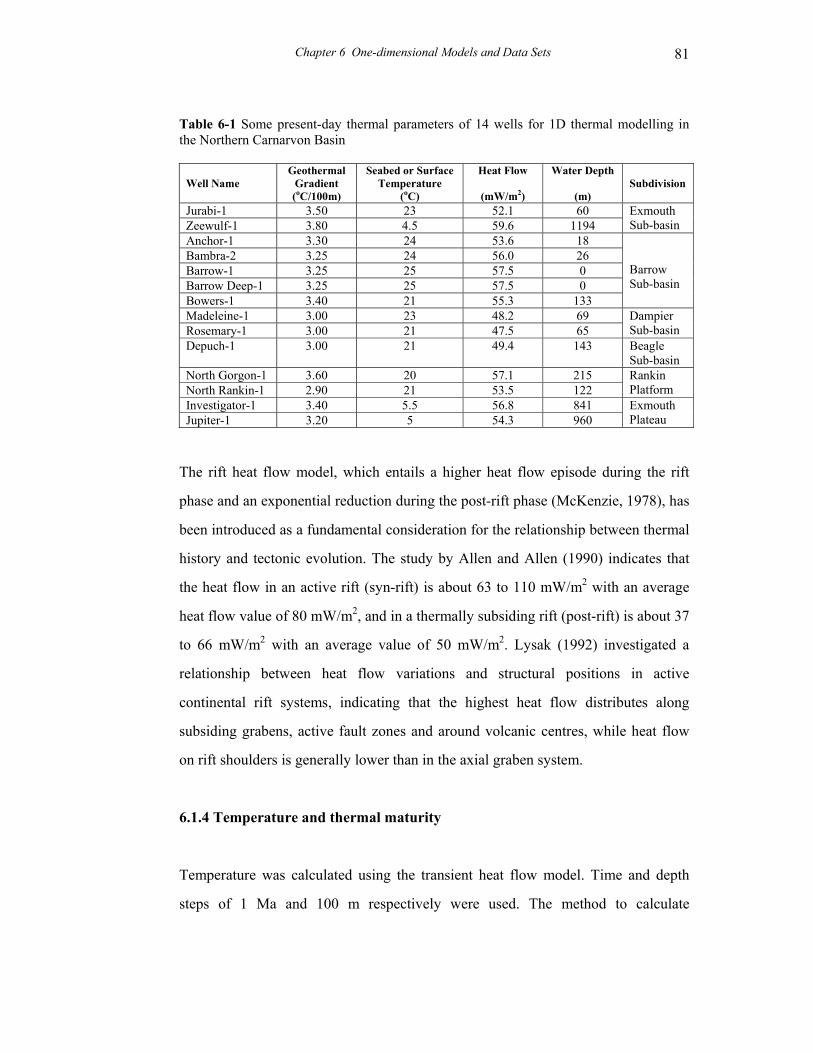
Chapter 6 One-dimensional Models and Data Sets
81
Table 6-1 Some present-day thermal parameters of 14 wells for 1D thermal modelling in the Northern Carnarvon Basin
Well Name
Geothermal Gradient (oC/100m)
Seabed or Surface Temperature
(oC)
Heat Flow
(mW/m2)
Water Depth
(m)
Subdivision
Jurabi-1 3.50 23 52.1 60 Zeewulf-1 3.80 4.5 59.6 1194
Exmouth Sub-basin
Anchor-1 3.30 24 53.6 18 Bambra-2 3.25 24 56.0 26 Barrow-1 3.25 25 57.5 0 Barrow Deep-1 3.25 25 57.5 0 Bowers-1 3.40 21 55.3 133
Barrow Sub-basin
Madeleine-1 3.00 23 48.2 69 Rosemary-1 3.00 21 47.5 65
Dampier Sub-basin
Depuch-1 3.00 21 49.4 143 Beagle Sub-basin
North Gorgon-1 3.60 20 57.1 215 North Rankin-1 2.90 21 53.5 122
Rankin Platform
Investigator-1 3.40 5.5 56.8 841 Jupiter-1 3.20 5 54.3 960
Exmouth Plateau
The rift heat flow model, which entails a higher heat flow episode during the rift
phase and an exponential reduction during the post-rift phase (McKenzie, 1978), has
been introduced as a fundamental consideration for the relationship between thermal
history and tectonic evolution. The study by Allen and Allen (1990) indicates that
the heat flow in an active rift (syn-rift) is about 63 to 110 mW/m2 with an average
heat flow value of 80 mW/m2, and in a thermally subsiding rift (post-rift) is about 37
to 66 mW/m2 with an average value of 50 mW/m2. Lysak (1992) investigated a
relationship between heat flow variations and structural positions in active
continental rift systems, indicating that the highest heat flow distributes along
subsiding grabens, active fault zones and around volcanic centres, while heat flow
on rift shoulders is generally lower than in the axial graben system.
6.1.4 Temperature and thermal maturity
Temperature was calculated using the transient heat flow model. Time and depth
steps of 1 Ma and 100 m respectively were used. The method to calculate
Chapter 6 One-dimensional Models and Data Sets
82
temperature takes into account the thermal conductivity plus the heat capacity of the
lithologies in the model, giving a more accurate heat-flow profile.
The BasinMod 1D provides a method, together with default values of kinetic
parameters, for the calculation of vitrinite maturation, using the chemical-kinetic
model of vitrinite reflectance (Sweeney and Burnham, 1990). Vitrinite reflectance is
a function of temperature and time, as described by the Arrhenius equation, which
shows that the reaction rate of vitrinite maturation increases exponentially with
temperature and linearly with time. The method allows the calculation of Ro values,
ranging between 0.3 and 4.5 %, so as to compare with the measured maturity data
and calibrate heat flow histories.
6.2 Data sets
Fourteen wells (Table 6-1 and Fig. 6-1) in various tectonic subdivisions of the
Northern Carnarvon Basin were selected on the basis of available data for thermal
modelling using BasinMod 1D (version 7.06, Platte River Associates, Inc.). The
input data used for this modelling was collected from open files, such as well-
completion reports from the Department of Minerals and Energy of Western
Australia. The initial porosity, matrix density, matrix thermal conductivity and
matrix heat capacity were adopted from the default values in BasinMod 1D. In
addition, conventional and side-wall core samples in Bambra-2 were analyzed for
Rock-Eval pyrolysis.
6.2.1 Stratigraphic data and porosity-depth relationship
The stratigraphic data include the present thickness of stratigraphic intervals,
lithology, and absolute age. The formation thickness is based on well-completion
reports and well-log information. The undifferentiated formations within the
Cainozoic were defined using the interpreted seismic data by the AGSO. Five
lithologies (sandstone, siltstone, shale/claystone, limestone and coal) were used and
the average content of each lithology was calculated as a percentage of mixed
lithologies in a single formation. Absolute ages were obtained from the stratigraphic
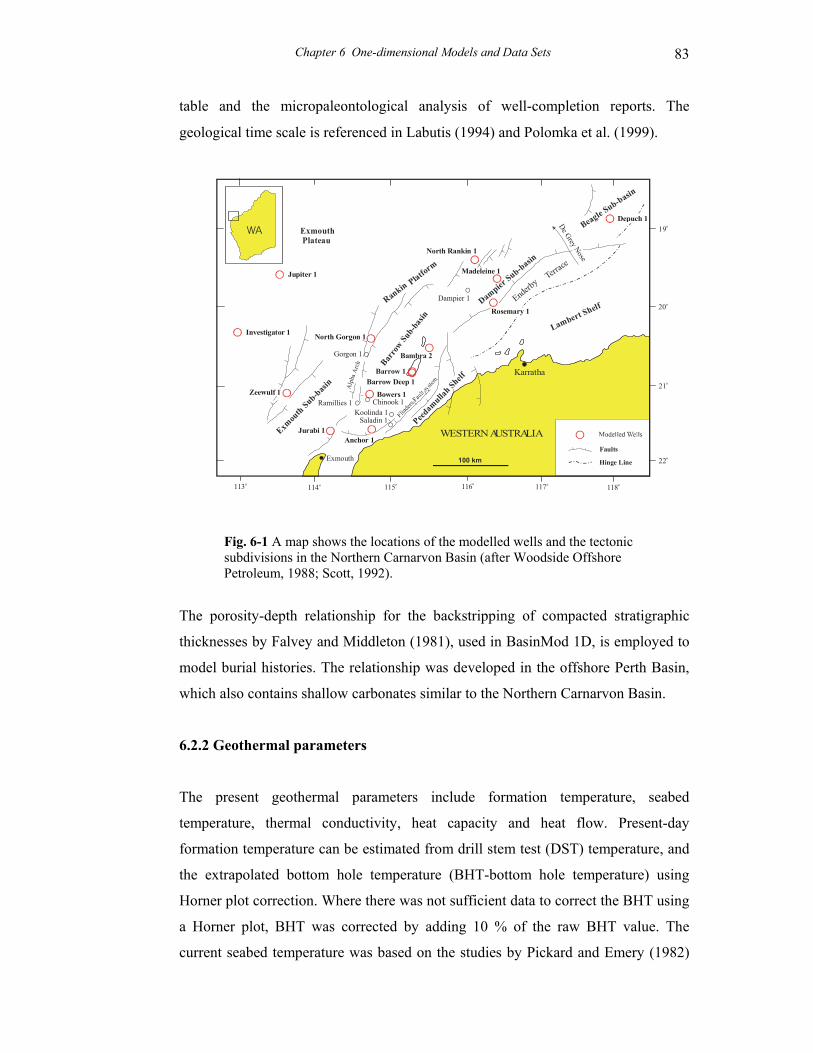
Chapter 6 One-dimensional Models and Data Sets
83
table and the micropaleontological analysis of well-completion reports. The
geological time scale is referenced in Labutis (1994) and Polomka et al. (1999).
Fig. 6-1 A map shows the locations of the modelled wells and the tectonic subdivisions in the Northern Carnarvon Basin (after Woodside Offshore Petroleum, 1988; Scott, 1992).
The porosity-depth relationship for the backstripping of compacted stratigraphic
thicknesses by Falvey and Middleton (1981), used in BasinMod 1D, is employed to
model burial histories. The relationship was developed in the offshore Perth Basin,
which also contains shallow carbonates similar to the Northern Carnarvon Basin.
6.2.2 Geothermal parameters
The present geothermal parameters include formation temperature, seabed
temperature, thermal conductivity, heat capacity and heat flow. Present-day
formation temperature can be estimated from drill stem test (DST) temperature, and
the extrapolated bottom hole temperature (BHT-bottom hole temperature) using
Horner plot correction. Where there was not sufficient data to correct the BHT using
a Horner plot, BHT was corrected by adding 10 % of the raw BHT value. The
current seabed temperature was based on the studies by Pickard and Emery (1982)
Rankin Platform
Beagle Sub-basin
Dampier Sub-basin
Barro
w Sub-b
asin
Exmou
th Sub-basin
Enderby
Terrace
Lambert Shelf
WESTERN AUSTRALIA
100 km
Karratha
ExmouthFaults
Hinge Line
Bambra 2
North Rankin 1
117o113o
22o
20o
Exmouth Plateau
Jupiter 1
Investigator 1
Depuch 1
Madeleine 1
North Gorgon 1
Jurabi 1
115o
21o
19o
118o116o114o
Barrow Deep 1
Bowers 1
Anchor 1
Peedamulla
h Shelf
De Grey Nose
Alp
ha A
rch
WA
ODampier 1
OGorgon 1
OO
OSaladin 1
Ramillies 1 Chinook 1Koolinda 1
Barrow 1
Zeewulf 1
Rosemary 1
O
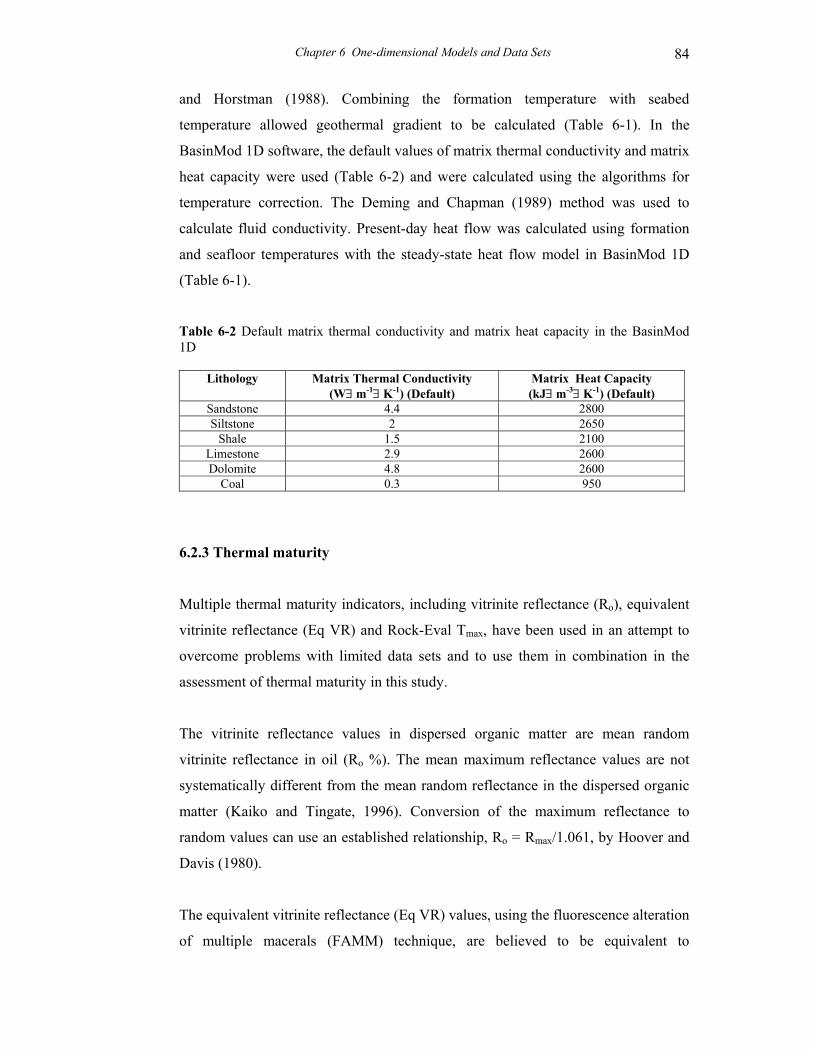
Chapter 6 One-dimensional Models and Data Sets
84
and Horstman (1988). Combining the formation temperature with seabed
temperature allowed geothermal gradient to be calculated (Table 6-1). In the
BasinMod 1D software, the default values of matrix thermal conductivity and matrix
heat capacity were used (Table 6-2) and were calculated using the algorithms for
temperature correction. The Deming and Chapman (1989) method was used to
calculate fluid conductivity. Present-day heat flow was calculated using formation
and seafloor temperatures with the steady-state heat flow model in BasinMod 1D
(Table 6-1).
Table 6-2 Default matrix thermal conductivity and matrix heat capacity in the BasinMod 1D
Lithology Matrix Thermal Conductivity (W∃ m-1∃ K-1) (Default)
Matrix Heat Capacity (kJ∃ m-3∃ K-1) (Default)
Sandstone 4.4 2800 Siltstone 2 2650
Shale 1.5 2100 Limestone 2.9 2600 Dolomite 4.8 2600
Coal 0.3 950
6.2.3 Thermal maturity
Multiple thermal maturity indicators, including vitrinite reflectance (Ro), equivalent
vitrinite reflectance (Eq VR) and Rock-Eval Tmax, have been used in an attempt to
overcome problems with limited data sets and to use them in combination in the
assessment of thermal maturity in this study.
The vitrinite reflectance values in dispersed organic matter are mean random
vitrinite reflectance in oil (Ro %). The mean maximum reflectance values are not
systematically different from the mean random reflectance in the dispersed organic
matter (Kaiko and Tingate, 1996). Conversion of the maximum reflectance to
random values can use an established relationship, Ro = Rmax/1.061, by Hoover and
Davis (1980).
The equivalent vitrinite reflectance (Eq VR) values, using the fluorescence alteration
of multiple macerals (FAMM) technique, are believed to be equivalent to
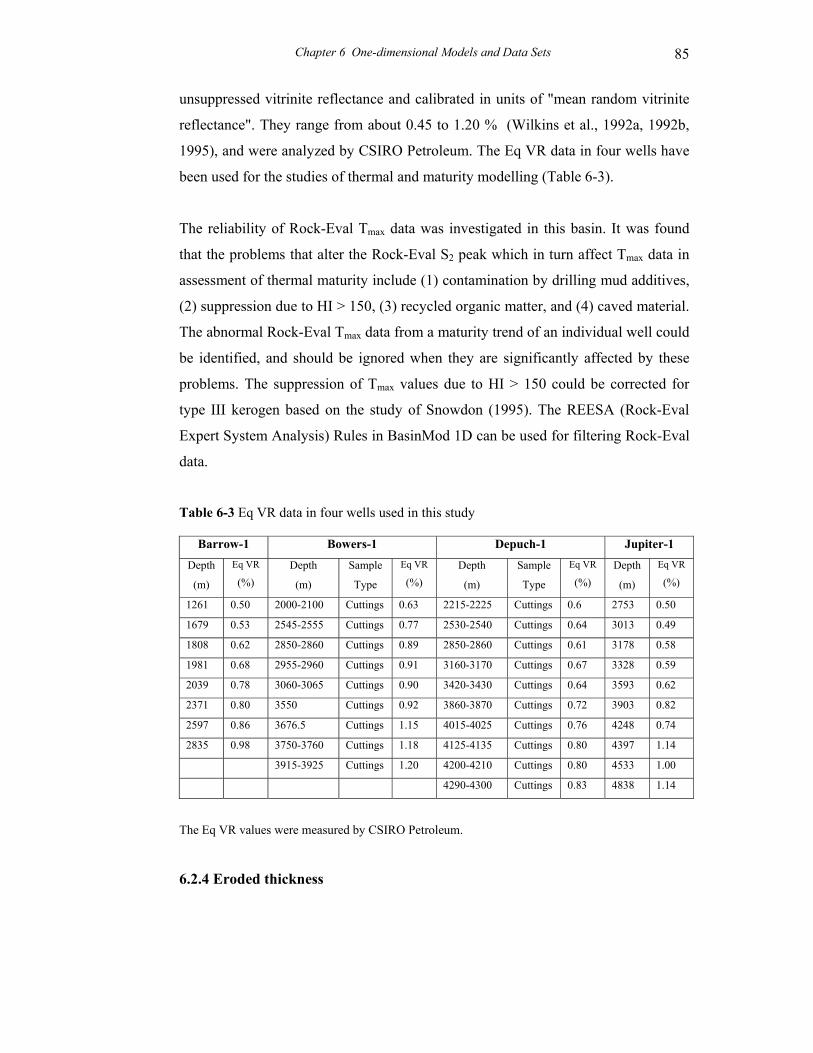
Chapter 6 One-dimensional Models and Data Sets
85
unsuppressed vitrinite reflectance and calibrated in units of "mean random vitrinite
reflectance". They range from about 0.45 to 1.20 % (Wilkins et al., 1992a, 1992b,
1995), and were analyzed by CSIRO Petroleum. The Eq VR data in four wells have
been used for the studies of thermal and maturity modelling (Table 6-3).
The reliability of Rock-Eval Tmax data was investigated in this basin. It was found
that the problems that alter the Rock-Eval S2 peak which in turn affect Tmax data in
assessment of thermal maturity include (1) contamination by drilling mud additives,
(2) suppression due to HI > 150, (3) recycled organic matter, and (4) caved material.
The abnormal Rock-Eval Tmax data from a maturity trend of an individual well could
be identified, and should be ignored when they are significantly affected by these
problems. The suppression of Tmax values due to HI > 150 could be corrected for
type III kerogen based on the study of Snowdon (1995). The REESA (Rock-Eval
Expert System Analysis) Rules in BasinMod 1D can be used for filtering Rock-Eval
data.
Table 6-3 Eq VR data in four wells used in this study
Barrow-1 Bowers-1 Depuch-1 Jupiter-1
Depth
(m)
Eq VR
(%) Depth
(m)
Sample
Type
Eq VR
(%) Depth
(m)
Sample
Type
Eq VR
(%) Depth
(m)
Eq VR
(%)
1261 0.50 2000-2100 Cuttings 0.63 2215-2225 Cuttings 0.6 2753 0.50
1679 0.53 2545-2555 Cuttings 0.77 2530-2540 Cuttings 0.64 3013 0.49
1808 0.62 2850-2860 Cuttings 0.89 2850-2860 Cuttings 0.61 3178 0.58
1981 0.68 2955-2960 Cuttings 0.91 3160-3170 Cuttings 0.67 3328 0.59
2039 0.78 3060-3065 Cuttings 0.90 3420-3430 Cuttings 0.64 3593 0.62
2371 0.80 3550 Cuttings 0.92 3860-3870 Cuttings 0.72 3903 0.82
2597 0.86 3676.5 Cuttings 1.15 4015-4025 Cuttings 0.76 4248 0.74
2835 0.98 3750-3760 Cuttings 1.18 4125-4135 Cuttings 0.80 4397 1.14
3915-3925 Cuttings 1.20 4200-4210 Cuttings 0.80 4533 1.00
4290-4300 Cuttings 0.83 4838 1.14
The Eq VR values were measured by CSIRO Petroleum.
6.2.4 Eroded thickness
Chapter 6 One-dimensional Models and Data Sets
86
The erosional thickness is important for burial, thermal and maturity modelling.
However, there are no available well-log data for estimating erosional thicknesses.
Seismic data can be used to make a rough correlation, and estimate thicknesses at
the main unconformity. Based on AGSO's seismic interpretation, the seismic
reflections show obvious erosional phenomena at the unconformity between the
Triassic or Jurassic and Cretaceous sequences on the Rankin Platform. The missing
section of the Lower Jurassic was estimated to be from several hundred meters up to
one thousand meters thick (Barber, 1982). The Triassic erosional thickness ranges
from zero to more than one thousand meters. Therefore, the total erosional thickness
during the rifting until breakup on the Rankin Platform ranges from several hundred
meters to more than two thousand meters. Some of the Lower Jurassic rocks may
have been eroded on the structural highs of the Exmouth Plateau during the Middle
Jurassic. In addition, where strata are absent and there is no evidence of erosion
from seismic data, it has been treated as periods of non-deposition.
6.2.5 Palaeobathymetry and sea-level variations
Palaeobathymetry may affect thermal modelling owing to the variation of
palaeoseafloor temperatures. Kaiko and Tait (2001) used seismic data to study the
palaeo-water depths of the Late Jurassic to Cainozoic for some individual wells of
the Northern Carnarvon Basin. These palaeo-water depth data were used for 1D
modelling and were also used to evaluate water-sediment interface temperatures for
the wells selected in this study. The palaeobathymetric values in the Triassic and
Early-Middle Jurassic were estimated using lithology and palynofacies analysis in
the well completion reports, and a study by Bradshaw et al. (1988). These were
about 5 to 20 metres in the Middle-Late Triassic, 20 to 50 metres in the Early
Jurassic, and 50 to 350 metres in the Middle-Late Jurassic. Similar deep water
conditions persisted over most of the study area until the Tertiary, when prograding
carbonate sediments again produced a shallow shelf environment.
The long-term eustatic curves of the Mesozoic-Cenozoic by Haq et al. (1987) were
adopted for changes of relative sea-level through time.
Chapter 7 1D Heat Flow and Thermal Maturity Modelling 86
CHAPTER 7 ONE-DIMENSIONAL HEAT FLOW AND
THERMAL MATURITY MODELLING
7.1 Introduction
The heat flow history of a basin is calculated by establishing an agreement between
a calculated (or modelled) maturity curve and the equivalent observed maturity
parameter (such as vitrinite reflectance, or Rock-Eval Tmax). Then, this calculated
heat flow history can be used to predict the thermal maturity of source rocks and the
timing of hydrocarbon generation. The calculated, or modelled, thermal maturity
parameters are usually derived from models that use (1) empirically-based
temperature and time integrals (e.g. Waples, 1980; Middleton, 1982), (2) the
Arrhenius-reaction approach (e.g. Lerche et al., 1984; Wood, 1988), or (3) multiple
Arrhenius-reaction models, which attempt to simulate the chemical reactions which
produce maturation (e.g. Larter, 1988; Sweeney and Burnham, 1990). Temperature
is the most sensitive parameter in thermal maturity and hydrocarbon generation, and
Tissot et al. (1987) consider that reconstruction of temperature history is essential
when evaluating petroleum prospects. Formation temperature depends upon heat
flow, thermal conductivity, burial depth and the water-sediment interface or surface
temperature.
Vitrinite reflectance is the most widely used indicator of thermal maturity (e.g.
Waples, 1985; Tissot and Welte, 1984; Allen and Allen, 1990; Hunt, 1996). Wilkins
et al. (1992a) pointed out that two major causes of the anomalously low vitrinite
reflectance for some North West Shelf wells are: (1) the suppression of vitrinite
reflectance through marine influence; (2) the difficulty of identifying the vitrinite
population in dispersed organic matter. Marine influence resulting in lower Ro
values were proposed by Wilkins et al. (1992a), Hunt (1996), Kaiko and Tingate
(1996) and Gurba and Ward (1998). Samuelsson and Middleton (1998) stressed that
the vitrinite reflectance suppression in this basin has led to an underestimation of the
true level of thermal maturity. As a major thermal maturity indicator, these problems
with vitrinite reflectance make it difficult to estimate the thermal history in many
wells of this basin. Researches have used alternative thermal parameters and Ro
Chapter 7 1D Heat Flow and Thermal Maturity Modelling 87
correction for attempting to overcome the problems associated with the anomalously
low Ro in studies of the basin’s thermal history and the thermal evolution of source
rocks. Alexander, Marzi and Kagi (1990) applied molecular markers as thermal
indicators for modelling the palaeoheatflow of the Jupiter-1 well in the basin.
Wilkins, Russell and Ellacott (1994) evaluated thermal maturity of five Northern
Carnarvon Basin wells using equivalent vitrinite reflectance (Eq VR) data, which is
analysed by the technique of the fluorescence alteration of multiple macerals
(FAMM). Kaiko and Tingate (1996) used the spore coloration combined with Ro
and FAMM data for assessment of thermal maturity in the Barrow and Dampier
Sub-basins. Samuelsson and Middleton (1998) corrected vitrinite reflectance values
based on the method of Lo (1993) for reconstruction of heat flow histories in seven
wells of the basin.
Studies of palaeoheat flow in rift-related basins indicate that high palaeoheat flow is
commonly associated with rifting and seafloor spreading (Mello and Karner, 1996;
Zhou and Littke, 1999), and the reconstruction of thermal history from vitrinite
reflectance is a function of the tectonic history in a sedimentary basin (e.g.
Middleton, 1982; Allen and Allen, 1990). Based on theoretical and empirical
studies (McKenzie, 1978; Barber, 1982; Hellinger and Sclater, 1983; Middleton and
Hunt, 1989; Driscoll and Karner, 1998; Tindale et al., 1998; Polomka et al., 1999),
the evolution of the Northern Carnarvon Basin during the Jurassic is commonly
accepted to be comprised of two major phases: (1) rapid subsidence and faulting,
and (2) thermal subsidence.
However, direct evidence for estimating past heat flow from palaeotemperatures
(derived from vitrinite reflectance, Rock-Eval Tmax, or similar parameters) in most
Barrow and Dampier Sub-basin wells may have disappeared since the
palaeotemperatures experienced during the rifting phase may have been equalled, or
exceeded, by those associated during burial in later sag-phase sedimentation (Kaiko
and Tingate, 1996). Nielsen (1996) proposed that organic maturity indicators tend to
remember only the maximum temperature encountered, and when organic matter in
the present era experiences the maximum geotemperature, maturity indicators are
less sensitive to thermal reconstruction.
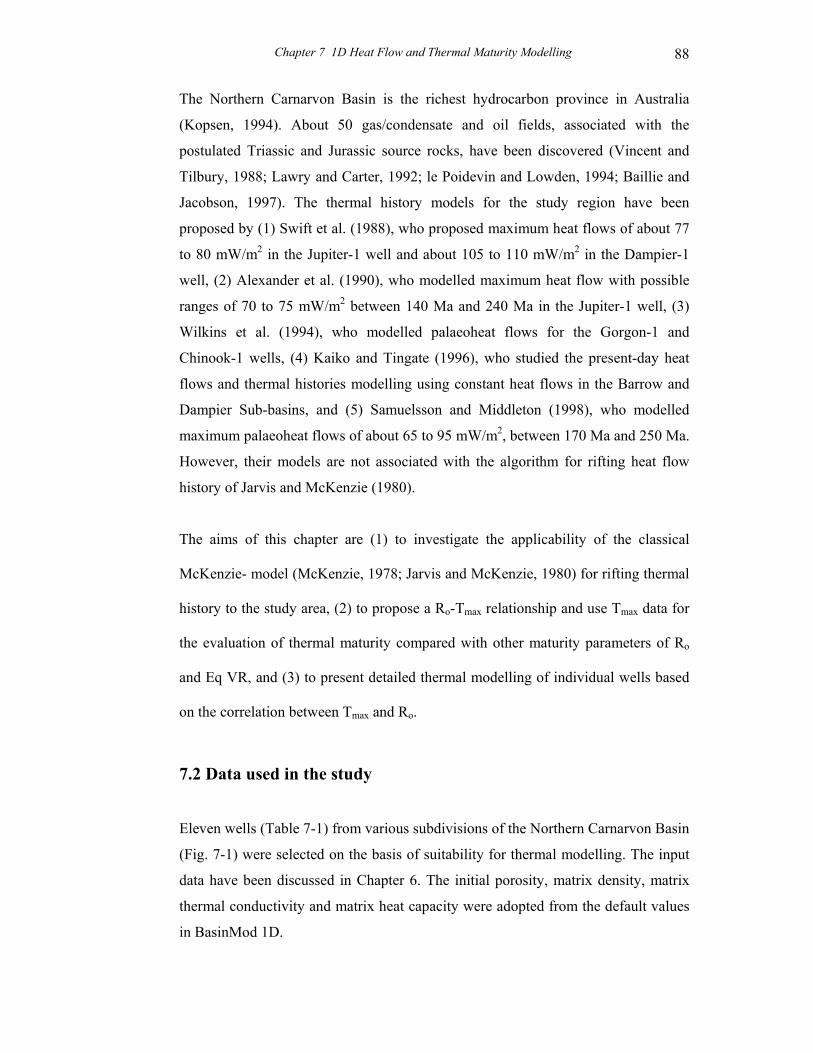
Chapter 7 1D Heat Flow and Thermal Maturity Modelling 88
The Northern Carnarvon Basin is the richest hydrocarbon province in Australia
(Kopsen, 1994). About 50 gas/condensate and oil fields, associated with the
postulated Triassic and Jurassic source rocks, have been discovered (Vincent and
Tilbury, 1988; Lawry and Carter, 1992; le Poidevin and Lowden, 1994; Baillie and
Jacobson, 1997). The thermal history models for the study region have been
proposed by (1) Swift et al. (1988), who proposed maximum heat flows of about 77
to 80 mW/m2 in the Jupiter-1 well and about 105 to 110 mW/m2 in the Dampier-1
well, (2) Alexander et al. (1990), who modelled maximum heat flow with possible
ranges of 70 to 75 mW/m2 between 140 Ma and 240 Ma in the Jupiter-1 well, (3)
Wilkins et al. (1994), who modelled palaeoheat flows for the Gorgon-1 and
Chinook-1 wells, (4) Kaiko and Tingate (1996), who studied the present-day heat
flows and thermal histories modelling using constant heat flows in the Barrow and
Dampier Sub-basins, and (5) Samuelsson and Middleton (1998), who modelled
maximum palaeoheat flows of about 65 to 95 mW/m2, between 170 Ma and 250 Ma.
However, their models are not associated with the algorithm for rifting heat flow
history of Jarvis and McKenzie (1980).
The aims of this chapter are (1) to investigate the applicability of the classical
McKenzie- model (McKenzie, 1978; Jarvis and McKenzie, 1980) for rifting thermal
history to the study area, (2) to propose a Ro-Tmax relationship and use Tmax data for
the evaluation of thermal maturity compared with other maturity parameters of Ro
and Eq VR, and (3) to present detailed thermal modelling of individual wells based
on the correlation between Tmax and Ro.
7.2 Data used in the study
Eleven wells (Table 7-1) from various subdivisions of the Northern Carnarvon Basin
(Fig. 7-1) were selected on the basis of suitability for thermal modelling. The input
data have been discussed in Chapter 6. The initial porosity, matrix density, matrix
thermal conductivity and matrix heat capacity were adopted from the default values
in BasinMod 1D.
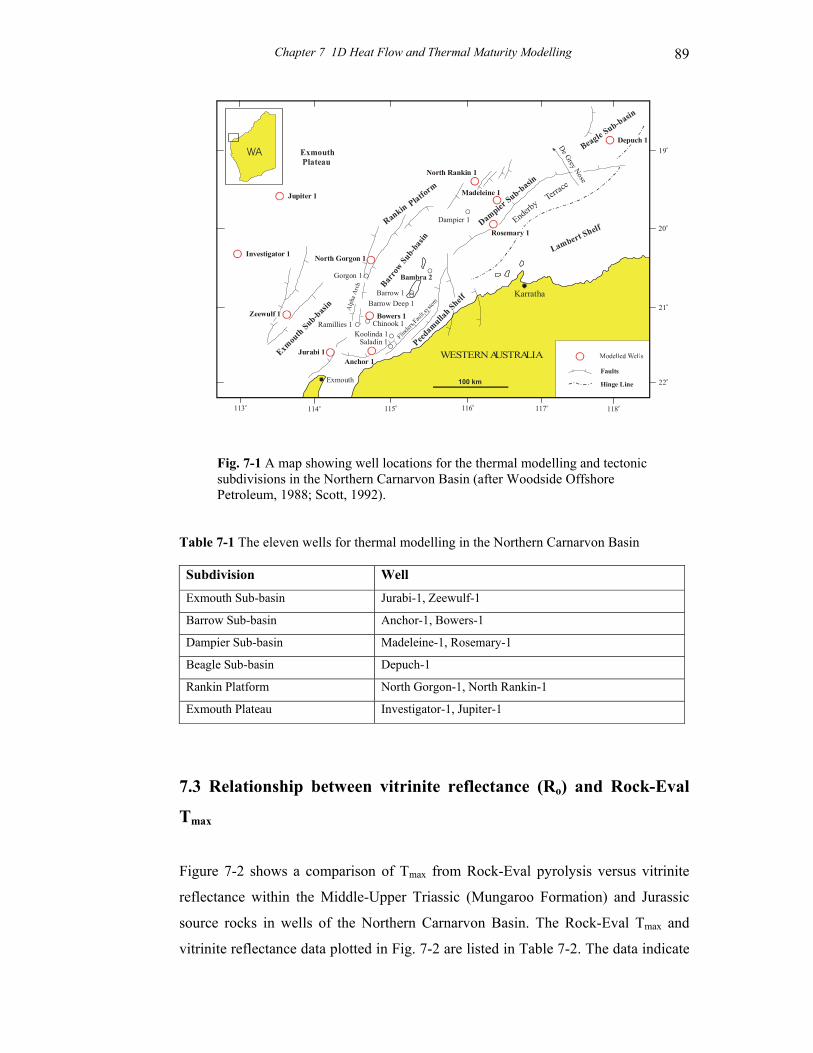
Chapter 7 1D Heat Flow and Thermal Maturity Modelling 89
Fig. 7-1 A map showing well locations for the thermal modelling and tectonic subdivisions in the Northern Carnarvon Basin (after Woodside Offshore Petroleum, 1988; Scott, 1992). Table 7-1 The eleven wells for thermal modelling in the Northern Carnarvon Basin Subdivision Well
Exmouth Sub-basin Jurabi-1, Zeewulf-1
Barrow Sub-basin Anchor-1, Bowers-1
Dampier Sub-basin Madeleine-1, Rosemary-1
Beagle Sub-basin Depuch-1
Rankin Platform North Gorgon-1, North Rankin-1
Exmouth Plateau Investigator-1, Jupiter-1
7.3 Relationship between vitrinite reflectance (Ro) and Rock-Eval
Tmax
Figure 7-2 shows a comparison of Tmax from Rock-Eval pyrolysis versus vitrinite
reflectance within the Middle-Upper Triassic (Mungaroo Formation) and Jurassic
source rocks in wells of the Northern Carnarvon Basin. The Rock-Eval Tmax and
vitrinite reflectance data plotted in Fig. 7-2 are listed in Table 7-2. The data indicate
Rankin Platform
Beagle Sub-basin
Dampier Sub-basin
Barro
w Sub-b
asin
Exmou
th Sub-basin
Enderby
Terrace
Lambert Shelf
WESTERN AUSTRALIA
100 km
Karratha
ExmouthFaults
Hinge Line
Bambra 2
North Rankin 1
117o113o
22o
20o
Exmouth Plateau
Jupiter 1
Investigator 1
Depuch 1
Madeleine 1
North Gorgon 1
Jurabi 1
115o
21o
19o
118o116o114o
Barrow Deep 1
Bowers 1
Anchor 1
Peedamulla
h Shelf
De Grey Nose
Alp
ha A
rch
WA
ODampier 1
OGorgon 1
OO
OSaladin 1
Ramillies 1 Chinook 1Koolinda 1
Barrow 1
Zeewulf 1
Rosemary 1
O
O
OO
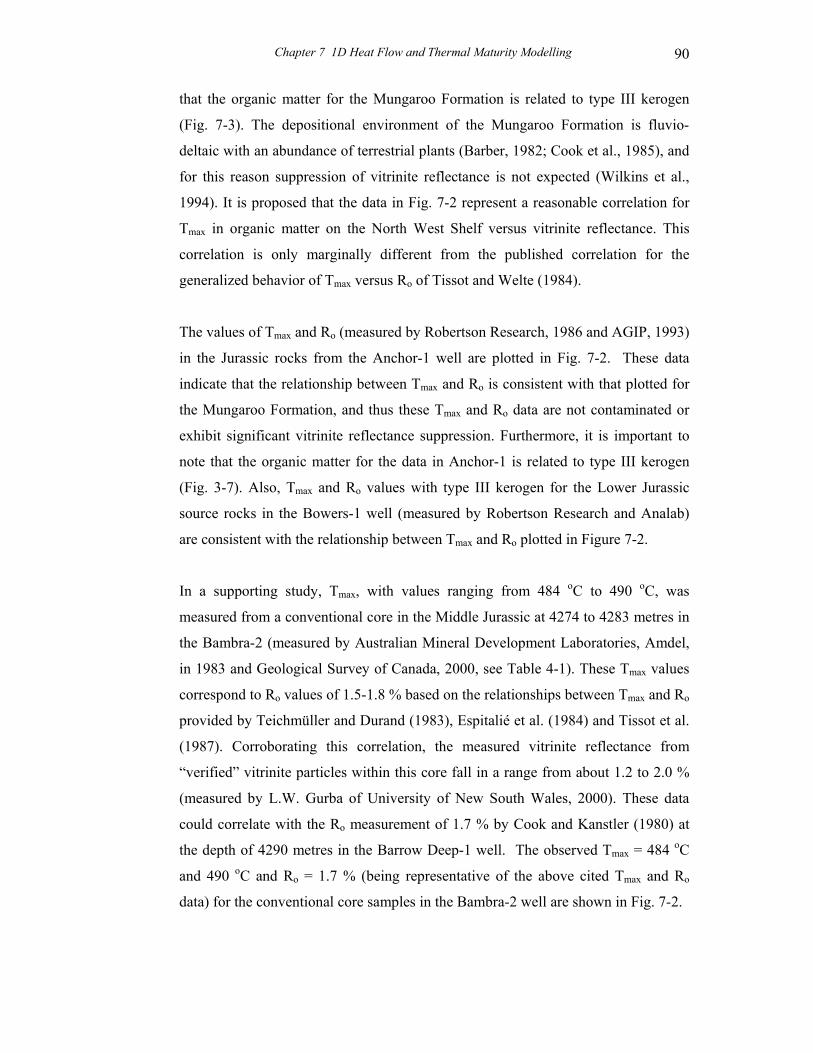
Chapter 7 1D Heat Flow and Thermal Maturity Modelling 90
that the organic matter for the Mungaroo Formation is related to type III kerogen
(Fig. 7-3). The depositional environment of the Mungaroo Formation is fluvio-
deltaic with an abundance of terrestrial plants (Barber, 1982; Cook et al., 1985), and
for this reason suppression of vitrinite reflectance is not expected (Wilkins et al.,
1994). It is proposed that the data in Fig. 7-2 represent a reasonable correlation for
Tmax in organic matter on the North West Shelf versus vitrinite reflectance. This
correlation is only marginally different from the published correlation for the
generalized behavior of Tmax versus Ro of Tissot and Welte (1984).
The values of Tmax and Ro (measured by Robertson Research, 1986 and AGIP, 1993)
in the Jurassic rocks from the Anchor-1 well are plotted in Fig. 7-2. These data
indicate that the relationship between Tmax and Ro is consistent with that plotted for
the Mungaroo Formation, and thus these Tmax and Ro data are not contaminated or
exhibit significant vitrinite reflectance suppression. Furthermore, it is important to
note that the organic matter for the data in Anchor-1 is related to type III kerogen
(Fig. 3-7). Also, Tmax and Ro values with type III kerogen for the Lower Jurassic
source rocks in the Bowers-1 well (measured by Robertson Research and Analab)
are consistent with the relationship between Tmax and Ro plotted in Figure 7-2.
In a supporting study, Tmax, with values ranging from 484 oC to 490 oC, was
measured from a conventional core in the Middle Jurassic at 4274 to 4283 metres in
the Bambra-2 (measured by Australian Mineral Development Laboratories, Amdel,
in 1983 and Geological Survey of Canada, 2000, see Table 4-1). These Tmax values
correspond to Ro values of 1.5-1.8 % based on the relationships between Tmax and Ro
provided by Teichmüller and Durand (1983), Espitalié et al. (1984) and Tissot et al.
(1987). Corroborating this correlation, the measured vitrinite reflectance from
“verified” vitrinite particles within this core fall in a range from about 1.2 to 2.0 %
(measured by L.W. Gurba of University of New South Wales, 2000). These data
could correlate with the Ro measurement of 1.7 % by Cook and Kanstler (1980) at
the depth of 4290 metres in the Barrow Deep-1 well. The observed Tmax = 484 oC
and 490 oC and Ro = 1.7 % (being representative of the above cited Tmax and Ro
data) for the conventional core samples in the Bambra-2 well are shown in Fig. 7-2.

Chapter 7 1D Heat Flow and Thermal Maturity Modelling 91
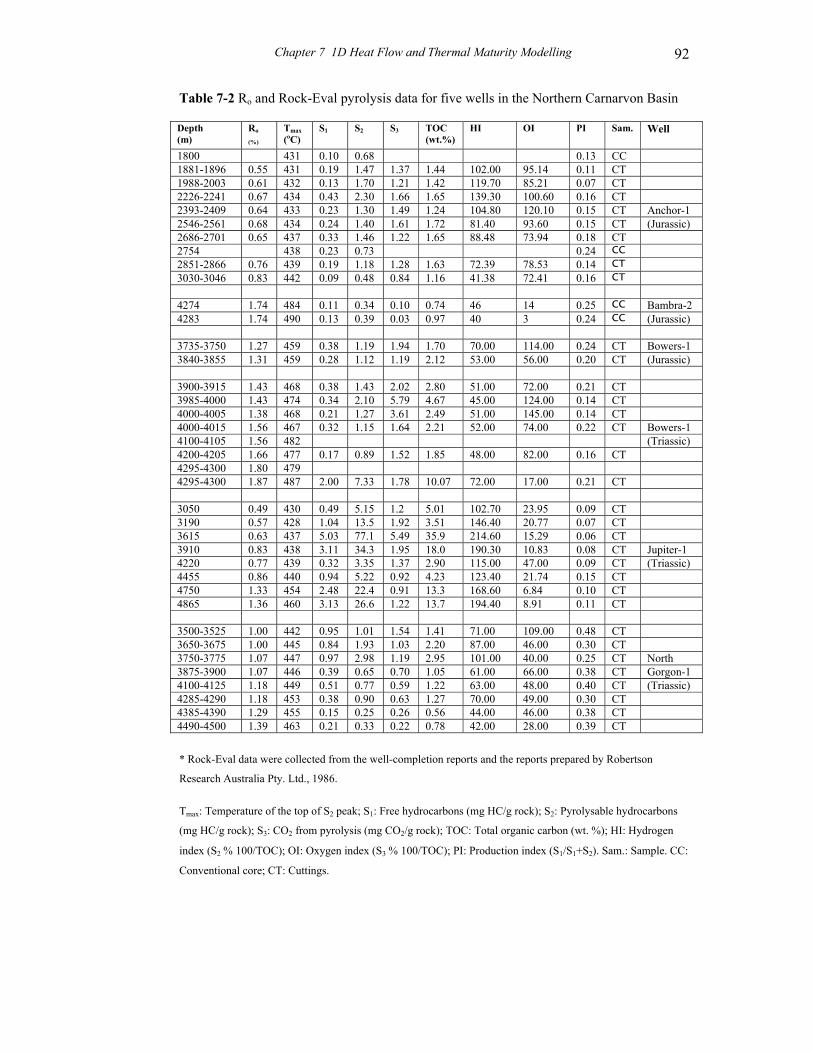
Chapter 7 1D Heat Flow and Thermal Maturity Modelling 92
Table 7-2 Ro and Rock-Eval pyrolysis data for five wells in the Northern Carnarvon Basin Depth (m)
Ro
(%)
Tmax (oC)
S1 S2 S3 TOC (wt.%)
HI OI PI Sam. Well
1800 431 0.10 0.68 0.13 CC 1881-1896 0.55 431 0.19 1.47 1.37 1.44 102.00 95.14 0.11 CT 1988-2003 0.61 432 0.13 1.70 1.21 1.42 119.70 85.21 0.07 CT 2226-2241 0.67 434 0.43 2.30 1.66 1.65 139.30 100.60 0.16 CT 2393-2409 0.64 433 0.23 1.30 1.49 1.24 104.80 120.10 0.15 CT Anchor-1 2546-2561 0.68 434 0.24 1.40 1.61 1.72 81.40 93.60 0.15 CT (Jurassic) 2686-2701 0.65 437 0.33 1.46 1.22 1.65 88.48 73.94 0.18 CT 2754 438 0.23 0.73 0.24 CC
2851-2866 0.76 439 0.19 1.18 1.28 1.63 72.39 78.53 0.14 CT 3030-3046 0.83 442 0.09 0.48 0.84 1.16 41.38 72.41 0.16 CT 4274 1.74 484 0.11 0.34 0.10 0.74 46 14 0.25 CC Bambra-2 4283 1.74 490 0.13 0.39 0.03 0.97 40 3 0.24 CC (Jurassic) 3735-3750 1.27 459 0.38 1.19 1.94 1.70 70.00 114.00 0.24 CT Bowers-1 3840-3855 1.31 459 0.28 1.12 1.19 2.12 53.00 56.00 0.20 CT (Jurassic) 3900-3915 1.43 468 0.38 1.43 2.02 2.80 51.00 72.00 0.21 CT 3985-4000 1.43 474 0.34 2.10 5.79 4.67 45.00 124.00 0.14 CT 4000-4005 1.38 468 0.21 1.27 3.61 2.49 51.00 145.00 0.14 CT 4000-4015 1.56 467 0.32 1.15 1.64 2.21 52.00 74.00 0.22 CT Bowers-1 4100-4105 1.56 482 (Triassic) 4200-4205 1.66 477 0.17 0.89 1.52 1.85 48.00 82.00 0.16 CT 4295-4300 1.80 479 4295-4300 1.87 487 2.00 7.33 1.78 10.07 72.00 17.00 0.21 CT 3050 0.49 430 0.49 5.15 1.2 5.01 102.70 23.95 0.09 CT 3190 0.57 428 1.04 13.5 1.92 3.51 146.40 20.77 0.07 CT 3615 0.63 437 5.03 77.1 5.49 35.9 214.60 15.29 0.06 CT 3910 0.83 438 3.11 34.3 1.95 18.0 190.30 10.83 0.08 CT Jupiter-1 4220 0.77 439 0.32 3.35 1.37 2.90 115.00 47.00 0.09 CT (Triassic) 4455 0.86 440 0.94 5.22 0.92 4.23 123.40 21.74 0.15 CT 4750 1.33 454 2.48 22.4 0.91 13.3 168.60 6.84 0.10 CT 4865 1.36 460 3.13 26.6 1.22 13.7 194.40 8.91 0.11 CT 3500-3525 1.00 442 0.95 1.01 1.54 1.41 71.00 109.00 0.48 CT 3650-3675 1.00 445 0.84 1.93 1.03 2.20 87.00 46.00 0.30 CT 3750-3775 1.07 447 0.97 2.98 1.19 2.95 101.00 40.00 0.25 CT North 3875-3900 1.07 446 0.39 0.65 0.70 1.05 61.00 66.00 0.38 CT Gorgon-1 4100-4125 1.18 449 0.51 0.77 0.59 1.22 63.00 48.00 0.40 CT (Triassic) 4285-4290 1.18 453 0.38 0.90 0.63 1.27 70.00 49.00 0.30 CT 4385-4390 1.29 455 0.15 0.25 0.26 0.56 44.00 46.00 0.38 CT 4490-4500 1.39 463 0.21 0.33 0.22 0.78 42.00 28.00 0.39 CT
* Rock-Eval data were collected from the well-completion reports and the reports prepared by Robertson
Research Australia Pty. Ltd., 1986.
Tmax: Temperature of the top of S2 peak; S1: Free hydrocarbons (mg HC/g rock); S2: Pyrolysable hydrocarbons
(mg HC/g rock); S3: CO2 from pyrolysis (mg CO2/g rock); TOC: Total organic carbon (wt. %); HI: Hydrogen
index (S2 % 100/TOC); OI: Oxygen index (S3 % 100/TOC); PI: Production index (S1/S1+S2). Sam.: Sample. CC:
Conventional core; CT: Cuttings.
Chapter 7 1D Heat Flow and Thermal Maturity Modelling 93
The Jurassic organic matter in the studied wells consists mainly of type III kerogen
(Figures 3-6 to 3-9). The Jurassic organic matter in the Depuch-1 well is related to
the coal-bearing strata and type III kerogen with HI ranging from about 40 to 389.
The relationship between Ro versus Tmax (Fig. 7-2), as an average conversion trend
of two maturity data sets, has been used to convert Tmax data into Ro values in the
BasinMod 1D software mainly for the Mungaroo Formation and Jurassic sequence
in the selected wells.
7.4 Modelling of tectonic subsidence and sedimentation rates
The tectonic subsidence (water-loaded subsidence) can be obtained after the
removal of the sediment-loaded subsidence and after corrections of the palaeo-water
depth (the data provided by Dr. Alex Kaiko) and palaeosea level variations through
time. Subsidence analysis can help in the understanding of the histories of the syn-
rift (Jurassic and earliest Cretaceous) and post-rift (Cretaceous and Cainozoic).
Figure 7-4 shows the tectonic subsidence curves in the Bambra-2 and Barrow Deep-
1 wells calculated by applying the equation of Steckler and Watts (1978) in the
BasinMod 1D software. These curves exhibit two principal phases of subsidence in
accordance with the rift tectonic regime, which generally agree with previous
regional studies (e.g. Barber, 1982; Exon and Colwell, 1994; Müller et al., 1998;
Polomka et al., 1999). These results indicate that rapid subsidence and
corresponding high sedimentation rates took place during the rift-extensional period,
and thermal subsidence with lower sedimentation rates occurred during the post-rift
period. During the rift phase, the sedimentation rates ranged from about 80 m/Ma to
200 m/Ma. During the post-rift phase, sedimentation rates ranged from less than 10
m/Ma to 50 m/Ma. However, the sedimentation rates in the Cretaceous were 10 to
50 m/Ma, while the rates in the Cainozoic ranged from less than 10 to 20 m/Ma.
7.5 Modelling of heat flow and thermal maturity
7.5.1 Thermal modelling for 2 wells in the Exmouth Sub-basin
7.5.1.1 Jurabi-1 thermal modelling

Chapter 7 1D Heat Flow and Thermal Maturity Modelling 94
Chapter 7 1D Heat Flow and Thermal Maturity Modelling 95
The Jurabi-1 well is located on the southwestern flank of the Muiron Anticline in the
eastern Exmouth Sub-basin (Fig. 7-1). The boundary between the Upper Jurassic
strata and Muderong Shale is the main unconformity. Barrow Group is absent at the
well site, and the group is thought to have been eroded during the breakup in the
Valanginian, when a thickness of several hundred meters was eroded. This is based
on seismic and sonic log data. Nevertheless, there are 1063 metres of Cretaceous-
Cenozoic sedimentary rocks in this well. Three formation temperatures were
determined from BHTs using Horner plots. The current heat flow of 52.1 mW/m2 is
calculated from the formation temperatures with a seafloor temperature of 23 oC.
The maturity profiles in this well with Ro (measured by A.C. Cook, 1982) from side-
wall cores and Tmax data from cuttings samples (measured by PGA Consultants,
1992 and Geotech, 1995) are shown in Fig. 7-5A. It can be seen that three of the
four Ro values are in the Murat Siltstone, Brigadier and Mungaroo Formations, one
is an anomalously low value in the Athol Formation, and all the Tmax data are in the
Middle and Upper Jurassic sequence. It should be noted that some Tmax values,
between 1535 and 2400 metres with HI ranging from 168 to 314, are likely to be
suppressed about 1-3 oC, according to the study of Snowdon (1995). Also, the Tmax
data from 1305 to 1470 metres are possibly related to recycled organic matter. Thus,
Tmax is not as reliable as non-anomalous vitrinite reflectance, as a maturity indicator,
in this well.
The thermal modelling, using the current heat flow (projected back into the past),
does not give a match between the observed maturity profile and calculated maturity
curve (Fig. 7-5A, curve 2). A good fit to the maturity data, however, was achieved
from a rift heat flow model, with 600 metres of erosion thickness and exponentially
decreasing heat flow to the present (Fig. 7-5A, curve 1 and Fig. 7-5B). The
modelled maturity curve links the Tmax data in the Dingo Claystone and Athol
Formation with the Ro data in the Lower Jurassic and Upper Triassic (Fig. 7-5A).
The proposed syn-rift phase in this sub-basin started at 190 Ma and terminated at
136 Ma. The maximum heat flow of about 67 mW/m2 is 29 % greater than the
current heat flow. Figure 7-6 shows the histories of burial, temperature and thermal
maturity in the Jurabi-1 well with the rift-related heat flow history. It is obvious that
the model produces the maximum temperature during the syn-rift phase due to an

Chapter 7 1D Heat Flow and Thermal Maturity Modelling 96
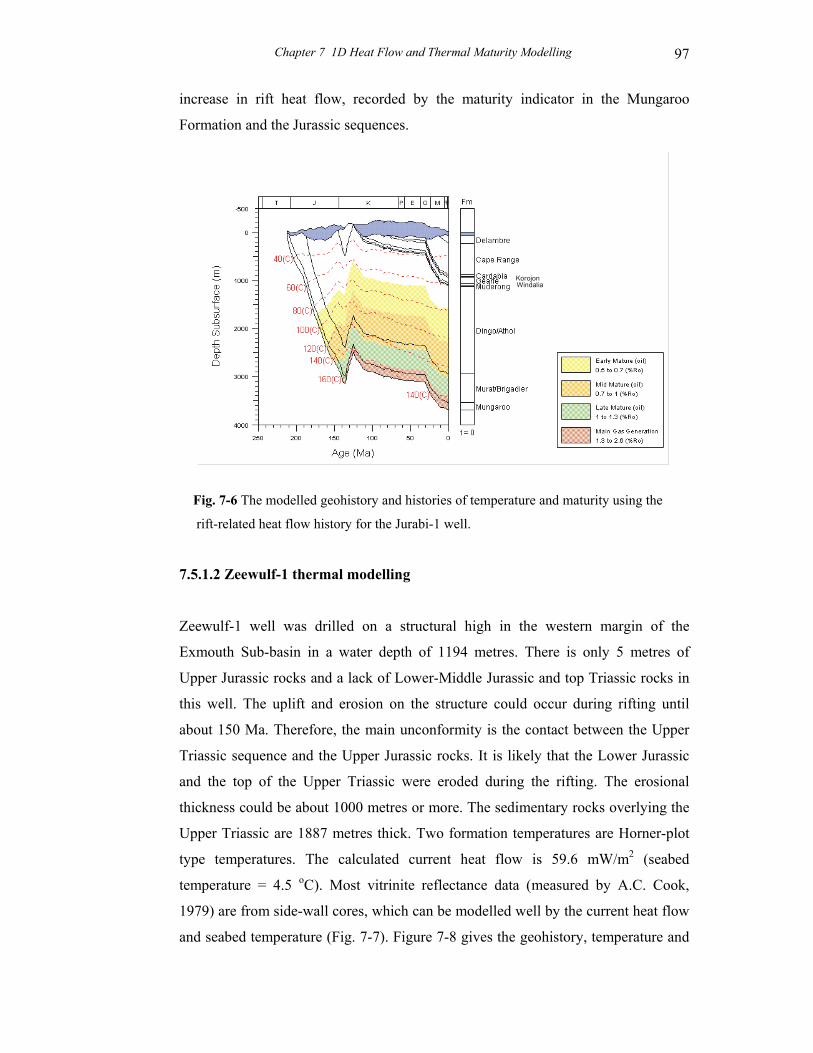
Chapter 7 1D Heat Flow and Thermal Maturity Modelling 97
increase in rift heat flow, recorded by the maturity indicator in the Mungaroo
Formation and the Jurassic sequences.
Fig. 7-6 The modelled geohistory and histories of temperature and maturity using the
rift-related heat flow history for the Jurabi-1 well.
7.5.1.2 Zeewulf-1 thermal modelling
Zeewulf-1 well was drilled on a structural high in the western margin of the
Exmouth Sub-basin in a water depth of 1194 metres. There is only 5 metres of
Upper Jurassic rocks and a lack of Lower-Middle Jurassic and top Triassic rocks in
this well. The uplift and erosion on the structure could occur during rifting until
about 150 Ma. Therefore, the main unconformity is the contact between the Upper
Triassic sequence and the Upper Jurassic rocks. It is likely that the Lower Jurassic
and the top of the Upper Triassic were eroded during the rifting. The erosional
thickness could be about 1000 metres or more. The sedimentary rocks overlying the
Upper Triassic are 1887 metres thick. Two formation temperatures are Horner-plot
type temperatures. The calculated current heat flow is 59.6 mW/m2 (seabed
temperature = 4.5 oC). Most vitrinite reflectance data (measured by A.C. Cook,
1979) are from side-wall cores, which can be modelled well by the current heat flow
and seabed temperature (Fig. 7-7). Figure 7-8 gives the geohistory, temperature and
KorojonWindalia
Chapter 7 1D Heat Flow and Thermal Maturity Modelling 98
maturity histories in this well. The model indicates that the organic matter in the
Mungaroo Formation experienced decreasing temperatures at the place of uplift and
erosion associated with the Jurassic extension. The secondary maturity increase is
due to later burial during the post-rift phase.
7.5.2 Thermal modelling for 2 wells in the Barrow Sub-basin
7.5.2.1 Anchor-1 thermal modelling
Anchor-1 well was drilled in the southern margin of the Barrow Sub-basin. In this
case, six formation temperatures are corrected from the BHTs (raw BHTs + 10%). A
current heat flow of 53.6 mW/m2 is estimated, with a seabed temperature of 24 oC.
The vitrinite reflectance values (measured by Robertson Research Australia Pty.
Ltd.) and the Tmax data (measured by Robertson Research Australia Pty. Ltd., BHP
and AGIP) are shown in Fig. 7-9. Both Ro and Tmax data can be matched with the
present heat flow and seabed temperature. This modelled result suggests that both Ro
and Tmax values can be used to evaluate the thermal maturity trend in this well and
also suggests that the organic matter in the well site is at maximum temperature at
present (Fig. 7-9). Figure 7-10 indicates a basically continued burial and thermal
effect histories in this well.
7.5.2.2 Bowers-1 thermal modelling
The Bowers-1 well was drilled on a faulted anticlinal structure on the eastern flank
of the Alpha Arch in the Barrow Sub-basin (Fig. 7-1). The well contains a thin
Jurassic sequence, but there is no palynological evidence to indicate that Middle-
Upper Jurassic strata are absent. In this case, two formation temperatures were
derived from Horner-plot corrections and the seafloor temperature is 21 oC. The
calculated current heat flow is 55.3 mW/m. The vitrinite reflectance values
(measured by Robertson Research Australia Pty. Ltd. and Keiraville Konsultants,
1989), Tmax data (measured by Robertson Research Australia Pty. Ltd. and Analab,
1982) and Eq VR values (CSIRO Petroleum) are plotted in Fig. 7-11A. It can be
seen that the Ro data from Triassic rocks, obtained from different laboratories,
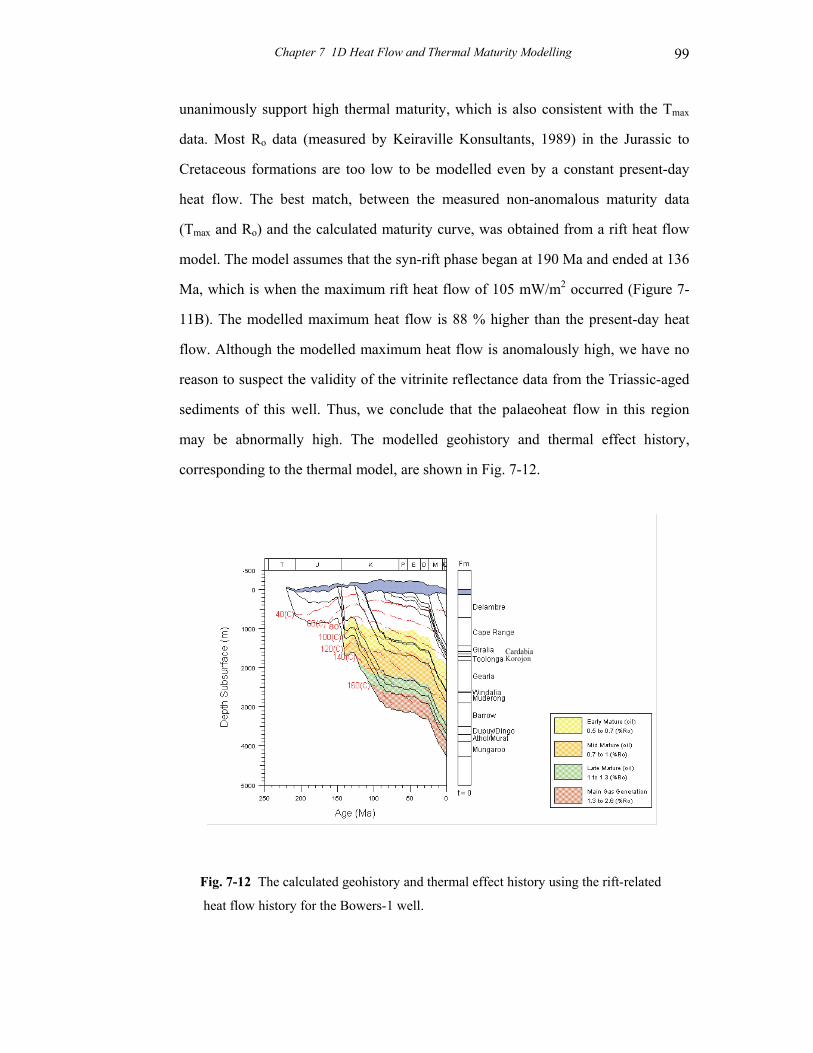
Chapter 7 1D Heat Flow and Thermal Maturity Modelling 99
unanimously support high thermal maturity, which is also consistent with the Tmax
data. Most Ro data (measured by Keiraville Konsultants, 1989) in the Jurassic to
Cretaceous formations are too low to be modelled even by a constant present-day
heat flow. The best match, between the measured non-anomalous maturity data
(Tmax and Ro) and the calculated maturity curve, was obtained from a rift heat flow
model. The model assumes that the syn-rift phase began at 190 Ma and ended at 136
Ma, which is when the maximum rift heat flow of 105 mW/m2 occurred (Figure 7-
11B). The modelled maximum heat flow is 88 % higher than the present-day heat
flow. Although the modelled maximum heat flow is anomalously high, we have no
reason to suspect the validity of the vitrinite reflectance data from the Triassic-aged
sediments of this well. Thus, we conclude that the palaeoheat flow in this region
may be abnormally high. The modelled geohistory and thermal effect history,
corresponding to the thermal model, are shown in Fig. 7-12.
Fig. 7-12 The calculated geohistory and thermal effect history using the rift-related
heat flow history for the Bowers-1 well.
Korojon
Chapter 7 1D Heat Flow and Thermal Maturity Modelling 100
7.5.3 Thermal modelling for 3 wells in the Dampier and Beagle Sub-basins
7.5.3.1 Rosemary-1 thermal modelling
The Dampier Sub-basin is a rift graben between the Beagle Sub-basin on the north
and the Barrow Sub-basin on the south. It is bounded on the west by the Rankin
Platform and on the east by the Lambert Shelf. The geological history of the basin
has been studied by a number of workers (e.g. Crostella and Chaney, 1978; Kopsen
and McGann, 1985; Veenstra, 1985; Vincent and Tilbury, 1988; Barber, 1994; Hill,
1994; Miller and Smith, 1996). Rosemary-1 was drilled on a faulted structure on the
Rosemary Fault System along the east flank of the sub-basin. In the acceptable
Rock-Eval data, the values of hydrogen index in the Jurassic organic-matter
generally range from about 80 to 191, with the Tmax values ranging from 432 oC to
442 oC, related to type III kerogen. The formation temperatures were corrected from
BHTs (raw BHTs + 10%). A current heat flow is calculated to be 47.5 mW/m2 with
a seabed temperature of 21 oC. The two sets of measured reflectance data (CSIRO
and Robertson Research Australia Pty. Ltd.) are significantly lower than the
modelled maturity trend, which is based on the present-day heat flow and seabed
temperature (Fig. 7-13). The modelled maturity curve, on the basis of these
corrected formation temperatures, is consistent with the Tmax data, which may
represent a lower limit maturity trend. Figure 7-14 shows the modelled histories of
burial, temperature and maturity for this well.
7.5.3.2 Madeleine-1 thermal modelling
The Madeleine-1 well was drilled in the Dampier Sub-basin (Fig. 7-1). In this case,
the formation temperatures are corrected from the measured well temperatures
(BHT + 10 %). A current heat flow of 48.2 mW/m2 (seafloor temperature = 23 oC) is
estimated. The two sets of vitrinite reflectance data (measured by Robertson
Research Australia Pty. Ltd. and Woodside Petroleum) from core and cutting
samples fall significantly lower than the calculated maturity curve for the constant
current heat flow model (Fig. 7-15A).
Chapter 7 1D Heat Flow and Thermal Maturity Modelling 101
Tmax data (measured by Robertson Research Australia Pty. Ltd. and Woodside
Petroleum) from both core and cutting samples can be used to evaluate the thermal
maturity trend in this well (Figure 7-15A). The Tmax data with S1 1 used for the
thermal modelling was examined using the REESA Rules. The constant current heat
flow model provides a good match to the relatively reliable Tmax data. The fact that
the present-day heat flow model can match the present maturity indicator suggests
that the thermal effect due to present-day burial has exceeded any thermal effect that
may have been imprinted on the sedimentary rocks during the syn-rift phase as
noted by Kaiko and Tingate (1996). To fit the modelled maturity trend, a rift-related
heat flow can be calculated with varying water-sediments interface temperature due
to palaeoseawater depth changes that contain uncertainties. The rift heat flow has a
peak heat flow value about 63 mW/m2 at about 155 Ma. Figures 7-16 to 7-18 show
the difference between the thermal histories and hydrocarbon generation effects
using the constant heat flow with the present seabed temperature and the rift heat
flow with varying seabed temperatures. The rift-related heat flow history may be
more reasonable for predicting histories of thermal maturity and hydrocarbon
generation according to the rift tectonic setting of this basin.
7.5.3.3 Depuch-1 thermal modelling
The Depuch-1 well was drilled on the northern flank of the main depocentre in the
Beagle Sub-basin. The sub-basin is situated at the northernmost of the elongate rift
grabens and is separated from the Dampier Sub-basin by the De Grey Nose (Figure
7-1). Three formation temperatures were obtained from corrected BHTs (raw BHT +
10 %). The measured maturity profiles with Ro (measured by Robertson Research
and Keiraville Konsultants), Eq VR (CSIRO Petroleum) and Tmax data (Robertson
Research) are shown in Fig. 7-19.
It should be also noted that some Tmax values are likely to be suppressed by about 1
to 4 oC, due to HI > 150 to 389 in coal-related samples, and the observed vitrinite
reflectance values in the Jurassic rocks may be suppressed by about 0.1 to 0.3 %.
The corrected Tmax data can be matched (Fig. 7-19) by the maturity model generated
from the assumption of a constant current heat flow, which was calculated to be 49.4
Chapter 7 1D Heat Flow and Thermal Maturity Modelling 102
mW/m2 (seabed temperature = 21 oC). The modelled result suggests that the maturity level, about 0.6-1.0 % Ro in the Jurassic sequence of this well, is less sensitive to rifting heat flow modelling and that the Jurassic source rocks in this location experienced relatively low temperature increases during the earlier syn-rift phase. The fact that the present-day heat flow model and seabed temperature can match these maturity data further suggests that the sedimentary sequence is currently experiencing its maximum temperature. The modelled geohistory and thermal effect are shown in Fig. 7-20. 7.5.4 Thermal modelling for 2 wells on the Rankin Platform 7.5.4.1 North Gorgon-1 thermal modelling The North Gorgon-1 well was drilled in the northern part of the Gorgon structure of the southern part of the Rankin Platform (Fig. 7-1), a relatively high structure, which forms the western boundary of the Barrow-Dampier Sub-basins. The Gorgon structure is a series of northeast-southwest trending, en-echelon horst blocks of the Rankin Platform. The horst blocks consist of Triassic rocks. During the Early-Middle Jurassic, the structure underwent uplift and erosion associated with the syn-rift phase. Hellinger and Sclater (1983) proposed that extension and subsidence within the rift phase is generally accompanied by uplift and erosion of the rift shoulders. Structural models by Stein (1994) show that some parts of the Rankin Platform have undergone in excess of 1.5 kilometres of rift-related uplift. Based on missing successions in the well data and interpreted seismic lines from the AGSO, the Lower Jurassic and the upper part of the Mungaroo Formation are missing and the erosional thickness is estimated to be 1500 to 2000 metres. Formation temperatures are based on DST temperatures. The maturity profiles, with Ro data (measured by Keiraville Konsultants) and Tmax data (measured by Amdel) in Fig. 7-21, indicate that there is no obvious break at the boundary between the Mungaroo Formation and Barrow Group. The measured maturity data can be matched well by the model, which assumes a constant current heat flow of 57.1 mW/m2 (seafloor temperature = 20 oC), irrespective of a missing section of Triassic and Lower Jurassic from 0 to 3200 metres. It is considered that the Rankin Platform as a western rift shoulder underwent a period of temperature decrease during the rift-associated uplift and erosion. This case illustrates that the graben shoulder has

Chapter 7 1D Heat Flow and Thermal Maturity Modelling 103
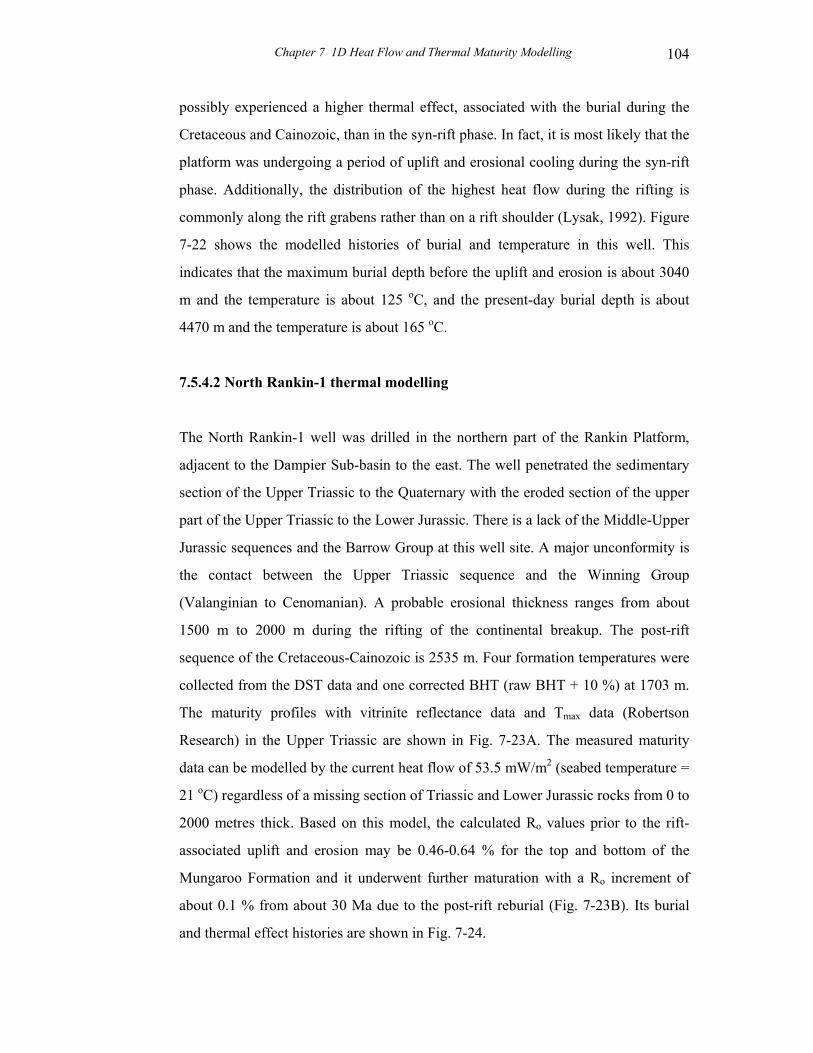
Chapter 7 1D Heat Flow and Thermal Maturity Modelling 104
possibly experienced a higher thermal effect, associated with the burial during the
Cretaceous and Cainozoic, than in the syn-rift phase. In fact, it is most likely that the
platform was undergoing a period of uplift and erosional cooling during the syn-rift
phase. Additionally, the distribution of the highest heat flow during the rifting is
commonly along the rift grabens rather than on a rift shoulder (Lysak, 1992). Figure
7-22 shows the modelled histories of burial and temperature in this well. This
indicates that the maximum burial depth before the uplift and erosion is about 3040
m and the temperature is about 125 oC, and the present-day burial depth is about
4470 m and the temperature is about 165 oC.
7.5.4.2 North Rankin-1 thermal modelling
The North Rankin-1 well was drilled in the northern part of the Rankin Platform,
adjacent to the Dampier Sub-basin to the east. The well penetrated the sedimentary
section of the Upper Triassic to the Quaternary with the eroded section of the upper
part of the Upper Triassic to the Lower Jurassic. There is a lack of the Middle-Upper
Jurassic sequences and the Barrow Group at this well site. A major unconformity is
the contact between the Upper Triassic sequence and the Winning Group
(Valanginian to Cenomanian). A probable erosional thickness ranges from about
1500 m to 2000 m during the rifting of the continental breakup. The post-rift
sequence of the Cretaceous-Cainozoic is 2535 m. Four formation temperatures were
collected from the DST data and one corrected BHT (raw BHT + 10 %) at 1703 m.
The maturity profiles with vitrinite reflectance data and Tmax data (Robertson
Research) in the Upper Triassic are shown in Fig. 7-23A. The measured maturity
data can be modelled by the current heat flow of 53.5 mW/m2 (seabed temperature =
21 oC) regardless of a missing section of Triassic and Lower Jurassic rocks from 0 to
2000 metres thick. Based on this model, the calculated Ro values prior to the rift-
associated uplift and erosion may be 0.46-0.64 % for the top and bottom of the
Mungaroo Formation and it underwent further maturation with a Ro increment of
about 0.1 % from about 30 Ma due to the post-rift reburial (Fig. 7-23B). Its burial
and thermal effect histories are shown in Fig. 7-24.
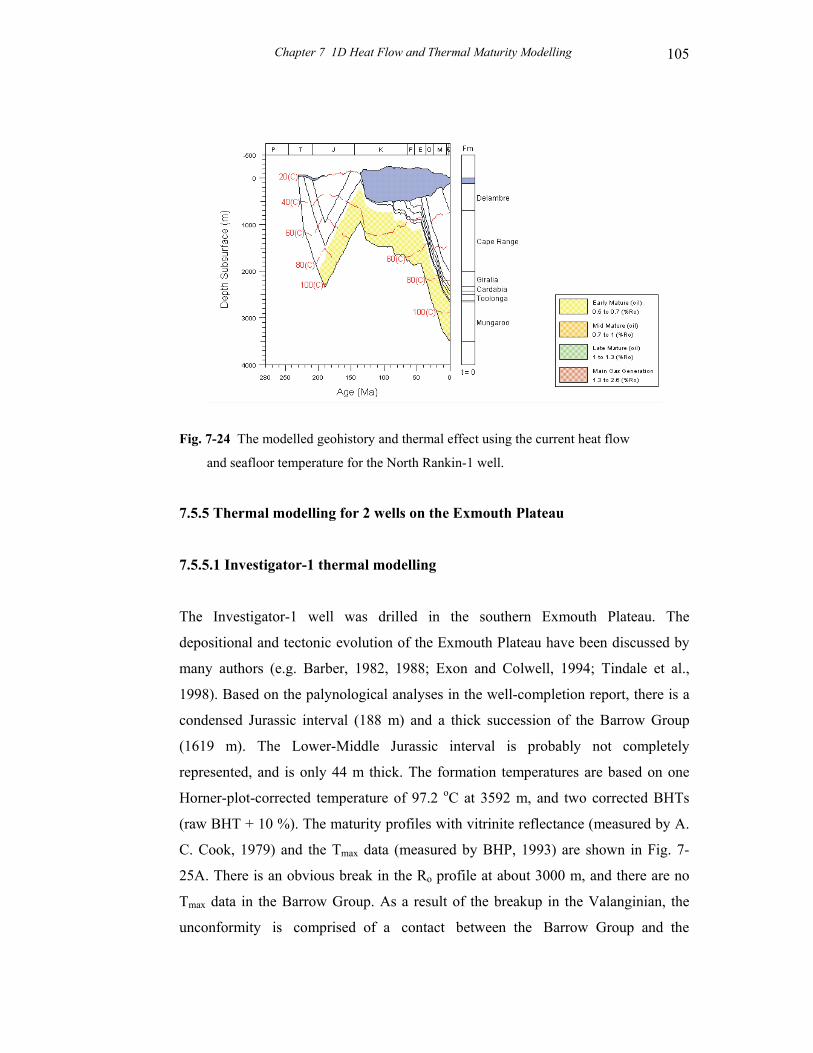
Chapter 7 1D Heat Flow and Thermal Maturity Modelling 105
Fig. 7-24 The modelled geohistory and thermal effect using the current heat flow
and seafloor temperature for the North Rankin-1 well.
7.5.5 Thermal modelling for 2 wells on the Exmouth Plateau
7.5.5.1 Investigator-1 thermal modelling
The Investigator-1 well was drilled in the southern Exmouth Plateau. The
depositional and tectonic evolution of the Exmouth Plateau have been discussed by
many authors (e.g. Barber, 1982, 1988; Exon and Colwell, 1994; Tindale et al.,
1998). Based on the palynological analyses in the well-completion report, there is a
condensed Jurassic interval (188 m) and a thick succession of the Barrow Group
(1619 m). The Lower-Middle Jurassic interval is probably not completely
represented, and is only 44 m thick. The formation temperatures are based on one
Horner-plot-corrected temperature of 97.2 oC at 3592 m, and two corrected BHTs
(raw BHT + 10 %). The maturity profiles with vitrinite reflectance (measured by A.
C. Cook, 1979) and the Tmax data (measured by BHP, 1993) are shown in Fig. 7-
25A. There is an obvious break in the Ro profile at about 3000 m, and there are no
Tmax data in the Barrow Group. As a result of the breakup in the Valanginian, the
unconformity is comprised of a contact between the Barrow Group and the

Chapter 7 1D Heat Flow and Thermal Maturity Modelling 106

Chapter 7 1D Heat Flow and Thermal Maturity Modelling 107
Muderong Shale (Tindale et al., 1998). The two segments of the Ro profile are
unlikely to be caused by a discontinuous thermal effect between the Jurassic
sequence and the Barrow Group due to a possible erosional period during the
Middle Jurassic. The model, based on extrapolation of the current heat flow of 56.8
mW/m2 (seafloor temperature = 5.5 oC) back in time, is inconsistent with the
measured Ro values (Fig. 7-25A). A rift palaeoheat flow scenario is shown in Fig. 7-
25B, and the modelled result is also shown in Fig. 7-25A. The rift thermal model
matches the measured Ro and Tmax profiles in the Triassic and Jurassic, but observed
values are lower in the Barrow Group interval. This suggests that the measured Ro
values in the Barrow Group should be inferred to be suppressed or incorrect. The
syn-rift phase is assumed to commence in the earliest Jurassic (208 Ma) and
continue to breakup (136 Ma). The modelled maximum heat flow, which
subsequently decayed exponentially to the present-day value, was determined to be
78 mW/m2, and was 37 % higher than the present heat flow of 56.8 mW/m2. Figure
7-26 shows the geohistory and the modelled histories of temperature and thermal
maturity using the rift-related heat flow history.
Fig. 7-26 The modelled geohistory and histories of temperature and thermal maturity
using the rift-related heat flow history for the Investigator-1 well. The erosional thickness
of 300 m was used during the Middle Jurassic.
Low-Middle Jurassic
Delambre/Cape RangeGiralia/Cardabia
Gearle

Chapter 7 1D Heat Flow and Thermal Maturity Modelling 108
7.5.5.2 Jupiter-1 thermal modelling
The Jupiter-1 well was drilled on an upthrown block of a fault half-graben on the
central Exmouth Plateau. The well has a condensed Upper Jurassic interval of 15 m
from the Callovian to the Tithonian. The Lower-Middle Jurassic sequence and
Barrow Group are absent. The three profiles of the measured maturity data include
vitrinite reflectance (measured by A. C. Cook, 1979, 1985 and AMDEL, 1996), Eq
VR (CSIRO Petroleum) and Tmax data (measured by Geotech, 1996) within the
Mungaroo Formation of the Middle-Upper Triassic (Fig. 7-27A). The formation
temperatures are all Horner-plot-corrected BHTs. It is difficult to get a fit between
the observed maturity data and calculated (modelled) maturity curve, based on the
present heat flow of 54.3 mW/m2 (seabed temperature = 5 oC) in this well. A good
fit between the observed and calculated maturity for this well is obtained using the
rift heat flow model (Fig. 7-27B). The peak thermal influence during rifting on this
well location is considered to be from 208 Ma to 155 Ma. The modelled maximum
value of the rift palaeoheat flow was about 72 mW/m2, which exponentially
decreased to the present value during the post-rift phase. The peak heat flow value is
about 33 % more than the present heat flow. Figure 7-28 is the geohistory, and
thermal history associated with the rift-related heat flow.
7.6 Summary
Possible errors in the modelled palaeoheat flow may be related to the conceptual
model for the present study, and also to input data, such as: (1) a single thermal
event during syn-rifting, (2) the assumption of only vertical thermal conduction, and
(3) uncertainties of the input data, such as thermal maturity, matrix thermal
conductivity, formation temperature, palaeoseafloor or surface temperature,
erosional thickness and hiatus time. These factors should be taken into
consideration when evaluating the modelled results.
Heat flow modelling indicates that the measured thermal maturity data in some
wells are consistent with rift heat flow models (Jarvis and McKenzie, 1980)
associated with the Jurassic to earliest Cretaceous rifting in the sub-basins (190-136

Chapter 7 1D Heat Flow and Thermal Maturity Modelling 109
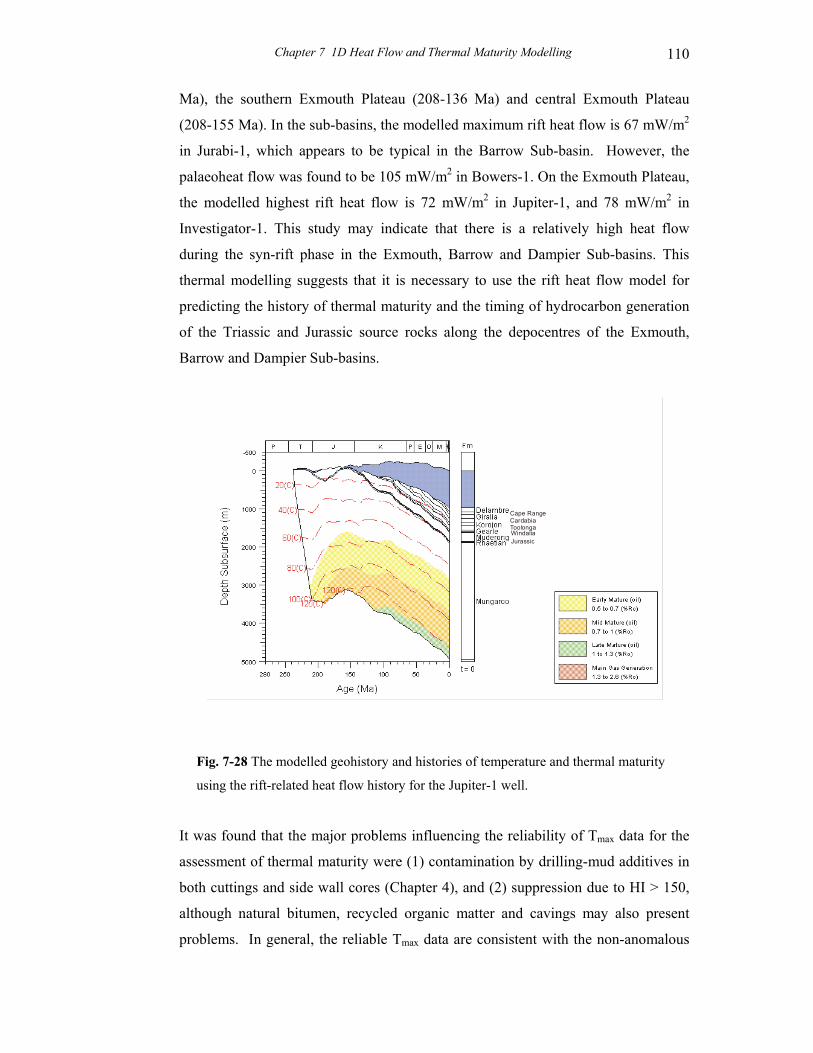
Chapter 7 1D Heat Flow and Thermal Maturity Modelling 110
Ma), the southern Exmouth Plateau (208-136 Ma) and central Exmouth Plateau
(208-155 Ma). In the sub-basins, the modelled maximum rift heat flow is 67 mW/m2
in Jurabi-1, which appears to be typical in the Barrow Sub-basin. However, the
palaeoheat flow was found to be 105 mW/m2 in Bowers-1. On the Exmouth Plateau,
the modelled highest rift heat flow is 72 mW/m2 in Jupiter-1, and 78 mW/m2 in
Investigator-1. This study may indicate that there is a relatively high heat flow
during the syn-rift phase in the Exmouth, Barrow and Dampier Sub-basins. This
thermal modelling suggests that it is necessary to use the rift heat flow model for
predicting the history of thermal maturity and the timing of hydrocarbon generation
of the Triassic and Jurassic source rocks along the depocentres of the Exmouth,
Barrow and Dampier Sub-basins.
Fig. 7-28 The modelled geohistory and histories of temperature and thermal maturity
using the rift-related heat flow history for the Jupiter-1 well.
It was found that the major problems influencing the reliability of Tmax data for the
assessment of thermal maturity were (1) contamination by drilling-mud additives in
both cuttings and side wall cores (Chapter 4), and (2) suppression due to HI > 150,
although natural bitumen, recycled organic matter and cavings may also present
problems. In general, the reliable Tmax data are consistent with the non-anomalous
Cape RangeCardabiaToolongaWindaliaJurassic
Chapter 7 1D Heat Flow and Thermal Maturity Modelling 111
(non-suppressed) Ro data and some Eq VR data, which plot according to the
proposed Ro-Tmax relationship (Fig. 7-2) for the basin. The relationship has been
extensively tested with many wells in this study. This study indicates that reliable
Tmax data are important, and useful, to evaluate thermal maturity, especially where
other maturity data are unavailable. The study shows the correlation developed
between Tmax and Ro in the detailed thermal modelling of individual wells and also
indicates that a good, reliable correlation between Tmax and Ro may go towards
overcoming the problems associated with the anomalously low vitrinite reflectance.
However, the proposed relationship of Ro to Tmax is preliminary, and more study is
needed to improve this correlation. It should be noted that the relationship between
Ro and Tmax, used in this study, may result in !3-10 % error for the calculated
vitrinite reflectance.

Chapter 7 1D Heat Flow and Thermal Maturity Modelling 112
Fig. 7-24 The modelled geohistory and thermal effect using the current heat flow
and seafloor temperature for the North Rankin-1 well.
7.5.5 Thermal modelling for 2 wells on the Exmouth Plateau
7.5.5.1 Investigator-1 thermal modelling
The Investigator-1 well was drilled in the southern Exmouth Plateau. The
depositional and tectonic evolution of the Exmouth Plateau have been discussed by
many authors (e.g. Barber, 1982, 1988; Exon and Colwell, 1994; Tindale et al.,
1998). Based on the palynological analyses in the well-completion report, there is a
condensed Jurassic interval (188 m) and a thick succession of the Barrow Group
(1619 m). The Lower-Middle Jurassic interval is probably not completely
represented, and is only 44 m thick. The formation temperatures are based on one
Horner-plot-corrected temperature of 97.2 oC at 3592 m, and two corrected BHTs
(raw BHT + 10 %). The maturity profiles with vitrinite reflectance (measured by A.
C. Cook, 1979) and the Tmax data (measured by BHP, 1993) are shown in Fig. 7-
25A. There is an obvious break in the Ro profile at about 3000 m, and there are no
Tmax data in the Barrow Group. As a result of the breakup in the Valanginian, the
unconformity is comprised of a contact between the Barrow Group and the

Chapter 7 1D Heat Flow and Thermal Maturity Modelling 113
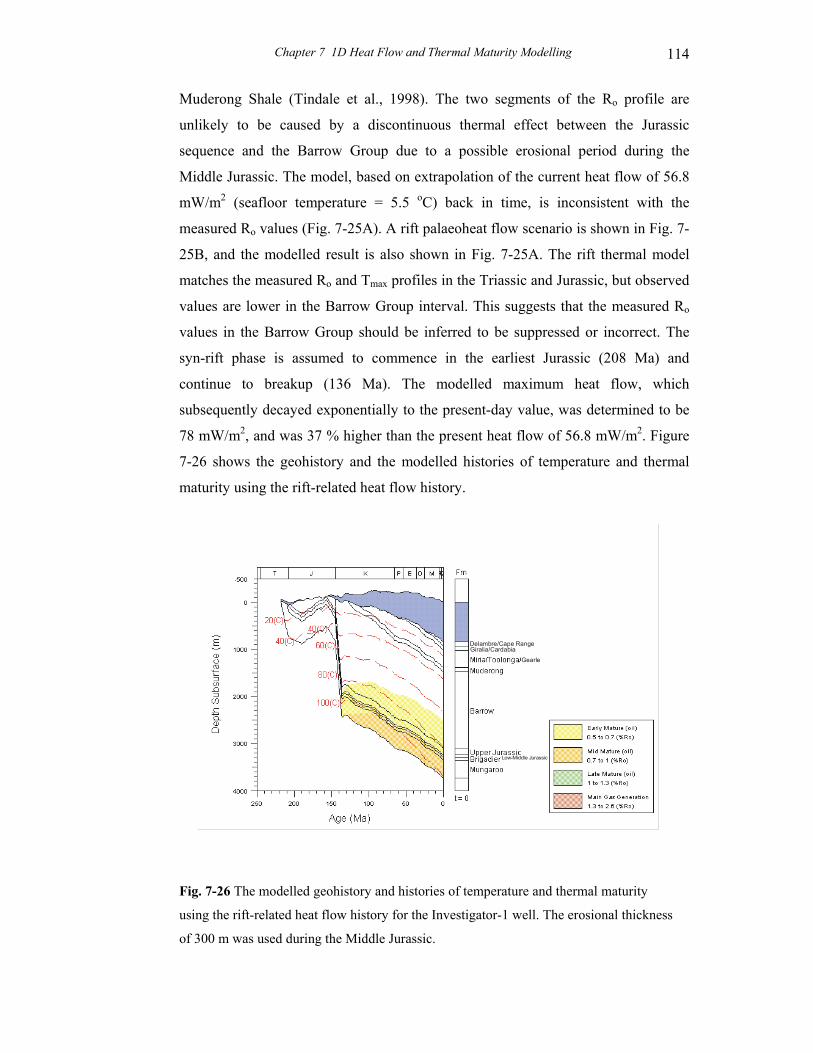
Chapter 7 1D Heat Flow and Thermal Maturity Modelling 114
Muderong Shale (Tindale et al., 1998). The two segments of the Ro profile are
unlikely to be caused by a discontinuous thermal effect between the Jurassic
sequence and the Barrow Group due to a possible erosional period during the
Middle Jurassic. The model, based on extrapolation of the current heat flow of 56.8
mW/m2 (seafloor temperature = 5.5 oC) back in time, is inconsistent with the
measured Ro values (Fig. 7-25A). A rift palaeoheat flow scenario is shown in Fig. 7-
25B, and the modelled result is also shown in Fig. 7-25A. The rift thermal model
matches the measured Ro and Tmax profiles in the Triassic and Jurassic, but observed
values are lower in the Barrow Group interval. This suggests that the measured Ro
values in the Barrow Group should be inferred to be suppressed or incorrect. The
syn-rift phase is assumed to commence in the earliest Jurassic (208 Ma) and
continue to breakup (136 Ma). The modelled maximum heat flow, which
subsequently decayed exponentially to the present-day value, was determined to be
78 mW/m2, and was 37 % higher than the present heat flow of 56.8 mW/m2. Figure
7-26 shows the geohistory and the modelled histories of temperature and thermal
maturity using the rift-related heat flow history.
Fig. 7-26 The modelled geohistory and histories of temperature and thermal maturity
using the rift-related heat flow history for the Investigator-1 well. The erosional thickness
of 300 m was used during the Middle Jurassic.
Low-Middle Jurassic
Delambre/Cape RangeGiralia/Cardabia
Gearle
Chapter 7 1D Heat Flow and Thermal Maturity Modelling 115
7.5.5.2 Jupiter-1 thermal modelling
The Jupiter-1 well was drilled on an upthrown block of a fault half-graben on the
central Exmouth Plateau. The well has a condensed Upper Jurassic interval of 15 m
from the Callovian to the Tithonian. The Lower-Middle Jurassic sequence and
Barrow Group are absent. The three profiles of the measured maturity data include
vitrinite reflectance (measured by A. C. Cook, 1979, 1985 and AMDEL, 1996), Eq
VR (CSIRO Petroleum) and Tmax data (measured by Geotech, 1996) within the
Mungaroo Formation of the Middle-Upper Triassic (Fig. 7-27A). The formation
temperatures are all Horner-plot-corrected BHTs. It is difficult to get a fit between
the observed maturity data and calculated (modelled) maturity curve, based on the
present heat flow of 54.3 mW/m2 (seabed temperature = 5 oC) in this well. A good
fit between the observed and calculated maturity for this well is obtained using the
rift heat flow model (Fig. 7-27B). The peak thermal influence during rifting on this
well location is considered to be from 208 Ma to 155 Ma. The modelled maximum
value of the rift palaeoheat flow was about 72 mW/m2, which exponentially
decreased to the present value during the post-rift phase. The peak heat flow value is
about 33 % more than the present heat flow. Figure 7-28 is the geohistory, and
thermal history associated with the rift-related heat flow.
7.6 Summary
Possible errors in the modelled palaeoheat flow may be related to the conceptual
model for the present study, and also to input data, such as: (1) a single thermal
event during syn-rifting, (2) the assumption of only vertical thermal conduction, and
(3) uncertainties of the input data, such as thermal maturity, matrix thermal
conductivity, formation temperature, palaeoseafloor or surface temperature,
erosional thickness and hiatus time. These factors should be taken into
consideration when evaluating the modelled results.
Heat flow modelling indicates that the measured thermal maturity data in some
wells are consistent with rift heat flow models (Jarvis and McKenzie, 1980)
associated with the Jurassic to earliest Cretaceous rifting in the sub-basins (190-136

Chapter 7 1D Heat Flow and Thermal Maturity Modelling 116

Chapter 7 1D Heat Flow and Thermal Maturity Modelling 117
Ma), the southern Exmouth Plateau (208-136 Ma) and central Exmouth Plateau
(208-155 Ma). In the sub-basins, the modelled maximum rift heat flow is 67 mW/m2
in Jurabi-1, which appears to be typical in the Barrow Sub-basin. However, the
palaeoheat flow was found to be 105 mW/m2 in Bowers-1. On the Exmouth Plateau,
the modelled highest rift heat flow is 72 mW/m2 in Jupiter-1, and 78 mW/m2 in
Investigator-1. This study may indicate that there is a relatively high heat flow
during the syn-rift phase in the Exmouth, Barrow and Dampier Sub-basins. This
thermal modelling suggests that it is necessary to use the rift heat flow model for
predicting the history of thermal maturity and the timing of hydrocarbon generation
of the Triassic and Jurassic source rocks along the depocentres of the Exmouth,
Barrow and Dampier Sub-basins.
Fig. 7-28 The modelled geohistory and histories of temperature and thermal maturity
using the rift-related heat flow history for the Jupiter-1 well.
It was found that the major problems influencing the reliability of Tmax data for the
assessment of thermal maturity were (1) contamination by drilling-mud additives in
both cuttings and side wall cores (Chapter 4), and (2) suppression due to HI > 150,
although natural bitumen, recycled organic matter and cavings may also present
problems. In general, the reliable Tmax data are consistent with the non-anomalous
Cape RangeCardabiaToolongaWindaliaJurassic
Chapter 7 1D Heat Flow and Thermal Maturity Modelling 118
(non-suppressed) Ro data and some Eq VR data, which plot according to the
proposed Ro-Tmax relationship (Fig. 7-2) for the basin. The relationship has been
extensively tested with many wells in this study. This study indicates that reliable
Tmax data are important, and useful, to evaluate thermal maturity, especially where
other maturity data are unavailable. The study shows the correlation developed
between Tmax and Ro in the detailed thermal modelling of individual wells and also
indicates that a good, reliable correlation between Tmax and Ro may go towards
overcoming the problems associated with the anomalously low vitrinite reflectance.
However, the proposed relationship of Ro to Tmax is preliminary, and more study is
needed to improve this correlation. It should be noted that the relationship between
Ro and Tmax, used in this study, may result in !3-10 % error for the calculated
vitrinite reflectance.

Chapter 7 1D Heat Flow and Thermal Maturity Modelling 119
Chapter 8 Thermal Maturity within the Overpressured Jurassic Rocks
122
CHAPTER 8 THERMAL MATURITY AND THERMAL
MODELLING WITHIN THE OVERPRESSURED JURASSIC
ROCKS IN THE BARROW AND BAMBRA WELLS
8.1 Introduction
Overpressure is common in many sedimentary basins worldwide (e.g. Bigelow,
1994b; Swarbrick and Osborne, 1998). Disequilibrium compaction and fluid volume
expansion during gas generation are considered to be the major contributors to large
magnitude overpressure (e.g. Swarbrick and Osborne, 1998). Hunt (1990) has noted
that much of the world's oil and gas has been generated from source rocks in deep
(>3000 m) overpressured fluid compartments, and the fluid thermal expansion and
hydrocarbon generation result in overpressure within sealed compartments of
sedimentary basins. McTavish (1998) has also pointed out that the abnormal profiles
of organic matter maturation in overpressured sequence, which express the
retardation of maturation, are a worldwide phenomenon.
Vitrinite reflectance (Ro) is the most widely used maturity indicator in petroleum
exploration (e.g. Tissot and Welte, 1984; Allen and Allen, 1990; Hunt, 1996). A
common interpretation for unexpectedly low Ro is vitrinite-reflectance suppression,
which occurs when measurement is made on (1) liptinite-rich organic matter, and
(2) a perhydrous vitrinite population (e.g. Hutton and Cook, 1980; Price and Barker,
1985; Raymond and Murchison, 1991), or (3) vitrinite deposited under marine
influence (e.g. Wilkins et al., 1992a; Hunt, 1996; Gurba and Ward, 1998). In
overpressured systems, an alternative explanation for anomalously low vitrinite
reflectance values is due to overpressure retardation of organic matter maturation
(McTavish, 1978; Hao et al., 1995; McTavish, 1998; Carr, 1999). McTavish (1978)
described possible pressure retardation of vitrinite reflectance in some North Sea
wells, and Hao et al. (1995) found that overpressure has significantly retarded
organic matter maturation and petroleum generation from the LD3011 well in the
Yinggehai Basin, South China Sea. In contrast, Hunt (1979; 1996) emphasized that
vitrinite maturation is not significantly affected by pressure, only by temperature.
Tissot and Welte (1984) pointed out that the influence of pressure is probably
Chapter 8 Thermal Maturity within the Overpressured Jurassic Rocks
123
subordinate to that of temperature on the basis of geological studies and
experimental work. Furthermore, Allen and Allen (1990) stated that pressure is a
negligible factor in thermal maturity. These authors stressed that the most important
factor in thermal maturity is temperature, with pressure being relatively unimportant
in hydrocarbon generation. Similarly, Khorasani and Michelsen (1994)
demonstrated that the effect of overpressure in shales has no important influence on
the observed relationship between temperature and vitrinite reflectance.
The unusually steep vitrinite reflectance profiles, mainly in the Jurassic and the
Lower Cretaceous formations in the Northern Carnarvon Basin, North West Shelf of
Australia, have been studied by various authors (e.g. Wilkins et al., 1992a; Kaiko
and Tingate, 1996; Samuelsson and Middleton, 1998). Wilkins et al. (1992a)
proposed that the two main sources of error in the vitrinite reflectance data for some
North West Shelf wells are the suppression of vitrinite reflectance with marine
influence and/or inaccurate identification of vitrinite in dispersed organic matter.
They also indicated that some North West Shelf wells show a surprisingly small
increase in vitrinite reflectance with increasing depth that is impossible to fit with
thermal maturity modelling.
McTavish (1998) maintained that apparently abnormal maturity profiles in source
rocks found in overpressured sequences are widespread in the world, including other
unpublished examples from the North West Shelf of Australia. With regard to the
Australian North West Shelf, and in the Barrow Sub-basin of the Northern
Carnarvon Basin specifically, the deeper part of some anomalous vitrinite
reflectance profiles is associated with high overpressure (e.g. Kopsen and McGann,
1985; Wilkins et al., 1992a; Swarbrick and Hillis, 1999). Kopsen and McGann
(1985) described present-day thermal maturities of the Barrow and Bambra wells
below expected values with the apparent vitrinite under-maturity occurring within
the highly overpressured Jurassic sequence. Wilkins et al. (1992a) pointed out that
the lower part of the Jurassic sequence in Barrow Deep-1 is strongly overpressured,
but considered that the overpressure effect on vitrinite reflectance was likely to be
small. Swarbrick and Hillis (1999) suggested that the vitrinite reflectance data from
the North West Shelf basins should be used with caution where overpressuring is
significant. They further suggested that the retardation of maturation was largely
Chapter 8 Thermal Maturity within the Overpressured Jurassic Rocks
124
responsible for delayed petroleum-trap charging, which was at variance with the
charge time predicted by some basin modelling exercises. It is clear from the above
that there is an unsolved problem: are the anomalously low vitrinite reflectance
profiles in the overpressured Jurassic sequence of the Barrow Sub-basin due to
overpressure-related retardation of thermal maturity? This topic is believed to merit
further attention. This chapter aims to improve an understanding of whether the
overpressure has a determinable influence on thermal maturity and petroleum
generation in two separate case studies using measured maturity data and thermal
modelling in the overpressured Jurassic section in the Barrow and Bambra wells.
The wells for the case studies are (1) the Barrow-1/Barrow Deep-1 wells, and (2) the
Bambra-1/Bambra-2 wells (Fig. 6-1).
8.2 Thermal maturity
The thermal maturity data used in this study include Ro, equivalent vitrinite
reflectance (Eq VR) and Rock Eval Tmax. The Ro data in three wells and Eq VR in
Barrow-1 are listed in Table 8-1. It can be seen that the majority of measured
vitrinite reflectance values in these three wells are unexpectedly low compared with
Eq VR and Rock-Eval Tmax data. Rock-Eval Tmax data for Bambra-2, Barrow Deep-1
and Barrow-1 are listed in Table 4-1, Tables 8-2 and 8-3, respectively. Figures 8-1
and 8-2 show that the Jurassic section is highly overpressured in these wells and the
Rock-Eval Tmax data generally increase with increasing depth. It should be noted
that the Tmax data used in Bambra-2 are the acceptable and normal values in Table 4-
1. However, it is uncertain whether the thermal maturity has been retarded in the
overpressured zone. It needs to be further studied, combined with more maturity
parameters and thermal modelling.
The molecular parameters of thermal maturity from gas chromatography (GC) and
gas chromatography-mass spectrometry (GC-MS) analyses of saturated hydrocarbon
fractions from paraffinic crude oils and rocks in the Barrow and Bambra areas are
given in Table 8-4. Volkman et al. (1983) demonstrated that these crude oils in the
Barrow Sub-basin had a source in the Upper Jurassic Dingo Claystone formation.
The distributions of n-alkane hydrocarbons from GC analyses on the extracts of the

Chapter 8 Thermal Maturity within the Overpressured Jurassic Rocks
125
Chapter 8 Thermal Maturity within the Overpressured Jurassic Rocks
126
conventional core samples (4274.2 m and 4282.9 m) show quite high levels of
thermal maturity (Fig. 4-2, A and B). Peters and Moldowan (1993) and Hunt (1996)
recommend that the ratios of C29 20S/(20S+20R) and C29 ββ/(ββ+αα) steranes can
be used as maturity indicators with maturity ranges, compared with vitrinite
reflectance, between < 0.4-0.8 % and < 0.4-0.9 % Ro respectively. As can be
expected on the basis of Peters and Moldowan (1993) and Hunt (1996), the
traditionally used biomarker maturity parameters based on steranes for the source
rock samples at 3610 m, 4274 m and 4283 m (A and B; Table 8-4) in the
overpressured zone have all reached their equilibrium values. The steadily
decreasing pristane/n-C17 and phytane/n-C18 ratios in rocks (C and D; Table 8-4)
with burial depth indicate that the thermal maturity of the source rocks in the
overpressured interval increases with increasing depth (temperature). This organic
geochemical evidence indicates that the organic matter in the source rocks of the
observed overpressured interval in the Barrow and Bambra areas has experienced
moderate to high levels of thermal maturation and that a detectable maturation
retardation has not been observed from the sedimentary organic matter in the
overpressured system.
8.3 Data sets for thermal maturity modelling
Key input data for the modelling comprise the present thickness of the stratigraphic
interval, lithology (Table 8-5), absolute age, measured formation temperatures
(Table 8-6), thermal maturities and palaeobathymetries based on the data from Dr.
Alex Kaiko (personal communication). The porosity-depth relationship for
backstripping established by Falvey and Middleton (1981) was adopted for the
modelling of burial histories. In the study areas of the selected wells, there is no
significant erosion (Ellis et al., 1999) to influence the maturity modelling, although
uplift may have occurred during the Tertiary (Densley et al., 2000). Hiatuses have
been treated as periods of non-deposition. Some present-day geothermal parameters
are shown in Table 6-1. Formation temperatures used in this thermal modelling are
listed in Table 8-6.
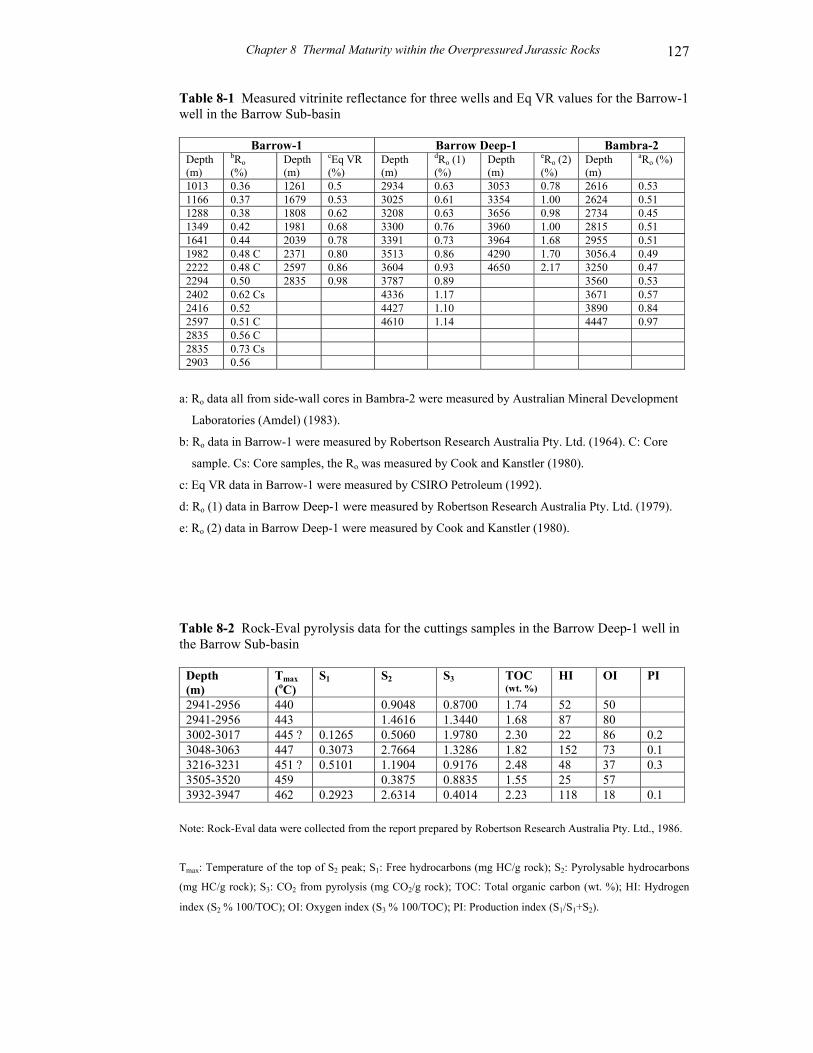
Chapter 8 Thermal Maturity within the Overpressured Jurassic Rocks
127
Table 8-1 Measured vitrinite reflectance for three wells and Eq VR values for the Barrow-1 well in the Barrow Sub-basin
Barrow-1 Barrow Deep-1 Bambra-2 Depth (m)
bRo (%)
Depth (m)
cEq VR (%)
Depth (m)
dRo (1) (%)
Depth (m)
eRo (2) (%)
Depth (m)
aRo (%)
1013 0.36 1261 0.5 2934 0.63 3053 0.78 2616 0.53 1166 0.37 1679 0.53 3025 0.61 3354 1.00 2624 0.51 1288 0.38 1808 0.62 3208 0.63 3656 0.98 2734 0.45 1349 0.42 1981 0.68 3300 0.76 3960 1.00 2815 0.51 1641 0.44 2039 0.78 3391 0.73 3964 1.68 2955 0.51 1982 0.48 C 2371 0.80 3513 0.86 4290 1.70 3056.4 0.49 2222 0.48 C 2597 0.86 3604 0.93 4650 2.17 3250 0.47 2294 0.50 2835 0.98 3787 0.89 3560 0.53 2402 0.62 Cs 4336 1.17 3671 0.57 2416 0.52 4427 1.10 3890 0.84 2597 0.51 C 4610 1.14 4447 0.97 2835 0.56 C 2835 0.73 Cs 2903 0.56
a: Ro data all from side-wall cores in Bambra-2 were measured by Australian Mineral Development
Laboratories (Amdel) (1983).
b: Ro data in Barrow-1 were measured by Robertson Research Australia Pty. Ltd. (1964). C: Core
sample. Cs: Core samples, the Ro was measured by Cook and Kanstler (1980).
c: Eq VR data in Barrow-1 were measured by CSIRO Petroleum (1992).
d: Ro (1) data in Barrow Deep-1 were measured by Robertson Research Australia Pty. Ltd. (1979).
e: Ro (2) data in Barrow Deep-1 were measured by Cook and Kanstler (1980).
Table 8-2 Rock-Eval pyrolysis data for the cuttings samples in the Barrow Deep-1 well in the Barrow Sub-basin
Depth (m)
Tmax (oC)
S1 S2 S3 TOC (wt. %)
HI OI PI
2941-2956 440 0.9048 0.8700 1.74 52 50 2941-2956 443 1.4616 1.3440 1.68 87 80 3002-3017 445 ? 0.1265 0.5060 1.9780 2.30 22 86 0.2 3048-3063 447 0.3073 2.7664 1.3286 1.82 152 73 0.1 3216-3231 451 ? 0.5101 1.1904 0.9176 2.48 48 37 0.3 3505-3520 459 0.3875 0.8835 1.55 25 57 3932-3947 462 0.2923 2.6314 0.4014 2.23 118 18 0.1
Note: Rock-Eval data were collected from the report prepared by Robertson Research Australia Pty. Ltd., 1986.
Tmax: Temperature of the top of S2 peak; S1: Free hydrocarbons (mg HC/g rock); S2: Pyrolysable hydrocarbons
(mg HC/g rock); S3: CO2 from pyrolysis (mg CO2/g rock); TOC: Total organic carbon (wt. %); HI: Hydrogen
index (S2 % 100/TOC); OI: Oxygen index (S3 % 100/TOC); PI: Production index (S1/S1+S2).
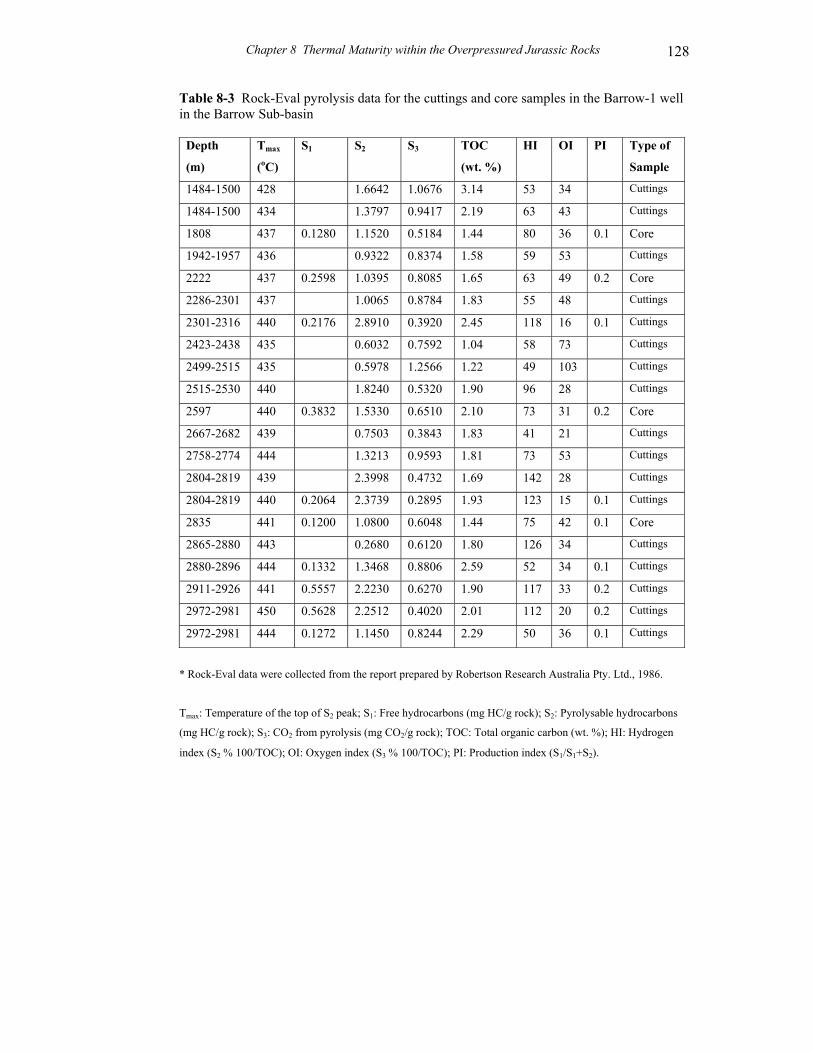
Chapter 8 Thermal Maturity within the Overpressured Jurassic Rocks
128
Table 8-3 Rock-Eval pyrolysis data for the cuttings and core samples in the Barrow-1 well in the Barrow Sub-basin
Depth
(m)
Tmax
(oC)
S1 S2 S3 TOC
(wt. %)
HI OI PI Type of
Sample
1484-1500 428 1.6642 1.0676 3.14 53 34 Cuttings
1484-1500 434 1.3797 0.9417 2.19 63 43 Cuttings
1808 437 0.1280 1.1520 0.5184 1.44 80 36 0.1 Core
1942-1957 436 0.9322 0.8374 1.58 59 53 Cuttings
2222 437 0.2598 1.0395 0.8085 1.65 63 49 0.2 Core
2286-2301 437 1.0065 0.8784 1.83 55 48 Cuttings
2301-2316 440 0.2176 2.8910 0.3920 2.45 118 16 0.1 Cuttings
2423-2438 435 0.6032 0.7592 1.04 58 73 Cuttings
2499-2515 435 0.5978 1.2566 1.22 49 103 Cuttings
2515-2530 440 1.8240 0.5320 1.90 96 28 Cuttings
2597 440 0.3832 1.5330 0.6510 2.10 73 31 0.2 Core
2667-2682 439 0.7503 0.3843 1.83 41 21 Cuttings
2758-2774 444 1.3213 0.9593 1.81 73 53 Cuttings
2804-2819 439 2.3998 0.4732 1.69 142 28 Cuttings
2804-2819 440 0.2064 2.3739 0.2895 1.93 123 15 0.1 Cuttings
2835 441 0.1200 1.0800 0.6048 1.44 75 42 0.1 Core
2865-2880 443 0.2680 0.6120 1.80 126 34 Cuttings
2880-2896 444 0.1332 1.3468 0.8806 2.59 52 34 0.1 Cuttings
2911-2926 441 0.5557 2.2230 0.6270 1.90 117 33 0.2 Cuttings
2972-2981 450 0.5628 2.2512 0.4020 2.01 112 20 0.2 Cuttings
2972-2981 444 0.1272 1.1450 0.8244 2.29 50 36 0.1 Cuttings
* Rock-Eval data were collected from the report prepared by Robertson Research Australia Pty. Ltd., 1986.
Tmax: Temperature of the top of S2 peak; S1: Free hydrocarbons (mg HC/g rock); S2: Pyrolysable hydrocarbons
(mg HC/g rock); S3: CO2 from pyrolysis (mg CO2/g rock); TOC: Total organic carbon (wt. %); HI: Hydrogen
index (S2 % 100/TOC); OI: Oxygen index (S3 % 100/TOC); PI: Production index (S1/S1+S2).
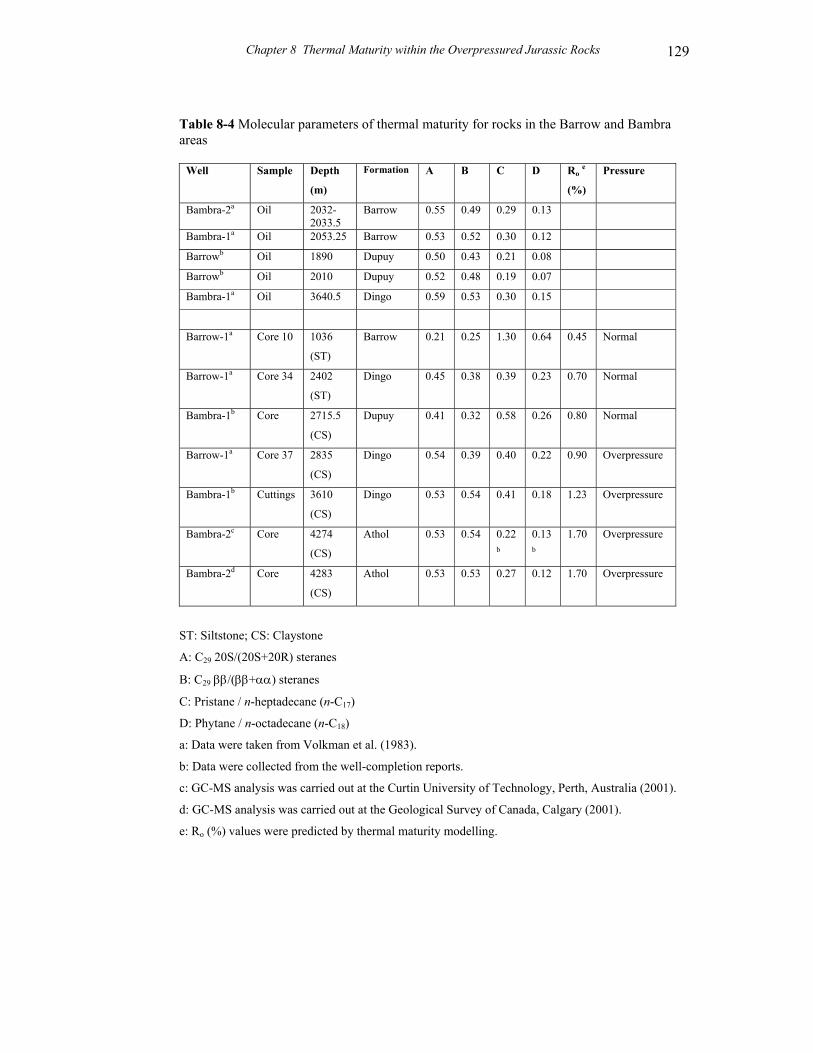
Chapter 8 Thermal Maturity within the Overpressured Jurassic Rocks
129
Table 8-4 Molecular parameters of thermal maturity for rocks in the Barrow and Bambra areas
Well Sample Depth
(m)
Formation A B C D Ro e
(%)
Pressure
Bambra-2a Oil 2032-2033.5
Barrow 0.55 0.49 0.29 0.13
Bambra-1a Oil 2053.25 Barrow 0.53 0.52 0.30 0.12
Barrowb Oil 1890 Dupuy 0.50 0.43 0.21 0.08
Barrowb Oil 2010 Dupuy 0.52 0.48 0.19 0.07
Bambra-1a Oil 3640.5 Dingo 0.59 0.53 0.30 0.15
Barrow-1a Core 10 1036
(ST)
Barrow 0.21 0.25 1.30 0.64 0.45 Normal
Barrow-1a Core 34 2402
(ST)
Dingo 0.45 0.38 0.39 0.23 0.70 Normal
Bambra-1b Core 2715.5
(CS)
Dupuy 0.41 0.32 0.58 0.26 0.80 Normal
Barrow-1a Core 37 2835
(CS)
Dingo 0.54 0.39 0.40 0.22 0.90 Overpressure
Bambra-1b Cuttings 3610
(CS)
Dingo 0.53 0.54 0.41 0.18 1.23 Overpressure
Bambra-2c Core 4274
(CS)
Athol 0.53 0.54 0.22b
0.13b
1.70 Overpressure
Bambra-2d Core 4283
(CS)
Athol 0.53 0.53 0.27 0.12 1.70 Overpressure
ST: Siltstone; CS: Claystone
A: C29 20S/(20S+20R) steranes
B: C29 ββ/(ββ+αα) steranes
C: Pristane / n-heptadecane (n-C17)
D: Phytane / n-octadecane (n-C18)
a: Data were taken from Volkman et al. (1983).
b: Data were collected from the well-completion reports.
c: GC-MS analysis was carried out at the Curtin University of Technology, Perth, Australia (2001).
d: GC-MS analysis was carried out at the Geological Survey of Canada, Calgary (2001).
e: Ro (%) values were predicted by thermal maturity modelling.
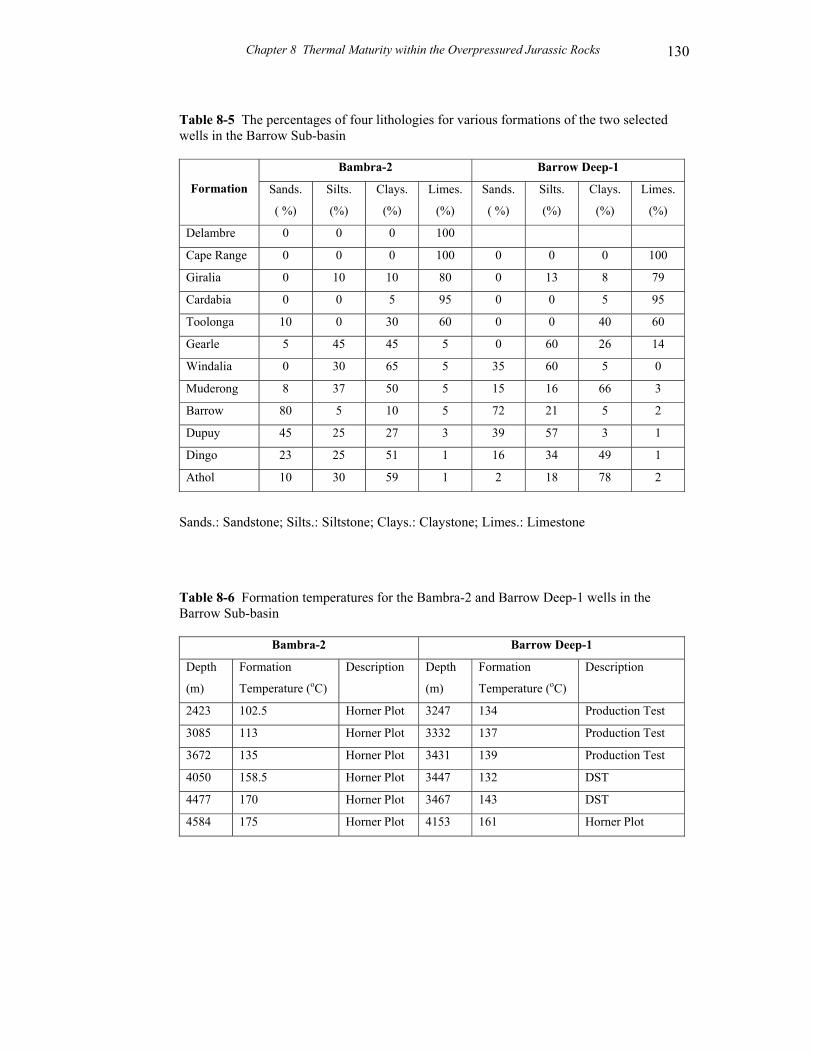
Chapter 8 Thermal Maturity within the Overpressured Jurassic Rocks
130
Table 8-5 The percentages of four lithologies for various formations of the two selected wells in the Barrow Sub-basin
Bambra-2 Barrow Deep-1
Formation Sands.
( %)
Silts.
(%)
Clays.
(%)
Limes.
(%)
Sands.
( %)
Silts.
(%)
Clays.
(%)
Limes.
(%)
Delambre 0 0 0 100
Cape Range 0 0 0 100 0 0 0 100
Giralia 0 10 10 80 0 13 8 79
Cardabia 0 0 5 95 0 0 5 95
Toolonga 10 0 30 60 0 0 40 60
Gearle 5 45 45 5 0 60 26 14
Windalia 0 30 65 5 35 60 5 0
Muderong 8 37 50 5 15 16 66 3
Barrow 80 5 10 5 72 21 5 2
Dupuy 45 25 27 3 39 57 3 1
Dingo 23 25 51 1 16 34 49 1
Athol 10 30 59 1 2 18 78 2
Sands.: Sandstone; Silts.: Siltstone; Clays.: Claystone; Limes.: Limestone
Table 8-6 Formation temperatures for the Bambra-2 and Barrow Deep-1 wells in the Barrow Sub-basin
Bambra-2 Barrow Deep-1
Depth
(m)
Formation
Temperature (oC)
Description Depth
(m)
Formation
Temperature (oC)
Description
2423 102.5 Horner Plot 3247 134 Production Test
3085 113 Horner Plot 3332 137 Production Test
3672 135 Horner Plot 3431 139 Production Test
4050 158.5 Horner Plot 3447 132 DST
4477 170 Horner Plot 3467 143 DST
4584 175 Horner Plot 4153 161 Horner Plot
Chapter 8 Thermal Maturity within the Overpressured Jurassic Rocks
131
8.4 Thermal maturity modelling
Palaeotemperatures were calculated using the transient-heat-flow model with a
constant heat-flow history (calculated current heat flow) and seabed/surface
temperature through time, because the palaeotemperatures in this region experienced
during the rifting phase may have been equalled, or exceeded, by those associated
during the later sag-phase sedimentation (Kaiko and Tingate, 1996; Nielsen, 1996).
Palaeotemperatures were also calculated using a rift-related heat flow model and
varying seabed/surface temperature over geological time. The rift-related heat flow
history was calculated based on the modified Jarvis and McKenzie (1980) algorithm
in the BasinMod 1D. The method of temperature calculation takes into account the
thermal conductivity plus the heat capacity of the lithologies in this model. The
kinetics of vitrinite maturation is a function of temperature and time. Ro curves were
calculated using the chemical kinetic model of vitrinite reflectance (Sweeney and
Burnham, 1990) in the BasinMod 1D.
8.4.1 Barrow-1 thermal modelling
Figure 8-3 shows the modelled maturity curves and temperature line in Barrow-1,
which correspond to the upper part of Barrow Deep-1. The formation temperatures,
calculated current heat flow and surface temperature are based on the values from
Barrow Deep-1 (Tables 6-1 and 8-6). The modelled temperature line is consistent
with the corrected BHTs (raw BHT + 10 %) in this well. The modelled result
indicates that the measured Ro data (Table 8-1) are much lower than the calculated
maturity curves. Nevertheless, both Eq VR data and Tmax data measured from core
and cutting samples can be matched using the current heat flow (surface temperature
= 25 oC) (Fig. 8-3). According to the fluid pressure profile in Fig. 8-1, sedimentary
rocks shallower than 2650 m are normally pressured, and 2650 m to a total depth of
2970 m is the pressure transition zone in this well. This result indicates that the
measured Ro is probably suppressed and suggests that the anomalously steep
vitrinite reflectance profile should not be related to the pore fluid pressure. Fig. 8-4
shows the modelled geohistory and histories of temperature and thermal maturity
using the constant heat flow and surface temperature histories for this well.

Chapter 8 Thermal Maturity within the Overpressured Jurassic Rocks
132
Chapter 8 Thermal Maturity within the Overpressured Jurassic Rocks
133
8.4.2 Barrow Deep-1 thermal modelling
Figure 8-5 shows that the modelled maturity curve was obtained from the constant
current heat-flow history as in the Barrow-1 modelling (Tables 6-1 and 8-6). The
measured maturity data, which indicates two sets of vitrinite reflectance values
(Table 8-1) and Tmax data, are from the overpressured Jurassic source section. The
Ro (1) data were measured by Robertson Research Australia Pty. Ltd. (1979) (open-
file data) and the Ro (2) data by Cook and Kantsler (1980). Both Ro datasets are
generally lower than the modelled maturity curves. However, the anomalously low
Ro values are inconsistent with low maturity and are not supported by Rock-Eval
data.
The predicted maturity curve obtained from the present-day heat flow and surface
temperature (Fig. 8-5) is consistent with the Tmax data, and the measured Ro (2) data
for the three deepest values of Cook and Kantsler (1980). After a comparison of the
three deepest Ro (2) values and the reliable Tmax values with the good-fit maturity
curve, it is found that there is also no reliable evidence to support overpressure
influence on the thermal maturity in the highly overpressured Jurassic section. Also,
the Jurassic source rocks between 3150-4550 m have experienced moderate to over
maturity consistent with the predicted maturity (Ro: 1.05-2.2 %) between 3150-4550
m with small to very little remaining hydrocarbon generation potential (most of
hydrogen indices range from < 10 to 50, while TOC range from 1 % to 2.5%) in the
overpressured sequence, whereas the three hydrogen indices between 60 to 110 at
about 3900-4170 m are thought to be due to some contribution of solid bitumen (5
% of solid bitumen content at 4145 m) based on the organic petrographic analysis of
Teerman (1994) (Fig. 8-1). This case study indicates that the anomalously low Ro
data, measured by Robertson Research Australia Pty. Ltd. and Cook and Kantsler
(1980), are not significantly affected by the overpressuring. It should be noted that
casing point control and careful sample scrutiny confirm that cavings are not
responsible for the anomalously low Ro values (Fig. 8-1). Figure 8-6 shows the
modelled histories of burial and thermal effect using the constant thermal condition
for this well. Figure 8-7 shows the calculated cumulative oil and gas generation
from the Dingo Claystone and Athol Formation with the constant heat flow and
surface in this well.

Chapter 8 Thermal Maturity within the Overpressured Jurassic Rocks
134
Chapter 8 Thermal Maturity within the Overpressured Jurassic Rocks
135
Additionally, a good-fit between the valid maturity data (Tmax data and Ro values)
and the calculated maturity curve was also obtained from a rift heat flow model (Fig.
8-8). Figure 8-9 shows the modelled histories of burial, temperature and thermal
maturity. Figure 8-10A indicates the rifting heat flow model used in this modelling,
which has a maximum heat flow of about 67 mW/m2 during the syn-rift phase and
varying seabed temperature (or surface temperature). Figures 8-10B and 8-10C
indicate the cumulative oil and gas generation from the Dingo Claystone and Athol
Formation using the rift heat flow history for this well. It should be noted that the
modelled results indicate the difference of the histories of temperature, maturity and
hydrocarbon generation using different thermal models (Figures 8-6, 8-7, 8-9 and 8-
10).
8.4.3 Bambra-2 thermal modelling
Good quality Tmax data (acceptable and normal Tmax data in Table 4-1 and Fig. 8-2)
from conventional core and SWC samples were used for thermal maturity modelling
in this well. Figure 8-11 shows the correlation between the modelled maturity curve
and the observed Ro and Tmax data in this well. The current heat flow of 56 mW/m2
was estimated from the formation temperatures (Horner-plot-corrected BHTs) and
seafloor temperature (24 Co). The model produces the predicted temperature line
and the maturity curve approximately fits to both the measured formation
temperatures and Tmax data. The measured vitrinite reflectance values, all from side-
wall cores, are much lower than the modelled maturity pattern and Tmax data trend.
This suggests that the observed Ro data are anomalously low and probably
suppressed in agreement with Kaiko and Tingate (1996). It is possible that the true
maturity trend in the Jurassic rocks may be better indicated by the Tmax values from
core samples.
These are corroborated by measurements of vitrinite reflectance on a Bambra-2
conventional core at 4274-4283 m, which range between about 1.2 % and 2.0 % Ro
(measured by Dr L.W. Gurba at the University of New South Wales, Australia). Six
Tmax values of 484-490 oC (Table 4-1), measured from the conventional core and
extracted SWC samples at 4225-4301 m, correspond to Ro values of about 1.5-1.8 %
(Tissot and Welte, 1994). The modelled Ro at 4280 m in Bambra-2 is 1.6-1.8 %. The
Chapter 8 Thermal Maturity within the Overpressured Jurassic Rocks
136
n-alkane distributions, from GC analyses on saturated hydrocarbon fractions of the
conventional core extracts (A and B; Fig. 4-1), represent a high mature organic
matter and suggest that this source rock is within a wet gas and condensate
generating stage, which fits well with the Tmax values from the conventional core.
Therefore, the predicted Ro values of about 1.7 % could be the true maturity level
for the conventional core.
In conjunction with the reliable pyrolysis data, biomarker maturity, n-alkane
distributions and kinetic modelling of thermal maturity, the Tmax values are believed
to represent the true trend of thermal maturity in this well. This strongly suggests
that the anomalously low vitrinite reflectance need not necessarily be a function of
overpressure in the Jurassic shaley sequence.
Hunt (1996) pointed out that high geothermal gradients in overpressured shales are
attributed to the low thermal conductivity of such shales that seem to act as heat
insulators causing temperature increase, and this can enhance hydrocarbon
generation. High porosity in the undercompacted zone yields a lower bulk thermal
conductivity, and this increases the geothermal gradient. Sensitive analysis for low
thermal conductivity in the overpressured Jurassic shaley sequence was carried out
in this modelling, but it should be noted that this parameter does not influence the
conclusions of this paper.
Figures 8-12 and 8-13 show the calculated geohistory, temperature and maturity
histories, and the cumulative hydrocarbon generation from the Dingo Claystone and
Athol Formation obtained using the constant heat flow and seafloor temperature.
In addition, the good Tmax values from Bambra-2 can be also matched by the rift-
related heat flow history (Fig. 8-14). Figure 8-15 displays the calculated geohistory,
histories of temperature and maturity. Figure 8-16A shows the rifting heat flow
history which exhibits the rift heat flow increase during 190-136 Ma with the
maximum value of 68 mW/m2 at 136 Ma and exponentially decreases in the post-rift
phase. Figures 8-16B and 8-16C show the cumulative hydrocarbon generation from
the Dingo Claystone and Athol Formation obtained from the rifting heat-flow
Chapter 8 Thermal Maturity within the Overpressured Jurassic Rocks
137
models. The histories of thermal effect and hydrocarbon generation obtained from
the two heat flow models (constant and rift) are different.
8.5 Discussion
Some controversy surrounds the retardation of hydrocarbon generation in
overpressured zones. Cecil et al. (1977) and Carr (1999) considered that
overpressure can retard thermal maturity and hydrocarbon generation because the
generated light component is unable to escape, or there is insufficient space for the
generated hydrocarbons in the overpressured system. Cecil et al. (1977) pointed out
that the overpressured zone behaves as a closed thermodynamic system, thus the
expulsion of light hydrocarbons is retarded and organic metamorphism is inhibited.
Hao et al. (1995) and Osborne and Swarbrick (1997) considered that hydrocarbon
generation, and cracking to gas, may be self-limiting in a sealed system because
pressure buildup may retard further organic metamorphism. In contrast, Hunt (1990)
proposed that the generation and migration of oil and gas in sealed overpressured
systems, plus thermal expansion of pore fluids causes fracturing of pressure seals
during periods of basin sinking, and are associated with the episodic process of seal
breakout and resealing cycles. In an overpressured system, fluid flow is limited, but
not totally restricted by low-permeability rocks (e.g. Bredehoeft et al., 1994).
Overpressures caused by hydrocarbon generation can form microfractures, which
can act as migration pathways, based on geological observation of the petroleum
expulsion phenomena (e.g. Düppenbecker et al., 1991; Márquez and Mountjoy,
1996). Many authors also attribute overpressure development in sedimentary basins
to petroleum generation, and fluid-volume expansion during oil and gas generation
and thermal cracking of crude oil to gas within a sealed compartment (e.g. Spencer,
1987; Hunt, 1990; Düppenbecker et al., 1991; Bredehoeft et al., 1994; Luo and
Vasseur, 1996; Márquez and Mountjoy, 1996; Swarbrick and Osborne, 1998).
The observation of thin-sections of the claystone from the conventional core at
4274-4283 m in Bambra-2 indicates that the Jurassic source rocks contain bitumen.
Teerman (1994) presented data indicating less than 5 % to 5 % bitumen in the
organic matter of the Upper Jurassic samples, based on the study of visual
compositions of kerogen. Perhaps lower than expected vitrinite reflectance is related
Chapter 8 Thermal Maturity within the Overpressured Jurassic Rocks
138
to solid bitumen to some extent, as suggested by Lo (1992). Similarly, anomalously
low Tmax values may also be influenced by an increase in heavy bitumen content in
overpressured source rocks because these generated heavy hydrocarbons are not
expelled efficiently. Vandenbroucke et al. (1983) showed that the Tmax values
measured on kerogen in the high pressure zone of the Handil field, Mahakam Delta,
Indonesia, are significantly lower than the values measured on the coal samples
because the organic matter contains abundant pyrobitumens. This process involves
the migration of lighter hydrocarbons leaving behind heavy oil that, being unable to
be expelled, is cracked to gas and pyrobitumens owing to thermal effects in the
overpressured compartments (Hunt, 1990). Clememtz (1979) and Kruge (1983)
pointed out that solid bitumen and heavy bitumen can affect the S2 peak resulting in
abnormal Tmax values, but that these problems could be overcome by solvent
extraction prior to pyrolysis, and the subsequent evaluation of S2 after solvent
extraction. Hunt (1996) stated that asphaltites, pyrobitumens and some resinites are
not soluble in conventional organic solvents and that microscopic studies can assist
in recognizing insoluble bitumen interference. The valid Rock-Eval Tmax data used
in this study have been carefully analyzed and examined (see Chapter 4).
As described in Chapter 4, the anomalously low vitrinite reflectance values in some
samples of the Bambra-2 well appear to be also related to the difficulty of
distinguishing vitrinite and inertinite macerals due to the very small size of the
organic particles and quite high maturity (Dr. Lila W. Gurba, personal
communication). Table 8-7 contains the examples that show this problem probably
results in an inaccurate identification of vitrinite and inertinite in the two samples in
Bambra-2. Thus, the inertinite reflectance range in Table 8-7 should be the range of
vitrinite reflectance and inertinite reflectance.
In combination with the accumulation of hydrocarbons, oil-source geochemical
correlations in the sub-basin (Volkman, et al., 1983) and the studies of thermal
maturity, thermal modelling and modelled hydrocarbon generation (Figures 8-3 to 8-
16), the occurrence of overpressure in the two studied cases suggests the existence
of a dynamic overpressured sealed compartment in the Jurassic source section,
where hydrocarbon generation, especially gas generation, is likely to be the
significant mechanism for generating overpressure. In summary, for the Barrow
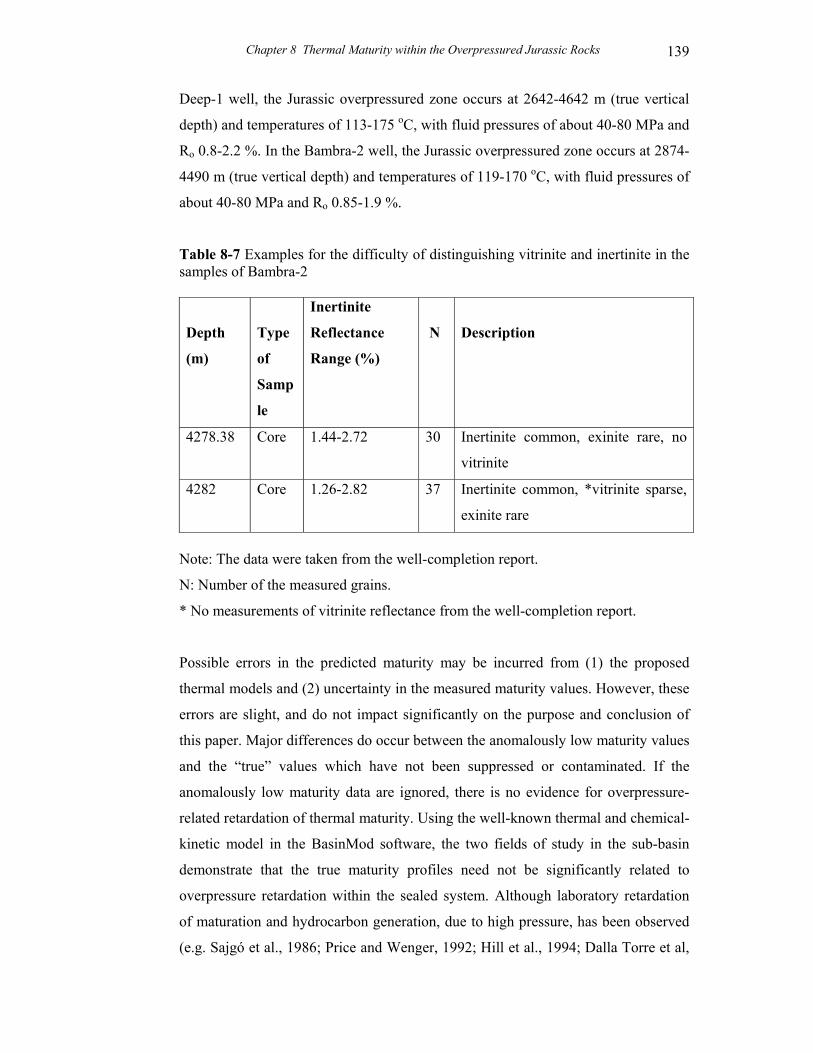
Chapter 8 Thermal Maturity within the Overpressured Jurassic Rocks
139
Deep-1 well, the Jurassic overpressured zone occurs at 2642-4642 m (true vertical
depth) and temperatures of 113-175 oC, with fluid pressures of about 40-80 MPa and
Ro 0.8-2.2 %. In the Bambra-2 well, the Jurassic overpressured zone occurs at 2874-
4490 m (true vertical depth) and temperatures of 119-170 oC, with fluid pressures of
about 40-80 MPa and Ro 0.85-1.9 %.
Table 8-7 Examples for the difficulty of distinguishing vitrinite and inertinite in the samples of Bambra-2
Depth
(m)
Type
of
Samp
le
Inertinite
Reflectance
Range (%)
N
Description
4278.38 Core 1.44-2.72 30 Inertinite common, exinite rare, no
vitrinite
4282 Core 1.26-2.82 37 Inertinite common, *vitrinite sparse,
exinite rare
Note: The data were taken from the well-completion report.
N: Number of the measured grains.
* No measurements of vitrinite reflectance from the well-completion report.
Possible errors in the predicted maturity may be incurred from (1) the proposed
thermal models and (2) uncertainty in the measured maturity values. However, these
errors are slight, and do not impact significantly on the purpose and conclusion of
this paper. Major differences do occur between the anomalously low maturity values
and the “true” values which have not been suppressed or contaminated. If the
anomalously low maturity data are ignored, there is no evidence for overpressure-
related retardation of thermal maturity. Using the well-known thermal and chemical-
kinetic model in the BasinMod software, the two fields of study in the sub-basin
demonstrate that the true maturity profiles need not be significantly related to
overpressure retardation within the sealed system. Although laboratory retardation
of maturation and hydrocarbon generation, due to high pressure, has been observed
(e.g. Sajgó et al., 1986; Price and Wenger, 1992; Hill et al., 1994; Dalla Torre et al,
Chapter 8 Thermal Maturity within the Overpressured Jurassic Rocks
140
1997), the overpressure effect on thermal maturity is negligible within the studied
cases in the Barrow Sub-basin, North West Shelf of Australia. Although the datasets
in this study are limited, these results indicate that overpressure retardation is not a
global phenomenon, at least. To determine the true origins of geology and
geochemistry for abnormal maturity profiles in geologically overpressured
conditions, it is recommended that more field studies be carried out.
8.6 Summary
In the wells examined, the anomalously low Tmax and Ro values do not appear to be
significantly related to overpressure effects. The anomalous Tmax values are mainly
caused by contamination by drilling-mud additives. This study supports previous
studies that the two major causes of abnormal Ro values are (1) the suppression of
vitrinite reflectance through marine influence, and (2) misidentification of vitrinite
macerals.
Thermal maturity described by the biomarker parameters and n-alkane distributions
from GC-MS and GC analyses of the saturate fractions suggest that the organic
matter in the Jurassic overpressured source rocks is not associated with a maturation
anomaly. Thermal maturity modelling indicates that the temperature-time-related
kinetic model can provide a match between good maturity data (Ro, Tmax and Eq
VR) and the calculated maturity curves in the Jurassic highly overpressured system.
This study indicates that the true thermal maturity (Ro 0.8-2.2 %) of the observed
Jurassic source rocks is not detectably influenced by the observed overpressure
(fluid pressure about 40-80 MPa at 3000-4600 m). In conclusion, these field cases
indicate that the overpressure is, therefore, an unimportant factor in the thermal
maturity and hydrocarbon generation in this area.
In addition, both the current heat flow history (steady state) and the rift heat-flow
model (no-steady state) can provide a match between the valid maturity data and the
predicted maturity curves at present, but the thermal effect histories are clearly
different.
Chapter 9 Two-dimensional Models and Data
149
______________________________
Part IV
Two-dimensional Models, Deep Overpressure Modelling and Pressure Behaviour Modelling ______________________________
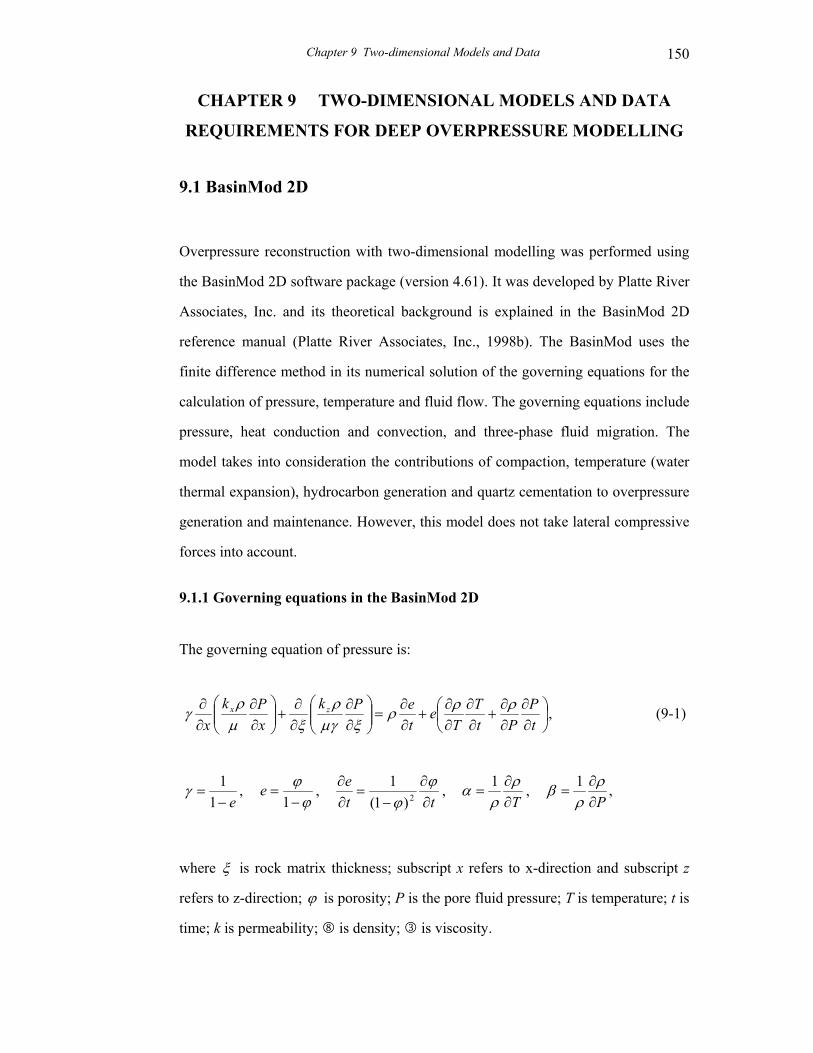
Chapter 9 Two-dimensional Models and Data
150
CHAPTER 9 TWO-DIMENSIONAL MODELS AND DATA
REQUIREMENTS FOR DEEP OVERPRESSURE MODELLING
9.1 BasinMod 2D
Overpressure reconstruction with two-dimensional modelling was performed using
the BasinMod 2D software package (version 4.61). It was developed by Platte River
Associates, Inc. and its theoretical background is explained in the BasinMod 2D
reference manual (Platte River Associates, Inc., 1998b). The BasinMod uses the
finite difference method in its numerical solution of the governing equations for the
calculation of pressure, temperature and fluid flow. The governing equations include
pressure, heat conduction and convection, and three-phase fluid migration. The
model takes into consideration the contributions of compaction, temperature (water
thermal expansion), hydrocarbon generation and quartz cementation to overpressure
generation and maintenance. However, this model does not take lateral compressive
forces into account.
9.1.1 Governing equations in the BasinMod 2D
The governing equation of pressure is:
,
∂∂
∂∂
+∂∂
∂∂
+∂∂
=
∂∂
∂∂
+
∂∂
∂∂
tP
PtT
Te
tePk
xPk
xzx ρρρ
ξµγρ
ξµρ
γ (9-1)
e−
=1
1γ , ϕ
ϕ−
=1
e , tt
e∂∂
−=
∂∂ ϕ
ϕ 2)1(1 ,
T∂∂
=ρ
ρα 1 , ,1
P∂∂
=ρ
ρβ
where ξ is rock matrix thickness; subscript x refers to x-direction and subscript z
refers to z-direction; ϕ is porosity; P is the pore fluid pressure; T is temperature; t is
time; k is permeability; 8 is density; 3 is viscosity.
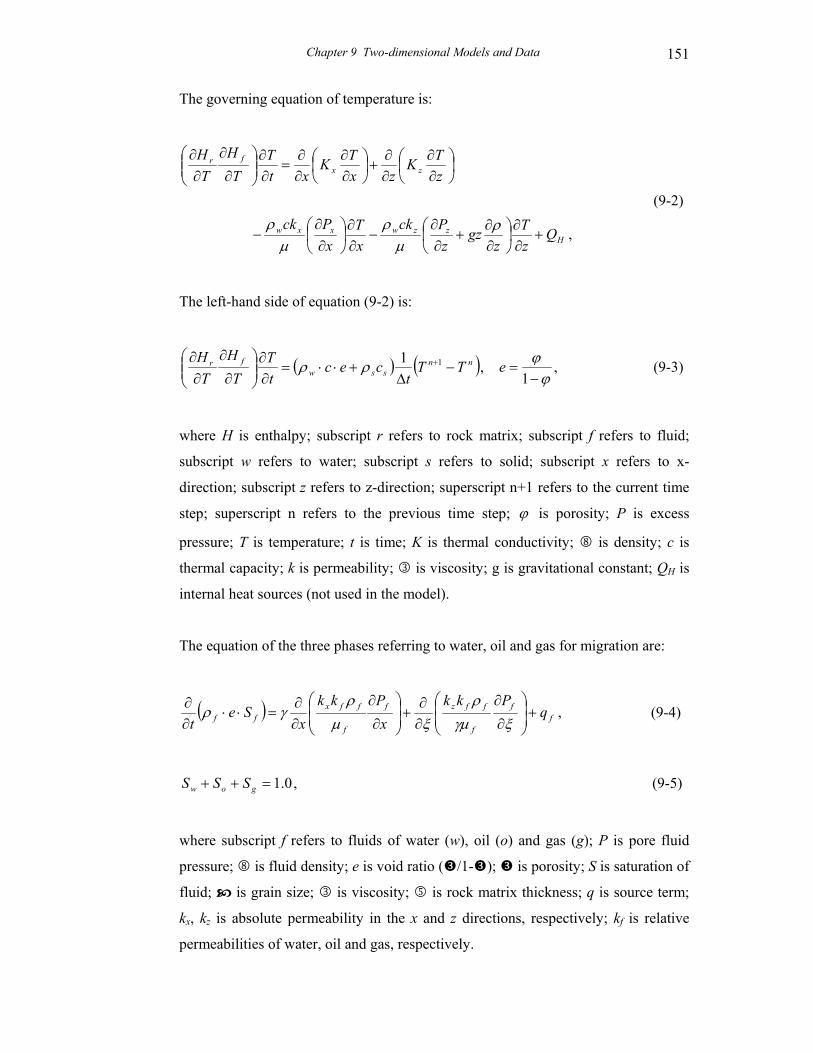
Chapter 9 Two-dimensional Models and Data
151
The governing equation of temperature is:
,Hzzwxxw
zxfr
QzT
zgz
zPck
xT
xPck
zTK
zxTK
xtT
TH
TH
+∂∂
∂∂
+∂∂
−∂∂
∂∂
−
∂∂
∂∂
+
∂∂
∂∂
=∂∂
∂
∂
∂∂
ρµ
ρµ
ρ (9-2)
The left-hand side of equation (9-2) is:
( ) ( ),1 1 nnssw
fr TTt
cectT
TH
TH
−∆
+⋅⋅=∂∂
∂
∂
∂∂ +ρρ ,
1 ϕϕ−
=e (9-3)
where H is enthalpy; subscript r refers to rock matrix; subscript f refers to fluid;
subscript w refers to water; subscript s refers to solid; subscript x refers to x-
direction; subscript z refers to z-direction; superscript n+1 refers to the current time
step; superscript n refers to the previous time step; ϕ is porosity; P is excess
pressure; T is temperature; t is time; K is thermal conductivity; 8 is density; c is
thermal capacity; k is permeability; 3 is viscosity; g is gravitational constant; QH is
internal heat sources (not used in the model).
The equation of the three phases referring to water, oil and gas for migration are:
( ) ,ff
f
ffzf
f
ffxff q
Pkkx
Pkkx
Set
+
∂
∂
∂∂
+
∂
∂
∂∂
=⋅⋅∂∂
ξγµρ
ξµρ
γρ (9-4)
,0.1=++ gow SSS (9-5)
where subscript f refers to fluids of water (w), oil (o) and gas (g); P is pore fluid
pressure; 8 is fluid density; e is void ratio ( /1- ); is porosity; S is saturation of
fluid; is grain size; 3 is viscosity; 5 is rock matrix thickness; q is source term;
kx, kz is absolute permeability in the x and z directions, respectively; kf is relative
permeabilities of water, oil and gas, respectively.
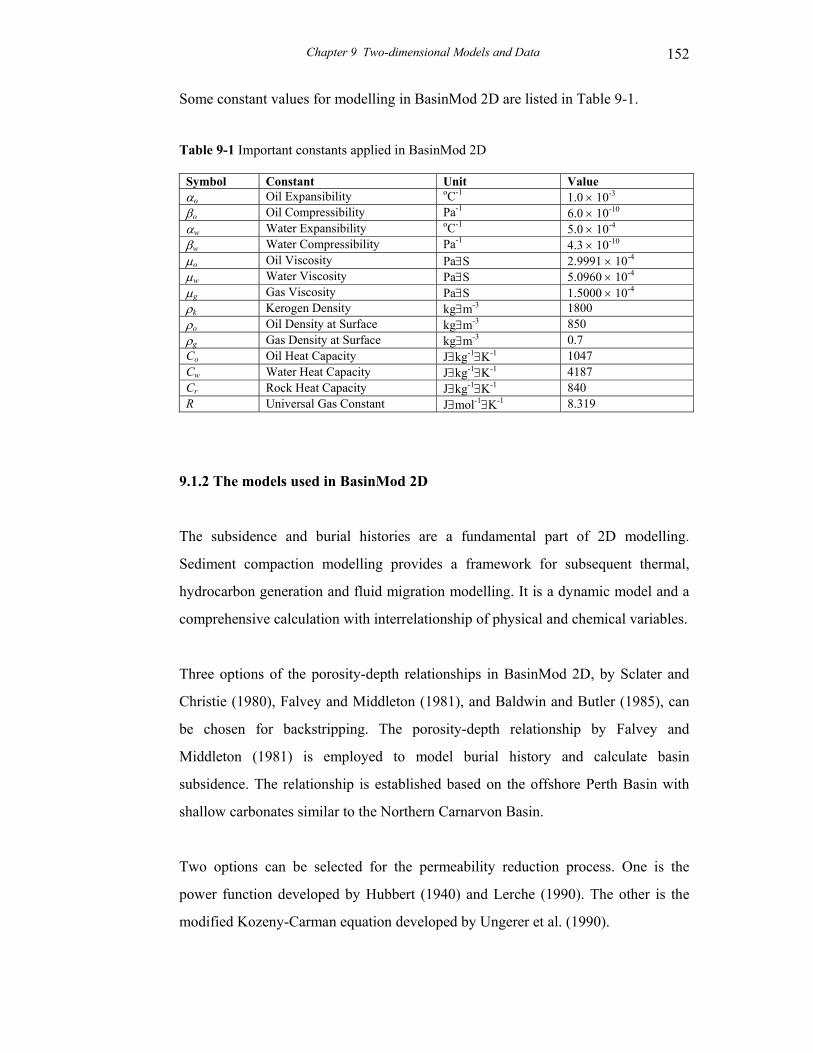
Chapter 9 Two-dimensional Models and Data
152
Some constant values for modelling in BasinMod 2D are listed in Table 9-1.
Table 9-1 Important constants applied in BasinMod 2D
Symbol Constant Unit Value αo Oil Expansibility oC-1 1.0 × 10⁻³ βo Oil Compressibility Pa-1 6.0 × 10⁻¹⁰ αw Water Expansibility oC-1 5.0 × 10⁻⁴ βw Water Compressibility Pa-1 4.3 × 10⁻¹⁰ µo Oil Viscosity Pa∃S 2.9991 × 10⁻⁴ µw Water Viscosity Pa∃S 5.0960 × 10⁻⁴ µg Gas Viscosity Pa∃S 1.5000 × 10⁻⁴ ρk Kerogen Density kg∃m-3 1800 ρo Oil Density at Surface kg∃m-3 850 ρg Gas Density at Surface kg∃m-3 0.7 Co Oil Heat Capacity J∃kg-1∃K-1 1047 Cw Water Heat Capacity J∃kg-1∃K-1 4187 Cr Rock Heat Capacity J∃kg-1∃K-1 840 R Universal Gas Constant J∃mol-1∃K-1 8.319
9.1.2 The models used in BasinMod 2D
The subsidence and burial histories are a fundamental part of 2D modelling.
Sediment compaction modelling provides a framework for subsequent thermal,
hydrocarbon generation and fluid migration modelling. It is a dynamic model and a
comprehensive calculation with interrelationship of physical and chemical variables.
Three options of the porosity-depth relationships in BasinMod 2D, by Sclater and
Christie (1980), Falvey and Middleton (1981), and Baldwin and Butler (1985), can
be chosen for backstripping. The porosity-depth relationship by Falvey and
Middleton (1981) is employed to model burial history and calculate basin
subsidence. The relationship is established based on the offshore Perth Basin with
shallow carbonates similar to the Northern Carnarvon Basin.
Two options can be selected for the permeability reduction process. One is the
power function developed by Hubbert (1940) and Lerche (1990). The other is the
modified Kozeny-Carman equation developed by Ungerer et al. (1990).
Chapter 9 Two-dimensional Models and Data
153
These kinetic models for hydrocarbon generation modelling in BasinMod 2D are
described through multiple parallel reactions governed by first-order kinetics and the
Arrhenius law (Tissot et al., 1987; Espitalié et al., 1988; Burnham, 1989). The
kinetic model used in this study for hydrocarbon generation modelling is the well-
accepted model by Burnham (1989). The chemical kinetic model of Sweeney and
Burnham (1990) was used to calculate vitrinite maturation.
The volumetric changes during the degradation of solid kerogen into oil, gas and
residue may cause an increase in pore pressure. The pressure increment due to
generation pressures contributed by the generated oil and gas can be calculated
based on the equations of Lerche (1990) in this model. Thus, the pore pressure
regime related to hydrocarbon generation can be investigated.
Two options of oil and gas expulsion models can be selected for hydrocarbon
primary migration. One is the saturation expulsion model (Mackenzie and Quigley,
1988; Cooles et al., 1986). The other is the pressure-controlled expulsion model
(Düppenbecker et al., 1991). Three phases refer to oil, gas and water.
Porosity loss due to quartz cementation during burial can be calculated in BasinMod
2D software using the kinetic model of Walderhaug (1996). This function was used
to model the porosity loss in the top pressure-sealing zone in the Barrow Sub-basin.
The models and parameters used in BasinMod 2D, such as porosity-depth
relationship, lithologic properties, kinetic parameters of hydrocarbon generation,
compaction equations, models for temperature calculation, expulsion, fault,
migration and algorithms for calibration parameters, can be selected or modified by
users. The petroleum geological processes modelled by BasinMod 2D are dynamic
and interactive in chronological order. Subsidence, burial, compaction, temperature,
pore pressure evolution, multiple-phase fluid flow, organic-matter maturity,
hydrocarbon generation, expulsion and migration can be calculated by the model.
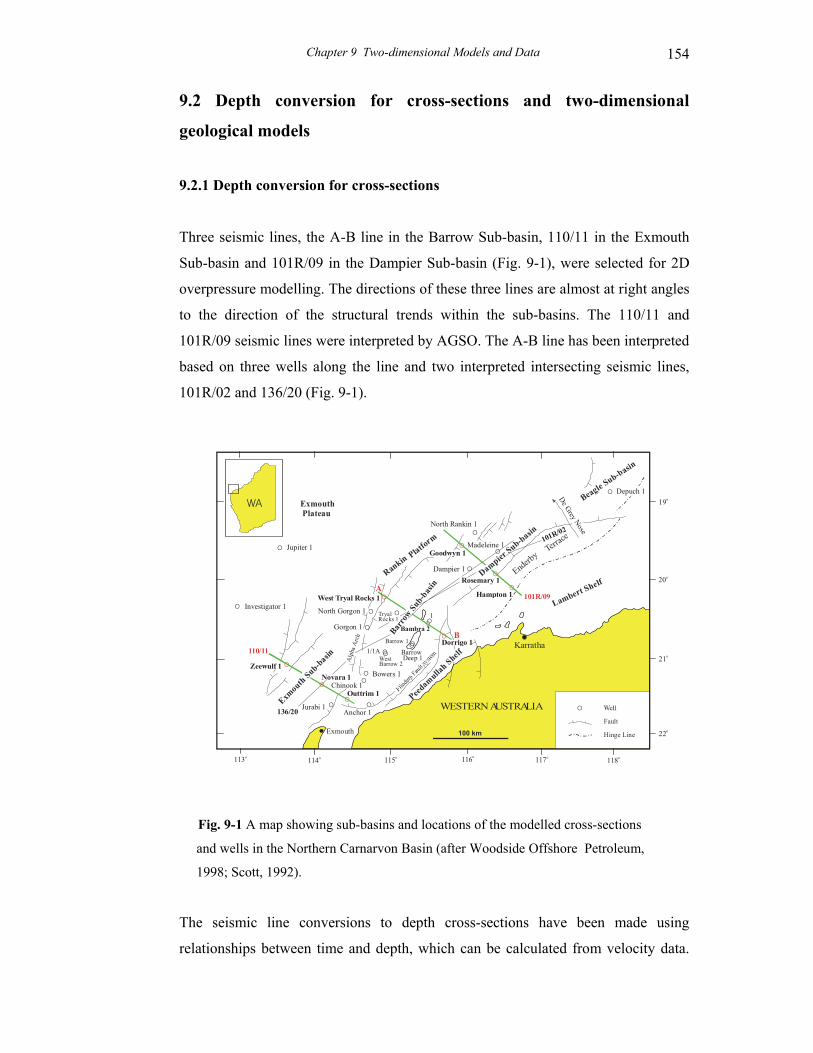
Chapter 9 Two-dimensional Models and Data
154
9.2 Depth conversion for cross-sections and two-dimensional
geological models
9.2.1 Depth conversion for cross-sections
Three seismic lines, the A-B line in the Barrow Sub-basin, 110/11 in the Exmouth
Sub-basin and 101R/09 in the Dampier Sub-basin (Fig. 9-1), were selected for 2D
overpressure modelling. The directions of these three lines are almost at right angles
to the direction of the structural trends within the sub-basins. The 110/11 and
101R/09 seismic lines were interpreted by AGSO. The A-B line has been interpreted
based on three wells along the line and two interpreted intersecting seismic lines,
101R/02 and 136/20 (Fig. 9-1).
Fig. 9-1 A map showing sub-basins and locations of the modelled cross-sections
and wells in the Northern Carnarvon Basin (after Woodside Offshore Petroleum,
1998; Scott, 1992).
The seismic line conversions to depth cross-sections have been made using
relationships between time and depth, which can be calculated from velocity data.
O
OO
O
O
O
O
Rankin Platform
Beagle Sub-basin
Enderby
Terrace
Lambert Shelf
WESTERN AUSTRALIA
100 km
Karratha
ExmouthFault
Hinge Line
Bambra 2
North Rankin 1
117o113o
22o
20o
Exmouth Plateau
Jupiter 1
Investigator 1
Depuch 1
Madeleine 1
North Gorgon 1
Jurabi 1
115o
21o
19o
118o116o114o
OBarrowDeep 1
Bowers 1
Anchor 1
Peedamulla
h Shelf
De Grey Nose
WA
O
ODampier 1
OGorgon 1
OChinook 1
O
O
OWest Tryal Rocks 1A
B
O
OO
O
O
West Barrow 2
1
1/1ABarrow 1
O
O
O
O
O
O
O
Outtrim 1
Zeewulf 1
O
Dorrigo 1
Hampton 1
Goodwyn 1
101R/09
110/11
Novara 1
Exmouth Sub-basin A
lpha
Arc
h
TryalRocks 1
Barro
w Sub-
basin Rosemary 1
Dampier Sub-basin
101R/02
136/20
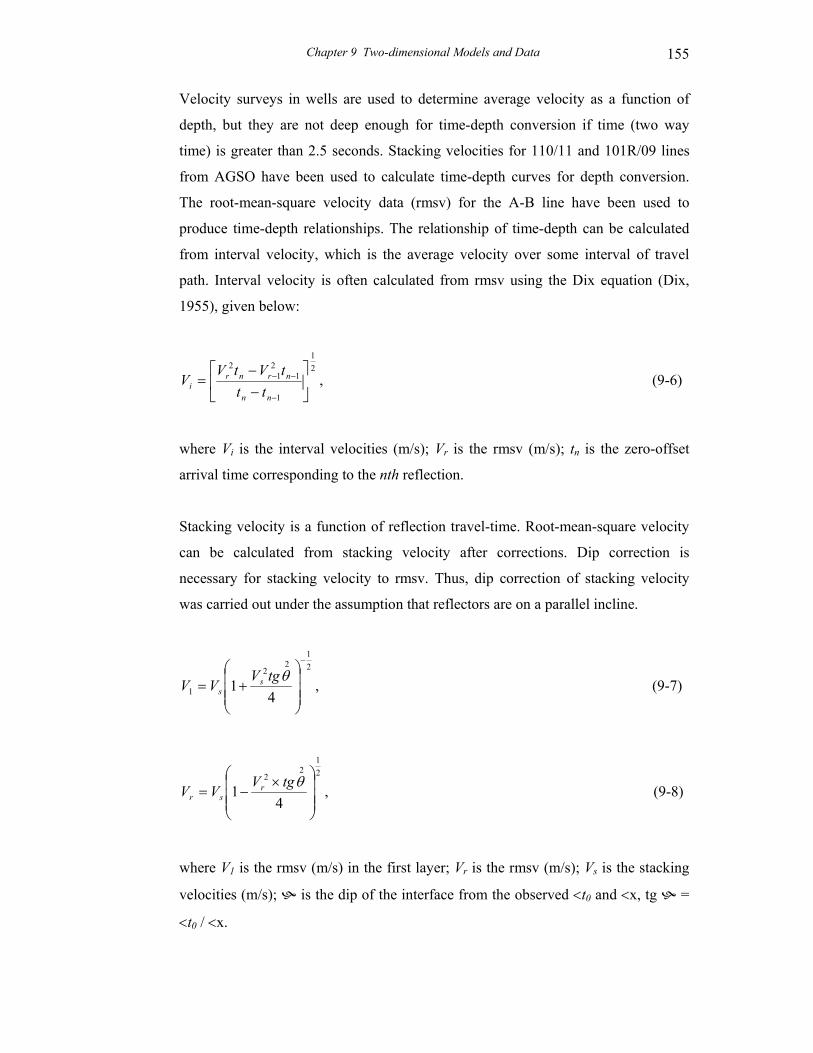
Chapter 9 Two-dimensional Models and Data
155
Velocity surveys in wells are used to determine average velocity as a function of
depth, but they are not deep enough for time-depth conversion if time (two way
time) is greater than 2.5 seconds. Stacking velocities for 110/11 and 101R/09 lines
from AGSO have been used to calculate time-depth curves for depth conversion.
The root-mean-square velocity data (rmsv) for the A-B line have been used to
produce time-depth relationships. The relationship of time-depth can be calculated
from interval velocity, which is the average velocity over some interval of travel
path. Interval velocity is often calculated from rmsv using the Dix equation (Dix,
1955), given below:
,21
1
12
12
−−
=−
−−
nn
nrnri tt
tVtVV (9-6)
where Vi is the interval velocities (m/s); Vr is the rmsv (m/s); tn is the zero-offset
arrival time corresponding to the nth reflection.
Stacking velocity is a function of reflection travel-time. Root-mean-square velocity
can be calculated from stacking velocity after corrections. Dip correction is
necessary for stacking velocity to rmsv. Thus, dip correction of stacking velocity
was carried out under the assumption that reflectors are on a parallel incline.
,4
121
22
1
−
+=
θtgVVV s
s (9-7)
,4
121
22
×−=
θtgVVV r
sr (9-8)
where V1 is the rmsv (m/s) in the first layer; Vr is the rmsv (m/s); Vs is the stacking
velocities (m/s); is the dip of the interface from the observed <t0 and <x, tg =
<t0 / <x.
Chapter 9 Two-dimensional Models and Data
156
The time-depth curves were calculated from rmsv using the Dix equation and a
spline interpolation method with an interpolated interval of 0.05 s as shown in
Figures 9-2 to 9-4. It can be seen that the seismic-velocity-derived time-depth
relationships correlated well with those from velocity surveys in nearby wells along
the three seismic lines. The errors of the converted depth using seismic velocity data
are less than 5 % in shallow parts compared with the well data. Thus, seismic
velocity data have been used for the time-depth conversion for these seismic lines.
However, more errors may occur in the time-depth conversion of deep parts using
the seismic-derived time-depth relationships.
9.2.2 Two-dimensional geological models
In the Barrow Sub-basin, the stratigraphy of the A-B depth-converted cross-section
is divided into 8 events and lithology units (Fig. 9-5). Along the A-B cross-section,
three wells, West Tryal Rocks-1, Bambra-2 and Dorrigo-1, have been selected to
provide geological data. The well data from Tryal Rocks-1 has been also referred to
in building the 2D geological model. In the Exmouth Sub-basin, the interpreted
110/11 seismic line is shown in Appendix 2. The stratigraphy of the 110/11 depth-
converted cross-section is divided into 11 events and different lithology mixes (Fig.
9-6). The geological data from three wells, Zeewulf-1, Novara-1 and Outtrim-1
along the 110/11 cross-section have been used to set up the 2D geological model. In
the Dampier Sub-basin, the interpreted 101R/09 seismic line is shown in Appendix
3. The stratigraphy of the 101R/09 depth-converted cross-section is also divided into
11 events and lithology units (Fig. 9-7). Along the 101R/09 cross-section, the
geological data were derived from three wells, Goodwyn-7, Rosemary-1 and
Hampton-1 for the 2D geological model.
The fault distribution and the geometry of these depth cross-sections were
interpreted from seismic data and information from wells. In fact, many geological
events are too complex to model quantitatively. In order to construct models, they
must not only be acceptable geologically, but also be suitable for numerical
procedures. Simplification of the model is necessary but over-simplification of
seismic and geological information needs to be avoided. Many simplifications in

Chapter 9 Two-dimensional Models and Data
157

Chapter 9 Two-dimensional Models and Data
158
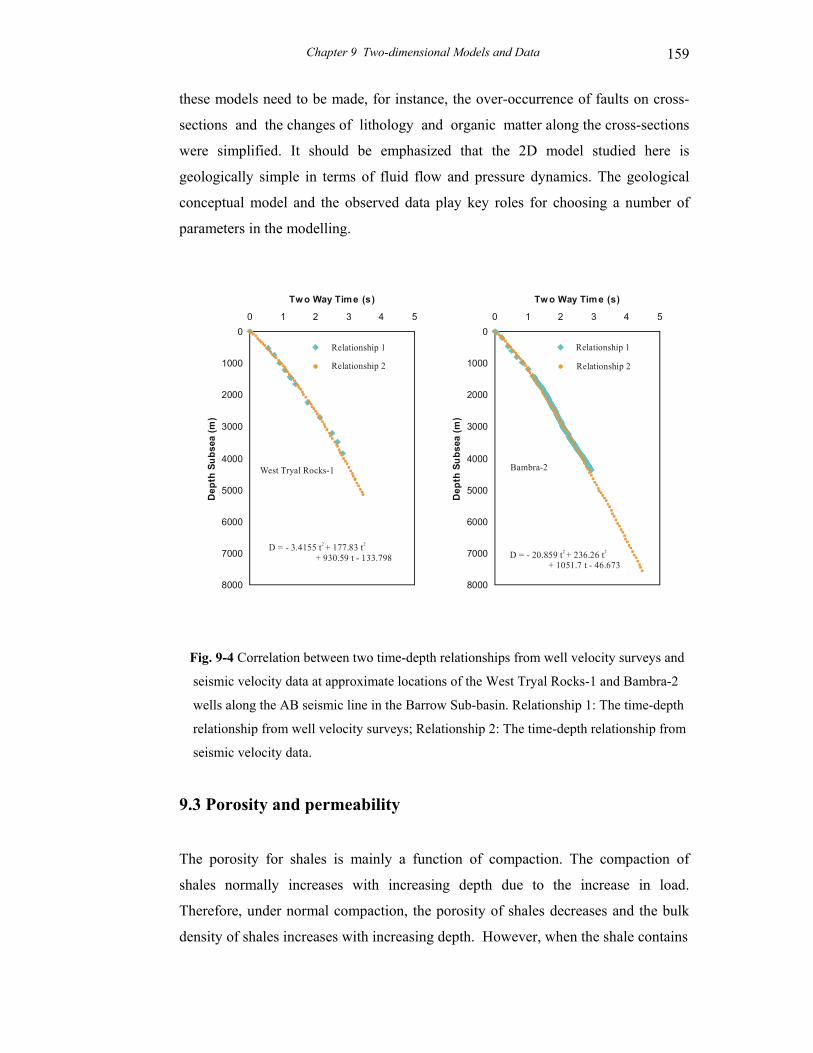
Chapter 9 Two-dimensional Models and Data
159
these models need to be made, for instance, the over-occurrence of faults on cross-
sections and the changes of lithology and organic matter along the cross-sections
were simplified. It should be emphasized that the 2D model studied here is
geologically simple in terms of fluid flow and pressure dynamics. The geological
conceptual model and the observed data play key roles for choosing a number of
parameters in the modelling.
Fig. 9-4 Correlation between two time-depth relationships from well velocity surveys and
seismic velocity data at approximate locations of the West Tryal Rocks-1 and Bambra-2
wells along the AB seismic line in the Barrow Sub-basin. Relationship 1: The time-depth
relationship from well velocity surveys; Relationship 2: The time-depth relationship from
seismic velocity data.
9.3 Porosity and permeability
The porosity for shales is mainly a function of compaction. The compaction of
shales normally increases with increasing depth due to the increase in load.
Therefore, under normal compaction, the porosity of shales decreases and the bulk
density of shales increases with increasing depth. However, when the shale contains
0
1000
2000
3000
4000
5000
6000
7000
8000
0 1 2 3 4 5
Tw o Way Time (s)
Dep
thSu
bsea
(m)
0
1000
2000
3000
4000
5000
6000
7000
8000
0 1 2 3 4 5
Tw o Way Time (s)
Dep
thSu
bsea
(m)
D = - 20.859 t + 236.26 t+ 1051.7 t - 46.673
2 2
Relationship 1
Relationship 2
Relationship 1
Relationship 2
D = - 3.4155 t + 177.83 t+ 930.59 t - 133.798
2 2
West Tryal Rocks-1 Bambra-2

Chapter 9 Two-dimensional Models and Data
160

Chapter 9 Two-dimensional Models and Data
161

Chapter 9 Two-dimensional Models and Data
162
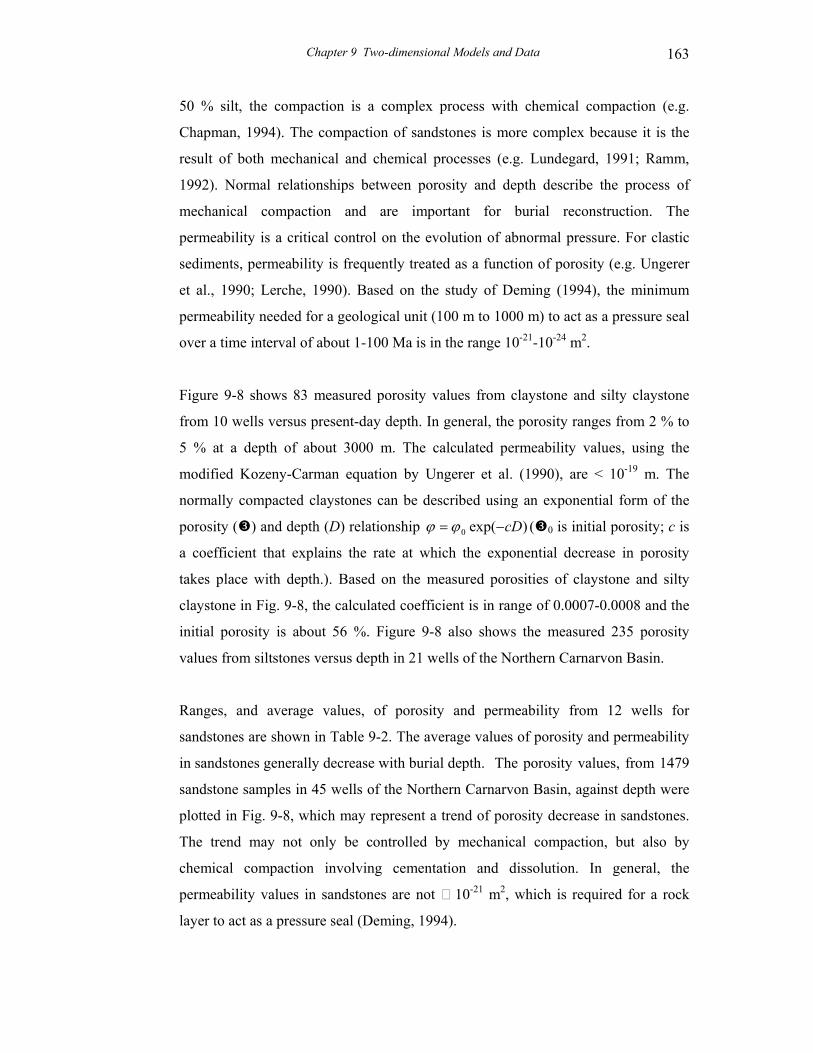
Chapter 9 Two-dimensional Models and Data
163
50 % silt, the compaction is a complex process with chemical compaction (e.g.
Chapman, 1994). The compaction of sandstones is more complex because it is the
result of both mechanical and chemical processes (e.g. Lundegard, 1991; Ramm,
1992). Normal relationships between porosity and depth describe the process of
mechanical compaction and are important for burial reconstruction. The
permeability is a critical control on the evolution of abnormal pressure. For clastic
sediments, permeability is frequently treated as a function of porosity (e.g. Ungerer
et al., 1990; Lerche, 1990). Based on the study of Deming (1994), the minimum
permeability needed for a geological unit (100 m to 1000 m) to act as a pressure seal
over a time interval of about 1-100 Ma is in the range 10-21-10-24 m2.
Figure 9-8 shows 83 measured porosity values from claystone and silty claystone
from 10 wells versus present-day depth. In general, the porosity ranges from 2 % to
5 % at a depth of about 3000 m. The calculated permeability values, using the
modified Kozeny-Carman equation by Ungerer et al. (1990), are < 10-19 m. The
normally compacted claystones can be described using an exponential form of the
porosity ( ) and depth (D) relationship )exp(0 cD−= ϕϕ ( 0 is initial porosity; c is
a coefficient that explains the rate at which the exponential decrease in porosity
takes place with depth.). Based on the measured porosities of claystone and silty
claystone in Fig. 9-8, the calculated coefficient is in range of 0.0007-0.0008 and the
initial porosity is about 56 %. Figure 9-8 also shows the measured 235 porosity
values from siltstones versus depth in 21 wells of the Northern Carnarvon Basin.
Ranges, and average values, of porosity and permeability from 12 wells for
sandstones are shown in Table 9-2. The average values of porosity and permeability
in sandstones generally decrease with burial depth. The porosity values, from 1479
sandstone samples in 45 wells of the Northern Carnarvon Basin, against depth were
plotted in Fig. 9-8, which may represent a trend of porosity decrease in sandstones.
The trend may not only be controlled by mechanical compaction, but also by
chemical compaction involving cementation and dissolution. In general, the
permeability values in sandstones are not 10-21 m2, which is required for a rock
layer to act as a pressure seal (Deming, 1994).

Chapter 9 Two-dimensional Models and Data
164
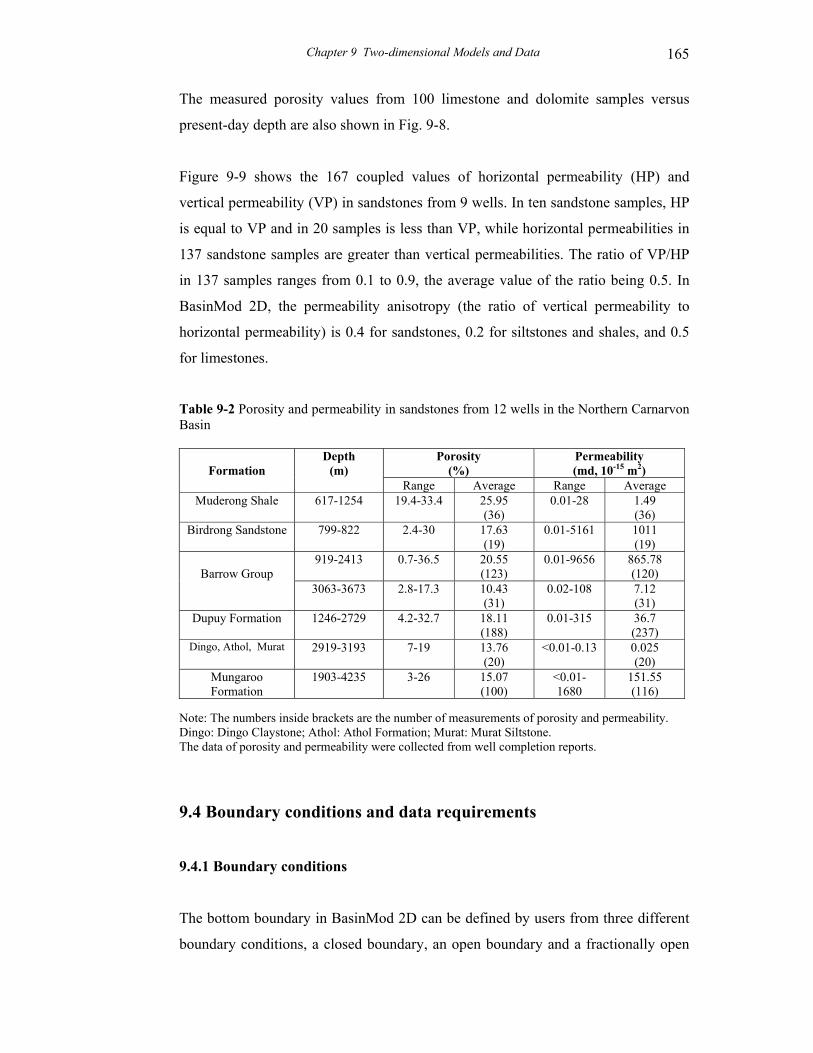
Chapter 9 Two-dimensional Models and Data
165
The measured porosity values from 100 limestone and dolomite samples versus
present-day depth are also shown in Fig. 9-8.
Figure 9-9 shows the 167 coupled values of horizontal permeability (HP) and
vertical permeability (VP) in sandstones from 9 wells. In ten sandstone samples, HP
is equal to VP and in 20 samples is less than VP, while horizontal permeabilities in
137 sandstone samples are greater than vertical permeabilities. The ratio of VP/HP
in 137 samples ranges from 0.1 to 0.9, the average value of the ratio being 0.5. In
BasinMod 2D, the permeability anisotropy (the ratio of vertical permeability to
horizontal permeability) is 0.4 for sandstones, 0.2 for siltstones and shales, and 0.5
for limestones.
Table 9-2 Porosity and permeability in sandstones from 12 wells in the Northern Carnarvon Basin
Porosity (%)
Permeability (md, 10-15 m2)
Formation
Depth (m)
Range Average Range Average Muderong Shale 617-1254 19.4-33.4 25.95
(36) 0.01-28 1.49
(36) Birdrong Sandstone 799-822 2.4-30 17.63
(19) 0.01-5161 1011
(19) 919-2413 0.7-36.5 20.55
(123) 0.01-9656 865.78
(120)
Barrow Group 3063-3673 2.8-17.3 10.43
(31) 0.02-108 7.12
(31) Dupuy Formation 1246-2729 4.2-32.7 18.11
(188) 0.01-315 36.7
(237) Dingo, Athol, Murat 2919-3193 7-19 13.76
(20) <0.01-0.13 0.025
(20) Mungaroo Formation
1903-4235 3-26 15.07 (100)
<0.01-1680
151.55 (116)
Note: The numbers inside brackets are the number of measurements of porosity and permeability. Dingo: Dingo Claystone; Athol: Athol Formation; Murat: Murat Siltstone. The data of porosity and permeability were collected from well completion reports.
9.4 Boundary conditions and data requirements
9.4.1 Boundary conditions
The bottom boundary in BasinMod 2D can be defined by users from three different
boundary conditions, a closed boundary, an open boundary and a fractionally open
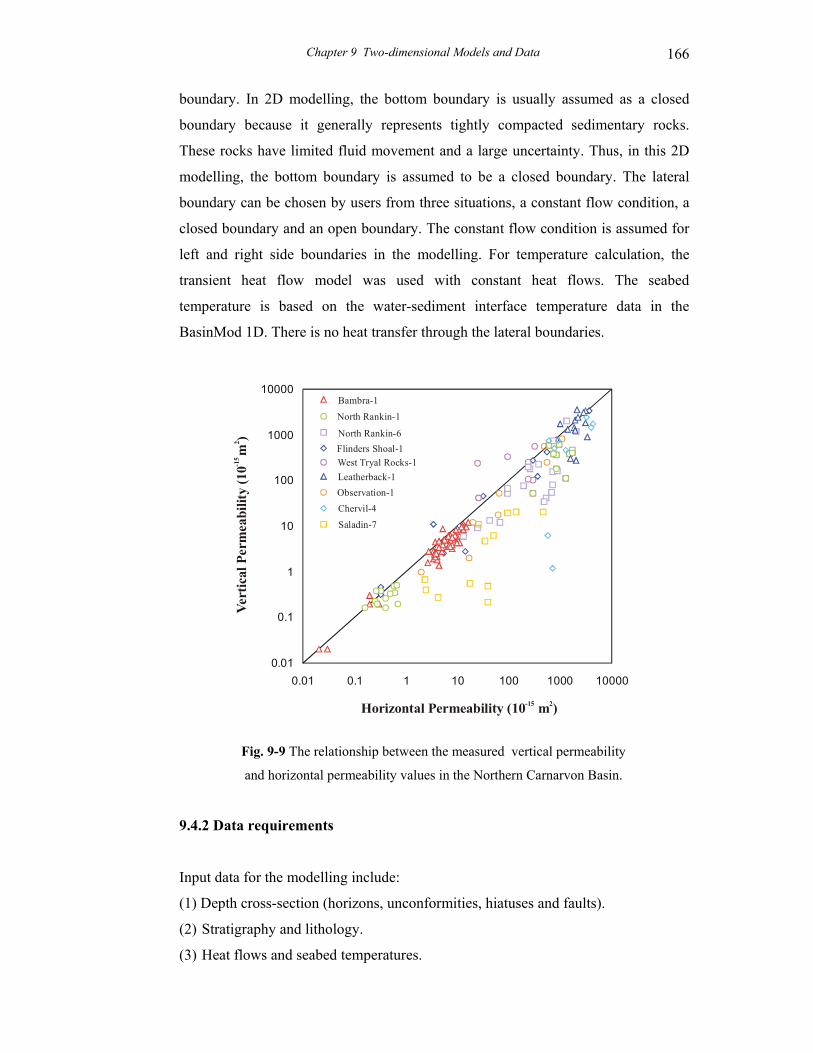
Chapter 9 Two-dimensional Models and Data
166
boundary. In 2D modelling, the bottom boundary is usually assumed as a closed
boundary because it generally represents tightly compacted sedimentary rocks.
These rocks have limited fluid movement and a large uncertainty. Thus, in this 2D
modelling, the bottom boundary is assumed to be a closed boundary. The lateral
boundary can be chosen by users from three situations, a constant flow condition, a
closed boundary and an open boundary. The constant flow condition is assumed for
left and right side boundaries in the modelling. For temperature calculation, the
transient heat flow model was used with constant heat flows. The seabed
temperature is based on the water-sediment interface temperature data in the
BasinMod 1D. There is no heat transfer through the lateral boundaries.
Fig. 9-9 The relationship between the measured vertical permeability
and horizontal permeability values in the Northern Carnarvon Basin.
9.4.2 Data requirements
Input data for the modelling include:
(1) Depth cross-section (horizons, unconformities, hiatuses and faults).
(2) Stratigraphy and lithology.
(3) Heat flows and seabed temperatures.
0.01
0.1
1
10
100
1000
10000
0.01 0.1 1 10 100 1000 10000
Horizontal Permeability (10 m )-15 2
Vert
ical
Per
mea
bilit
y (1
0 m
)-1
52
Bambra-1North Rankin-1
Flinders Shoal-1North Rankin-6
West Tryal Rocks-1Leatherback-1Observation-1Chervil-4Saladin-7
Chapter 9 Two-dimensional Models and Data
167
(4) Kerogen type and total organic carbon (TOC, %).
(5) Palaeo-seawater depths
(6) Erosional thickness.
The measured data from an individual well, including thermal maturity, formation
temperature, fluid pressure, mud weight, porosity and permeability, were used to
correlate with the modelled results at the well points along the cross-section in order
to calibrate and optimize parameters and to produce acceptable calculations.
Two numerical methods of finite difference and finite element are used in the
BasinMod 2D software. The modelling requires the software operator to set time
(∆t), lateral distance (x-distance) (∆x) and vertical-depth distance (∆z) increments.
These increments are increased to allow more rapid computation, or decreased to
obtain greater accuracy (albeit longer computation time). The cell divisions are
based on the size of time step and the number of lateral cells which may affect the
stability and precision of the calculation and resolution of the modelled compaction,
fluid flow, thermal results and excess pressures. More precise results can be
obtained through the use of a smaller time step. The examination, using time steps
of 0.5, 1, and 2 Ma, and distance increments of 0.5 and 1 km, indicates that the time
step of 1 Ma in the Jurassic section and 2 Ma in the other formations is satisfactory,
and the lateral distance interval of 1 km is reasonable for the stability and precision
of the calculated results. For our modelling, ∆t was chosen to be 1Ma and 2 Ma, and
∆x was selected to be 1 km for cell divisions. Vertical distance increments (∆z) were
calculated from time increments and sedimentation rates. These values were also
chosen to permit reasonable computation times on a Pentium-III, 800 MHz personal
computer.
9.4.3 Date sets
The ages of stratigraphic events
The absolute age of a stratigraphic event is based on the stratigraphic table and the
palaeontological analysis in the wells along the two-dimensional models. Both
Chapter 9 Two-dimensional Models and Data
168
isochronous and time-transgressive events concerning horizons and unconformities
were handled in the BasinMod 2D. The geological time scale is referenced to the
publications of Labutis (1994) and Polomka et al. (1999).
Lithologies
Lithologic mixes for stratigraphic events are calculated from the selected wells
along cross-sections. The thicknesses of four main lithologies (sandstone, siltstone,
shale/claystone and limestone) of each stratigraphic event from well information and
the average content of each lithology are calculated as a percentage for mixed
lithologies in a single stratigraphic event. There is no relevant data for explaining
reservoir layers and fluid flow conduits in these studied 2D regional geological
models.
Total organic carbon and kerogen type
Based on our statistics of 1030 measured TOC (%) values in shales, average values
and ranges of total organic carbon content are 1.3 % and 0.5-3.0 % in the Barrow
Group, 1.7 % and 0.5-5.0 % in the Dupuy Formation, Dingo Claystone and Athol
Formation, 2.1 % and 0.5-6.0 % in the Murat Siltstone, 2.2 % and 0.5-14.0 % in the
Mungaroo Formation. Type III kerogen was used in the Barrow Group, the Jurassic
source rocks and the Mungaroo Formation.
Thermal parameters
Steady-state heat flow (constant heat flow) values and seabed temperatures, the
default values of matrix thermal conductivity and matrix heat capacity in BasinMod
2D, as in BasinMod 1D, were used in the 2D modelling.
Palaeobathymetry
Palaeobathymetry is a necessary parameter for the reconstruction of subsidence
history. Hardenbol et al. (1981), Joy (1992), and Emery and Myers (1996) provided
methods, using seismic data, to determine palaeo-water depths. Seismic profiles
Chapter 9 Two-dimensional Models and Data
169
sometimes provide good information about the relative bathymetries. Palaeo-water
depths can be estimated from coastal onlaps, shelf breaks, lithology, eroded and
non-deposition areas with some calibrated calculation. Kaiko and Tait (2000)
studied the post-rift tectonic subsidence and the palaeo-water depth using seismic
data for some wells in the Northern Carnarvon Basin. Because of a lack of good data
concerning palaeobathymetric values in the Triassic and Jurassic sequences, the
lithology and palynofacies analysis in the wells and the studies of the environment
and palaeogeography by Bint and Helby (1988) and Bradshaw et al. (1988) were
used to evaluate the palaeo-water depths. These were about 2-50 m during the
Middle-Late Triassic, 20-50 m during the Early Jurassic, 50-350 m during the
Middle-Late Jurassic, 200-400 m during the Cretaceous and 20-300 m in the
Cenozoic.
Erosional events
A large uplift and erosion event took place on the Rankin Platform and the structural
highs during the syn-rift phase associated with the breakup of Gondwana. The
erosional effects are clearly visible on the seismic lines. Generally, the sedimentary
rocks of the Murat Siltstone (Lower Jurassic) and the upper part of the Mungaroo
Formation (Upper Triassic) were eroded during the late Early Jurassic to the
breakup time. It is estimated that the eroded thicknesses were from several hundred
meters to two thousand meters on the Rankin Platform. Uplift and erosion also
occurred on the eastern flank of the basin. Possibly several hundred meters and up to
one thousand meters of the Barrow group (Earliest Cretaceous) and the Dingo
Claystone (Upper Jurassic) were eroded during the breakup time. The erosional
thicknesses during the Cretaceous and the Cenozoic seem to be small from the
selected seismic lines.
Chapter 10 2D Overpressure Modelling and Pressure Behaviour Modelling 169
CHAPTER 10 TWO-DIMENSIONAL DEEP OVERPRESSURE
MODELLING AND PRESSURE BEHAVIOUR MODELLING
10.1 Introduction
Overpressure is encountered in the formations of Jurassic age and the Barrow Group
(of the earliest Cretaceous age) in some wells within the Northern Carnarvon Basin
(Zaunbrecher, 1994). Overpressure influences many fluid-related aspects of
petroleum geology, including diagenesis and reservoir quality (e.g. Burley, 1993).
The processes of migration and accumulation of oil and gas are strongly influenced
by overpressured systems (e.g. England et al., 1987; Hunt, 1990). It also constitutes
a hazard in drilling wells and directly impacts on drilling costs and the safety of
petroleum exploration (Tingate et al., 2001).
The mechanisms proposed for increasing fluid pressure (pore fluid pressure) in
sedimentary basins include (1) rapid loading causing compaction disequilibrium that
is common in fine-grained rocks (e.g. Chapman, 1972; Magara, 1978; Swarbrick,
1995; Hunt, 1996), (2) aquathermal expansion and thermal expansion of fluids (e.g.
Barker, 1972; Bradley, 1975; Plumley, 1980; Miller and Luk, 1993; Hunt, 1990;
Alnes and Lilburn, 1998), (3) hydrocarbon generation (e.g. Timko and Fertl, 1971;
Law and Dickinson, 1985; Spencer, 1987; Düppenbecker et al., 1991) and oil-to-gas
cracking (e.g. Chaney, 1950; Barker, 1990; Luo and Vasseur, 1996), (4)
compression of lateral tectonic stress (e.g. Berry, 1973), (5) smectite to illite
transformation and clay dehydration (Powers, 1967; Burst, 1969; Schmidt, 1973),
(6) osmosis in shales (Marine and Fritz, 1981), and (7) effect of gas buoyancy in
sealed units (Swarbrick, 1995). Generating overpressures from the latter three
mechanisms are considered to be small in most cases (Swarbrick, 1995). The
contribution of horizontal compression to overpressure generation is considered to
be minor in passive continental margin basins (Swarbrick and Osborne, 1998). Luo
and Vasseur (1996) demonstrated that oil generation is unimportant for overpressure
generation if the organic matter content of rocks is less than 5 %, while gas
generation and oil-to-gas cracking are significant contributions to overpressure. Lou
and Vasseur (1992) suggested that in practical geopressure studies, the pressuring
effect of aquathermal factor could be neglected. Swarbrick and Hillis (1999)
Chapter 10 2D Overpressure Modelling and Pressure Behaviour Modelling 170
presented data showing thermal expansion of fluid during burial to be a relatively
minor mechanism for overpressure development.
Swarbrick and Osborne (1998) reviewed various overpressure mechanisms indicated
in the literature and proposed that the major mechanisms for large magnitude
overpressure, in most extensional sedimentary basins, are compaction
disequilibrium due to rapid loading in fine-grained sequences, and fluid volume
expansion during gas generation. Recently, Yardley and Swarbrick (2000) used 2D
models to show that disequilibrium compaction-generated overpressure can
significantly enhance the excess pressure (the difference between fluid pressure and
hydrostatic pressure) at structural highs by the lateral transfer of fluids from deep
overpressured parts of a basin along laterally extensive inclined aquifers, both in
recently deposited reservoirs and in old structures.
In support of the compaction disequilibrium mechanism, Gretener and Bloch (1992)
noted that there were two types of overpressure development in sedimentary basins:
(1) compaction disequilibrium, in which there is unrestricted lateral flow and
restricted vertical flow, and (2) sealed compartments, in which there is both
restricted lateral and vertical flow. Mann and Mackenzie (1990) presented an
argument that compaction disequilibrium was the dominant mechanism for observed
fluid overpressure in the Gulf of Mexico and the North Sea, based on an empirical
relationship between overpressure gradient, permeability and deposition rate. Luo
and Vasseur (1992) also presented an argument that the excess pressure is so great
that it cannot be explained by compaction alone in some areas, such as the United
States Gulf of Coast. Despite the arguments for compaction disequilibrium
(generally undercompaction) being the cause of overpressure in many basins, a
significant corpus of evidence has also been gathered that may suggest otherwise.
Bradley (1975) and Swarbrick (1995) suggest that excess pressure will dissipate
once burial slows to a rate at which fluid loss matches the addition of overburden
stress. Hermanrud et al. (1998) demonstrated that high fluid overpressures in the
thick shale-prone Upper Jurassic and Lower Cretaceous sequences on Haltenbanken
(offshore mid-Norway) have not significantly contributed to high porosity in
overpressured zones. The conclusion of the Hermanrud et al. (1998) and Teige et al.
(1999) studies is that there is no abnormally high porosity (and, thus,
Chapter 10 2D Overpressure Modelling and Pressure Behaviour Modelling 171
undercompaction) on Haltenbanken in the North Sea, but rather the sonic and
resistivity wireline logs are responding to the present day fluid overpressure. Hunt et
al. (1998) stated that fine-grained quartz and carbonates stop compacting at
porosities around 3 %, whereas shales containing minerals with large surface areas,
such as smectite and illite, stop compacting at porosities around 10 %. More
recently, Lee and Deming (2002) studied the overpressure in the Anadarko Basin,
southwestern Oklahoma. They proposed that the overpressure can not be explained
by compaction disequilibrium and that the best explanations are gas generation and
gas capillary seals.
Barker (1972) noted that the high-pressure zones should be effectively isolated from
their surroundings. Bradley (1975) considered that the abnormal pressured system
must be completely enclosed by seals on all sides. Hunt (1990) pointed out that to
maintain overpressure through geological time requires seals that are almost
completely impermeable or a continuous pressure recharge must occur during basin
sinking. Hunt (1990), Powley (1990), Bradley and Powley (1994), and Ortoleva
(1994) proposed that the pressure fluid compartments are characterized by an
effective seal, in three-dimensions. The efficiency of low-permeability units, fine-
grained rocks, may be enhanced by diagenetic cements (Hunt, 1990; Swarbrick,
1995). Deming (1994) demonstrated that the permeability needed for a geological
layer to act as a pressure seal is in the range 10-21-10-24 m2. To maintain overpressure
in sedimentary basins over geological time, highly effective pressure seals, such as
low-permeability rocks and lateral fault sealing, are required to be capable of
preventing fluid expulsion from sealed compartments.
The Northern Carnarvon Basin is a hydrocarbon-rich overpressured basin.
Petroleum generation is believed to be mainly associated with the Jurassic organic-
rich, clay-rich section which is highly overpressured. Previous authors have
proposed various origins for the generation of the fluid overpressure in the Northern
Carnarvon Basin which principally include (1) hydrocarbon generation (Horstman
1988) or gas generation (Zaunbrecher 1994), and (2) compaction disequilibrium
(Swarbrick & Hillis 1999; Bekele et al. 2001; Tingate et al. 2001). However,
Swarbrick and Hillis (1999) suggested that the generation of a large volume of gas
could be a secondary source of overpressure as well. Bekele et al. (2001) also
Chapter 10 2D Overpressure Modelling and Pressure Behaviour Modelling 172
proposed that organic maturation has a contribution of approximately 15 percent to
the maximum pressure anomaly in the Barrow Sub-basin, based on 2D numerical
basin modelling. Horstman (1988) maintained that hydrocarbon generation is the
most important mechanism within source rocks, based on a comparison of the depth
of the oil window and the top of the overpressured zone. Zaunbrecher (1994)
considered that gas generation and accumulation are the likely origin for the
overpressure in reservoirs sealed by overpressured clays.
Clearly, both the hydrocarbon generation and disequilibrium compaction
mechanisms have been most commonly proposed by various authors to be the
dominant genesis of the observed overpressures for the Jurassic clay-rich and some
Cretaceous sequences in the Northern Carnarvon Basin. With reference to previous
work, the following questions concerning the deep overpressured system in the sub-
basins are still of great interest to the study of overpressure modelling: (1) What is
the effect of the top pressure seal for maintaining the deep overpressure in the sub-
basins? (2) What does the evolution of the deep overpressured system look like in
the sub-basins? (3) What are the processes and major mechanisms of the generation
and maintenance of the deep overpressured system in the sub-basins? and (4) What
is the pressure behaviour within low-permeability (10-18-10-22 m2) environments?
The aim of this chapter to propose possible answers for these questions based on
results from (1) studies of deep overpressure, formation compaction and pressure
seal in Chapter 5 and this Chapter, and (2) overpressure modelling using BasinMod
2D software and approximation of pressure behaviour modelling within low-
permeability conditions based on a well-known diffusion equation.
Two-dimensional modelling was performed using the BasinMod 2D package
(version 4.61) to reconstruct the evolutions of porosity and permeability, formation
of pressure seal with compaction and cementation, generation and preservation of
the deep overpressure on the studied cross-sections in the Barrow, Exmouth and
Dampier Sub-basins. It should be noted that the 2D modelling should be perceived
to give a qualitative overview for the overpressure history rather than strict
quantitative results. Three 1D models were developed to investigate the low-
permeability conditions required to maintain overpressure and to determine the
dissipation time of the observed deep overpressure in the Bambra locality of the
Chapter 10 2D Overpressure Modelling and Pressure Behaviour Modelling 173
Barrow Sub-basin. This modelling was based on a well-known diffusion
approximation for pressure behaviour in porous media.
10.2 Two-dimensional overpressure modelling in the Barrow Sub-
basin
The length of the AB cross-section (Fig. 9-5) in the Barrow Sub-basin for the 2D modelling is 120 km and its maximum depth is about 10700 m. The cross-section has been divided into 22,537 cells with time intervals of 1-2 Ma and x-distance intervals of 1 km. Top pressure seal of the deep overpressured system in this geological model was designed with 300-500 m thickness and was modelled with quartz cementation. 10.2.1 Correlation between the predicted values and the observed data 10.2.1.1 Data from Bambra-2 for correlation Figure 10-1A shows modelled porosity and permeability curves, and some measured porosity and permeability values at the Bambra-2 well site along the cross-section in the Barrow Sub-basin (x-distance of 90,000 m on Fig. 9-5). The porosity curve matches the observed claystone porosity values of 4.9-6.6 % from a conventional core at 4274-4283 m. The measured permeability values for this core at 4274-4283 m are generally 10-17 m2 (data from the well completion report), which are basically consistent with the calculated values of about 10-18-10-19 m2 in the overpressured Middle Jurassic. Figure 10-1B shows that the modelled fluid pressure and excess pressure curves at present basically fit with the mud weight pressures and RFT pressures from Bambra-1. The modelled maximum excess pressure is about 35.6 MPa at a depth of 4600 m within the Athol Formation. Figure 10-1C shows the calculated temperature and vitrinite reflectance curves at present and the measured formation temperatures and thermal maturity values. The formation temperatures from Bambra-2 are the extrapolated bottom hole temperatures using the Horner-plot. The observed thermal maturity values were derived from a 1D modelled maturity trend obtained from Rock-Eval Tmax data in Bambra-2, which can be modelled using the present-day seabed temperatures and constant heat flow values in the range of 43-46 mW/m2 along the cross-section.

Chapter 10 2D Overpressure Modelling and Pressure Behaviour Modelling 174
Chapter 10 2D Overpressure Modelling and Pressure Behaviour Modelling 175
10.2.1.2 Data from West Tryal Rocks-1 for correlation
Figure 10-2A shows the modelled fluid pressure and the RFT pressures and mud
weights at the West Tryal Rocks-1 well site along the cross-section (x-distance of
7600 m on Fig. 9-5). Figure 10-2B also shows the modelled temperature and
maturity curves and the measured formation temperatures and thermal maturity
values at this well site. There are two estimated formation temperatures, one (146.7 oC at 3866 m) is the extrapolated bottom hole temperature using the Horner-plot and
the other is the corrected bottom hole temperature by adding 10 % of the raw
temperature (120 oC at 3433 m). The measured maturity values are the 1D modelled
maturity trend using the real Rock-Eval Tmax data in West Tryal Rocks-1 which can
be well matched using the constant heat flow values in the range of 43-46 mW/m2
and current seabed temperatures along the cross-section.
10.2.2 Results of the BasinMod 2D modelling
10.2.2.1 Sedimentation rates
Based on the calculated sedimentation rates in the sub-basin, the burial history can
be divided into three periods. Rapid loading occurred during the Jurassic and
Earliest Cretaceous (136 Ma) with sedimentation rates of about 80-180 m/Ma in the
graben. The sedimentation rates were about 40-60 m/Ma during the Early
Cretaceous to the early Late Cretaceous (136-90 Ma) and about 10-20 m/Ma during
the Late Cretaceous and Cainozoic.
10.2.2.2 Porosity and permeability
A number of the modelled chronological evolution profiles of porosity and
permeability at x-distances of 50,000 m were selected (Fig. 10-3; approximately
mid-basin, see Fig. 9-5 for the location). The various ages for the profiles of porosity
and permeability are 160 Ma, 145 Ma, 136 Ma, 120 Ma, 90 Ma, 65 Ma, 24 Ma and
present-day. Based on the modelled porosity, the permeability history was
calculated using the modified Kozeny-Carman equation (Ungerer et al., 1990) in
BasinMod 2D. Figure 10-3 indicates porosity and permeability histories:

Chapter 10 2D Overpressure Modelling and Pressure Behaviour Modelling 176
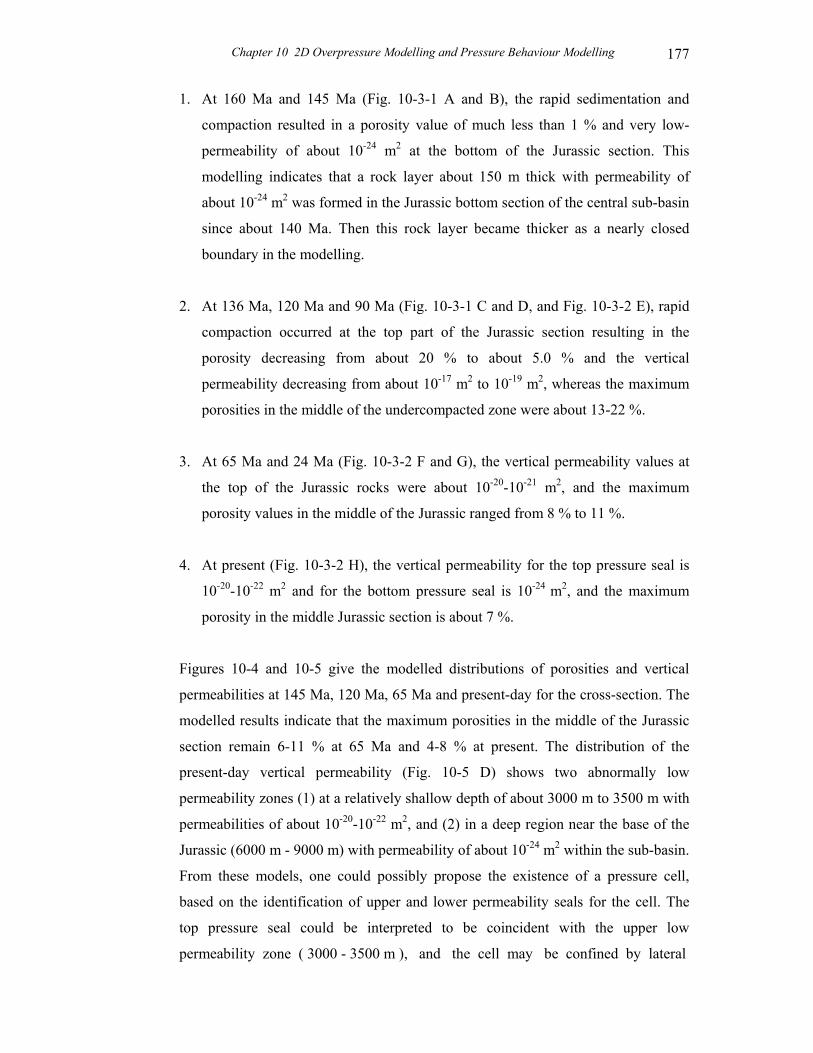
Chapter 10 2D Overpressure Modelling and Pressure Behaviour Modelling 177
1. At 160 Ma and 145 Ma (Fig. 10-3-1 A and B), the rapid sedimentation and
compaction resulted in a porosity value of much less than 1 % and very low-
permeability of about 10-24 m2 at the bottom of the Jurassic section. This
modelling indicates that a rock layer about 150 m thick with permeability of
about 10-24 m2 was formed in the Jurassic bottom section of the central sub-basin
since about 140 Ma. Then this rock layer became thicker as a nearly closed
boundary in the modelling.
2. At 136 Ma, 120 Ma and 90 Ma (Fig. 10-3-1 C and D, and Fig. 10-3-2 E), rapid
compaction occurred at the top part of the Jurassic section resulting in the
porosity decreasing from about 20 % to about 5.0 % and the vertical
permeability decreasing from about 10-17 m2 to 10-19 m2, whereas the maximum
porosities in the middle of the undercompacted zone were about 13-22 %.
3. At 65 Ma and 24 Ma (Fig. 10-3-2 F and G), the vertical permeability values at
the top of the Jurassic rocks were about 10-20-10-21 m2, and the maximum
porosity values in the middle of the Jurassic ranged from 8 % to 11 %.
4. At present (Fig. 10-3-2 H), the vertical permeability for the top pressure seal is
10-20-10-22 m2 and for the bottom pressure seal is 10-24 m2, and the maximum
porosity in the middle Jurassic section is about 7 %.
Figures 10-4 and 10-5 give the modelled distributions of porosities and vertical
permeabilities at 145 Ma, 120 Ma, 65 Ma and present-day for the cross-section. The
modelled results indicate that the maximum porosities in the middle of the Jurassic
section remain 6-11 % at 65 Ma and 4-8 % at present. The distribution of the
present-day vertical permeability (Fig. 10-5 D) shows two abnormally low
permeability zones (1) at a relatively shallow depth of about 3000 m to 3500 m with
permeabilities of about 10-20-10-22 m2, and (2) in a deep region near the base of the
Jurassic (6000 m - 9000 m) with permeability of about 10-24 m2 within the sub-basin.
From these models, one could possibly propose the existence of a pressure cell,
based on the identification of upper and lower permeability seals for the cell. The
top pressure seal could be interpreted to be coincident with the upper low
permeability zone ( 3000 - 3500 m ), and the cell may be confined by lateral

Chapter 10 2D Overpressure Modelling and Pressure Behaviour Modelling 178
Chapter 10 2D Overpressure Modelling and Pressure Behaviour Modelling 179
closed faults and a deeper zone, which appears to be associated with the base of the
Jurassic sediments (6000-9000 m).
10.2.2.3 Fluid pressure
Eight representative profiles of excess pressure were selected to demonstrate the
modelled chronological results for the following geological times: the end of the
Middle Jurassic (160 Ma), the end of the Late Jurassic (145 Ma), the early period of
the Early Cretaceous (136 Ma), the middle of the Early Cretaceous (120 Ma), the
early period of the Late cretaceous (90 Ma), the end of the Late Cretaceous (65 Ma),
the end of the Oligocene (24 Ma) and present-day (Fig. 10-6). Figure 10-6-1 (A and
B) shows that the Jurassic overpressure was developed during the deposition of
claystone and siltstone-dominated Jurassic and the Lowest Cretaceous sequences
with the maximum excess pressures of about 35 MPa and 65 MPa at 160 Ma and
145 Ma respectively in the Jurassic succession. The buildup of the high fluid
pressure was modelled, which may be related to rapid sedimentation rates in Jurassic
fine-grained sediments. These excess pressure profiles show that the significant
upward compaction-driven water flow was indicated by the water flow direction,
and that overpressure was also released along fault conduits. Figure 10-6-1 (C and
D) and Figure 10-6-2 (E) show that the maximum excess pressures were about 80
MPa, 83 MPa and 90 MPa at 136 Ma, 120 Ma and 90 Ma, respectively, in the
Jurassic section. The Jurassic overpressured system may be recharged in terms of
the current modelling package, owing to compaction disequilibrium during the
deposition of the Upper Jurassic and Lower Cretaceous indicated by the porosity
history (Fig. 10-3). The direction of water flow was obviously controlled by the
permeability increase from deeper to shallower. Figure 10-6-2 (F, G and H) shows
the overpressure evolution in the Tertiary and Quaternary. The modelling shows that
the deep overpressured system has been sealed from at least Cainozoic because the
upward and lateral water flow has been significantly weakened, which could suggest
that a top pressure seal, and lateral closed faults, were becoming more effective
through time to maintain the overpressure. This isolation condition seems to be an
important control for maintaining the deep overpressure based on the BasinMod 2D
modelling.
Chapter 10 2D Overpressure Modelling and Pressure Behaviour Modelling 180
10.2.2.4 General discussion
There is an absence of observed data from the deep overpressured section at depths
greater than 4650 m. The calculated deep overpressure below 5000 m using the
BasinMod 2D modelling may not be valid.
A significant error for the overpressure distribution may be related to fault
distribution in the depocentre of the sub-basin because faults, as conduits allow pore
fluid flow. A possible error may be also derived from the steady-state thermal model
for thermal expansion of pore fluids and hydrocarbon generation, but it was
discovered to be minor in the BasinMod 2D modelled results, based on the
sensitivity analysis using various temperatures. The porosity is more sensitive to the
overpressure modelling because the permeability calculation is based on it.
The fact that this top pressure seal was designed to be independent of formation
boundaries but modelled results show a close correlation between pressure seal and
location and stratigraphy is particularly interesting. The influence of the top pressure
seal was examined for the deep overpressured system. The results indicate that there
are various distributions of the overpressure predicted for two distinct models with,
and without, the designed top pressure seal, and that these are unlikely to match
measured pressure data without the top pressure seal. As the result of cementation,
the modelled porosity in the interpreted top pressure seal was calculated to be 1.5-
4.5 % and the calculated permeability values ranged from 10-20 m2 to 10-22 m2 at
present (Fig. 10-4 D and Fig. 10-5 D). This suggests that quartz cementation is a
significant factor in forming the low-permeability rocks in the depth interval of the
interpreted top pressure seal of the sub basin.
Temperature increase results in pore fluid expansion that produces overpressure.
The contribution of thermal expansion of pore fluids to overpressure has been
calculated in this cross-section using the BasinMod 2D. It is about 5-10 % of the
maximum excess pressures. The generated pressure owing to hydrocarbon
generation has been observed in the processes of the two-dimensional overpressure
modelling. However, the calculated generation pressure, using the model of the
Chapter 10 2D Overpressure Modelling and Pressure Behaviour Modelling 181
volumetric change in BasinMod 2D, is smaller (less than 2 MPa) irrespective of
TOC values from 1 % to 6 %.
10.3 Two-dimensional overpressure modelling in the Exmouth Sub-
basin
The length and present-day depth of the 110/11 cross-section (see Fig. 9-6 for the
cross-section) in the Exmouth Sub-basin are 150 km and about 12800 m,
respectively. It has been divided into 34,397 cells with time intervals of 2 Ma and x-
distance intervals of 1 km. Many normal faults in the seismic cross-section were
interpreted (Appendix 2). However, only crucial normal faults have been set up on
the geological 2D model and were modelled throughout geological time. It should
be noted that occurrences of many small-scale normal faults within the Barrow
Group and Upper Jurassic section have been ignored because it is impossible to
model too many small-scale faults using the numerical model. However, this may
influence the modelled distribution of the deep overpressure to some extent.
10.3.1 Correlation between the calculated values and the observed data
10.3.1.1 Fluid pressure correlation
Figure 10-7 shows the three pressure profiles of the modelled and measured fluid
pressures at the well sites of Zeewulf-1, Novara-1 and Outtrim-1 along the 110/11
cross-section in the Exmouth Sub-basin. Unfortunately, all three wells along the
cross-section have not been drilled into the deep overpressured zone. These
modelled results are consistent with the observed data which indicate that the
shallower part (depth < 2800-3000 m) of the cross-section is a normal pressure
system. However, a deep overpressured system has been observed in the Jurabi-1
well at depths greater than 2900 m (Fig. 5-4), mentioned in Chapter 5.
10.3.1.2 Temperature and maturity correlation
Figure 10-8 indicates the modelled temperature lines and maturity trends, and the
observed formation temperatures and thermal maturity values at the well sites of
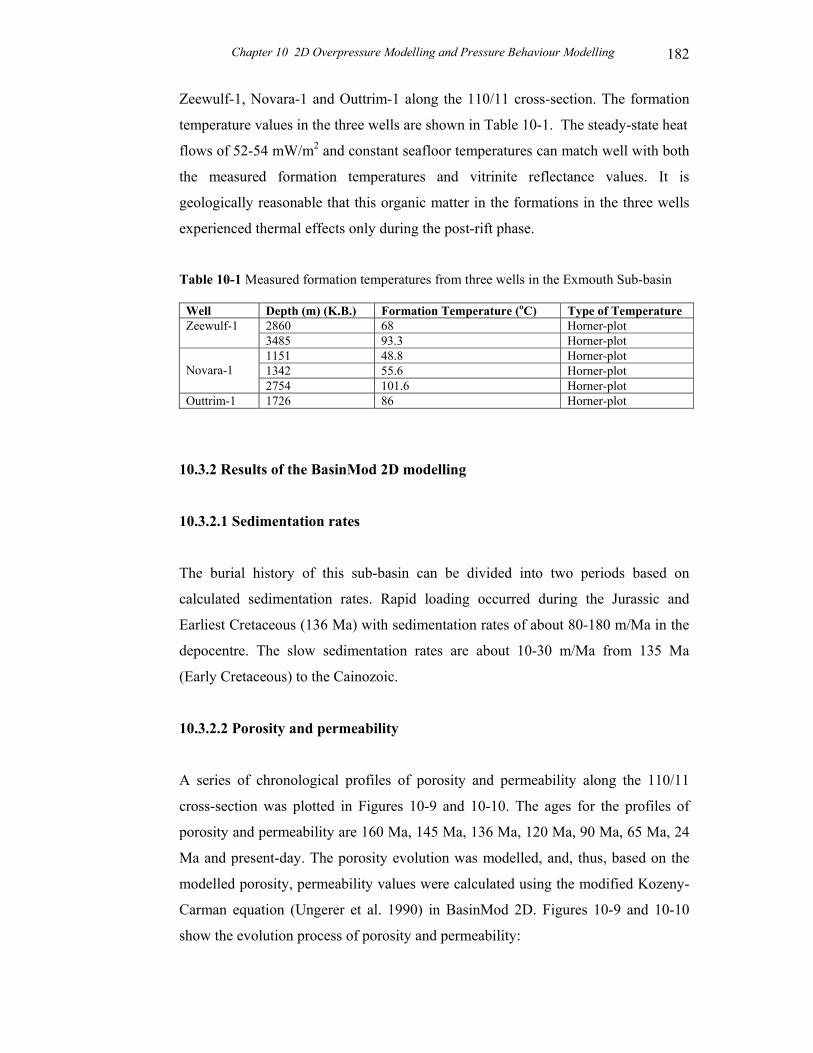
Chapter 10 2D Overpressure Modelling and Pressure Behaviour Modelling 182
Zeewulf-1, Novara-1 and Outtrim-1 along the 110/11 cross-section. The formation
temperature values in the three wells are shown in Table 10-1. The steady-state heat
flows of 52-54 mW/m2 and constant seafloor temperatures can match well with both
the measured formation temperatures and vitrinite reflectance values. It is
geologically reasonable that this organic matter in the formations in the three wells
experienced thermal effects only during the post-rift phase.
Table 10-1 Measured formation temperatures from three wells in the Exmouth Sub-basin
Well Depth (m) (K.B.) Formation Temperature (oC) Type of Temperature 2860 68 Horner-plot Zeewulf-1 3485 93.3 Horner-plot 1151 48.8 Horner-plot 1342 55.6 Horner-plot
Novara-1
2754 101.6 Horner-plot Outtrim-1 1726 86 Horner-plot
10.3.2 Results of the BasinMod 2D modelling
10.3.2.1 Sedimentation rates
The burial history of this sub-basin can be divided into two periods based on
calculated sedimentation rates. Rapid loading occurred during the Jurassic and
Earliest Cretaceous (136 Ma) with sedimentation rates of about 80-180 m/Ma in the
depocentre. The slow sedimentation rates are about 10-30 m/Ma from 135 Ma
(Early Cretaceous) to the Cainozoic.
10.3.2.2 Porosity and permeability
A series of chronological profiles of porosity and permeability along the 110/11
cross-section was plotted in Figures 10-9 and 10-10. The ages for the profiles of
porosity and permeability are 160 Ma, 145 Ma, 136 Ma, 120 Ma, 90 Ma, 65 Ma, 24
Ma and present-day. The porosity evolution was modelled, and, thus, based on the
modelled porosity, permeability values were calculated using the modified Kozeny-
Carman equation (Ungerer et al. 1990) in BasinMod 2D. Figures 10-9 and 10-10
show the evolution process of porosity and permeability:
Chapter 10 2D Overpressure Modelling and Pressure Behaviour Modelling 183
1. At 160 Ma, 145 Ma and 136 Ma (Figures 10-9-1 A, B and C; 10-10-1 A, B and
C), the bottom of the Jurassic section underwent rapid compaction leading to the
occurrence of very low porosity and permeability zones with the lowest
permeability values about 10-24 m2, which actually formed a impermeable
bottom boundary of the Jurassic in the depocentre of the sub-basin since about
138 Ma. It can be seen that strong compacted zones occurred along the major
faults, which indicated that pore water rapidly migrated along the fault planes
during the rifting burial and fault activity. It is obvious that porosities of about
10-45 % remained in the middle-upper part of the Jurassic sequence.
2. At 120 Ma, 90 Ma and 65 Ma (Figures 10-9-1 D; 10-9-2 E and F; 10-10-1 D;
10-10-2 E and F), porosity slowly decreased in the Jurassic section due to slow
overburden loading during this period. Pore water release along fault conduits
tended to cease. The estimated porosities of 7-10 % remained in the middle of
the Upper Jurassic sequence, while the Middle-Lower Jurassic rocks were highly
compacted.
3. At 24 Ma and present-day (Figures 10-9-2 G and H; 10-10-2 G and H), the
porosity values in the Upper Jurassic section in the central sub-basin ranged
from approximately 2 % to 7 %. The vertical permeability was about 10-20 m2 at
the top of the Upper Jurassic rocks and about 10-23-10-25 m2 in the Lower-Middle
Jurassic rocks. It can be seen that the lateral fault sealing resulted in many
separated cells in the deep overpressured system of the Jurassic section.
10.3.2.3 Fluid pressure
The calculated eight profiles of chronological excess pressure have been chosen to
show the modelled deep overpressure evolution for the following geological times:
the end of the Middle Jurassic (160 Ma), the end of the Late Jurassic (145 Ma), the
early period of the Early Cretaceous (136 Ma), the middle of the Early Cretaceous
(120 Ma), the early period of the Late Cretaceous (90 Ma), the end of the Late
Cretaceous (65 Ma), the end of the Oligocene (24 Ma) and present-day (Fig. 10-11).
Figure 10-11-1 (A, B and C) shows that the Jurassic overpressure was developed
during the deposition of the Jurassic and the Lowest Cretaceous sequences (Barrow
Chapter 10 2D Overpressure Modelling and Pressure Behaviour Modelling 184
Group). The maximum excess pressures were calculated to be about 35 MPa, 83
MPa and 103 MPa at 160 Ma, 145 Ma and 136 Ma, respectively in the Lower
Jurassic succession. It seems that the rapid sedimentation rates in the fine-grained
sediments during the rift phase were a significant cause of overpressure generation.
From these excess pressure profiles, the migration of water was dominated by
upward water flow as indicated by water flow direction and the lateral flow of water
was presented on the cross-section. Pore water flow and overpressure emission from
the Jurassic rocks along fault planes were significant events during the period.
Figures 10-11-1 (D) and 10-11-2 (E) show that the upward emission of overpressure
and water flow along the major normal faults from the Jurassic sequence were
gradually weakened as faults closed during the time interval. The maximum excess
pressures were modelled to be 85 MPa (120 Ma) and 62 MPa (90 Ma) in the
Jurassic section. Figure 10-11-2 (F, G and H) shows the overpressure evolution
during the Cainozoic. The modelled results indicate that the upward water flow and
overpressure release from the Jurassic overpressured system appeared to be slow. It
should be noted that the compaction effect for the deep overpressure should not be a
significant source because most of the porosity has been lost through compaction
and small porosities of 2-7 % remained in the well-compacted fine-grained Jurassic
source rocks and very slow deposition from 64 Ma to present-day. However, the
discharge of the modelled overpressure from the Jurassic overpressured
compartments was slow and the maximum excess pressures were 53 MPa at 64 Ma
and 45 MPa at present-day. The approximate 10 % of the total excess pressures were
calculated to be caused by fluid thermal expansion and generated pressure. Perhaps,
the deep overpressured system was significantly maintained by sealed conditions
since the Cainozoic from the BasinMod 2D modelling.
10.4 Two-dimensional overpressure modelling in the Dampier Sub-
basin
The length of the 101R/09 cross-section in the Dampier Sub-basin for the modelling
is about 135 km and the interpreted maximum depth of the cross-section is about
11000 m. The cross-section was divided into 29,765 cells with time intervals of 2
Chapter 10 2D Overpressure Modelling and Pressure Behaviour Modelling 185
Ma and x-distance intervals of 1 km. The critical normal faults were designed on the
geological 2D model and were modelled over geological time.
10.4.1 Correlation between the calculated values and the observed data
10.4.1.1 Fluid pressure correlation
Figure 10-12 shows correlation between the modelled pressure lines and measured
fluid pressures at the three well sites of Goodwyn-7, Rosemary-1 and Hampton-1
along the 101R/09 cross-section in the Dampier Sub-basin. These three wells were
drilled either on the shoulders of the rift graben or on its flank (Fig. 9-7). Therefore,
these wells have shown generally normal pressures in the Jurassic rocks (absence of
the Jurassic formations in Goodwyn-7). The overpressure within the Jurassic section
in this sub-basin was observed in Dampier-1. The slightly overpressured zone in this
well occurs at a depth of about 2900 m (Fig. 5-5), mentioned in Chapter 5.
10.4.1.2 Temperature and maturity correlation
Figure 10-13 shows the calculated temperature and maturity, and the observed
formation temperatures and maturity values at the well sites of Goodwyn-7,
Rosemary-1 and Hampton-1 along the 101R/09 cross-section. All formation
temperatures in the three wells are the corrected BHTs by adding 10 % of the raw
BHTs (Table 10-2). The constant heat flows of 40-43 mW/m2 and seafloor
temperatures can match with both the measured formation temperatures in the three
wells and the maturity data in Rosemary-1 and Hampton-1 (absence of maturity data
in Goodwyn-7). The observed maturity data were obtained from 1D modelled
maturity trends using the Rock-Eval Tmax data in Rosemary-1 and Hampton-1.
10.4.2 Results of the BasinMod 2D modelling
10.4.2.1 Sedimentation rates
Based on the calculated sedimentation rates along the cross-section, rapid deposition
occurred during the Jurassic period and the depositional rates were about 100-250
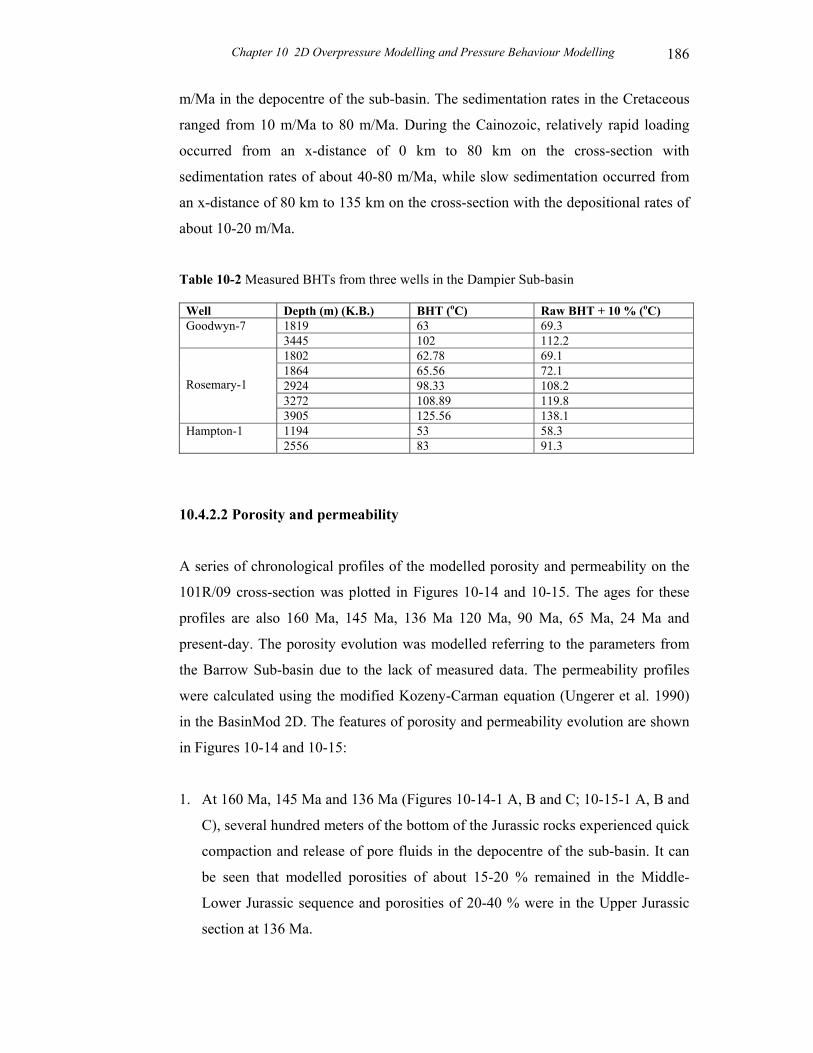
Chapter 10 2D Overpressure Modelling and Pressure Behaviour Modelling 186
m/Ma in the depocentre of the sub-basin. The sedimentation rates in the Cretaceous
ranged from 10 m/Ma to 80 m/Ma. During the Cainozoic, relatively rapid loading
occurred from an x-distance of 0 km to 80 km on the cross-section with
sedimentation rates of about 40-80 m/Ma, while slow sedimentation occurred from
an x-distance of 80 km to 135 km on the cross-section with the depositional rates of
about 10-20 m/Ma.
Table 10-2 Measured BHTs from three wells in the Dampier Sub-basin
Well Depth (m) (K.B.) BHT (oC) Raw BHT + 10 % (oC) 1819 63 69.3 Goodwyn-7 3445 102 112.2 1802 62.78 69.1 1864 65.56 72.1 2924 98.33 108.2 3272 108.89 119.8
Rosemary-1
3905 125.56 138.1 1194 53 58.3 Hampton-1 2556 83 91.3
10.4.2.2 Porosity and permeability
A series of chronological profiles of the modelled porosity and permeability on the
101R/09 cross-section was plotted in Figures 10-14 and 10-15. The ages for these
profiles are also 160 Ma, 145 Ma, 136 Ma 120 Ma, 90 Ma, 65 Ma, 24 Ma and
present-day. The porosity evolution was modelled referring to the parameters from
the Barrow Sub-basin due to the lack of measured data. The permeability profiles
were calculated using the modified Kozeny-Carman equation (Ungerer et al. 1990)
in the BasinMod 2D. The features of porosity and permeability evolution are shown
in Figures 10-14 and 10-15:
1. At 160 Ma, 145 Ma and 136 Ma (Figures 10-14-1 A, B and C; 10-15-1 A, B and
C), several hundred meters of the bottom of the Jurassic rocks experienced quick
compaction and release of pore fluids in the depocentre of the sub-basin. It can
be seen that modelled porosities of about 15-20 % remained in the Middle-
Lower Jurassic sequence and porosities of 20-40 % were in the Upper Jurassic
section at 136 Ma.
Chapter 10 2D Overpressure Modelling and Pressure Behaviour Modelling 187
2. At 120 Ma, 90 Ma and 65 Ma (Figures 10-14-1 D; 10-14-2 E and F; 10-15-1 D;
10-15-2 E and F), with the deposition of the Cretaceous, the Jurassic rocks were
gradually compacted causing porosity to decrease through the period. The
maximum porosity value in the Jurassic section of the depocentre fell from about
15 % at 120 Ma to about 8 % at 65 Ma.
3. At 24 Ma and present-day (Figures 10-14-2 G and H; 10-15-2 G and H), the
maximum porosity value was about 7 % at 24 Ma and 6 % at present-day in the
Jurassic source rocks of the central sub-basin. The vertical permeability was
about 10-19 m2 at the top of the Upper Jurassic section and about 10-24 m2 at the
bottom of the Lower-Middle Jurassic section. It can be seen that the vertical
permeability values in the rocks along faults in the central sub-basin were about
10-24 m2. Therefore, from this modelling, the bottom of the Jurassic rocks and
the fault rocks actually formed impermeable boundaries for the Jurassic source
section in the centre of the sub-basin.
10.4.2.3 Fluid pressure
Eight profiles of the modelled excess pressure have been selected to explain the
modelled deep overpressure history for the following geological times: the end of
the Middle Jurassic (160 Ma), the end of the Late Jurassic (145 Ma), the early period
of the Early Cretaceous (136 Ma), the middle of the Early Cretaceous (120 Ma), the
early period of the Late Cretaceous (90 Ma), the end of the Late Cretaceous (65
Ma), the end of the Oligocene (24 Ma) and present-day (Fig. 10-16). Figure 10-16-1
(A and B) shows that the Jurassic overpressure was developed mainly in the Lower-
Middle Jurassic section during the deposition of the Jurassic rocks. The maximum
excess pressures were about 40 MPa at 160 Ma and 65 MPa at 145 Ma. The lower
part of the Jurassic section was overpressured in the central sub-basin. The dominant
direction of water flow was upward. Figure 10-16-1 (C and D) shows that the deep
overpressure was maintained in the Lower-Middle Jurassic rocks with the highest
excess pressure of about 68 MPa. Upward water flow continued through this period.
Figure 10-16-2 (E and F) shows the distribution of deep overpressure in the Jurassic
was similar to that at 136-120 Ma. However, upward water flow significantly
weakened during this time. Figure 10-16-2 (G and H) indicates that the overpressure
Chapter 10 2D Overpressure Modelling and Pressure Behaviour Modelling 188
in the lower part of the Upper Jurassic from the left boundary to about middle of the
cross-section was enhanced, which may be due to the deposition of the Cainozoic.
Upward water flow occurred significantly in the Cainozoic sequence.
10.5 Pressure behaviour modelling
It seems that the variable of permeability is not sensitive to the deep overpressure
calculation in the 2D overpressure modelling if the permeabilites are less than 10-19-
10-20 m2. Based on presently available stratigraphic, petrographical and
petrophysical data, a pressure seal may exist within the sub-basins. However,
questions remain as to whether the present-day maintained overpressure is caused by
compaction disequilibrium in the geological past, and whether permeabilities of 10-
19-10-22 m-2 (10-4-10-7 md) for a pressure seal are sufficiently low to preserve the
overpressure for tens of millions of years. A simple 1D model was used in the hope
of estimating how rapidly pressure dissipates. It should be noted that dissipation of
excess pressure is different in the 2D and 1D processes, in spite of fluid expulsion
from overpressured shaly sections being dominantly vertical. However, with 2D, an
extra dimension is added to permit dissipation (rather than just vertically), and the
dissipation may be even more rapid. Thus, the deductions below may be
strengthened. Therefore, the simple theoretical considerations below provide
important information about overpressure longevity.
Fundamental questions posed by the computer-based basin modelling are (1) the
persistence of an overpressure cell over time, (2) the importance of compaction
disequilibrium as a cause of maintained overpressure, and (3) the importance of
hydrocarbon generation as a cause of maintained overpressure. Such questions may
be resolved by the application of some simple mathematically tractable models. This
section describes these simple models and their results.
The theory of pressure modelling has been fully dealt with by Bear (1972) and
Sahimi (1995), amongst others. It has been long recognised that diffusion
approximation of pressure behaviour (Bear, 1972, pp. 408-409; Cossé, 1993, p. 134)
by using exact tractable mathematical solutions is a relatively simple way to solve
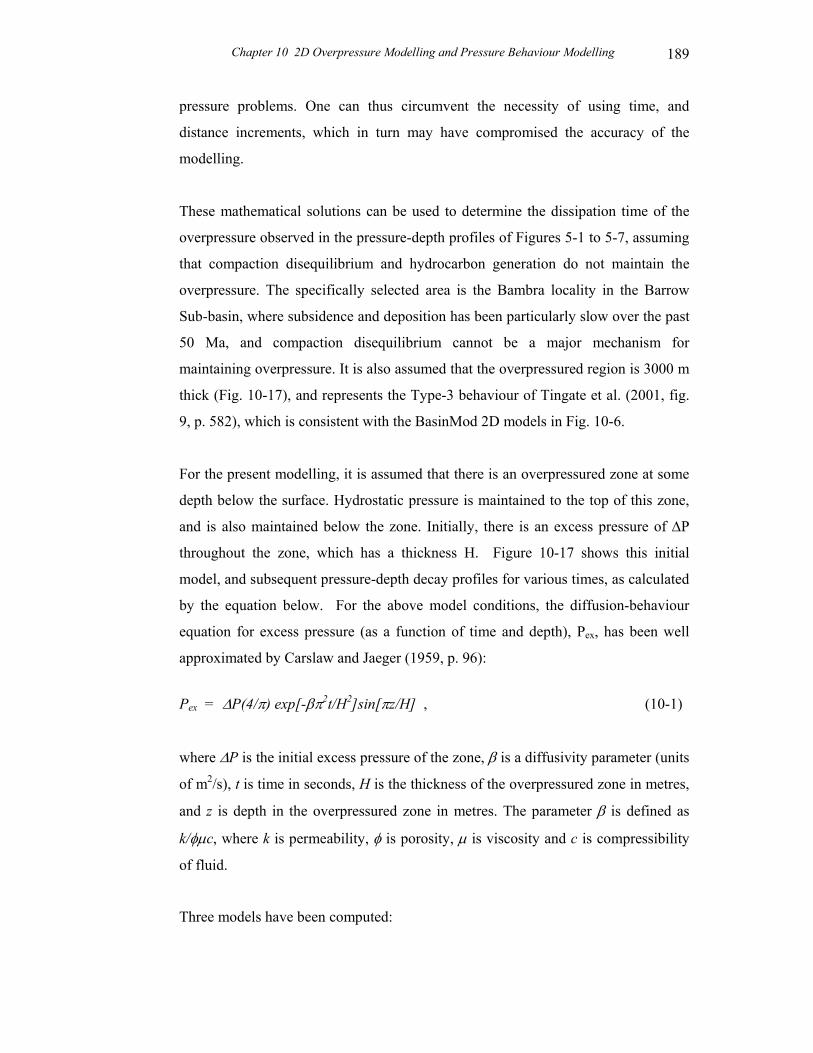
Chapter 10 2D Overpressure Modelling and Pressure Behaviour Modelling 189
pressure problems. One can thus circumvent the necessity of using time, and
distance increments, which in turn may have compromised the accuracy of the
modelling.
These mathematical solutions can be used to determine the dissipation time of the
overpressure observed in the pressure-depth profiles of Figures 5-1 to 5-7, assuming
that compaction disequilibrium and hydrocarbon generation do not maintain the
overpressure. The specifically selected area is the Bambra locality in the Barrow
Sub-basin, where subsidence and deposition has been particularly slow over the past
50 Ma, and compaction disequilibrium cannot be a major mechanism for
maintaining overpressure. It is also assumed that the overpressured region is 3000 m
thick (Fig. 10-17), and represents the Type-3 behaviour of Tingate et al. (2001, fig.
9, p. 582), which is consistent with the BasinMod 2D models in Fig. 10-6.
For the present modelling, it is assumed that there is an overpressured zone at some
depth below the surface. Hydrostatic pressure is maintained to the top of this zone,
and is also maintained below the zone. Initially, there is an excess pressure of ∆P
throughout the zone, which has a thickness H. Figure 10-17 shows this initial
model, and subsequent pressure-depth decay profiles for various times, as calculated
by the equation below. For the above model conditions, the diffusion-behaviour
equation for excess pressure (as a function of time and depth), Pex, has been well
approximated by Carslaw and Jaeger (1959, p. 96):
Pex = ∆P(4/π) exp[-βπ2t/H2]sin[πz/H] , (10-1)
where ∆P is the initial excess pressure of the zone, β is a diffusivity parameter (units
of m2/s), t is time in seconds, H is the thickness of the overpressured zone in metres,
and z is depth in the overpressured zone in metres. The parameter β is defined as
k/φµc, where k is permeability, φ is porosity, µ is viscosity and c is compressibility
of fluid.
Three models have been computed:
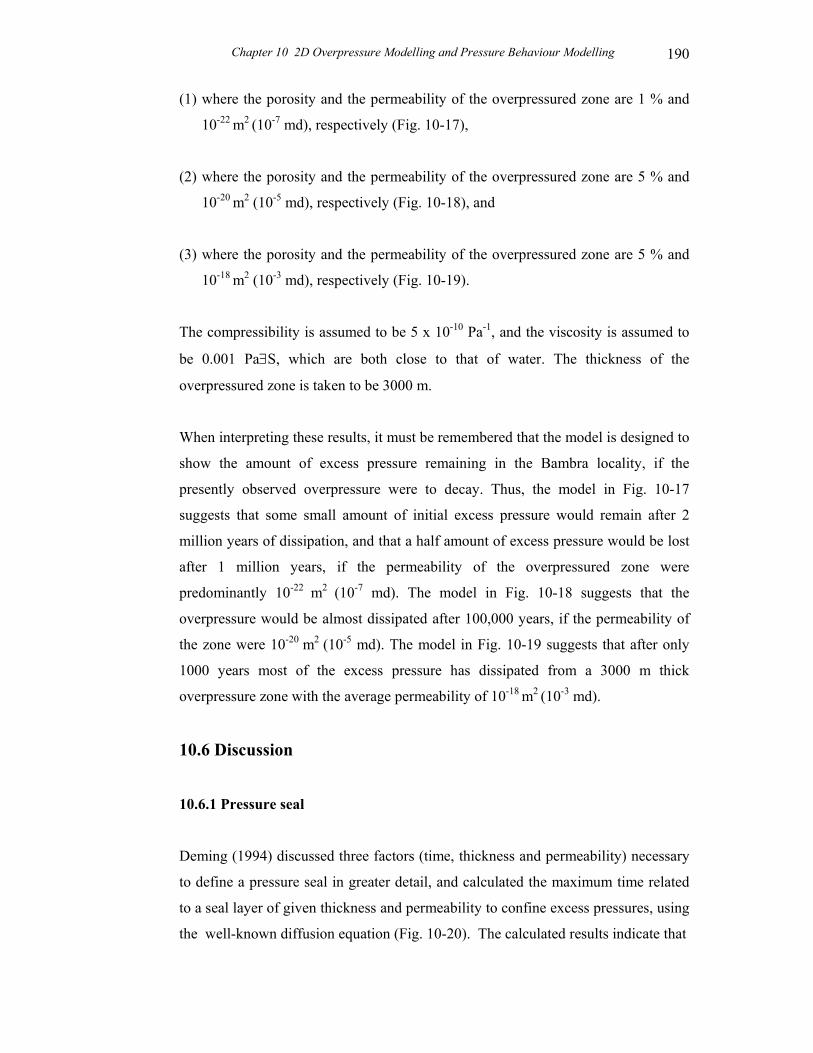
Chapter 10 2D Overpressure Modelling and Pressure Behaviour Modelling 190
(1) where the porosity and the permeability of the overpressured zone are 1 % and
10-22 m2 (10-7 md), respectively (Fig. 10-17),
(2) where the porosity and the permeability of the overpressured zone are 5 % and
10-20 m2 (10-5 md), respectively (Fig. 10-18), and
(3) where the porosity and the permeability of the overpressured zone are 5 % and
10-18 m2 (10-3 md), respectively (Fig. 10-19).
The compressibility is assumed to be 5 x 10⁻¹⁰ Pa-1, and the viscosity is assumed to
be 0.001 Pa∃S, which are both close to that of water. The thickness of the
overpressured zone is taken to be 3000 m.
When interpreting these results, it must be remembered that the model is designed to
show the amount of excess pressure remaining in the Bambra locality, if the
presently observed overpressure were to decay. Thus, the model in Fig. 10-17
suggests that some small amount of initial excess pressure would remain after 2
million years of dissipation, and that a half amount of excess pressure would be lost
after 1 million years, if the permeability of the overpressured zone were
predominantly 10-22 m2 (10-7 md). The model in Fig. 10-18 suggests that the
overpressure would be almost dissipated after 100,000 years, if the permeability of
the zone were 10-20 m2 (10-5 md). The model in Fig. 10-19 suggests that after only
1000 years most of the excess pressure has dissipated from a 3000 m thick
overpressure zone with the average permeability of 10-18 m2 (10-3 md).
10.6 Discussion
10.6.1 Pressure seal
Deming (1994) discussed three factors (time, thickness and permeability) necessary
to define a pressure seal in greater detail, and calculated the maximum time related
to a seal layer of given thickness and permeability to confine excess pressures, using
the well-known diffusion equation (Fig. 10-20). The calculated results indicate that

Chapter 10 2D Overpressure Modelling and Pressure Behaviour Modelling 191
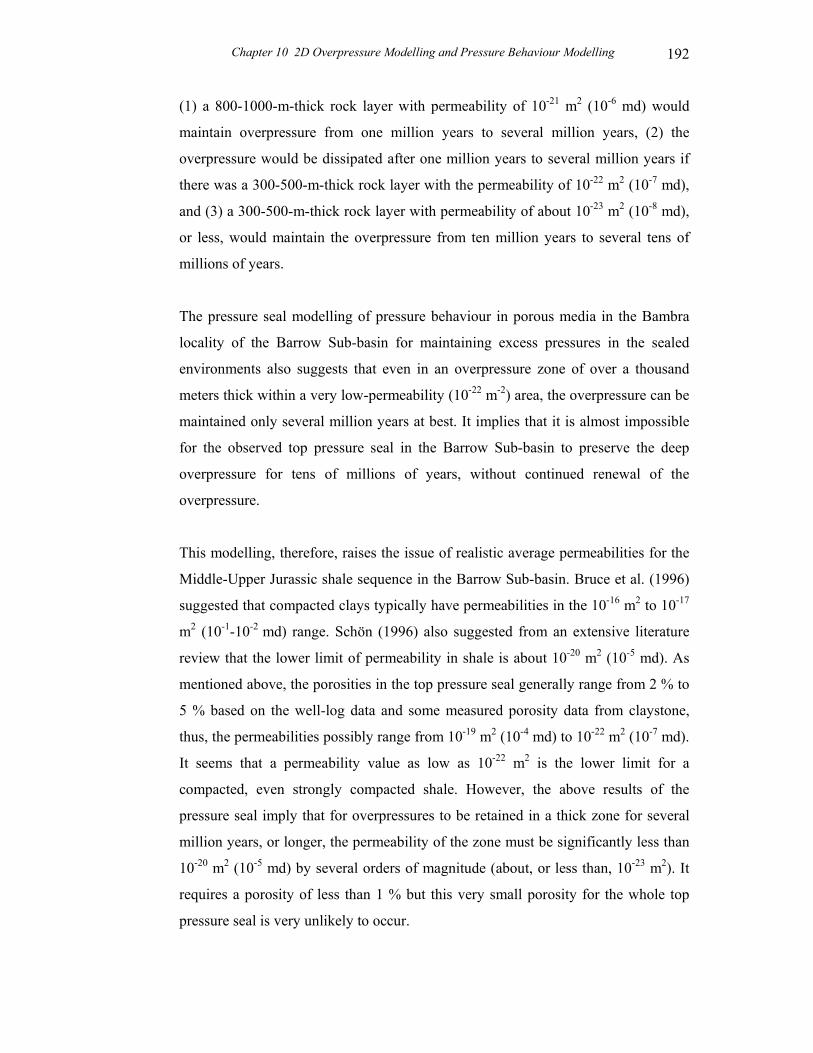
Chapter 10 2D Overpressure Modelling and Pressure Behaviour Modelling 192
(1) a 800-1000-m-thick rock layer with permeability of 10-21 m2 (10-6 md) would
maintain overpressure from one million years to several million years, (2) the
overpressure would be dissipated after one million years to several million years if
there was a 300-500-m-thick rock layer with the permeability of 10-22 m2 (10-7 md),
and (3) a 300-500-m-thick rock layer with permeability of about 10-23 m2 (10-8 md),
or less, would maintain the overpressure from ten million years to several tens of
millions of years.
The pressure seal modelling of pressure behaviour in porous media in the Bambra
locality of the Barrow Sub-basin for maintaining excess pressures in the sealed
environments also suggests that even in an overpressure zone of over a thousand
meters thick within a very low-permeability (10-22 m-2) area, the overpressure can be
maintained only several million years at best. It implies that it is almost impossible
for the observed top pressure seal in the Barrow Sub-basin to preserve the deep
overpressure for tens of millions of years, without continued renewal of the
overpressure.
This modelling, therefore, raises the issue of realistic average permeabilities for the
Middle-Upper Jurassic shale sequence in the Barrow Sub-basin. Bruce et al. (1996)
suggested that compacted clays typically have permeabilities in the 10-16 m2 to 10-17
m2 (10-1-10-2 md) range. Schön (1996) also suggested from an extensive literature
review that the lower limit of permeability in shale is about 10-20 m2 (10-5 md). As
mentioned above, the porosities in the top pressure seal generally range from 2 % to
5 % based on the well-log data and some measured porosity data from claystone,
thus, the permeabilities possibly range from 10-19 m2 (10-4 md) to 10-22 m2 (10-7 md).
It seems that a permeability value as low as 10-22 m2 is the lower limit for a
compacted, even strongly compacted shale. However, the above results of the
pressure seal imply that for overpressures to be retained in a thick zone for several
million years, or longer, the permeability of the zone must be significantly less than
10-20 m2 (10-5 md) by several orders of magnitude (about, or less than, 10-23 m2). It
requires a porosity of less than 1 % but this very small porosity for the whole top
pressure seal is very unlikely to occur.

Chapter 10 2D Overpressure Modelling and Pressure Behaviour Modelling 193
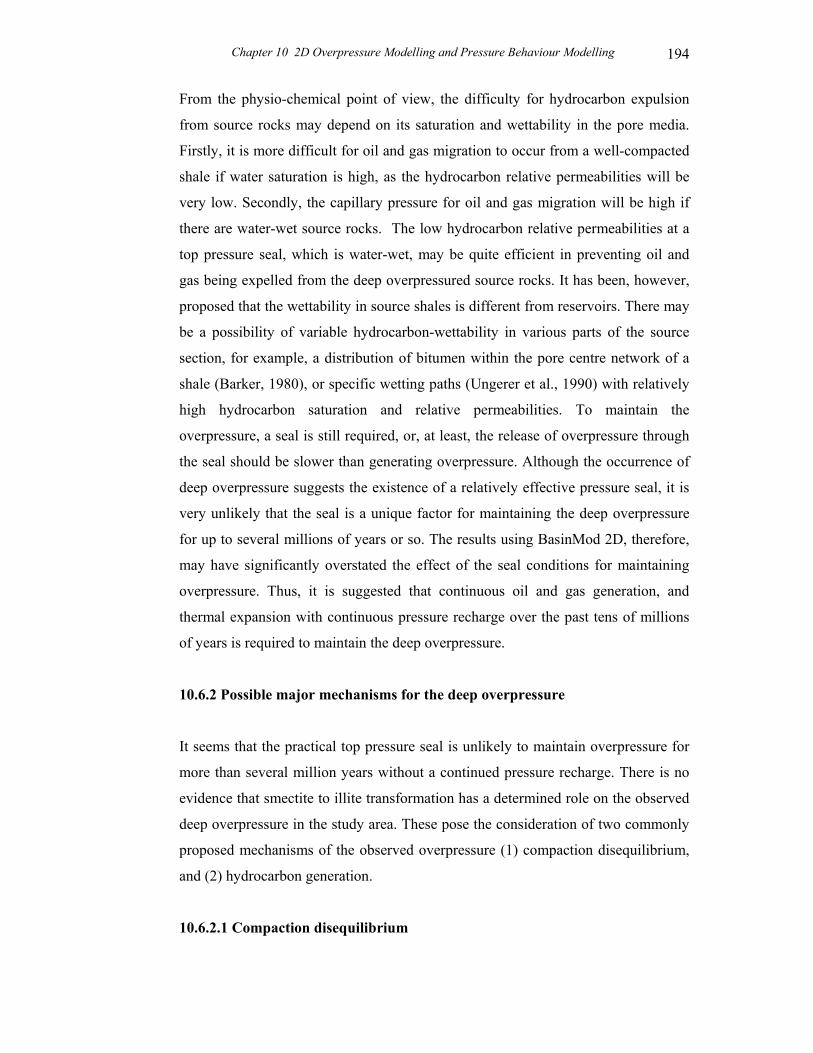
Chapter 10 2D Overpressure Modelling and Pressure Behaviour Modelling 194
From the physio-chemical point of view, the difficulty for hydrocarbon expulsion
from source rocks may depend on its saturation and wettability in the pore media.
Firstly, it is more difficult for oil and gas migration to occur from a well-compacted
shale if water saturation is high, as the hydrocarbon relative permeabilities will be
very low. Secondly, the capillary pressure for oil and gas migration will be high if
there are water-wet source rocks. The low hydrocarbon relative permeabilities at a
top pressure seal, which is water-wet, may be quite efficient in preventing oil and
gas being expelled from the deep overpressured source rocks. It has been, however,
proposed that the wettability in source shales is different from reservoirs. There may
be a possibility of variable hydrocarbon-wettability in various parts of the source
section, for example, a distribution of bitumen within the pore centre network of a
shale (Barker, 1980), or specific wetting paths (Ungerer et al., 1990) with relatively
high hydrocarbon saturation and relative permeabilities. To maintain the
overpressure, a seal is still required, or, at least, the release of overpressure through
the seal should be slower than generating overpressure. Although the occurrence of
deep overpressure suggests the existence of a relatively effective pressure seal, it is
very unlikely that the seal is a unique factor for maintaining the deep overpressure
for up to several millions of years or so. The results using BasinMod 2D, therefore,
may have significantly overstated the effect of the seal conditions for maintaining
overpressure. Thus, it is suggested that continuous oil and gas generation, and
thermal expansion with continuous pressure recharge over the past tens of millions
of years is required to maintain the deep overpressure.
10.6.2 Possible major mechanisms for the deep overpressure
It seems that the practical top pressure seal is unlikely to maintain overpressure for
more than several million years without a continued pressure recharge. There is no
evidence that smectite to illite transformation has a determined role on the observed
deep overpressure in the study area. These pose the consideration of two commonly
proposed mechanisms of the observed overpressure (1) compaction disequilibrium,
and (2) hydrocarbon generation.
10.6.2.1 Compaction disequilibrium
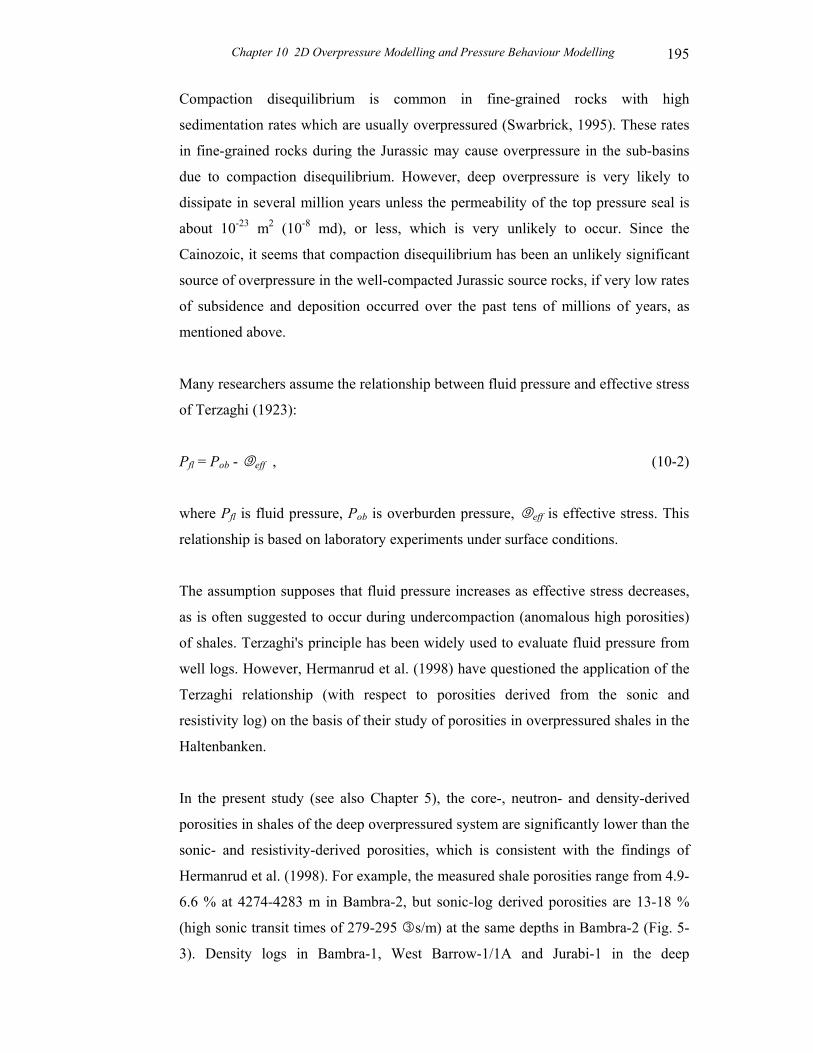
Chapter 10 2D Overpressure Modelling and Pressure Behaviour Modelling 195
Compaction disequilibrium is common in fine-grained rocks with high
sedimentation rates which are usually overpressured (Swarbrick, 1995). These rates
in fine-grained rocks during the Jurassic may cause overpressure in the sub-basins
due to compaction disequilibrium. However, deep overpressure is very likely to
dissipate in several million years unless the permeability of the top pressure seal is
about 10-23 m2 (10-8 md), or less, which is very unlikely to occur. Since the
Cainozoic, it seems that compaction disequilibrium has been an unlikely significant
source of overpressure in the well-compacted Jurassic source rocks, if very low rates
of subsidence and deposition occurred over the past tens of millions of years, as
mentioned above.
Many researchers assume the relationship between fluid pressure and effective stress
of Terzaghi (1923):
Pfl = Pob - 9eff , (10-2)
where Pfl is fluid pressure, Pob is overburden pressure, 9eff is effective stress. This
relationship is based on laboratory experiments under surface conditions.
The assumption supposes that fluid pressure increases as effective stress decreases,
as is often suggested to occur during undercompaction (anomalous high porosities)
of shales. Terzaghi's principle has been widely used to evaluate fluid pressure from
well logs. However, Hermanrud et al. (1998) have questioned the application of the
Terzaghi relationship (with respect to porosities derived from the sonic and
resistivity log) on the basis of their study of porosities in overpressured shales in the
Haltenbanken.
In the present study (see also Chapter 5), the core-, neutron- and density-derived
porosities in shales of the deep overpressured system are significantly lower than the
sonic- and resistivity-derived porosities, which is consistent with the findings of
Hermanrud et al. (1998). For example, the measured shale porosities range from 4.9-
6.6 % at 4274-4283 m in Bambra-2, but sonic-log derived porosities are 13-18 %
(high sonic transit times of 279-295 3s/m) at the same depths in Bambra-2 (Fig. 5-
3). Density logs in Bambra-1, West Barrow-1/1A and Jurabi-1 in the deep
Chapter 10 2D Overpressure Modelling and Pressure Behaviour Modelling 196
overpressured system do not exhibit any porosity anomaly (Figures 5-2, 5-4 and 5-
6). These suggest that the sonic-log and resistivity-log data may not be consistent
with abnormally high porosities expected in the overpressured source rocks. In turn,
this suggests that the present day deep overpressure is not associated with a
significant porosity anomaly due to compaction disequilibrium in the fine-grained
rocks. The maintenance of the overpressure in the Jurassic source rocks to the
present-day, therefore, requires that a mechanism other than compaction
disequilibrium be sought to explain the deep overpressures in the sub-basins.
10.6.2.2 Hydrocarbon generation
On the basis of this study, one has to consider that the major causes for pressure
recharge to maintain the deep overpressures are hydrocarbon generation in the
Cainozoic after the thick Jurassic shales and siltstones had been compacted and most
of the porosity in the Jurassic sequence had been lost through compaction. In fact,
the deep overpressured system in the Barrow Sub-basin, interpreted by the sonic-
log, resistivity-log and the measured pressure data, is in agreement with the
observed zone of organic maturity of 0.8-2.0 % Ro (vitrinite reflectance) and an
increased volume of gas-generating organic matter. The boundary between the
pressure transition zone and the overpressured compartment (bottom of top pressure
seal) is consistent with a maturity of about 1 % Ro. Ro at the top of the deep
overpressured zone is about 1 % in Dampier-1 of the Dampier Sub-basin and also
about 1 % in Jurabi-1 of the Exmouth Sub-basin. This may be why the deep
overpressured zone frequently appears to have a planar top in a basin. The depth of
the planar top seems to be associated with the upper part of the hydrocarbon
generation zone with the thermal maturity range of about 0.8-1 %. It is proposed that
if an effective pressure seal exists it can only maintain the overpressure for several
million years at best, while continuous hydrocarbon generation, especially gas
generation and thermal expansion, for a pressure recharge over the past several tens
of millions of years is very likely to be the major cause of maintenance of the deep
overpressure. As hydrocarbon generation and charge in the Jurassic source rocks is
believed to have occurred since the Cainozoic, it is not inconceivable that an
overpressure regime has been maintained since that time.
Chapter 10 2D Overpressure Modelling and Pressure Behaviour Modelling 197
10.7 Summary
This study and modelling has shown several possible ways of interpreting the
observed abnormal fluid pressures in the sub-basins. The BasinMod 2D basin
modelling has suggested a maintained pressure cell in the Jurassic sequence since
the Cainozoic. This modelling may inadvertently support some unrealistic
petrophysical parameters, and computational assumptions. Nevertheless, the
modelled overpressure distribution at present-day is fairly consistent with the
observed data. The pressure seal that appears to be present in the Barrow Sub-basin
clearly suggests that the observed overpressure can be only maintained by the top
pressure seal for several million years at best, unless extremely low permeabilities
(10-23 m2 or less) occur for a thousand meters in the Jurassic shaley sequences of the
sub-basins.
The modelled results using the BasinMod 2D software suggest the following
observations:
(1) The rapid sedimentation rates in fine-grained rocks during the basin subsidence
of the Jurassic, resulting in compaction disequilibrium, are likely to be a
mechanism for generating overpressure.
(2) The pressure seal, including top and bottom low-permeability rocks and lateral
sealed faults, is one of the major controls on the deep overpressured
compartments in the Jurassic shaley sequence since the Cainozoic.
(3) Quartz cementation may be a significant factor in forming a low-permeability
rock layer for a top pressure seal.
(4) Thermal expansion of pore fluids makes a 5-10 % contribution to the maximum
excess pressure in the studied case, and the generated pressure of hydrocarbon
generation makes a less than 2 % contribution to the maximum excess pressure
in the sub-basins.
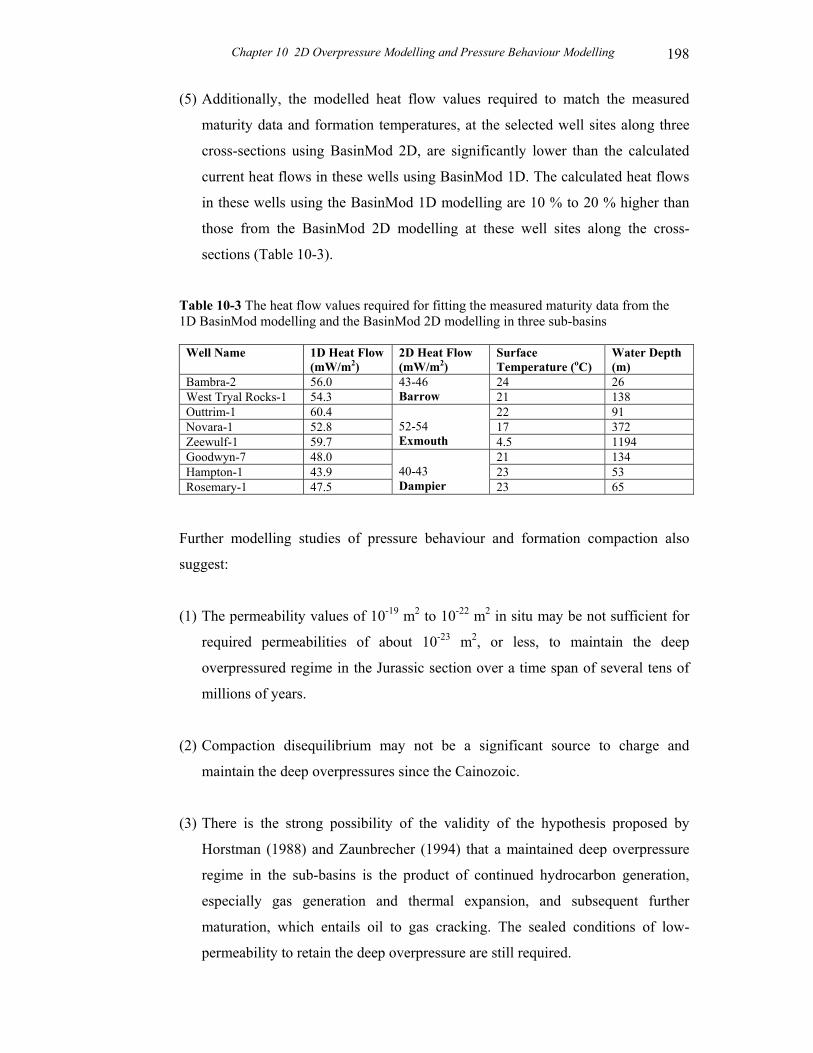
Chapter 10 2D Overpressure Modelling and Pressure Behaviour Modelling 198
(5) Additionally, the modelled heat flow values required to match the measured
maturity data and formation temperatures, at the selected well sites along three
cross-sections using BasinMod 2D, are significantly lower than the calculated
current heat flows in these wells using BasinMod 1D. The calculated heat flows
in these wells using the BasinMod 1D modelling are 10 % to 20 % higher than
those from the BasinMod 2D modelling at these well sites along the cross-
sections (Table 10-3).
Table 10-3 The heat flow values required for fitting the measured maturity data from the 1D BasinMod modelling and the BasinMod 2D modelling in three sub-basins
Well Name 1D Heat Flow (mW/m2)
2D Heat Flow (mW/m2)
Surface Temperature (oC)
Water Depth (m)
Bambra-2 56.0 24 26 West Tryal Rocks-1 54.3
43-46 Barrow 21 138
Outtrim-1 60.4 22 91 Novara-1 52.8 17 372 Zeewulf-1 59.7
52-54 Exmouth 4.5 1194
Goodwyn-7 48.0 21 134 Hampton-1 43.9 23 53 Rosemary-1 47.5
40-43 Dampier 23 65
Further modelling studies of pressure behaviour and formation compaction also
suggest:
(1) The permeability values of 10-19 m2 to 10-22 m2 in situ may be not sufficient for
required permeabilities of about 10-23 m2, or less, to maintain the deep
overpressured regime in the Jurassic section over a time span of several tens of
millions of years.
(2) Compaction disequilibrium may not be a significant source to charge and
maintain the deep overpressures since the Cainozoic.
(3) There is the strong possibility of the validity of the hypothesis proposed by
Horstman (1988) and Zaunbrecher (1994) that a maintained deep overpressure
regime in the sub-basins is the product of continued hydrocarbon generation,
especially gas generation and thermal expansion, and subsequent further
maturation, which entails oil to gas cracking. The sealed conditions of low-
permeability to retain the deep overpressure are still required.
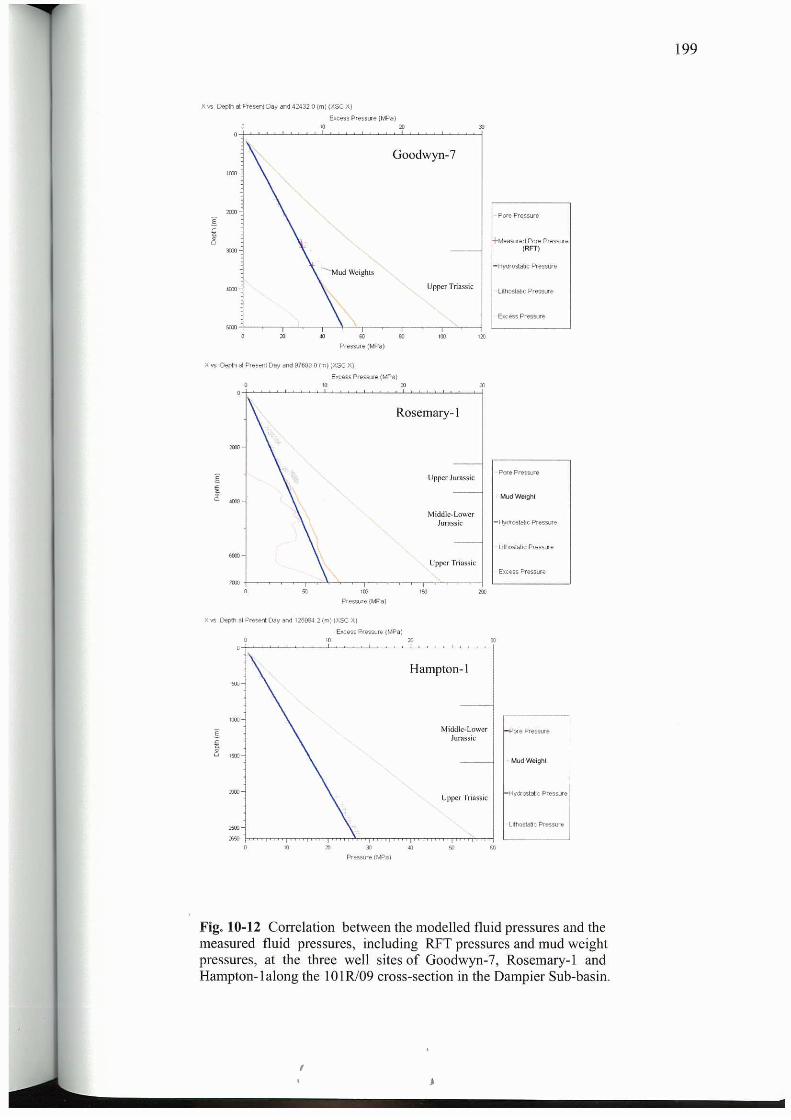
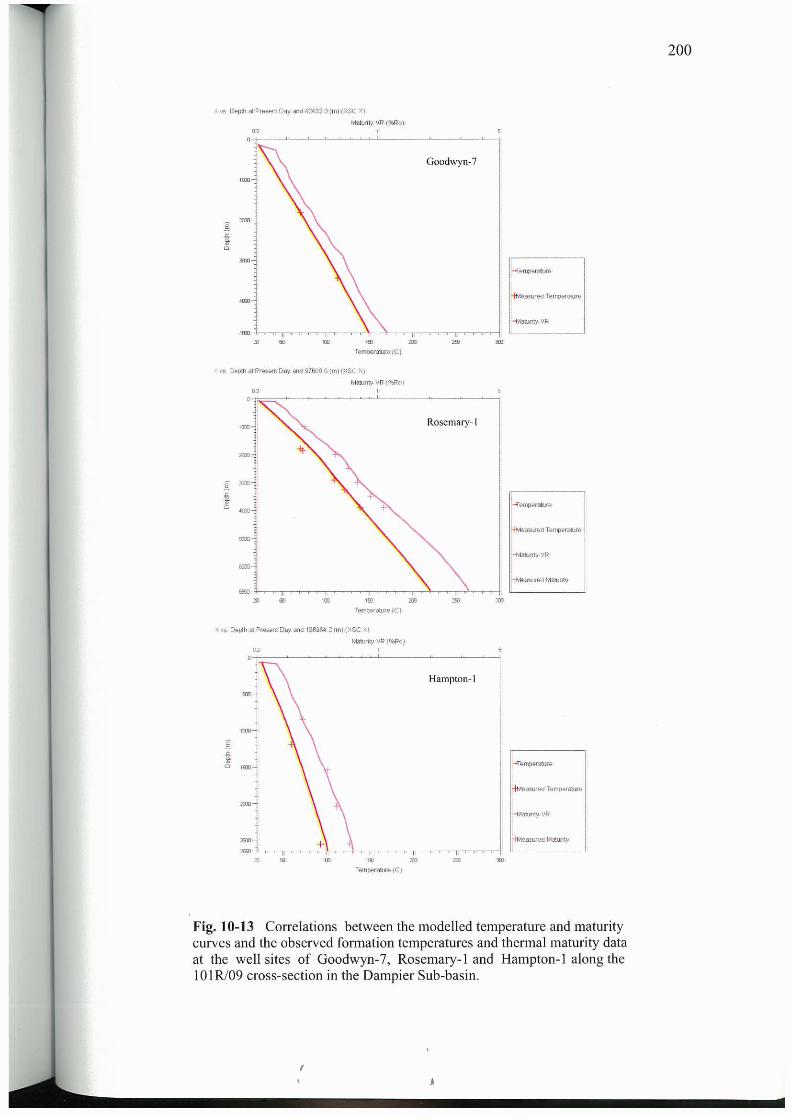
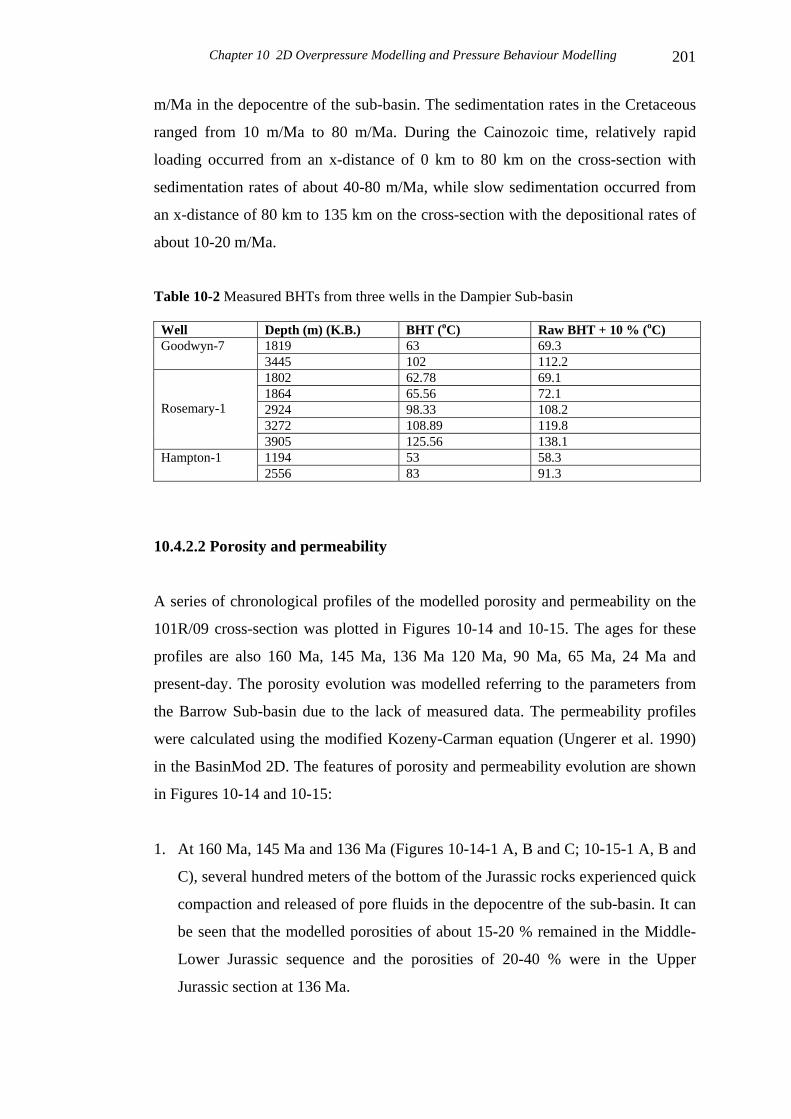
Chapter 10 2D Overpressure Modelling and Pressure Behaviour Modelling 201
m/Ma in the depocentre of the sub-basin. The sedimentation rates in the Cretaceous
ranged from 10 m/Ma to 80 m/Ma. During the Cainozoic time, relatively rapid
loading occurred from an x-distance of 0 km to 80 km on the cross-section with
sedimentation rates of about 40-80 m/Ma, while slow sedimentation occurred from
an x-distance of 80 km to 135 km on the cross-section with the depositional rates of
about 10-20 m/Ma.
Table 10-2 Measured BHTs from three wells in the Dampier Sub-basin
Well Depth (m) (K.B.) BHT (oC) Raw BHT + 10 % (oC) 1819 63 69.3 Goodwyn-7 3445 102 112.2 1802 62.78 69.1 1864 65.56 72.1 2924 98.33 108.2 3272 108.89 119.8
Rosemary-1
3905 125.56 138.1 1194 53 58.3 Hampton-1 2556 83 91.3
10.4.2.2 Porosity and permeability
A series of chronological profiles of the modelled porosity and permeability on the
101R/09 cross-section was plotted in Figures 10-14 and 10-15. The ages for these
profiles are also 160 Ma, 145 Ma, 136 Ma 120 Ma, 90 Ma, 65 Ma, 24 Ma and
present-day. The porosity evolution was modelled referring to the parameters from
the Barrow Sub-basin due to the lack of measured data. The permeability profiles
were calculated using the modified Kozeny-Carman equation (Ungerer et al. 1990)
in the BasinMod 2D. The features of porosity and permeability evolution are shown
in Figures 10-14 and 10-15:
1. At 160 Ma, 145 Ma and 136 Ma (Figures 10-14-1 A, B and C; 10-15-1 A, B and
C), several hundred meters of the bottom of the Jurassic rocks experienced quick
compaction and released of pore fluids in the depocentre of the sub-basin. It can
be seen that the modelled porosities of about 15-20 % remained in the Middle-
Lower Jurassic sequence and the porosities of 20-40 % were in the Upper
Jurassic section at 136 Ma.
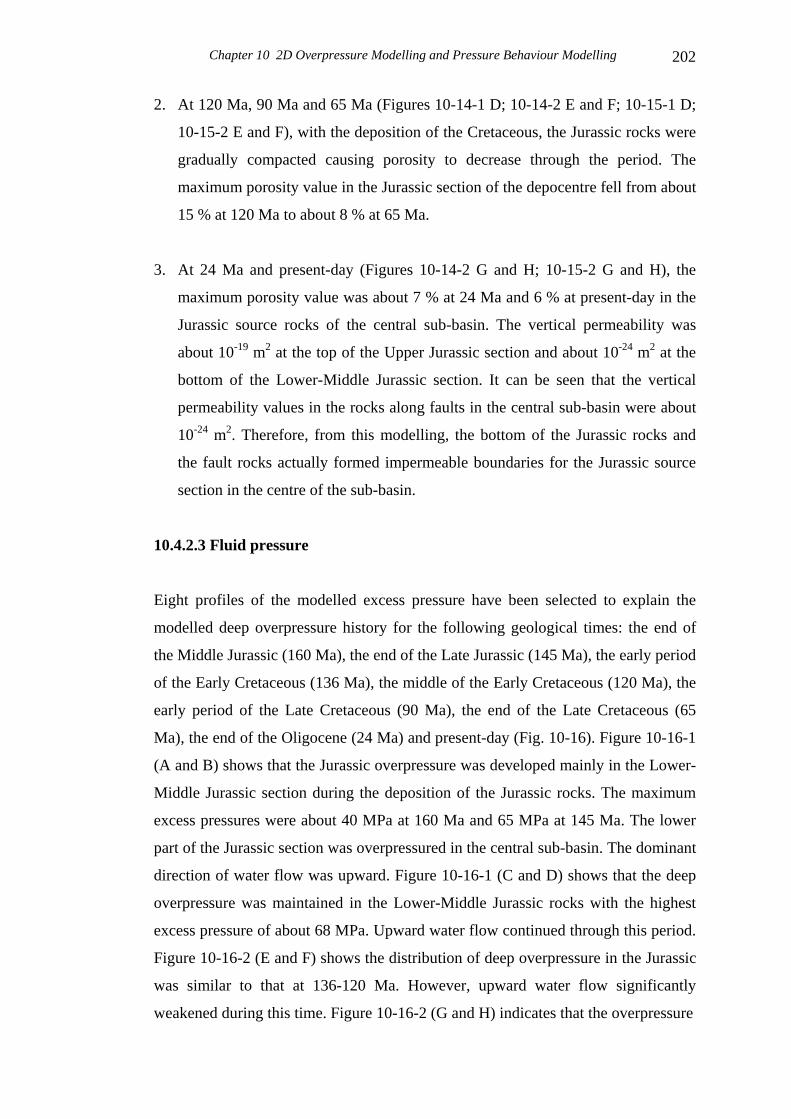
Chapter 10 2D Overpressure Modelling and Pressure Behaviour Modelling 202
2. At 120 Ma, 90 Ma and 65 Ma (Figures 10-14-1 D; 10-14-2 E and F; 10-15-1 D;
10-15-2 E and F), with the deposition of the Cretaceous, the Jurassic rocks were
gradually compacted causing porosity to decrease through the period. The
maximum porosity value in the Jurassic section of the depocentre fell from about
15 % at 120 Ma to about 8 % at 65 Ma.
3. At 24 Ma and present-day (Figures 10-14-2 G and H; 10-15-2 G and H), the
maximum porosity value was about 7 % at 24 Ma and 6 % at present-day in the
Jurassic source rocks of the central sub-basin. The vertical permeability was
about 10-19 m2 at the top of the Upper Jurassic section and about 10-24 m2 at the
bottom of the Lower-Middle Jurassic section. It can be seen that the vertical
permeability values in the rocks along faults in the central sub-basin were about
10-24 m2. Therefore, from this modelling, the bottom of the Jurassic rocks and
the fault rocks actually formed impermeable boundaries for the Jurassic source
section in the centre of the sub-basin.
10.4.2.3 Fluid pressure
Eight profiles of the modelled excess pressure have been selected to explain the
modelled deep overpressure history for the following geological times: the end of
the Middle Jurassic (160 Ma), the end of the Late Jurassic (145 Ma), the early period
of the Early Cretaceous (136 Ma), the middle of the Early Cretaceous (120 Ma), the
early period of the Late Cretaceous (90 Ma), the end of the Late Cretaceous (65
Ma), the end of the Oligocene (24 Ma) and present-day (Fig. 10-16). Figure 10-16-1
(A and B) shows that the Jurassic overpressure was developed mainly in the Lower-
Middle Jurassic section during the deposition of the Jurassic rocks. The maximum
excess pressures were about 40 MPa at 160 Ma and 65 MPa at 145 Ma. The lower
part of the Jurassic section was overpressured in the central sub-basin. The dominant
direction of water flow was upward. Figure 10-16-1 (C and D) shows that the deep
overpressure was maintained in the Lower-Middle Jurassic rocks with the highest
excess pressure of about 68 MPa. Upward water flow continued through this period.
Figure 10-16-2 (E and F) shows the distribution of deep overpressure in the Jurassic
was similar to that at 136-120 Ma. However, upward water flow significantly
weakened during this time. Figure 10-16-2 (G and H) indicates that the overpressure
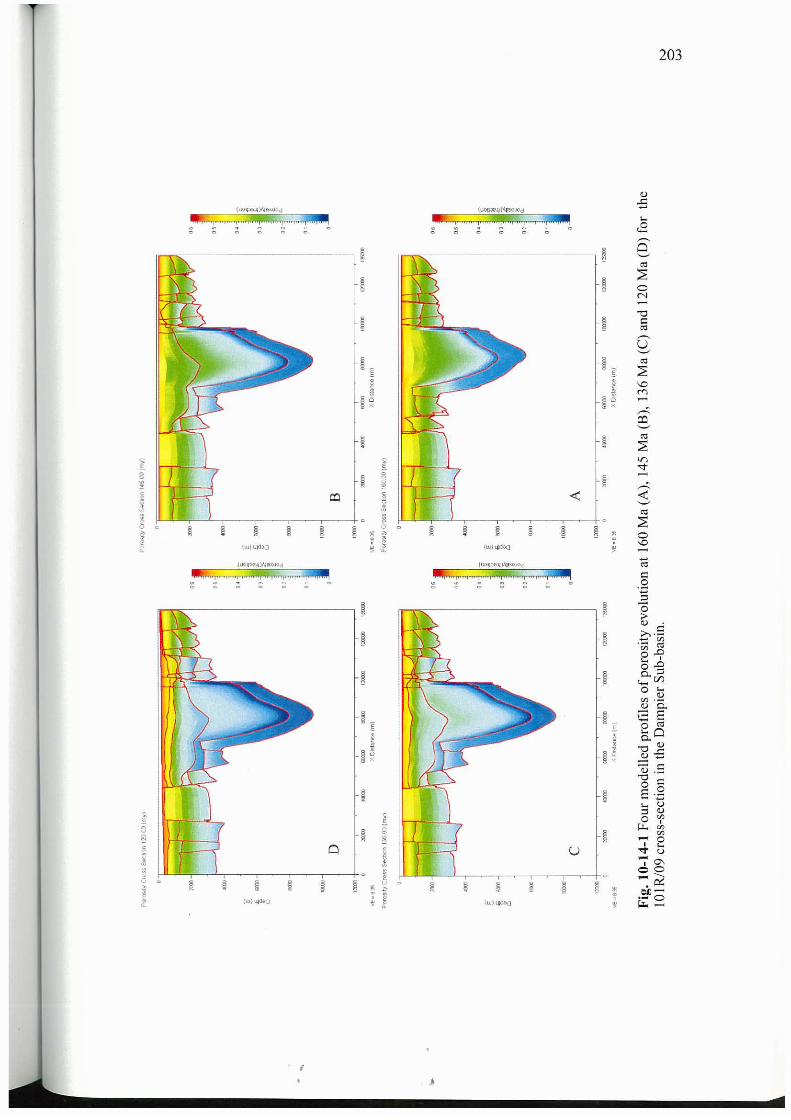
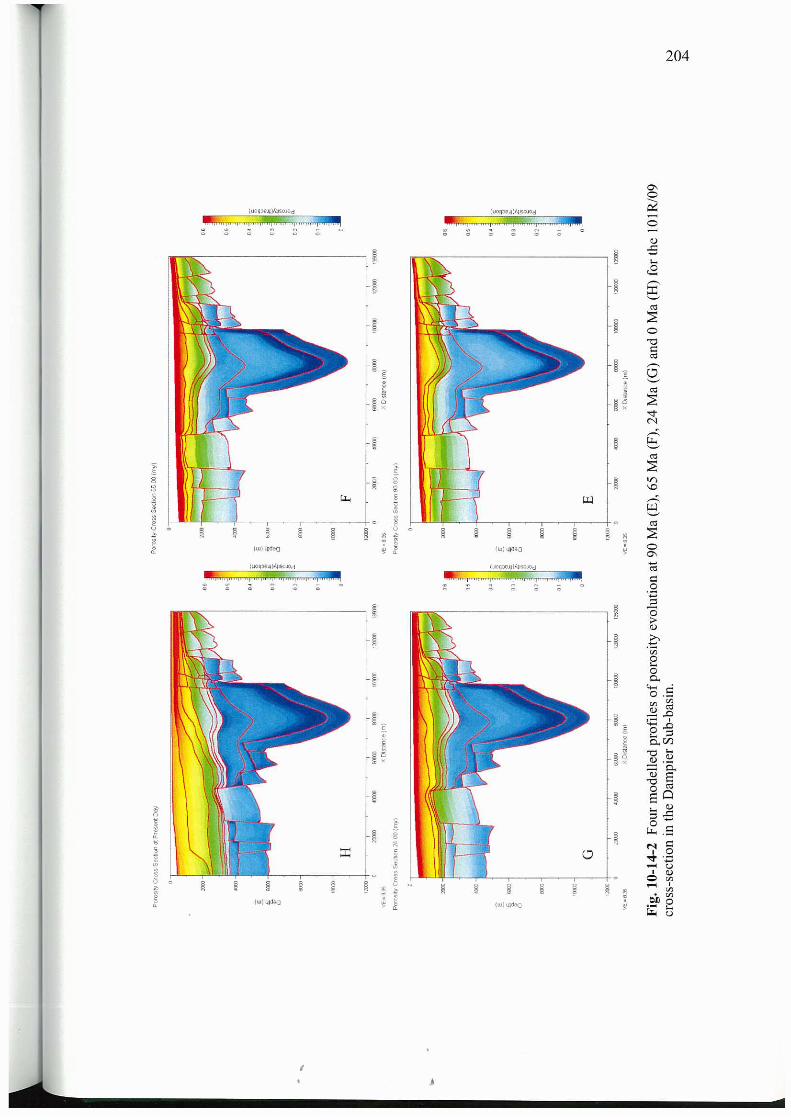
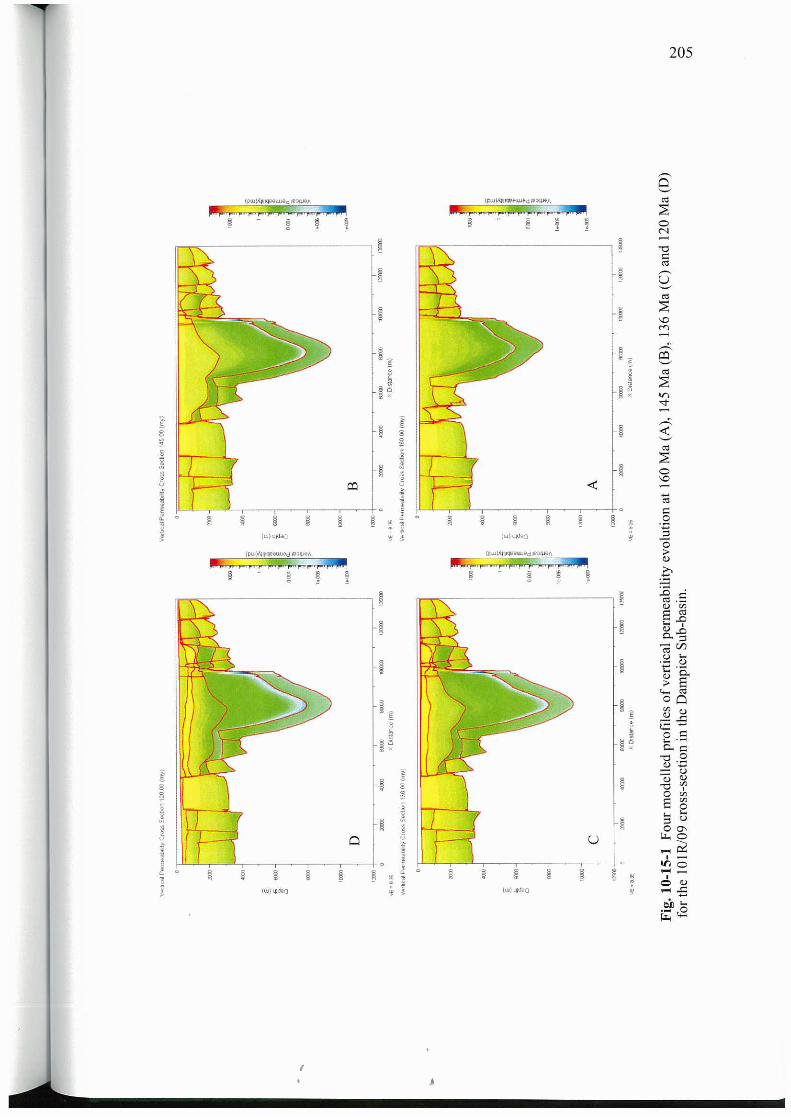
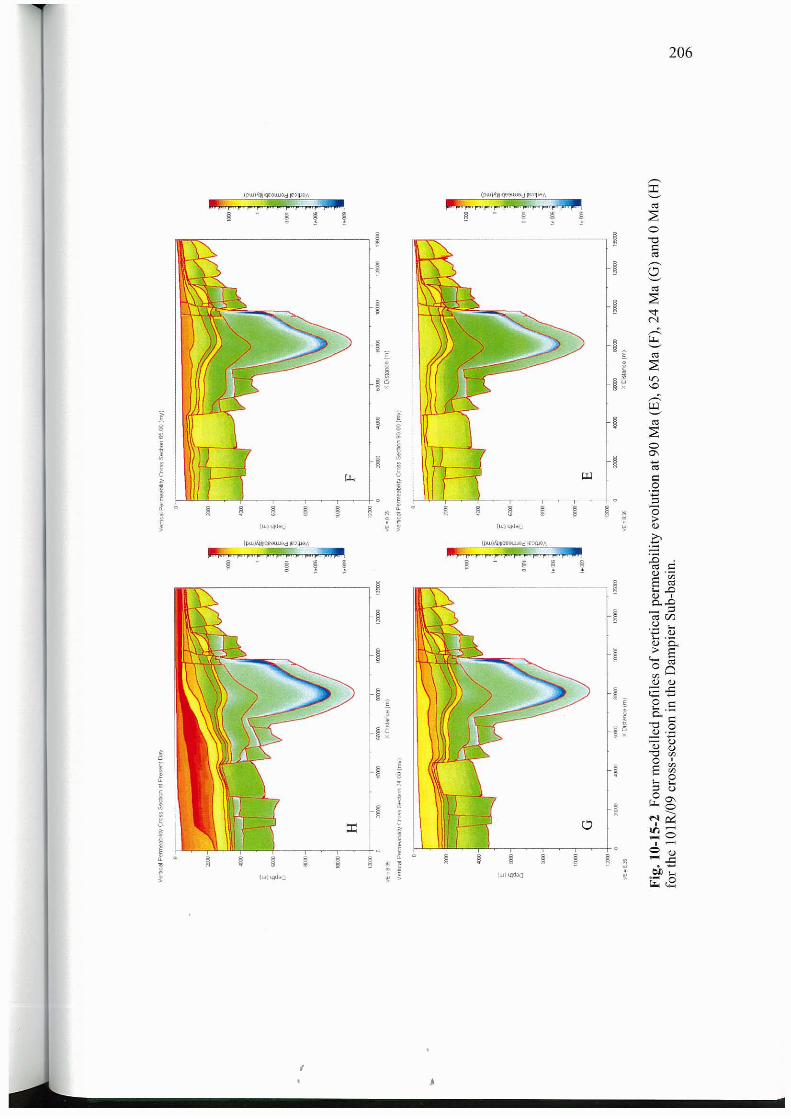
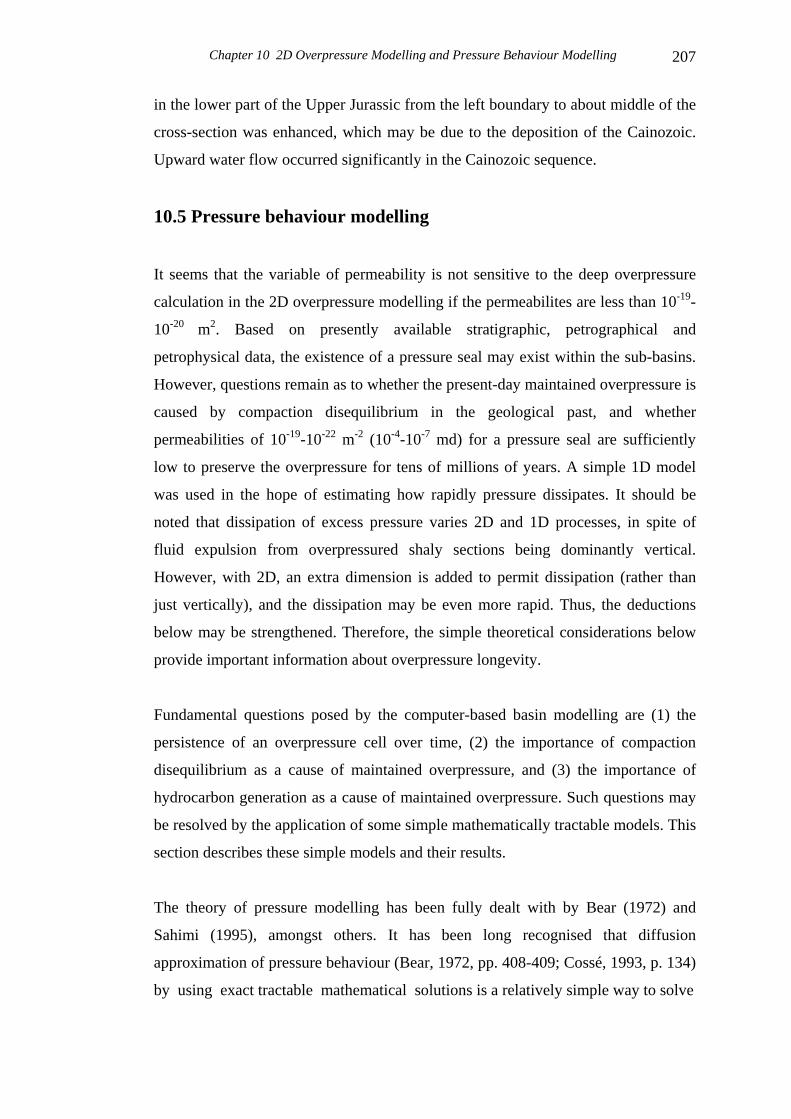
Chapter 10 2D Overpressure Modelling and Pressure Behaviour Modelling 207
in the lower part of the Upper Jurassic from the left boundary to about middle of the
cross-section was enhanced, which may be due to the deposition of the Cainozoic.
Upward water flow occurred significantly in the Cainozoic sequence.
10.5 Pressure behaviour modelling
It seems that the variable of permeability is not sensitive to the deep overpressure
calculation in the 2D overpressure modelling if the permeabilites are less than 10-19-
10-20 m2. Based on presently available stratigraphic, petrographical and
petrophysical data, the existence of a pressure seal may exist within the sub-basins.
However, questions remain as to whether the present-day maintained overpressure is
caused by compaction disequilibrium in the geological past, and whether
permeabilities of 10-19-10-22 m-2 (10-4-10-7 md) for a pressure seal are sufficiently
low to preserve the overpressure for tens of millions of years. A simple 1D model
was used in the hope of estimating how rapidly pressure dissipates. It should be
noted that dissipation of excess pressure varies 2D and 1D processes, in spite of
fluid expulsion from overpressured shaly sections being dominantly vertical.
However, with 2D, an extra dimension is added to permit dissipation (rather than
just vertically), and the dissipation may be even more rapid. Thus, the deductions
below may be strengthened. Therefore, the simple theoretical considerations below
provide important information about overpressure longevity.
Fundamental questions posed by the computer-based basin modelling are (1) the
persistence of an overpressure cell over time, (2) the importance of compaction
disequilibrium as a cause of maintained overpressure, and (3) the importance of
hydrocarbon generation as a cause of maintained overpressure. Such questions may
be resolved by the application of some simple mathematically tractable models. This
section describes these simple models and their results.
The theory of pressure modelling has been fully dealt with by Bear (1972) and
Sahimi (1995), amongst others. It has been long recognised that diffusion
approximation of pressure behaviour (Bear, 1972, pp. 408-409; Cossé, 1993, p. 134)
by using exact tractable mathematical solutions is a relatively simple way to solve
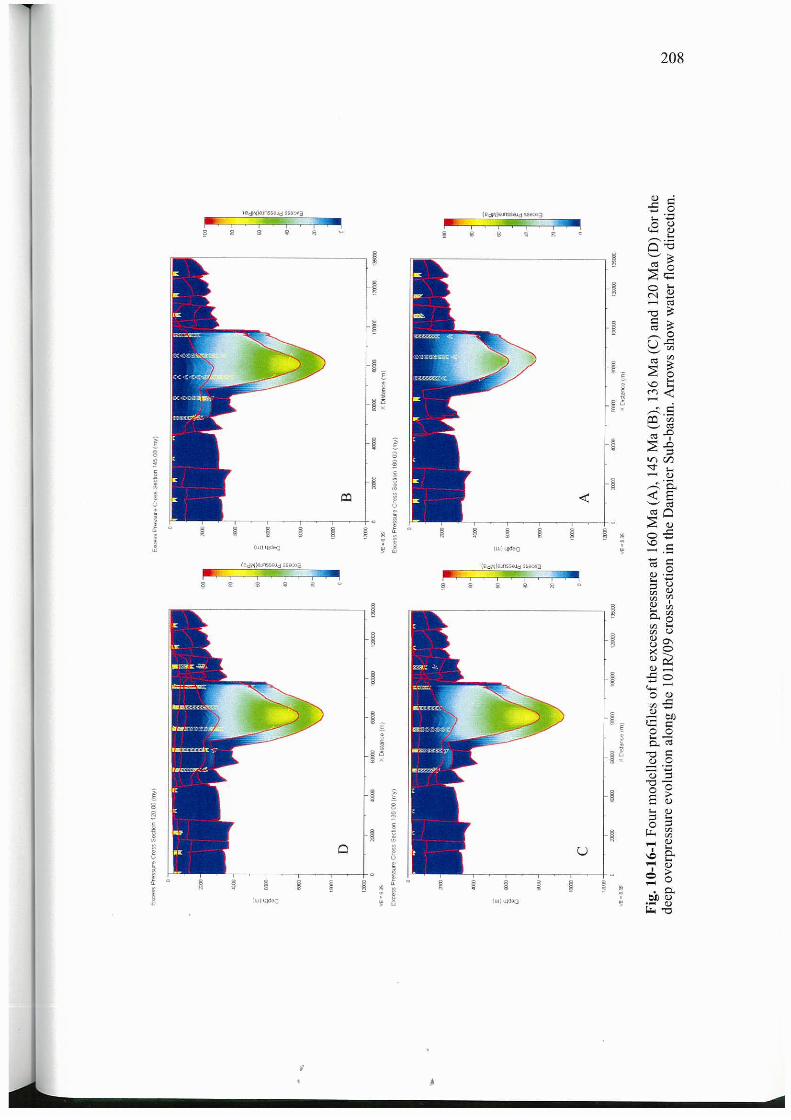
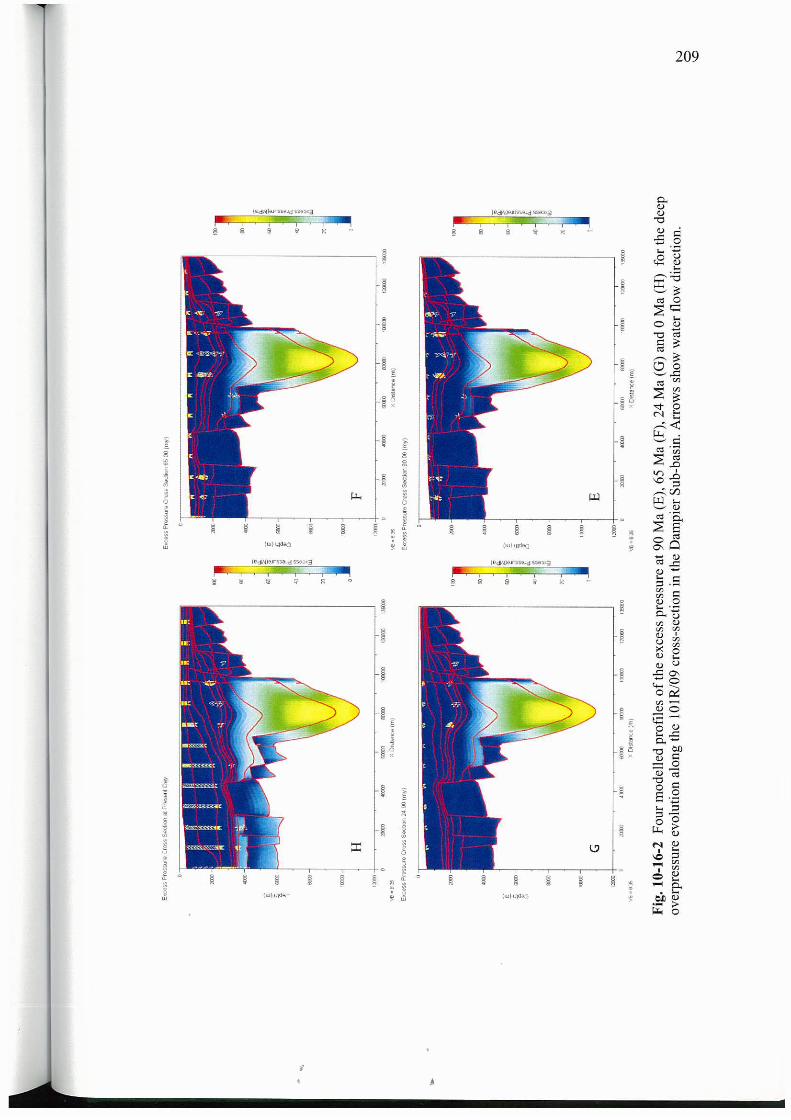
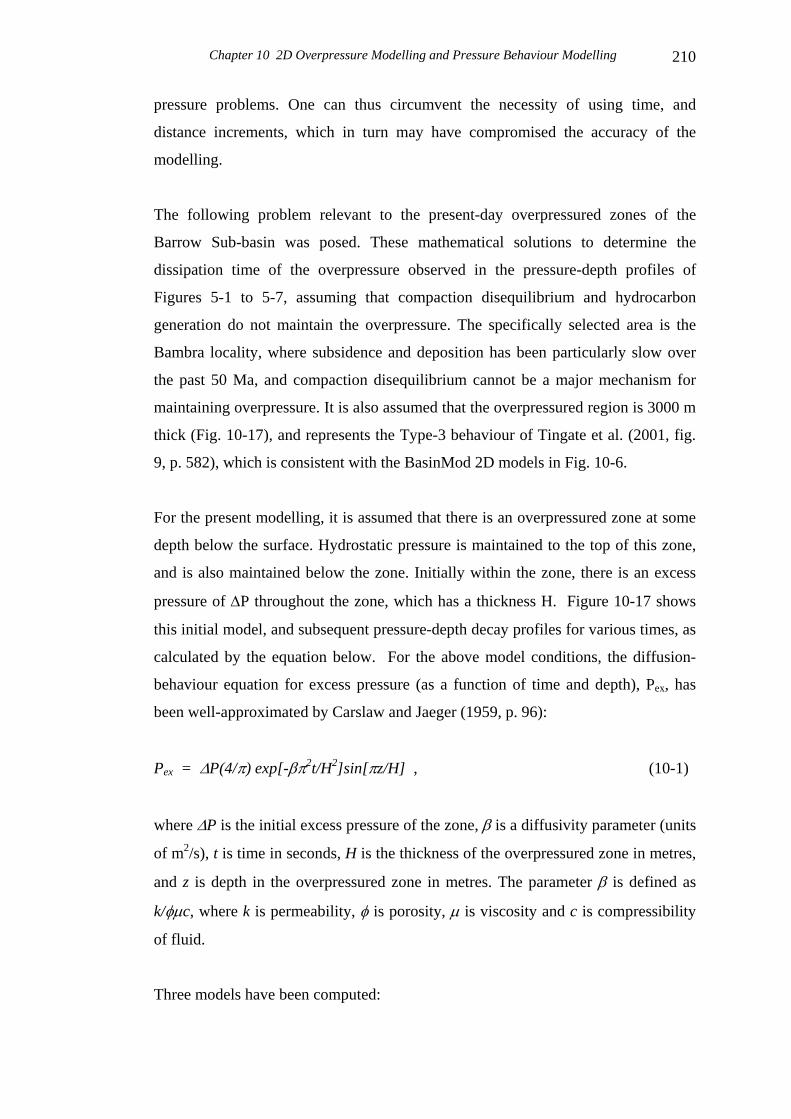
Chapter 10 2D Overpressure Modelling and Pressure Behaviour Modelling
210
pressure problems. One can thus circumvent the necessity of using time, and
distance increments, which in turn may have compromised the accuracy of the
modelling.
The following problem relevant to the present-day overpressured zones of the
Barrow Sub-basin was posed. These mathematical solutions to determine the
dissipation time of the overpressure observed in the pressure-depth profiles of
Figures 5-1 to 5-7, assuming that compaction disequilibrium and hydrocarbon
generation do not maintain the overpressure. The specifically selected area is the
Bambra locality, where subsidence and deposition has been particularly slow over
the past 50 Ma, and compaction disequilibrium cannot be a major mechanism for
maintaining overpressure. It is also assumed that the overpressured region is 3000 m
thick (Fig. 10-17), and represents the Type-3 behaviour of Tingate et al. (2001, fig.
9, p. 582), which is consistent with the BasinMod 2D models in Fig. 10-6.
For the present modelling, it is assumed that there is an overpressured zone at some
depth below the surface. Hydrostatic pressure is maintained to the top of this zone,
and is also maintained below the zone. Initially within the zone, there is an excess
pressure of ΔP throughout the zone, which has a thickness H. Figure 10-17 shows
this initial model, and subsequent pressure-depth decay profiles for various times, as
calculated by the equation below. For the above model conditions, the diffusion-
behaviour equation for excess pressure (as a function of time and depth), Pex, has
been well-approximated by Carslaw and Jaeger (1959, p. 96):
Pex = ΔP(4/π) exp[-βπ2t/H2]sin[πz/H] , (10-1)
where ΔP is the initial excess pressure of the zone, β is a diffusivity parameter (units
of m2/s), t is time in seconds, H is the thickness of the overpressured zone in metres,
and z is depth in the overpressured zone in metres. The parameter β is defined as
k/φμc, where k is permeability, φ is porosity, μ is viscosity and c is compressibility
of fluid.
Three models have been computed:
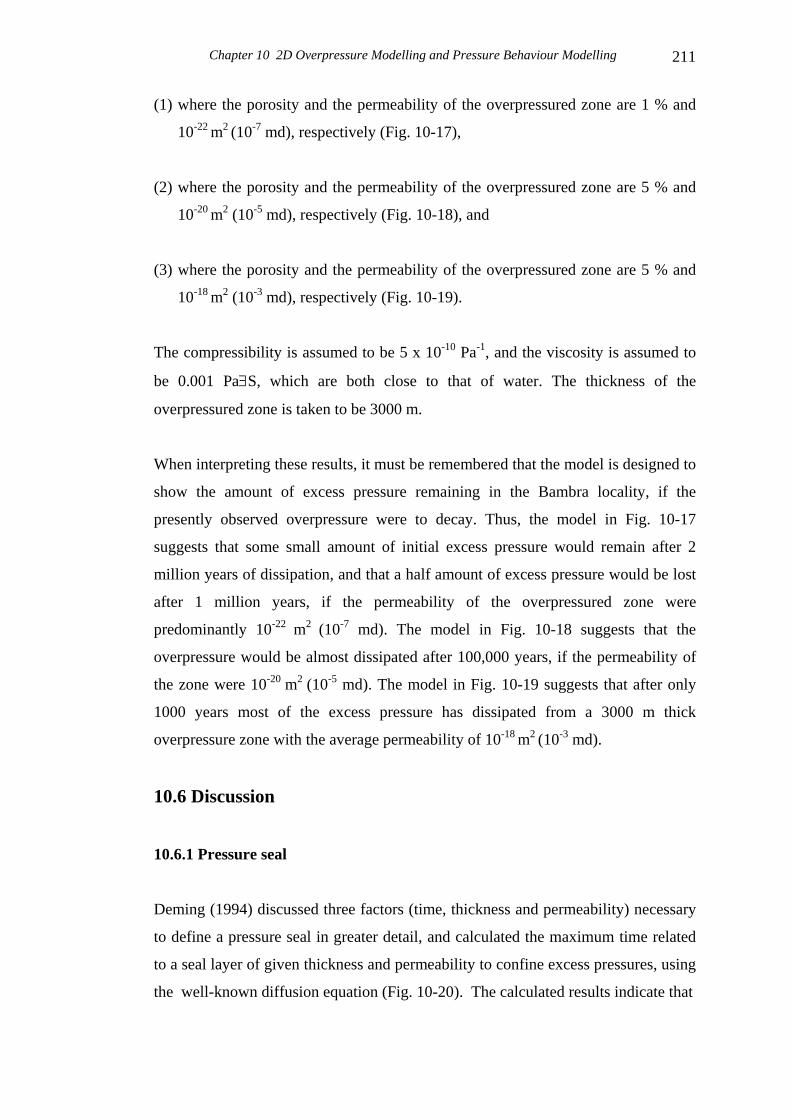
Chapter 10 2D Overpressure Modelling and Pressure Behaviour Modelling
211
(1) where the porosity and the permeability of the overpressured zone are 1 % and
10-22 m2 (10-7 md), respectively (Fig. 10-17),
(2) where the porosity and the permeability of the overpressured zone are 5 % and
10-20 m2 (10-5 md), respectively (Fig. 10-18), and
(3) where the porosity and the permeability of the overpressured zone are 5 % and
10-18 m2 (10-3 md), respectively (Fig. 10-19).
The compressibility is assumed to be 5 x 10⁻¹⁰ Pa-1, and the viscosity is assumed to
be 0.001 Pa∃S, which are both close to that of water. The thickness of the
overpressured zone is taken to be 3000 m.
When interpreting these results, it must be remembered that the model is designed to
show the amount of excess pressure remaining in the Bambra locality, if the
presently observed overpressure were to decay. Thus, the model in Fig. 10-17
suggests that some small amount of initial excess pressure would remain after 2
million years of dissipation, and that a half amount of excess pressure would be lost
after 1 million years, if the permeability of the overpressured zone were
predominantly 10-22 m2 (10-7 md). The model in Fig. 10-18 suggests that the
overpressure would be almost dissipated after 100,000 years, if the permeability of
the zone were 10-20 m2 (10-5 md). The model in Fig. 10-19 suggests that after only
1000 years most of the excess pressure has dissipated from a 3000 m thick
overpressure zone with the average permeability of 10-18 m2 (10-3 md).
10.6 Discussion
10.6.1 Pressure seal
Deming (1994) discussed three factors (time, thickness and permeability) necessary
to define a pressure seal in greater detail, and calculated the maximum time related
to a seal layer of given thickness and permeability to confine excess pressures, using
the well-known diffusion equation (Fig. 10-20). The calculated results indicate that
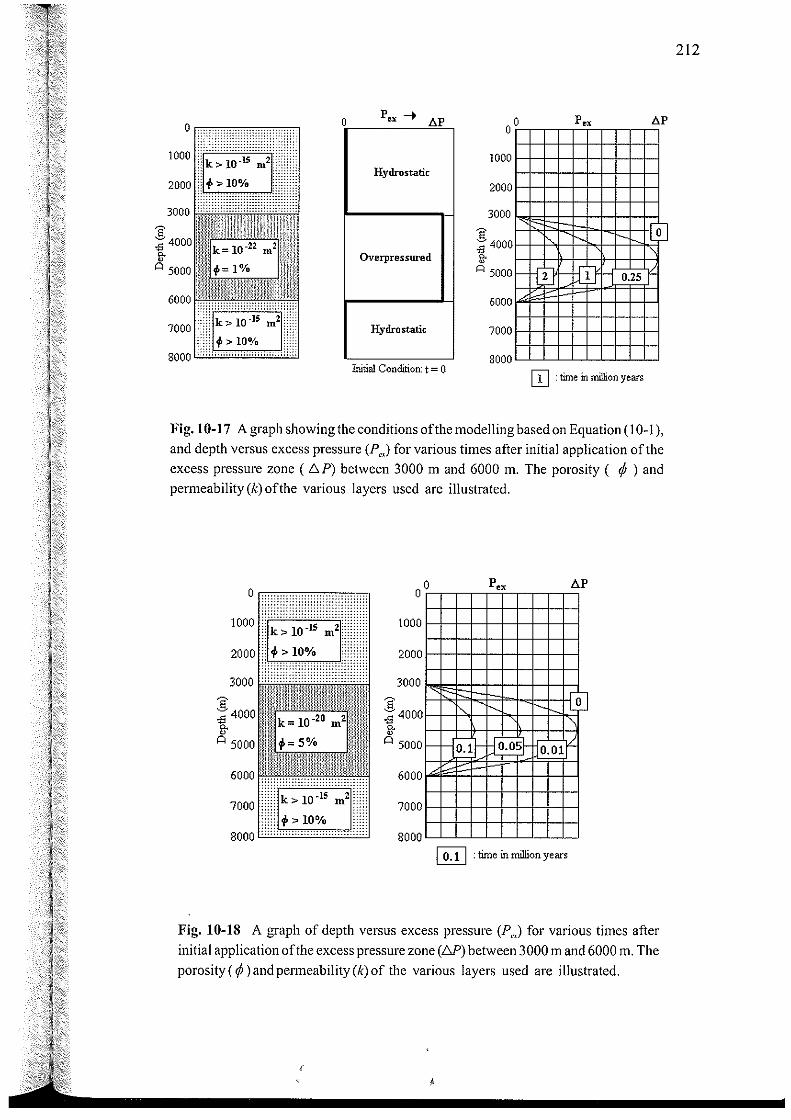
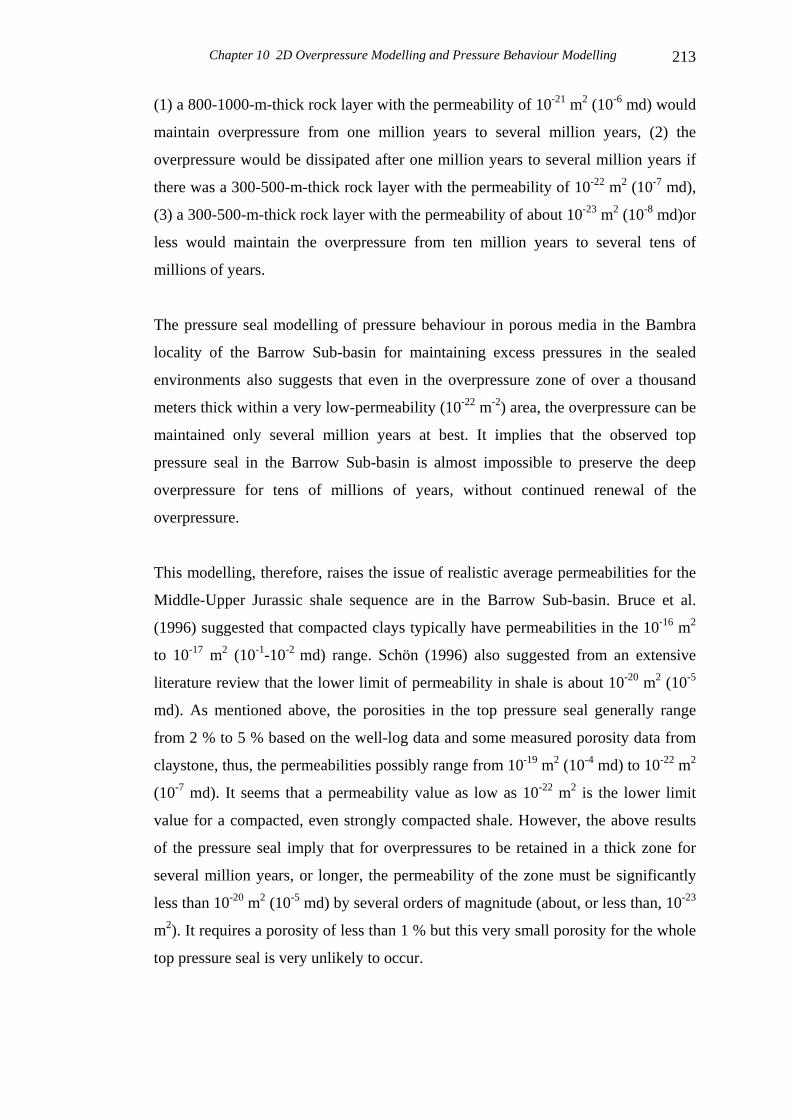
Chapter 10 2D Overpressure Modelling and Pressure Behaviour Modelling
213
(1) a 800-1000-m-thick rock layer with the permeability of 10-21 m2 (10-6 md) would
maintain overpressure from one million years to several million years, (2) the
overpressure would be dissipated after one million years to several million years if
there was a 300-500-m-thick rock layer with the permeability of 10-22 m2 (10-7 md),
(3) a 300-500-m-thick rock layer with the permeability of about 10-23 m2 (10-8 md)or
less would maintain the overpressure from ten million years to several tens of
millions of years.
The pressure seal modelling of pressure behaviour in porous media in the Bambra
locality of the Barrow Sub-basin for maintaining excess pressures in the sealed
environments also suggests that even in the overpressure zone of over a thousand
meters thick within a very low-permeability (10-22 m-2) area, the overpressure can be
maintained only several million years at best. It implies that the observed top
pressure seal in the Barrow Sub-basin is almost impossible to preserve the deep
overpressure for tens of millions of years, without continued renewal of the
overpressure.
This modelling, therefore, raises the issue of realistic average permeabilities for the
Middle-Upper Jurassic shale sequence are in the Barrow Sub-basin. Bruce et al.
(1996) suggested that compacted clays typically have permeabilities in the 10-16 m2
to 10-17 m2 (10-1-10-2 md) range. Schön (1996) also suggested from an extensive
literature review that the lower limit of permeability in shale is about 10-20 m2 (10-5
md). As mentioned above, the porosities in the top pressure seal generally range
from 2 % to 5 % based on the well-log data and some measured porosity data from
claystone, thus, the permeabilities possibly range from 10-19 m2 (10-4 md) to 10-22 m2
(10-7 md). It seems that a permeability value as low as 10-22 m2 is the lower limit
value for a compacted, even strongly compacted shale. However, the above results
of the pressure seal imply that for overpressures to be retained in a thick zone for
several million years, or longer, the permeability of the zone must be significantly
less than 10-20 m2 (10-5 md) by several orders of magnitude (about, or less than, 10-23
m2). It requires a porosity of less than 1 % but this very small porosity for the whole
top pressure seal is very unlikely to occur.
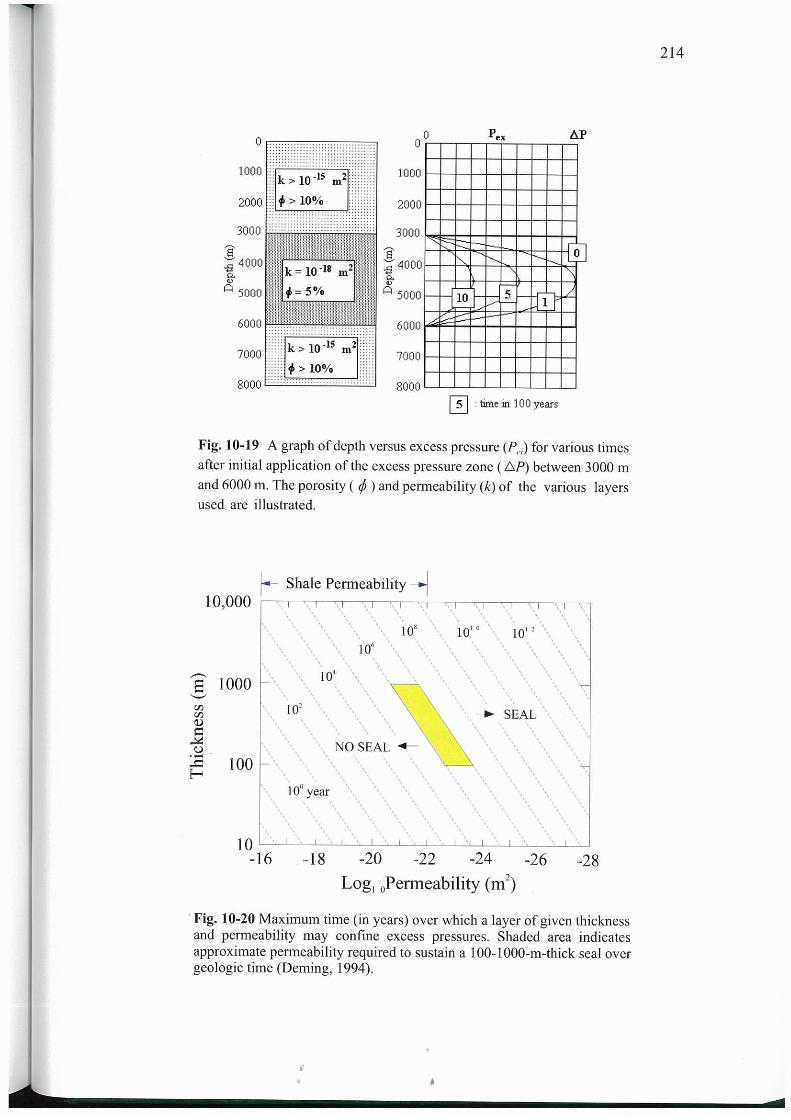
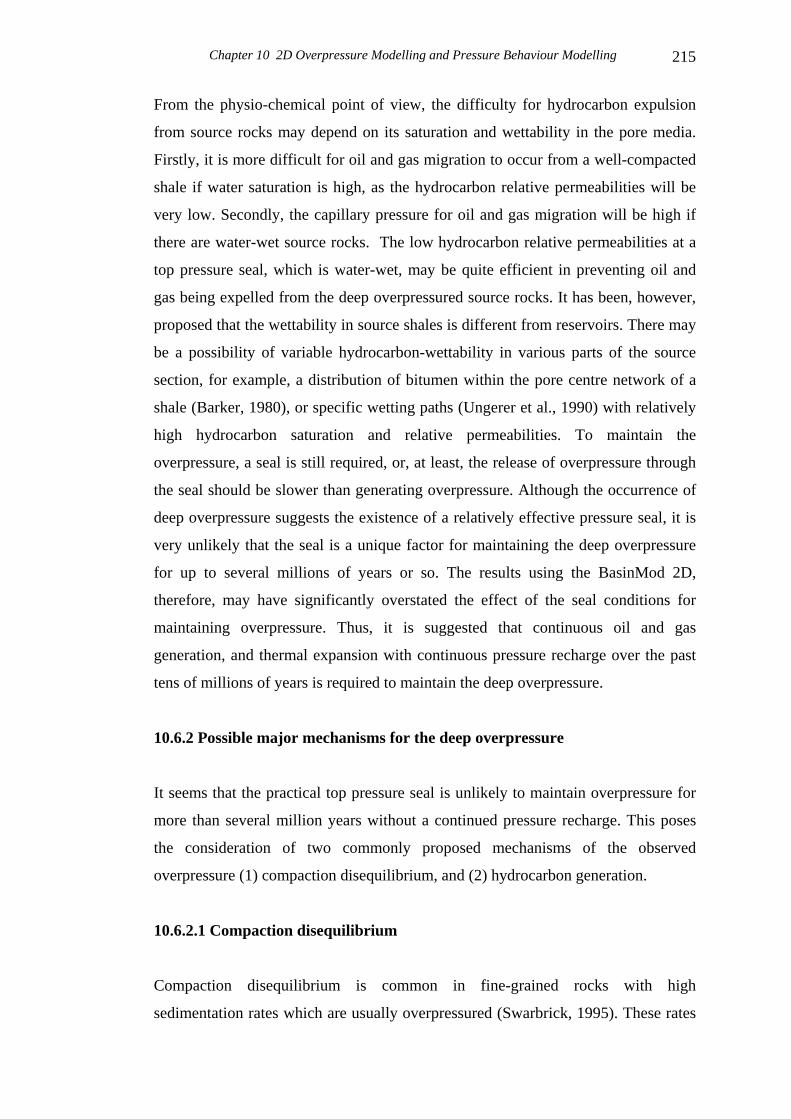
Chapter 10 2D Overpressure Modelling and Pressure Behaviour Modelling
215
From the physio-chemical point of view, the difficulty for hydrocarbon expulsion
from source rocks may depend on its saturation and wettability in the pore media.
Firstly, it is more difficult for oil and gas migration to occur from a well-compacted
shale if water saturation is high, as the hydrocarbon relative permeabilities will be
very low. Secondly, the capillary pressure for oil and gas migration will be high if
there are water-wet source rocks. The low hydrocarbon relative permeabilities at a
top pressure seal, which is water-wet, may be quite efficient in preventing oil and
gas being expelled from the deep overpressured source rocks. It has been, however,
proposed that the wettability in source shales is different from reservoirs. There may
be a possibility of variable hydrocarbon-wettability in various parts of the source
section, for example, a distribution of bitumen within the pore centre network of a
shale (Barker, 1980), or specific wetting paths (Ungerer et al., 1990) with relatively
high hydrocarbon saturation and relative permeabilities. To maintain the
overpressure, a seal is still required, or, at least, the release of overpressure through
the seal should be slower than generating overpressure. Although the occurrence of
deep overpressure suggests the existence of a relatively effective pressure seal, it is
very unlikely that the seal is a unique factor for maintaining the deep overpressure
for up to several millions of years or so. The results using the BasinMod 2D,
therefore, may have significantly overstated the effect of the seal conditions for
maintaining overpressure. Thus, it is suggested that continuous oil and gas
generation, and thermal expansion with continuous pressure recharge over the past
tens of millions of years is required to maintain the deep overpressure.
10.6.2 Possible major mechanisms for the deep overpressure
It seems that the practical top pressure seal is unlikely to maintain overpressure for
more than several million years without a continued pressure recharge. This poses
the consideration of two commonly proposed mechanisms of the observed
overpressure (1) compaction disequilibrium, and (2) hydrocarbon generation.
10.6.2.1 Compaction disequilibrium
Compaction disequilibrium is common in fine-grained rocks with high
sedimentation rates which are usually overpressured (Swarbrick, 1995). These rates
Chapter 10 2D Overpressure Modelling and Pressure Behaviour Modelling
216
in fine-grained rocks during the Jurassic may wide cause overpressure in the sub-
basins due to compaction disequilibrium. However, deep overpressure is very likely
to dissipate in several million years only if the permeability of the top pressure seal
is about 10-23 m2 (10-8 md), or less, which is very unlikely to occur. Since the
Cainozoic, it seems that the compaction disequilibrium has been an unlikely
significant source of overpressure in the well-compacted Jurassic source rocks, if
very low rates of subsidence and deposition occurred over the past tens of millions
of years, as mentioned above.
Many researchers assume the relationship between fluid pressure and effective stress
of Terzaghi (1923):
Pfl = Pob - 9eff , (10-2)
where Pfl is fluid pressure, Pob is overburden pressure, 9eff is effective stress. This
relationship is based on laboratory experiments under surface conditions.
The assumption supposes that fluid pressure increases as effective stress decreases,
as often suggested to occur during undercompaction (anomalous high porosities) of
shales. Terzaghi's principle has been widely used to evaluate fluid pressure from
well logs. However, Hermanrud et al. (1998) have questioned the application of the
Terzaghi relationship (with respect to porosities derived from the sonic and
resistivity log) on the basis of their study of porosities in overpressured shales in the
Haltenbanken.
In the present study (see also Chapter 5), the core-, neutron- and density-derived
porosities in shales of the deep overpressured system are significantly lower than the
sonic- and resistivity-derived porosities, which is consistent with the findings of
Hermanrud et al. (1998). For example, the measured shale porosities range from 4.9-
6.6 % at 4274-4283 m in Bambra-2, but sonic-log derived porosities are 13-18 %
(high sonic transit times of 279-295 3s/m) at the same depths of Bambra-2 (Fig. 5-
3). Density-logs in Bambra-1, West Barrow-1/1A and Jurabi-1 in the deep
overpressured system do not exhibit any porosity anomaly (Figures 5-2, 5-4 and 5-
6). These suggest that the sonic-log and resistivity-log data may not be consistent
Chapter 10 2D Overpressure Modelling and Pressure Behaviour Modelling
217
with abnormally high porosities expected in the overpressured source rocks. In turn,
this suggests that the present day deep overpressure is not associated with a
significant porosity anomaly due to compaction disequilibrium in the fine-grained
rocks. The maintenance of the overpressure in the Jurassic source rocks to the
present-day, therefore, requires that a mechanism other than compaction
disequilibrium be sought to explain the deep overpressures in the sub-basins.
10.6.2.2 Hydrocarbon generation
On the basis of this study, one has to consider that the major causes for pressure
recharge to maintain the deep overpressures are hydrocarbon generation in the
Cainozoic after the thick Jurassic shales and siltstones had been compacted and most
of the porosity in the Jurassic sequence had been lost through compaction. In fact,
the deep overpressured system in the Barrow Sub-basin, interpreted by the sonic-
log, resistivity-log and the measured pressure data, is in agreement with the
observed zone of organic maturity of 0.8-2.0 % Ro (vitrinite reflectance) and an
increased volume of gas-generating organic matter. The boundary between the
pressure transition zone and the overpressured compartment (bottom of top pressure
seal) is consistent with a maturity of about 1 % Ro. Ro at the top of the deep
overpressured zone is about 1 % in Dampier-1 of the Dampier Sub-basin and also
about 1 % in Jurabi-1 of the Exmouth Sub-basin. This may be why the deep
overpressured zone frequently appears to have a planar top in a basin. The depth of
the planar top seems to be associated with the upper part of the hydrocarbon
generation zone with the thermal maturity range of about 0.8-1 %. It is proposed that
if an effective pressure seal exists it can only maintain the overpressure for several
million years at best, while continuous hydrocarbon generation, especially gas
generation and thermal expansion, for a pressure recharge over the past several tens
of millions of years is very likely to be the major cause of maintenance of the deep
overpressure. As hydrocarbon generation and charge in the Jurassic source rocks is
believed to have occurred since the Cainozoic, it is not inconceivable that an
overpressure regime has been maintained since that time.
Chapter 10 2D Overpressure Modelling and Pressure Behaviour Modelling
218
10.7 Summary
This study and modelling has shown several possible ways of interpreting the
observed abnormal fluid pressures in the sub-basins. The BasinMod 2D basin
modelling has suggested a maintained pressure cell in the Jurassic sequence since
the Cainozoic. This modelling may inadvertently support some unrealistic
petrophysical parameters, and computational assumptions. Nevertheless, the
modelled overpressure distribution at present-day is fairly consistent with the
observed data. The pressure seal that appears to be present in the Barrow Sub-basin
clearly suggests that the observed overpressure can be only maintained by the top
pressure seal for several million years at best, unless extremely low permeabilities
(10-23 m2 or less) occur a thousand meters in the Jurassic shaley sequences of the
sub-basins.
The modelled results using the BasinMod 2D software suggest the following
observations:
(1) The rapid sedimentation rates in fine-grained rocks during the basin subsidence
of the Jurassic, resulting in compaction disequilibrium, are likely to be a
mechanism for generating overpressure.
(2) The pressure seal, including top and bottom low-permeability rocks and lateral
sealed faults, is one of the major controls on the deep overpressured
compartments in the Jurassic shaley sequence since the Cainozoic.
(3) Quartz cementation may be a significant factor in forming a low-permeability
rock layer for a top pressure seal.
(4) Thermal expansion of pore fluids makes a 5-10 % contribution to the maximum
excess pressure in the studied case, and the generated pressure of hydrocarbon
generation makes a less than 2 % contribution to the maximum excess pressure
in the sub-basins.
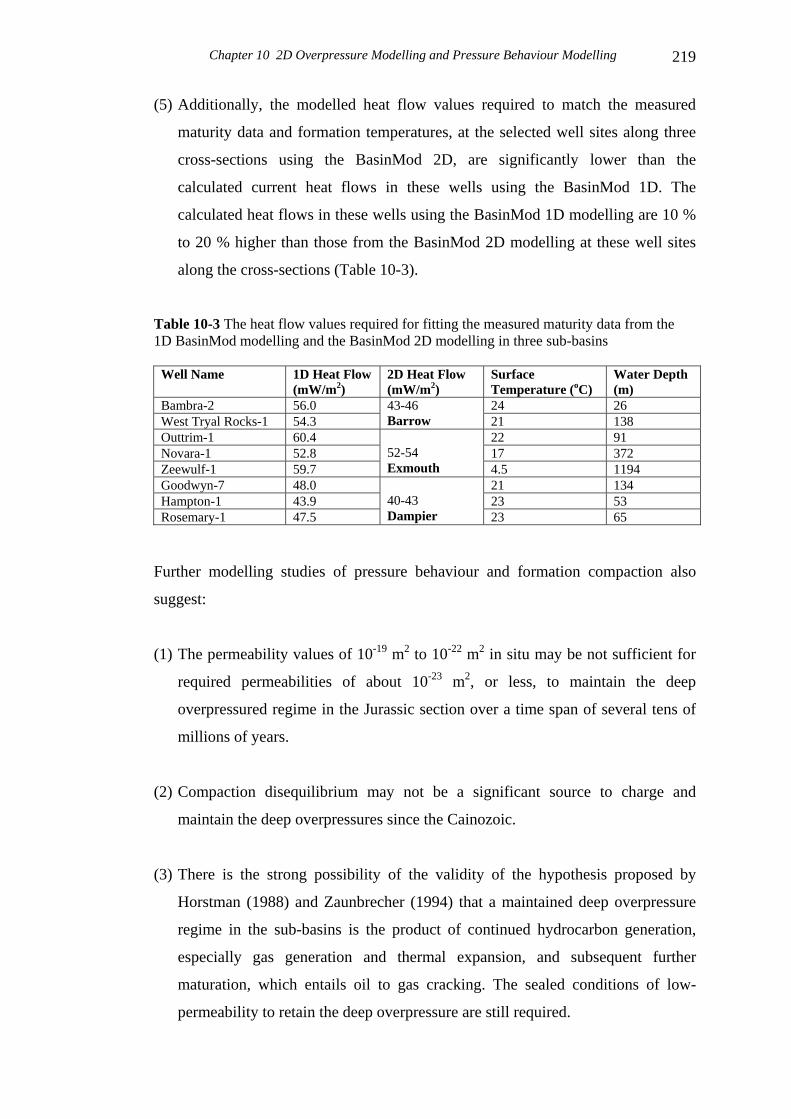
Chapter 10 2D Overpressure Modelling and Pressure Behaviour Modelling
219
(5) Additionally, the modelled heat flow values required to match the measured
maturity data and formation temperatures, at the selected well sites along three
cross-sections using the BasinMod 2D, are significantly lower than the
calculated current heat flows in these wells using the BasinMod 1D. The
calculated heat flows in these wells using the BasinMod 1D modelling are 10 %
to 20 % higher than those from the BasinMod 2D modelling at these well sites
along the cross-sections (Table 10-3).
Table 10-3 The heat flow values required for fitting the measured maturity data from the 1D BasinMod modelling and the BasinMod 2D modelling in three sub-basins
Well Name 1D Heat Flow (mW/m2)
2D Heat Flow (mW/m2)
Surface Temperature (oC)
Water Depth (m)
Bambra-2 56.0 24 26 West Tryal Rocks-1 54.3
43-46 Barrow 21 138
Outtrim-1 60.4 22 91 Novara-1 52.8 17 372 Zeewulf-1 59.7
52-54 Exmouth 4.5 1194
Goodwyn-7 48.0 21 134 Hampton-1 43.9 23 53 Rosemary-1 47.5
40-43 Dampier 23 65
Further modelling studies of pressure behaviour and formation compaction also
suggest:
(1) The permeability values of 10-19 m2 to 10-22 m2 in situ may be not sufficient for
required permeabilities of about 10-23 m2, or less, to maintain the deep
overpressured regime in the Jurassic section over a time span of several tens of
millions of years.
(2) Compaction disequilibrium may not be a significant source to charge and
maintain the deep overpressures since the Cainozoic.
(3) There is the strong possibility of the validity of the hypothesis proposed by
Horstman (1988) and Zaunbrecher (1994) that a maintained deep overpressure
regime in the sub-basins is the product of continued hydrocarbon generation,
especially gas generation and thermal expansion, and subsequent further
maturation, which entails oil to gas cracking. The sealed conditions of low-
permeability to retain the deep overpressure are still required.
Conclusions and Limitations 220
CONCLUSIONS AND LIMITATIONS
Conclusions
The principal aims of this study were evaluation of (1) heat flow history, (2) thermal
maturity and hydrocarbon generation in the deep overpressured system, and (3)
pressure seal and evolution of deep overpressure. The prime methods used were (1)
geological analysis, and (2) basin modelling. Eight chapters contain the most
important research work, data and viewpoints. Chapters 3, 4 and 5 explain the
characteristics of organic matter, a case study of the reliability of Tmax data, the deep
overpressured system and its top pressure seal. Chapters 6 and 7 describe the 1D
model, parameters and BasinMod 1D modelling for thermal history and thermal
maturity. Chapter 8 contains two case studies of the thermal maturity and thermal
modelling in the deep overpressured zone. Chapters 9 and 10 establish 2D
geological models and choose parameters, show the results of BasinMod 2D
overpressure modelling, and discuss the effect of the pressure seal and major origins
to generate and maintain the deep overpressured system.
The major new findings from this study are as follows:
• Reliable Tmax data are useful to evaluate thermal maturity and a relationship
between vitrinite reflectance and Rock-Eval Tmax is proposed.
• Some thermal maturity data are consistent with the rifting heat flow model of
Jarvis and McKenzie (1980).
• No undercompaction overpressure effect on retardation of maturation can be
observed in these studied wells. The deep overpressure is a result of the thermal
maturity and hydrocarbon generation in this basin.
• The present day deep overpressured zone is not associated with a high porosity
anomaly owing to compaction disequilibrium.
Conclusions and Limitations 221
• The observed deep overpressure can not be maintained over tens of millions of
years in a very low-permeability (10-22 m2 or 10-7 md) environment.
• The major mechanism to maintain the observed deep overpressure through the
last tens of millions of years is continued hydrocarbon generation, especially gas
generation and thermal expansion, within sealed conditions.
The conclusions, new facts and suggestions to be drawn from this study are as
follows:
1. The Jurassic and Upper Triassic formations are rich in total organic carbon on
the basis of 1256 TOC values. TOC values in the Dupuy Formation, Dingo
Claystone and Athol Formation of the Jurassic range from about 0.2 % to 13 %
with an average value of about 1.74 %. TOC values in the Murat Siltstone of the
Lower Jurassic range from about 0.4 % to 11 % with an average value of about
2.09 %. TOC values in the Mungaroo Formation of the Middle-Upper Triassic
range from about 0.2 % to 36 % with an average value of about 2.19 %
calculated from the TOC values of less than 15 %. TOC contents in the coal-
bearing sequence of the Lower-Middle Jurassic of the Beagle Sub-basin have
higher values.
2. The organic matter in the Jurassic source rocks is a mixture of terrestrial and
marine input, but its bulk geochemical feature appears to be dominated by type
III kerogen based on the current data. The organic matter in the Lower-Middle
Jurassic contains more terrigenous material and mainly gas generating type of
organic matter, while the organic matter in the Upper Jurassic may consist of
more marine material and some mixed type II/III kerogen for a more oil-prone
type may occur in the Barrow-Dampier Sub-basins.
3. The major problems influencing the reliability of Rock-Eval Tmax data for the
assessment of thermal maturity are (1) contamination by drilling-mud additives,
and (2) suppression due to HI > 150. Carefully estimating and selecting Tmax
data are important. The reliable Tmax data are useful to evaluate thermal maturity,
especially where no other reliable measured maturity parameters are available.
Conclusions and Limitations 222
4. The Jurassic sequence and some low parts of the Barrow Group are
overpressured with excess pressures of about 5-29 MPa at depths of about 2900-
3640 m from observations by repeat formation tests (RFTs) and drill stem tests
(DSTs). The deep overpressured system (mainly in Jurassic rocks) is also
coincident with increase in mud weights within the observed depth range of
2650-4650 m.
5. The Jurassic source rocks are also overpressured, corroborated by high sonic
transit times and low formation resistivities in the fine-grained rocks. However,
the measured claystone porosities are significantly lower than the sonic-log and
resistivity-log derived porosities, and the density-log data are not in agreement
with abnormal high porosities due to compaction disequilibrium in the
overpressured source rocks. A possible explanation is that the sonic-log and
resistivity-log also directly respond to the overpressuring in the deep
overpressured fine-grained rocks of the sub-basins, which is consistent with the
observation by Hermanrud et al. (1998).
6. The top pressure seal for the deep overpressured system in the Barrow Sub-basin
is interpreted to be consistent with a pressure transition zone. The top pressure
seal was observed to be a rock layer containing 60-80 % claystone and siltstone
with 20-40 % sandstone and thin limestone. The top of the rock layer has
varying depths of about 2650-3000 m with temperatures of 110-125 oC. The
bottom of the rock layer has depths ranging from 3100 m to 3300 m with
temperatures of 125-135 oC. The thicknesses of the rock layer range from about
300 m to 500 m. The estimated porosities of claystone in the rock layer, based
on the well-log data and measured claystone porosities, are about 2-5 % and
calculated permeabilities range from about 10-19- 10-22 m2.
7. The evidence of rifting heat flow histories, during the rift event of the Jurassic
and earliest Cretaceous, was modelled using multiple thermal maturity data from
4 wells, Jurabi-1 in the Exmouth Sub-basin, Bowers-1 in the Barrow Sub-basin,
and Investigator-1 and Jupiter-1 on the Exmouth Plateau. The thermal maturity
data are consistent with the rifting heat flow model of Jarvis and McKenzie
(1980). The maximum typical heat flow values during the rifting along the
Conclusions and Limitations 223
rifting grabens (sub-basins) were determined to be 60-70 mW/m2 with relatively
higher values in the Exmouth and Barrow Sub-basins and relatively lower values
in the Dampier and Beagle Sub-basins. The maximum heat flow values during
the rifting on the southern and central areas of the Exmouth Plateau possibly
range from 70 mW/m2 to 80 mW/m2.
8. During the rifting in the Jurassic and earliest Cretaceous, the Rankin Platform, as
a western shoulder of grabens, underwent substantial uplift and erosion. The
estimated erosional thickness may range from hundreds meters up to 2500 m.
The 1D thermal modelling indicates that the Rankin Platform was experiencing a
decrease of temperature during the rifting. There is no evidence that a higher
rift-associated heat flow occurred on the Rankin Platform (western graben
shoulder).
9. The study of thermal modelling suggests that it is more geologically reasonable
to use the rift-related heat flow histories for predicting temperature, thermal
maturity and hydrocarbon generation in the depocentres of the sub-basins, while
the constant heat flow model (calculated current heat flow and surface or
seafloor temperature) can be generally used to predict the thermal effects on the
graben shoulders. The constant heat flow model can be also used to calculate the
maturity and temperature histories during the post-rift phase of basin
development.
10. This study propose a relationship between vitrinite reflectance and Rock-Eval
Tmax for the assessment of thermal maturity and thermal modelling. The
relationship is preliminary and further study is needed to improve the
correlation. The relationship between Ro and Tmax used in the thermal study may
result in ! 3-10 % error for the calculated vitrinite reflectance.
11. The true thermal maturity (Ro: 0.8-2.2 %) in the observed Jurassic overpressured
source rocks of the Barrow Sub-basin is not detectably influenced by the
observed overpressure (fluid pressures of about 40-80 MPa at depths of 3000-
4600 m). Based on this study, overpressure retardation of organic-matter
Conclusions and Limitations 224
maturation does not appear to be a global phenomenon, and the overpressure is
not a significant factor in the thermal maturity and hydrocarbon generation in the
study region. The temperature-time-related kinetic model can still be used to
predict the thermal effects and timing of hydrocarbon generation in the deep
overpressured Jurassic section in this basin.
12. Rapid loading occurred during the Jurassic and earliest Cretaceous in the central
areas of the sub-basins with sedimentation rates of about 80-250 m/Ma. The
sedimentation rates were 10-80 m/Ma in the Cretaceous and generally 10-30
m/Ma in Cainozoic.
13. 2D modelled porosity along selected cross-sections indicate that higher porosity
was retained in the Jurassic fine-grained rocks, and movement of the pore fluids
was inhibited during the rapid deposition in the Jurassic and Early Cretaceous.
However, the porosities at the present-day in the observed deep overpressured
Jurassic section probably range from 2 % to 7 %. The discrepancy is probably
due to an inappropriate porosity algorithm used in the modelling software.
14. 2D overpressure modelling indicates that rapid sedimentation rates resulted in
compaction disequilibrium in the fine-grained rocks, which is likely to be a
significant mechanism of deep overpressure generation in the sub-basins during
the Jurassic and Early Cretaceous. However, since the Cainozoic, the
compaction disequilibrium should be much less important to maintain the deep
highly overpressured system, because the Jurassic section had been well
compacted and the depositional rates were very slow in most areas of the sub-
basins.
15. The sealed conditions for the deep overpressured Jurassic section since the
Cainozoic were modelled using the BasinMod 2D modelling. These conditions
were formed by (1) laterally closed faults, (b) near impermeable rocks with
permeabilities of about 10-23-10-25 m2 at the bottom of Jurassic, and (c) a top
pressure seal with permeabilities of about 10-20-10-22 m2 in the Barrow Sub-basin
and permeabilities in the top of the Jurassic section ranging from about 10-19 m2
to 10-20 m2 in the Exmouth and Dampier Sub-basins. The model-derived
Conclusions and Limitations 225
permeabilities of 10-23-10-25 m2 for the bottom of the Jurassic section may not
necessarily be suitable to represent the bottom sealed conditions of the observed
present day deep overpressured system.
16. In combination with the characteristics of the top pressure seal in the Barrow
Sub-basin, (a) 2D modelling for the deep overpressure, (b) the modelling for
pressure behavior in low-permeability (10-18-10-22 m2) environments, and (c) the
studies of pressure sealing by Deming (1994), one may conclude that the top
pressure seal with a permeability of more than 10-23 m2 (10-23 md) is not
sufficient to maintain deep overpressure without pressure recharge over the past
tens of millions of years. The permeabilities required for the top pressure seal to
retain deep overpressure over geological time span are 10-23 m2, or less, which
are almost unlikely to occur in most natural geological circumstances.
17. The study suggests that (1) the present day overpressured zone is not associated
with an anomalous high porosity due to undercompaction, (2) slower
sedimentation rates and subsidence occurred since the Early Cainozoic, (3) the
Jurassic source rocks were compacted and most of the porosity had been lost
through compaction since the middle Tertiary, and (4) the present-day observed
deep overpressure is unlikely to have been the preserved, due to a mechanism of
compaction disequilibrium, in the geological past. Therefore, it seems that
compaction disequilibrium is not a significant mechanism for the deep
overpressured system since the Cainozoic.
18. An acceptable hypothesis for the major cause to maintain the observed deep
overpressure through the last tens of millions of years is organic-matter
maturation and continued hydrocarbon generation, especially gas generation and
thermal expansion, as proposed by Horstman (1988), Hunt (1990) and
Zaunbrecher (1994). Sealed conditions or low-permeability environments for
retaining the deep overpressure are still necessary.
19. On the basis of the 2D modelled results, it appears that quartz cementation may
be a significant cause in creating a low-permeability rock layer with
permeabilities of 10-19-10-22 m2 for a top pressure seal, which may be more
Conclusions and Limitations 226
effective in preventing oil and gas being expelled from the well-compacted,
overpressured Jurassic source section in a short period of geological time. This
may imply (1) an episodic sequence of (a) hydrocarbon generation (especially
gas generation) - (b) overpressure - (c) fracture - (d) hydrocarbon migration - (e)
resealing, and (2) a pressure-driven process due to high overpressure caused by
continuous hydrocarbon generation, especially gas generation, in the sealed
overpressured source rocks for oil and gas migration, which occurred in the
geological past in this basin.
20. Based on 1D maturity modelling and the study of 2D overpressure evolution, oil
and gas generation, migration and accumulation in the sub-basins since the Late
Cretaceous are the most important events for an understanding and evaluation of
oil and gas potential, and for petroleum exploration in this basin with deep
overpressured compartments.
Limitations
The main limitations for this study are as follows:
1. Although a great deal of data have been obtained for this study, the observed
data are still insufficient for detailed studies of basin history.
2. The geological models have been built with many simplifications, especially
the 2D geological models, due to numerical procedures and data limitation.
3. The uncertainties of thermal parameters and fluid parameters, and claystone
permeability have not been fully resolved.
4. It seems that the mathematical models in the 2D modelling are still far from
satisfactory for the practical dynamic, and interaction, processes of geology and
geochemistry.
References
227
REFERENCES
AGSO North West Shelf Study Group. (1994). Deep reflections on the North West
Shelf: changing perceptions of basin formations. In: Purcell, P. G. and Purcell,
R. R. eds., The Sedimentary Basins of Western Australia (pp. 63-76):
Proceedings of the Petroleum Exploration Society of Australia, Perth, 1994.
Alexander, R., Kagi, R.I., Toh, E. and van Bronswijk, W. (1988). The use of
aromatic hydrocarbons for assessment of thermal histories of sediments. In:
Purcell, P. G. and Purcell, R. R. eds., The North West Shelf, Australia (pp. 559-
562): Proceedings of the Petroleum Exploration Society of Australia, Perth,
1988.
Alexander, R., Marzi, R. and Kagi, R.I. (1990). A new method for assessing the
thermal history of sediments: a case study from the Exmouth Plateau in
Northwestern Australia. Australian Petroleum Exploration Association Journal,
30, 364-372.
Allan, J. and Douglas, A.G. (1977). Variations in the content and distribution of n-
alkanes in a series of Carboniferous vitrinite and sporinites of bituminous rank.
Geochim. Cosmochim. Acta, 40, 1223-1230.
Allen, P.A. and Allen, J.R. (1990). Basin analysis: principles and applications (pp.
282-283). Oxford, England: Blackwell Scientific Publications.
Alnes, J.R. and Lilburn, R.A. (1998). Mechanisms for generating overpressure in
sedimentary basins: A Reevalution: Discussion. American Association of
Petroleum Geologists Bulletin, 82, 2266-2269.
Apthorpe, M.C. (1979). Depositional history of the Upper Cretaceous of the
Northwest Shelf, based on Foraminifera. Australian Petroleum Exploration
Association Journal, 19, 74-89.
Asquith, G.B. and Gibson, C.R. (1983). Basic well log analysis for geologists (pp.
41-44). Tulsa, Oklahoma: American Association of Petroleum Geologists.
Aydin, A. (2000). Fracture, faults, and hydrocarbon entrapment, migration and flow.
Marine and Petroleum Geology, 17, 797-814.
Baillie, P.W. and Jacobson, E.P. (1997). Prospectivity and exploration history of the
Barrow Sub-basin, Western Australia. Australian Petroleum Production and
Exploration Association Journal, 37, 117-135.
References
228
Baldwin, B. and Butler, C.O. (1985). Compaction curves. American Association of
Petroleum Geologists Bulletin, 69, 622-626.
Barber, P.M. (1982). Palaeotectonic evolution and hydrocarbon genesis of the
central Exmouth Plateau. Australian Petroleum Exploration Association Journal,
23, 131-144.
Barber, P.M. (1988). The Exmouth Plateau deep water frontier: a case history. In:
Purcell, P. G. and Purcell, R. R. eds., The North West Shelf, Australia (pp. 173-
187): Proceedings of the Petroleum Exploration Society of Australia, Perth,
1988.
Barber, P. (1994). Sequence stratigraphy and petroleum potential of Upper Jurassic-
Lower Cretaceous depositional systems in the Dampier Sub-basin, North West
Shelf, Australia. In: Purcell, P. G. and Purcell, R. R. eds., The Sedimentary
Basins of Western Australia (pp. 526-542): Proceedings of the Petroleum
Exploration Society of Australia, Perth, 1994.
Barker, C. (1972). Aquathermal pressuring-role of temperature in development of
abnormal–pressure zones. American Association of Petroleum Geologists
Bulletin, 56, 2068-2071.
Barker, C. (1980). Primary migration: the importance of water-mineral-organic
matter interactions in the source rock. In: Roberts, W. H. and Cordell, R. J. eds.,
Problems of Petroleum Migration: American Association of Petroleum
Geologists Studies in Geology No. 10, 19-31.
Barker, C. (1990). Calculated volume and pressure changes during the thermal
cracking of oil to gas in reservoirs. American Association of Petroleum
Geologists Bulletin, 74, 1254-1261.
Barker, C. (1996). Thermal modelling of petroleum generation: theory and
applications. New York; Amsterdam: Elsevier.
Bear, J. (1972). Dynamics of fluids in porous media. New York: Elsevier Science.
Bekele, E.B., Johnson, M.D. and Higgs, W.G. (2001). Numerical modelling of
overpressure generation in the Barrow Sub-basin, Northwest Australia.
Australian Petroleum Production and Exploration Association Journal, 41, 595-
607.
Berry, F.A.F. (1973). High fluid potential in California Coast Ranges and their
tectonic significance. American Association of Petroleum Geologists Bulletin,
57, 1219-1245.
References
229
Beston, N.B. (1986). Reservoir geological modelling of the North Rankin Field,
Northwest Australia. Australian Petroleum Exploration Association Journal, 26,
375-388.
Bigelow, E.L. (1994a). Well logging methods to detect abnormal pressure. In: Fertl,
W.H., Chapman, R.E. and Hotz, R.F. eds., Studies in abnormal pressures (pp.
187-240). Amsterdam; New York: Elsevier Science.
Bigelow, E.L. (1994b). Global occurrences of abnormal pressures. In: Fertl, W.H.,
Chapman, R.E. and Hotz, R.F. eds., Studies in abnormal pressures (pp. 1-16).
Amsterdam; New York: Elsevier Science.
Bint, A.N. and Helby, R. (1988). Upper Triassic palynofacies and environmental
interpretations for the Rankin Trend, Northern Carnarvon Basin, W.A. In:
Purcell P.G. and Purcell R.R. eds., The North West Shelf, Australia (pp. 591-
598). Proceedings of the Petroleum Exploration Society of Australia, Perth,
1988.
Bjørlykke, K. and Egeberg, P.K. (1993). Quartz cementation in sedimentary basins.
American Association of Petroleum Geologists Bulletin, 77, 1538-1548.
Blevin, J.E., Stephenson, A.E. and West, B.G. (1994). Mesozoic structural
development of the Beagle Sub-basin – implication for the petroleum potential
of the Northern Carnarvon Basin. In: Purcell, P. G. and Purcell, R. R. eds., The
Sedimentary Basins of Western Australia (pp. 479-496): Proceedings of the
Petroleum Exploration Society of Australia, Perth, 1994.
Bordenave, M.L., Espitalié, J, Leplat, P., Oudin, J.L. and Vandenbroucke, M.
(1993). Screening techniques for source rock evaluation. In: Bordenave, M.L.
(ed), Applied Petroleum Geochemistry (pp. 217-278, Chapter II. 2). Paris:
Editions Technip.
Boyd, R., Williamson, P. and Haq, B.U. (1993). Seismic stratigraphy and passive-
margin evolution of the southern Exmouth Plateau. Spec. Publs Int. Ass.
Sediment., 18, 581-603.
Bradley, J.S. (1975). Abnormal formation pressure. American Association of
Petroleum Geologists Bulletin, 59, 957-973.
Bradley, J.S. and Powley, D.E. (1994). Pressure compartments in sedimentary
basins: a review. In: Ortoleva, P.J. ed., Basin Compartments and Seals (pp. 3-26):
American Association of Petroleum Geologists Memoir, 61.
References
230
Bradshaw, M.T., Yeates, A.N., Beynon, R.M., Brakel, A.T., Langford, R.P.,
Totterdell, J.M. and Yeung, M. (1988). Palaeogeographic evolution of the North
West Shelf Region. In: Purcell P.G. and Purcell R.R. eds., The North West Shelf,
Australia (pp. 29-54). Proceedings of the Petroleum Exploration Society of
Australia, Perth, 1988.
Bredehoeft, J., Wesley, J. and Fouch, T. (1994). Simulation of the origin of fluid
pressure, fracture generation, and the movement of fluids in the Uinta Basin,
Utah. American Association of Petroleum Geologists Bulletin, 78, 1729-1747.
Brikké, I. (1982). Geochemical interpretation of some oils and condensates from the
Dampier Sub-basin of Western Australia. Australian Petroleum Exploration
Association Journal, 22, 179-187.
Bruce, R.H., Middleton, M.F., Holyland, P., Loewenthal, D. and Bruner, I. (1996).
Modelling of petroleum formation associated with heat transfer due to
hydrodynamic processes. Petroleum Exploration Society of Australia Journal,
24, 6-12.
Burley, S. (1993). Models of burial diagenesis for deep exploration plays in Jurassic
fault traps of the Central and Northern North Sea. In: Parker, J. ed., Petroleum
Geology of Northwest Europe (pp. 1353-1375). London: Geological Society.
Burnham, A.K. (1989). A simple kinetic model of petroleum formation and cracking
(pp. 1-11). Lawrence Livermore National Laboratory Report UCID-21665
(unpublished).
Burnham, A.K. and Sweeney, J.J. (1989). A chemical kinetic model of vitrinite
maturation and reflectance. Geochimica et Cosmochimica Acta, 53, 2649-2657.
Burst, J.F. (1969). Diagenesis of Gulf Coast sediments and its possible relation to
petroleum migration. American Association of Petroleum Geologists Bulletin, 53,
73-93.
Campbell, I.R. and Smith, D.N. (1982). Gorgon 1 - Southernmost Rankin Platform
gas discovery. Australian Petroleum Exploration Association Journal, 22, 102-
111.
Campbell, I.R., Tait, A.M. and Reiser, R.F. (1984). Barrow Island Oilfield,
revisited. Australian Petroleum Exploration Association Journal, 24, 289-298.
Carr, A.D. (1999). A vitrinite reflectance kinetic model incorporating overpressure
retardation. Marine and Petroleum Geology, 16, 355-377.
References
231
Carslaw, H.S. and Jaeger, J.C. (1959). Conduction of heat in solids. Oxford at the
Clarendon Press, 510 p.
Cecil, B.C., Stanton, R.W. and Robbins, E.I. (1977). Geologic factors controlling
coalification and hydrocarbon maturation (abstract). American Association of
Petroleum Geologists Bulletin, 61, 775.
Chaney, P.E. 1950. Abnormal pressure and lost circulation. World Oil, 130, 122-
126.
Chapman, R.E. (1972). Clays with abnormal interstitial fluid pressures. American
Association of Petroleum Geologists Bulletin, 56, 790-795.
Chapman, R.E. (1994). Abnormal pore pressures: essential theory, possible causes,
and sliding. In: Fertl, W.H., Chapman, R.E. and Hotz, R.F. eds., Studies in
abnormal pressures (pp. 51-91). Amsterdam; New York: Elsevier Science.
Clementz, D.M. (1979). Effect of oil and bitumen saturation on source-rock
pyrolysis. American Association of Petroleum Geologists Bulletin, 63, 2227-
2232.
Cockbain, A.E. (1989). The North West Shelf. Australian Petroleum Exploration
Association Journal, 29, 529-545.
Colwell, J.B., Röhl, U., von Rad, U. and Kristan Tollmann, E. (1994). Mesozoic
sedimentary and volcaniclastic rocks dredged from the northern Exmouth
Plateau and Rowley Terrace, offshore northwest Australia. AGSO Journal of
Australian Geology and Geophysics, 15, 11-42.
Cook, A.C. and Kantsler, A.J. (1980). The maturation history of the epicontinental
basins of Western Australia. United Nations Economic Social Commission for
Asia and Pacific, CCOP/SOPAC Technical Bulletin, 3, 171-195.
Cook, A.C., Smyth, M. and Vos, R.G. (1985). Source potential of Upper Triassic
fluvio-deltaic systems of the Exmouth Plateau. Australian Petroleum
Exploration Association Journal, 25, 204-215.
Cooles, G.P., Mackenzie, A.S. and Quigley, T.M. (1986). Calculation of petroleum
masses generated and expelled from source rocks. Organic Geochemistry, 10,
235-245.
Cossé, R. (1993). Basics of reservoir engineering, oil and gas field development
techniques. Institute Francais du Pétrole Publications, Editions Technip, 342 p.
References
232
Cranganu, C. and Deming, D. (1996). Heat flow and hydrocarbon generation in the
Transylvanian Basin, Romania. American Association of Petroleum Geologists
Bulletin, 80, 1641-1653.
Crostella, A. and Chaney, M.A. (1978). The petroleum geology of the Outer
Dampier Sub-basin. Australian Petroleum Exploration Association Journal, 18,
13-22.
Crostella, A. and Barter, T. (1980). Triassic-Jurassic depositional history of the
Dampier and Beagle Sub-basins, Northwest Shelf of Australia. Australian
Petroleum Exploration Association Journal, 20, 25-33.
Crostella, A., Iasky, R.P., Blundell, K.A., Yasin, A.R., and Ghori, K.A. (2000).
Petroleum geology of the Peedamullah Shelf and Onslow Terrace, Northern
Carnarvon Basin, Western Australia. Report No. 73, Geological Survey of
Western Australia, 2000 (unpublished).
Daim, F.M. and Lennox, P.G. (1998). A new tectonic model for the evolution of the
Northern Carnarvon Basin, Western Australia. In: Purcell, P. G. and Purcell, R.
R. eds., The Sedimentary Basins of Western Australia 2 (pp. 435-446):
Proceedings of the Petroleum Exploration Society of Australia, Perth, 1998.
Dalla Torre, M., Mahlmann, R.F. and Ernst, W.G. (1997). Experimental study on
the pressure dependence of vitrinite maturation. Geochimica et Cosmochimica
Acta, 61, 2921-2928.
Deming, D. and Chapman, D.S. (1989). Thermal histories and hydrocarbon
generation: Example from Utah-Wyoming thrust belt. American Association of
Petroleum Geologists Bulletin, 73, 1455-1471.
Deming, D. (1994). Factors necessary to define a pressure seal. American
Association of Petroleum Geologists Bulletin, 78, 1005-1009.
Densley, M.R., Hillis, R.R. and Redfearn, J.E.P. (2000). Quantification of uplift in
the Carnarvon Basin based on interval velocities. Australian Journal of Earth
Sciences, 47, 111-122.
Dickinson, G. (1953). Geological aspects of abnormal reservoir pressure in Gulf
Coast Louisiana. American Association of Petroleum Geologists Bulletin, 37,
410-432.
Dix, C.H. (1955). Seismic velocities from surface measurements. Geophysics, 20,
68-86.
References
233
Driscoll, N.W., and Karner, G.D. (1998). Lower crustal extensional across the
Northern Carnarvon Basin, Australia: Evidence for an eastward dipping
detachment. Journal of Geophysical Research, 103, 4975-4991.
Düppenbecker, S.J., Dohmen, L. and Welte D.H. (1991). Numerical modelling of
petroleum expulsion in two areas of the Lower Saxony Basin, Northern
Germany. In: England, W.A. and Fleet, A.J., eds., Petroleum Migration (pp. 47-
64). London: The Geological Society.
Ellis, G.K., Pitchford, A. and Bruce, R.H. (1999). Barrow Island oil field. Australian
Petroleum Production and Exploration Association Journal, 39, 158-176.
Emery, D. and Myers, K. (1996). Sequence stratigraphy (pp. 11-41). Cambridge,
Mass.: Blackwell Science, 1996.
England, W., Mackenzie, A., Mann, D. and Quigley, T. (1987). The movement and
entrapment of petroleum fluids in the subsurface. Journal of the Geological
Society, Landon, 144, 327-347.
Espitalié, J., Marquis, F. and Barsony, I. (1984). Geochemical logging. In:
Voorhees, K.J. ed., Analytical pyrolysis: techniques and applications (pp. 276-
304). London: Butterworths.
Etheridge, M.A. and O'Brien, G.W. (1994). Structural and tectonic evolution of the
Western Australia Margin basin system. Petroleum Exploration Society of
Australia Journal, 34, 45-63.
Exon, N.F. and Colwell, J.B. (1994). Geological history of the outer NorthWest
Shelf of Australia: a synthesis. AGSO Journal of Australian Geology and
Geophysics, 15, 177-190.
Falvey, D.A. and Middleton, M.F. (1981). Passive continental margins: evidence for
a prebreakup deep crustal metamorphic subsidence mechanism. Oceanologica
Acta, 1981 (pp. 103-114). Proceedings 26th International Geological Congress,
Geology of Continental Margins Symposium, Paris, 7-17 July, 1981.
Falvey, D.A. and Mutter, J.C. (1981). Regional plate tectonics and the evolution of
Australia's passive continental margins. BMR (Bureau of Mineral Resources)
Journal of Australian Geology and Geophysics, 6, 1-29.
Ghori, K.A.R. (1995). Measuring thermal conductivities improve maturation
modelling in the Northern Carnarvon Basin, Western Australia. Petroleum
Exploration Society of Australia Journal, 23, 3-12.
References
234
Ghori, K.A.R. (1999). Silurian-Devonian Petroleum source-rock potential and
thermal history, Carnarvon Basin, Western Australia. Report No. 72, 88 p.
Department of Minerals and Energy, Geological Survey of Western Australia
(unpublished).
Gorter, J.D. (1994). Interpretation of raw Rock-Eval Data: A cautionary tale from
the Carnarvon Basin, Western Australia. A Report for Hardy Petroleum
(unpublished).
Gretener, P.E. and Bloch, G. (1992). Geopressures: two distinctly different kinds of
conditions. 1992 Annual Convention, Abstracts (pp. 48-49), American
Association of Petroleum Geologists.
Gurba, L.W. and Ward, C.R. (1998). Vitrinite reflectance anomalies in the high-
volatile bituminous coals of the Gunnedah Basin, New South Wales, Australia.
International Journal of Coal Geology, 36, 111-140.
Hao, F., Sun, Y.C., Li, S.T. and Zhang, Q.M. (1995). Overpressure retardation of
organic-matter maturation and petroleum generation: a case study from the
Yinggehai and Qiongdongnan Basins, South China Sea. American Association of
Petroleum Geologists Bulletin, 79, 551-562.
Haq, B.U., Hardenbol, J. and Vail, P.R. (1987). Chronology of fluctuating sea levels
since the Triassic. Science, 235, 1156-1166.
Hardenbol, J., Vail, P.R. and Ferrer, J. (1981). Interpreting paleoenvironments,
subsidence history and sea-level changes of passive margins from seismic and
biostratigraphy. Oceanologica Acta, No SP, 33-44.
Hellinger, S. and Sclater, J. G. (1983). Some comments on two-layer extensional
models for the evolution of sedimentary basins. Journal of Geophysical
Research, 88, 8251-8269.
Hermanrud, C., Wensaas, L., Teige, G.M.G., Nordgård Bolås, H.M., Hansen, S. and
Vik, E. (1998). Shale porosities from well logs on Haltenbanken (Offshore Mid-
Norway) show no influence of overpressuring. In: Law, B.E., Ulmishek, G.F.
and Slavin, V.I. eds., Abnormal pressures in hydrocarbon environments (pp. 65-
85): American Association of Petroleum Geologists Memoir, 70.
Hill, G. (1994). The role of the pre-rift structure in the architecture of the Dampier
Basin Area, North West Shelf, Australia. Australian Petroleum Exploration
Association Journal, 34, 603-613.
References
235
Hill, R.J., Jenden, P.D., Tang, Y.C., Teerman, S.C. and Kaplan, I.R. (1994).
Influence of pressure on pyrolysis of coal. In: Mukhopadhyay P.K. and Dow
W.G. eds., Vitrinite reflectance as a maturity parameter: Application and
limitations (pp. 161-193): American Chemical Society Symposium Series 570.
Hocking, R. M., Moors, H. T., and Van De Graaff, W. J. E. (1987). Geology of the
Carnarvon Basin Western Australia. Geological Survey Western Australia
Bulletin, 133.
Hocking, R.M. (1988). Regional Geology of the Northern Carnarvon Basin. In:
Purcell P.G. and Purcell R.R. eds., The North West Shelf, Australia (pp. 97-114):
Proceedings of the Petroleum Exploration Society of Australia, Perth, 1988.
Hocking, R., Mory, A.J. and Williams, I.R. (1994). An atlas of Neoproterozoic and
Phanerozoic Basins of Western Australia. In: Purcell, P. G. and Purcell, R. R.
eds., The Sedimentary Basins of Western Australia (pp. 21-43): Proceedings of
the Petroleum Exploration Society of Australia, Perth, 1994.
Hoover, D.S. and Davis, A. (1980). The development and evaluation of an
automated reflectance microscope system for the petrographic characterization
of bituminous coals. Penn State Univ., U.S. Dept. Energy, Techn. Rep., FE-
2030-TR23, Contract No. EX-76-C-01-2030.
Horstman, E.L. (1988). Source maturity, overpressures and production North West
Shelf, Australia. In: Purcell P.G. and Purcell R.R. eds., The North West Shelf,
Australia (pp. 529-537): Proceedings of the Petroleum Exploration Society of
Australia, Perth, 1988.
Huang, W.Y. and Meinschein, W.G. (1979). Sterols as ecological indicators.
Geochimica et Cosmochimica Acta, 43, 739-745.
Hubbert, M.K. (1940). The theory of ground-water motion. Journal of Geology, 48,
785-944.
Hubbert, M.K. (1953). Entrapment of petroleum under hydrodynamic conditions.
American Association of Petroleum Geologists Bulletin, 37, 1954-2026.
Hunt, J.M. (1979). Petroleum geochemistry and geology (pp. 332). San Francisco:
W. H. Freeman.
Hunt, J.M. (1990). Generation and migration of petroleum from abnormally pressure
fluid compartments. American Association of Petroleum Geologists Bulletin, 74,
1-12.
References
236
Hunt, J.M., Lewan, M.D. and Hennet, R.J-C. (1991). Modeling oil generation with
time-temperature index graphs based on the Arrhenius equation. American
Association of Petroleum Geologists Bulletin, 75, 795-807.
Hunt, J.M. (1996). Petroleum geochemistry and geology (2nd ed.) (pp. 291, 370,
380-388, 491-516). New York: W. H. Freeman.
Hunt, J.M., Whelan, J.K., Eglinton, L.B. and Cathles III, L.M. (1998). Relation of
Shale Porosities, Gas Generation, and Compaction to Deep Overpressures in the
U.S. Gulf Coast. In Law, B.E., Ulmishek, G.F. and Slavin, V.I. eds., Abnormal
Pressures in Hydrocarbon Environments (pp. 87-104): American Association of
Petroleum Geologists Memoir, 70.
Hutton, A.C. and Cook, A.C. (1980). Influence of alginate on the reflectance of
vitrinite from Joadja, NSW, and some coals and other oil shales containing
alginate. Fuel, 59, 711-714.
Jarvis, G.T. and McKenzie, D.P. (1980). Sedimentary basin formation with finite
extension rates. Earth Planetary Science Letters, 48, 42-52.
Jones, R.W. (1984). Comparison of carbonate and shale source rocks. In: James G.
Palaces ed., Petroleum geochemistry and source rock potential of carbonate
rocks, American Association of Petroleum Geologists Studies in Geology, No.
18 (pp. 163-180). Tulsa, Oklahoma 74101, U.S.A.
Joy, A.M. (1992). Estimation of Cenozoic water depths in the Western Central
Graben, UK North Sea, by subsidence modelling. In: R.F.P. Hardman ed.,
Exploration Britain; geological insights for the next decade (pp. 107-125).
Geological Society Special Publications No. 67, Geological Society of London.
London, United Kingdom, 1992.
Kaiko, A.R. and Tingate, P.R. (1996). Suppressed vitrinite reflectance and its effect
on thermal history modelling in the Barrow and Dampier Sub-basins. Australian
Petroleum Production and Exploration Association Journal, 36, 428-444.
Kaiko, A.R. (1998). Thermal history analysis of the Barrow and Dampier Sub-
basins, North West Shelf, Western Australia (PhD thesis, University of South
Australia).
Kaiko, A.R. (2000). Evidence for a rift related heating event around the Alpha Arch,
Barrow Sub-basin, Western Australia (abstract, pp. 1444-1445). AAPG
international conference and exhibition, Bali, Indonesia, October 15-18, 2000.
References
237
Kaiko, A.R. and Tait, A. M. (2001). Post-rift tectonic subsidence and palaeo-water
depths in the Northern Carnarvon Basin, Western Australia. Australian
Petroleum Production and Exploration Association Journal, 41, 367-379.
Keep, M., Powell, C.McA. and Baillie, P.W. (1998). Neogene deformation of the
North West Shelf, Australia. In: Purcell P.G. and Purcell R.R. eds., The
Sedimentary Basins of Western Australia 2 (pp. 81-91). Proceedings of the
Petroleum Exploration Society of Australia, Perth, 1998.
Khorasani, G.K. and Michelsen, J.K. (1994). The effects of overpressure, lithology,
chemistry and heating rate on vitrinite reflectance evolution, and its relationship
with oil generation. Australian Petroleum Exploration Association Journal, 34,
418-435.
Kopsen, E. and McGann, G. (1985). A review of the hydrocarbon habitat of the
Eastern and Central Barrow-Dampier Sub-basin, Western Australia. Australian
Petroleum Exploration Association Journal, 25, 154-176.
Kopsen, E. (1994). Northern Carnarvon Basin hydrocarbon distribution and future
petroleum potential. In: Purcell, P. G. and Purcell, R. R. eds., The Sedimentary
Basins of Western Australia (pp. 127-139): Proceedings of the Petroleum
Exploration Society of Australia, Perth, 1994.
Kruge, M.A. (1983). Diagenesis of Miocene Biogenic Sediments in Lost Hills Oil
Field, San Joaquin Basin, California. In: Isaacs, C.M. and Garrison, R.E. eds.,
Petroleum generation and occurrence in the Miocene Monterey Formation,
California (pp. 39-51). Los Angeles: The Pacific Section, Society of Economic
Paleontologists and Mineralogists.
Labutis, V.R. (1994). Sequence stratigraphy and the North West Shelf of Australia.
In: Purcell, P.G. and Purcell, R.R. eds., The Sedimentary Basins of Western
Australia (pp. 159-180): Proceedings of West Australian Basins Symposium,
Perth, Western Australia, 1994.
Lachenbruch, A. (1970). Crustal temperature and heat productivity: implications of
the linear heat flow relation. Journal of Geophysical Research, 75, 3291-3300.
Larter, S.R. (1988). Some pragmatic perspectives in source rock geochemistry.
Marine and Petroleum Geology, 5, 194-204.
Law, B. and Dickinson, W. (1985). Conceptual model for origin of abnormally
pressured gas accumulation in low-permeability reservoirs. American Association
of Petroleum Geologists Bulletin, 69, 1295-1304.
References
238
Lawry, P.J. and Carter, P.A. (1992). Rivoli-1 gas discovery - Exmouth Sub-basin,
Western Australia. Australian Petroleum Exploration Association Journal, 32,
94-102.
le Poidevin, S.R. and Lowden, R.D. (1994). Petroleum resource of the Western
Australia. In: Purcell, P. G. and Purcell, R. R. eds., The Sedimentary Basins of
Western Australia (pp. 119-125): Proceedings of the Petroleum Exploration
Society of Australia, Perth, 1994.
Lee, Y. and Deming, D. (2002). Overpressure in the Anadarko basin, southwestern
Oklahoma: Static or dynamic? American Association of Petroleum Geologists
Bulletin, 86, 145-160.
Lerche, I., Yarzab, R.F. and Kendall, C.G.St.C. (1984). Determination of paleoheat
flux from vitrinite reflectance. American Association of Petroleum Geologists
Bulletin, 68, 1704-1717.
Lerche, I. (1990). Basin analysis - quantitative methods (pp. 232-235). San Diego:
Academic Press, Inc.
Lo, H.B. (1992). Identification of indigenous vitrinite for improved thermal maturity
evaluation. Organic Geochemistry, 17, 359-364.
Lo, H.B. (1993). Correction criteria for the suppression of vitrinite reflectance in
hydrogen-rich kerogen: preliminary guideline. Organic Geochemistry, 20, 653-
657.
Ludden, J.N. (1992). Radiometric age determinations for basement from Sites 765
and 766, Argo Abyssal Plain and Northwestern Australia Margin. In F.M.
Gradstein et al., eds., Preceedings of the Ocean Drilling Program (PP. 557-559).
Scientific Results: College Station, Texas A and M University. ODP. v. 123.
Lundegard, P.D. (1991). Sandstone porosity loss - A "Big Picture" view of the
importance of compaction. Journal of Sedimentary Research, 62, 250-260.
Luo, X.R. and Vasseur, G. (1992). Contributions of compaction and aquathermal
pressuring to geopressure and the influence of environmental conditions.
American Association of Petroleum Geologists Bulletin, 76, 1550-1559.
Luo, X.R. and Vasseur, G. (1996). Geopressuring mechanism of organic matter
cracking: numerical modeling. American Association of Petroleum Geologists
Bulletin, 80, 856-874.
Lysak, S.V. (1992). Heat flow variations in continental rifts. Tectonophysics, 208,
309-323.
References
239
Mackenzie, A.S. and Quigley, T.M. (1988). Principles of geochemical prospect
appraisal. American Association of Petroleum Geologists Bulletin, 72, 399-413.
Magara, K. (1978). Compaction and fluid migration: practical petroleum geology
(pp. 47-85). Amsterdam: Elsevier Science.
Mann, D.M. and Mackenzie, A.S. (1990). Prediction of pore pressure in sedimentary
basin. Marine and Petroleum Geology, 7, 55-65.
Marine, I.W. and Fritz, S.J. (1981). Osmotic model to explain anomalous hydraulic
heads. Water Resources Research, 17, 73-82.
Márquez, X.M. and Mountjoy, E.W. (1996). Microfractures due to overpressures
caused by thermal cracking in well-sealed Upper Devonian reservoirs, Deep
Alberta Basin. American Association of Petroleum Geologists Bulletin, 80, 570-
588
McAuliffe, C.D. (1979). Oil and gas migration - chemical and physical constraints.
American Association of Petroleum Geologists Bulletin, 63, 761-781.
McClure, I.M., Smith, D.N., Williams, A.F., Clegg, L.J. and Ford, C.C. (1988). Oil
and gas fields in the Barrow Sub-basin. In: Purcell P.G. and Purcell R.R. eds.,
The North West Shelf, Australia (pp. 371-390): Proceedings of the Petroleum
Exploration Society of Australia, Perth, 1988.
McKenzie, D. (1978). Some remarks on the development of sedimentary basin.
Earth and Planetary Science Letters, 40, 25-32.
McTavish, R.A. (1978). Pressure retardation of vitrinite diagenesis, offshore north-
west Europe. Nature, 271, 648-650.
McTavish, R.A. (1998). The role of overpressure in the retardation of organic matter
maturation. Journal of Petroleum Geology, 21, 153-186.
Mello, U.T. and Karner, G.D. (1996). Development of sediment overpressure and its
effect on thermal maturation: application to the Gulf of Mexico Basin. American
Association of Petroleum Geologists Bulletin, 80, 1367-1396.
Middleton, M.F. (1982). Tectonic history from vitrinite reflectance. Geophysical
Journal of the Royal astronomical Society, 68, 121-132.
Middleton, M.F. and Hunt, J.W. (1989). Influence of tectonics on Permian coal-rank
patterns in Australia. International Journal of Coal Geology, 13, 391-411.
Miller, L.R. and Smith, S.A. (1996) The development and regional significance of
rift-related depositional systems in the Dampier Sub-basin. Australian Petroleum
Production and Exploration Association Journal, 36, 369-384.
References
240
Miller, T.W. and Luk, C.H. (1993). Contributions of compaction and aquathermal
pressuring to geopressure and the influence of environmental conditions:
Discussion. American Association of Petroleum Geologists Bulletin, 77, 2006-
2010.
Müller, R.D., Mihut, D. and Baldwin, S. (1998). A new kinematic model for the
formation and evolution of the west and northwest Australian margin. In: Purcell
P.G. and Purcell R.R. eds., The Sedimentary Basins of Western Australia 2 (pp.
55-71): Proceedings of the Petroleum Exploration Society of Australia, Perth,
1998.
Nielsen, S.B. (1996). Sensitivity analysis in thermal and maturity modelling. Marine
and Petroleum Geology, 13, 415-425.
Ortoleva, P.J. (1994). Basin compartmentation: definitions and mechanisms. In:
Ortoleva, P.J. ed., Basin Compartments and Seals (pp. 39-51): American
Association of Petroleum Geologists Memoir, 61.
Osborne, M.J. and Swarbrick, R.E. (1997). Mechanisms for generating overpressure
in sedimentary basins: a re-evaluation. American Association of Petroleum
Geologists Bulletin, 81, 1023-1041.
Parry, J.C. and Smith, D.N. (1988). The Barrow and Exmouth Sub-basins. In:
Purcell P.G. and Purcell R.R. eds., The North West Shelf, Australia (pp. 129-
145): Proceedings of the Petroleum Exploration Society of Australia, Perth,
1988.
Peters, K.E. (1986). Guidelines for evaluating petroleum source rock using
programmed pyrolysis. American Association of Petroleum Geologists Bulletin,
70, 318-329.
Peters, K.E. and Moldowan, J.M. (1993). The biomarker guide: interpreting
molecular fossils in petroleum and ancient sediments (pp. 220-251). Englewood
Cliffs, New Jersey: Prentice Hall.
Petroleum Division of the Department of Minerals and Energy, Western Australia
(1999). North West Shelf oil and gas.
Pickard, G.L. and Emery, W.J. (1982). Physical oceanography: an introduction (4th
edition). Oxford: Pergamon Press, 249 p.
Pitchford, A., Teerman, S.C. and Clark, P.A. (1999). The use of oil fingerprinting to
enhance field production on Barrow Island. Australian Petroleum Production
and Exploration Association Journal, 39, 408-419.
References
241
Platte River Associates, Inc. (1996). BasinMod 1D Basin Modelling System
(version, 5.20) (unpublished).
Platte River Associates, Inc. (1998a). BasinMod 1D Basin Modelling System
(version, 7.00) (unpublished).
Platte River Associates, Inc. (1998b). BasinMod 2D Basin Modelling System
(version, 2.52) (unpublished).
Plumley, W.J. (1980). Abnormally high fluid pressure: survey of some basic
principles. American Association of Petroleum Geologists Bulletin, 64, 414-430.
Polomka, S.M., Bruins, J., Spanninga, G.A. and Mennie, J.P. (1999). WA-271-P,
Exmouth Sub-basin - integrated prospectivity evaluation. Australian Petroleum
Production and Exploration Association Journal, 39, 115-127.
Powell, T.G. and McKirdy, D.M. (1972). The geochemical characterization of
Australian crude oils. Australian Petroleum Exploration Association Journal, 12,
125-131.
Powell, T.G. and McKirdy, D.M. (1973a). Crude oil correlations in the Perth and
Carnarvon Basins. Australian Petroleum Exploration Association Journal, 13,
81-85.
Powell, T.G. and McKirdy, D.M. (1973b). Relationship between ratio of pristane to
phytane, crude oil composition and geological environment in Australia. Nature
Physical Science, 243, 37-39.
Powers, M.C. (1967). Fluid release mechanisms in compacting marine mudrocks
and their importance in oil exploration. American Association of Petroleum
Geologists Bulletin, 51, 1240-1254.
Powley, D.E. (1990). Pressure compartments and fluid flow in basins. In: V. M.
Goldschmidt conference, program and abstracts (p. 75): Geochem. Soc., United
States. 1990.
Price, L.C. and Barker, C.E. (1985). Suppression of vitrinite reflectance in
amorphous rich kerogen - a major unrecognized problem. Journal of Petroleum
Geology, 8, 59-84.
Price, L.C. and Wenger, L.M. (1992). The influence of pressure on petroleum
generation and maturation as suggested by aqueous pyrolysis. Organic
Geochemistry, 19, 1-3, 141-159.
Purcell, P.G. and Purcell, R.R. (1994). The sedimentary basin of Western Australia:
An introduction. In: P. G. and R. R. Purcell eds., The Sedimentary Basins of
References
242
Western Australia (pp. 3-18): Proceedings of the Petroleum Exploration Society
of Australia, Perth, 1994.
Quilty, P.G. (1977). Cenozoic sedimentation cycles in Western Australia. Geology,
5, 336-340.
Ramm, M. (1992). Porosity-depth trends in reservoir sandstones: off-shore Norway.
Marine and Petroleum Geology, 9, 553-567.
Raymond, A.C. and Murchison, D.G. (1991). Influence of exinitic macerals on the
reflectance of vitrinite in Carboniferous sediments of the Midland Valley of
Scotland. Fuel, 70, 155-161.
Robertson Research Australia Pty. Ltd. (1986). Petroleum geology and
geochemistry, North West Shelf, Australia (unpublished).
Sajgó, Cs., McEvov, J., Wolff, G.A. and Horváth, Z.A. (1986). Influence of
temperature and pressure on maturation processes-I. Preliminary report. Organic
Geochemistry, 10, 331-337.
Sahimi, M. (1995). Flow and transport in porous media and fractured rock (482 p.).
VCH Verlagsgesellcshaft mbH, Weinheim.
Samuelsson, J. and Middleton, M.F. (1998). A thermal maturation study of the
Carnarvon Basin, Australia and the northern North Sea, Europe. Exploration
Geophysics, 29, 597-604.
Schegg, R., Cornford, C. and Leu, W. (1999). Migration and accumulation of
hydrocarbon in the Swiss Molass Basin: implication of a 2D basin modeling
study. Marine and Petroleum Geology, 16, 511-531.
Schenk, H.J., Horsfield, B., Krooss, B., Schaefer, R.G. and Schwochau, K. (1997).
Kinetics of petroleum formation and cracking. In: D.H. Welte, B. Horsfield and
D.R. Baker eds., Petroleum and Basin Evolution (pp. 233-269): Springer-Verlag
Berlin: Scientific Publishing Services (P) Ltd, Madras.
Schmidt, G.W. (1973). Interstitial water composition and geochemistry of deep Gulf
Coast shales and sandstones. American Association of Petroleum Geologists
Bulletin, 57, 321-337.
Schön, J.H. (1996). Physical properties of rocks, fundamentals and principles of
petrophysics. New York: Elsevier Science.
Schowalter, T. (1979). Mechanics of secondary hydrocarbon migration, and
entrapment. American Association of Petroleum Geologists Bulletin, 63, 723-
760.
References
243
Sclater, J.G. and Christie, P.A.F. (1980). Continental stretching: an explanation of
the post-mid-Cretaceous subsidence of the central North Sea Basin. Journal of
Geophysical Research, 85, 3711-3739.
Scott, J. (1992). Accurate recognition of source rock character in the Jurassic of the
North West Shelf, Western Australia. Australian Petroleum Exploration
Association Journal, 32, 289-299.
Scott, J. (1994). Source rocks of Western Australia - distribution, character and
models. In: Purcell P. G. and Purcell R. R. eds., The Sedimentary Basins of
Western Australia (pp. 141-155): Proceedings of the Petroleum Exploration
Society of Australia, Perth, 1994.
Snowdon, L.R. (1995). Rock-Eval Tmax suppression: documentation and
amelioration. American Association of Petroleum Geologists Bulletin, 79, 1337-
1348.
Spencer, C.W. (1987). Hydrocarbon generation as a mechanism for overpressure in
the Rocky Mountains region. American Association of Petroleum Geologists
Bulletin, 71, 368-388.
Stagg, M.J. and Colwell, J.B. (1994). The structure foundations of the Northern
Carnarvon Basin. In: Purcell, P. G. and Purcell, R. R. eds., The Sedimentary
Basins of Western Australia (pp. 349-364): Proceedings of the Petroleum
Exploration Society of Australia, Perth, 1994.
Steckler, M.S. and Watts, A.B. (1978). Subsidence of the atlantic-type continental
margin off New York. Earth and Planetary Science Letters, 41, 1-13.
Stein, A. (1994). Rankin Platform, Western Australia: structural development and
exploration potential. In: Purcell P. G. and Purcell R. R. eds., The Sedimentary
Basins of Western Australia (pp. 509-523): Proceedings of the Petroleum
Exploration Society of Australia, Perth, 1994.
Swarbrick, R.E. (1995). Distribution and generation of the overpressure system,
Eastern Delaware Basin, Western Texas and Southern New Mexico: Discussion.
American Association of Petroleum Geologists Bulletin, 79, 1817-1821.
Swarbrick, R.E. and Osborne, M.J. (1998). Mechanisms that generate abnormal
pressures: an overview. In: Law, B.E., Ulmishek, G.F. and Slavin, V.I. eds.,
Abnormal pressures in hydrocarbon environments (pp. 13-34): American
Association of Petroleum Geologists Memoir, 70.
References
244
Swarbrick, R.E. and Hillis, R.R. (1999). The origin and influence of overpressure
with reference to the North West Shelf, Australia. Australian Petroleum
Production and Exploration Association Journal, 39, 64-72.
Sweeney, J.J. and Burnham, A.K. (1990). Evaluation of a simple model of vitrinite
reflectance based on chemical kinetics. American Association of Petroleum
Geologists Bulletin, 74, 1559-1570.
Swift, M. G., Stagg, H. M. J. and Falvey, D. A. (1988). Heat flow regime and
implications for oil maturation and migration in the Offshore Northern
Carnarvon Basin. In: Purcell, P. G. and Purcell, R. R. eds., The North West Shelf,
Australia (pp. 540-551): Proceedings of the Petroleum Exploration Society of
Australia, Perth, 1988.
Tait, A.M. (1985). A depositional model for the Dupuy Member and the Barrow
Group in the Barrow Sub-basin, Northwestern Australia. Australian Petroleum
Exploration Association Journal, 25, 282-290.
Teerman, S.C. (1994). Organic petrographic analysis of selected intervals in nine
Barrow Sub-basin wells. Report., Approval No. S30940 (unpublished).
Teichmüller, M. and Durand, B. (1983). Fluorescence in microscopical rank studies
on liptinites and vitrinites in peat and coals, and comparison with the results of
the rock-Eval pyrolysis. International Journal of Coal Geology, 2, 197-230.
Teige, G.M.G., Hermanrud, C., Wensaas, L., Bolas, H.M.N. (1999). The lack of
relationship between overpressure and porosity in North Sea and Haltenbanken
shales. Marine and Petroleum Geology, 16, 321-335.
Terzaghi, K. (1923). Die berechnung der durchlässigkeitsziffer des tones as dem
verlauf der hydrodynamichen spannungsercheinungen: Sitzungsgbrg. Akad.
Wiss. Wien, Math. Naturwess. K1., IIa, 132 (3/4), p. 125-138.
Timko, D.J. and Fertl, W.H. (1971). Relationship between hydrocarbon
accumulation and geopressure and its economic significance. Journal of
Petroleum Technology, 22, 923-930.
Tindale, K., Newell, N., Keall, J. and Smith, N. (1998). Structural evolution and
charge history of the Exmouth Sub-basin, Northern Carnarvon Basin, Western
Australia. In: Purcell P. G. and Purcell R. R. eds., The Sedimentary Basins of
Western Australia 2 (pp. 447-472). Proceedings of the Petroleum Exploration
Society of Australia, Perth, 1998.
References
245
Tingate, P.R., Khaksar, A, van Ruth, P., Dewhurst, D., Raven, M., Young, H.,
Hillis, R. and Dodds, K. (2001). Geological controls on overpressure in the
Northern Carnarvon Basin. Australian Petroleum Production and Exploration
Association Journal, 41, 573-593.
Tissot, B.P. and Welte D.H. (1984). Petroleum formation and Occurrence (2nd Edn)
(pp. 223, 509-523). Berlin: Springer-Verlag.
Tissot, B.P., Pelet, R. and Ungerer, P.H. (1987). Thermal history of sedimentary
basins, maturation indices, and kinetics of oil and gas generation. American
Association of Petroleum Geologists Bulletin, 71, 1445-1466.
Trendall, A.F. and Cockbain, A.E. (1990). Basin: Introduction. In: Geology and
mineral resources of Western Australia (pp. 290-293). Geological Survey of
Western Australia, Memoir, 3 (unpublished).
Ungerer, P., Burrus, J., Doligez, B., Chenet, P. Y. and Bessis, F. (1990). Basin
evaluation by integrated two-dimensional modeling of heat transfer, fluid flow,
hydrocarbon generation, and migration. American Association of Petroleum
Geologists Bulletin, 76, 309-335.
van Aarssen, B.G.K., Alexander, R. and Kagi, R.I. (1996). The origin of Barrow
Sub-basin crude oils: a geochemical correlation using land-plant biomarkers.
Australian Petroleum Production and Exploration Association Journal, 36, 465-
476.
van Aarssen, B.G.K., Bastow, T.P., Alexander, R. and Kagi, R.I. (1999). Age
determination of crude oils in the Barrow Sub-basin using palaeoclimate related
variations in higher plant biomarkers. Australian Petroleum Production and
Exploration Association Journal, 39, 399-407.
van Ruth, P., Hillis, R., Swarbrick, R and Tingate, P. (2000). Mud weights, transient
pressure tests, and the distribution of overpressure in the North West Shelf,
Australia. The Petroleum Exploration Society of Australia Journal, 28, 59-66.
Vandenbroucke, M., Durand, B. and Oudin, J.L. (1983). Detecting migration
phenomena in a geological series by means of C1-C35 hydrocarbon amounts and
distributions. In: Bjorøy, M. et al., eds., Advances in Organic Geochemistry,
1981 (pp. 147-155). Chichester, England: Wiley.
Vear, A. (1998). Analysis of the Dampier Sub-basin petroleum system using
integrated 2D modelling techniques. Australian Petroleum Production and
Exploration Association Journal, 38, 339-350.
References
246
Veenstra, E. (1985). Rift and drift in the Dampier Sub-basin, a seismic and structural
interpretation. Australian Petroleum Exploration Association Journal, 25, 177-
189.
Veevers, J.J. and Li, Z.X. (1991). Review of seafloor spreading around Australia. I.
Synthesis of the patterns of spreading. Australian Journal of Earth Sciences, 38,
391-408.
Vincent, P. and Tilbury, L. (1988). Gas and oil fields of the Ranikn Trend and
Northern Barrow-Dampier Sub-basin. In: Purcell, P. G. and Purcell, R. R. eds.,
The North West Shelf, Australia (pp. 341-369 Proceedings of the Petroleum
Exploration Society of Australia, Perth, 1988.
Volkman, J.K., Alexander, R. and Kagi, R.I. (1983). A geochemical reconstruction
of oil generation in the Barrow Sub-basin of Western Australia. Geochimica et
Cosmochimica Acta, 47, 2091-2105.
von Stackelberg, U., Exon, N.F., Von Rad, U., Quilty, P., Shafik, S., Beiersdorf, H.,
Seibertz, E. and Veevers, J.J. (1980). Geology of the Exmouth and Wallaby
plateaus off northwest Australia. Journal of Australian Geology and Geophysics,
5, 113-140.
Walderhaug, O. (1996). Kinetic modelling of quartz cementation and porosity loss
in deeply buried sandstone reservoirs. American Association of Petroleum
Geologists Bulletin, 80, 731-745.
Wangen, M. (2000). Generation of overpressure by cementation of pore space in
sedimentary rocks. Geophys. J. Int., 143, 608-620.
Waples, D.W. (1980). Time and temperature in petroleum formation: application of
Lopatin's method to petroleum exploration. American Association of Petroleum
Geologists Bulletin, 64, 916-926.
Waples, D.W. (1985). Geochemistry in Petroleum Exploration (pp. 102, 108).
Dordrecht: D. Reidel Publishing Company.
Waples, D.W., Kamata, H. and Suizu, M. (1992a). Art of Maturity modeling. Part 1:
Finding a satisfactory geologic model. American Association of Petroleum
Geologists Bulletin, 76, 31-46.
Waples, D.W., Suizu, M. and Kamata, H. (1992b). Art of Maturity modeling. Part 2:
Alternative models and sensitivity analysis. American Association of Petroleum
Geologists Bulletin, 76, 47-66.
References
247
Weedman, S. D., Brantley, S.L., Ryoji, S. and Poulson, S.R. (1996). Diagenesis,
compaction, and fluid chemistry modelling of a sandstone near a pressure seal:
Lower Tuscaloosa Formation, Gulf Coast. American Association of Petroleum
Geologists Bulletin, 80, 1045-1064.
Westphal, H. and Aigner, T. (1997). Seismic stratigraphy and subsidence analysis in
the Barrow-Dampier Subbasin, Northwest Australia. American Association of
Petroleum Geologists Bulletin, 81, 1721-1749.
Wilkins, R.W.T., Wilmshurst, J.R., Hladky, G., Ellacott, M.V. and Buckingham,
C.P. (1992a). The suppression of vitrinite reflectance in some North West Shelf
wells: Barrow-1, Jupiter-1 and Flamingo-1. Australian Petroleum Exploration
Association Journal, 32, 300-312.
Wilkins, R.W.T., Wilmshurst, J.R., Russell, N.J., Hladky, G., Ellacott, M.V. and
Buckingham, C. (1992b). Fluorescence alteration and suppression of vitrinite
reflectance. Organic Geochemistry, 18, 629-640.
Wilkins, R.W.T., Russell, N.J. and Ellacott, M.V. (1994). Fluorescence alteration
and thermal maturity modelling of Carnarvon Basin wells. In: Purcell P. G. and
Purcell R. R. eds., The Sedimentary Basins of Western Australia (pp. 415-432):
Proceedings of the Petroleum Exploration Society of Australia, Perth, 1994.
Wilkins, R.W.T., Wilmshurst, J.R., Hladky, G., Ellacott, M.V. and Buckingham,
C.P. (1995). Should fluorescence alteration replace vitrinite reflectance as a
major tool for thermal maturity determination in oil exploration? Organic
Geochemistry, 22, 191-209.
Wood, D.A. (1988). Relationship between thermal maturation indices calculated
using Arrhenius equations and Lopatin method: implications for petroleum
exploration. American Association of Petroleum Geologists Bulletin, 72, 115-
134.
Woodside Offshore Petroleum (1988). A review of the petroleum geology and
hydrocarbon potential of the Barrow-Dampier Sub-basin and Environs. In:
Purcell P. G. and Purcell R. R. eds., The North West Shelf, Australia (pp. 115-
128): Proceedings of the Petroleum Exploration Society of Australia, Perth,
1988.
Wulff, K.J. (1991). Upper Jurassic of the Barrow Sub-basin: Sedimentology,
sequence stratigraphy and implications for reservoir development (PhD thesis,
Curtin University of Technology).
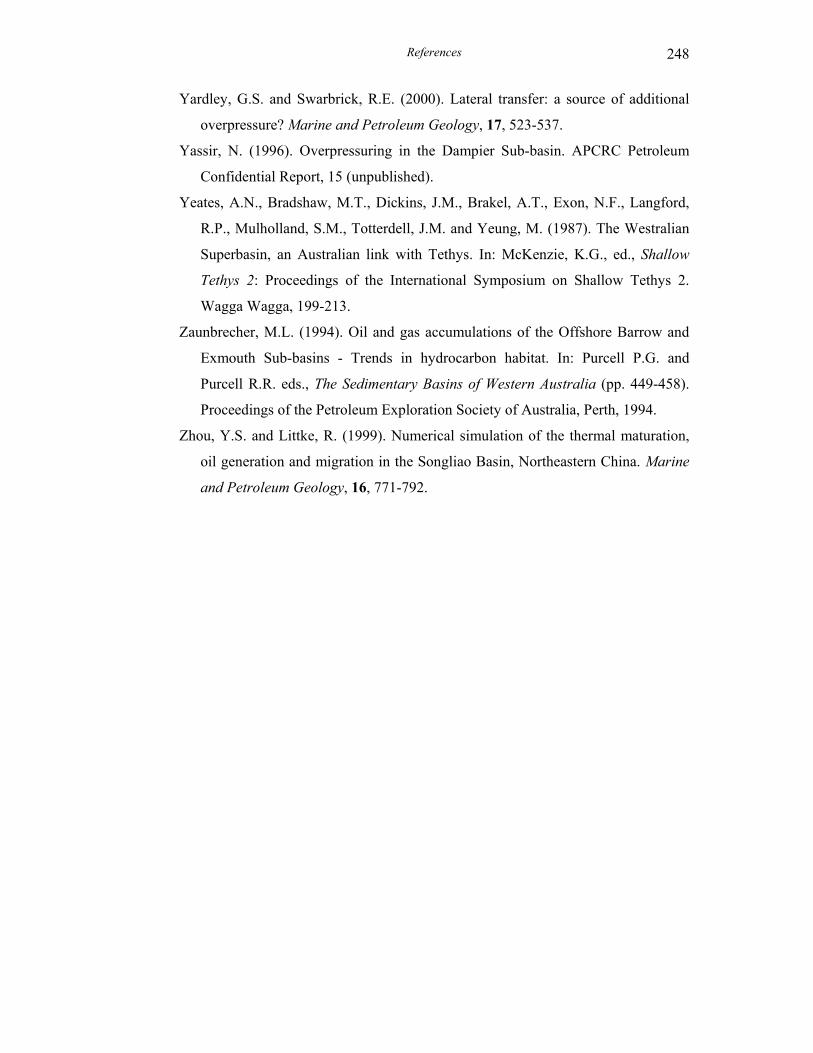
References
248
Yardley, G.S. and Swarbrick, R.E. (2000). Lateral transfer: a source of additional
overpressure? Marine and Petroleum Geology, 17, 523-537.
Yassir, N. (1996). Overpressuring in the Dampier Sub-basin. APCRC Petroleum
Confidential Report, 15 (unpublished).
Yeates, A.N., Bradshaw, M.T., Dickins, J.M., Brakel, A.T., Exon, N.F., Langford,
R.P., Mulholland, S.M., Totterdell, J.M. and Yeung, M. (1987). The Westralian
Superbasin, an Australian link with Tethys. In: McKenzie, K.G., ed., Shallow
Tethys 2: Proceedings of the International Symposium on Shallow Tethys 2.
Wagga Wagga, 199-213.
Zaunbrecher, M.L. (1994). Oil and gas accumulations of the Offshore Barrow and
Exmouth Sub-basins - Trends in hydrocarbon habitat. In: Purcell P.G. and
Purcell R.R. eds., The Sedimentary Basins of Western Australia (pp. 449-458).
Proceedings of the Petroleum Exploration Society of Australia, Perth, 1994.
Zhou, Y.S. and Littke, R. (1999). Numerical simulation of the thermal maturation,
oil generation and migration in the Songliao Basin, Northeastern China. Marine
and Petroleum Geology, 16, 771-792.
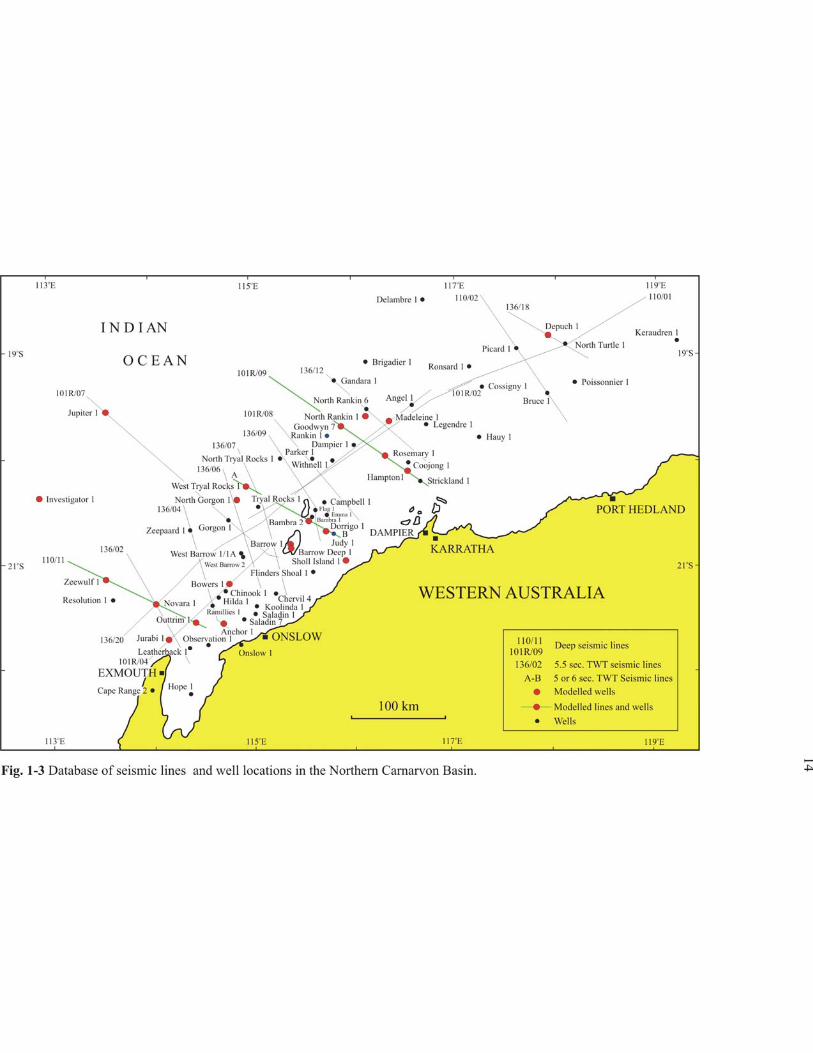
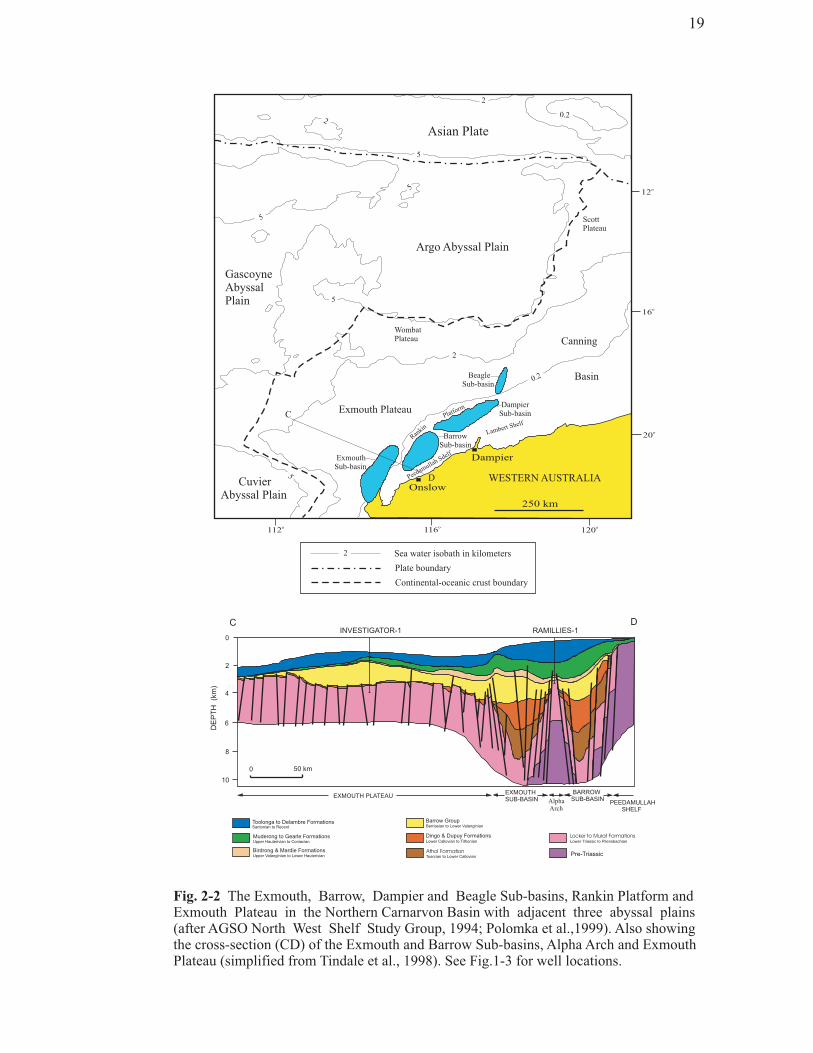
Dampier
Onslow
250 km
12o
16o
20o
120o
116o
112o
Argo Abyssal Plain
GascoyneAbyssalPlain
CuvierAbyssal Plain
WombatPlateau
ScottPlateau
Canning
Basin
WESTERN AUSTRALIA
0.2
2
5
2
0.2
5
5
2
5
5
ExmouthSub-basin
BarrowSub-basin
DampierSub-basin
BeagleSub-basin
Rankin
Platform
Peedamullah Sdelf
Lambert Shelf
2 Sea water isobath in kilometers
Plate boundary
Continental-oceanic crust boundary
Exmouth PlateauC
D
0
2
4
6
8
10
INVESTIGATOR-1 RAMILLIES-1
0 50 km
EXMOUTHSUB-BASIN
DE
PT
H(k
m)
EXMOUTH PLATEAUBARROWSUB-BASIN
PEEDAMULLAHSHELF
Santonian to Recent
Upper Hauterivian to Coniacian
Upper Valanginian to Lower Hauterivian
Berriasian to Lower Valanginian
Lower Callovian to Tithonian
Toarcian to Lower Callovian
Lower Triassic to Pliensbachian
Pre-Triassic
Toolonga to Delambre Formations
Muderong to Gearle Formations
Birdrong & Mardie Formations
Barrow Group
Dingo & Dupuy Formations
Athol Formation
Locker to Murat Formations
C D
AlphaArch
Fig. 2-2 The Exmouth, Barrow, Dampier and Beagle Sub-basins, Rankin Platform andExmouth Plateau in the Northern Carnarvon Basin with adjacent three abyssal plains(after AGSO North West Shelf Study Group, 1994; Polomka et al.,1999). Also showingthe cross-section (CD) of the Exmouth and Barrow Sub-basins, Alpha Arch and ExmouthPlateau (simplified from Tindale et al., 1998). See Fig.1-3 for well locations.
19
Asian Plate

QUATERNARY
AGEMa
ROCK UNITSLITHOLOGY
TE
RT
IAR
Y
PLIOCENE
MIOCENE
OLIGOCENE
EOCENE
PALEOCENE
NE
OG
EN
EPA
LE
OG
EN
E
MAASTRICHTIAN
CAMPANIAN
SANTONIANCONIACIANL
AT
E
TURONIAN
CENOMANIAN
ALBIAN
APTIAN
BARREMIAN
HAUTERIVIAN
VALANGINIAN
BERRIASIANNE
OC
OM
IAN
EA
RL
YCR
ET
AC
EO
US
JUR
AS
SIC
LA
TE
MID
DL
EE
AR
LY
KIMMERIDGIAN
OXFORDIAN
CALLOVIAN
BATHONIAN
BAJOCIAN
AALENIAN
TOARCIAN
PLIENSBACHIAN
SINEMURIAN
HETTANGIANRHAETIAN
NORIAN
CARNIAN
LADINIAN
ANISIAN
SCYTHIAN
TR
IAS
SIC
LA
TE
ME
PRE-TRIASSIC
TITHONIAN
DELAMBRE FORMATION
CAPE RANGE GROUP
GIRALIA CALCARENITE
CARDABIA GROUP
MIRIAKOROJ. WITH.
TOOLONGACALCILUTITE
GEARLESILTSTONE
HAYCOCKMARL
MUDERONGSHALE
BARROWGROUP
FORESTIERCLAYSTONE
DUPUYFORMATION
DINGOCLAYSTONE
ATHOLFORMATION
MURATSILTSTONE
MUNGAROOFORMATION
LOCKERSHALE
TECTONICSTAGE
WINDALIARADIOLARITE
WINDALIA SANDSTONE
Post-rift
Syn-rift
Pre-rift
1.8
5.2
23.3
35.4
56.5
65
74
83
86.688.590.4
97
111
124.5
131.2
134
140.7
145.5
152.1
154.7
157.1
161.3
166.1
173.5
178
187
194.5
203.5
208209.5
223.4
235
239.5
241.1
245
Limestone Marl Sandstone Shaleor Claystone
MuddySandstone
Siltstoneand Claystone
CoalMeasures
LEGENDRE
FORMATION
BRIGADIER FM.
ANGEL SST
MARDIE GRNSD
BIRDRONG SST
Break up136 Ma
Break up155 Ma
Syn-rift
Fig. 2-3 Generalized stratigraphic column of the sub-basins in the Northern Carnarvon Basin(after Blevin et al., 1994; Labutis, 1994; Stagg and Colwell,1994; Polomka et al.,1999).
20
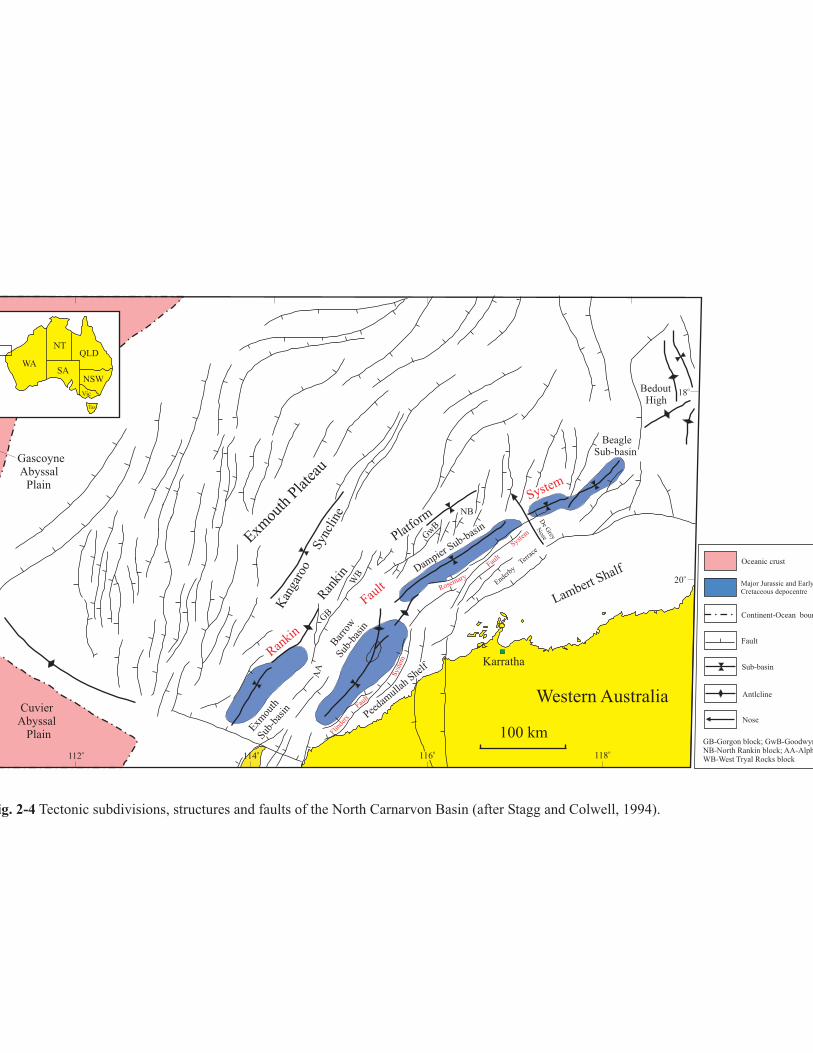
ig. 2-4 Tectonic subdivisions, structures and faults of the North Carnarvon Basin (after Stagg and Colwell, 1994).
Oceanic crust
Major Jurassic and EarlyCretaceous depocentre
Continent-Ocean boun
GB-Gorgon block; GwB-GoodwynNB-North Rankin block; AA-AlphWB-West Tryal Rocks block
Exmou
thPla
teau
Platfo
rm
Exmou
th
Sub-
basin
Bar
row
Sub-
basi
n
Dampier
Sub-basin
BeagleSub-basin
BedoutHigh
Lambert Shalf
GB
WB
Gw
B
NB
Ran
kin
Flinde
rs
Fault
System
CuvierAbyssal
Plain
GascoyneAbyssal
Plain
100 km
Western Australia
Karratha
112o
114o 118
o
20o
18o
116o
Peedam
ullah
Shelf
WA
NTQLD
SANSW
Vic
Tas
RosemaryEnder
byTer
race
Fault
Sys
tem
Kan
garo
oSyn
clin
e
Rankin
Fault
System
AA
Fault
Sub-basin
Antlcline
Nose
De
Grey
Nose
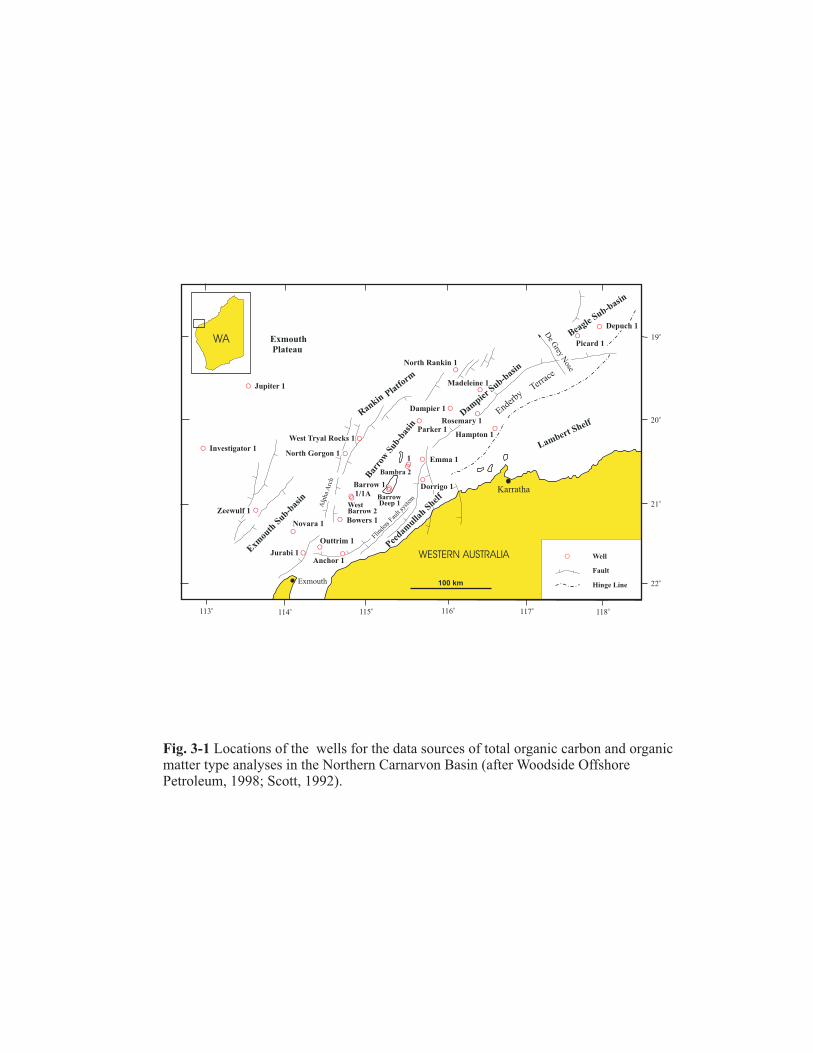
Fig. 3-1 Locations of the wells for the data sources of total organic carbon and organicmatter type analyses in the Northern Carnarvon Basin (after Woodside OffshorePetroleum, 1998; Scott, 1992).
O
OO
O
O
O
O
RankinPla
tform
Beagle
Sub-basin
Flinde
rsFau
ltsy
stem
Enderby
Terrac
e
Lambert Shelf
WESTERN AUSTRALIA
100 km
Karratha
Exmouth
Fault
Hinge Line
Bambra 2
North Rankin 1
117o
113o
22o
20o
ExmouthPlateau
Jupiter 1
Investigator 1
Depuch 1
Madeleine 1
North Gorgon 1
Jurabi 1
115o
21o
19o
118o116
o
114o
Well
O
BarrowDeep 1
Bowers 1
Anchor 1
Peedam
ullah
Shelf
De
Grey
Nose
WA
O
ODampier 1
O
OWest Tryal Rocks 1
O
O
OBarrow 1
O
O
O
O
O
O
Outtrim 1
Zeewulf 1
O
Dorrigo 1
Hampton 1
Novara 1
Exm
outh
Sub-bas
in
Alp
ha
Arc
h
Bar
row
Sub-
basi
n Rosemary 1D
ampie
r Sub-basin
O
Picard 1
O
Parker 1
Emma 1O1
OO
WestBarrow 2
1/1A
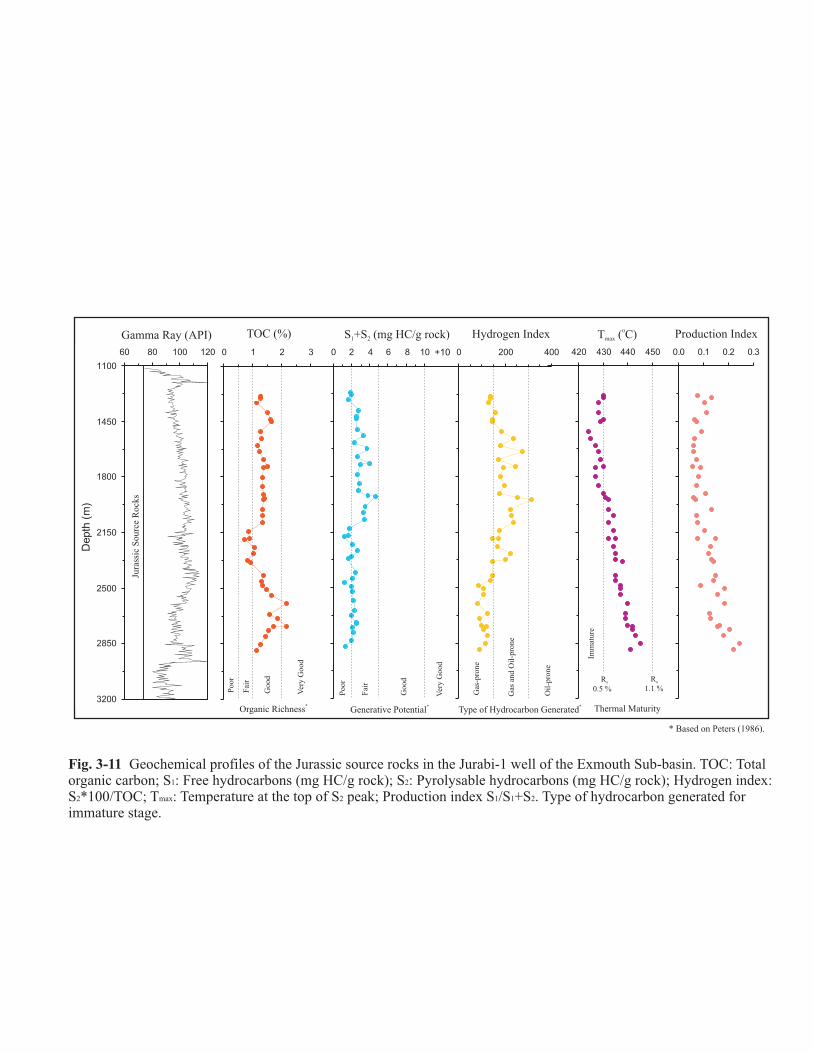
Fig. 3-11 Geochemical profiles of the Jurabi-1 well of the Exmouth Sub-basin. TOC: Totalorganic carbon; S : Free hydrocarbons (mg HC/g rock); S : Pyrolysable hydrocarbons (mg HC/g rock); Hydrogen index:S *100/TOC; T : Temperature at the top of S peak; Production index S /S +S . Type of hydrocarbon generated forimmature stage.
the Jurassic source rocks in1 2
2 max 2 1 1 2
0 2 4 6 8 10
TOC (%) S +1 S (mg HC/g rock)2
0 1 2 3
Gamma Ray (API)
Poor
Fai
r
Good
Ver
yG
ood
Hydrogen Index T ( C)max
oProduction Index
0 200 400
Gas
-pro
ne
Gas
and
Oil
-pro
ne
Oil
-pro
ne
420 430 440 450 0.0 0.1 0.2 0.3
Ro
0.5 %
R
1.1 %o
Type of Hydrocarbon Generated*
1100
1450
1800
2150
2500
2850
3200
60 80 100 120
Depth
(m)
Jura
ssic
Sourc
eR
ock
s
Organic Richness*
Generative Potential*
Poor
Fai
r
Ver
yG
ood
Good
Thermal Maturity
+10
Imm
ature
* Based on Peters (1986).
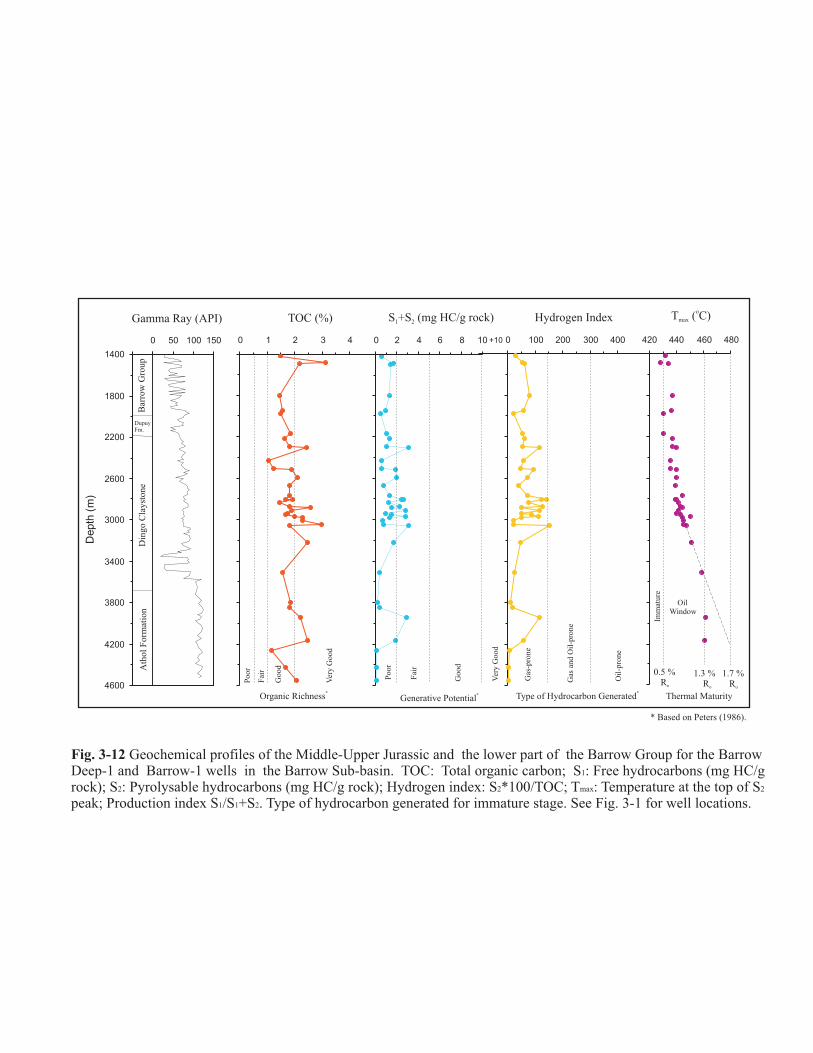
Fig. 3-12 Geochemical profiles of the Middle-Upper Jurassic and the lower part of the Barrow Group for the BarrowDeep-1 and Barrow-1 wells in the Barrow Sub-basin.
Type of hydrocarbon generated for immature stage. See Fig. 3-1 for well locations.
TOC: Total organic carbon; S : Free hydrocarbons (mg HC/grock); S : Pyrolysable hydrocarbons (mg HC/g rock); Hydrogen index: S *100/TOC; T : Temperature at the top of Speak; Production index S /S +S .
1
2 2 max 2
1 1 2
0 2 4 6 8 100 1 2 3 4 0 100 200 300 400 420 440 460 480
1400
1800
2200
2600
3000
3400
3800
4200
4600
-50 0 50 100 150
Depth
(m)
Bar
row
Gro
up
Din
go
Cla
yst
one
Poor
Fai
r
Good
Ver
yG
ood
Ver
yG
ood
Good
Fai
r
Poor
Gas
-pro
ne
Gas
and
Oil
-pro
ne
Oil
-pro
ne
0.5 %Ro
1.3 %Ro
1.7 %Ro
Organic Richness*
Generative Potential* Type of Hydrocarbon Generated
*
Gamma Ray (API) TOC (%) S +S (mg HC/g rock)1 2 Hydrogen Index T ( C)max
o
Imm
ature
OilWindow
DupuyFm.
Ath
ol
Form
atio
n
Thermal Maturity
+10
* Based on Peters (1986).
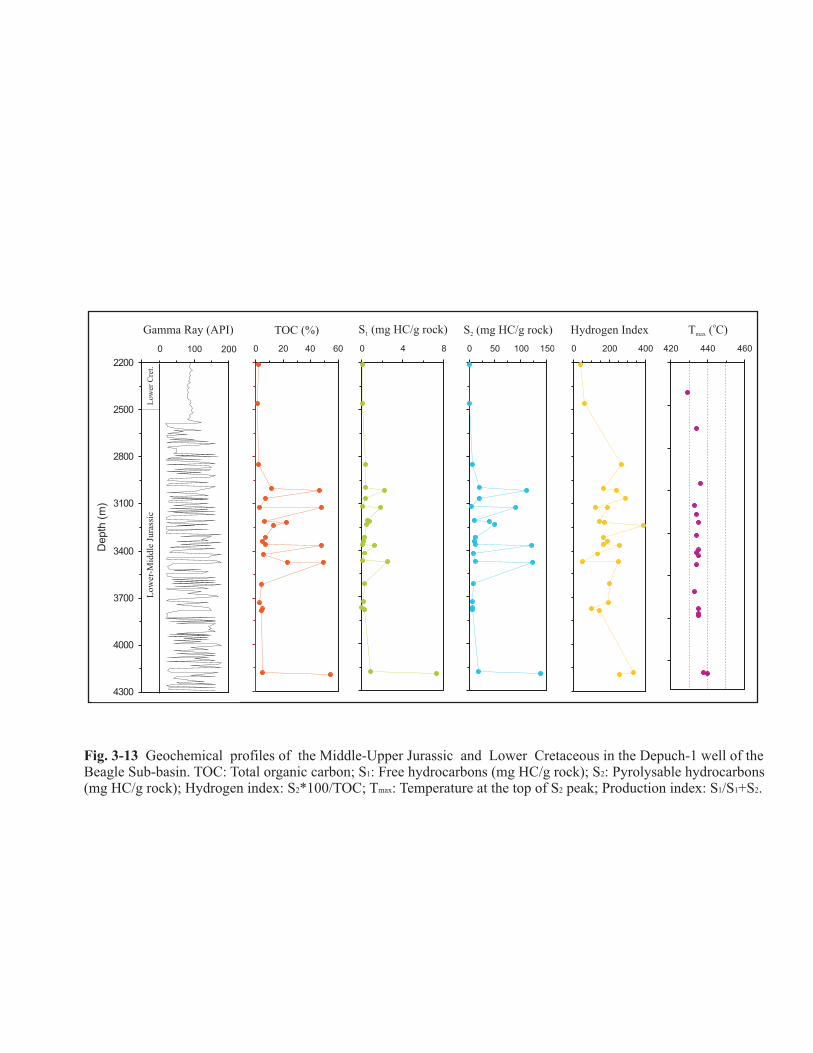
0 20 40 60 0 4 8 0 50 100 150 0 200 400 420 440 460
Gamma Ray (API) TOC (%) S (mg HC/g rock)1 S (mg HC/g rock)2 Hydrogen Index T ( C)max
o
2200
2500
2800
3100
3400
3700
4000
4300
-50 100
Depth
(m)
0 200
Low
erC
ret.
Low
er-M
iddle
Jura
ssic
Fig. 3-13 Geochemical profiles of the Middle-Upper Jurassic and Lower Cretaceous in the Depuch-1 well of theBeagle Sub-basin. TOC: Total organic carbon; S : Free hydrocarbons (mg HC/g rock); S : Pyrolysable hydrocarbons(mg HC/g rock); Hydrogen index: S *100/TOC; T : Temperature at the top of S peak; Production index: S /S +S .
1 2
2 max 2 1 1 2
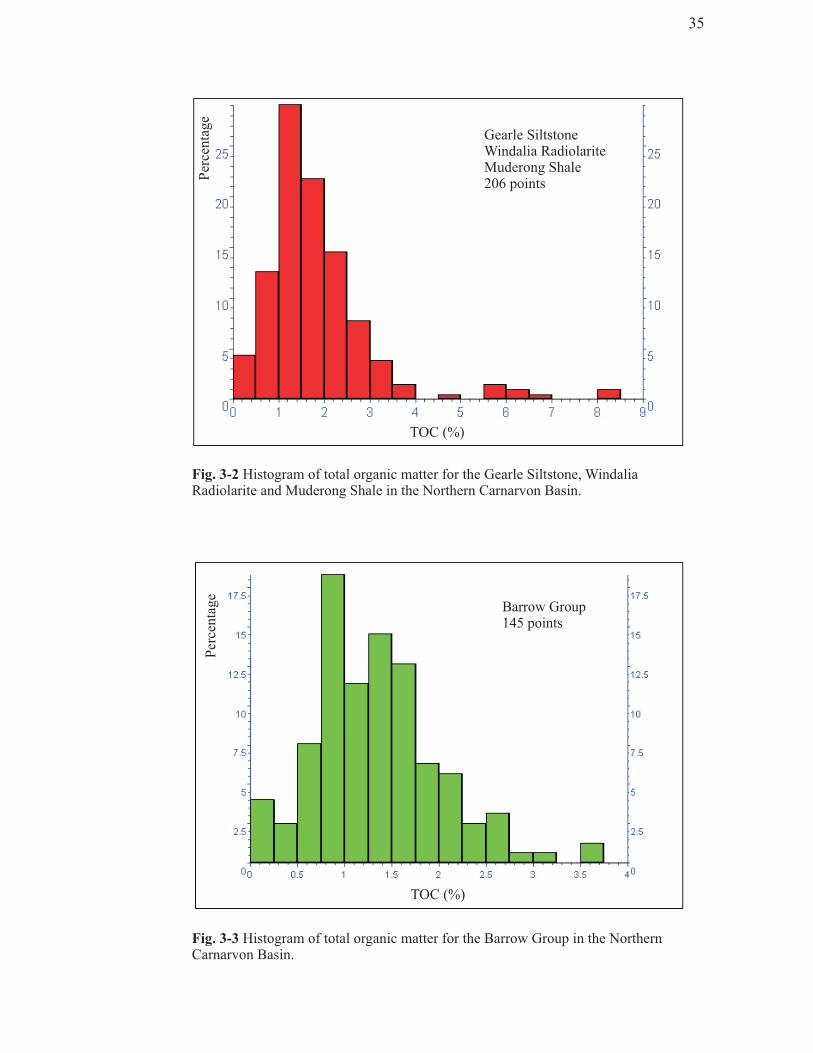
Fig. 3-2 Histogram of total organic matter for the Gearle Siltstone, WindaliaRadiolarite and Muderong Shale in the Northern Carnarvon Basin.
Fig. 3-3 Histogram of total organic matter for the Barrow Group in the NorthernCarnarvon Basin.
Gearle SiltstoneWindalia RadiolariteMuderong Shale206 points
TOC (%)
Per
centa
ge
Barrow Group145 points
Per
centa
ge
TOC (%)
35
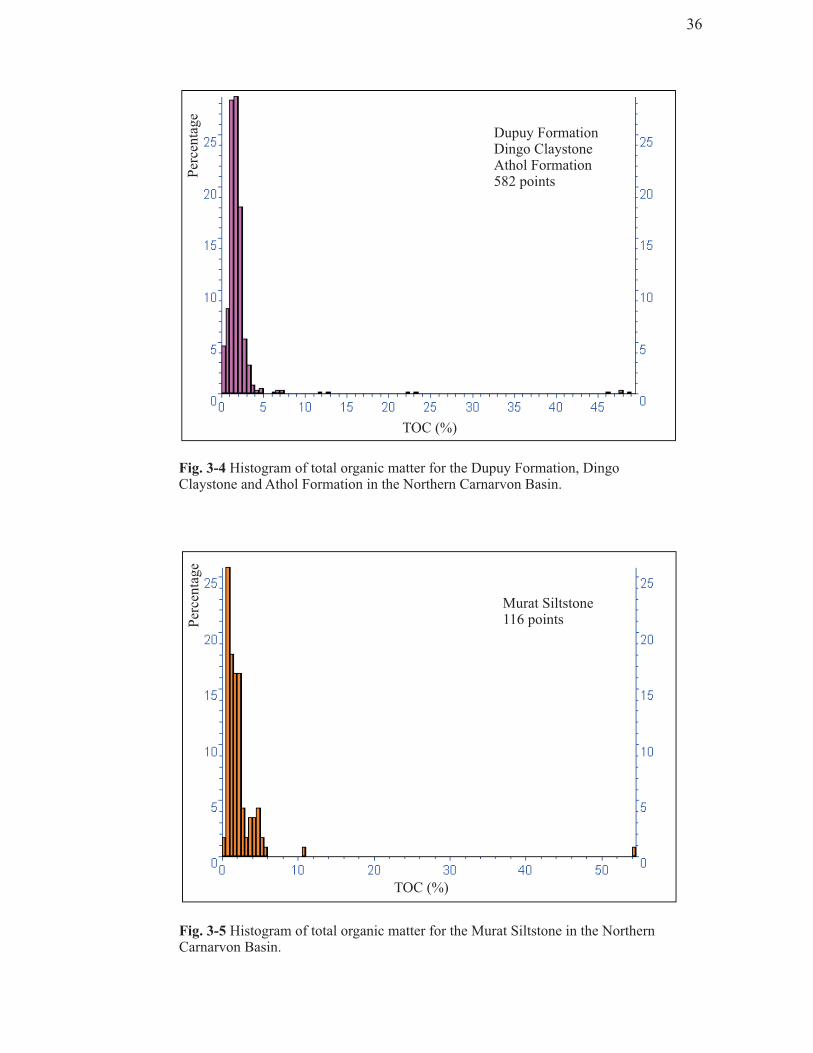
Fig. 3-4 Histogram of total organic matter for the Dupuy Formation, DingoClaystone and Athol Formation in the Northern Carnarvon Basin.
Fig. 3-5 Histogram of total organic matter for the Murat Siltstone in the NorthernCarnarvon Basin.
Dupuy FormationDingo ClaystoneAthol Formation582 points
TOC (%)
Per
centa
ge
Murat Siltstone116 points
TOC (%)
Per
centa
ge
36
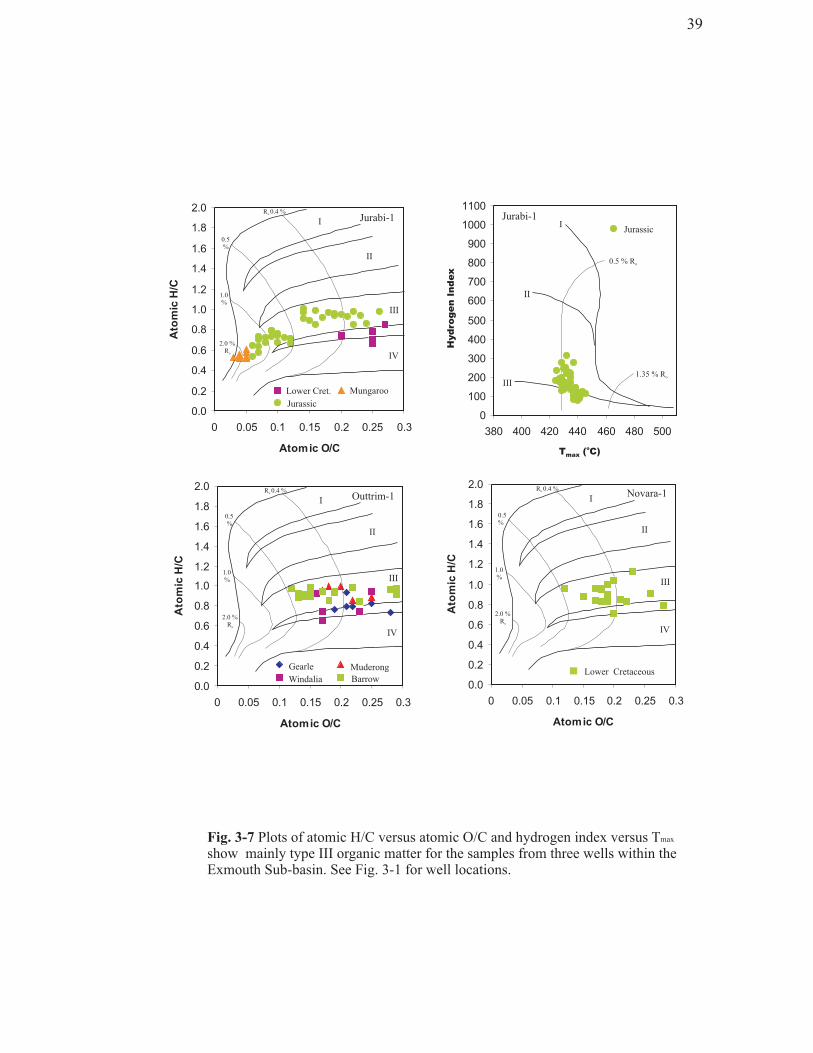
0.0
0.2
0.4
0.6
0.8
1.0
1.2
1.4
1.6
1.8
2.0
0 0.05 0.1 0.15 0.2 0.25 0.3
Atomic O/C
Ato
mic
H/C
0
100
200
300
400
500
600
700
800
900
1000
1100
380 400 420 440 460 480 500
0.0
0.2
0.4
0.6
0.8
1.0
1.2
1.4
1.6
1.8
2.0
0 0.05 0.1 0.15 0.2 0.25 0.3
Atomic O/C
Ato
mic
H/C
0.0
0.2
0.4
0.6
0.8
1.0
1.2
1.4
1.6
1.8
2.0
0 0.05 0.1 0.15 0.2 0.25 0.3
Atomic O/C
Ato
mic
H/C
Hydro
gen
Index
T ( C)max
o
Lower Cret. Mungaroo
Jurassic
Jurassic
Jurabi-1 Jurabi-1
Novara-1
Gearle
Windalia Barrow
Muderong
Outtrim-1
Lower Cretaceous
Ro 0.4 %
0.5%
1.0%
2.0 %Ro
I
II
III
IV
Ro 0.4 %
0.5%
II
III1.0%
2.0 %Ro
IV
I
Ro 0.4 %
1.0%
2.0 %Ro
0.5%
II
IV
III
I
I
II
III
0.5 % Ro
1.35 % Ro
Fig. 3-7 Plots of atomic H/C versus atomic O/C andorganic matter for the samples from three wells within the
Exmouth Sub-basin. See Fig. 3-1 for well locations.
hydrogen index versus Tshow mainly type III
max
39
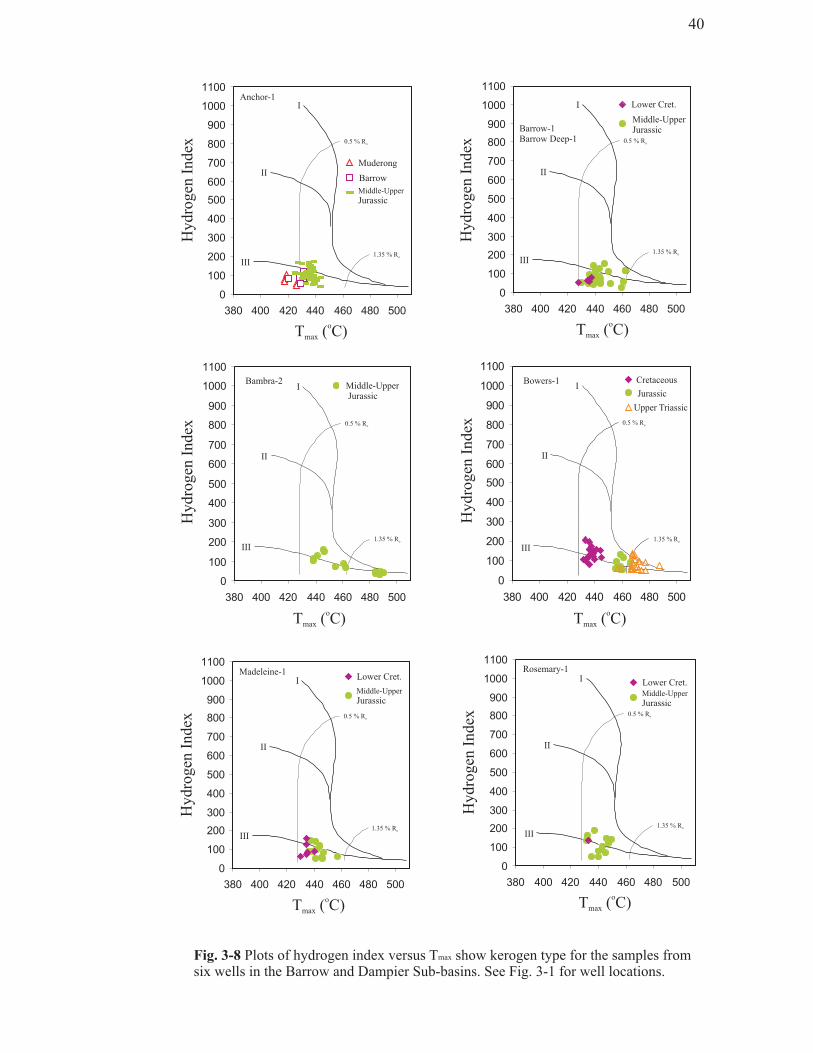
Fig. 3-8 Plots of h kerogen type for the samples fromsix wells in the Barrow and Dampier Sub-basins. See Fig. 3-1 for well locations.
ydrogen index versus T showmax
0
100
200
300
400
500
600
700
800
900
1000
1100
380 400 420 440 460 480 500
Barrow-1Barrow Deep-1
Lower Cret.
Middle-UpperJurassic
Hydro
gen
Index
T ( C)max
o
0
100
200
300
400
500
600
700
800
900
1000
1100
380 400 420 440 460 480 500
Anchor-1
Muderong
Barrow
Middle-Upper
Jurassic
Hydro
gen
Index
T ( C)max
o
I
II
III
0.5 % Ro
1.35 % Ro
I
II
III
0.5 % Ro
1.35 % Ro
0
100
200
300
400
500
600
700
800
900
1000
1100
380 400 420 440 460 480 500
0
100
200
300
400
500
600
700
800
900
1000
1100
380 400 420 440 460 480 500
Madeleine-1 Rosemary-1Lower Cret.
Middle-Upper
Jurassic
Lower Cret.Middle-Upper
Jurassic
Hydro
gen
Index
T ( C)max
o
Hydro
gen
Index
T ( C)max
o
I
II
III
0.5 % Ro
1.35 % Ro
I
II
III1.35 % Ro
0.5 % Ro
0
100
200
300
400
500
600
700
800
900
1000
1100
380 400 420 440 460 480 500
T ( C)max
o
Hydro
gen
Index
0.5 % Ro
1.35 % Ro
I
II
III
Bambra-2Middle-UpperJurassic
0
100
200
300
400
500
600
700
800
900
1000
1100
380 400 420 440 460 480 500
Hy
dro
gen
Ind
ex
Jurassic
0.5 % Ro
Cretaceous
Upper Triassic
1.35 % Ro
T ( C)max
o
Bowers-1I
II
III
40
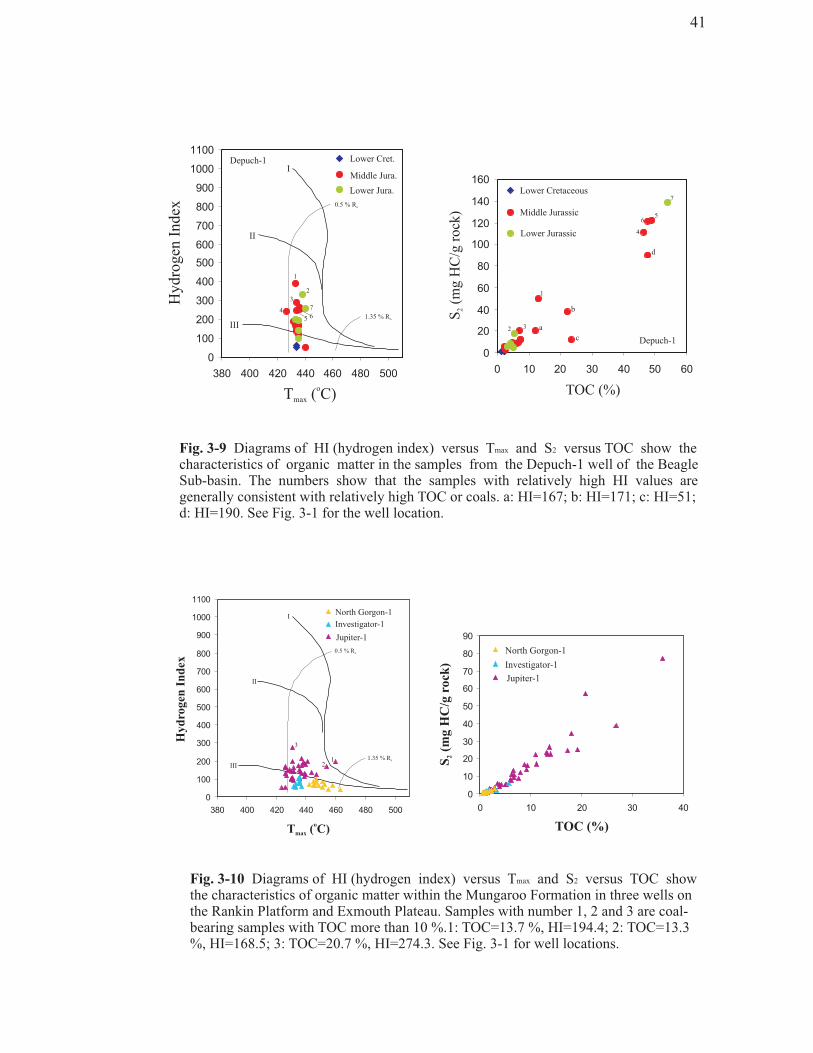
Fig. 3-9 Diagrams of HI (hydrogen index) versus T and S versus TOC show thecharacteristics of organic matter in the samples from the Depuch-1 well of the BeagleSub-basin. The numbers show that the samples with relatively high HI values aregenerally consistent with relatively high TOC or coals. a: HI=167; b: HI=171; c: HI=51;d: HI=190. See Fig. 3-1 for the well location.
max 2
Fig. 3-10 Diagrams of HI versus T and S versus TOC showthe characteristics of organic matter within the Mungaroo Formation in three wells onthe Rankin Platform and Exmouth Plateau. Samples with number 1, 2 and 3 are coal-bearing samples with TOC more than 10 %.1: TOC=13.7 %, HI=194.4; 2: TOC=13.3%, HI=168.5; 3: TOC=20.7 %, HI=274.3. See Fig. 3-1 for well locations.
max 2(hydrogen index)
41
0
100
200
300
400
500
600
700
800
900
1000
1100
380 400 420 440 460 480 500
Hyd
rogen
Ind
ex
T ( C)max
o
North Gorgon-1
Investigator-1
Jupiter-1
1.35 % Ro
0.5 % Ro
I
II
III
0
10
20
30
40
50
60
70
80
90
0 10 20 30 40
TOC (%)
S(m
gH
C/g
rock
)2
North Gorgon-1
Investigator-1
Jupiter-1
12
3
0
100
200
300
400
500
600
700
800
900
1000
1100
380 400 420 440 460 480 500
0
20
40
60
80
100
120
140
160
0 10 20 30 40 50 60
Depuch-1
Depuch-1
Lower Cret.
Middle Jurassic
Lower Cretaceous
Lower Jurassic
Middle Jura.
Lower Jura.
Hydro
gen
Index
T ( C)max
o TOC (%)
S(m
gH
C/g
rock
)2
I
II
III
0.5 % Ro
1.35 % Ro
1
2
3
4
5 6
65
7
7
2
4
1
3 a
b
c
d
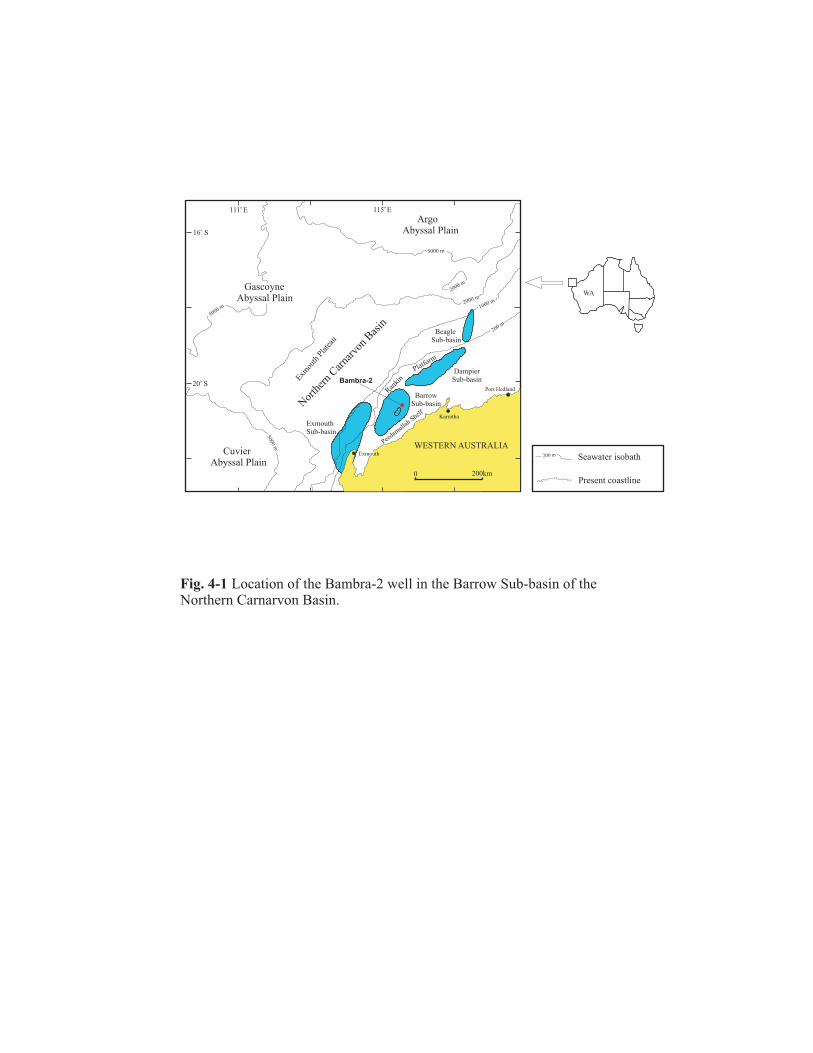
WA
ArgoAbyssal Plain
GascoyneAbyssal Plain
CuvierAbyssal Plain
Exmou
thPl
atea
uBeagle
Sub-basin
DampierSub-basin
BarrowSub-basin
WESTERN AUSTRALIA
5000 m
2000 m
2000 m
200 m
1000 m
5000 m
5000m
200km0
Port Hedland
Karratha
ExmouthSub-basin
115 Eo
20 So
16 So
111 Eo
Ran
kin
Platform
Exmouth
Peedam
ullah
Shelf
200 m Seawater isobath
Present coastline
Nor
ther
nCar
narv
onBas
in
Bambra-2
Fig. 4-1 Location of the Bambra-2 well in the Barrow Sub-basin of theNorthern Carnarvon Basin.
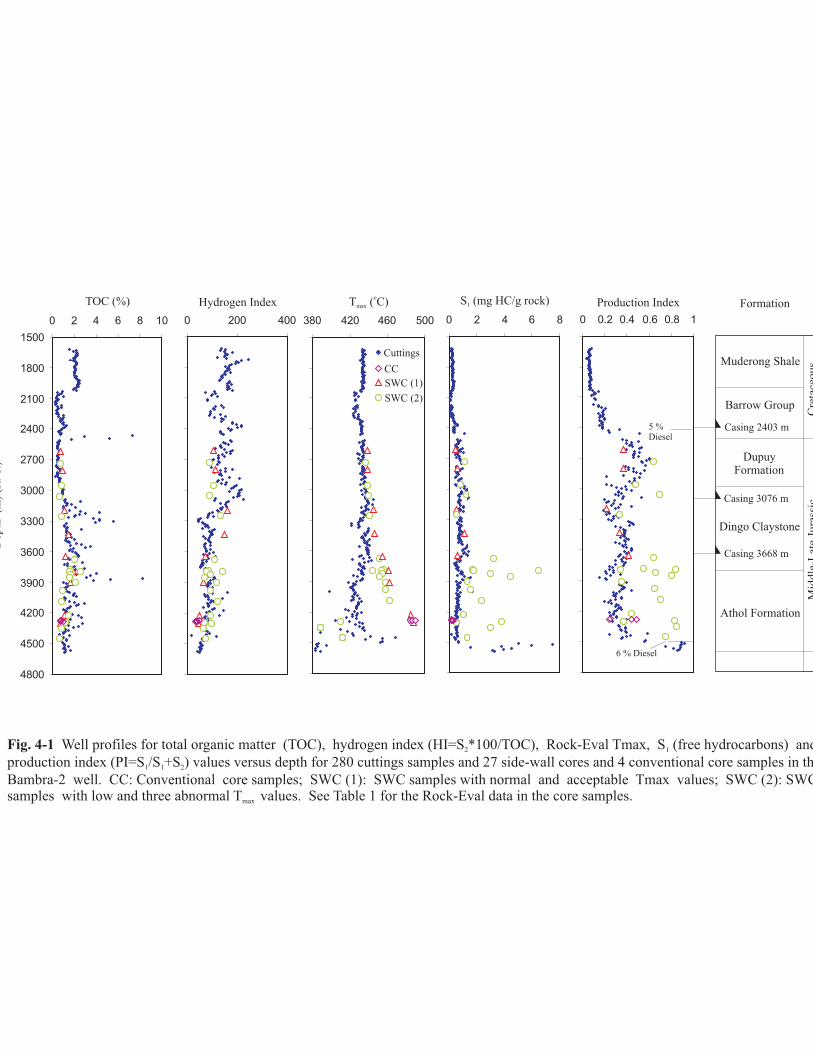
Fig. 4-1 Well profiles for total organic matter (TOC), hydrogen index (HI=S *100/TOC), Rock-Eval Tmax, S (free hydrocarbons) and
production index (PI=S /S +S ) values versus depth for 280 cuttings samples and 27 side-wall cores and 4 conventional core samples in th
Bambra-2 well. CC: Conventional core samples; SWC (1): SWC samples with normal and acceptable Tmax values; SWC (2): SWCsamples with low and three abnormal T values. See Table 1 for the Rock-Eval data in the core samples.
2 1
1 1 2
max
1500
1800
2100
2400
2700
3000
3300
3600
3900
4200
4500
4800
0 2 4 6 8 10 380 420 460 500 0 2 4 6 8 0 0.2 0.4 0.6 0.8 10 200 400
TOC (%) Hydrogen Index T ( C)max
o S (mg HC/g rock)1 Production Index Formation
Dep
th(m
)(R
.T
.)
Muderong Shale
Cre
tace
ous
Mid
dle
-Lat
eJu
rass
ic
Barrow Group
Casing 2403 m
DupuyFormation
Casing 3076 m
Dingo Claystone
Casing 3668 m
Athol Formation
5 %Diesel
6 % Diesel
Cuttings
CC
SWC (1)
SWC (2)
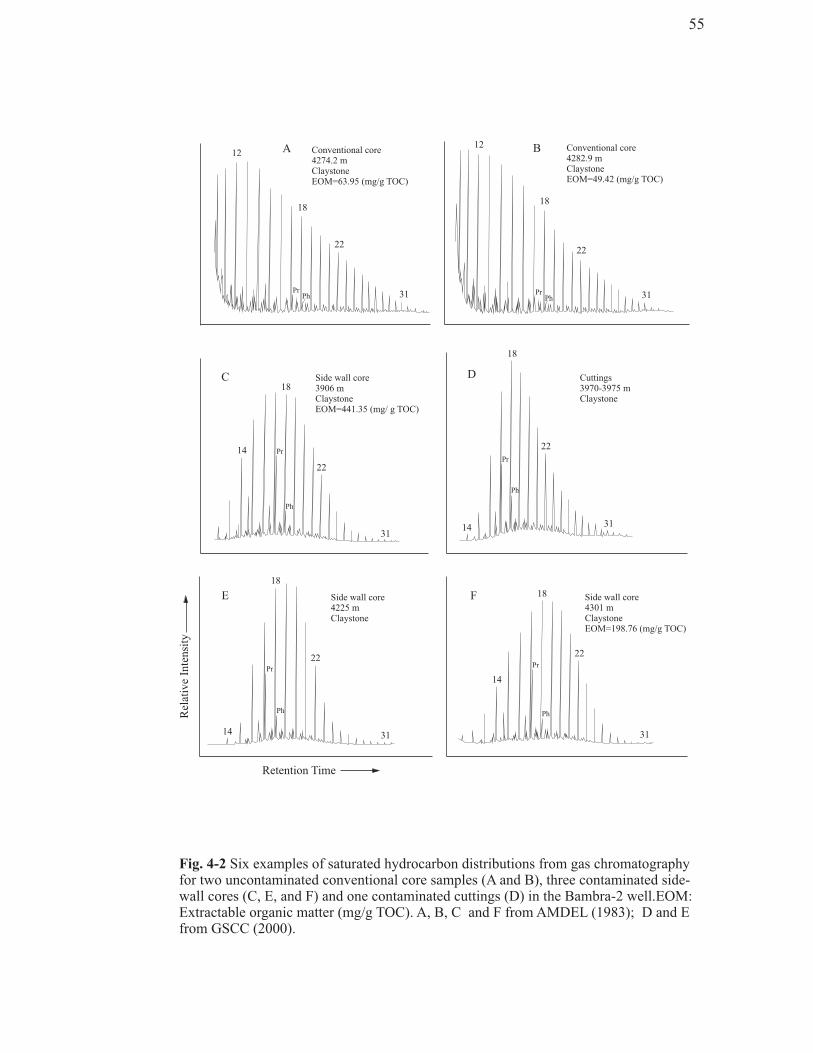
Fig. 4-2 Six examples of saturated hydrocarbon distributions from gas chromatographyfor two uncontaminated conventional core samples (A and B), three contaminated side-wall cores (C, E, and F) and one contaminated cuttings (D) in the Bambra-2 well.EOM:Extractable organic matter (mg/g TOC). A, B, C and F from AMDEL (1983); D and Efrom GSCC (2000).
55
Cuttings3970-3975 mClaystone
18
14
22
31
Side wall core4301 mClaystoneEOM=198.76 (mg/g TOC)
18
22
31
14
14
18
22
31
Side wall core3906 mClaystoneEOM=441.35 (mg/ g TOC)
Side wall core4225 mClaystone
14
18
22
31
Ph
Pr
Retention Time
Rel
ativ
eIn
ten
sity
Conventional core4282.9 mClaystoneEOM=49.42 (mg/g TOC)
12
18
22
31
Conventional core4274.2 mClaystoneEOM=63.95 (mg/g TOC)
12
18
22
31PhPr
A B
C D
E F
PrPh
Ph
PrPr
Ph
Pr
Ph
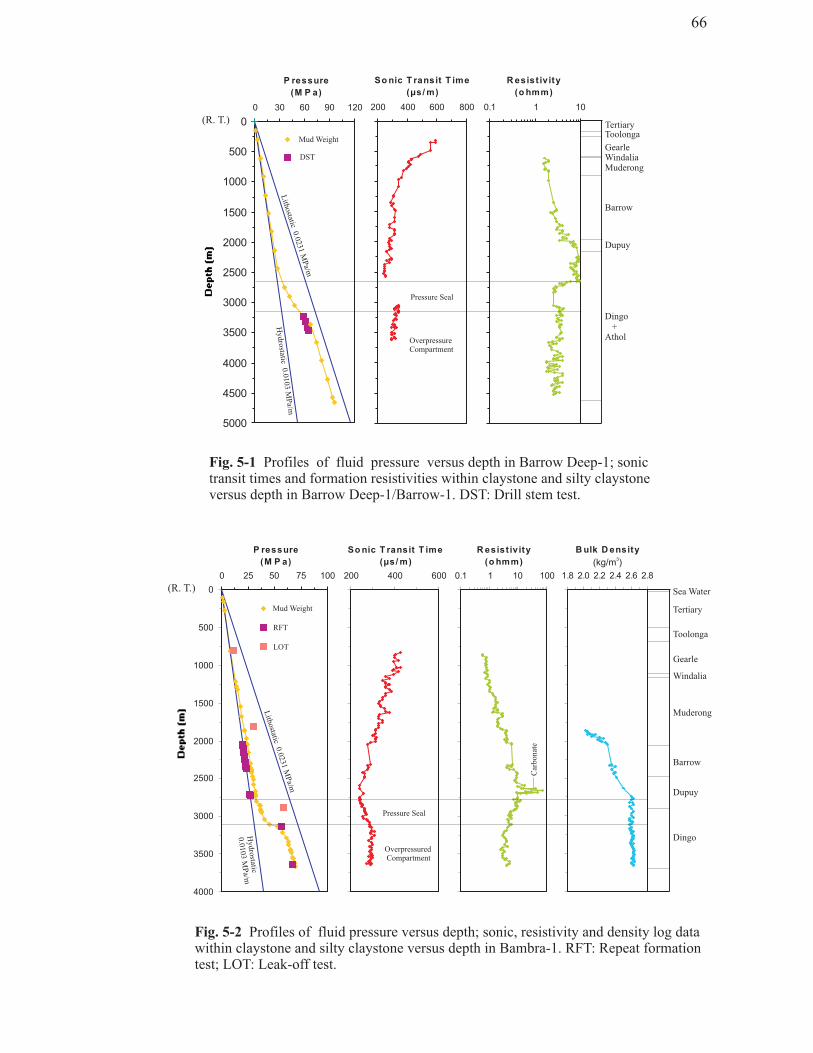
Fig. 5-1 Profiles of fluid pressure versus depth in Barrow Deep-1; sonictransit times and formation resistivities within claystone and silty claystoneversus depth in Barrow Deep-1/Barrow-1. DST: Drill stem test.
0
500
1000
1500
2000
2500
3000
3500
4000
4500
5000
0 30 60 90 120
P ressure
(M P a)
0.1 1 10
R esist iv ity
(o hmm)
(R. T.)TertiaryToolonga
Gearle
Muderong
Barrow
Dupuy
Dingo+
Athol
Windalia
200 400 600 800
So nic T ransit T ime
(µs/ m)
Mud Weight
DST
Pressure Seal
OverpressureCompartment
Lith
ostatic
0.0
231
MP
a/m
Hydro
static0.0
103
MP
a/m
1.8 2.0 2.2 2.4 2.6 2.8
B ulk D ensity
Tertiary
Toolonga
Gearle
Windalia
Muderong
Barrow
Dupuy
Dingo
0.1 1 10 100
R esist iv ity
(o hmm) (kg/m )3
200 400 600
So nic T ransit T ime
(µs/ m)
0
500
1000
1500
2000
2500
3000
3500
4000
0 25 50 75 100
P ressure
(M P a)
Mud Weight
RFT
LOT
Pressure Seal
OverpressuredCompartment
Lith
ostatic
0.0
231
MP
a/m
Hydro
static
0.0
103
MP
a/m
Car
bonat
e
(R. T.) Sea Water
Fig. 5-2 Profiles of fluid pressure versus depth; sonic, resistivity and density log datawithin claystone and silty claystone versus depth in Bambra-1. RFT: Repeat formationtest; LOT: Leak-off test.
66
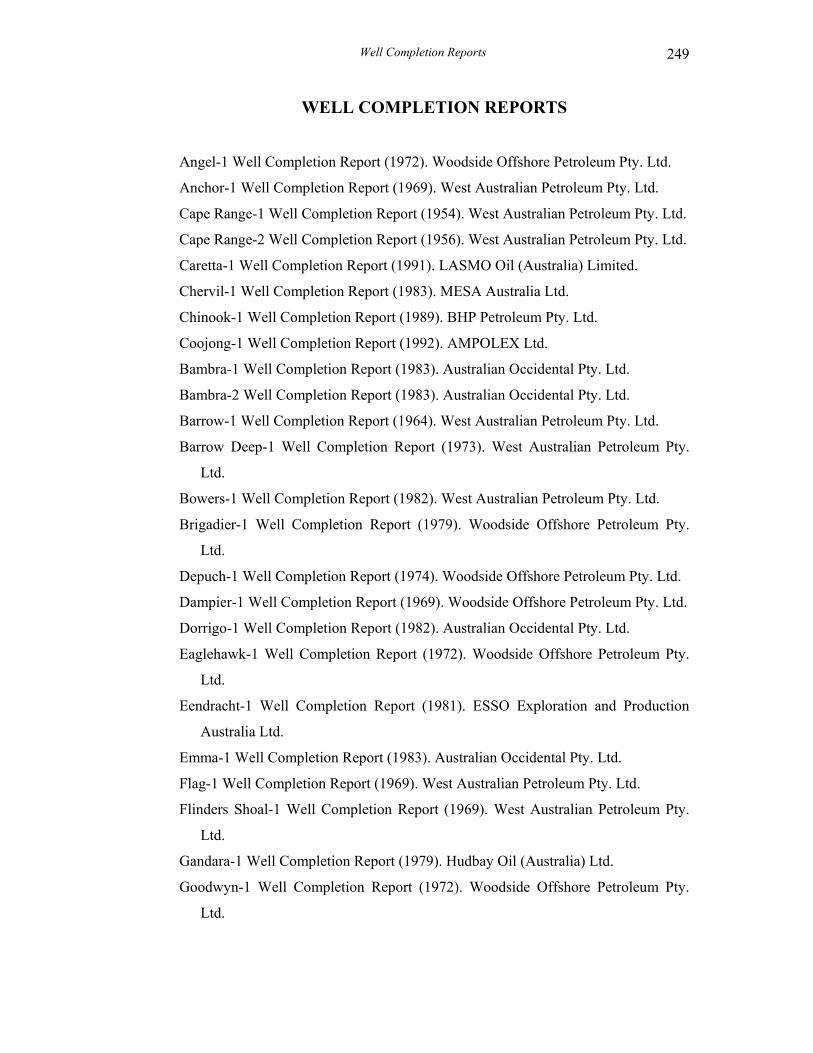
Well Completion Reports
249
WELL COMPLETION REPORTS
Angel-1 Well Completion Report (1972). Woodside Offshore Petroleum Pty. Ltd.
Anchor-1 Well Completion Report (1969). West Australian Petroleum Pty. Ltd.
Cape Range-1 Well Completion Report (1954). West Australian Petroleum Pty. Ltd.
Cape Range-2 Well Completion Report (1956). West Australian Petroleum Pty. Ltd.
Caretta-1 Well Completion Report (1991). LASMO Oil (Australia) Limited.
Chervil-1 Well Completion Report (1983). MESA Australia Ltd.
Chinook-1 Well Completion Report (1989). BHP Petroleum Pty. Ltd.
Coojong-1 Well Completion Report (1992). AMPOLEX Ltd.
Bambra-1 Well Completion Report (1983). Australian Occidental Pty. Ltd.
Bambra-2 Well Completion Report (1983). Australian Occidental Pty. Ltd.
Barrow-1 Well Completion Report (1964). West Australian Petroleum Pty. Ltd.
Barrow Deep-1 Well Completion Report (1973). West Australian Petroleum Pty.
Ltd.
Bowers-1 Well Completion Report (1982). West Australian Petroleum Pty. Ltd.
Brigadier-1 Well Completion Report (1979). Woodside Offshore Petroleum Pty.
Ltd.
Depuch-1 Well Completion Report (1974). Woodside Offshore Petroleum Pty. Ltd.
Dampier-1 Well Completion Report (1969). Woodside Offshore Petroleum Pty. Ltd.
Dorrigo-1 Well Completion Report (1982). Australian Occidental Pty. Ltd.
Eaglehawk-1 Well Completion Report (1972). Woodside Offshore Petroleum Pty.
Ltd.
Eendracht-1 Well Completion Report (1981). ESSO Exploration and Production
Australia Ltd.
Emma-1 Well Completion Report (1983). Australian Occidental Pty. Ltd.
Flag-1 Well Completion Report (1969). West Australian Petroleum Pty. Ltd.
Flinders Shoal-1 Well Completion Report (1969). West Australian Petroleum Pty.
Ltd.
Gandara-1 Well Completion Report (1979). Hudbay Oil (Australia) Ltd.
Goodwyn-1 Well Completion Report (1972). Woodside Offshore Petroleum Pty.
Ltd.
Well Completion Reports
250
Goodwyn-7 Well Completion Report (1985). Woodside Offshore Petroleum Pty.
Ltd.
Gorgon-1 Well Completion Report (1980). West Australian Petroleum Pty. Ltd.
Griffin-1 Well Completion Report (1990). BHP Petroleum Pty. Ltd.
Hampton-1 Well Completion Report (1974). Woodside Offshore Petroleum Pty.
Ltd.
Investigator-1 Well Completion Report (1979). ESSO Exploration and Production
Australia Ltd.
Judy-1 Well Completion Report (1983). Australian Occidental Pty. Ltd.
Jupiter-1 Well Completion Report (1979). Phillips Australian Petroleum Oil
Company.
Jurabi-1 Well Completion Report (1982). ESSO Exploration and Production
Australia Ltd.
Keraudren-1 Well Completion Report (1974). Hematite Petroleum Pty. Ltd.
Koolinda-1 Well Completion Report (1978). West Australian Petroleum Pty. Ltd.
Leatherback-1 Well Completion Report (1991). LASMO Oil (Australia) Limited.
Legendre-1 Well Completion Report (1968). Woodside Offshore Petroleum Pty.
Ltd.
Madeleine-1 Well Completion Report (1969). Woodside Offshore Petroleum Pty.
Ltd.
Mercury-1 Well Completion Report (1980). Phillips Australian Oil Company.
North Gorgon-1 Well Completion Report (1983). West Australian Petroleum Pty.
Ltd.
North Rankin-1 Well Completion Report (1971). Woodside Offshore Petroleum Pty.
Ltd.
North Tryal Rocks-1 Well Completion Report (1972). West Australian Petroleum
Pty. Ltd.
Novara-1 Well Completion Report (1983). ESSO Exploration and Production
Australia Ltd.
Observation-1 Well Completion Report (1968). West Australian Petroleum Pty. Ltd.
Onslow-1 Well Completion Report (1967). West Australian Petroleum Pty. Ltd.
Well Completion Reports
251
Outtrim-1 Well Completion Report (1984). ESSO Exploration and Production
Australia Ltd.
Pepper-1 Well Completion Report (1971). West Australian Petroleum Pty. Ltd.
Picard-1 Well Completion Report (1972). Woodside Offshore Petroleum Pty. Ltd.
Poissonnier-1 Well Completion Report (1974). Woodside Offshore Petroleum Pty.
Ltd.
Rankin-1 Well Completion Report (1971). Woodside Offshore Petroleum Pty. Ltd.
Resolution-1 Well Completion Report (1979). ESSO Exploration and Production
Australia Ltd.
Ronsard-1 Well Completion Report (1974). Woodside Offshore Petroleum Pty. Ltd.
Rosemary-1 Well Completion Report (1973). Woodside Offshore Petroleum Pty.
Ltd.
Saladin-1 Well Completion Report (1985). West Australian Petroleum Pty. Ltd.
Saturn-1 Well Completion Report (1981). Phillips Australian Oil Company.
Sholl Island-1 Well Completion Report (1967). West Australian Petroleum Pty. Ltd.
Sirius-1 Well Completion Report (1981). ESSO Exploration and Production
Australia Ltd.
South Chervil-1 Well Completion Report (1983). Wesminco Oil Pty. Ltd.
Spar-1 Well Completion Report (1977). West Australian Petroleum Pty. Ltd.
Strickland-1 Well Completion Report (1982). Hudbay Oil (Australia) Ltd.
Tryal Rocks-1 Well Completion Report (1971). West Australian Petroleum Pty. Ltd.
Vinck-1 Well Completion Report (1980). ESSO Exploration and Production
Australia Ltd.
West Barrow-1/1A Well Completion Report (1982). Offshore Oil N.L.
West Barrow-2 Well Completion Report (1985). BHP Petroleum Pty. Ltd.
West Tryal Rocks-1 Well Completion Report (1973). West Australian Petroleum
Pty. Ltd.
Wonnich-1 Well Completion Report (1996). Ampolex Limited.
Zeepaard-1 Well Completion Report (1980). ESSO Exploration and Production
Australia Ltd.
Zeewulf-1 Well Completion Report (1979). ESSO Exploration and Production
Australia Ltd.
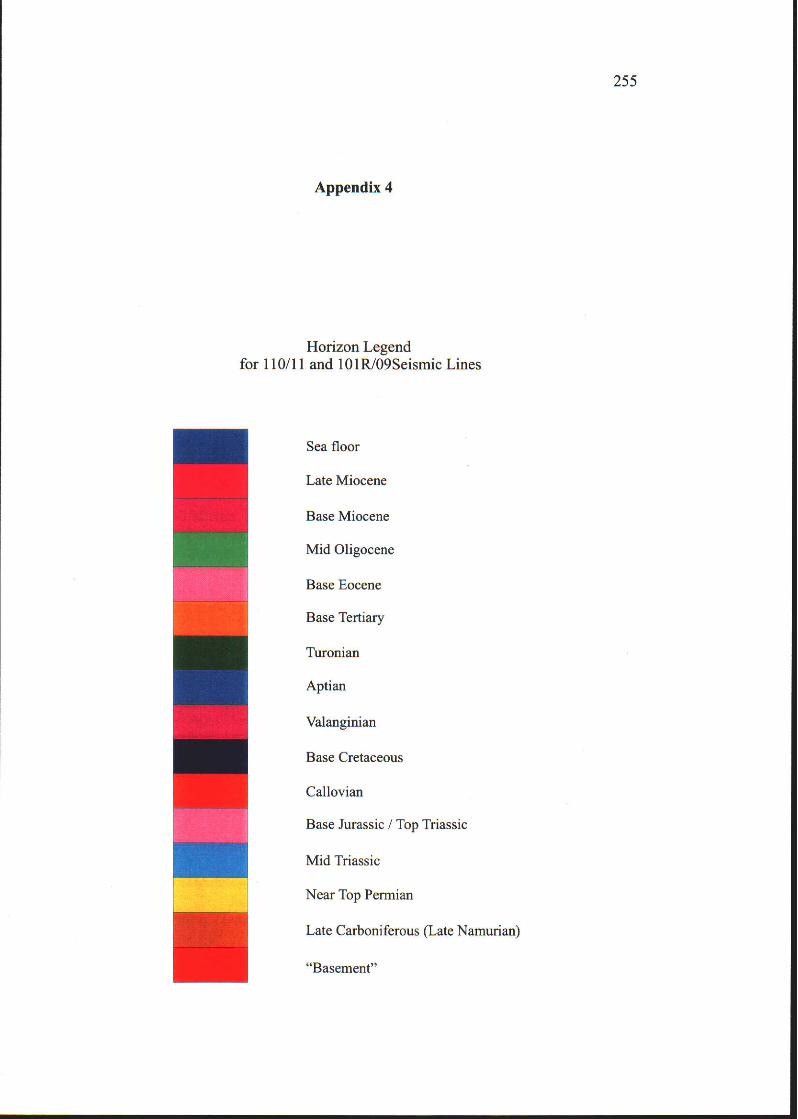

256
Appendix 5
LIST OF PUBLISHED PAPERS AND CONFERENCE PRESENTATIONS DURING THIS STUDY
Published papers Sheng He, Mike Middleton, Alex Kaiko, Chunqing Jiang and Maowen Li, (2002). Two case studies of thermal maturity and thermal modelling in the overpressured Jurassic rocks of the Barrow Sub-basin, North West Shelf of Australia. Marine and Petroleum Geology, 19, 143-159. Sheng He and Mike Middleton, (2002). Pressure seal and deep overpressure modelling in the Barrow Sub-basin, Northern Carnarvon Basin of the North West Shelf, Australia, in Keep, M. & Moss, S.J. (Eds.), 2002, The sedimentary Basins of Western Australia 3 (pp. 531-549): Proceedings of the Petroleum Exploration Society of Australia Symposium, Perth, WA, 2002. S. He, M. Middleton and Z. H. Tang, (2000). Characteristics and origin of underpressure system in the Shiwu Fault Depression, south-east Songliao Basin, China. Basin Research, 12, 147-158. I.D. Sills and S. He, (1999). Determination of evolved gas transfer time from a thermoanalyser to a coupled gas detection system using pyrite oxidation. Thermochimica Acta, 339, 125-130. Tang Zhonghua, He Sheng and Wu Jingfu, (1999). Thermal backstripping from vitrinite reflectance profiles in comparison with an extensional model for passive continental margin basins on northern continental shelf of South China Sea. Journal of China University of Geosciences, 10, 251-257. He Sheng, (1999). Relationship between paleoclimate and source rocks from molecular markers in the North Sea (abstract). AAPG Bulletin, 83, 1887. (the grant-in aid from the American Association of Petroleum Geologists Foundation, 1999) Conference presentations He-Sheng and Middleton-Mike, (2002). Pressure seal and modelling of the Jurassic overpressure in the Barrow Sub-basin, North West Shelf of Australia. AAPG Annual Convention, Houston, Texas, March 10-13, 2002. He-Sheng, Middleton-Mike-F and Collins-Lindsay, (2000). Thermal history modeling in the Offshore Carnarvon Basin, North West shelf, Australia. AAPG International Conference and Exhibition, Bali, Indonesia, October 15-18, 2000.
257
He-Sheng, Middleton-Mike-F, Zhao-Kejing and Gu-Wenbin, (2000). Characters of high-sulfur lacustrine source rocks of sour-gas and heavy-oil in the Jinxian Sub-basin of the Bohaiwan Basin, China. AAPG International Conference and Exhibition, Bali, Indonesia, October 15-18, 2000. He-Sheng and Middleton-Mike, (2000). Study of anomalous low vitrinite reflectance profiles in the Barrow Sub-basin, Western Australia. 15th Australian Geological Convention, Sydney, July 3rd-7th, 2000. He-Sheng, Middleton-Mike and Tang-Zhonghua, (1999). Hydrochemical characters and origin of underpressure system in the southeast area of Songliao Basin, China. AAPG Annual Meeting, San Antonio, Texas, April 11-14, 1999. He-Sheng, Middleton-Mike and Tang-Zhonghua, (1999). A thermal backstripping model for determining the palaeo-heat flow from vitrinite reflectance profiles in South China Sea Basins. AAPG Annual Meeting, San Antonio, Texas, April 11-14, 1999. Papers under review He Sheng and Mike Middleton. Heat flow modelling and thermal maturity in the Northern Carnarvon Basin, the North West Shelf, Australia. Marine and Petroleum Geology. Sheng He, Alex Kaiko, Mike Middleton and Chunqing Jiang, Assessment of Rock-Eval Tmax data, a case study from the Bambra-2 well of the Barrow Sub-basin, Western Australia. PESA Journal.