Embed Size (px)
Citation preview
Thermal Issues in Disk Drive Design:Challenges and Possible Solutions
SUDHANVA GURUMURTHI
University of Virginia
and
ANAND SIVASUBRAMANIAM
The Pennsylvania State University
The importance of pushing the performance envelope of disk drives continues to grow in the en-terprise storage market. One of the most fundamental factors impacting disk drive design is heatdissipation, since it directly affects drive reliability. Until now, drive manufacturers have continuedto meet the 40% annual growth target of the internal data-rates (IDR) by increasing RPMs andshrinking platter sizes, both of which have counteracting effects on the heat dissipation withina drive. In this article, we shall show that we are getting to a point where it is going to be verydifficult to stay on this roadmap. We first present detailed models that capture the close relation-ships between capacity, performance, and thermal characteristics over time. Using these models,we quantify the drop-off in IDR growth rates over the next decade if we are to adhere to the thermaldesign envelope. We motivate the need for continued improvements in IDR by showing that theresponse times of real workloads can be improved by 30–60% with a 10K increase in the RPM fordisks used in their respective storage systems. We then present two dynamic thermal management(DTM) techniques that can be used to buy back some of this IDR loss. The first DTM techniqueexploits the thermal slack between what the drive was intended to support and the currently loweroperating temperature to ramp up the RPM. The second DTM technique assumes that the drive isonly designed for average case operation and dynamically throttles its activities to remain withinthe thermal envelope.
Categories and Subject Descriptors: B.4.2 [Input/Output and Data Communications]: Input/Output Devices
General Terms: Design, Measurement, Performance, Reliability
Additional Key Words and Phrases: Disk drive, thermal management, technology scaling
This research has been supported in part by NSF Grants 0429500, 032056, 0130143, and 0103583.Authors’ addresses: S. Gurumurthi, Department of Computer Science, University of Virginia, 151Engineer’s Way, P.O. Box 400740, Charlottesville, VA 22904-4740; email: [email protected]; A. Sivasubramaniam, Department of Computer Science and Engineering, The PennsylvaniaState University, University Park, PA 16802; email: [email protected] to make digital or hard copies of part or all of this work for personal or classroom use isgranted without fee provided that copies are not made or distributed for profit or direct commercialadvantage and that copies show this notice on the first page or initial screen of a display alongwith the full citation. Copyrights for components of this work owned by others than ACM must behonored. Abstracting with credit is permitted. To copy otherwise, to republish, to post on servers,to redistribute to lists, or to use any component of this work in other works requires prior specificpermission and/or a fee. Permissions may be requested from Publications Dept., ACM, Inc., 1515Broadway, New York, NY 10036 USA, fax: +1 (212) 869-0481, or [email protected]© 2006 ACM 1553-3077/06/0200-0041 $5.00
ACM Transactions on Storage, Vol. 2, No. 1, February 2006, Pages 41–73.
42 • S. Gurumurthi and A. Sivasubramaniam
1. INTRODUCTION
Disk drives lie at the heart of the storage system and are the most significantdeterminants of both its capacity and performance. Due to the large differencein speed between disks and other levels in the memory hierarchy, I/O perfor-mance plays a critical role in many server applications. There have been severalimprovements over the years to address the I/O bottleneck, including (to namea few) better caching/buffer management [Patterson et al. 1995], parallelismin the form of RAID [Patterson et al. 1988], and high bandwidth interconnectssuch as SAN. However, at the core of these extensive I/O subsystems lie thedisk drives, whose performance advances have lagged woefully behind the restof the system components. As Amdahl’s law dictates, a single such delay caneventually limit overall system performance. Further, it is quite possible that afaster drive can actually alleviate the need for going to expensive storage areanetworks and higher levels of parallelism when deploying balanced systems.
From a drive design perspective, two important performance metrics arethe internal data rate (IDR) and the seek time. Over the past fifteen years,disk drive manufacturers have been able to sustain an annual growth rateof 40% in the IDR. This growth has been fueled by innovations in recordingtechnology which have provided higher densities, coupled with increases inthe drive RPM. In order to compensate for higher power dissipation due tothe faster rotational speed of platters and to ensure that the device operateswithin the thermal design envelope, platter sizes have also been shrunken insuccessive drive generations. This process of designing to operate within thethermal envelope is critical because temperature is one of the most fundamentalfactors affecting the reliability of a disk drive. High temperatures can cause off-track errors due to thermal tilt of the disk stack and actuator, or even causehead crashes due to outgassing spindle and voice-coil motor lubricants [Herbst1997]. Disks are so sensitive to temperature that even a 15◦C rise from ambienttemperature can double the failure rate of a disk drive [Anderson et al. 2003].
While these techniques have been successful in allowing the IDR to scalealong the 40% growth curve for nearly the past two decades, there are severalimpediments on the horizon that need to be overcome:
—The growth rates of linear and track densities are expected to slow down duea variety of physical limitations. Further, lower signal-to-noise ratios at highareal densities require the use of stronger error correcting codes which reduceeffective (user-perceived) capacity and data rate. These trends mandate moreaggressive scaling of the drive RPM to meet IDR targets, which also increasesthe amount of heat generated (by nearly the cubic power of the RPM).
—Going to smaller form-factors decreases the amount of heat that can be dis-sipated to the outside air, thereby constraining the design even further.
—In high-density server configurations, which are common in most serverfarms today, external ambient temperatures are becoming more difficult tocontain due to the preheating of air by other components near the drivesand also because provisioning more powerful cooling systems to combat theeffects is very expensive.
ACM Transactions on Storage, Vol. 2, No. 1, February 2006.
Thermal Issues in Disk Drive Design: Challenges and Possible Solutions • 43
In order to continue to make innovations, it is important to understand allof these trade-offs and how they will impact the disk drive roadmap over thenext decade. Understanding and studying all these issues requires compre-hensive models of disk drives to capture the interrelationships between thedifferent parameters and their impact on capacity, performance, and thermalbehavior.
In this article, we make the following contributions towards understandingthe nature of the thermal-design problem in disk drives, its impact on futuredisks, and towards developing techniques to mitigate its effects:
—We present models to study the capacity, performance, and thermal charac-teristics of disk drives in a unified way to evaluate the different trade-offsover time. We validate the models against 13 real drives from different man-ufacturers over a range of calendar years.
—We compute a disk drive roadmap based both on our models and on expectedtrends in technology scaling of fundamental parameters. We show that whilewe have been able to meet the IDR growth rate of 40% so far, the aggres-sive RPM scaling required to overcome some of the constraints imposed byrecording technology would be difficult to achieve within the thermal designenvelope, thereby restricting IDR growth in the future. We also evaluatehow changes in zoned-bit recording, drive enclosure dimensions, and coolingcapabilities affect this roadmap.
—We illustrate the need for continued improvements in IDR by quantifyingthe performance gains of using faster disks for a set of I/O-intensive serverworkloads. We show that the data rate gain can improve response times forthese workloads by 30–60% with a 10K increase in RPM for the disks used intheir respective storage systems. Using an integrated performance-thermalstorage system simulation framework, we show that such RPM increasescan, however, lead to thermal violations.
—In order to buy back some of the performance/capacity loss imposed by thethermal envelope, we present a set of dynamic thermal management (DTM)policies for disk drives. Specifically, we present two ways of performing DTM:(i) ramping up rotational speed when detecting a thermal slack between thecurrent temperature and what the disk was designed for, and (ii) designinga disk for the average case and dynamically employing throttling to controldisk activities when close to reaching the thermal envelope.
The related work is given in Section 2. Detailed models for capacity and per-formance are developed and validated for real disks in Section 3. In Section 4,a detailed model of the thermal characteristics of disk drives is presented,along with details of how this model is adapted and validated for modern disks.Section 5 presents the expected trends in magnetic recording technology overthe next decade and develops a methodology to generate the disk drive roadmap.Section 6 charts out the roadmap when designing disks for operation within thethermal envelope. Section 7 studies the impact of changes in other, related tech-nologies on the roadmap. Section 8 motivates the need for continued demand forfaster disks and presents the thermal behavior of applications on these disks.
ACM Transactions on Storage, Vol. 2, No. 1, February 2006.
44 • S. Gurumurthi and A. Sivasubramaniam
It then sketches out various DTM techniques. Finally, Section 9 concludes thisarticle.
2. RELATED WORK
The importance of the I/O subsystem on the performance of server applicationshas resulted in fairly detailed performance models of the storage hierarchy(e.g., [Ganger et al. 1999; Griffin et al. 2002]). The Disksim simulator [Gangeret al. 1999] is one such publicly distributed tool that models the performancecharacteristics of the disk drive, controllers, caches, and interconnects. The im-portance of modeling power has gained attention over the last decade, primar-ily in the context of conserving battery energy for drives in laptops [Zedlewskiet al. 2003; Hong and Potkonjak 1996]. A tool called Dempsey is presented inZedlewski et al. [2003] for detailed modeling of the energy consumption of mo-bile hard disks. A detailed breakdown of the power in different components ofa mobile disk is given in Harris et al. [1995] and Hong and Potkonjak [1996].Temperature-aware design is becoming increasingly important [Skadron et al.2003] as well. In the context of disk drives, Clauss [1988] describes a model ofthe thermal behavior of a drive based on parameters such as dimensions, num-ber and sizes of platters in the disk stack, and properties of the constituentmaterials. This model is adapted to study the thermal ramifications of currentand future hard disk drives. There has also been some recent work on modelingand designing disk arrays in a temperature-aware manner [Huang and Chung2002].
There are also published papers on analyzing the dynamics of disk drivesvia macromodeling using mixed-signal hardware description languages (HDLs)such as VHDL-AMS [Christen and Bakalar 1999; Damon and Christen 1996].Voßkamper et al. [2000] presents a technique known as physical-effect mod-eling wherein the different components of a mechanical device are modeledseparately in an HDL and are combined to model the entire device. Dammerset al. [2001] uses this technique to model the spindle motor (SPM) and voice-coilmotor (VCM) of a hard disk.
The historical evolution of different aspects of hard disk drive design, alongwith projections for future trends, are given in a set of papers published byindustry [Anderson et al. 2003; Grochowski and Halem 2003; Hitachi 2006a;Riedel 2004]. There have also been studies on the characteristics of designingfuture high density disk drives. This research covers issues such as the impactof bit-aspect ratios [Chen and Moon 2001] and error-correcting code overheads[Wood 2000] in such drives. There are several proposals [Wood 2000; Mallaryet al. 2002; Tarnopolsky 2004] on how to build Terabit areal density drives,covering magnetic recording physics issues and engineering considerations.
3. MODELING THE CAPACITY, PERFORMANCE, AND THERMALCHARACTERISTICS OF DISK DRIVES
This section describes the models used in this study for capturing the capacity,data rates, and thermal characteristics of disk drives.
ACM Transactions on Storage, Vol. 2, No. 1, February 2006.
Thermal Issues in Disk Drive Design: Challenges and Possible Solutions • 45
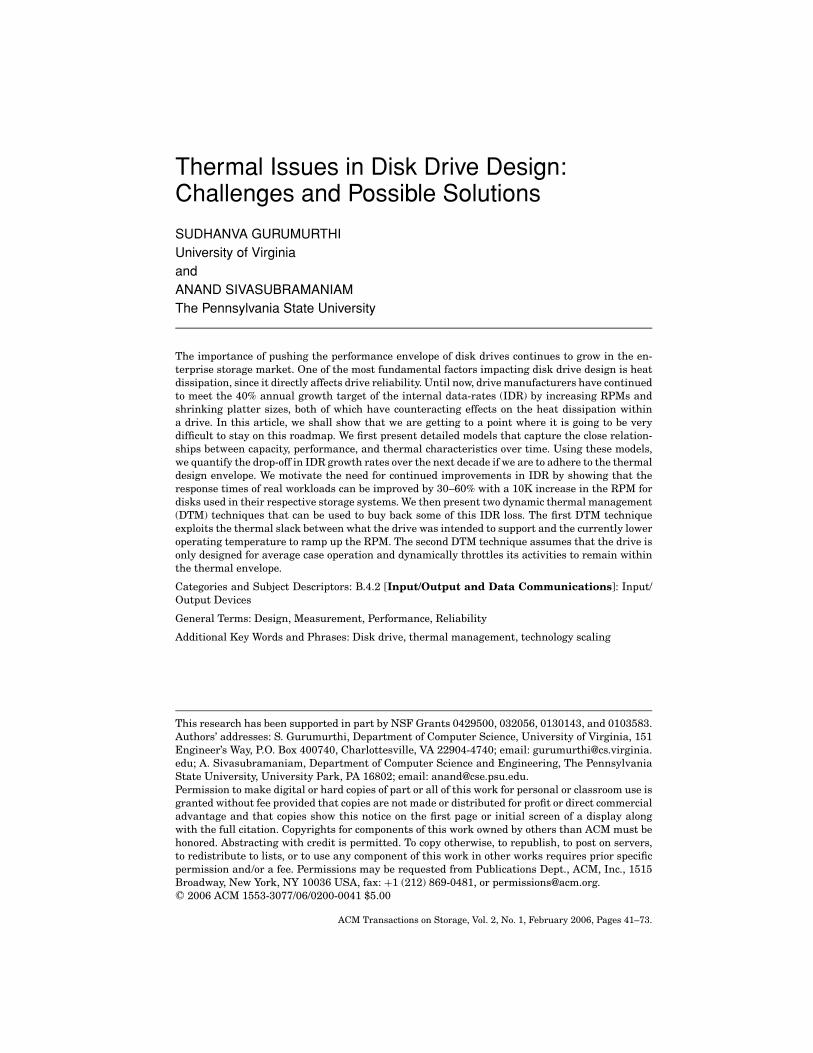
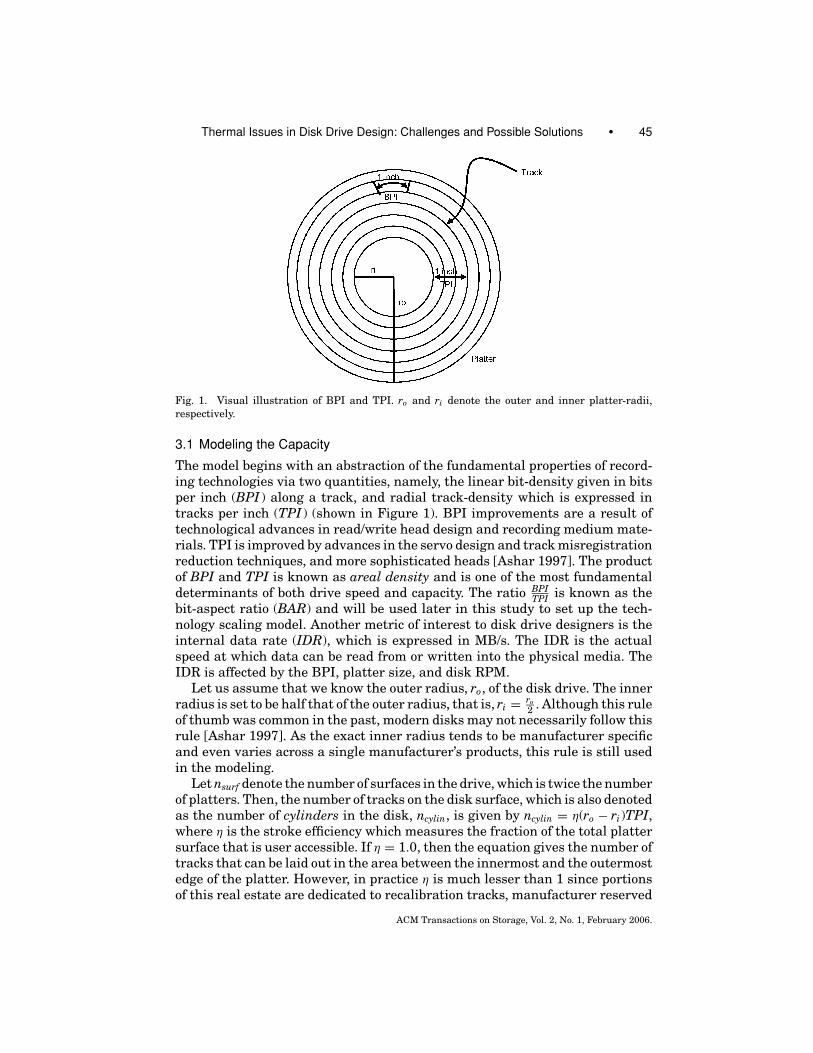
Fig. 1. Visual illustration of BPI and TPI. ro and ri denote the outer and inner platter-radii,respectively.
3.1 Modeling the Capacity
The model begins with an abstraction of the fundamental properties of record-ing technologies via two quantities, namely, the linear bit-density given in bitsper inch (BPI ) along a track, and radial track-density which is expressed intracks per inch (TPI ) (shown in Figure 1). BPI improvements are a result oftechnological advances in read/write head design and recording medium mate-rials. TPI is improved by advances in the servo design and track misregistrationreduction techniques, and more sophisticated heads [Ashar 1997]. The productof BPI and TPI is known as areal density and is one of the most fundamentaldeterminants of both drive speed and capacity. The ratio BPI
TPI is known as thebit-aspect ratio (BAR) and will be used later in this study to set up the tech-nology scaling model. Another metric of interest to disk drive designers is theinternal data rate (IDR), which is expressed in MB/s. The IDR is the actualspeed at which data can be read from or written into the physical media. TheIDR is affected by the BPI, platter size, and disk RPM.
Let us assume that we know the outer radius, ro, of the disk drive. The innerradius is set to be half that of the outer radius, that is, ri = ro
2 . Although this ruleof thumb was common in the past, modern disks may not necessarily follow thisrule [Ashar 1997]. As the exact inner radius tends to be manufacturer specificand even varies across a single manufacturer’s products, this rule is still usedin the modeling.
Let nsurf denote the number of surfaces in the drive, which is twice the numberof platters. Then, the number of tracks on the disk surface, which is also denotedas the number of cylinders in the disk, ncylin, is given by ncylin = η(ro − ri)TPI,where η is the stroke efficiency which measures the fraction of the total plattersurface that is user accessible. If η = 1.0, then the equation gives the number oftracks that can be laid out in the area between the innermost and the outermostedge of the platter. However, in practice η is much lesser than 1 since portionsof this real estate are dedicated to recalibration tracks, manufacturer reserved
ACM Transactions on Storage, Vol. 2, No. 1, February 2006.
46 • S. Gurumurthi and A. Sivasubramaniam
tracks, spare tracks (to recover from defects), landing zone for the head slider,and other manufacturing tolerances. The stroke efficiency is typically around23 [Hughes 2004], which is the value that is used in the models. From these, wecan calculate the raw capacity (in bits), Cmax, of the disk drive as
Cmax = η × nsurf × π(r2
o − r2i
)(BPI × TPI).
In reality, even this Cmax is not completely usable because:
(1) Outer tracks can hold more sectors because of their longer perimeters. How-ever, allocating storage on a per-track basis would require complex channelelectronics to accommodate different data rates for each track [Ashar 1997].Instead, zoned bit recording (ZBR) or multiband recording is used, whichcan lead to some capacity loss.
(2) In addition to user data, each sector needs additional storage for servopatterns and error-correcting codes (ECCs), leading to a further reductionin capacity. These components are modeled as follows.
3.1.1 Capacity Adjustment due to Zoned Bit Recording (ZBR). ZBR is acoarse-grained way of accommodating variable sized tracks, where the tracksare grouped into zones with each track in a zone having the same number ofsectors. Such grouping can provide good trade-offs between capacity and designcomplexity of the drive electronics. ZBR can allow more data to reside on theouter tracks to benefit from a higher data rate due to a constant angular velocity,without extensively complicating the electronics.
Each track j has a raw bit capacity Ctj , which is given by Ctj = 2πr j BPIwhere r j is the radius of track j . Let j = 0, 1, . . . , ncylin − 1 where 0 is theoutermost track and ncylin − 1 is the innermost. Then, for any two tracks m andn such that m < n, Ctm > Ctn since rm > rn. Since the recordable area is withinro −ri and we have ncylin cylinders that are assumed to be uniformly spaced out,the perimeter of any given track j , denoted as Ptj , is given by
Ptj = 2π
[ri +
(ro − ri
ncylin − 1
)(ncylin − j − 1)
]. (1)
This equation is easy to understand when we consider the three cases where atrack may be located on a surface:
(1) If j = 0, then the corresponding track is that which is at the distance of ro
from the center of the platter. Thus, the perimeter of the track is 2πro.(2) If j = ncylin − 1, then the corresponding track is that which is closest to the
spindle-motor assembly, at a distance of ri from the center of the platter.Thus, the perimeter is 2πri.
(3) For the intermediate tracks, the distance between adjacent tracks is ( ro−rincylin
),that is, the tracks are equally spaced out radially along the platter surface.Therefore, any given track j is located at a distance ( ro−ri
ncylin)(ncylin − j ) from
the innermost track.
Assuming that each zone has an equal number of tracks, the number of tracksper zone, ntz, is ntz = ncylin
nzoneswhere nzones is the desired number of zones. Modern
ACM Transactions on Storage, Vol. 2, No. 1, February 2006.
Thermal Issues in Disk Drive Design: Challenges and Possible Solutions • 47
disk drives have about 30 zones. Therefore, zone 0 would be composed of tracks0 to ncylin
nzones− 1, zone 1 would have tracks ncylin
nzonesto ( 2ncylin
nzones− 1), and so on. For each
zone z, let the bit capacity of its smallest perimeter track in the zone be denotedas Ctzmin . In our ZBR model, we allocate for every track in zone z: Ctzmin bits (or(
Ctzmin8×512 ) sectors). Thus, each zone has a capacity of ntz(
Ctzmin4096 ) sectors, making
the total disk capacity (in 512-byte sectors), with losses due to ZBR taken intoaccount, as
CZBR = nsurf
nzones−1∑z=0
ntz
(Ctzmin
4096
).
3.1.2 Capacity Adjustments due to Servo Information. Servo are specialpatterns that are recorded on the platter surface to correctly position the headabove the center of a track. In older drives, an entire surface (and head) used tobe dedicated to servo information, leading to considerable loss of usable capac-ity. To mitigate this, modern drives make use of a technique known as embeddedservo, where the servo patterns are stored along with each sector. There are nospecial servo surfaces and the read/write heads that are used for user dataaccess are also used to read the servo information.
The storage overheads for servo are modeled by considering the number ofbits required to encode the track-identifier information for each servo-sector.Other fields in servo information, such as those for write-recovery (which sig-nals the beginning of a servo pattern) and those for generating the position errorsignal (which indicates the position of the actuator with respect to a particulartrack), are not modeled due to the lack of information about their implementa-tion in real disk drives. The servo model that we use is based on the informationgiven in the patent [Ottesen and Smith 2001]. The track-id information is en-coded as a Gray code, such that the fields for any two adjacent tracks differ onlyby a single bit. This enables fast and accurate seeks to be performed. As theservo information is embedded with each sector, the total number of bits usedfor storing servo in each sector, Cservo, is given by
Cservo = �log2(ncylin)�. (2)
3.1.3 Capacity Adjustments due to Error-Correcting Codes. One of theramifications of technology scaling has been increased error rates. In orderto understand why, a brief exposition of how higher densities are achieved isrequired.
Each bit cell in a track is composed of multiple magnetic grains (typically,50–100 grains per cell [Hitachi 2006b]). A bit storing a digital ‘one’ is composedof a region of grains that are uniformly polarized, and a region where there isa transition in the magnetic polarity represents a ‘zero.’
When a write is performed on a bit cell, all the grains in the region have theirmagnetic polarity altered by the write head. To achieve higher areal density,the size of the bit cell needs to be reduced. In order to achieve this, we havetwo options, namely, shrinking the grains themselves and reducing the num-ber of grains in the cells. The standard approach has been to shrink the grainsize. However, the superparamagnetic limit [Charrap et al. 1997] imposes a
ACM Transactions on Storage, Vol. 2, No. 1, February 2006.

48 • S. Gurumurthi and A. Sivasubramaniam
minimum grain size so that the signal energy stored in the grain does not dropbelow the ambient thermal energy. Otherwise, the magnetic grains would be-come thermally unstable and would flip their polarity within a short time span(effectively rendering disk drives as volatile storage!). One way to overcomethis limit is to use a recording medium that is more coercive, thus requiring astronger field to change the state of the bits. Designing write heads to achievethis is quite challenging [Hughes 2004]. Therefore, in order to continue achiev-ing areal density growth beyond this point, it is necessary to reduce the numberof grains per bit as well. The use of fewer grains in the bit cell leads to lowersignal-to-noise ratios (SNR). In order to accommodate such noisy conditions,error-correcting codes (ECCs) are required, and most modern disks use Reed-Solomon codes [Reed and Solomon 1960]. It has been shown that for currentdisks the ECC storage requirement is about 10% of the available capacity andwould increase to 35% for disks whose areal densities are in the Terabit range[Wood 2000]. Thus, in our model the total capacity used by ECC (in bits), CECC,is 416 bits per sector for drives whose areal densities are less than 1 Tb/in2,whereas those in the Terabit range use 1440 bits per sector.
3.1.4 Derated Capacity Equation. From the above discussions on ZBR,servo, and ECC costs, we can calculate their total space overhead (in bits persector) as
α = ntz
(Ctzmin
4096
)(Cservo + CECC).
Therefore, the estimated capacity of the disk in terms of 512-byte sectors isgiven by
Cactual = nsurf
nzones−1∑z=0
ntz
(ntzCtzmin − α
4096
). (3)
3.1.5 Validation. To verify the accuracy of this derived model, the capacityestimated by the models are compared against actual values reported for a setof server disks of different configurations, manufacturers, and from differentyears (obtained from Anderson et al. [2003]). The result of this comparison ispresented in Table I (the detailed drive specifications are given in Gurumurthiet al. [2005]). For most disks, the difference between the actual and the esti-mated capacities is within 12%. The errors are primarily due to some of theassumptions made along the way, and also because we assume 30 zones foreach disk (which is optimistic for many of the older disks in the table, whichused only around 10–15 zones).
3.2 Modeling the Performance
Two main performance-related drive parameters are the seek time and theinternal data rate, whose modeling is presented below.
3.2.1 Seek Time. The seek time depends on two factors, namely, the in-ertial power of the actuator voice-coil motor and the radial length of the databand on the platter [Grochowski and Halem 2003]. Physically, a seek involves
ACM Transactions on Storage, Vol. 2, No. 1, February 2006.
Thermal Issues in Disk Drive Design: Challenges and Possible Solutions • 49
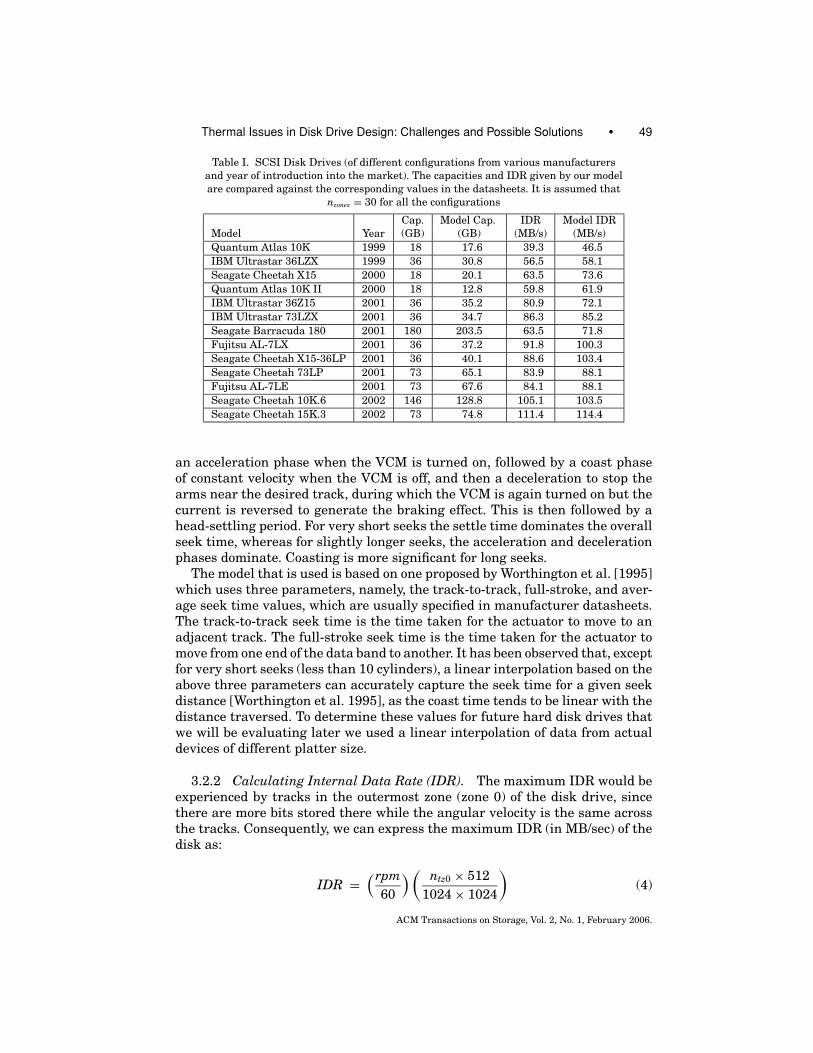
Table I. SCSI Disk Drives (of different configurations from various manufacturersand year of introduction into the market). The capacities and IDR given by our modelare compared against the corresponding values in the datasheets. It is assumed that
nzones = 30 for all the configurations
Cap. Model Cap. IDR Model IDRModel Year (GB) (GB) (MB/s) (MB/s)Quantum Atlas 10K 1999 18 17.6 39.3 46.5IBM Ultrastar 36LZX 1999 36 30.8 56.5 58.1Seagate Cheetah X15 2000 18 20.1 63.5 73.6Quantum Atlas 10K II 2000 18 12.8 59.8 61.9IBM Ultrastar 36Z15 2001 36 35.2 80.9 72.1IBM Ultrastar 73LZX 2001 36 34.7 86.3 85.2Seagate Barracuda 180 2001 180 203.5 63.5 71.8Fujitsu AL-7LX 2001 36 37.2 91.8 100.3Seagate Cheetah X15-36LP 2001 36 40.1 88.6 103.4Seagate Cheetah 73LP 2001 73 65.1 83.9 88.1Fujitsu AL-7LE 2001 73 67.6 84.1 88.1Seagate Cheetah 10K.6 2002 146 128.8 105.1 103.5Seagate Cheetah 15K.3 2002 73 74.8 111.4 114.4
an acceleration phase when the VCM is turned on, followed by a coast phaseof constant velocity when the VCM is off, and then a deceleration to stop thearms near the desired track, during which the VCM is again turned on but thecurrent is reversed to generate the braking effect. This is then followed by ahead-settling period. For very short seeks the settle time dominates the overallseek time, whereas for slightly longer seeks, the acceleration and decelerationphases dominate. Coasting is more significant for long seeks.
The model that is used is based on one proposed by Worthington et al. [1995]which uses three parameters, namely, the track-to-track, full-stroke, and aver-age seek time values, which are usually specified in manufacturer datasheets.The track-to-track seek time is the time taken for the actuator to move to anadjacent track. The full-stroke seek time is the time taken for the actuator tomove from one end of the data band to another. It has been observed that, exceptfor very short seeks (less than 10 cylinders), a linear interpolation based on theabove three parameters can accurately capture the seek time for a given seekdistance [Worthington et al. 1995], as the coast time tends to be linear with thedistance traversed. To determine these values for future hard disk drives thatwe will be evaluating later we used a linear interpolation of data from actualdevices of different platter size.
3.2.2 Calculating Internal Data Rate (IDR). The maximum IDR would beexperienced by tracks in the outermost zone (zone 0) of the disk drive, sincethere are more bits stored there while the angular velocity is the same acrossthe tracks. Consequently, we can express the maximum IDR (in MB/sec) of thedisk as:
IDR =(rpm
60
) (ntz0 × 512
1024 × 1024
)(4)
ACM Transactions on Storage, Vol. 2, No. 1, February 2006.
50 • S. Gurumurthi and A. Sivasubramaniam
where ntz0 is the number of sectors per track in zone 0, and rpm is the angularvelocity expressed as rotations per minute.
3.2.3 Validation. The seek time models have already been verified in ear-lier work [Worthington et al. 1995]. To validate the IDR model, its value iscomputed from the specifications for the disks listed in Table I using our mod-els and compared against the manufacturer-supplied IDR value. The resultingdata is presented in the last two columns of Table I. Again, it is assumed thateach of the disks uses a ZBR with 30 zones. From the table it can be observedthat for most of the disks the IDR predicted by our model and the actual IDRare within 15%.
4. MODELING THERMAL BEHAVIOR
The thermal model used in this study is based on the one developed by Eibeckand Cohen [1988]. This model evaluates the temperature distribution of thedrive by calculating the amount of heat generated by components such as theSPM and the VCM, the conduction of heat along solid components, and the con-vection of heat to the air. It is assumed that the drive is completely enclosed,and the only interaction with the external air is by the conduction of heatthrough the base and cover and convection with the outside air. The outside airis assumed to be maintained at a constant temperature by some cooling mecha-nism. This is true in most modern systems where air flow is provided, typicallyusing fans and air conditioning, to maintain a constant external temperature[Seagate Cheetah 2006].
The model divides the hard disk into four components:
(1) the internal drive air;(2) the SPM assembly that consists of the motor hub and the platters;(3) the base and cover; and(4) the VCM and disk arms.
The heat transfer rate over a time interval t, dQdt (in watts), through a cross-
sectional area A is given by Newton’s Law of Cooling as
dQdt
= hA�T
where h is the heat-transfer coefficient and �T is the temperature differencebetween the two entities. For solids, where heat is transferred via conduction,the heat transfer coefficient h depends upon the thermal conductivity k and thethickness of the material, and is given by k
Thickness .Between solids and fluids, the heat exchange takes place via convection
where the heat-transfer coefficient depends on whether the fluid flow is lami-nar or turbulent, and also on the exact geometry of the solid components. Themodel makes use of empirical correlations for known geometries to calculatethe heat-transfer coefficient of the different solid components of the disk drive.The heat of the internal drive air is calculated as the sum of the heat energyconvected to it by each of the solid components and the viscous dissipation (in-ternal friction) in the air itself minus the heat that is lost through the cover to
ACM Transactions on Storage, Vol. 2, No. 1, February 2006.
Thermal Issues in Disk Drive Design: Challenges and Possible Solutions • 51
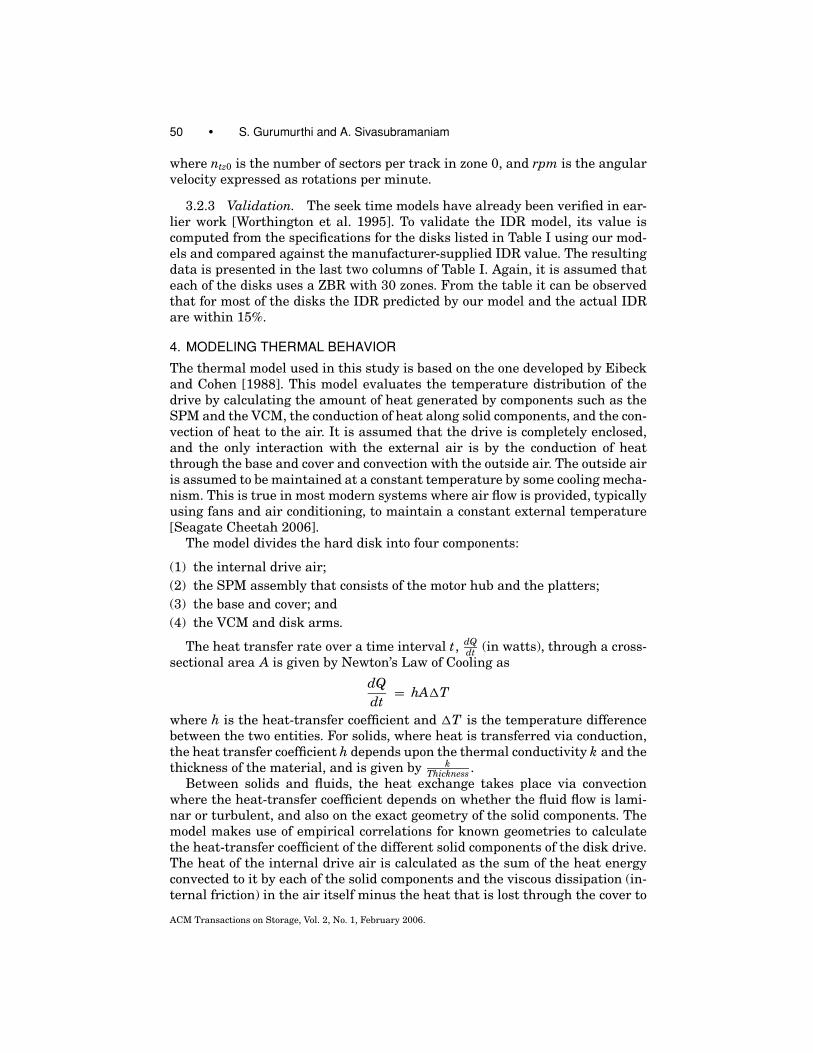
Table II. Maximum Operating Temperatures (for a specified external wet-bulb temperature)
Model Year RPM External Wet-Bulb Temp. Max. Oper. Temp.IBM Ultrastar 36LZX 1999 10K 29.4◦C 50◦CSeagate Cheetah X15 2000 15K 28.0◦C 55◦CIBM Ultrastar 36Z15 2001 15K 29.4◦C 55◦CSeagate Barracuda 180 2001 7.2K 28.0◦C 50◦C
the outside. Viscous dissipation is related linearly to the number of platters inthe disk stack, cubic (2.8th power, to be precise) with the disk RPM and to thefifth (4.6th power, to be precise) power of the platter diameter [Clauss 1988;Schirle and Lieu 1996].
To solve the heat equations for each component, the model uses the finitedifference method [Levy and Lessman 1992]. At each time step, the tempera-tures of all the components and the air are calculated, and this is iterativelyrevised at each subsequent time step until it converges to a steady state tem-perature. The air temperature is assumed to be uniform over the entire drive ateach time step. The accuracy of the model depends upon the granularity of thetime steps [Clauss 1988]. Using a coarse-grained time step provides a fastermodel (in terms of computation time), but the solution may not be accurate. Onthe other hand, an extremely fine-grained time step can provide an accuratesolution at the expense of a high computation time. A wide range of differentsizes were experimented with and it was found that a value of 600 steps perminute gives a solution very close (numerically) to that of the finer-grainedones.
There are a number of input parameters to the thermal model. The firstset of parameters relates to disk geometry, such as the inner and outer radiiof a platter, the drive enclosure dimensions, and the length of the disk arms.Another set of parameters pertains to the properties of the materials, such asthermal conductivity and density. There are also operational parameters suchas the number of platters, the RPM, the temperature of the outside air, and theVCM power.
With regard to the materials, the platters on most current disk drives aretypically made of an aluminum-magnesium alloy and the base/cover castingsare aluminum [Hetzler 2004]. As the exact alloy that is employed tends to beproprietary information, it was assumed that the platters, together with thedisk arm and spindle hub, are made of aluminum. With regard to the opera-tional parameters, the external ambient temperature was set to 28◦C, whichis the maximum operating wet-bulb temperature. The wet-bulb temperaturemeasures the temperature while taking the humidity of the air into account.Many disks, including some of the 13 that were examined in the earlier twosubsections (see Table II), specify a maximum wet-bulb external temperatureof 28–29.4◦C. When calculating the power of the VCM, which is dependent onplatter dimensions, previously published data was used [Sri-Jayantha 1995].This earlier work shows that the VCM power is roughly twice as large for a95 mm (3.7′′) platter compared to that for a 65 mm (2.5′′) one, and nearly fourtimes that of the 47 mm (1.8′′) size.
ACM Transactions on Storage, Vol. 2, No. 1, February 2006.
52 • S. Gurumurthi and A. Sivasubramaniam
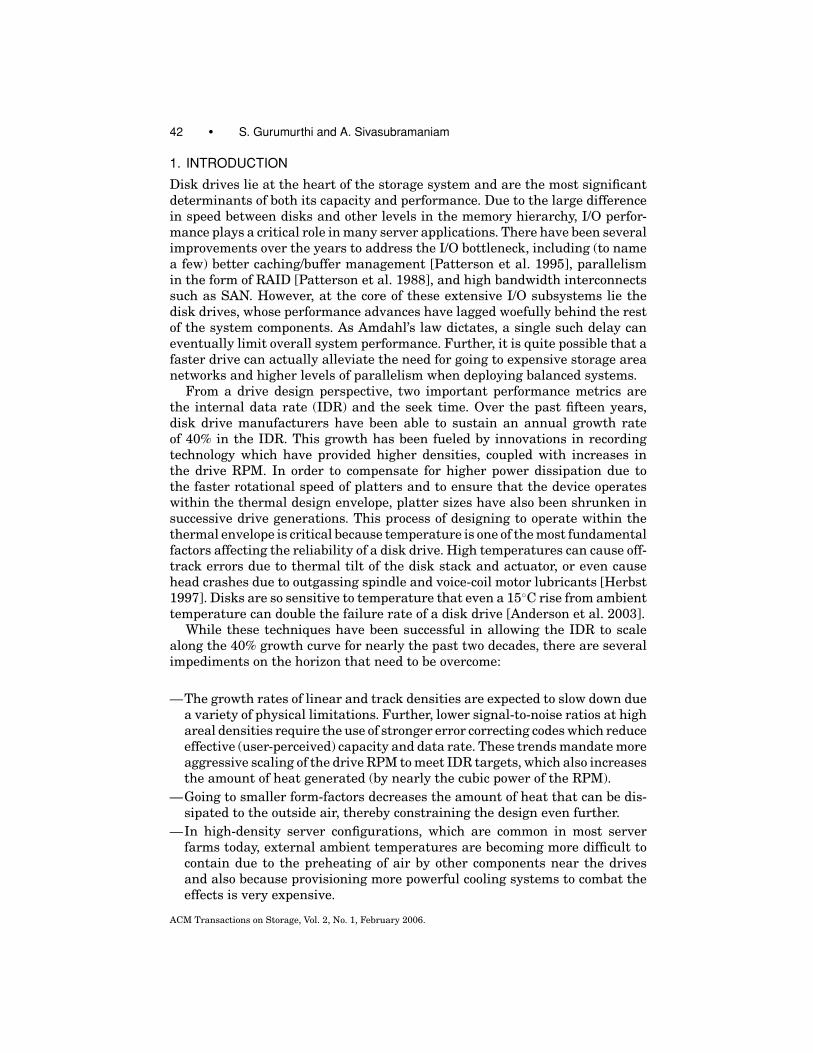
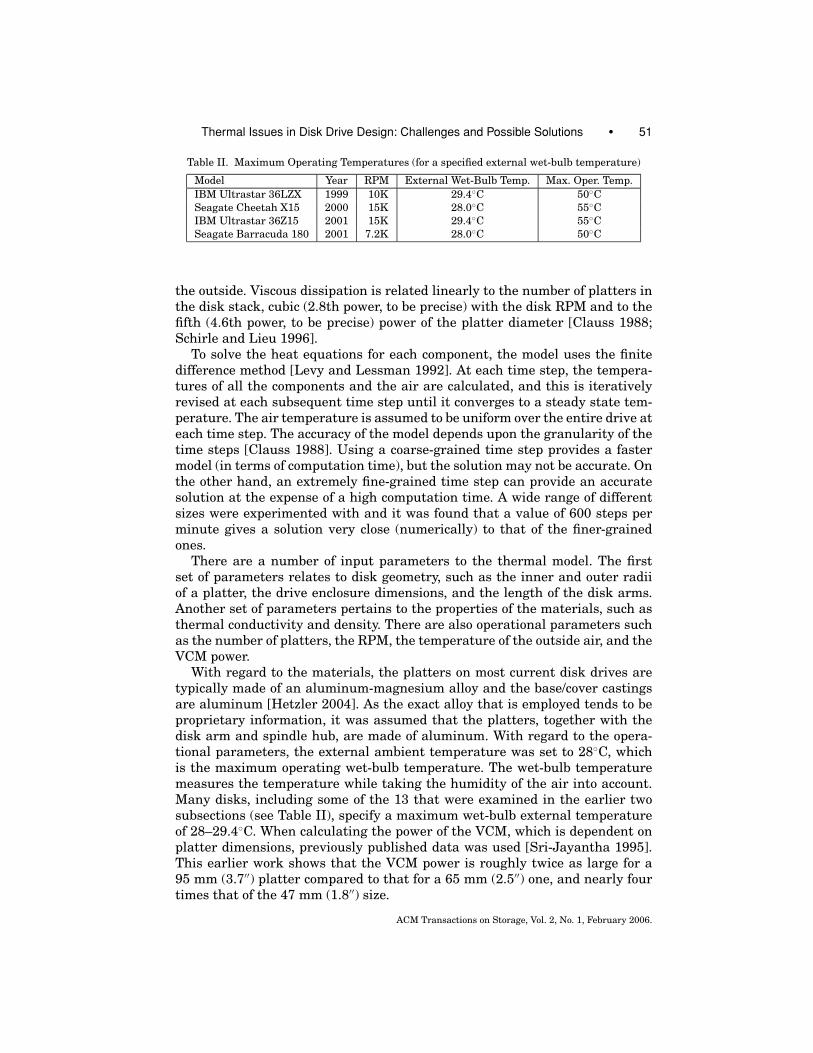
Fig. 2. Temperature of the modeled Cheetah ST318453 disk over time starting from an externaltemperature of 28◦C.
4.0.4 Validation and Setting a Thermal Envelope. The thermal model pro-posed earlier [Eibeck and Cohen 1988] was validated with disk drives that areover 15 years old. In addition to making sure that the model is still applicableto modern drives, we also need to define what should be the thermal envelope(i.e., the maximum operating temperature) for drive design when charting outthe roadmap.
The Seagate Cheetah 15K.3 ST318453 SCSI disk drive [Seagate Cheetah2006] was modeled in detail. This disk drive is composed of a single 2.6′′ platter(but a 3.5′′ form-factor enclosure) and rotates at 15K RPM (a 4–platter version ofthis disk is listed in the last row of Table I). The disk drive was taken apart andits geometry studied in detail. This allowed us to determine how the componentsare internally laid out and to create geometry models parameterized for theplatter size and count. The physical drive parameters, such as the length of thedisk arm, thickness of the platter, base and cover, etc., which are not consideredby the capacity and performance models, were measured precisely using Verniercalipers. The VCM power of this disk was determined to be 3.9 W. The diskspecifications (in their data sheets) typically include the maximum operatingtemperature which is the temperature that should not be exceeded even ifthe VCM and SPM are always on. In the validation experiment, the SPM andVCM were assumed to be perpetually on, and the internal air temperature wascalculated.
The temperature of the internal air over the duration of the experiment isshown in Figure 2. All components are initially the temperature of the out-side air, namely, 28◦C. The temperature rises from 28◦C to 33◦C within thefirst minute and rapidly increases thereafter. It then stabilizes and reachesa steady state of 45.22◦C after about 48 minutes. Only the VCM and SPMare considered to be heat sources, and we do not consider the heat generatedby the on-board electronics. This is due to the lack of publicly available data
ACM Transactions on Storage, Vol. 2, No. 1, February 2006.
Thermal Issues in Disk Drive Design: Challenges and Possible Solutions • 53
on the microarchitecture of the electronics and also the details of technologyroadmaps for ASICs. Consequently, the heat generated by these electronic com-ponents was discounted in all the results and the thermal envelope of operationwas reduced accordingly. In fact, earlier research [Huang and Chung 2002] hasshown that on-board electronics can add about 10◦C to the temperature withinthe drive. If we consider this additive factor (10 + 45.22 = 55.22◦C), the resultspresented here come very close to the rated maximum operating temperatureof this drive (which is 55◦C), verifying the validity of this model.
It is to be noted that the thermal envelope—the maximum temperaturewithin a drive for reliable operation—itself has negligible variance over time.This is reflected in the rated maximum operating temperatures of some of thedisks in the list spanning different years (1999–2001) and different RPMs, pro-cured from datasheets (see Table II), which remains more or less constant.Consequently, we used the same thermal envelope of 45.22◦C (obtained abovewithout on-board electronics) when laying out the roadmap over time acrossdisks of different platter sizes and numbers.
5. ROADMAP WITH THERMAL CONSTRAINTS
In the previous two sections, three drive models for capacity, performance,and thermal characteristics were presented, which, though explained indepen-dently, are rather closely intertwined. This is because many of the parametersused by each model can depend on the results from another. For instance, theperformance and thermal characteristics are closely dependent on the drive pa-rameters (e.g., the size and number of platters). The heat dissipation is closelydependent on the operating RPM. Finally, the capacity of drives is not onlylimited by recording technology, but also by the thermal envelope (larger ormore platters can lead to higher temperatures). It is important to ensure thatwe study all the interrelated factors together when charting out a disk drivetechnology roadmap.
This roadmap is driven by two fundamental factors: (i) the innovations inmagnetic technologies to increase recording densities (the BPI and TPI, in par-ticular), and (ii) the growing demands for high data transfer rates (the IDR).The trends in growth of BPI, TPI, and IDR over the past decade have been madeavailable by Hitachi [2006a] where the values for each year, together with theircompound (annual) growth rate (CGR), are given. For instance, for the year1999, the values for BPI, TPI, and IDR were 270 KBPI, 20 KTPI, and 47 MB/s,and their CGRs have been 30%, 50%, and 40%, respectively. This growth ratein the linear and track densities has resulted in an areal density CGR of 100%.These past and projected growth rates are the starting points for the roadmap.Even though we have benefited from these growth rates over the past decade,it is going to be challenging to maintain these growth trends in the future:
—The growth in BPI is expected to slow down due to several factors. First,increases in linear density would require lower head fly heights. With cur-rent head fly heights already being only a few nanometers from the plattersurface, it is very difficult to further reduce this. Second, increasing BPI re-quires higher recording medium coercivity, for which, as we mentioned in
ACM Transactions on Storage, Vol. 2, No. 1, February 2006.

54 • S. Gurumurthi and A. Sivasubramaniam
Section 3.1, it is not feasible to design a write head with the currently knownmaterials. Finally, the grain size is constrained by the superparamagneticlimit.
—The CGR for TPI is also expected to decline [Chen and Moon 2001]. IncreasingTPI requires that tracks be narrower, which makes them more susceptibleto media noise. Further, more closely spaced tracks can lead to intertrackinterference effects. Finally, with narrower tracks the track edges are noisierthan the center region and the edge effects increase.
As the BARs have also been dropping, there has been a larger slowdown inBPI CGR than for TPI. It has been shown [Chen and Moon 2001] that thereexist optimal values for the BAR for a given areal density. The BAR is aroundsix to seven for disks today and is expected to drop to four or below in thefuture [Hitachi 2006a]. Furthermore, it is expected [Grochowski 2004; Riedel2004] that the growth in areal density will slow down to 40–50%. Given thisgrowth in areal density, the industry projections predict the availability of anareal density of 1 Tb/in2 in the year 2010.
We studied a set of proposals for creating such a Terabit density disk [Wood2000; Mallary et al. 2002; Tarnopolsky 2004]. In particular, we were interestedin the feasible values for BPI and TPI, given all the constraints related to therecording medium, head design, and noise margins for constructing reliableTerabit density disks. Among the proposals, we chose the one with more con-servative assumptions about BPI, since it does not scale as well as TPI, to obtainvalues of 1.85 MBPI and 540 KTPI giving a BAR of 3.42 (which agrees withcurrent expectations). We then adjusted the CGRs for BPI and TPI to achievethis areal density in the year 2010, together with the expected BAR trends.This provides a BPI and TPI CGR of 14% and 28%, respectively (down from theoriginal values of 30% and 50%), to give an areal density CGR of about 46% peryear.
Once we had these fundamental parameters (the anticipated BPI and TPIfor each year), a “roadmap” was generated, starting from the year 2002, for aperiod of ten successive years, that is, up to the year 2012. The basic premisewhen doing this was that we were trying to sustain the expected IDR growthrate of at least 40% per year over the 11 year period. The steps when generatingthe temperature-dictated disk drive technology roadmap are given below:
(1) For each year, the values for BPI and TPI are plugged in from the above es-timates into the capacity model calculated in Section 3.1 for a given plattersize and number of platters, carried over from the previous year. In the re-sulting disk configuration, we can calculate its IDR for a given RPM (whichis again carried over from the previous year) by putting in the appropri-ate values for ntz0 in Equation 4. If the resulting IDR meets the projected40% growth rate, then the new configuration remains within the tolerablethermal envelope (since the same platter size, number of platters, and RPMyielded a disk within the thermal envelope in the previous year).
(2) However, if the disk from Step 1 does not meet the target IDR for thatyear, one option is to see whether increasing the RPM can get us to this
ACM Transactions on Storage, Vol. 2, No. 1, February 2006.

Thermal Issues in Disk Drive Design: Challenges and Possible Solutions • 55
IDR (by putting this value in the LHS of Equation 4 and finding the rpm).We can then use the resulting disk configuration and RPM value in thethermal model of the disk in Section 4 to see whether this remains withinthe thermal envelope. If it does, then we have achieved the target IDRusing the same number of platters and platter sizes as the previous yearby increasing the RPM.
(3) If the necessary RPM from Step 2 does not keep the new disk within thethermal envelope, then the other option for meeting the IDR target is toshrink the platter sizes. Recall that the viscous dissipation is proportionalto nearly the fifth power of the platter size, and the third power of the RPM.Further, a smaller platter size implies shorter seeks (in terms of physicaldistance traversed), thus reducing VCM power as well. Consequently, it ispossible to remain within the thermal envelope by shrinking the plattersize (note that the resulting ntz0 in Equation 4 decreases) and increasingthe RPM proportionally to compensate for the drop in IDR.
(4) Shrinking the platter size as in Step 3 results in a drop in the overall ca-pacity. Over a period of time, such reductions in capacity can accumulate,causing a concern. To compensate for this reduction it may become neces-sary to add platters at some point, causing all the steps enumerated aboveto be repeated.
Thus, the roadmap is not a single disk drive design point but a spectrumof different platter sizes (and their corresponding RPMs) that tries to sustainthe IDR growth rate from year to year. When generating this roadmap, we con-sider the initial platter size (in the year 2002) to be 2.6,′′ with two subsequentshrinks of 2.1′′ and 1.6′′ in later years. Smaller platter sizes are not considereddue to the unavailability of VCM power correlations and disk enclosure designconsiderations at such small media sizes. For each platter size in a given year,configurations with one, two, and four platters are considered. These repre-sent disks for low, medium, and high capacity market segments for the sametechnology generation. Increasing the number of platters also increases viscousdissipation. This is taken into account and different external cooling budgetsare provided for each of the three platter counts in order to use the same ther-mal envelope (45.22◦C) for these higher platter disks at the beginning of theroadmap. We assume that the cooling technology remains invariant over time,and that the disks need to be designed for the thermal envelope based solely oninternal choices. The ramifications of changes in the cooling system are studiedin Section 7.1.
6. RESULTS
As a first step in the analysis, it is interesting to investigate what disk speedwould be required for a given platter size and its resultant thermal impactwhen trying to meet the 40% IDR growth target. In the absence of any thermalconstraints, if we are to meet the IDR target for a given year, we would use thelargest platter size possible and merely modulate the RPM to reach the desiredvalue (Step 2 of the method). Tables III, IV, and V give the RPM that is requiredin each year for the three platter sizes that we consider and the steady state
ACM Transactions on Storage, Vol. 2, No. 1, February 2006.
56 • S. Gurumurthi and A. Sivasubramaniam
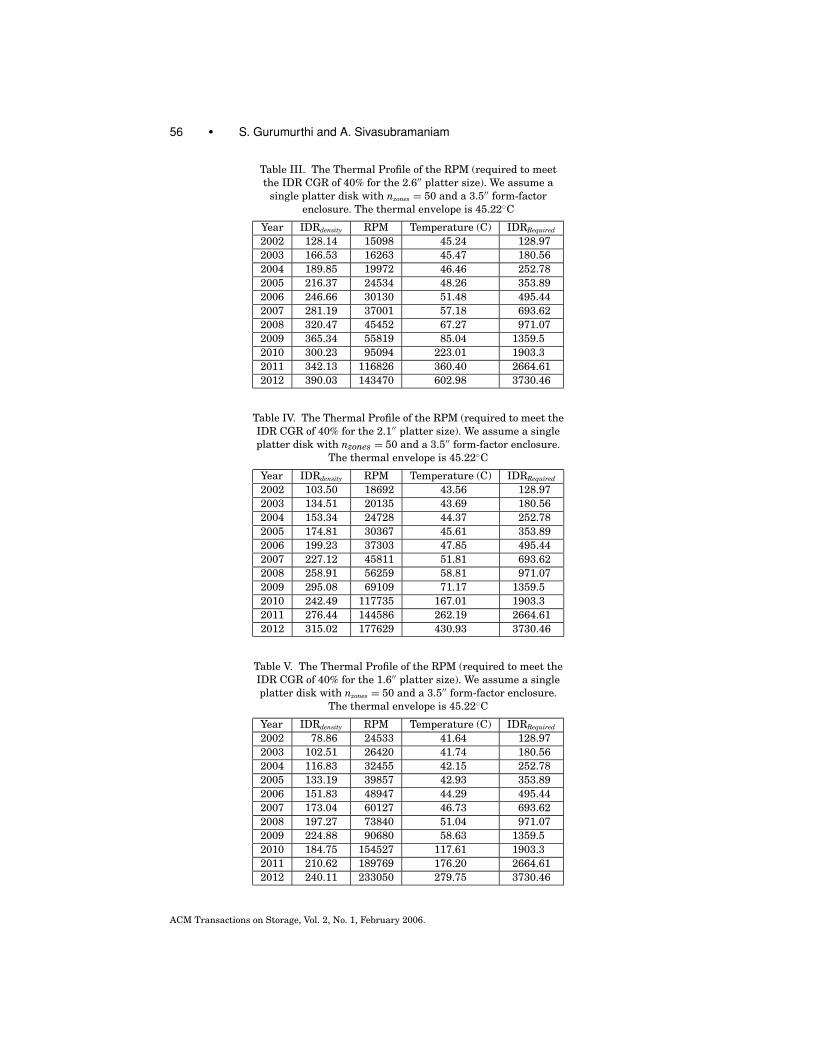
Table III. The Thermal Profile of the RPM (required to meetthe IDR CGR of 40% for the 2.6′′ platter size). We assume a
single platter disk with nzones = 50 and a 3.5′′ form-factorenclosure. The thermal envelope is 45.22◦C
Year IDRdensity RPM Temperature (C) IDRRequired
2002 128.14 15098 45.24 128.972003 166.53 16263 45.47 180.562004 189.85 19972 46.46 252.782005 216.37 24534 48.26 353.892006 246.66 30130 51.48 495.442007 281.19 37001 57.18 693.622008 320.47 45452 67.27 971.072009 365.34 55819 85.04 1359.52010 300.23 95094 223.01 1903.32011 342.13 116826 360.40 2664.612012 390.03 143470 602.98 3730.46
Table IV. The Thermal Profile of the RPM (required to meet theIDR CGR of 40% for the 2.1′′ platter size). We assume a singleplatter disk with nzones = 50 and a 3.5′′ form-factor enclosure.
The thermal envelope is 45.22◦C
Year IDRdensity RPM Temperature (C) IDRRequired
2002 103.50 18692 43.56 128.972003 134.51 20135 43.69 180.562004 153.34 24728 44.37 252.782005 174.81 30367 45.61 353.892006 199.23 37303 47.85 495.442007 227.12 45811 51.81 693.622008 258.91 56259 58.81 971.072009 295.08 69109 71.17 1359.52010 242.49 117735 167.01 1903.32011 276.44 144586 262.19 2664.612012 315.02 177629 430.93 3730.46
Table V. The Thermal Profile of the RPM (required to meet theIDR CGR of 40% for the 1.6′′ platter size). We assume a singleplatter disk with nzones = 50 and a 3.5′′ form-factor enclosure.
The thermal envelope is 45.22◦C
Year IDRdensity RPM Temperature (C) IDRRequired
2002 78.86 24533 41.64 128.972003 102.51 26420 41.74 180.562004 116.83 32455 42.15 252.782005 133.19 39857 42.93 353.892006 151.83 48947 44.29 495.442007 173.04 60127 46.73 693.622008 197.27 73840 51.04 971.072009 224.88 90680 58.63 1359.52010 184.75 154527 117.61 1903.32011 210.62 189769 176.20 2664.612012 240.11 233050 279.75 3730.46
ACM Transactions on Storage, Vol. 2, No. 1, February 2006.
Thermal Issues in Disk Drive Design: Challenges and Possible Solutions • 57
temperature that is reached for a one platter configuration. Trends for two andfour platter configurations are similar.
Let us analyze these results by first focusing on the 2.6′′ platter size. TheIDR requirements (shown as IDRRequired in Table III) from the years 2002 to2012 increase nearly 29 times. A portion of the required increase is providedby the growth in linear density, denoted in the table as IDRdensity (i.e., the IDRobtainable with just the density growth and no RPM changes). Any demandsbeyond that have to be provided by an increase in the RPM. For instance, theRPM requirements grow nearly 9.5 times from the year 2002 to 2012. For abetter understanding, let us subdivide the timeline into three regions, namely,the years before 2004, where the BPI and TPI CGRs are 30% and 50%, respec-tively, the years from 2004 to 2009, which are in the subTerabit areal densities,and the region from 2010 to 2012. Recall that the growth rates in BPI and TPIslow down after 2003 to 14% and 28%, respectively, and the ECC overheads forTerabit areal density disks would increase to 35%. The effects of these trendsare shown in the Table, where there is only a 7.7% increase in the requiredRPM from 2002 to 2003, but the required RPM growth increases to about 23%per annum in the post-2003 region. During the Terabit transition (from 2009to 2010), a sudden 70% increase in RPM is required. This is due to the way theimpact of ECC is modeled, as a sudden increase from 10% to 35% when tran-sitioning into the Terabit region. Realistically, this transition would be moregradual. After this steep increase, the RPM growth rate again steadies out to23% for the subsequent years.
When examining the thermal characteristics of the 2.6′′ drive, a similar trendis observable for the three temporal regions of the roadmap. The heat due toviscous dissipation increases from 0.91 W in 2002 to 1.13 W in 2003. In thesecond region, due to higher rotational speed growth (and its relationship inthe cubic power) the viscous dissipation grows from 2 W in 2004 to over 35.55 Win 2009, causing a significant rise in temperature well beyond the thermalenvelope of 45.22◦C. Therefore, all else remaining constant, it is clear thatfuture single platter disk drives would not be able to provide the desired IDRsat the 2.6′′ platter size. Viscous dissipation increases even further from year2010 onwards and reaches a value of 499.73 W in 2012, causing the internaldrive air temperature to reach as high as 602.98◦C for this platter size.
The effect of shrinking the platter (related in the fifth power to heat, whichcan compensate for certain amounts of increases in RPM) can be observed byexamining the results for the 2.1′′ and 1.6′′ drives in Tables IV and V. Eventhough a smaller platter size implies a higher RPM is needed to meet the re-quired IDR (than for the 2.6′′ drive), it can be seen that the higher RPMs canbe somewhat offset by moving to the smaller sizes, helping us stay within thethermal envelope until around 2007. Beyond that, even the 1.6′′ size is too bigto stay within the envelope.
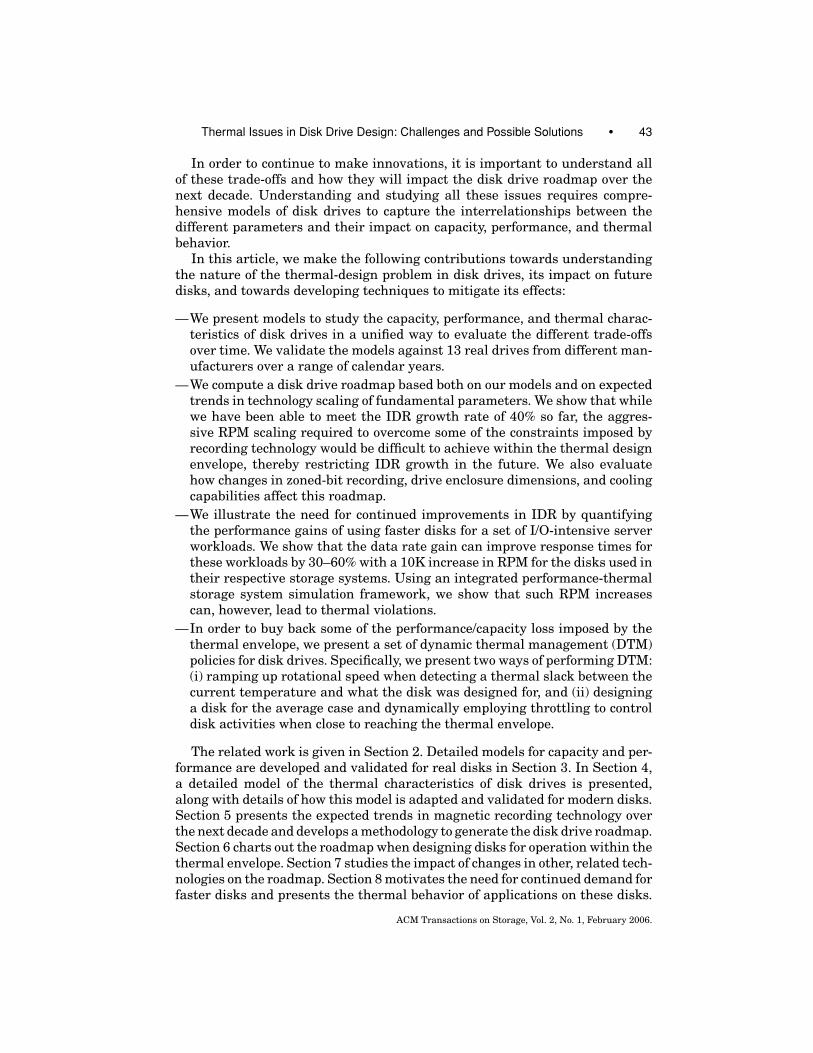
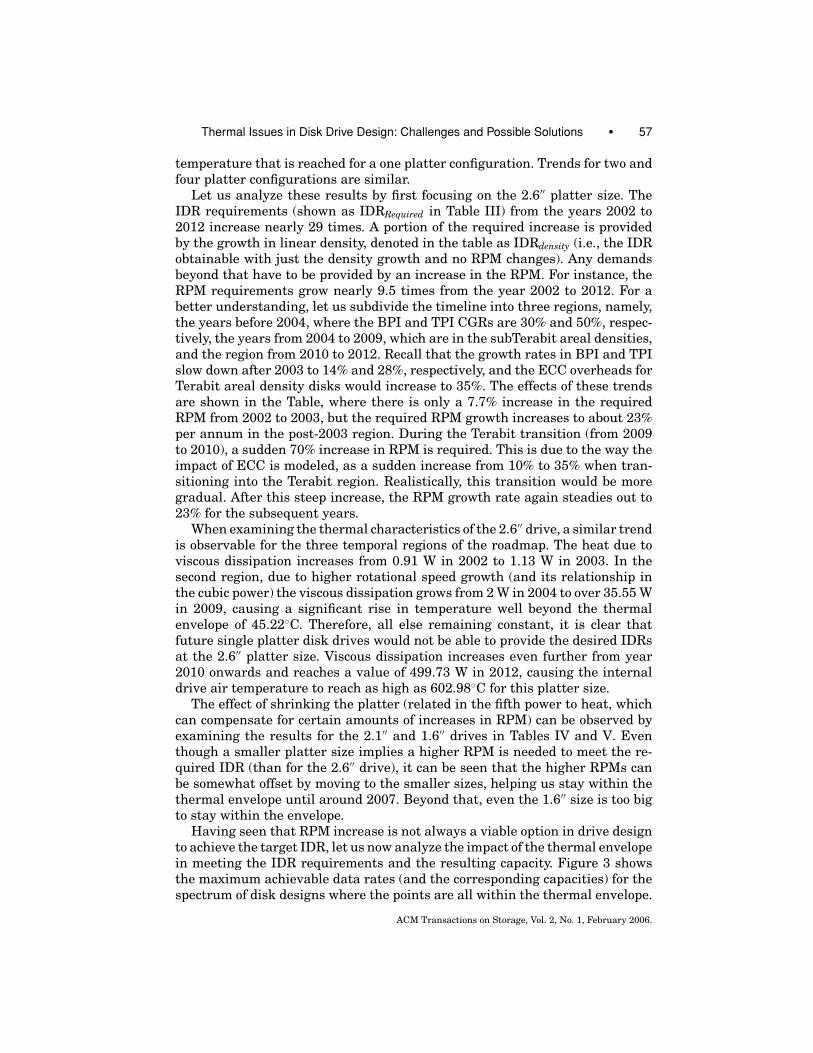
Having seen that RPM increase is not always a viable option in drive designto achieve the target IDR, let us now analyze the impact of the thermal envelopein meeting the IDR requirements and the resulting capacity. Figure 3 showsthe maximum achievable data rates (and the corresponding capacities) for thespectrum of disk designs where the points are all within the thermal envelope.
ACM Transactions on Storage, Vol. 2, No. 1, February 2006.
58 • S. Gurumurthi and A. Sivasubramaniam
Fig. 3. Disk drive roadmap. Each solid curve (for a given platter size) gives the maximum attain-able IDR (in the top three graphs) for that configuration which is within the thermal envelope of45.22◦C, and the corresponding capacity (in the bottom three graphs), for a given year. The dottedline indicates the 40% target growth rate in IDR over time. Any curve which falls below this dottedline fails to meet the target for those years.
For each experiment (with a given number of platters, each of a given size),the maximum RPM that it can run without exceeding the thermal envelope iscalculated. This coupled with the density values for the corresponding year canbe used to calculate the maximum IDR (and its capacity) that such a disk cansustain within the envelope. In addition to these lines, the IDR graphs also plotthe 40% growth rate target (the dotted line). The IDR roadmap points whichyield a value in any year larger than the corresponding value in the dotted lineindicate that the corresponding configuration can yield a higher data rate thanthe target. Typically, in such years the manufacturer of such a disk may opt toemploy a lower RPM to just sustain the target IDR, rather than what is reallypossible. The more interesting points are where the roadmap lines intersect thetarget IDR line. Note that the y-axes of all IDR roadmap graphs are in log-scale.
Let us first consider the one-platter roadmap. We can see that the 1.6′′ platter,and also the 2.1′′ to a certain extent, is able to provide (and even exceed in theearlier years) the target IDR until about 2006. The 2.6′′ platter size, however,starts falling short of being able to meet the projections from 2003 onwards.The 2.1′′ and 1.6′′ sizes reach their maximum allowable RPMs in the 2004–2005 and 2006–2007 time-frames, respectively, after which they fall short of theIDR requirements. At such points, the manufacturer is presented with threeoptions:
—Sacrifice the data rate and retain capacity growth by maintaining the sameplatter size.
—Sacrifice capacity by reducing the platter size to achieve the higher data rate.
ACM Transactions on Storage, Vol. 2, No. 1, February 2006.
Thermal Issues in Disk Drive Design: Challenges and Possible Solutions • 59
—Achieve the higher IDR by shrinking the platter but get the higher capacityby adding more platters.
For example, consider the year 2005. From Table IV, we notice that a speed of30,367 RPM would be required to meet the IDR for the 2.1′′ size. However, thisis 1,543 RPM in excess of what is required to be within the thermal envelope.If we shrink the platter to 1.6′′ we would be able to achieve this data rate withan RPM of 39,857. However, for the one platter device the capacity drops from61.13 GB to just 35.48 GB. If the manufacturer wishes to achieve a capacitythat is closer to the 2.1′′ system, an additional platter may be added to push thecapacity of the 1.6′′ drive to 70.97 GB. At this point, the roadmap would shiftinto the two-platter system and consequently increase the cooling requirementsfor the product. In general, it can be seen that the IDR growth rate of 40% canbe sustained till the year 2006. Growth from 2006 to 2007 for the 1.6′′ plattersize dips to 25%, and to only 14% per annum subsequently.
When transitioning to Terabit areal densities in the year 2010, due to thelarge increase in the ECC overheads, which is not offset by the BPI growth, theIDR drops from 805.24 MB/s in 2009 to 661.39 MB/s in 2010. After this, theIDR growth of 14% is resumed. By the year 2012, there is a gap of over 2,870MB/s between the 40% CGR point and the best data rate achievable from thedesign space of this study. Similar trends can be observed for the two and fourplatter roadmaps as well, with the difference that the fall-off from the roadmapis slightly steeper (despite conservatively assuming a higher cooling budget)since they cause a higher viscous dissipation. This makes RPM an even biggerissue in restricting their maximum data rates.
7. IMPACT OF OTHER TECHNOLOGICAL CONSIDERATIONS
The influences that different drive parameters such as form-factor, extent ofzoned-bit recording, and effectiveness of the cooling system have on the aboveroadmap are now presented.
7.1 Cooling System
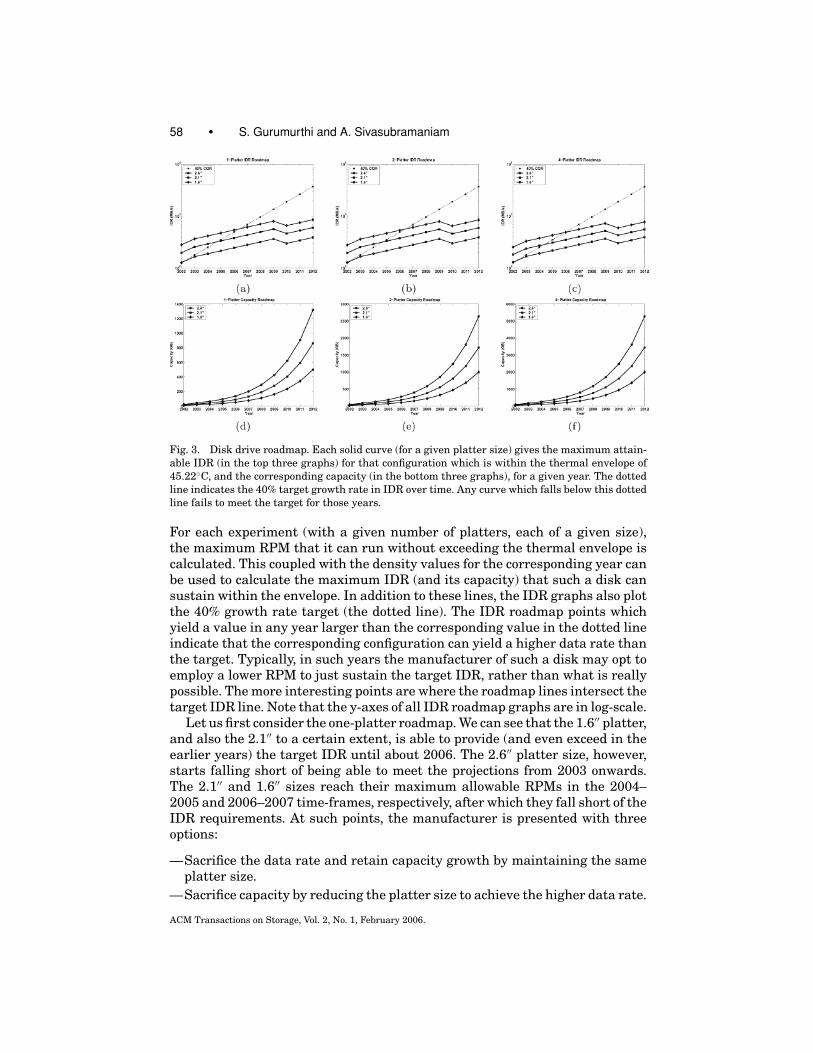
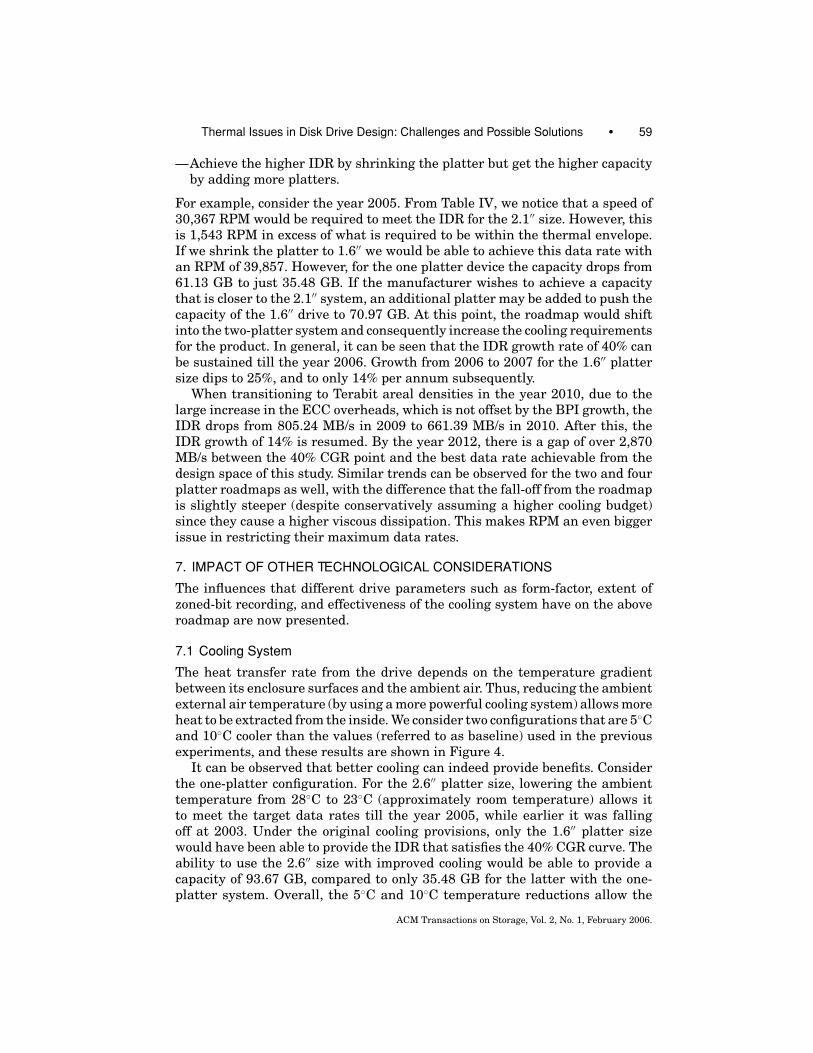
The heat transfer rate from the drive depends on the temperature gradientbetween its enclosure surfaces and the ambient air. Thus, reducing the ambientexternal air temperature (by using a more powerful cooling system) allows moreheat to be extracted from the inside. We consider two configurations that are 5◦Cand 10◦C cooler than the values (referred to as baseline) used in the previousexperiments, and these results are shown in Figure 4.
It can be observed that better cooling can indeed provide benefits. Considerthe one-platter configuration. For the 2.6′′ platter size, lowering the ambienttemperature from 28◦C to 23◦C (approximately room temperature) allows itto meet the target data rates till the year 2005, while earlier it was fallingoff at 2003. Under the original cooling provisions, only the 1.6′′ platter sizewould have been able to provide the IDR that satisfies the 40% CGR curve. Theability to use the 2.6′′ size with improved cooling would be able to provide acapacity of 93.67 GB, compared to only 35.48 GB for the latter with the one-platter system. Overall, the 5◦C and 10◦C temperature reductions allow the
ACM Transactions on Storage, Vol. 2, No. 1, February 2006.

60 • S. Gurumurthi and A. Sivasubramaniam
Fig. 4. Improvements in the cooling system. Each row is for a particular platter count, and eachcolumn for a particular platter size. Each graph shows the IDR in the original roadmap (baseline),together with those when the ambient external air temperature is 5◦C and 10◦C lower. The curvesare shown only for the data points where they fail to meet the target 40% CGR.
roadmap to be lengthened by one and two years, respectively (2007 and 2008),using the 1.6′′ size. However, the Terabit transition cannot be sustained evenby the aggressive cooling systems. The trends are found to be similar for higherplatter counts as well. For the two-platter system, the 40% CGR roadmap canbe maintained for as long as the single platter one. Beyond 2007, the fall-offof the data rates are sharper for the multiplatter drives. For instance, for the5◦C cooler configuration, the maximum attainable speed is only 66,240 RPM(with an IDR of 871.13 MB/s), whereas the one-platter disk can provide 71,580RPM (941.36 MB/s). A similar trend is observable for the 10◦C configuration aswell. This behavior is even more pronounced for the four-platter system, wherethe roadmap itself drops off a year earlier. As the viscous dissipation is higherif there are more platters, they tend to limit the achievable RPM to a greaterextent.
Though these enhancements can buy some more time in the roadmap (andenhance drive reliability as well [Anderson et al. 2003]), increasing the coolingrequirement is not that attractive from the practical viewpoint because:
(1) It is not as easy to control ambient temperature in a desktop setting, sincea large fraction of disk drives are sold as commodity.
ACM Transactions on Storage, Vol. 2, No. 1, February 2006.
Thermal Issues in Disk Drive Design: Challenges and Possible Solutions • 61
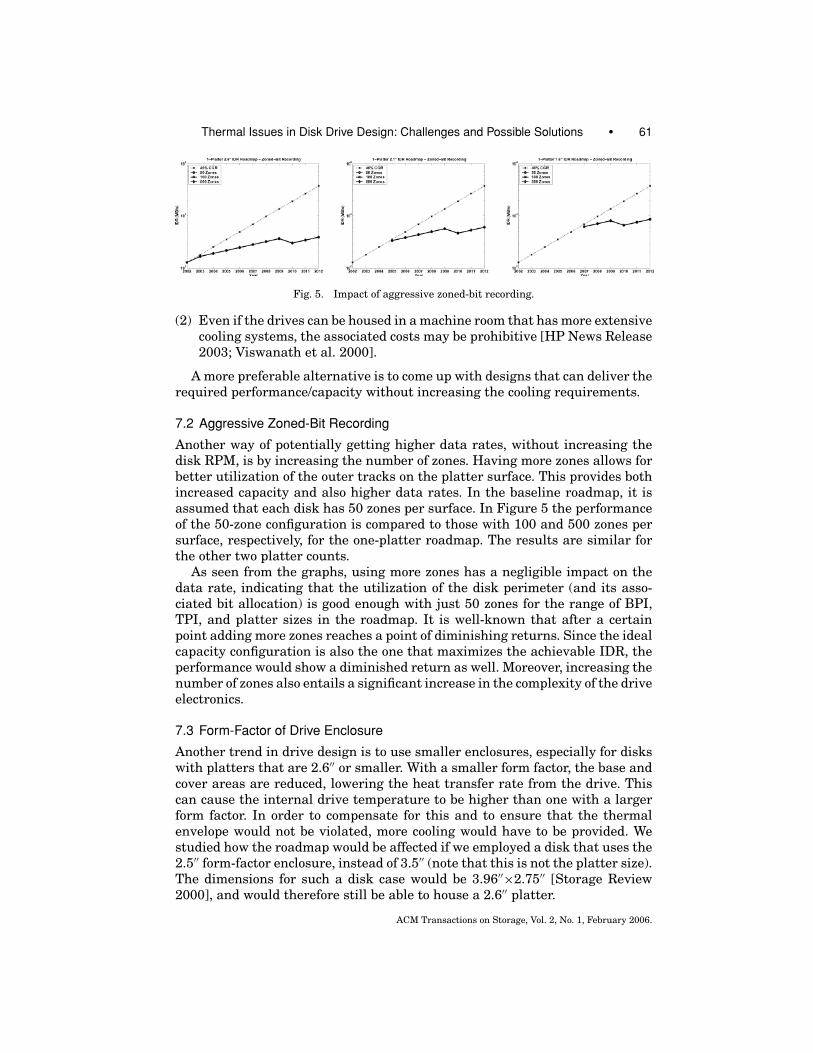
Fig. 5. Impact of aggressive zoned-bit recording.
(2) Even if the drives can be housed in a machine room that has more extensivecooling systems, the associated costs may be prohibitive [HP News Release2003; Viswanath et al. 2000].
A more preferable alternative is to come up with designs that can deliver therequired performance/capacity without increasing the cooling requirements.
7.2 Aggressive Zoned-Bit Recording
Another way of potentially getting higher data rates, without increasing thedisk RPM, is by increasing the number of zones. Having more zones allows forbetter utilization of the outer tracks on the platter surface. This provides bothincreased capacity and also higher data rates. In the baseline roadmap, it isassumed that each disk has 50 zones per surface. In Figure 5 the performanceof the 50-zone configuration is compared to those with 100 and 500 zones persurface, respectively, for the one-platter roadmap. The results are similar forthe other two platter counts.
As seen from the graphs, using more zones has a negligible impact on thedata rate, indicating that the utilization of the disk perimeter (and its asso-ciated bit allocation) is good enough with just 50 zones for the range of BPI,TPI, and platter sizes in the roadmap. It is well-known that after a certainpoint adding more zones reaches a point of diminishing returns. Since the idealcapacity configuration is also the one that maximizes the achievable IDR, theperformance would show a diminished return as well. Moreover, increasing thenumber of zones also entails a significant increase in the complexity of the driveelectronics.
7.3 Form-Factor of Drive Enclosure
Another trend in drive design is to use smaller enclosures, especially for diskswith platters that are 2.6′′ or smaller. With a smaller form factor, the base andcover areas are reduced, lowering the heat transfer rate from the drive. Thiscan cause the internal drive temperature to be higher than one with a largerform factor. In order to compensate for this and to ensure that the thermalenvelope would not be violated, more cooling would have to be provided. Westudied how the roadmap would be affected if we employed a disk that uses the2.5′′ form-factor enclosure, instead of 3.5′′ (note that this is not the platter size).The dimensions for such a disk case would be 3.96′′×2.75′′ [Storage Review2000], and would therefore still be able to house a 2.6′′ platter.
ACM Transactions on Storage, Vol. 2, No. 1, February 2006.

62 • S. Gurumurthi and A. Sivasubramaniam
Fig. 6. Using a smaller drive enclosure.
The 2.6′′ platter size is equally ineffective in both form-factors in trackingthe 40% CGR curve. Also, the larger form-factor delivers slightly better per-formance than the 2.5′′ one. This gap widens as we move into the higher RPMranges of the roadmap. This is due to the limitations of the smaller base andcover to dissipate the internal drive heat to the ambient air. These limitationsstart becoming more serious as the internally generated heat increases for thehigher RPMs. The differences were not found to be significant between the oneand two platter models. However, the roll-off in data rates are slightly higherfor the four-platter configurations due to the additional viscous heat that isgenerated.
In general, the results clearly indicate that we tend to fall off the roadmapeven at 2002 by going for such a smaller enclosure, and a much more aggressivecooling system to cut the ambient temperature by at least another 15◦C isneeded before this becomes a comparable option.
8. DYNAMIC THERMAL MANAGEMENT (DTM)
In Section 6, we have seen that the thermal design envelope poses a challengeto the data rate scaling that we have enjoyed for nearly the past two decades.Although it may appear that the trivial approach to tackling this problem isto employ a more powerful cooling system, this is not an attractive solution
ACM Transactions on Storage, Vol. 2, No. 1, February 2006.

Thermal Issues in Disk Drive Design: Challenges and Possible Solutions • 63
given the high cost of cooling and the nature of the disk drive market where thedevices are sold as commodity. It is therefore desirable to come up with a moreelegant solution to the problem. In this section, we shall present a set of dynamicthermal management (DTM) strategies that can be used to boost performancewhile still working under the constraints imposed by the thermal envelope. Inparticular, we propose and evaluate the two DTM approaches outlined below:
(1) Detecting thermal slack (the difference between the current temperatureand the thermal envelope that the disk has been designed for) and exploitingit to temporarily ramp-up RPM (assuming that the disk can support DRPM)for better performance.
(2) Deploying a disk that has been designed for average case behavior and torun it at a higher RPM than what the worst case would support most ofthe time, and using dynamic throttling techniques when getting close tothermal emergencies.
In this section, we first motivate the need for continued improvement in thespeed of disk drives by quantifying the improvement in I/O performance pro-vided by higher RPMs using a set of commercial application traces. We studythe thermal behavior of these applications when such disks are employed, us-ing a performance-thermal simulation infrastructure, and show that the directincorporation of such higher RPMs can cause the drive temperature to exceedthe thermal envelope. Subsequently, the above two mechanisms are discussedas possible means of achieving such data rates.
8.1 The Need for Faster Disks
Even though it is apparent that higher data rates would help bandwidth-limitedworkloads, we are still interested in finding out how helpful this can be in thecontext of realistic workloads. We conducted this evaluation using five commer-cial I/O traces given in Figure 7(a). The TPC-C trace was collected on a two-wayDell PowerEdge SMP machine, and the TPC-H trace was collected on an eight-way IBM Netfinity SMP system, both using DB2 on Linux as the underlyingplatform. Table also gives the approximate year when the traces were collected.
The models presented in Section 3 were used to capture some of the diskperformance and capacity characteristics for the appropriate year (since thisinformation was not always available). All the disks were assumed to have a4 MB disk cache and ZBR with 30 zones per surface. For the RAID systems,RAID-5 was used with a stripe-size of 16 512-byte blocks. The performance of thedisks was simulated using DiskSim [Ganger et al. 1999] with the appropriateRPM in Figure 7(a). The experiments were conducted by increasing the RPMin steps of 5000 (without their thermal effects) to find the impact on responsetime. The objective of this experiment is to investigate if using higher RPMdisks can provide significant storage system performance boosts.
Results from these experiments are shown in Figure 7 in the form of CDFplots of the response times. In addition, below each graph the average responsetimes are indicated. It is observed that even a 5000 RPM increase from thebaseline provides significant benefit in the I/O response time. Average response
ACM Transactions on Storage, Vol. 2, No. 1, February 2006.

64 • S. Gurumurthi and A. Sivasubramaniam
Fig. 7. Performance impact of faster disk drives for server workloads. Each graph shows the CDFof the response times for each RPM used in the constituent drives in the simulated systems. Theaverage response time for each of the corresponding configurations is shown below each plot inorder of increasing RPMs.
ACM Transactions on Storage, Vol. 2, No. 1, February 2006.
Thermal Issues in Disk Drive Design: Challenges and Possible Solutions • 65
times improved by 20.8% for the OLTP application to over 52.5% for Openmailfor such an increase, and by more than 31%–66% with a 10K RPM increaseabove the baselines. For the Openmail, search-engine, and TPC-C workloadswe notice that the entire CDF curve shifts to the left, indicating that most of theI/O requests benefited from increased RPM. We find the higher RPM helpingeven those workloads with a considerable number of seeks such as Openmail,where there is an average seek distance of 1952 cylinders per request withover 86% of all requests requiring a movement of the arm. This is because mostrequests span multiple successive blocks, thus benefiting from the higher RPM.These results motivate the need for continued growth in the data rates of diskdrives.
8.1.1 Thermal Ramifications. Having seen the performance benefits thatthe faster disks would have provided for the applications on their respectivestorage systems, let us turn our attention to the thermal consequences. Inorder to perform this experiment, we built a simulation framework that inte-grated both the performance (DiskSim) and thermal models. In this simulator,the thermal state is maintained and updated as the performance simulationprogresses. The state information is maintained separately for each simulateddisk (the thermal interactions between the different disks are not currentlymodeled). The thermal state of a disk is updated upon any event in the perfor-mance simulation that affects thermal behavior, that is, a seek that requires themovement of the disk arm and thus causes the VCM to consume power. SinceDiskSim is an event-driven simulator and the thermal model is based on explicittime-varying behavior (time-step simulation), a sampling-based approach wasfollowed. Here, the performance model invokes the thermal simulator a certainnumber of times between any two I/O events and communicates its state. Wefound that taking 400 samples between any two I/O requests gives a thermalprofile that is reasonably accurate. Care was also taken to ensure a one-to-onetiming correspondence between the performance and thermal models. The dif-ferent components of a disk seek that affect the drive temperature, namely,acceleration, coast, and deceleration, were modeled accurately. For this, we as-sumed a bang-bang triangular seek [Ho 1997] where both the acceleration anddeceleration times are equal, which is typical of most disk drives.
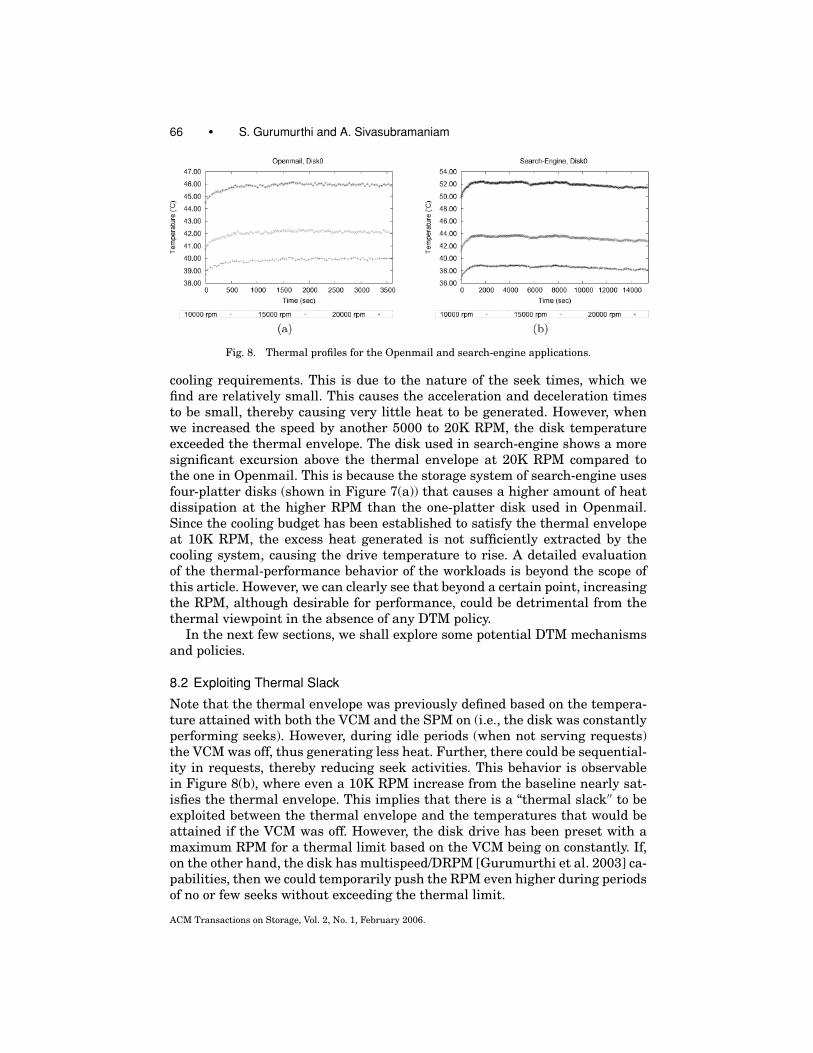
Figure 8 shows the thermal behavior of the Openmail and search-engineapplications. The graphs show the temperature of one of the disks, namely, disk0, during the entire simulation time of the workloads. In each graph we plot thetemperature when the disks are operating in their baseline configurations, inaddition to additional speeds that are 5K and 10K RPM higher than the baselinevalues, respectively. In order to simulate behavior after overcoming the startupeffects, the workload was executed after the disks were allowed to “warm up′′ for150 minutes after their initial turned-off (cold) state. During these 150 minutesits assumed that the disks are rotating but there is no movement of the armand hence, the VCM does not consume any power. Once the disks reached theirsteady state idle temperature, we started the execution of the workload.
For both workloads, we observe that a 5000 RPM increase from the base-line can be accommodated within the thermal envelope without increasing the
ACM Transactions on Storage, Vol. 2, No. 1, February 2006.
66 • S. Gurumurthi and A. Sivasubramaniam
Fig. 8. Thermal profiles for the Openmail and search-engine applications.
cooling requirements. This is due to the nature of the seek times, which wefind are relatively small. This causes the acceleration and deceleration timesto be small, thereby causing very little heat to be generated. However, whenwe increased the speed by another 5000 to 20K RPM, the disk temperatureexceeded the thermal envelope. The disk used in search-engine shows a moresignificant excursion above the thermal envelope at 20K RPM compared tothe one in Openmail. This is because the storage system of search-engine usesfour-platter disks (shown in Figure 7(a)) that causes a higher amount of heatdissipation at the higher RPM than the one-platter disk used in Openmail.Since the cooling budget has been established to satisfy the thermal envelopeat 10K RPM, the excess heat generated is not sufficiently extracted by thecooling system, causing the drive temperature to rise. A detailed evaluationof the thermal-performance behavior of the workloads is beyond the scope ofthis article. However, we can clearly see that beyond a certain point, increasingthe RPM, although desirable for performance, could be detrimental from thethermal viewpoint in the absence of any DTM policy.
In the next few sections, we shall explore some potential DTM mechanismsand policies.
8.2 Exploiting Thermal Slack
Note that the thermal envelope was previously defined based on the tempera-ture attained with both the VCM and the SPM on (i.e., the disk was constantlyperforming seeks). However, during idle periods (when not serving requests)the VCM was off, thus generating less heat. Further, there could be sequential-ity in requests, thereby reducing seek activities. This behavior is observablein Figure 8(b), where even a 10K RPM increase from the baseline nearly sat-isfies the thermal envelope. This implies that there is a “thermal slack′′ to beexploited between the thermal envelope and the temperatures that would beattained if the VCM was off. However, the disk drive has been preset with amaximum RPM for a thermal limit based on the VCM being on constantly. If,on the other hand, the disk has multispeed/DRPM [Gurumurthi et al. 2003] ca-pabilities, then we could temporarily push the RPM even higher during periodsof no or few seeks without exceeding the thermal limit.
ACM Transactions on Storage, Vol. 2, No. 1, February 2006.
Thermal Issues in Disk Drive Design: Challenges and Possible Solutions • 67
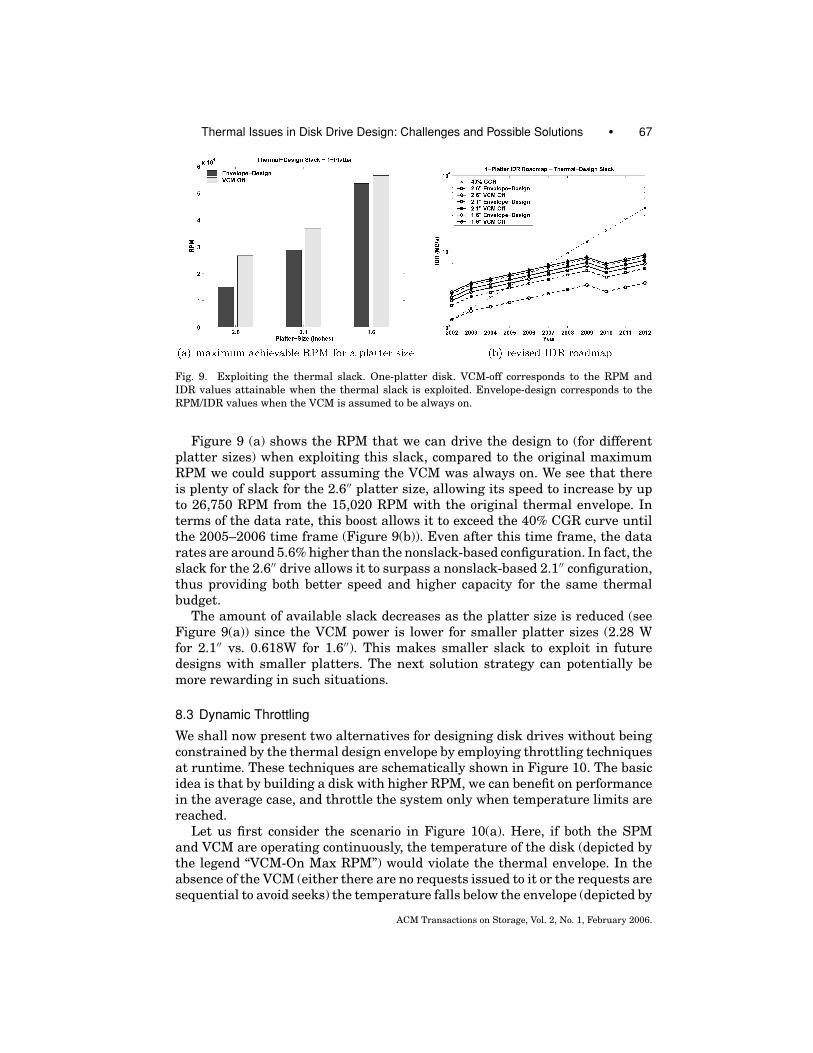
Fig. 9. Exploiting the thermal slack. One-platter disk. VCM-off corresponds to the RPM andIDR values attainable when the thermal slack is exploited. Envelope-design corresponds to theRPM/IDR values when the VCM is assumed to be always on.
Figure 9 (a) shows the RPM that we can drive the design to (for differentplatter sizes) when exploiting this slack, compared to the original maximumRPM we could support assuming the VCM was always on. We see that thereis plenty of slack for the 2.6′′ platter size, allowing its speed to increase by upto 26,750 RPM from the 15,020 RPM with the original thermal envelope. Interms of the data rate, this boost allows it to exceed the 40% CGR curve untilthe 2005–2006 time frame (Figure 9(b)). Even after this time frame, the datarates are around 5.6% higher than the nonslack-based configuration. In fact, theslack for the 2.6′′ drive allows it to surpass a nonslack-based 2.1′′ configuration,thus providing both better speed and higher capacity for the same thermalbudget.
The amount of available slack decreases as the platter size is reduced (seeFigure 9(a)) since the VCM power is lower for smaller platter sizes (2.28 Wfor 2.1′′ vs. 0.618W for 1.6′′). This makes smaller slack to exploit in futuredesigns with smaller platters. The next solution strategy can potentially bemore rewarding in such situations.
8.3 Dynamic Throttling
We shall now present two alternatives for designing disk drives without beingconstrained by the thermal design envelope by employing throttling techniquesat runtime. These techniques are schematically shown in Figure 10. The basicidea is that by building a disk with higher RPM, we can benefit on performancein the average case, and throttle the system only when temperature limits arereached.
Let us first consider the scenario in Figure 10(a). Here, if both the SPMand VCM are operating continuously, the temperature of the disk (depicted bythe legend “VCM-On Max RPM”) would violate the thermal envelope. In theabsence of the VCM (either there are no requests issued to it or the requests aresequential to avoid seeks) the temperature falls below the envelope (depicted by
ACM Transactions on Storage, Vol. 2, No. 1, February 2006.
68 • S. Gurumurthi and A. Sivasubramaniam
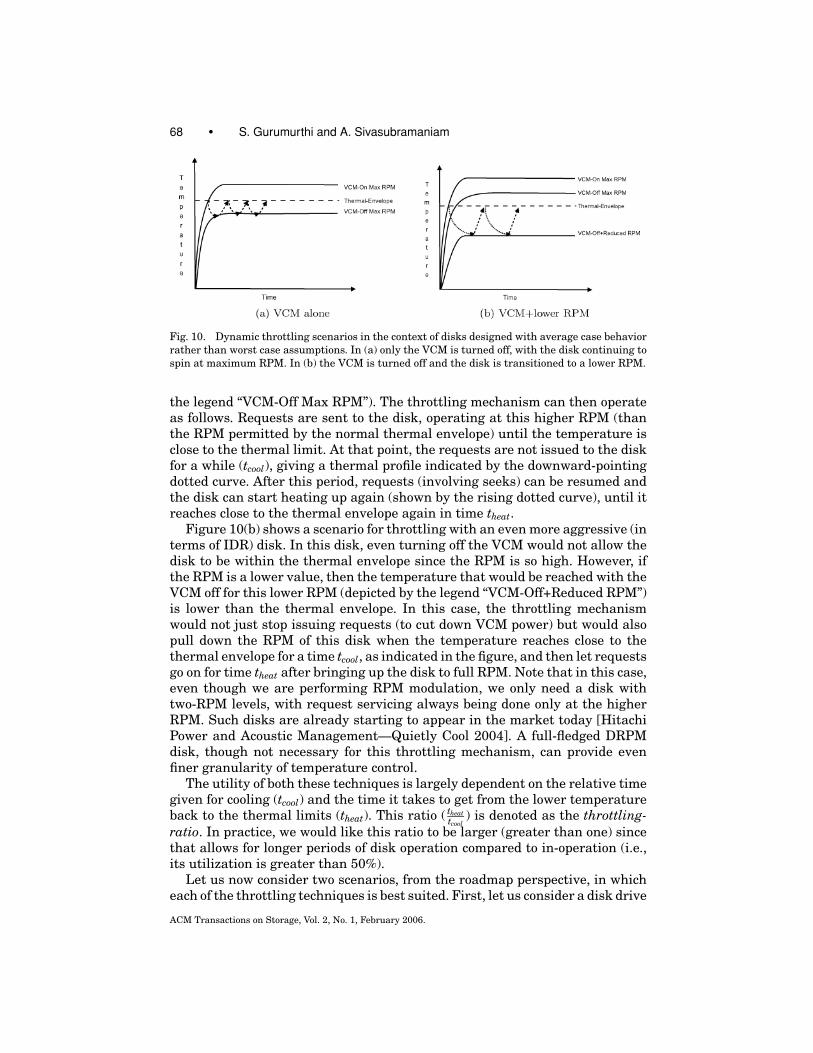
Fig. 10. Dynamic throttling scenarios in the context of disks designed with average case behaviorrather than worst case assumptions. In (a) only the VCM is turned off, with the disk continuing tospin at maximum RPM. In (b) the VCM is turned off and the disk is transitioned to a lower RPM.
the legend “VCM-Off Max RPM”). The throttling mechanism can then operateas follows. Requests are sent to the disk, operating at this higher RPM (thanthe RPM permitted by the normal thermal envelope) until the temperature isclose to the thermal limit. At that point, the requests are not issued to the diskfor a while (tcool), giving a thermal profile indicated by the downward-pointingdotted curve. After this period, requests (involving seeks) can be resumed andthe disk can start heating up again (shown by the rising dotted curve), until itreaches close to the thermal envelope again in time theat.
Figure 10(b) shows a scenario for throttling with an even more aggressive (interms of IDR) disk. In this disk, even turning off the VCM would not allow thedisk to be within the thermal envelope since the RPM is so high. However, ifthe RPM is a lower value, then the temperature that would be reached with theVCM off for this lower RPM (depicted by the legend “VCM-Off+Reduced RPM”)is lower than the thermal envelope. In this case, the throttling mechanismwould not just stop issuing requests (to cut down VCM power) but would alsopull down the RPM of this disk when the temperature reaches close to thethermal envelope for a time tcool, as indicated in the figure, and then let requestsgo on for time theat after bringing up the disk to full RPM. Note that in this case,even though we are performing RPM modulation, we only need a disk withtwo-RPM levels, with request servicing always being done only at the higherRPM. Such disks are already starting to appear in the market today [HitachiPower and Acoustic Management—Quietly Cool 2004]. A full-fledged DRPMdisk, though not necessary for this throttling mechanism, can provide evenfiner granularity of temperature control.
The utility of both these techniques is largely dependent on the relative timegiven for cooling (tcool) and the time it takes to get from the lower temperatureback to the thermal limits (theat). This ratio ( theat
tcool) is denoted as the throttling-
ratio. In practice, we would like this ratio to be larger (greater than one) sincethat allows for longer periods of disk operation compared to in-operation (i.e.,its utilization is greater than 50%).
Let us now consider two scenarios, from the roadmap perspective, in whicheach of the throttling techniques is best suited. First, let us consider a disk drive
ACM Transactions on Storage, Vol. 2, No. 1, February 2006.
Thermal Issues in Disk Drive Design: Challenges and Possible Solutions • 69
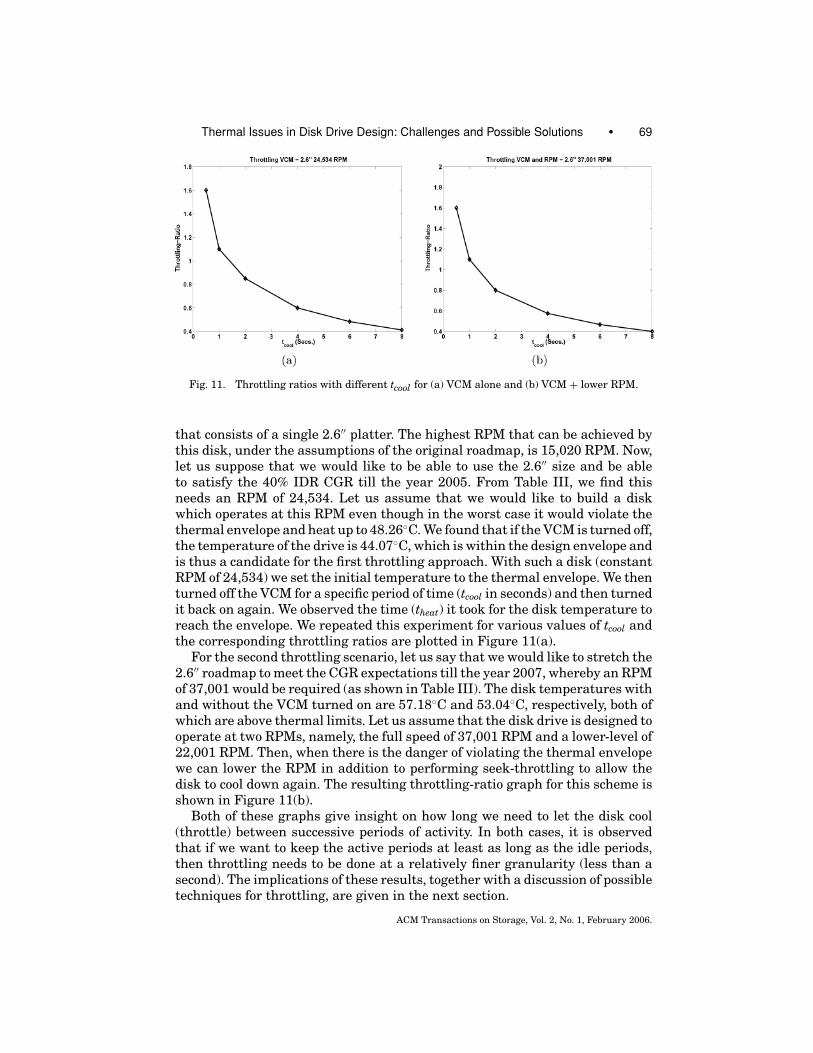
Fig. 11. Throttling ratios with different tcool for (a) VCM alone and (b) VCM + lower RPM.
that consists of a single 2.6′′ platter. The highest RPM that can be achieved bythis disk, under the assumptions of the original roadmap, is 15,020 RPM. Now,let us suppose that we would like to be able to use the 2.6′′ size and be ableto satisfy the 40% IDR CGR till the year 2005. From Table III, we find thisneeds an RPM of 24,534. Let us assume that we would like to build a diskwhich operates at this RPM even though in the worst case it would violate thethermal envelope and heat up to 48.26◦C. We found that if the VCM is turned off,the temperature of the drive is 44.07◦C, which is within the design envelope andis thus a candidate for the first throttling approach. With such a disk (constantRPM of 24,534) we set the initial temperature to the thermal envelope. We thenturned off the VCM for a specific period of time (tcool in seconds) and then turnedit back on again. We observed the time (theat) it took for the disk temperature toreach the envelope. We repeated this experiment for various values of tcool andthe corresponding throttling ratios are plotted in Figure 11(a).
For the second throttling scenario, let us say that we would like to stretch the2.6′′ roadmap to meet the CGR expectations till the year 2007, whereby an RPMof 37,001 would be required (as shown in Table III). The disk temperatures withand without the VCM turned on are 57.18◦C and 53.04◦C, respectively, both ofwhich are above thermal limits. Let us assume that the disk drive is designed tooperate at two RPMs, namely, the full speed of 37,001 RPM and a lower-level of22,001 RPM. Then, when there is the danger of violating the thermal envelopewe can lower the RPM in addition to performing seek-throttling to allow thedisk to cool down again. The resulting throttling-ratio graph for this scheme isshown in Figure 11(b).
Both of these graphs give insight on how long we need to let the disk cool(throttle) between successive periods of activity. In both cases, it is observedthat if we want to keep the active periods at least as long as the idle periods,then throttling needs to be done at a relatively finer granularity (less than asecond). The implications of these results, together with a discussion of possibletechniques for throttling, are given in the next section.
ACM Transactions on Storage, Vol. 2, No. 1, February 2006.
70 • S. Gurumurthi and A. Sivasubramaniam
8.4 Discussion
The results presented in this section indicate that there is some amount ofthermal slack between when the VCM is on and off (Section 8.2) to temporarilyramp-up the RPM. Such techniques can buy us some IDR in the near future.However, as platter sizes continue to diminish the benefits of this technique arelikely to become less significant due to the drop in VCM power. Furthermore,when the latencies to transition between the RPMs are also factored in, thebenefit would be even less.
The more promising approach, from both the effectiveness and complexityof design viewpoints, seems to be the dynamic throttling strategy. Throttlingis employed to reduce or avoid sending requests to the disk for a cooling downperiod before resuming again. The attractiveness of implementing throttlingeven with existing disks warrants a closer investigation of the techniques forachieving the intended goals with little performance loss. The throttling-ratiographs indicate that keeping the disk utilization higher than 50% requires afiner granularity of throttling—possibly at the granularity of a few dozen re-quests. If the interarrival times of requests in a workload are appropriatelyspaced, then we could achieve such throttling at little cost (or even for free).Another issue is how to best utilize the theat time period. For instance, one wayof masking out the performance loss during the tcool period is when conceivablyno activity on the disk-media can be performed, data could still be served outof the disk or controller caches. This motivates investigating how aggressiveprefetching during the theat phase could at least partially mask out any perfor-mance perturbation during throttling phases. Techniques for colocating dataitems to reduce seek overheads (e.g., [Ruemmler and Wilkes 1991]) can reduceVCM power and further enhance the potential of throttling. It is also possibleto use mirrored disks (i.e., writes propagate to both) while reads are directedto one for a while, and then sent to another during the cool down period. Thethrottling-ratio graphs give an indication of how many of these disks may needto be employed for a desired cool down period.
There are several other techniques to enhance IDR while remaining withinthermal bounds. For instance, we could use two disks, each with a differentplatter size. The larger disk, due to its thermal limitations, would have a lowerIDR than the smaller one, although the latter, assuming the platter counts to bethe same, would have a lesser capacity. Such a configuration allows the smallerdisk, which itself could have capacities in the order of several gigabytes, toserve as a cache for the larger one. This is somewhat similar in philosophy topreviously proposed cache disks [Hu and Yang 1996].
9. CONCLUDING REMARKS
This article has presented an integrated framework for studying the interrela-tionships of capacity, performance, and thermal characteristics of disk drives,and how these can be used to chart out a roadmap based on a given thermalenvelope. We have shown that aggressive RPM scaling (mandated by scalingproblems in magnetic recording density and higher error-correction code re-quirements) to sustain the status-quo in data rate growth poses problems from
ACM Transactions on Storage, Vol. 2, No. 1, February 2006.
Thermal Issues in Disk Drive Design: Challenges and Possible Solutions • 71
the thermal viewpoint. We show that using RPMs that would allow the tem-perature to be within the thermal envelope would cause significant slowdownin the IDR growth rates.
We have presented dynamic thermal management (DTM) as an option forbuying back at least some of the loss in IDR growth rates for the future by eitherexploiting the thermal slack, or by throttling disk activities. By employing theseoptions, we find that there is around 5–10K RPM to gain in the near future. Eventhough this may not be enough to get us back all the way to the IDR roadmap,this gain still provides substantial improvements in response times for severalserver I/O traces. Even if we do not wish to consider DTM as a method for ampli-fying data rates, it is important to reiterate that temperatures have a consider-able impact on long term drive reliability [Anderson et al. 2003], and we can useDTM just to reduce the average operating temperature for enhancing reliability.
This article identifies several future directions for research, including thosefor developing DTM control algorithms.
ACKNOWLEDGMENTS
We would like to thank Youngjae Kim for developing the integratedperformance-thermal simulation framework. We would also like to thank SteveHetzler, Gordon Hughes, Ed Grochowski, Erik Riedel, and Kevin Skadron fortheir inputs on different aspects of disk drive design and thermal modeling.
REFERENCES
ALVAREZ, G., KEETON, K., RIEDEL, E., AND UYSAL, M. 2001. Characterizing data-intensive workloadson modern disk arrays. In Proceedings of the Workshop on Computer Architecture EvaluationUsing Commercial Workloads.
ANDERSON, D., DYKES, J., AND RIEDEL, E. 2003. More than an interface—SCSI vs. ATA. In Proceed-ings of the Annual Conference on File and Storage Technology (FAST).
ASHAR, K. 1997. Magnetic Disk Drive Technology: Heads, Media, Channel, Interfaces, and Inte-gration. IEEE Press.
CHARRAP, S., LU, P., AND HE, Y. 1997. Thermal stability of recorded information at high densities.IEEE Trans. Magnetics 33, 1 (Jan.), 978–983.
CHEN, J. AND MOON, J. 2001. Detection signal-to-noise ratio versus bit cell aspect ratio at highareal densities. IEEE Trans. Magnetics 37, 3 (May), 1157–1167.
CHRISTEN, E. AND BAKALAR, K. 1999. VHDL-AMS—A hardware description language for analogand mixed-signal applications. IEEE Trans. Circuits Syst. II: Analog and Digital Signal Process-ing 46, 10 (Oct.), 1263–1272.
CLAUSS, N. 1988. A computational model of the thermal expansion within a fixed disk drivestorage system. M.S. thesis, University of California, Berkeley.
DAMMERS, D., BINET, P., PELZ, G., AND VOßKAMPER, L. 2001. Motor modeling based on physical effectmodels. In Proceedings of the IEEE/ACM International Workshop on Behavioral Modeling andSimulation (BMAS), 78–83.
DAMON, D. AND CHRISTEN, E. 1996. Introduction to VHDL-AMS—Part 1: Structural and discretetime concepts. In Proceedings of the International Symposium on Computer-Aided Control SystemDesign, 264–269.
EIBECK, P. AND COHEN, D. 1988. Modeling thermal characteristics of a fixed disk drive. IEEETrans. Components, Hybrids, and Manufacturing Technology 11, 4 (Dec.), 566–570.
GANGER, G., WORTHINGTON, B., AND PATT, Y. 1999. The DiskSim Simulation Environment Version2.0 Reference Manual. http://www.ece.cmu.edu/ ganger/disksim/.
GRIFFIN, J., SCHINDLER, J., SCHLOSSER, S., BUCY, J., AND GANGER, G. 2002. Timing-Accurate storageemulation. In Proceedings of the Annual Conference on File and Storage Technology (FAST).
ACM Transactions on Storage, Vol. 2, No. 1, February 2006.
72 • S. Gurumurthi and A. Sivasubramaniam
GROCHOWSKI, E. 2004. Hitachi GST, San Jose Research Center. Private Correspondence.GROCHOWSKI, E. AND HALEM, R. 2003. Technological impact of magnetic hard disk drives on storage
systems. IBM Syst. J. 42, 2, 338–346.GURUMURTHI, S., SIVASUBRAMANIAM, A., KANDEMIR, M., AND FRANKE, H. 2003. DRPM: Dynamic speed
control for power management in server class disks. In Proceedings of the International Sympo-sium on Computer Architecture (ISCA), 169–179.
GURUMURTHI, S., SIVASUBRAMANIAM, A., AND NATARAJAN, V. 2005. Disk drive roadmap from the ther-mal perspective: A case for dynamic thermal management. Tech. Rep. CSE-05-001, The Penn-sylvania State University.
HARRIS, E., DEPP, S., PENCE, W., KIRKPATRICK, S., JAYANTHA, M. S., AND TROUTMAN, R. 1995. Technologydirections for portable computers. In Proceedings of the IEEE 83, 4 (April), 636–658.
HERBST, G. 1997. IBM’s drive temperature indicator processor (Drive-TIP) helps ensure highdrive reliability. In IBM Whitepaper.
HETZLER, S. 2004. IBM Almaden Research Center. Private Correspondence.Hitachi Global Storage Technologies—HDD Technology Overview Charts. Hitachi Global Stor-
age Technologies—HDD Technology Overview Charts. http://www.hitachigst.com/hdd/technolo/overview/storagetechchart.html. 2006a.
Hitachi Global Storage Technologies—Research and Technology Overview. Hitachi Global Stor-age Technologies—Research and Technology Overview. http://www.hitachigst.com/hdd/research/storage/pm/. 2006b.
Hitachi Power and Acoustic Management—Quietly Cool 2004. Hitachi Power and AcousticManagement—Quietly Cool. In Hitachi Whitepaper. http://www.hitachigst.com/tech/techlib.nsf/productfamilies/White Papers.
HO, H. 1997. Fast servo Bang-Bang seek control. IEEE Trans. Magnetics 33, 6 (Nov.), 4522–4527.HONG, I. AND POTKONJAK, M. 1996. Power optimization in disk-based real-time application specific
systems. In Proceedings of the International Conference on Computer-Aided Design (ICCAD),634–637.
HP NEWS RELEASE. 2003. HP announces “smart” cooling solution for data centers. http://www.hp.com/hpinfo/newsroom/press/2003/030304b.html.
HU, Y. AND YANG, Q. 1996. DCD disk caching disk: A new approach for boosting I/O performance.In Proceedings of the International Symposium on Computer Architecture (ISCA), 169–178.
HUANG, R. AND CHUNG, D. 2002. Thermal design of a disk-array system. In Proceedings of theInterSociety Conference on Thermal and Thermomechanical Phenomena in Electronic Systems,106–112.
HUGHES, G. 2004. Center for Magnetic Recording Research, University of California, San Diego.Private Correspondence.
LEVY, H. AND LESSMAN, F. 1992. Finite Difference Equations. Dover Publications.MALLARY, M., TORABI, A., AND BENAKLI, M. 2002. One Terabit per square inch perpendicular record-
ing conceptual design. IEEE Trans. Magnetics 38, 4 (July), 1719–1724.OTTESEN, H. AND SMITH, G. 2001. Servo format for disk drive data storage devices. In United States
Patent 6,775,081.PATTERSON, D., GIBSON, G., AND KATZ, R. 1988. A case for redundant arrays of inexpensive disks
(RAID). In Proceedings of the ACM SIGMOD Conference on the Management of Data, 109–116.PATTERSON, R., GIBSON, G., GINTING, E., STODOLSKY, D., AND ZELENKA, J. 1995. Informed prefetching
and caching. In Proceedings of the ACM Symposium on Operating Systems Principles (SOSP),79–95.
REED, I. AND SOLOMON, G. 1960. Polynomial codes over certain finite fields. J. Soc. Indus. Appl.Math. 8, 300–304.
RIEDEL, E. 2004. Device trends—Where disk drives are headed. In Proceedings of the Informa-tion Storage Industy Consortium (INSIC) Workshop on the Future of Data Storage Devices andSystems (DS2).
RUEMMLER, C. AND WILKES, J. 1991. Disk shuffling. Tech. Rep. HPL-91-156, HP Laboratories.SCHIRLE, N. AND LIEU, D. 1996. History and trends in the development of motorized spindles for
hard disk drives. IEEE Trans. Magnetics 32, 3 (May), 1703–1708.Seagate Cheetah 15K.3 SCSI Disc Drive: ST3734553LW/LC Product Manual, vol. 1. http://www.
seagate.com/support/disc/manuals/scsi/100148123b.pdf.
ACM Transactions on Storage, Vol. 2, No. 1, February 2006.
Thermal Issues in Disk Drive Design: Challenges and Possible Solutions • 73
SKADRON, K., STAN, M., HUANG, W., VELUSAMY, S., SANKARANARAYANAN, K., AND TARJAN, D. 2003.Temperature-Aware microarchitecture. In Proceedings of the International Symposium on Com-puter Architecture (ISCA), 1–13.
SRI-JAYANTHA, M. 1995. Trends in mobile storage design. In Proceedings of the InternationalSymposium on Low Power Electronics, 54–57.
Storage Review—Reference Guide. http://storagereview.com/guide2000/ref/hdd/op/formIn25.html.TARNOPOLSKY, G. 2004. Hard disk drive capacity at high magnetic areal density. IEEE Trans.
Magnetics 40, 1 (Jan.), 301–306.UMass Trace Repository. http://traces.cs.umass.edu.VISWANATH, R., WAKHARKAR, V., WATWE, A., AND LEBONHEUR, V. 2000. Thermal performance chal-
lenges from silicon to systems. Intel Technol. J.VOßKAMPER, L., SCHMID, R., AND PELZ, G. 2000. Combining models of physical effects for describing
complex electromechanical devices. In Proceedings of the IEEE/ACM International Workshop onBehavioral Modeling and Simulation (BMAS), 42–45.
WOOD, R. 2000. The feasibility of magnetic recording at 1 Terabit per square inch. IEEE Trans.Magnetics 36, 1 (Jan.), 36–42.
WORTHINGTON, B., GANGER, G., PATT, Y., AND WILKES, J. 1995. On-Line extraction of SCSI disk driveparameters. In Proceedings of the ACM SIGMETRICS Conference on Measurement and Modelingof Computer Systems, 146–156.
ZEDLEWSKI, J., SOBTI, S., GARG, N., ZHENG, F., KRISHNAMURTHY, A., AND WANG, R. 2003. Modeling hard-disk power consumption. In Proceedings of the Annual Conference on File and Storage Technology(FAST ).
Received July 2005; revised October 2005; accepted October 2005
ACM Transactions on Storage, Vol. 2, No. 1, February 2006.