Embed Size (px)
Citation preview

Thermal Maturation of the Eastern Anadarko Basin, Oklahoma
U.S. GEOLOGICAL SURVEY BULLETIN 1866-C

AVAILABILITY OF BOOKS AND MAPS OF THE U.S. GEOLOGICAL SURVEY
Instructions on ordering publications of the U.S. Geological Survey, along with prices of the last offerings, are given in the cur rent-year issues of the monthly catalog "New Publications of the U.S. Geological Survey." Prices of available U.S. Geological Sur vey publications released prior to the current year are listed in the most recent annual "Price and Availability List." Publications that are listed in various U.S. Geological Survey catalogs (see back inside cover) but not listed in the most recent annual "Price and Availability List" are no longer available.
Prices of reports released to the open files are given in the listing "U.S. Geological Survey Open-File Reports," updated month ly, which is for sale in microfiche from the U.S. Geological Survey, Books and Open-File Reports Section, Federal Center, Box 25425, Denver, CO 80225. Reports released through the NTIS may be obtained by writing to the National Technical Information Service, U.S. Department of Commerce, Springfield, VA 22161; please include NTIS report number with inquiry.
Order U.S. Geological Survey publications by mail or over the counter from the offices given below.
BY MAIL
Books
Professional Papers, Bulletins, Water-Supply Papers, Techniques of Water-Resources Investigations, Circulars, publications of general in terest (such as leaflets, pamphlets, booklets), single copies of Earthquakes & Volcanoes, Preliminary Determination of Epicenters, and some mis cellaneous reports, including some of the foregoing series that have gone out of print at the Superintendent of Documents, are obtainable by mail from
U.S. Geological Survey, Books and Open-File ReportsFederal Center, Box 25425
Denver, CO 80225
Subscriptions to periodicals (Earthquakes & Volcanoes and Preliminary Determination of Epicenters) can be obtained ONLY from the
Superintendent of DocumentsGovernment Printing Office
Washington, D.C. 20402
(Check or money order must be payable to Superintendent of Docu ments.)
Maps
For maps, address mail orders to
U.S. Geological Survey, Map DistributionFederal Center, Box 25286
Denver, CO 80225
Residents of Alaska may order maps from
Alaska Distribution Section, U.S. Geological Survey,New Federal Building - Box 12
101 Twelfth Ave., Fairbanks, AK 99701
OVER THE COUNTER
Books
Books of the U.S. Geological Survey are available over the counter at the following Geological Survey Public Inquiries Offices, all of which are authorized agents of the Superintendent of Documents:
WASHINGTON, D.C.-Main Interior Bldg., 2600 corridor,18th and CSts.,NW.DENVER, Colorado-Federal Bldg., Rm. 169,1961 Stout St.LOS ANGELES, California-Federal Eldg., Rm. 7638,300 N.Los Angeles St.MENLO PARK, California-Bldg. 3 (Stop 533), Rm. 3128,345MiddlefieldRd.RESTON, Virginia-503 National Center, Rm. 1C402,12201Sunrise Valley Dr.SALT LAKE CITY, Utah-Federal Bldg., Rm. 8105,125South State St.SAN FRANCISCO, California-Customhouse, Rm. 504,555Battery St.SPOKANE, Washington-U.S. Courthouse, Rm. 678, West920 Riverside Ave..ANCHORAGE, Alaska-Rm. 101, 4230 University Dr.ANCHORAGE, Alaska-Federal Bldg, Rm. E-146, 701 C St.
MapsMaps may be purchased over the counter at the U.S. Geologi
cal Survey offices where books are sold (all addresses in above list) and at the following Geological Survey offices:
ROLLA, Missouri-1400 Independence Rd. DENVER, Colorado-Map Distribution, Bldg. 810, Federal
Center FAIRBANKS, Alaska-New Federal Bldg., 101 Twelfth Ave.
Chapter C
Thermal Maturation of the Eastern Anadarko Basin, Oklahoma
By MARK J. PAWLEWICZ
A multidisciplinary approach to research studies of sedimentary rocks and their constituents and the evolution of sedimentary basins, both ancient and modern
U.S. GEOLOGICAL SURVEY BULLETIN 1866
EVOLUTION OF SEDIMENTARY BASINS ANADARKO BASIN

DEPARTMENT OF THE INTERIOR
MANUEL LUJAN, JR., Secretary
U.S. GEOLOGICAL SURVEY
Dallas L Peck, Director
Any use of trade, product, or firm names in this publication is for descriptive purposes only and does not imply endorsement by the U.S. Government.
UNITED STATES GOVERNMENT PRINTING OFFICE: 1989
For sale by theBooks and Open-File Reports SectionU.S. Geological SurveyFederal CenterBox 25425Denver, CO 80225
Library of Congress Cataloging-in-Publication Data
Pawlewicz, M. J.Thermal maturation of the eastern Anadarko Basin, Oklahoma / by Mark J.
Pawlewicz.
p. cm. (Evolution of sedimentary basins Anadarko Basin ; ch. C) (U.S. Geological Survey bulletin ; 1866-C)
Bibliography: p. Supt. of Docs, no.: I 19.3: 1988-C1. Earth temperature Anadarko Basin Measurement.2. Geology Anadarko Basin. 3. Petroleum Geology Anadarko
Basin. 4. Anadarko Basin. I. Title. II. Series. III. Series: U.S. Geological Survey bulletin ; 1866-C. QE75.B9 no. 1866-C [QE509]557.3 s-dc20 89-600156 [551.1'4'09766] CIP

CONTENTSAbstract Cl Introduction Cl Methods C2 Regression analysis C3 Discussion C5 Burial history C7
Reflectance and temperature C8 Conclusions C9 References cited C12
FIGURES
1. Map showing location of Anadarko basin and line of well profile Cl2. Semilogarithmic plots of vitrinite reflectance versus depth for this and other
studies C3 3-5. Burial history reconstruction for:
3. No. 1 Atchison well at northern end of well profile C84. No. 1 Petree Ranch well near middle of well profile C95. No. 51-11 Weller well near southern end of well
profile CIO6. Cross section along well profile showing isoreflectance lines at 0.6 and 1.3
percent Rm Cll
TABLES
1. Location of boreholes used in study C22. Vitrinite reflectance, depth, reflectance statistics, and temperature for samples
from wells in this study C43. Geothermal gradients for selected wells in study area C6
Contents III
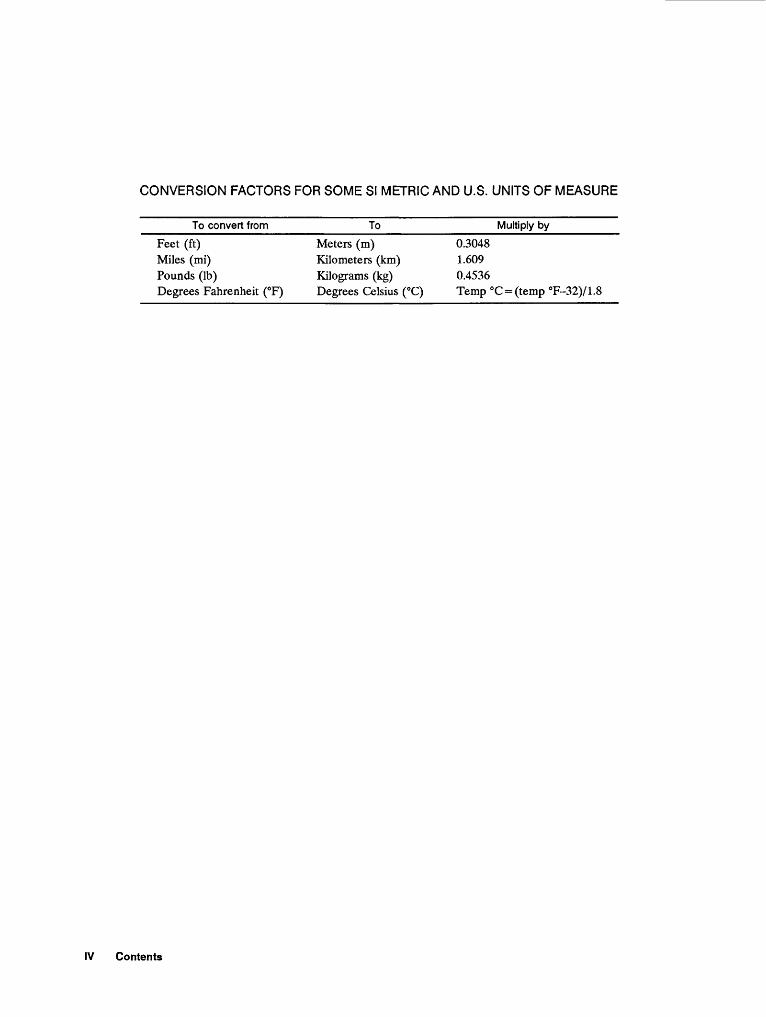
CONVERSION FACTORS FOR SOME SI METRIC AND U.S. UNITS OF MEASURE
To convert from To Multiply by
Feet (ft) Meters (m) 0.3048Miles (mi) Kilometers (km) 1.609Pounds (Ib) Kilograms (kg) 0.4536Degrees Fahrenheit (°F) Degrees Celsius (°C) Temp °C = (temp °F-32)/1.8
IV Contents

EVOLUTION OF SEDIMENTARY BASINS-ANADARKO BASIN
Thermal Maturation of theEastern Anadarko Basin, Oklahoma
By Mark J. Pawlewicz
Abstract
Vitrinite reflectance (Rm) measurements on samples from wells along a line extending for 125 mi (200 km) from the northern shelf area of the Anadarko basin near the Kansas State line south to the deep part of the basin show that the level of thermal maturity of sedimentary organic matter in the samples was set after maximum burial.
Burial history reconstruction curves show the tectonic evolution of this area: minimal subsidence occurred in the northern part of the basin in the Early Paleozoic, and moderate to rapid subsidence occurred throughout most of the remaining part of the basin from the Middle Ordovician to Permian. Temperatures determined from reflectance values are high as compared to those generally accepted for the onset of hydrocarbon generation and also to those obtained from other similar studies in the basin. Regression analysis yields a reflectance gradient of 0.109 percent Rm/1,000 ft (300 m) along the profile. Isoreflectance lines show the depth to the 0.6- and 1.3-percent Rm levels, the window of oil generation. The isoreflectance lines can be used to estimate the level of thermal maturity above or below them.
INTRODUCTION
The Anadarko basin (fig. 1) in west-central Oklahoma contains the thickest section of Paleozoic sedimentary rocks on the North American craton; more than 36,000 ft (11 km) of sediments accumulated in the deepest parts of the basin (Garner and Turcotte, 1984). The basin is bounded on the east by the Nemaha uplift, on the north and west by shelf areas, and on the south by the Amarillo-Wichita uplift (Evans, 1979).
In the Precambrian, what is now the southern Oklahoma region was rifted to form the southern Oklahoma aulacogen (Hoffman and others, 1974). In the Early Cambrian, the area was faulted and igneous rocks emplaced; igneous activity ended in the Middle Cam-
37e101 C 99° 97°
36°
35° IGENERALIZED OUTLINE
OF ANADARKO BASIN
I_______I_____
0
10 50
50 100 MILES 1 1
1 100 KILOMETERS
Manuscript approved for publication May 18, 1989.
Figure 1. Location of Anadarko basin and line of well profile (A-A 1). Well data given in table 1. Modified from Adkison (1960).
brian. The Anadarko basin was formed during an oro- genic breakup of the aulacogen in the Pennsylvanian (Webster, 1980). The Late Mississippian through Early Pennsylvanian was marked by a renewed phase of accelerated subsidence and by narrowing of the depositional trough in the Anadarko basin (Garner and Turcotte, 1984). Detailed discussions of the depositional history of the basin are presented by Huffman (1959) and Adler (1971).
In the present study, I investigated the paleogeo- thermal history of the eastern part of the Anadarko basin by measuring vitrinite reflectance of samples from a series of wells (fig. 1, table 1). Two additional data sets
Thermal Maturation of the Eastern Anadarko Basin, Oklahoma C1
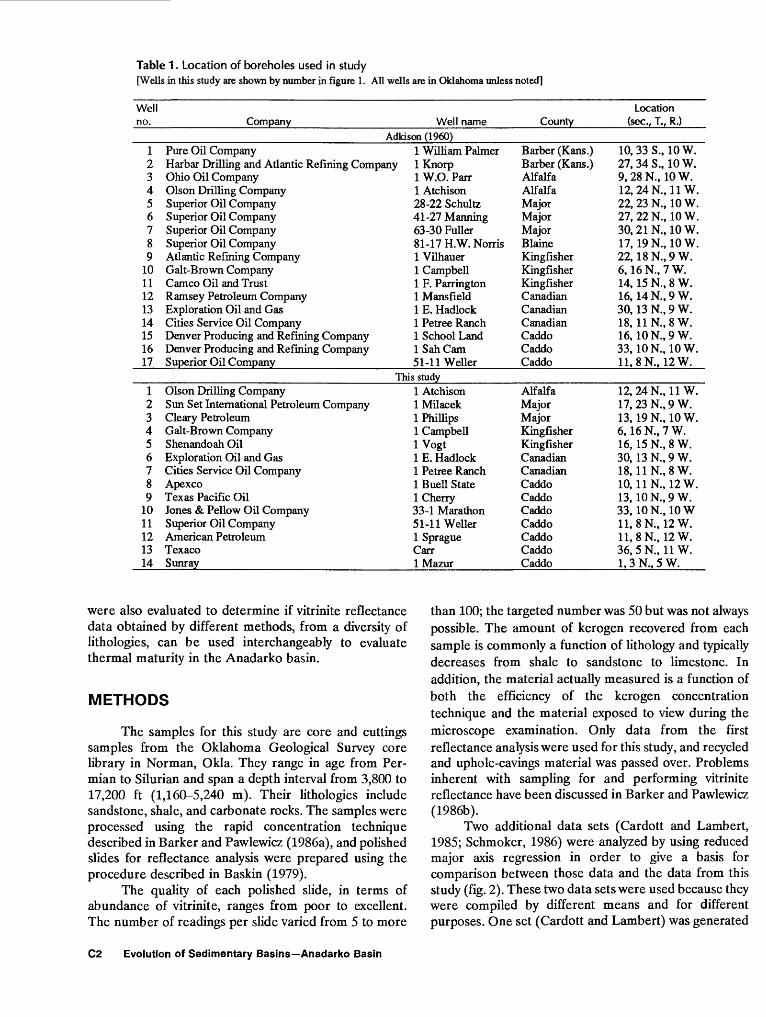
Table 1 . Location of boreholes used in study[Wells in this study are shown by number in figure 1. All wells are in Oklahoma unless noted]
Wellno. Company Well name County
Location(sec., T., R.)
Adkison (1960)1 Pure Oil Company 1 William Palmer2 Harbar Drilling and Atlantic Refining Company 1 Knorp3 Ohio Oil Company4 Olson Drilling Company5 Superior Oil Company6 Superior Oil Company7 Superior Oil Company8 Superior Oil Company9 Atlantic Refining Company
10 Gait-Brown Company11 Cameo Oil and Trust12 Ramsey Petroleum Company13 Exploration Oil and Gas14 Cities Service Oil Company15 Denver Producing and Refining Company16 Denver Producing and Refining Company17 Superior Oil Company
1 W.O. Parr1 Atchison28-22 Schultz41-27 Manning63-30 Fuller81-17 H.W. Norris1 Vilhauer1 Campbell1 F. Parrington1 Mansfield1 E. Hadlock1 Petree Ranch1 School LandISahCam51-llWeller
Barber (Kans.)Barber (Kans.)AlfalfaAlfalfaMajorMajorMajorBlaineKingfisherKingfisherKingfisherCanadianCanadianCanadianCaddoCaddoCaddo
10,338., 10W.27,348., 10W.9,28N., 10 W.12, 24 N., 11 W.22, 23 N., 10W.27, 22 N., 10W.30, 2 IN., 10 W.17, 19 N., 10 W.22, 18N..9W.6, 16 N., 7 W.14, 15 N., 8 W.16, 14N..9W.30, 13 N., 9 W.18, 11N..8W.16, ION., 9 W.33, ION., 10W.11.8N., 12 W.
This study1 Olson Drilling Company2 Sun Set International Petroleum Company3 Cleary Petroleum4 Gait-Brown Company5 Shenandoah Oil6 Exploration Oil and Gas7 Cities Service Oil Company8 Apexco9 Texas Pacific Oil
10 Jones & Pellow Oil Company1 1 Superior Oil Company12 American Petroleum13 Texaco14 Sunray
1 Atchison1 Milacek1 Phillips1 CampbellIVogt1 E. Hadlock1 Petree Ranch1 Buell State1 Cherry33-1 Marathon51-llWeller1 SpragueCarr1 Mazur
AlfalfaMajorMajorKingfisherKingfisherCanadianCanadianCaddoCaddoCaddoCaddoCaddoCaddoCaddo
12, 24 N., 11 W.17, 23 N., 9 W.13, 19 N., 10 W.6, 16 N., 7 W.16, 15 N., 8 W.30, 13 N., 9 W.18, 11N..8W.10, 11 N., 12 W.13, ION., 9 W.33, ION., 10W11.8N., 12 W.11.8N., 12 W.36, 5 R, 11 W.1, 3 N., 5 W.
were also evaluated to determine if vitrinite reflectance data obtained by different methods, from a diversity of lithologies, can be used interchangeably to evaluate thermal maturity in the Anadarko basin.
METHODS
The samples for this study are core and cuttings samples from the Oklahoma Geological Survey core library in Norman, Okla. They range in age from Per mian to Silurian and span a depth interval from 3,800 to 17,200 ft (1,160-5,240 m). Their lithologies include sandstone, shale, and carbonate rocks. The samples were processed using the rapid concentration technique described in Barker and Pawlewicz (1986a), and polished slides for reflectance analysis were prepared using the procedure described in Baskin (1979).
The quality of each polished slide, in terms of abundance of vitrinite, ranges from poor to excellent. The number of readings per slide varied from 5 to more
than 100; the targeted number was 50 but was not always possible. The amount of kerogen recovered from each sample is commonly a function of lithology and typically decreases from shale to sandstone to limestone. In addition, the material actually measured is a function of both the efficiency of the kerogen concentration technique and the material exposed to view during the microscope examination. Only data from the first reflectance analysis were used for this study, and recycled and uphole-cavings material was passed over. Problems inherent with sampling for and performing vitrinite reflectance have been discussed in Barker and Pawlewicz (1986b).
Two additional data sets (Cardott and Lambert, 1985; Schmoker, 1986) were analyzed by using reduced major axis regression in order to give a basis for comparison between those data and the data from this study (fig. 2). These two data sets were used because they were compiled by different means and for different purposes. One set (Cardott and Lambert) was generated
C2 Evolution of Sedimentary Basins Anadarko Basin

0.1
5,000
10,000
: i5,ooo
20.000
25,000
30,000 L-
VITRINITE REFLECTANCE, IN PERCENT
1 10
Q
VITRINITE REFLECTANCE, IN PERCENT
1 10
30,000 i-
B
5,000 -
10,000 -
~ 15,000
20,000 -
25,000
30,000 L-
VITRINITE REFLECTANCE, IN PERCENTD
0.1
5.000
10,000
: 15,000
20,000
25,000
30.000 L
VITRINITE REFLECTANCE, IN PERCENT
1 10
Figure 2. Semilogarithmic plots of vitrinite reflectance (Rm) versus depth. A, This study; B, Schmoker (1986); C, Cardott and Lambert (1985); D, Data sets A, B, and C, combined.
by a single operator from samples from a single lithologic unit, the Woodford Shale, and the other set (Schmoker) was compiled from the literature and represents the work of several individuals. The differences between the data form the basis for not only a one-to-one comparison but also for an evaluation as to the applicability of the data in evaluating thermal maturation in the basin.
REGRESSION ANALYSIS
Regression analysis allows quantification of a relationship between a pair of variables such that other values can be interpolated or extrapolated. The reduced major axis regression technique discussed in Till (1974) was used to analyze all three data sets. This technique
Thermal Maturation of the Eastern Anadarko Basin, Oklahoma C3

Table 2. Vitrinite reflectance, depth, reflectance statistics, temperature, and age for samples wells in this study
[Location of wells shown in figure 1; well data given in table 1. Rm, vitrinite reflectance; n, number of Rm readings; CT, standard deviation. Temperature calculated using surface temperature of 60 °F (15 °C) and geothermal gradient of 1.3 °F/100 ft. Time units are generalized because most samples are cuttings and knowledge of local stratigraphy is imprecise. Ages from Adkison (I960)]
Depth Well number and name (feet)
1. 1 Atchison 5,3606,7487,177
2. 1 Milacek 4,9955,8056,2056,7107,205
3. 1 Phillips 1,9052,4653,7654,2255,0725,112
4. 1 Campbell 4,1554,8005,4456,0076,8157,4837,883
5. 1 Vogt 6,3856,8157,4557,7558,2158,7059,1159,720
6. 1 E. Hadlock 8,8379,1009,5959,862
10,017
7. 1 Petree Ranch 7,6758,0758,9259,565
10,00510,70510,995
8. 1 Buell State* 13,831
9. 1 Cherry 9,21510,20510,80511,20511,705
Rm (percent)
1.021.021.22
.69
.66
.63
.80
.82
1.171.43
.93
.891.501.58
.781.29
.831.00
.76
.69
.94
.73
.82
.81
.80
.78
.76
.86
.72
.83
.70
.74
.971.06
.82
.84
.971.171.071.441.65
1.91
.94
.97
.871.04
.97
n
215
16
3651513737
295719273865
5214437815537
2551515151515151
3545555251
15533971716117
35
4561477551
a0.21
.12
.37
.08
.08
.09
.10
.13
.24
.21
.20
.21
.21
.19
.18
.16
.22
.19
.09
.10
.18
.09
.12
.11
.13
.08
.11
.10
.11
.11
.12
.07
.14
.12
.08
.13
.17
.17
.13
.21
.27
.17
.17
.20
.16
.09
.08
Temperatureop oc
130148154
125135141147154
8593
109115126127
115122130138148158163
143148158159167173178186
179178185189190
160165176185190199203
239
180193200206212
546468
5257616468
293443465253
46505459647073
6264707175788186
7981858788
71748085889395
115
83909397
100
AgePennsylvanian System; Missourian SeriesMississippian System; Lower Miss. SeriesOrdovician System
Pennsylvanian System; Virgilian SeriesPennsylvanian System; Missourian SeriesPennsylvanian System; Des Moinesian SeriesLower Mississippian SeriesOrdovician System
Permian SystemPermian SystemPermian SystemPennsylvanian SystemPennsylvanian SystemPennsylvanian System
Pennsylvanian System; Virgilian SeriesPennsylvanian System; Virgilian SeriesPennsylvanian System; Virgilian SeriesPennsylvanian System; Missourian SeriesPennsylvanian System; Missourian SeriesPennsylvanian System; Des Moinesian SeriesMississippian System; Upper Miss. Series
Pennsylvanian System; Virgilian SeriesPennsylvanian System; Virgilian SeriesPennsylvanian System; Missourian SeriesPennsylvanian System; Missourian SeriesPennsylvanian System; Missourian SeriesPennsylvanian System; Des Moinesian SeriesPennsylvanian System; Des Moinesian SeriesMississippian System; Upper Miss. Series
Pennsylvanian System; Missourian SeriesPennsylvanian System; Missourian SeriesPennsylvanianSystem; Des Moinesian SeriesPennsylvanian System; Des Moinesian SeriesMississippian System; Upper Miss. Series
Pennsylvanian System; Virgilian SeriesPennsylvanian System; Missourian SeriesPennsylvanian System; Missourian SeriesPennsylvanian System; Des Moinesian SeriesPennsylvanian System; Des Moinesian SeriesPennsylvania System; Atokan SeriesMississippian System; Upper Miss. Series
Pennsylvanian System; Atokan Series
Pennsylvanian System; Missourian SeriesPennsylvanian System; Missourian SeriesPennsylvanian System; Des Moinesian SeriesPennsylvanian System; Des Moinesian SeriesPennsylvanian System; Des Moinesian Series
C4 Evolution of Sedimentary Basins Anadarko Basin

Table 2. Continued
Depth Well number and name (feet)
10. 33-1 Marathon 8,1059,305
10,10510,305
11. 51-llWeller 7,7058,782
10,72711,47712,36214,00015,81716,47217,127
12. 1 Sprague 4,2055,8057,0658,5559,265
10,125
13. 1 Carr* 10,81411,46911,74712,15517,002
14. 1 Mazur 15,93516,09917,05517,217
Rm (percent)
0.90.83.86.99
.67
.71
.96
.861.131.632.072.032.20
.931.18
.89
.82
.90
.78
.981.041.061.041.77
1.711.421.191.73
n20379
21
6123114561555535
101
174140553135
3545294555
1115
10
a0.12
.14
.14
.16
.08
.11
.13
.13
.07
.22
.29
.25
.22
.15
.20
.18
.11
.16
.08
.11
.10
.10
.11
.19
None.14.25.31
Temperatureop oC
165181191194
160174200210221242266275282
114135152172181191
200210212219281
267269282140
74838890
71799399
105117130135139
465767788388
9399
100104138
131132139284
AgePennsylvanianSystem; VirgilianSeriesPennsylvania!! System; Virgilian SeriesPennsylvanian System; Virgilian SeriesPennsylvanian System; Virgilian Series
Pennsylvanian System; Virgilian SeriesPennsylvanian System; Missourian SeriesPennsylvanian System; Missourian SeriesPennsylvanian System; Des Moinesian SeriesPennsylvanian System; Des Moinesian SeriesPennsylvanian System; Atokan SeriesPennsylvanian System; Morrowan SeriesPennsylvanian System; Morrowan SeriesPennsylvanian System; Morrowan Series
Permian SystemPermian SystemPennsylvanian System; Virgilian SeriesPennsylvanian System; Missourian SeriesPennsylvanian System; Missourian SeriesPennsylvanian System; Missourian Series
Pennsylvanian SystemPennsylvanian SystemPennsylvanian SystemPennsylvanian System; Atokan SeriesOrdovician System
Silurian SystemSilurian SystemSilurian SystemSilurian System
*Core sample
makes allowances for (1) the lack of precise depth control inherent with cuttings samples, and (2) the lack of precision in reflectance (Rm) values that results from the use of the mean of a set of numbers having a relatively wide range. The more common least-squares analysis requires that one variable (either depth or Rm) be known with certainty.
Semilogarithmic plots of vitrinite reflectance versus depth for the three data sets are shown in figure 2. Data from the No. 1 Phillips well (table 2) were included in the regression curve for data set^l for comparison but were excluded from regression calculations because of unexplained high Rm values for samples from shallow depths. Data from the No. 1 Mazur well were included in the regression calculations even though the samples are of Ordovician-age rocks that predate the time of higher plants, the source of vitrinite. Reflectance values for these samples follow the regression trend closely.
Cardott and Lambert (1985) analyzed samples of Woodford Shale (Upper Devonian and Lower Mississippian) from four wells near those used for this study, and their data are plotted in figure 2C. These data
are within the trend of the data from this study and agree well with them, particularly in the 7,000- to 15,000-ft depth range. The same holds for data from Schmoker (1986) (fig. 2B), mostly because Schmoker included the data of Cardott and Lambert. For shallowest depths, the data of Schmoker differ significantly from those of the other two studies, most likely because of sample heterogeneity.
DISCUSSION
The data in my study differ in fundamental ways from those of Cardott and Lambert (1985) and Schmoker (1986), even though we were working toward a similar end to use vitrinite reflectance data to predict thermal maturation in the Anadarko basin. For instance, Cardott and Lambert demonstrated the degree of thermal maturation of the Woodford Shale across a wide area of the basin, whereas Schmoker used vitrinite reflectance to model the evolution of the "oil window" in the basin. Schmoker (1986) noted that "***a substantial
Thermal Maturation of the Eastern Anadarko Basin, Oklahoma C5

difference exists between a set of analytical measurements and a predictive thermal maturity model by which one can project beyond available data***." The aim of my study, therefore, was to make some generalizations about the use of each of the paleogeo- thermal models to predict thermal maturation in any part of the basin.
The most significant reasons for differences in the three data sets are (1) the microscopist, (2) the source of the samples, core or cuttings, (3) the lithologies from which samples were collected, and (4) the areal distribution of the samples. Cardott and Lambert (1985) performed their own analyses, whereas Schmoker compiled data from several sources. The samples for the present study are from profiles of cuttings and core samples from wells along a north-south line that extends 125 mi (200 km) from near the Kansas State line, or the shallow shelf area of the Anadarko basin, south to the deep part of the basin.
Although shales and other clastic lithologies can have a homogeneous organic content, they commonly contain several populations of organic material representing distinct levels of maturation. This diversity results from variations in the source and the material and from the recycling of material from previously deposited organic matter. It can cause large disparities in the mean reflectance value of a sample depending on the level of expertise of the microscopist and the calibration of the reflectance equipment.
Cardott and Lambert's study has several advantages: the samples are from one lithological unit, wide-spaced areally, and are from both the shallow and the deep part of the basin. These factors insure that the samples represent the various heating conditions purported to characterize the Anadarko basin. In contrast, Schmoker's data, which were collected from several studies by different workers (including Cardott and Lambert, 1985), are from widespread areas but
Table 3. Geothermal gradients for selected wells in study area[Gradients were calculated from bottom-hole temperatures and corrected using the method of Harrison and others (1982).Multiple gradient values are given where incremental bottom-hole measurements were taken during drilling]
CompanyAmerada Petroleum Company Carter Oil Company and Oklahoma Nat. Gas Stanolind Oil and Gas Superior Oil Company
Midstates Oil Company
Cities Service Oil Company Exploration Oil and Gas
Cameo Oil and Trust
Deardorf Oil Company
Mazda Oil Company L.B. Jackson Superior Oil Company L. J. HorwitzOlson Drilling Company Ashland Oil and Refining Ohio Oil Company
The Texas Company Sinclair Oil and Gas
Well nameMack Silverhom No. 1 L.L.HolsteadNo. 1 J.W. Chappelear No. 1 Cogdill33-18
Hennessey No. 1
Petree Ranch No. 1 Ethel Hadlock No. 1
Parrington No. 1
Gungoll No. 1
Batman No. 1 Manley No. 1 Schultz 28-22 Frech No. 1W.W. Morris No. 1 AlbrightNo. 1 W.O.ParrNo. 1
C.L. Maxwell No. 1 Hendrixson No. 1
Location (sec. T., R.)
24, 6 N., 13 W. 16.7N., 14 W. 8, 7 N., 15 W. 18, 8 N., 11 W.
9,9N., 11 W.
18, UN., 8 W. 30, 13 N., 9 W.
14, 15 N., 8 W.
11,20N.,8W.
13, 21 N., 11 W. 36, 22 N., 10W. 22, 23 N., 10W. 8.24N., 11 W.27, 25 N., 9 W. 31,27N.,7W. 9, 28 N., 10W.
18, 28 N., 12 W. 17, 29 N., 8 W.
Gradient (°F)Calc.1.23 1.07 1.16 1.05
.881.35
.43 1.011.001.02 1.04
.99
.951.231.05
.04 1.06
.93
.941.06 1.10
.95
.821.06 1.05 1.18 1.121.49 1.57
Corrected1.30 1.39 1.48 1.38 1.201.661.51 1.331.321.35 1.10 1.301.291.551.341.37 1.391.24 1.261.37 1.40 1.27 1.141.33 1.31 1.38 1.381.75 1.82
C6 Evolution of Sedimentary Basins Anadarko Basin

represent a minimum sampling density. In addition, the data were obtained from both core and cuttings samples from the deep and shallow parts of the basin.
Problems can occur if data from different tectonic provinces are combined to make a model of the heating of a basin. In the Anadarko basin, the heating events of the deep basin differ considerably from those of the shallow basin. The heating of the deep basin is believed to have occurred at two different times, during which the shelf area was relatively stable, and the basin has been cooling since Permian time (Garner and Turcotte, 1984). The shelf area was never buried deeply, and because high-heat events were confined to the greater depths, the thermal histories of the shelf and deep basin are completely different. Vitrinite reflectance data from two such environments cannot be combined to make a representative model for the basin. Geothermal gradients, as calculated from bottom-hole temperatures, are fairly consistent along the well profile (table 3) because of the stabilization through cooling of the gradients within the basin since Permian time, after the maximum reflectance (maturity) of the organic material was set by higher temperatures. Thus, higher temperatures from the deep basin modeling will over estimate temperatures predicted for the shallow part of the basin.
The vitrinite reflectance data for this study do not correlate with the temperatures derived from bottom- hole temperature data using the relation of Barker and Pawlewicz (1987). The oil window generally is considered to fall within the range of from 50-65 °C (120-150 °F) to 130-145 °C (265-295 °F), corresponding to vitrinite reflectance of between about 0.6 and 1.3 percent. In the well along the profile that has the largest depth range and best individual correlation (No. 51-11 Weller), the highest reflectance values are significantly higher than the oil window. Although temperatures only approach the theoretical oil-window limits, the reflectance data are well above the limits, in the range of 2.0 percent (table 2). The deeper part of the well probably was subjected to higher temperatures that have since decreased. This pattern can also be observed in the No. 1 Petree Ranch and No. 1 Carr wells.
The present-day geothermal gradient for the region of the well profile is about 1.3 °F/100 ft (24 °C/km) (Harrison and Luza, 1986), similar to the gradient of 1.2 °F/100 ft used by Pusey (1973). Twenty-nine bottom-hole temperature data, from eighteen wells parallel with the well profile, are in partial agreement with this gradient if the temperature correction scheme of Harrison and others (1982) is applied to these data (table 3). The original calculated gradients are low, generally 1.0-1.2 °F/100 ft, but if the correction is applied, the gradients are close to or exceed 1.3 °F/100 ft. There is no foolproof
way of correcting bottom-hole temperature data, however, because there is never the assurance that temperatures were collected under equilibrium conditions. Thus, the temperatures for table 2 were figured using a geothermal gradient of 1.3 °F/100 ft and a surface temperature of 60 °F (15 °C).
The data set from this study fared well when its correlation coefficient, 0.76, was compared with those for the other two data sets, 0.90 (Cardott and Lambert, 1985) and 0.92 (Schmoker 1986). Although the correlation coefficient is not the definitive test of data, it conveys the information that internally the analyses are consistent and agree well. The correlation coefficient for this study of 0.76 is not bad; it indicates that the data have scatter but are still consistent and that a strong correlation between depth and reflectance is maintained.
BURIAL HISTORY
Burial history provides a useful way to view an idealized reconstruction of the depositional and tectonic history of an area. Three burial history curves (figs. 3-5) were constructed along the well profile (formation tops from Adkison, 1960). Figure 3, for the shallow shelf area of the basin, shows the relatively shallow subsidence for the shelf area during the middle Paleozoic, and figures 4 and 5 illustrate the rapid subsidence during the late Paleozoic for the deeper part of the basin. On all three curves, the amount of subsidence from the Pennsylvanian to Tertiary and the amount of subsequent uplift are estimated.
It is widely held that a regression line drawn upward to intercept a vertical line drawn from 0.2 percent Rm on a semilogarithmic plot will approximate the amount of sediment removed by erosion. Calculations based on a model of vitrinite reflectance from worldwide sources (Waples, 1980) suggest that about 3,900 ft (1.2 km) of sediments were removed basinwide, whereas calculations based on age spectra from microcline-bearing clasts (Harrison and others, 1987) suggest that about 6,550 ft (2 km) of sediments were removed in the southwestern part of the basin. A calculation by Schmoker (1986) suggests that about 2,600 ft (790 m) of erosion occurred, whereas the regression line shown in figure 2 indicates 3,200 ft (975 m) of erosion.
I believe that reflectance data from two areas as diverse as a continuously subsiding deep basin and a stable shelf cannot be combined to make an average value to estimate the amount of erosion. To illustrate, the reflectance data from three groups of three wells each along the the well profile, representing the shallow, intermediate and deep basin, were analyzed using reduced major axis regression. The No. 1 Atchison, No. 1
Thermal Maturation of the Eastern Anadarko Basin, Oklahoma C7

0
I,000
2,000
3,000
4,000
5,000
6,000
7,000
8,000
9,000
10,000
II,000
Woodford Shale Sylvan Shale
Viola Limestone'0' Simpson -^
PermianPennsylvanianChesterianMeramecianOsageanKinderhookian
500 400 300 200 100TIME, IN Ma
Figure 3. Burial history reconstruction for the No. 1 Atchison well at the northern end of the well profile. The burial history from the Pennsylvanian to the present is estimated. Location information for well given in table 1. Formation tops from Adkison and Sheldon (1963).
Milacek, and No. 1 Campbell make up the shallow group of wells; the No. 1 Hadlock, No. 1 Petree Ranch, and No. 1 Cherry the intermediate group; and the No. 51-11 Weller, No. 1 Sprague, and No. 1 Carr the deep group. Results of regression analysis of the first two groups were poor because of data scatter, and a 0.2-percent reflectance intercept line through the two data groups was inconclusive. Results of regression analysis of the third group were good (r = 0.81) and suggest about 8,000 ft (2.5 km) of erosion. This amount is hardly applicable to the thin shelf area because it is equal to or greater than the total sediment thickness in the areas of the first two groups. An average value would be similarly useless. Data collected in the method of Schmoker that is, from a limited sample set from widely spaced locales are also not amenable to such calculations. In contrast, the equations of Cardott and Lambert would be valid for an estimation of thermal maturity, at least for the Woodford Shale, because of the internal consistency of both the sampling and the analyses. I believe that an estimation of the amount of erosion cannot be approached from a regional basis without a vast amount of data but, rather, must be approached on a local basis, using several (2-10, depending on the area size) well profiles from locales having a similar tectonic history.
Reflectance and Temperature
Maturation of organic material is widely believed to be a function of time and temperature (Lopatin, 1971; Waples, 1980). The evaluation of the thermal history of the Anadarko basin by Schmoker (1986) used the work of Lopatin (1971), which suggests that both time and temperature have an affect on the maturation of the organic material. If this assumption is true, then almost the entire Permian section should be within the oil window if the temperature and time since the Paleozoic are considered.
In contrast, Barker and Pawlewicz (1986b) showed that time has much less of an effect on the rank of organic material than indicated by Lopatin (1971). Isoreflectance lines and formation boundaries along the line of the well profile are shown in figure 6. The isoreflectance lines were drawn from points connecting depths calculated for several wells (wells 2,5, 7, and 10 of Adkison, table 1) by using the reduced major axis regression method. That the isoreflectance lines cross formation boundaries at an angle is evidence for maturation being a function of increased temperatures resulting from burial or renewed heating after subsidence stopped. Maturation probably was occurring during deformation but at a slower rate.
C8 Evolution of Sedimentary Basins Anadarko Basin

0
I.000
2,000
3,000
4,000
5,000
6,000
H 7,000LU LU
2 8,000l~
t 9,000LUQ
10,000
II,000
12,000
13,000
14,000
15,000
TIME. IN Ma
Atokan
400 300 200 TIME, IN Ma
100
Figure 4. Burial history reconstruction for the No. 1 Petree Ranch well near the middle of well profile. The burial history from the Pennsylvanian to the present is estimated. Location information for well given in table 1. Formation tops from Adkison and Sheldon (1963).
CONCLUSIONS1. Internal consistency in both sample collection
and analysis and sufficient samples are required to adequately represent the area under investigation. A single microscopist (for the purpose of vitrinite reflectance) and samples from a single lithology will usually improve the data and allow more accurate prediction of thermal maturity.
2. Rank measurements show that along the eastern side of the Anadarko basin on the shelf the maturation of sediments resulted primarily from depth of burial; however, south of the shelf area in the deeper part of the basin, sediments were affected by an early high- heat event.
3. Reflectance values computed using the present- day geothermal gradient are at least 50-70 percent higher than expected relative to the generally accepted oil window values. Temperatures most likely were higher in the early Paleozoic and then decreased.
4. Isoreflectance lines show the depth to the limits of the oil window and can be used to predict occurrences of hydrocarbons.
5. Amounts of erosion cannot be predicted by combining data from two tectonic provinces as radically different as the shelf and deep basin areas in the Ana darko basin.
Thermal Maturation of the Eastern Anadarko Basin, Oklahoma C9

2.000
4.000
6.000
10.000
12,000
14,000
16,000
18.000
20.000400 300 200
TIME. IN Ma100
Figures. Burial history reconstruction for the No. 51-11 Wellerwell near the southern end of the well profile. The burial history from the Pennsylvanian to the present is estimated. Location information for well given in table 1. Formation tops from Adkison and Sheldon (1963).
C10 Evolution of Sedimentary Basins Anadarko Basin

SOUTHA'17 16 15 14 13 12 11 10
NORTH
A3 2 1
500
1,000
1,500
COtr.LU
2,000
2 2,500
LUQ
3,000
3,500
4,000
4,500
Permian
10 20 MILES
10 20 KILOMETERS
SEA LEVEL
1,000
2,000
3,000
4,000
5,000
6,000
7,000 t-LU LL
8,000 I0. LLJ
9,000 Q
10,000
11,000
12,000
13,000
14,000
15,000
Figure 6. Cross section along well profile showing isoreflectance lines (heavy) at 0.6 and 1.3 percent Rm. I so reflectance lines were drawn on points calculated by reduced major axis regression for several wells along profile (wells 2,5, 7, and 10of Adkison; table 1). See text for explanation. Numbers along top correspond to wells of Adkison listed in table 1. Wavy line indicates unconformity; long-dashed line indicates boundary uncertain.
Thermal Maturation of the Eastern Anadarko Basin, Oklahoma C11

REFERENCES CITED
Adkison, W.L., 1960, Subsurface cross section of Paleozoic rocks from Barber County, Kansas, to Caddo County, Oklahoma: U.S. Geological Survey Oil and Gas Investigations Chart OC-61, 2 sheets.
Adkison, W.L., and Sheldon, M.G., 1963, Sample descriptions and correlations for wells on a cross section from Barber County, Kansas, to Caddo County, Oklahoma: Oklahoma Geological Survey Guide Book 13, 139 p.
Adler, F.J., 1971, Anadarko Basin and central Oklahoma area, in Future petroleum provinces of the United States Their geology and potential: American Association of Petroleum Geologists Memoir 15, p. 1061-1069.
Barker, C.E., and Pawlewicz, M.J., 1986a, Concentration of dispersed sedimentary organic matter for vitrinite reflectance analysis using a simple crush and float method: Society for Organic Petrology Newsletter, v. 3, no. 3, p. 3.
____ 1986b, The correlation of vitrinite reflectance with maximum temperature in humic organic matter, in Bun- tebarth, G., and Stegena, L., eds., Paleogeothermics; Lecture notes in earth sciences, v. 5: Berlin, Springer- Verlag, p. 79-93.
Baskin, D.K., 1979, A method of preparing phytoclasts for vitrinite reflectance analysis: Journal of Sedimentary Petrology, v. 49, p. 633-635.
Cardott, B.J., and Lambert, M.W., 1985, Thermal maturation by vitrinite reflectance of Woodford Shale, Anadarko basin, Oklahoma: American Association of Petroleum Geologists Bulletin., v. 69, no. 11, p. 1982-1998.
Evans, J.L., 1979, Major structural and stratigraphic features of the Anadarko Basin, in Hyne, NJ., ed., Pennsylvanian sandstones of the mid continent: Tulsa Geological Society Special Paper 1, p. 97-114.
Garner, D.L., and Turcotte, D.L., 1984, The thermal and mechanical evolution of the Anadarko Basin: Tectono- physics, v. 107, p. 1-24.
Harrison, T.M., Heizler, M.T., and Burke, K., 1987, Aspects of thermal evolution of Anadarko Basin, Oklahoma:
American Association of Petroleum Geologists Bulletin, Abstracts with Program, v. 71, no. 5, p. 565.
Harrison, W.E., and Luza, K.V., 1986, Temperature gradient information for several boreholes drilled in Oklahoma: Oklahoma Geological Survey Special Publication 86-2, 42 p.
Harrison, W.E., Luza, K.V., Prater, M.L., and Cheung, P.K., 1982, Geothermal resource assessment in Oklahoma, in Ruscetta, C.A., ed., Geothermal direct heat program roundup technical conference proceedings, v. 1: Salt Lake City, University of Utah Earth Science Laboratory, p. 187-204.
Hoffman, P., Dewey, J.F., and Burke, K., 1974, Aulacogens and genetic relation to geosynclines with a Proterozoic example from Great Slave Lake, Canada, in Dott, R.H., Jr., and Shower, R.H., eds., Modern and ancient geosyn- clinal sedimentation: Society of Economic Paleontologists and Mineralogists Special Publication 19, p. 38-55.
Huffman, G.G., 1959, Pre-Desmoinesian isopachous and paleo- geologic studies in central and mid-continent region: American Association of Petroleum Geologists Bulletin, v. 43, no. 11, p. 2541-2575.
Lopatin, N.V., 1971, Temperature and geologic time as factors in coalification: Akademiya Nauk SSSR Izvestiya Seriya Geologicheskaya, no. 3, p. 95-106.
Pusey, W.C., 1973, The ESR-kerogen method; a new technique of estimating maturity of sedimentary rocks: Petroleum Times, January 12, 1973, p. 21-25.
Schmoker, J.W., 1986, Oil generation in the Anadarko Basin, Oklahoma and Texas; modeling using Lopatin's method: Oklahoma Geological Survey Special Publication 86-3, 40 p.
Till, R., 1974, Statistical methods for earth scientists; an introduction: London, Macmillan Press, 154 p.
Waples, D.W., 1980, Time and temperature in petroleum formation; application of Lopatin's method in petroleum exploration: American Association of Petroleum Geologists Bulletin, v. 64, no. 6, p. 916-926.
Webster, R.E., 1980, Evolution of the southern Oklahoma aulacogen: Oil and Gas Journal, v. 78, no. 7, p. 150-172.
*U.SGPO:1990 773-047/06032
C12 Evolution of Sedimentary Basins Anadarko Basin

SELECTED SERIES OF U.S. GEOLOGICAL SURVEY PUBLICATIONS
Periodicals
Earthquakes & Volcanoes (issued bimonthly). Preliminary Determination of Epicenters (issued monthly).
Technical Books and Reports
Professional Papers are mainly comprehensive scientific reports of wide and lasting interest and importance to professional scientists and en gineers. Included are reports on the results of resource studies and of topographic, hydrologic, and geologic investigations. They also include collections of related papers addressing different aspects of a single scien tific topic.
Bulletins contain significant data and interpretations that are of last ing scientific interest but are generally more limited in scope or geographic coverage than Professional Papers. They include the results of resource studies and of geologic and topographic investigations; as well as collections of short papers related to a specific topic.
Water-Supply Papers are comprehensive reports that present sig nificant interpretive results of hydrologic investigations of wide interest to professional geologists, hydrologists, and engineers. The series covers investigations in all phases of hydrology, including hydrogeology, availability of water, quality of water, and use of water.
Circulars present administrative information or important scientific information of wide popular interest in a format designed for distribution at no cost to the public. Information is usually of short-term interest.
Water-Resources Investigations Reports are papers of an interpre tive nature made available to the public outside the formal USGS publi cations series. Copies are reproduced on request unlike formal USGS publications, and they are also available for public inspection at depositories indicated in USGS catalogs.
Open-File Reports include unpublished manuscript reports, maps, and other material that are made available for public consultation at depositories. They are a nonpermanent form of publication that may be cited in other publications as sources of information.
Maps
Geologic Quadrangle Maps are multicolor geologic maps on topographic bases in 71/2- or 15-minute quadrangle formats (scales main ly 1:24,000 or 1:62,500) showing bedrock, surficial, or engineering geol ogy. Maps generally include brief texts; some maps include structure and columnar sections only.
Geophysical Investigations Maps are on topographic or planimetric bases at various scales; they show results of surveys using geophysical techniques, such as gravity, magnetic, seismic, or radioactivity, which reflect subsurface structures that are of economic or geologic significance. Many maps include correlations with the geology.
Miscellaneous Investigations Series Maps are on planimetric or topographic bases of regular and irregular areas at various scales; they present a wide variety of format and subject matter. The series also in cludes 71 /2-minute quadrangle photogeologic maps on planimetric bases which show geology as interpreted from aerial photographs. Series also includes maps of Mars and the Moon.
Coal Investigations Maps are geologic maps on topographic or planimetric bases at various scales showing bedrock or surficial geol ogy, stratigraphy, and structural relations in certain coal-resource areas.
Oil and Gas Investigations Charts show stratigraphic information for certain oil and gas fields and other areas having petroleum potential.
Miscellaneous Field Studies Maps are multicolor or black-and- white maps on topographic or planimetric bases on quadrangle or ir regular areas at various scales. Pre-1971 maps show bedrock geology in relation to specific mining or mineral-deposit problems; post-1971 maps are primarily black-and-white maps on various subjects such as environmental studies or wilderness mineral investigations.
Hydrologic Investigations Atlases are multicolored or black-and- white maps on topographic or planimetric bases presenting a wide range of geo hydro logic data of both regular and irregular areas; principal scale is 1:24,000 and regional studies are at 1:25 0,000 scale or smaller.
Catalogs
Permanent catalogs, as well as some others, giving comprehen sive listings of U.S. Geological Survey publications are available under the conditions indicated below from the U.S. Geological Survey, Books and Open-File Reports Section, Federal Center, Box 25425, Denver, CO 80225. (See latest Price and Availability List)
"Publications of the Geological Survey, 1879-1961" may be pur chased by mail and over the counter in paperback book form and as a set of microfiche.
"Publications of the Geological Survey, 1962-1970" may be pur chased by mail and over the counter in paperback book form and as a set of microfiche.
"Publications of the U.S. Geological Survey, 1971-1981" may be purchased by mail and over the counter in paperback book form (two volumes, publications listing and index) and as a set of microfiche.
Supplements for 1982,1983,1984,1985,1986, and for subsequent years since the last permanent catalog may be purchased by mail and over the counter in paperback book form.
State catalogs, "List of U.S. Geological Survey Geologic and Water-Supply Reports and Maps For (State)," may be purchased by mail and over the counter in paperback booklet form only
"Price and Availability List of U.S. Geological Survey Publica tions," issued annually, is available free of charge in paperback book let form only.
Selected copies of a monthly catalog "New Publications of the U.S. Geological Survey" available free of charge by mail or may be obtained over the counter in paperback booklet form only. Those wishing a free subscription to the monthly catalog "New Publications of the U.S. Geological Survey" should write to the U.S. Geological Survey, 582 National Center, Reston, VA 22092.
Note. Prices of Government publications listed in older catalogs, announcements, and publications may be incorrect. Therefore, the prices charged may differ from the prices in catalogs, announcements, and publications.