Embed Size (px)
Citation preview

LA-UR-97-2649
i i
THERMAL NEUTRON MULTIPLICITY COUNTING OF SAMPLES WITH VERY LOW FISSION RATES
M. S. Krick Los Alamos National Laboratory
Los Alamos, NM USA
To be Presented at the 38th Annual Meeting
Instime of Nuclear Materials Management Phoenix, AZ
July 20-24, 1997 n
This is a preprint of a paper intended for publication in a journal or proceedings. Because changes may be made before publication, this preprint is made available with the understanding that it will not be cited or reproduced without the permission of the author.

DISCLAIMER
This report was prepared as an account of work sponsored by an agency of the United States Government. Neither the United States Government nor any agency thereof, nor any of their empioyes, makes any warranty, express or implied, or assumes any legal liability or responsibility for the accuracy, completeness, or use- fulness of any information, apparatus, product, or process disclosed, or represents that its use would not infringe privately owned rights. Reference herein to any spe- cific commercial product, process, or service by trade name, trademark, manufac- turer, or otherwise does not necessarily constitute or imply its endorsement, recorn- mendirtion. or favoring by the United States Government or any agency thereof. The views and opinions of authors expressed herein do not necessarily state or reflect those of the United States Government or any agency thereof.

THERMAL NEUTRON MULTIPLICITY COUNTING OF SAMPLES WITH VERY LOW FTSSION RATES*
M. S. Krick Los Alamos National Laboratory
Los Alamos, NM 87545 USA
Abstract
When samples with very low fission rates are assayed using thermal neutron multiplicity counting, shift register electronics, and the moments formalism for the singles, doubles, and triples count rates, large counting statistics errors can occur in the triples rates because of cosmic ray events. These counting statistics errors can be greatly reduced using gate multiplicity analysis when cosmic ray events produce high multiplicity neutron bursts. The gate multiplicity analysis method, measurement data, and results are presented.
Introduction
Thermal neutron multiplicity counting is commonly performed with shift register multiplicity electronics’ and three-parameter moments analysis2 Shift register coincidence circuits were developed3y4 in the 1970s to improve coincidence counting performance at high count rates; moments analysis was de~eloped’.~ in the 1980s and provided convenient closed-form solutions for three-parameter multiplicity analysis.
However, at very low count rates where the measurement sample provides coincidence rates comparable to the coincidence rates arising fiom cosmic ray background events, neither the shift register coincidence circuit nor the moments analysis is well suited to the measurement. A cosmic ray event can produce a large neutron burst and the shift register circuit repeatedly counts the neutrons in the burst. The moments analysis then weights the data in favor of the high multiplicity events. The result is a very high sensitivity to cosmic ray events and a large statistical error in the measured triples count rate.
Because shift register circuits are so widely installed and because data collection software for these circuits is already developed and installed, it could be useful to have special analysis techniques to process shift register data when cosmic ray events produce a significant part of the coincidence rates. The method presented here is called gate
* This work is supported by the US Department of Energy, Office of Safeguards and Security.
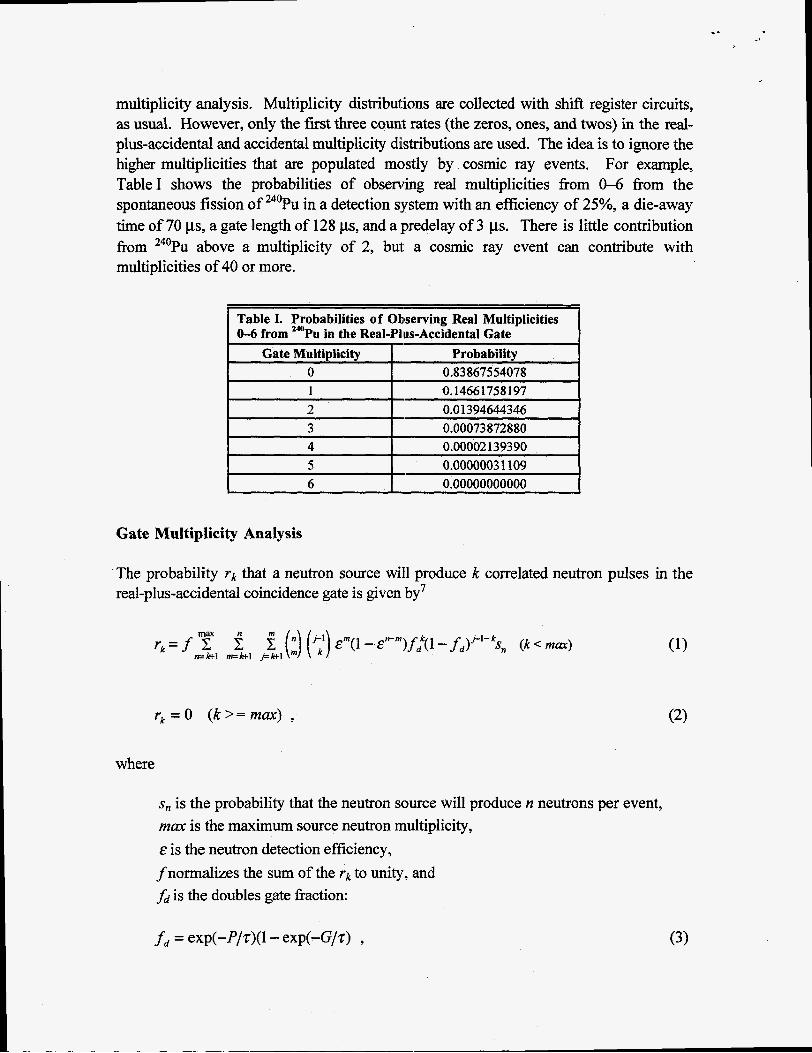
multiplicity analysis. Multiplicity distributions are collected with shift register circuits, as usual. However, only the fmt three count rates (the zeros, ones, and twos) in the real- plus-accidental and accidental multiplicity distributions are used. The idea is to ignore the higher multiplicities that are populated mostly by cosmic ray events. For example, Table1 shows the probabilities of observing real multiplicities fkom 0-6 from the spontaneous fission of 240Pu in a detection system with an efficiency of 25%, a die-away time of 70 ps, a gate length of 128 ps, and a predelay of 3 ps. There is little contribution from 240Pu above a multiplicity of 2, but a cosmic ray event can contribute with multiplicities of 40 or more.
Table I. Probabilities of Observing Real Multiplicities 0-6 from 240Pu in the Real-Plius-Accidental Gate
Gate Multiplicity Probability 0 0.83 867554078 1 0.14661758 197 2 0.01394644346 3 0.00073872880
I 4 I 0.00002 139390 I I I 5 0.0000003 1 109 I I 6 I 0.00000000000 I
Gate Multiplicity Analysis
The probability rk that a neutron source will produce k correlated neutron pulses in the real-plus-accidental coincidence gate is given 12y7
where
s, is the probability that the neutron source will produce n neutrons per event, m a is the maximum source neutron multiplicity, E is the neutron detection efficiency, fnormalizes the sum of the rk to unity, and fd is the doubles gate fraction:
fd = exp(-f‘/z)(l- exp(-G/z) , (3)

where
P is the predelay, G is the coincidence gate length, and z is the detector die-away time.
The total neutron count rate Stis
max
S, = $ x i s i , i =1
(4)
where F is the source event rate.
The singles (S), doubles (D), and triples (T) count rates for gate multiplicity analysis are defined as
Experimentally, the singles, doubles, and triples rates are determined as follows. Let S, be the measured total neutron count rate and let p i and qi be the observed probabilities of obtaining i neutron pulses in the real-plus-accidental and accidental coincidence gates, respectively. Then
and S, D, and Tare calculated from Eqs. 5-7.
The measured singles, doubles, and triples rates can be used to solve for three quantities using Eqs. 5-7 and Eq. 1. For example, one application could be to determine the effective 240Pu mass in a very small plutonium sample where the neutron multiplication (M) is 1 and the neutron detection efficiency is unknown. The measurement of the sample provides S, and the pi and qi, from which S, D, and T can be calculated from Eqs. 5-10. The total neutron count rate is

S, = mF,vslE(l+a) ,
where
rn = effective 240Pu mass, FO= 240pU spontaneous fission rate per unit mass, vsl = first moment of the 24?Pu spontaneous fission neutron emission probability
a = ratio of neutrons from (a,n) reactions to neutrons from spontaneous fission. distribution, and
Because M = 1, the ratio T/D is independent of a and can be solved for E using Eq. 1. Then
where qSf is calculated from Eq. 1 for a source of pure 240Pu. Finally, from Eq. 11, the effective 240~u mass is
The background count rates were ignored in the equations above. To correct for the background, the background rates are deteImined fiom Eqs. 5-10 using data from a background measurement. The background rates are then subtracted from the sample rates before the equations are solved for E, a, and m.
Measurements
The measurements were made with the three-ring multiplicity counter (3RMC).' The three rings contain 60 3He proportional counters to produce a neutron detection efficiency of 45% for 252Cf neutrons. The die-away time of the 3RMC is 62 ps. Any thermal neutron counter could have been used for these experiments, but the three-ring counter was available and convenient.
The 4-MHz multiplicity shift register (MSR,4)' was used to collect the raw data, which were transferred to an IBM Thinkpad computer for data analysis. The initial data collection and analysis were performed by the Los Alamos Neutron Coincidence Counting (NCC) code? Additional analysis was done with custom software. A predelay of 3 ps and a gate length of 64 ps was used foir all measurements.

A small 252Cf source was used as a weak source of fission neutrons such that the source contributed a neutron count rate similar to the background count rate. The smallest source available was much too strong when placed inside the 3RMC, so it was withdrawn into the top end plug as much as needed to obtain a sufficiently low count rate. Two kinds of background were used for the study: the normal room background and an enhanced background obtained by placing a lead brick in the detector. The lead greatly increases the correlated neutron background from cosmic ray interactions and simulates the cosmic background neutrons that can be produced from detector materials such as steel and cadmium or from high-2 materials in the samples being measured.
Each measurement was one hour long and consisted of 120 runs of 30 s eacly the total measurement time was slightly longer than an hour because of the readout and restart times between runs. For every measurement of the 252Cf source, a corresponding measurement of the background was made. One pair of sourcehackground measurements was made for normal room backgroun4 ten pairs of measurements were made for the enhanced and more difficult background when the lead brick was in the detector. The NCC code saves in disk files the multiplicity distributions for every run in a measurement, so all the raw data were available for custom data analysis.
Results
Figure 1 shows the doubles rate from moments analysis plotted vs the run numbers for one of the ten high-background measurements using the 252Cf source. The runs with the high doubles rates are those for which a large cosmic ray event occurred during the 30-s run. Likewise, Figs. 2 and 3 show the triples rates from the same measurements on two scales.
Fig. 1. Doubles rate from moments analysis vs run number for one measurement of 120 30-s runs. The outlier rejection limit (30) is 4.65 l/s. Figs. 1-5 use the same raw data set.

Fig. 2. Triples rate from moments analysis vs run number for one measurement of 120 30-s runs. This plot shows the six very large outliers. See also Fig. 3. Figs. 1-5 use the same raw data set.
M 40 60 80 100 120
Run n u m k
Fig. 3. Triples rate from moments analysis vs run number for one measure- ment of 120 30-s runs. The same data are shown in Fig. 2 with a different scale for the triples rate to show the six largest outliers, which are off scale in this figure. The outlier rejection limit (30) is 2.30 Us. Figs. 1-5 use the same raw data set.
20 40 60 so 120
Run number
Because the runs with large cosmic ray events have such a large influence on the average rates for the measurement, an outlier rejection procedure is normally used to remove these runs from the measurement before the average rates are calculated. The outlier rejection procedure used here for both the doubles and triples rates was to compute the sample standard deviation of the 120 runs and then to1 remove those runs whose rates were more than three standard deviations from the average; this process was repeated using the remaining runs until no more outliers were found. The final outlier rejection limits for the doubles and triples rates are shown in Figs. 1 and 3 for this measurement. Fifteen of the 120 runs were rejected as outliers.
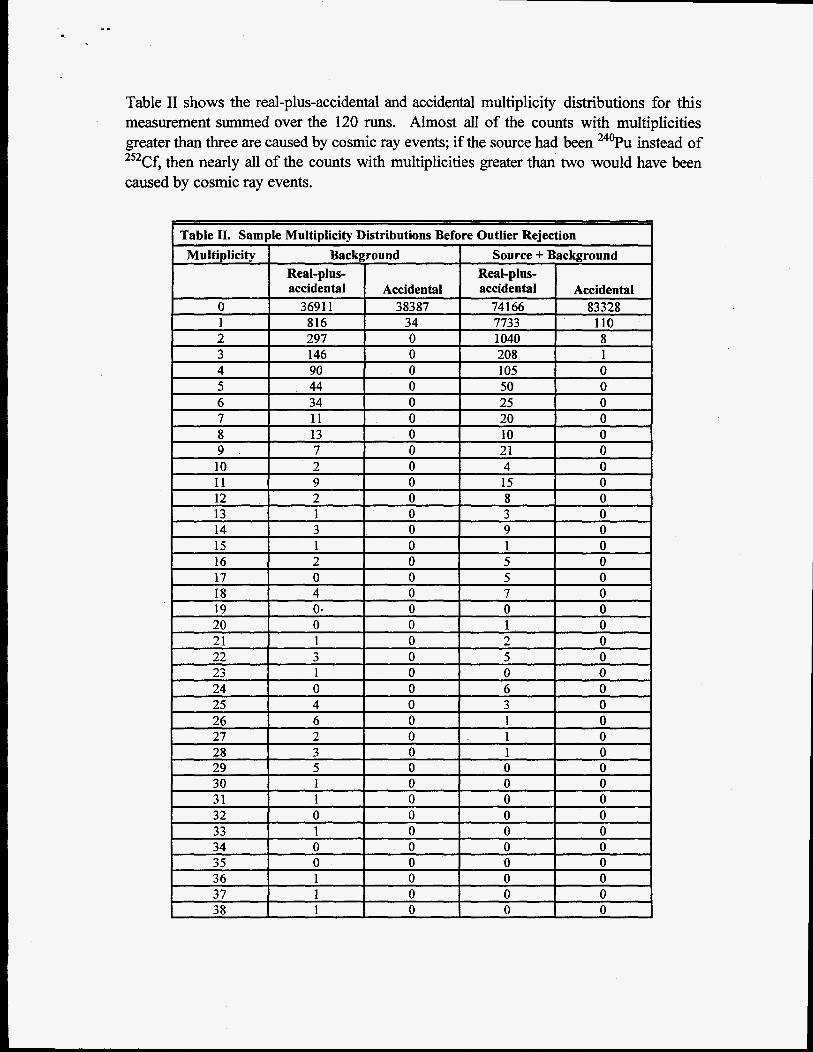
Table I1 shows the real-plus-accidental and accidental multiplicity distributions for this measurement summed over the 120 runs. Almost all of the counts with multiplicities greater than three are caused by cosmic ray events; if the source had been 24% instead of 252Cf, then nearly all of the counts with multiplicities greater than two would have been caused by cosmic ray events.
Table II. Sample Multiplicity Distributions Before Outlier Rejection MultiDlicitv I Backeround I Source + Background
~~
Real-plus- Real-plus- accidental Accidental accidental Accidental
0 36911 38387 74166 83328 1 816 34 7733 110 2 297 0 1040 8 3 146 0 208 1
I 13 I 1 I 0 I 3 I 0 I
19 0. 0 0 0 20 0 0 1 0 21 1 0 2 0
23 1 0 0 0 24 0 0 6 0 25 4 0 3 0

Table I11 shows the real-plus-accidental and accidental multiplicity distributions for the same measurement after the 15 outlier runs were removed. Although outlier rejection greatly improves the distributions, the moiments calculations are still sensitive to the remaining cosmic ray events.
.
15, Fig. 4. Doubles rate from gate multiplicity analysis vs run number for one meas- 5 . urement of 120 30-s runs. The outlier rejection limits $ 10-
(30) are 1.27 l/s and 2.97 l/s. 5 For comparison with Fig. 1, 8 .
Figures 4 and 5 show the doubles and triples rates plotted vs the run number for the same measurement using gate multiplicity analysis. Because this method is far less sensitive to cosmic ray events than the moments method, there are only three outliers. For comparison, the rates are plotted using the same relative scales used for the moments analysis.
.
. ~ 1 . . ~ I . , I I . j / I ~ . . , , I . I . ~ . ~ ~ ~ , , -
. . . \ I . I ,,, . ..,., , . , ~ 1 ~ 1 , ,,. I ~ c I ,. . . . _ . . , . , . , , . ~ . ~ , ~~. , _ . i I i . ,
Outlieriirnits = 1.27 and 2.97 , . , , . . , . ~ . . , . , , ,
Source + Background
the same relative scale for the doubles rate is used. Figs. 1- 5 use the same raw data set
. , . , ; , . *.. , , , . , _ I I ~ .,, , , I , , ,.' . ~ % , '.
1 4 c c , , ~ ~ ~ ~ ~ ~ . ~ ~ ~ o . - ~ , ~ ~ ~ ~ ~ ~ ~ ~ a ; o ~ ~ ~ . I . * 0 I I I I I -I
( 20 40 60 80 100
~ ~
0 32285 33375 ~ 64812- ~ 72527 1 697 31 667 1 94 2 233 0 889 8
I
120
3 104 0 163 0 4 58 0 68 0 5 23 0 29 0 6 8 0 3 0
I 7 I 0 I 0 I 2 I 0 1

0
Fig. 5. Triples rate from gate multiplicity analysis vs run number for one measurement of 120 30-s runs. The outlier rejection limit (30) is 0.62 l/s. For comparison with Fig. 3 the same relative scale for the triples rate is used. Figs. 1-5 use the same raw data set.
0 20 . 40 60 80
Run number 100 I20
Table N shows the doubles and triples rates for this measurement with and without outlier rejection for the moments and gate multiplicity analysis methods. Outliers that do occur using gate multiplicity analysis have little effect on the average rates.
Table V shows the number of outliers for each of the ten high-background measurement sets (ten background and ten source-plus-background) for moments analysis and gate multiplicity analysis.
Table IV. Rates Before and After Outlier Rejection I Moments Analvsis I Gate MultiDlicitv Analvsis
Doubles (Us) Triples (Us) Doubles (l/s) Triples (Us) Rates Before 3.550 4.170 2.124 0.284 Rates Afier 2.945 0.680 2.1 19 0.280
Table V. Number of Outliers in 120 Runs for Ten Sets of Measurements Measurement
Number Number of Outliers Background Source + Background
Gate Gate Moments Multiplicity Moments Multiplicity Analysis Analysis Analysis Analysis
1 27 1 23 0 2 22 7 23 0 3 15 1 13 I 1 4 11 4 15 1 5 24 4 22 1 6 39 4 21 1 7 17 2 16 0 8 17 2 16 0 9 18 2 15 3 10 24 1 28 0

Figure 6 shows the net doubles rate vs measurement number for each of the ten high- background measurements of the 252Cf sourcc: for moments analysis and gate multiplicity analysis. The net rate is the source rate with background subtracted; there are ten pairs of source and background measurements. The error bars shown on the plotted points are the sample standard deviations of the runs for th!e corresponding measurement that were not rejected as outliers. Also shown in Fig. 6 are lines indicating the average net doubles rates and standard errors calculated from the ten net doubles rates in each case. The net doubles rate is determined to a precision of 1.4% with moments analysis and 0.43% with gate multiplicity analysis.
Similarly, Figs. 7 and 8 show the net triples irate vs measurement number for each of the ten high-background measurements of the 2:j2Cf source for moments analysis and gate
Fig. 6. Net doubles rate vs measurement number for the ten repeat measure ment data sets (back- ground and source-plus- background) for moments analysis and gate multi- plicity analysis. The error (lo) of the average dou- bles rate is 1.4% for moments analysis and 0.43% with gate multi- plicity analysis.
I I I I 1 - 1
0 2 4 6 8 IO
Measurement number
0.5
0.4
0.3 c
s - v .- 0
0.0
-0.1
1 T i 1
0 2 I 4 I Q I ;I IO
Measurement number
Fig. 7. Net triples rate vs measurement number for the ten repeat measurement data sets (background and source- plus-background) for moments analysis. The error (la) of the average triples rate is 17%.
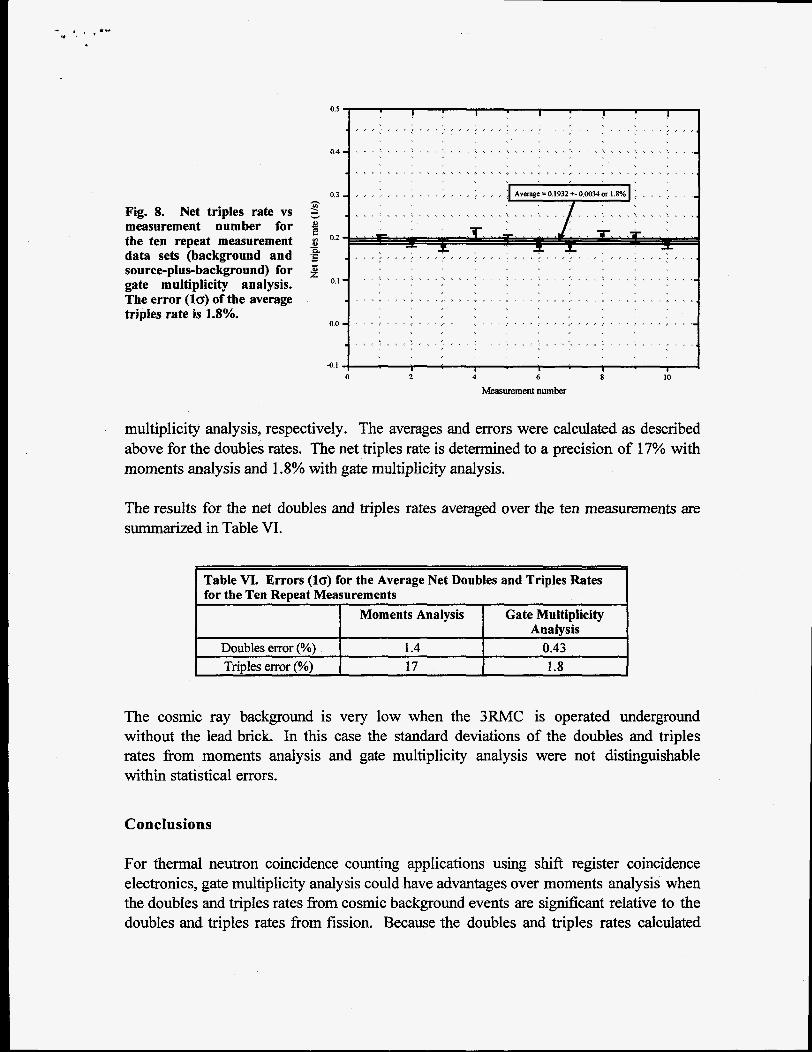
Fig. 8. Net triples rate vs measurement number for the ten repeat measurement data sets (background and source-plus-background) for gate multiplicity analysis. The error (lc) of the average triples rate is 1.8%.
multiplicity analysis, respectively. The averages and errors were calculated as described above for the doubles rates. The net triples rate is determined to a precision of 17% with moments analysis and 1.8% with gate multiplicity analysis.
The results for the net doubles and triples rates averaged over the ten measurements are summarized in Table VI.
Table VI. Errors (lo) for the Average Net Doubles and Triples Rates for the Ten Repeat Measurements
Moments Analysis Gate Multiplicity Analysis
Doubles error (%) 1.4 0.43 Triules error (%) 17 1.8
The cosmic ray background is very low when the 3RMC is operated underground without the lead brick. In this case the standard deviations of the doubles and triples rates from moments analysis and gate multiplicity analysis were not distinguishable within statistical errors.
Conclusions
For thermal neutron coincidence counting applications using shift register coincidence electronics, gate multiplicity analysis could have advantages over moments analysis when the doubles and triples rates from cosmic background events are significant relative to the doubles and triples rates from fission. Because the doubles and triples rates calculated

with gate multiplicity analysis are insensitive: to the cosmic background, these coincidence rates are determined with better precision. There are few outliers with gate multiplicity analysis and the outliers that do occur are not influential, so it is not necessary to make large numbers of short runs to search for outliers. If a sample contains a lot of high-Z material and is thus a major source of neutrons from cosmic events, gate multiplicity analysis is much less sensitive than moments analysis to this material.
References
1. J. K. Halbig, et al., “Recent Developments in Multiplicity Counting Hardware at Los Alamos,” 1991 Institute of Electrical and Electronic Engineers Nuclear Science Symposium and Medical Imaging Conference, Santa Fe, New Mexico, November 2-9, 199 1, Los Alamos National Laboratory document LA-UR-9 1-3571.
2. D. M. Cifarelli and W. Hage, “Models for a Three Parameter Analysis of Neutron Signal Correlation Measurements for Fissile Material Assay,” Nucl. Instrum. Methods, A215,550 (1986).
3. M. M. Stephens, J. E. Swansen, and L. I”. East, “Shift Register Neutron Coincidence Module,’’ Los Alamos Scientific Laboratory report LA-6 121-MS (December 1975).
4. K. Bohnel, “Determination of Plutonium in Nuclear Fuels Using the Neutron Coincidence Method,” KFK2203, Karlsruhe (1 973, also AWRE Translation 70 (54/4252), Aldermaston (1978).
5. W. Hage and D. M. Cifarelli, “Correlation Analysis with Neutron Count Distributions in Randomly or Signal Triggered Time Intervals for Assay of Special Nuclear Materials,” Nucl. Sci. Eng. 89, 159-1 76 (1 985).
6. K. Bohnel, “The Effect of Multiplicatbon on the Quantitative Determination of Spontaneously Fissioning Isotopes by Neutron Correlation Analysis,” Nucl. Sci. Eng.
7. M. S . Krick and J. E. Swansen, “Neutron Multiplicity and Multiplication Measurements,” NucZ. Instrum. Meth. 219,384-393 (1 984).
8. J. E. Stewart et al., “Assay of Scrap Plutonium Oxide by Thermal Neutron Multiplicity Counting for IAEA Verification of Excess Materials fiom Nuclear Weapons Production,” Nucl. Mater. Manage. XXV (Proc. Issue/CD-ROM), 263-267 (1996).
9. J. E. Stewart, et.al., NucZ. Mater. Manage. XXV (Proc. Issue/CD-ROM), 420-423 (1 996).
90,75-82 (1985).