Embed Size (px)
Citation preview
Thermal Noise in Initial LIGO
Gregory HarryLIGO / MIT
March 15, 2005
LIGO-G050087-00-R
Outline
• Impact of thermal noise on sensitivity• Measurements of suspension thermal noise
Measurements Results Future plans
• Ideas for improving thermal noise• Measurements of mirror thermal noise
Measurements Calculation and limits
Impact of Thermal Noise I
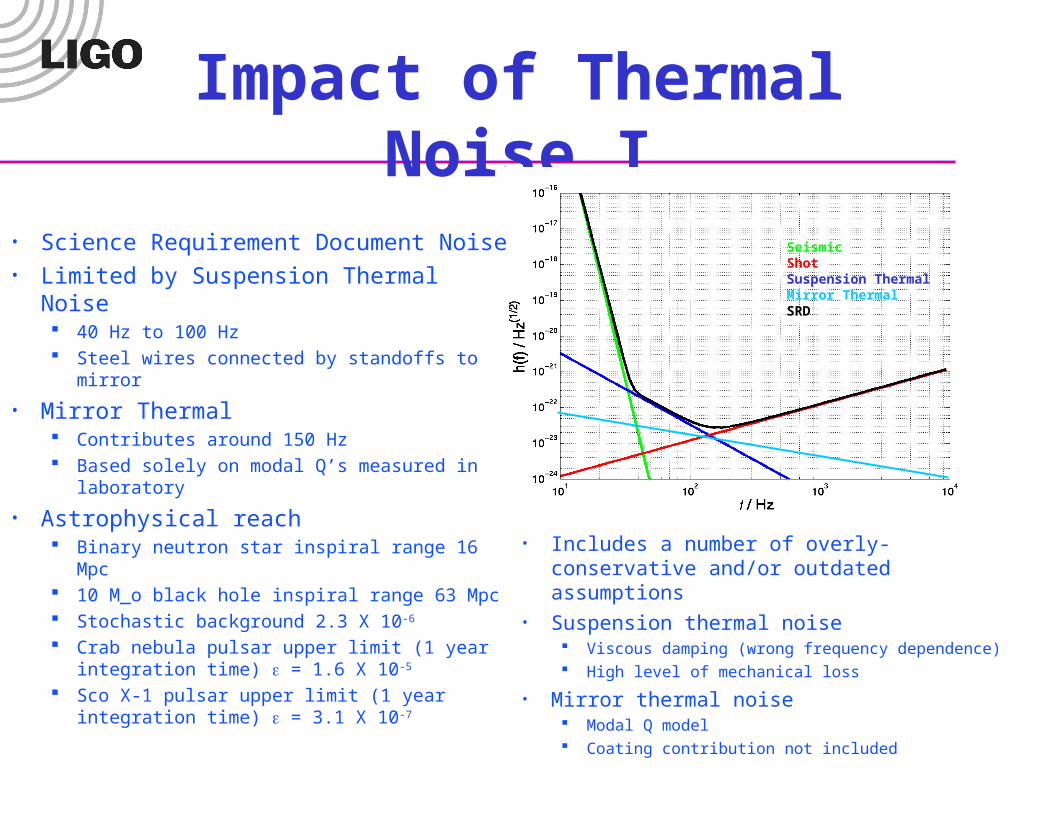
SeismicShotSuspension ThermalMirror ThermalSRD
• Includes a number of overly-conservative and/or outdated assumptions
• Suspension thermal noise Viscous damping (wrong frequency dependence) High level of mechanical loss
• Mirror thermal noise Modal Q model Coating contribution not included
• Science Requirement Document Noise• Limited by Suspension Thermal Noise
40 Hz to 100 Hz Steel wires connected by standoffs to mirror
• Mirror Thermal Contributes around 150 Hz Based solely on modal Q’s measured in
laboratory
• Astrophysical reach Binary neutron star inspiral range 16 Mpc 10 M_o black hole inspiral range 63 Mpc Stochastic background 2.3 X 10⁻⁶
Crab nebula pulsar upper limit (1 year integration time) = 1.6 X 10⁻⁵
Sco X-1 pulsar upper limit (1 year integration time) = 3.1 X 10⁻⁷
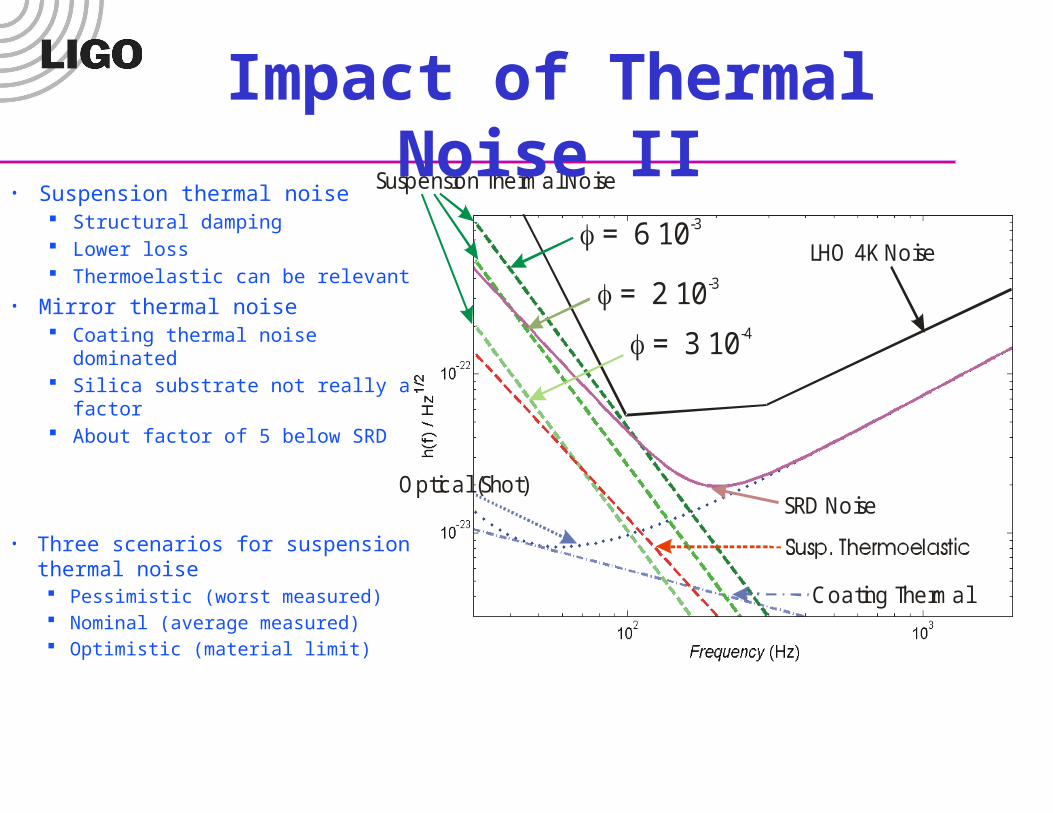
f = 6 10-3
f = 2 10-3
f = 3 10-4
Suspension Thermal Noise
SRD Noise
Coating Thermal
Optical (Shot)
LHO 4K Noise
Impact of Thermal Noise II
• Suspension thermal noise Structural damping Lower loss Thermoelastic can be relevant
• Mirror thermal noise Coating thermal noise dominated Silica substrate not really a
factor About factor of 5 below SRD
• Three scenarios for suspension thermal noise Pessimistic (worst measured) Nominal (average measured) Optimistic (material limit)
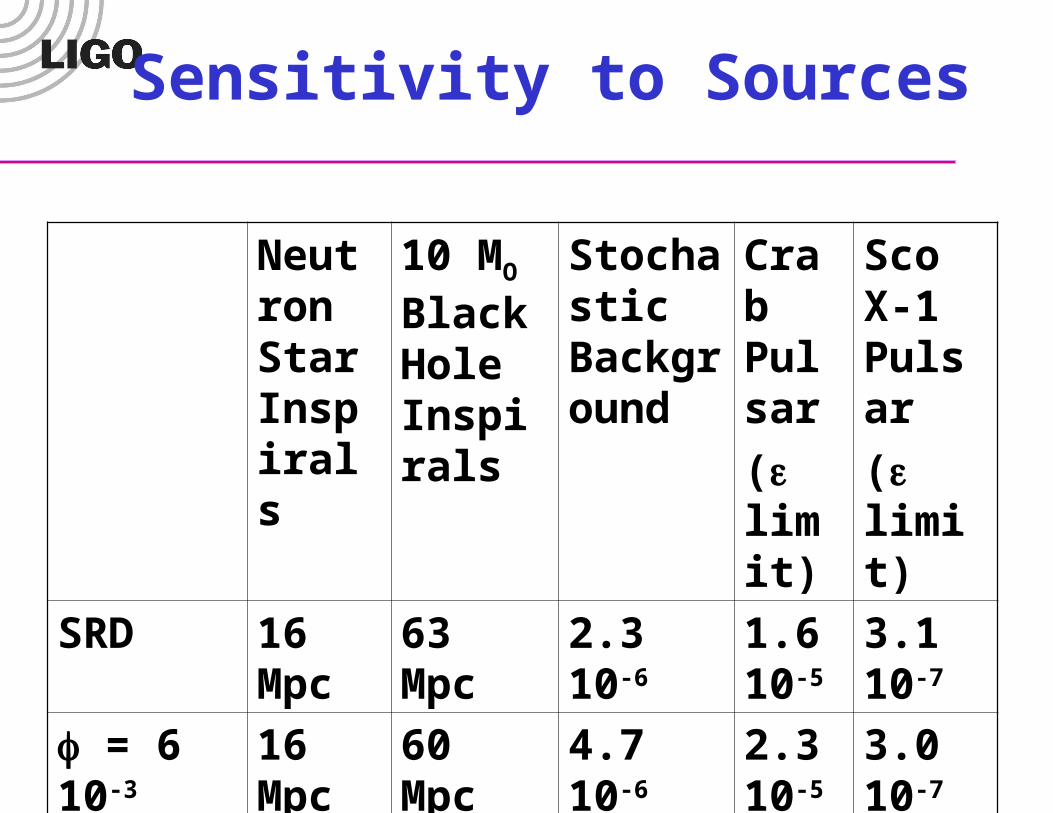
Sensitivity to Sources
Neutron Star Inspirals
10 MO Black Hole Inspirals
Stochastic Background
Crab Pulsar
( limit)
Sco X-1 Pulsar
( limit)
SRD 16 Mpc
63 Mpc 2.3 10-6 1.6 10-5
3.1 10-
7
f = 6 10-3 16 Mpc
60 Mpc 4.7 10-6 2.3 10-5
3.0 10-
7
f = 2 10-3 20 Mpc
84 Mpc 1.9 10-6 1.4 10-5
3.0 10-
7
f = 3 10-4 26 Mpc
120 Mpc
5.9 10-7 7.5 10-6
3.0 10-
7
Thermoelastic Limit
29 Mpc
140 Mpc
2.7 10-7 5.7 10-6
3.0 10-
7
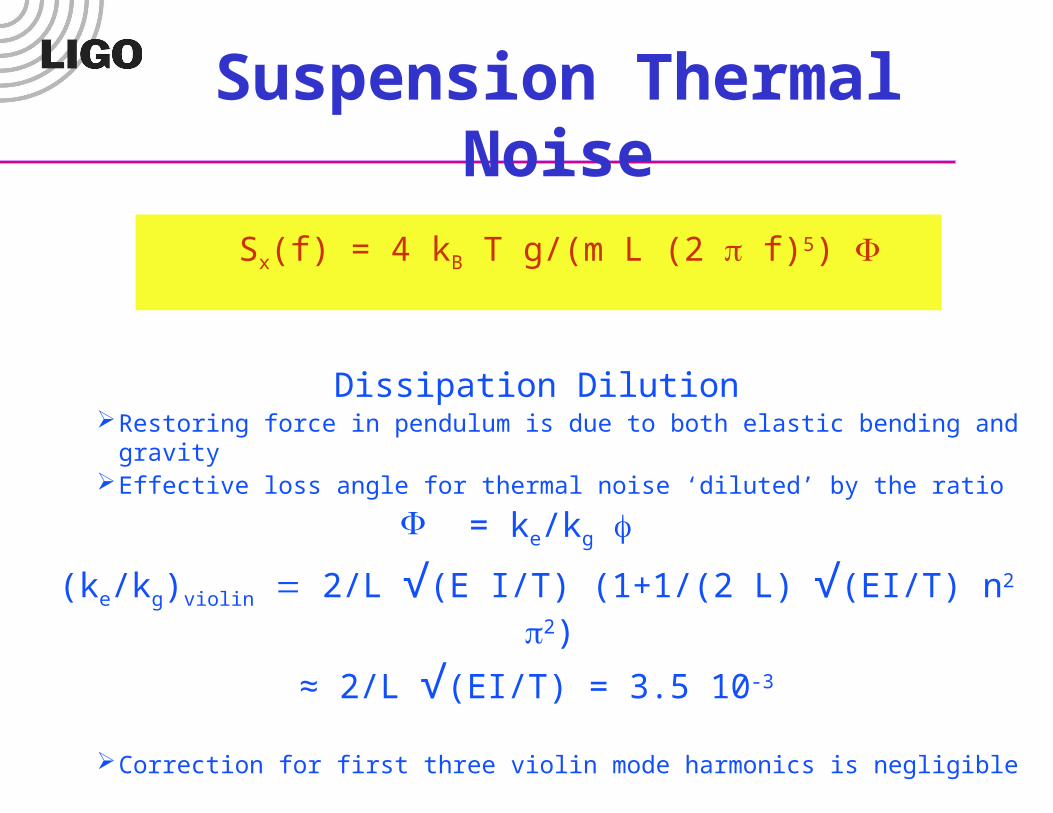
Suspension Thermal Noise
Dissipation DilutionRestoring force in pendulum is due to both elastic bending and gravity Effective loss angle for thermal noise ‘diluted’ by the ratio
= ke/kg f
(ke/kg)violin 2/L √(E I/T) (1+1/(2 L) √(EI/T) n2 2)
≈ 2/L √(EI/T) = 3.5 10-3
Correction for first three violin mode harmonics is negligible
Sx(f) = 4 kB T g/(m L (2 f)5)
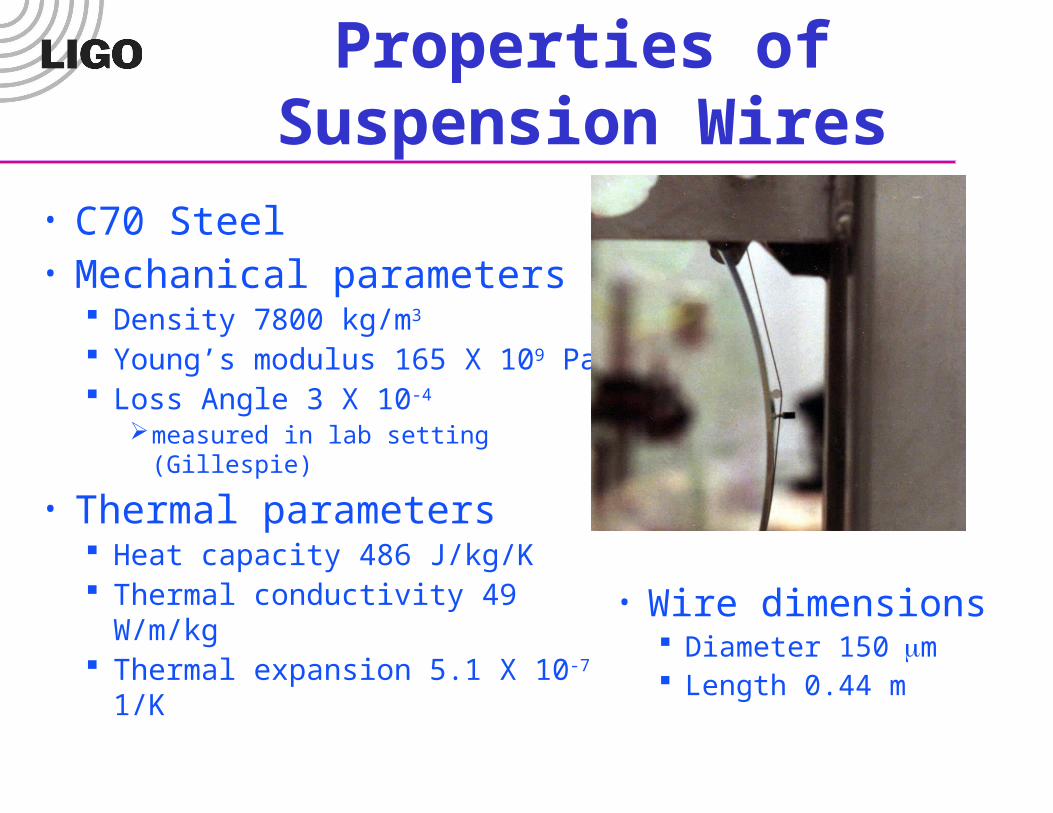
Properties of Suspension Wires
• C70 Steel• Mechanical parameters
Density 7800 kg/m3
Young’s modulus 165 X 109 Pa Loss Angle 3 X 10⁻⁴
measured in lab setting (Gillespie)
• Thermal parameters Heat capacity 486 J/kg/K Thermal conductivity 49 W/m/kg Thermal expansion 5.1 X 10⁻⁷ 1/K
• Wire dimensions Diameter 150m Length 0.44 m
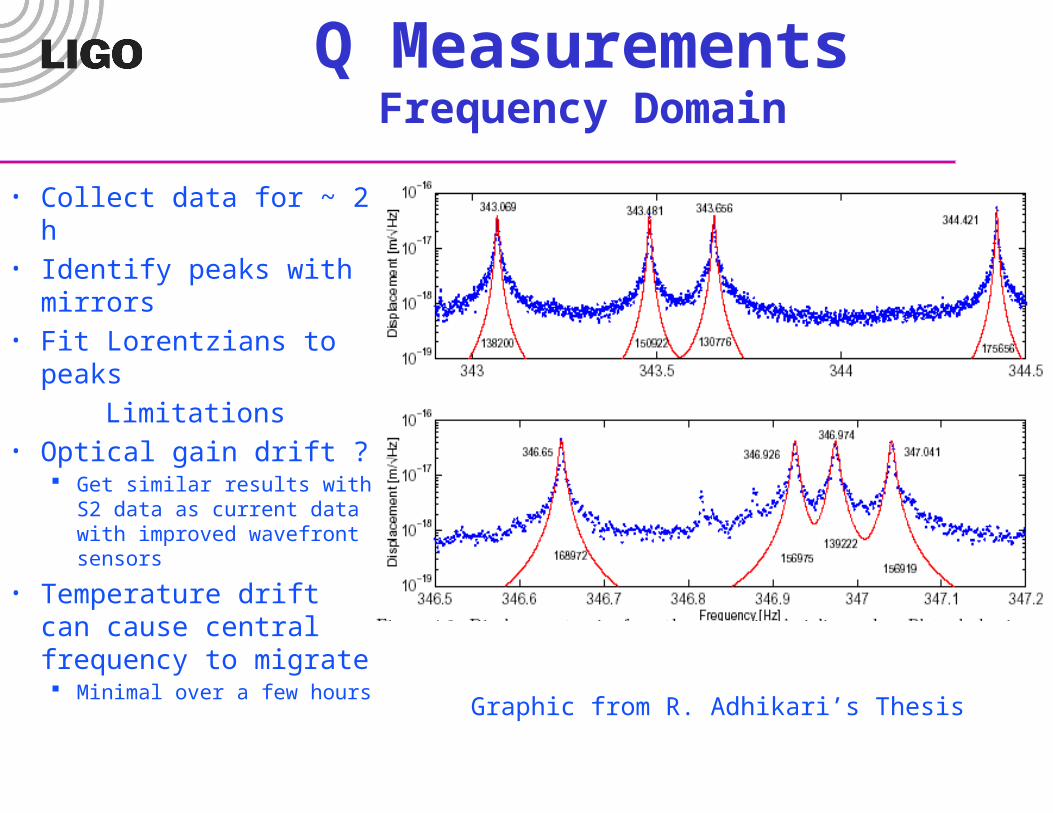
Q MeasurementsFrequency Domain
• Collect data for ~ 2 h• Identify peaks with
mirrors• Fit Lorentzians to
peaks
Limitations• Optical gain drift ?
Get similar results with S2 data as current data with improved wavefront sensors
• Temperature drift can cause central frequency to migrate Minimal over a few hours
Graphic from R. Adhikari’s Thesis
0 20 40 60 80 100 120-1.5
-1
-0.5
0
0.5
1
Time (s)
Am
plit
ude
LLO ITMy Violin Mode
0 20 40 60 80 100 12010
-4
10-2
100
102
Time (s)
Am
plit
ude
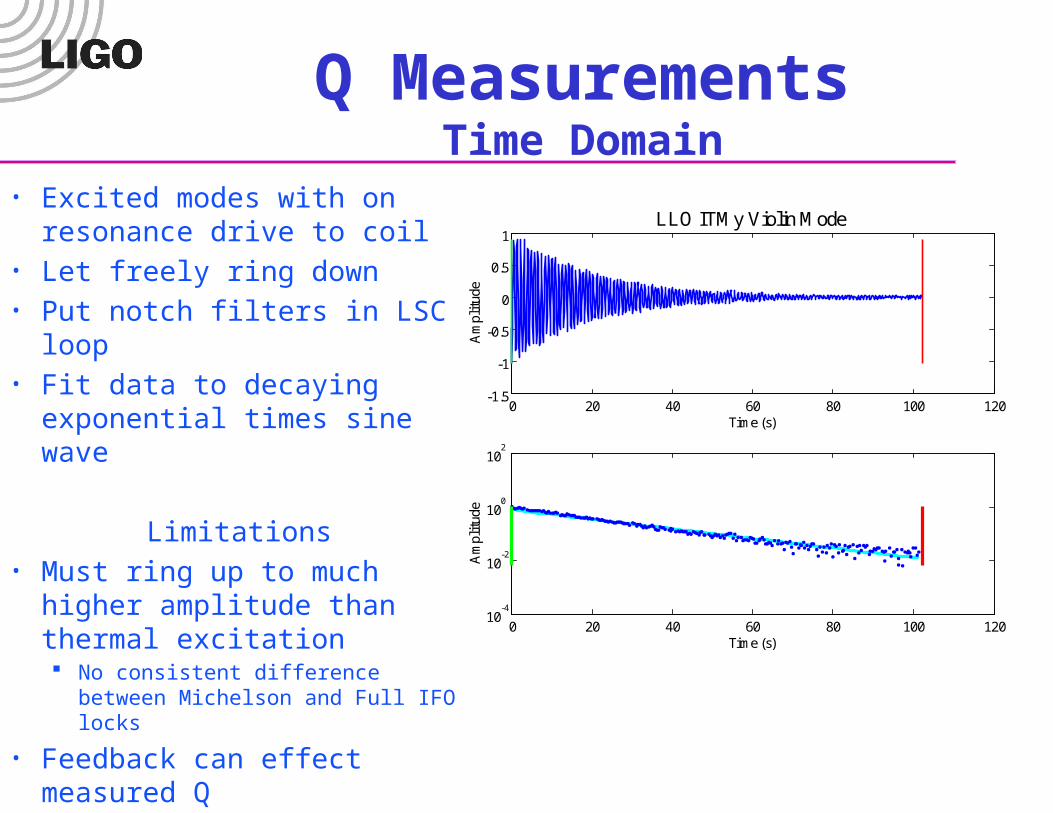
• Excited modes with on resonance drive to coil
• Let freely ring down• Put notch filters in LSC loop• Fit data to decaying
exponential times sine wave
Limitations• Must ring up to much higher
amplitude than thermal excitation No consistent difference between
Michelson and Full IFO locks
• Feedback can effect measured Q
Q MeasurementsTime Domain
Violin Mode ResultsOverview
• Ringdown Q’s and frequency domain fits do not agree
• Ringdown Q’s repeatable within a lock stretch but frequency domain fits are not
• Results different in different lock stretches• High harmonics show a little more pattern
Still unexplained discrepancies
• Highest Q’s consistent with material loss in wires Gillespie laboratory results
• Similar (lack of) patterns in all three IFOS Data from all 3, but more data on H2 than others
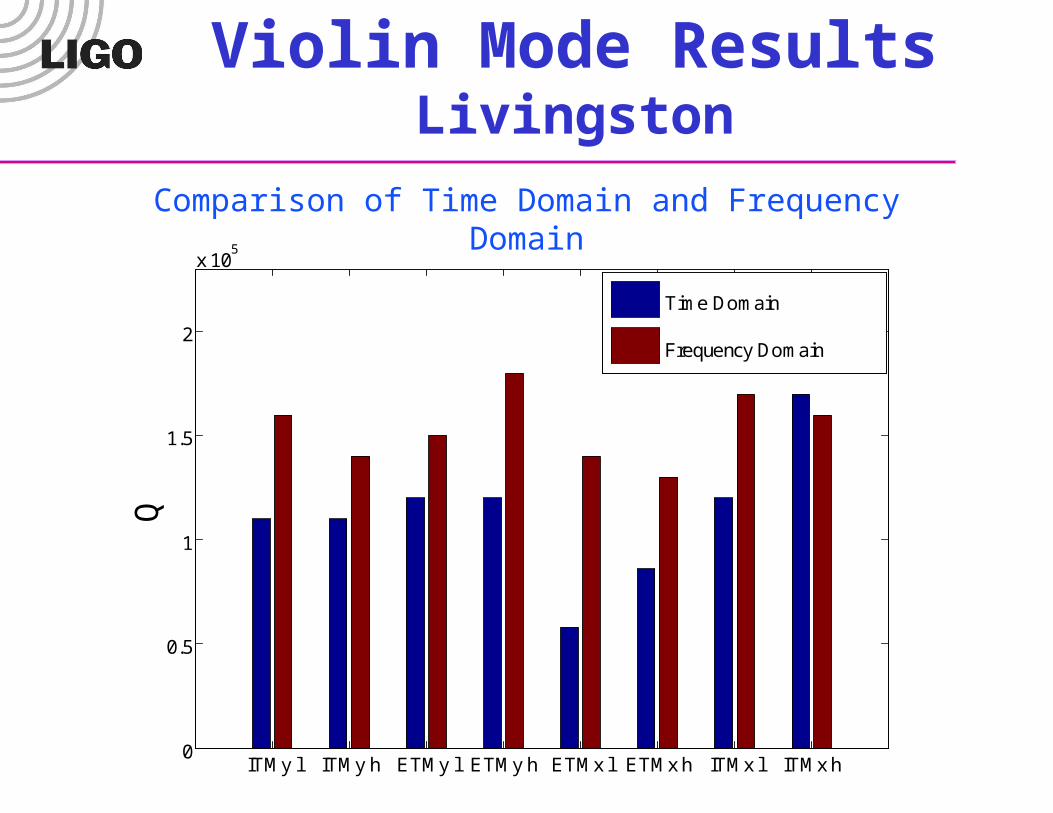
Violin Mode ResultsLivingston
ITMy l ITMy h ETMy l ETMy h ETMx l ETMx h ITMx l ITMx h0
0.5
1
1.5
2
x 105
Q
Time Domain
Frequency Domain
Comparison of Time Domain and Frequency Domain
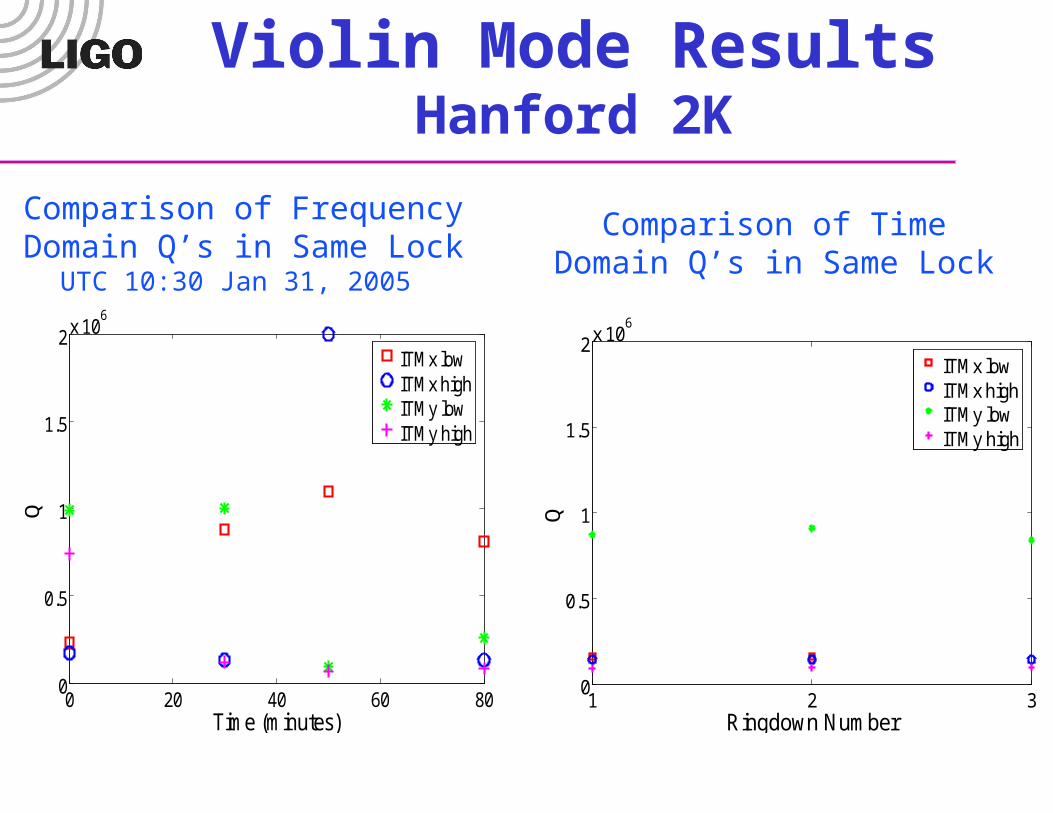
Violin Mode ResultsHanford 2K
Comparison of Frequency Domain Q’s in Same Lock
UTC 10:30 Jan 31, 2005
Comparison of Time Domain Q’s in Same Lock
1 2 30
0.5
1
1.5
2x 10⁶
Ringdown Number
Q
ITMx lowITMx highITMy lowITMy high
0 20 40 60 800
0.5
1
1.5
2x 10⁶
Time (minutes)
Q
ITMx lowITMx highITMy lowITMy high
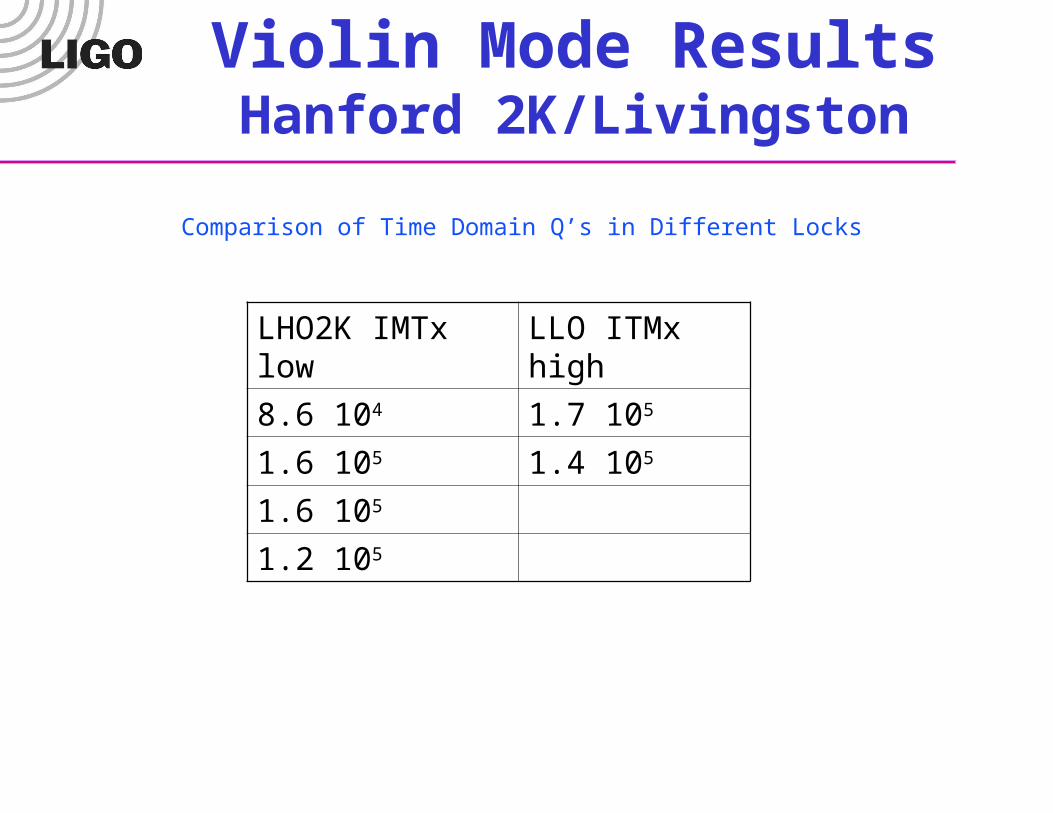
Violin Mode ResultsHanford 2K/Livingston
Comparison of Time Domain Q’s in Different Locks
LHO2K IMTx low LLO ITMx high
8.6 104 1.7 105
1.6 105 1.4 105
1.6 105
1.2 105
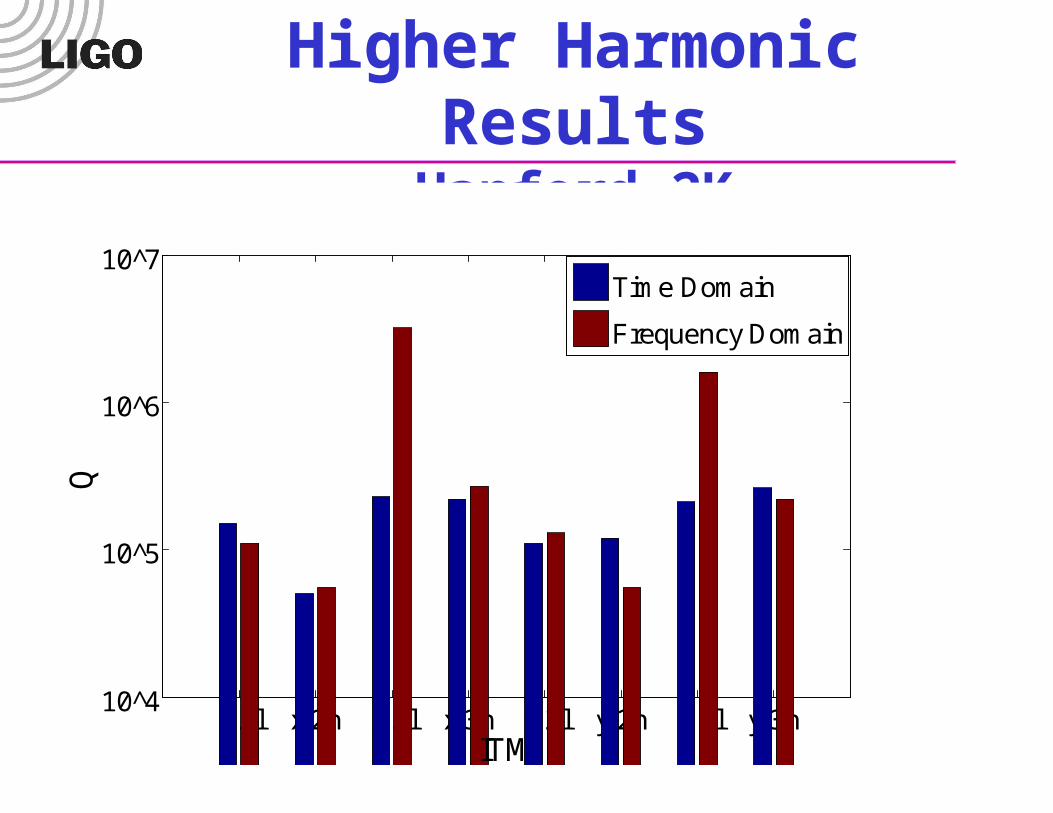
Higher Harmonic ResultsHanford 2K
x 2l x 2h x 3l x 3h y 2l y 2h y 3l y 3h10^4
10^5
10^6
10^7
ITM
Q
Time Domain
Frequency Domain
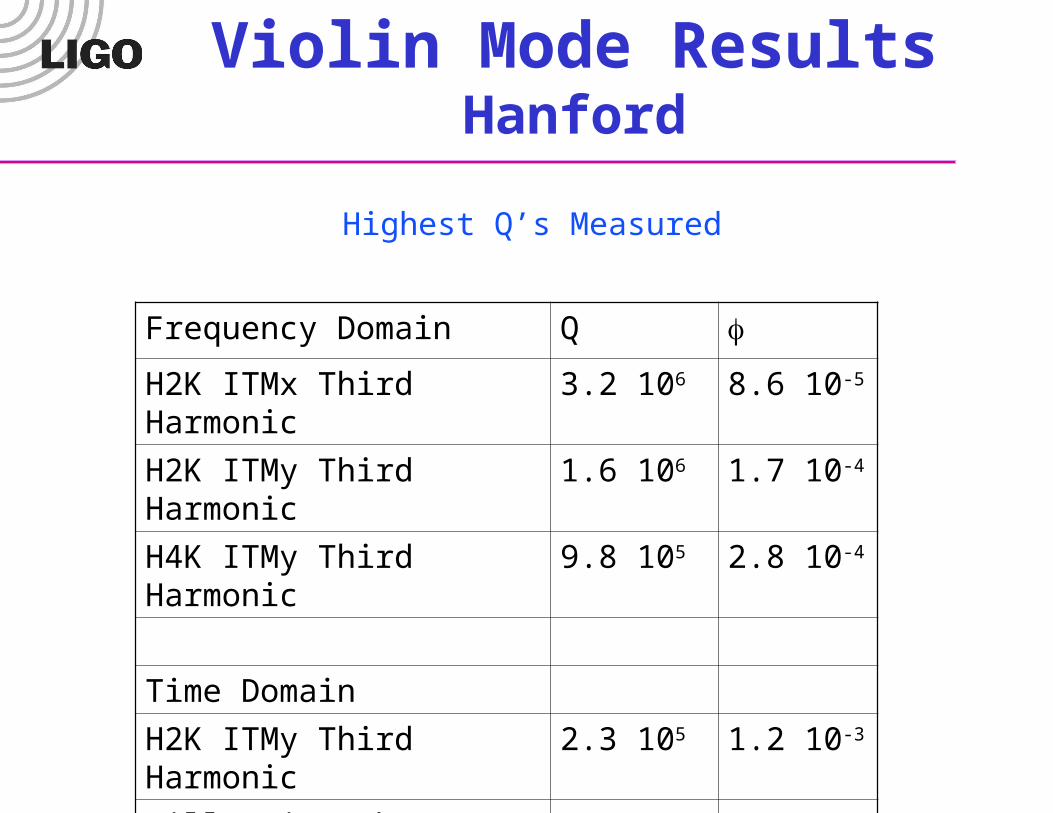
Violin Mode ResultsHanford
Highest Q’s Measured
Frequency Domain Q fH2K ITMx Third Harmonic 3.2 106 8.6 10-5
H2K ITMy Third Harmonic 1.6 106 1.7 10-4
H4K ITMy Third Harmonic 9.8 105 2.8 10-4
Time Domain
H2K ITMy Third Harmonic 2.3 105 1.2 10-3
Gillespie Lab Results 3 10-4
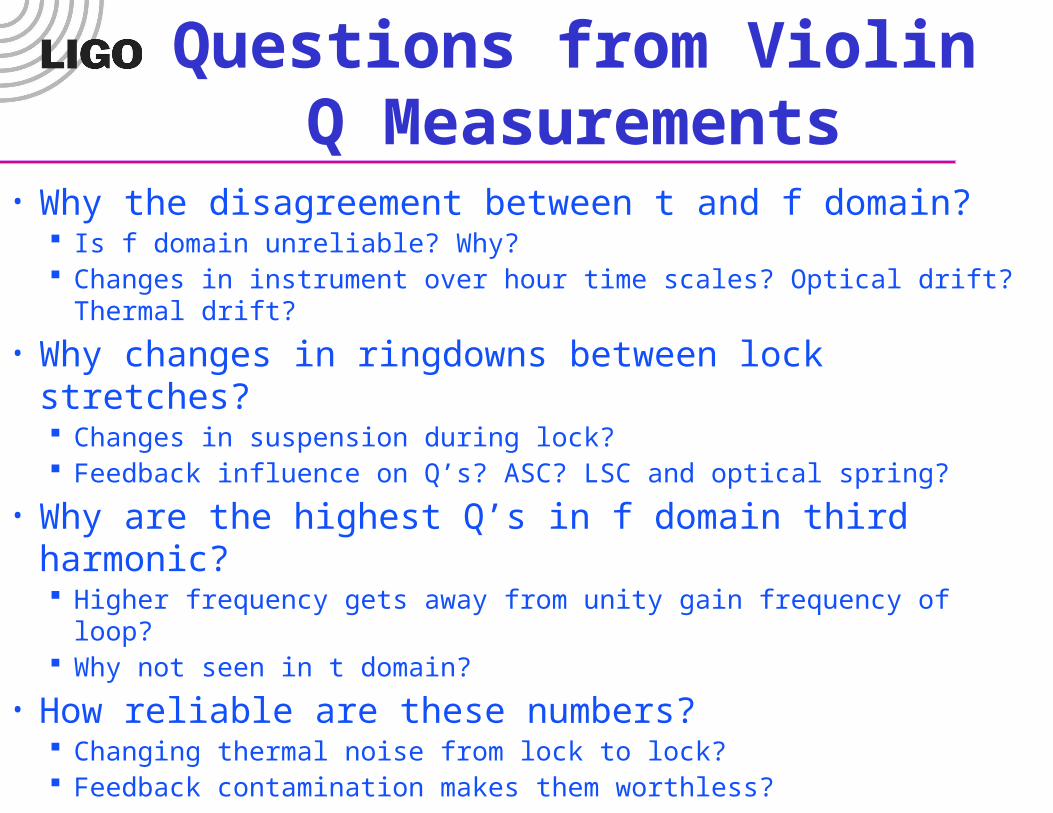
Questions from Violin Q Measurements
• Why the disagreement between t and f domain? Is f domain unreliable? Why? Changes in instrument over hour time scales? Optical drift?
Thermal drift?
• Why changes in ringdowns between lock stretches? Changes in suspension during lock? Feedback influence on Q’s? ASC? LSC and optical spring?
• Why are the highest Q’s in f domain third harmonic? Higher frequency gets away from unity gain frequency of loop? Why not seen in t domain?
• How reliable are these numbers? Changing thermal noise from lock to lock? Feedback contamination makes them worthless?
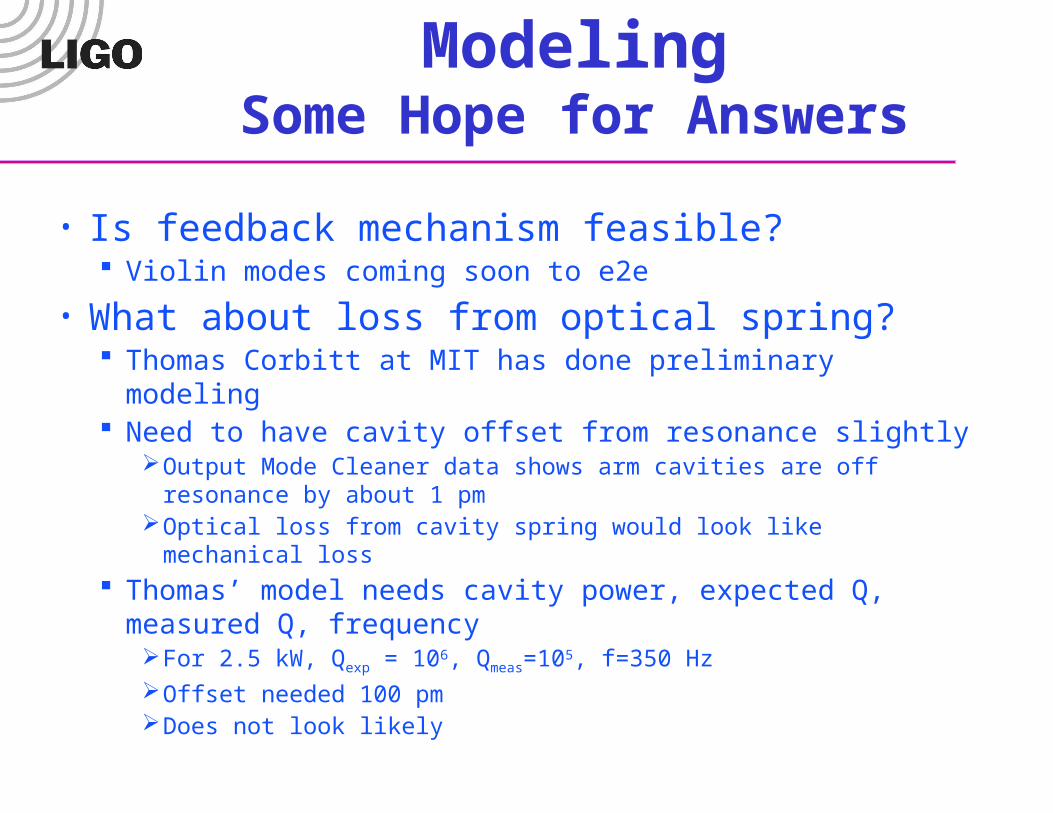
ModelingSome Hope for Answers
• Is feedback mechanism feasible? Violin modes coming soon to e2e
• What about loss from optical spring? Thomas Corbitt at MIT has done preliminary modeling Need to have cavity offset from resonance slightly
Output Mode Cleaner data shows arm cavities are off resonance by about 1 pm
Optical loss from cavity spring would look like mechanical loss Thomas’ model needs cavity power, expected Q,
measured Q, frequencyFor 2.5 kW, Qexp = 106, Qmeas=105, f=350 HzOffset needed 100 pmDoes not look likely
Violin Modes : Future Directions
• Modeling and theory Need some ideas
• More time domain data Same and different lock stretches
• Put notch filters in ASC loop• Measure Q vs. cavity power to assess feedback
If Q depends on power, extrapolate back to 0 to get true thermodynamic loss
• Measure more and higher harmonics Get above from loops unity gain frequency Less amplitude for same energy, so less motion of wire
• Collect data on all mirrors and wires Maybe some data is more comprehensible
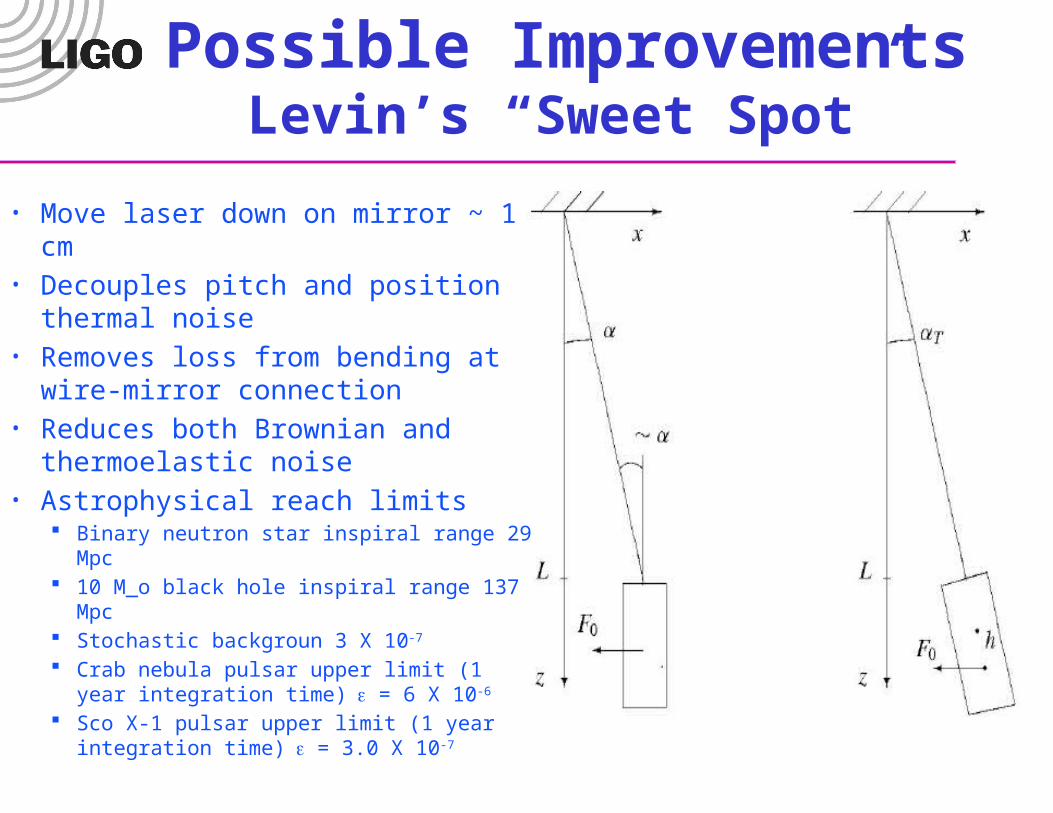
• Move laser down on mirror ~ 1 cm• Decouples pitch and position
thermal noise• Removes loss from bending at
wire-mirror connection• Reduces both Brownian and
thermoelastic noise• Astrophysical reach limits
Binary neutron star inspiral range 29 Mpc 10 M_o black hole inspiral range 137 Mpc Stochastic backgroun 3 X 10⁻⁷
Crab nebula pulsar upper limit (1 year integration time) = 6 X 10⁻⁶
Sco X-1 pulsar upper limit (1 year integration time) = 3.0 X 10⁻⁷
Possible ImprovementsLevin’s “Sweet Spot”
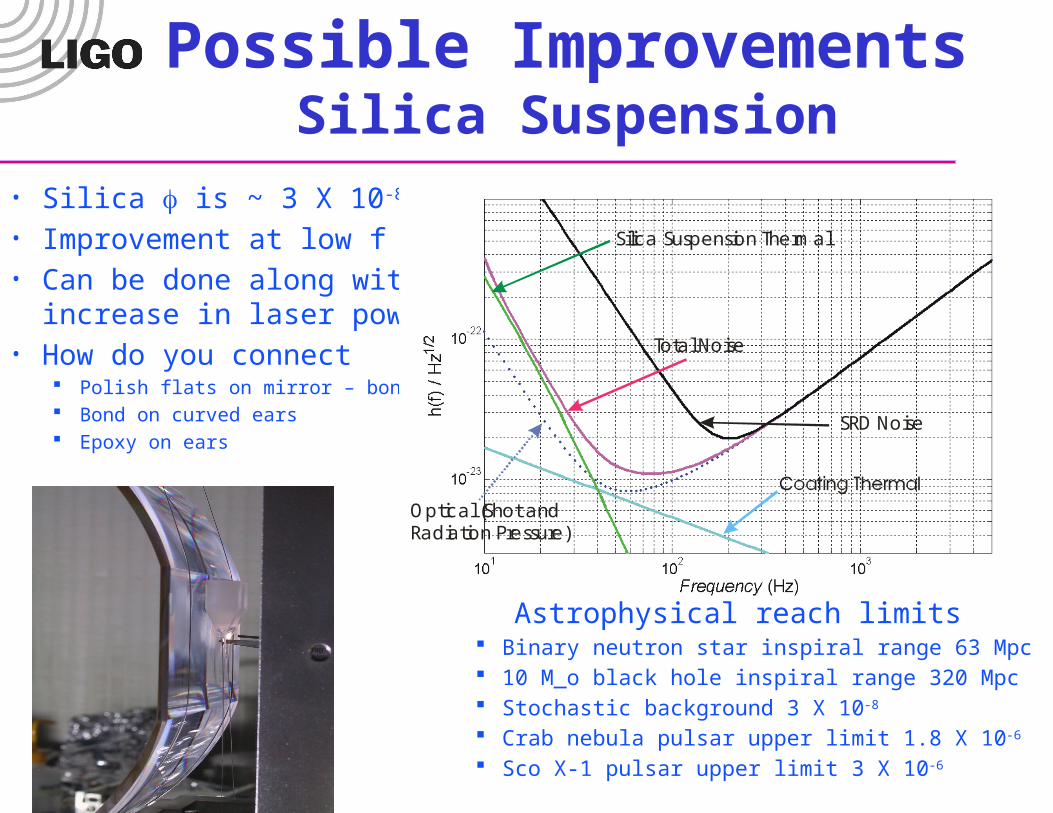
Possible ImprovementsSilica Suspension
• Silica f is ~ 3 X 10⁻⁸
• Improvement at low f • Can be done along with increase
in laser power• How do you connect
Polish flats on mirror – bond ears Bond on curved ears Epoxy on ears
Silica Suspension Thermal
Optical (Shot and Radiation Pressure)
Total Noise
SRD Noise
Astrophysical reach limits Binary neutron star inspiral range 63 Mpc 10 M_o black hole inspiral range 320 Mpc Stochastic background 3 X 10⁻⁸
Crab nebula pulsar upper limit 1.8 X 10⁻⁶
Sco X-1 pulsar upper limit 3 X 10⁻⁶
Suspension Thermal Noise
SRD Noise
Coating Thermal
Optical (Shot)
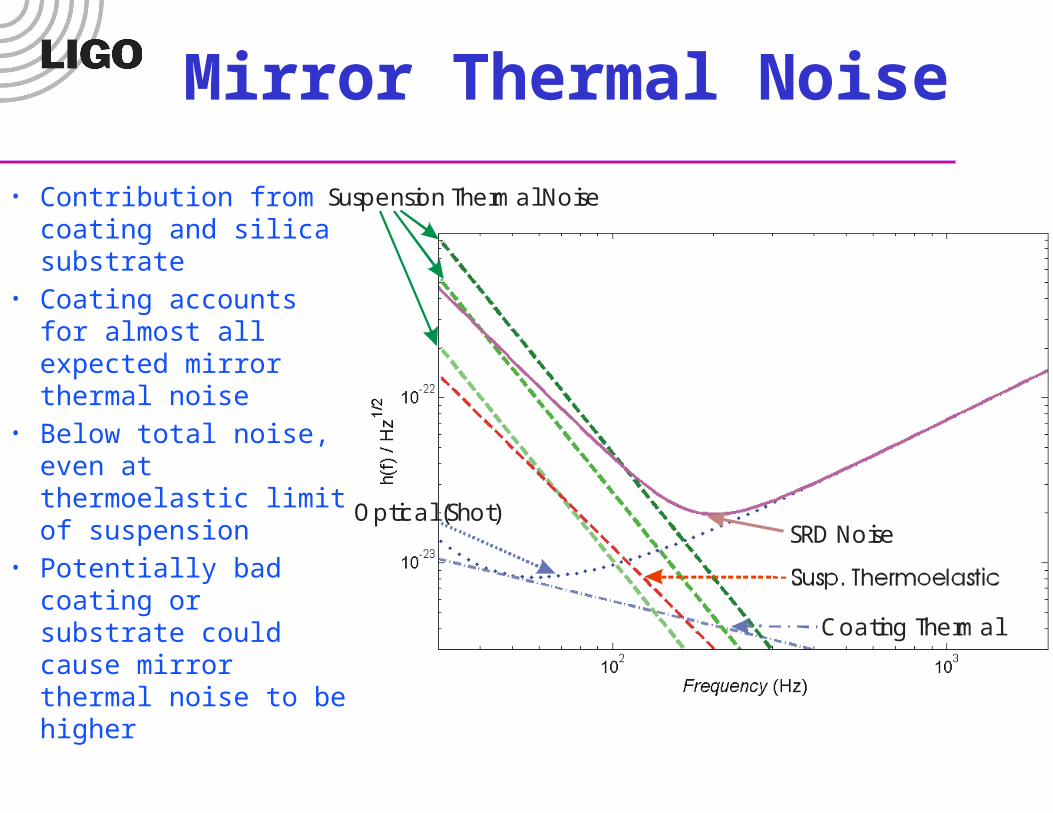
Mirror Thermal Noise
• Contribution from coating and silica substrate
• Coating accounts for almost all expected mirror thermal noise
• Below total noise, even at thermoelastic limit of suspension
• Potentially bad coating or substrate could cause mirror thermal noise to be higher
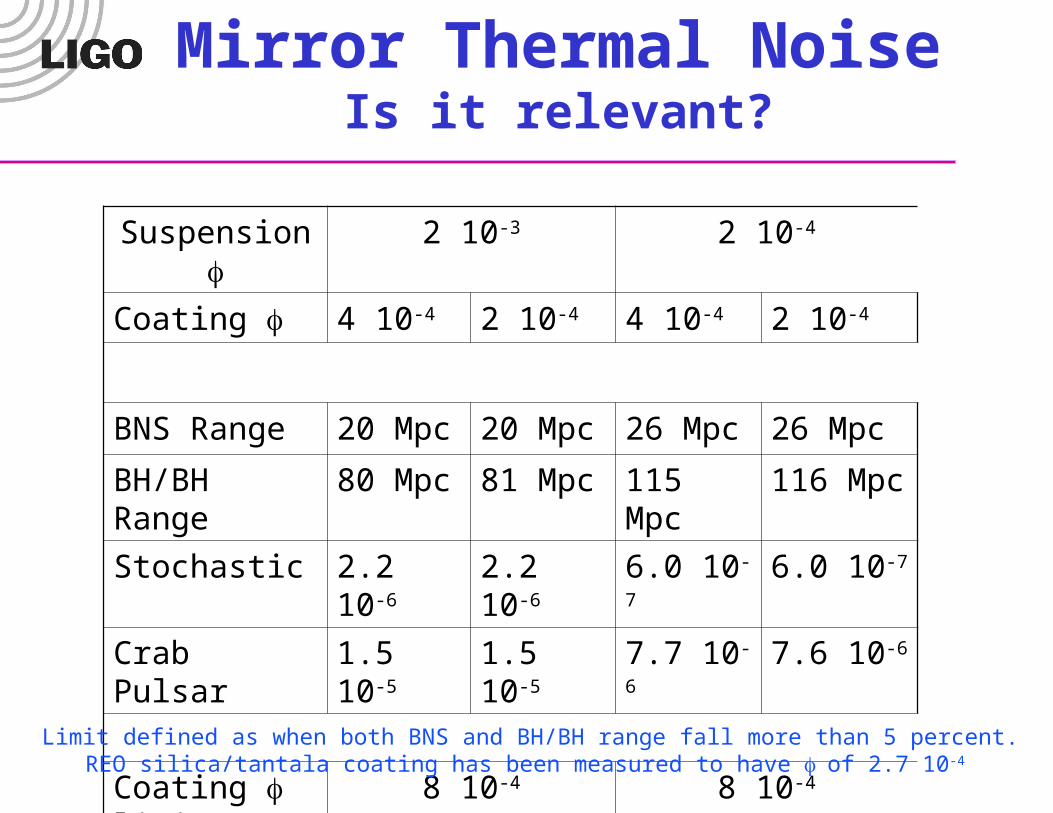
Mirror Thermal NoiseIs it relevant?
Suspension f 2 10-3 2 10-4
Coating f 4 10-4 2 10-4 4 10-4 2 10-4
BNS Range 20 Mpc 20 Mpc 26 Mpc 26 Mpc
BH/BH Range 80 Mpc 81 Mpc 115 Mpc 116 Mpc
Stochastic 2.2 10-6 2.2 10-6 6.0 10-7 6.0 10-7
Crab Pulsar 1.5 10-5 1.5 10-5 7.7 10-6 7.6 10-6
Coating f limit 8 10-4 8 10-4
Limit defined as when both BNS and BH/BH range fall more than 5 percent. REO silica/tantala coating has been measured to have fof 2.7 10-4
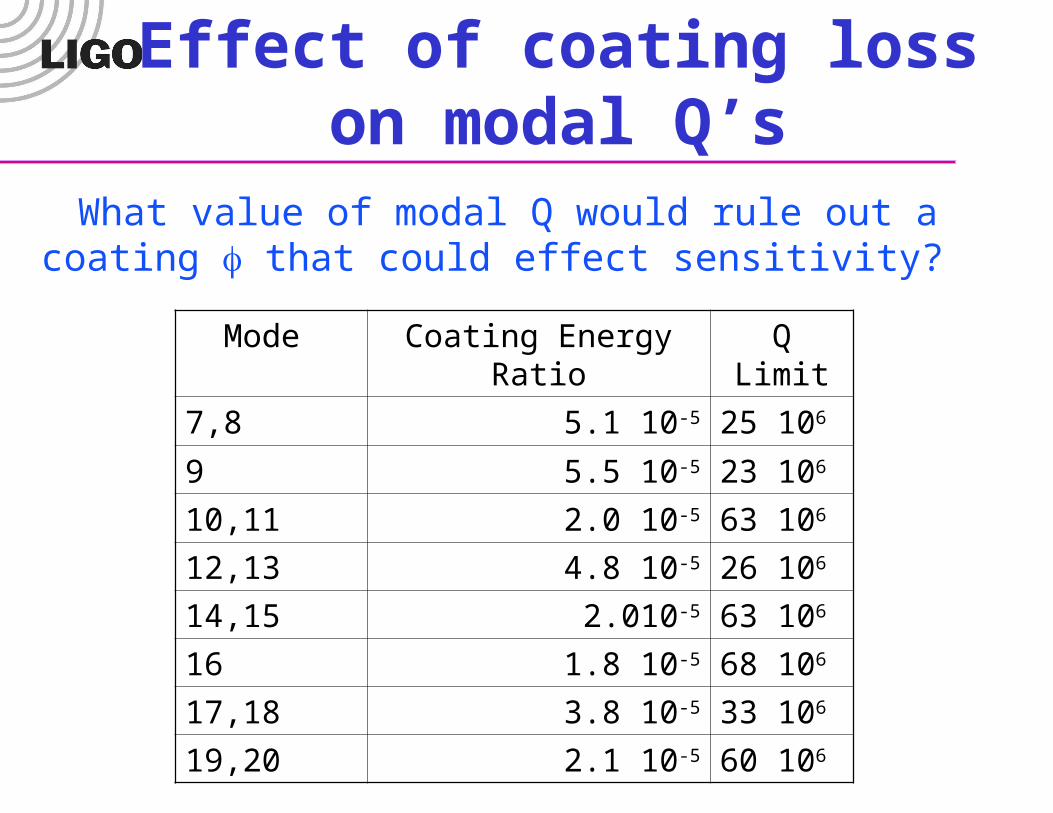
Effect of coating loss on modal Q’s
Mode Coating Energy Ratio Q Limit
7,8 5.1 10-5 25 106
9 5.5 10-5 23 106
10,11 2.0 10-5 63 106
12,13 4.8 10-5 26 106
14,15 2.010-5 63 106
16 1.8 10-5 68 106
17,18 3.8 10-5 33 106
19,20 2.1 10-5 60 106
What value of modal Q would rule out a coating f that could effect sensitivity?
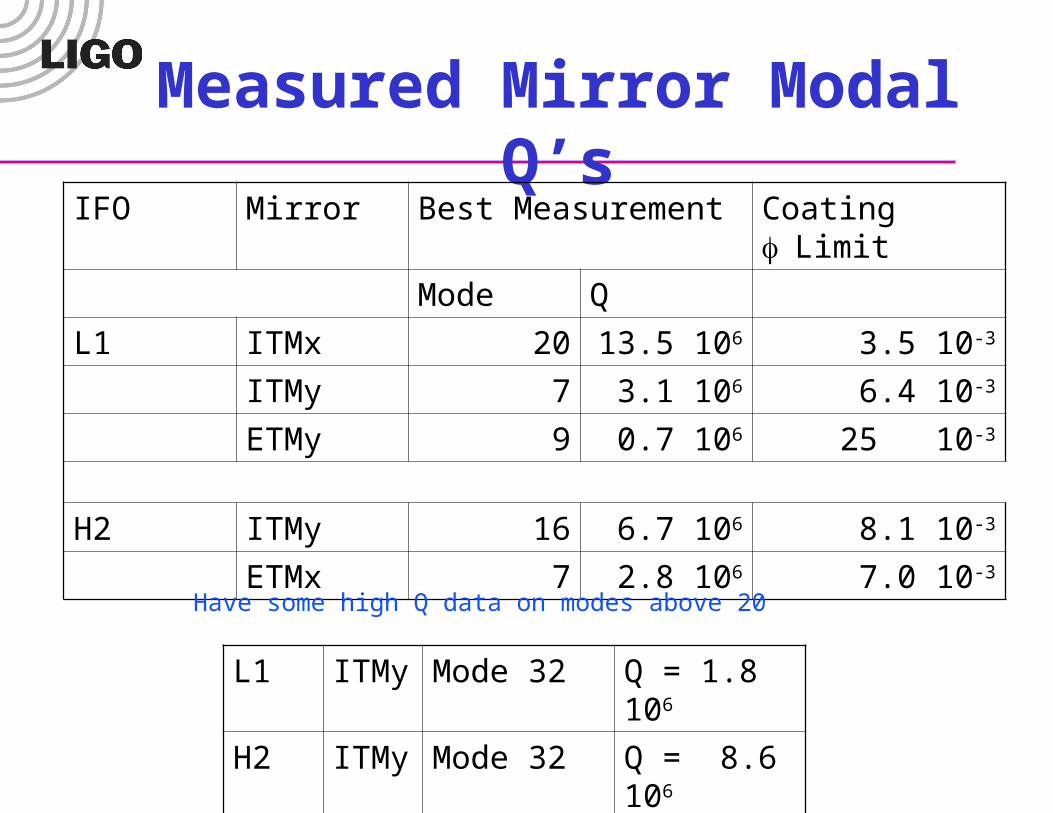
Measured Mirror Modal Q’s
IFO Mirror Best Measurement Coating fLimit
Mode Q
L1 ITMx 20 13.5 106 3.5 10-3
ITMy 7 3.1 106 6.4 10-3
ETMy 9 0.7 106 25 10-3
H2 ITMy 16 6.7 106 8.1 10-3
ETMx 7 2.8 106 7.0 10-3
L1 ITMy Mode 32 Q = 1.8 106
H2 ITMy Mode 32 Q = 8.6 106
H1 ITMx Mode ~110 Q = 27 106
Have some high Q data on modes above 20
Needed for Mirror Thermal Noise
• FEA models of energy distribution to higher mode number
• More Q’s Nothing on L1 ETMx, H1 ITMy, ETMx, ETMy, H2 ITMx, ETMy Very little on all H1 optics, H2 ETMx Little data on superpolished ETMs (L1 and H2)
• Perhaps some laboratory measurements of coated spare optics Need the extended FEA results before even considering Keep eye on lab results on scatter and absorption
• Probably not a problem, these measurements are not high priority
Conclusions
• Suspension thermal noise has a large impact on astrophysical performance
• Firm prediction of suspension thermal noise is still lacking• Need more information on violin mode losses
Current results are numerous but confusing No reason to believe suspension thermal noise will be above SRD, some
hope that it will be significantly below
• There are ways to reduce suspension thermal noise Some easier than others Some need more laboratory research
• Mirror thermal noise not as crucial a question Probably won’t limit sensitivity May want some more modal Q measurements to rule out