Embed Size (px)
DESCRIPTION
Document contains A case study of thermally rehabilitating Azuma House in Osaka Japan
Citation preview
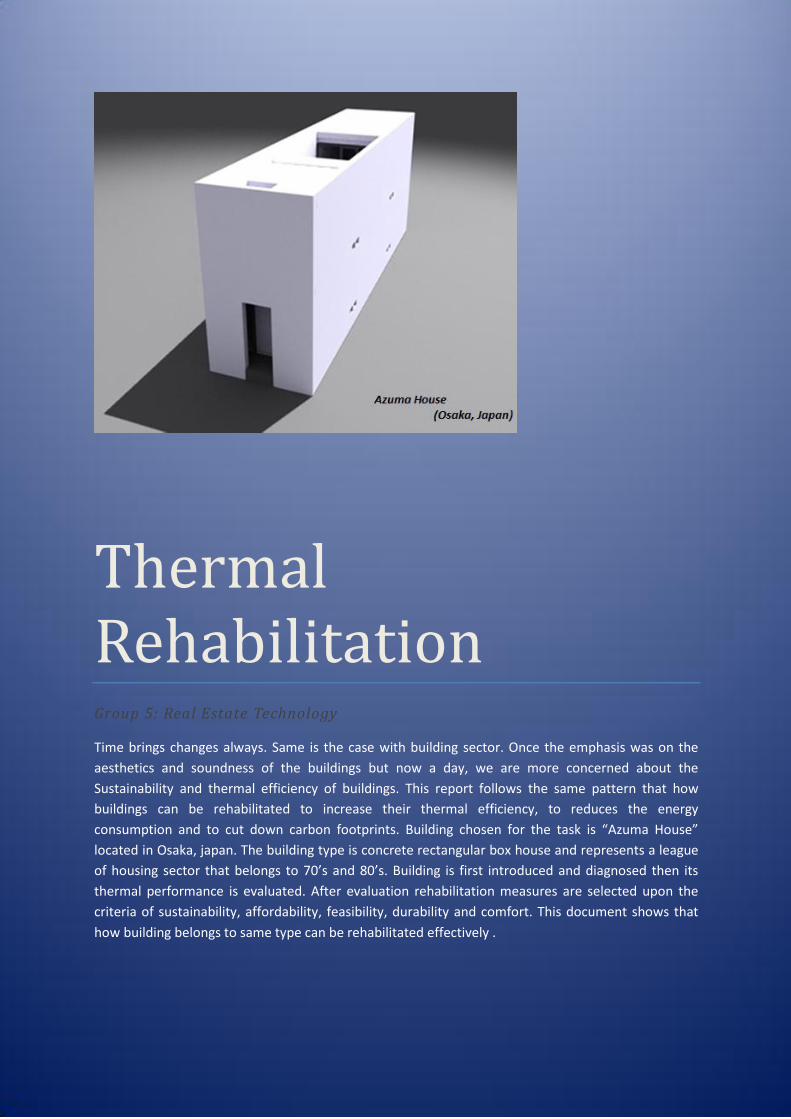
Thermal Rehabilitation Group 5: Real Estate Technology
Time brings changes always. Same is the case with building sector. Once the emphasis was on the
aesthetics and soundness of the buildings but now a day, we are more concerned about the
Sustainability and thermal efficiency of buildings. This report follows the same pattern that how
buildings can be rehabilitated to increase their thermal efficiency, to reduces the energy
consumption and to cut down carbon footprints. Building chosen for the task is “Azuma House”
located in Osaka, japan. The building type is concrete rectangular box house and represents a league
of housing sector that belongs to 70’s and 80’s. Building is first introduced and diagnosed then its
thermal performance is evaluated. After evaluation rehabilitation measures are selected upon the
criteria of sustainability, affordability, feasibility, durability and comfort. This document shows that
how building belongs to same type can be rehabilitated effectively .
1
TABLE OF CONTENTS
1. BUILDING’S INTRODUCTION AND DIAGNOSIS .................................................................... 3
1.1. Introduction of Building .......................................................................................................... 3
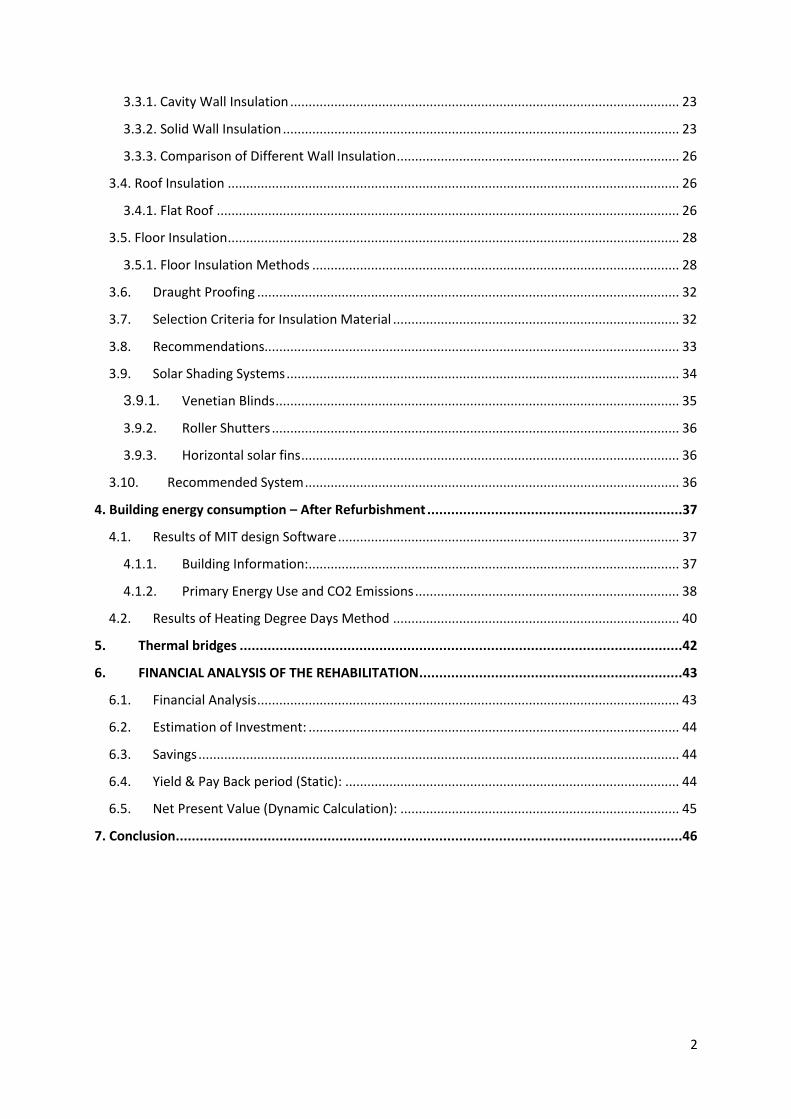
Situation in locality .......................................................................................................................... 4
Climate ............................................................................................................................................. 4
1.2. Building’s Detailed Description and Analysis .......................................................................... 5
1.3. Thermal flow study of Azuma House ...................................................................................... 6
2. Building Evaluation (w.r.t energy consumption and CO2 emission) – Before Rehabilitation ........ 7
2.1. Building energy codes .................................................................................................................. 7
2.2 Parameters to calculate Building Energy Consumption ................................................................ 8
2.3 The Calculation Method: ............................................................................................................. 10
2.3.1. Degree-day method ............................................................................................................. 10
2.3.2. Principle of the heating degree-day method: ..................................................................... 11
2.3.3. Heating degree days ............................................................................................................ 11
2.3.4. Calculation of U values ........................................................................................................ 13
2.3.5. Formula to calculate of the Heat Losses ............................................................................ 14
2.3.6. Formula to calculate of the Heating energy consumption .................................................. 14
2.4. Building simulation method for calculating the energy consumption ....................................... 15
2.4.1. MIT Design Advisor .............................................................................................................. 15
2.4.2. Weather Data ...................................................................................................................... 16
2.4.3. Calculations ......................................................................................................................... 16
2.4.3. Ventilation ........................................................................................................................... 17
2.4.4. Cooling Loads ....................................................................................................................... 17
2.4.5. Heating Loads ...................................................................................................................... 18
2.4.6. Building Envelope ................................................................................................................ 18
2.4.6.1. Roof .................................................................................................................................. 18
2.4.7. Energy Balance .................................................................................................................... 18
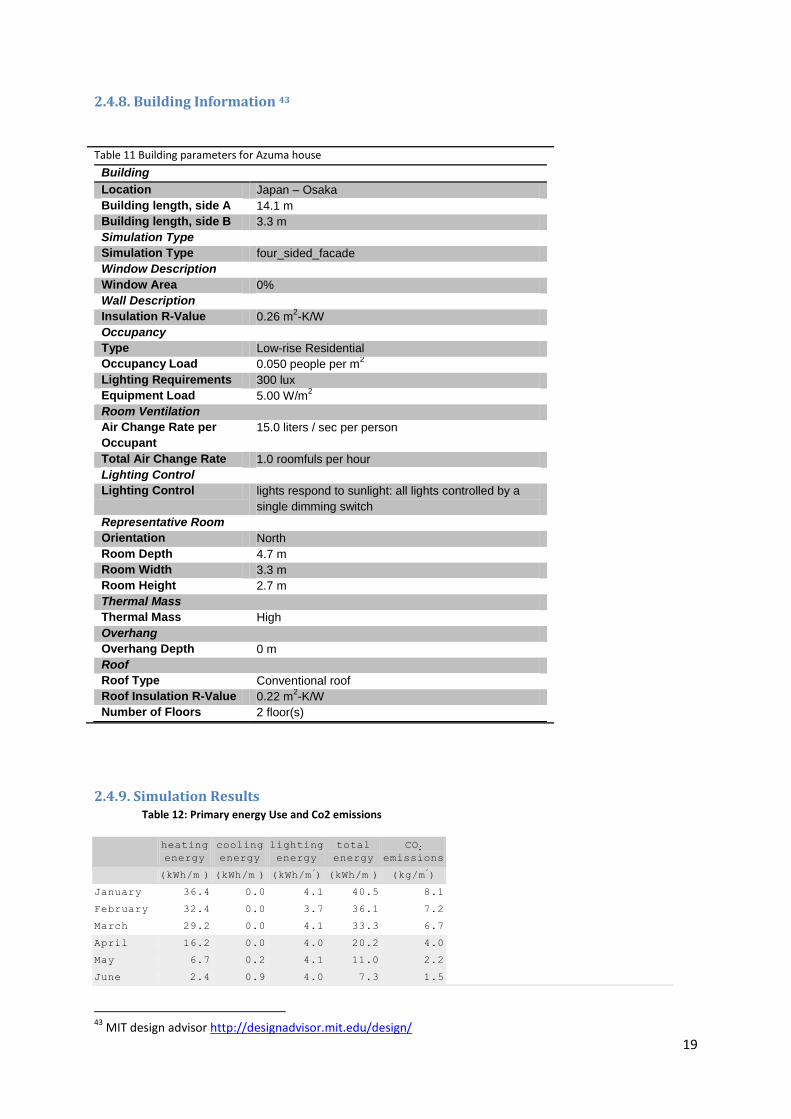
2.4.8. Building Information ........................................................................................................... 19
2.4.9. Simulation Results ............................................................................................................... 19
2.4.10. Energy ................................................................................................................................ 21
2.4.11. Life cycle Cost .................................................................................................................... 21
3. REHABILITATION MEASURES AND RECOMMENDATIONS ..........................................................22
3.1. Thermal Insulation ...................................................................................................................... 22
3.2. Insulation Target ......................................................................................................................... 22
3.3. Wall Insulation ............................................................................................................................ 23
2
3.3.1. Cavity Wall Insulation .......................................................................................................... 23
3.3.2. Solid Wall Insulation ............................................................................................................ 23
3.3.3. Comparison of Different Wall Insulation ............................................................................. 26
3.4. Roof Insulation ........................................................................................................................... 26
3.4.1. Flat Roof .............................................................................................................................. 26
3.5. Floor Insulation ........................................................................................................................... 28
3.5.1. Floor Insulation Methods .................................................................................................... 28
3.6. Draught Proofing ................................................................................................................... 32
3.7. Selection Criteria for Insulation Material .............................................................................. 32
3.8. Recommendations................................................................................................................. 33
3.9. Solar Shading Systems ........................................................................................................... 34
3.9.1. Venetian Blinds .............................................................................................................. 35
3.9.2. Roller Shutters ............................................................................................................... 36
3.9.3. Horizontal solar fins ....................................................................................................... 36
3.10. Recommended System ...................................................................................................... 36
4. Building energy consumption – After Refurbishment ................................................................37
4.1. Results of MIT design Software ............................................................................................. 37
4.1.1. Building Information: ..................................................................................................... 37
4.1.2. Primary Energy Use and CO2 Emissions ........................................................................ 38
4.2. Results of Heating Degree Days Method .............................................................................. 40
5. Thermal bridges ...............................................................................................................42
6. FINANCIAL ANALYSIS OF THE REHABILITATION ..................................................................43
6.1. Financial Analysis ................................................................................................................... 43
6.2. Estimation of Investment: ..................................................................................................... 44
6.3. Savings ................................................................................................................................... 44
6.4. Yield & Pay Back period (Static): ........................................................................................... 44
6.5. Net Present Value (Dynamic Calculation): ............................................................................ 45
7. Conclusion ...............................................................................................................................46
3
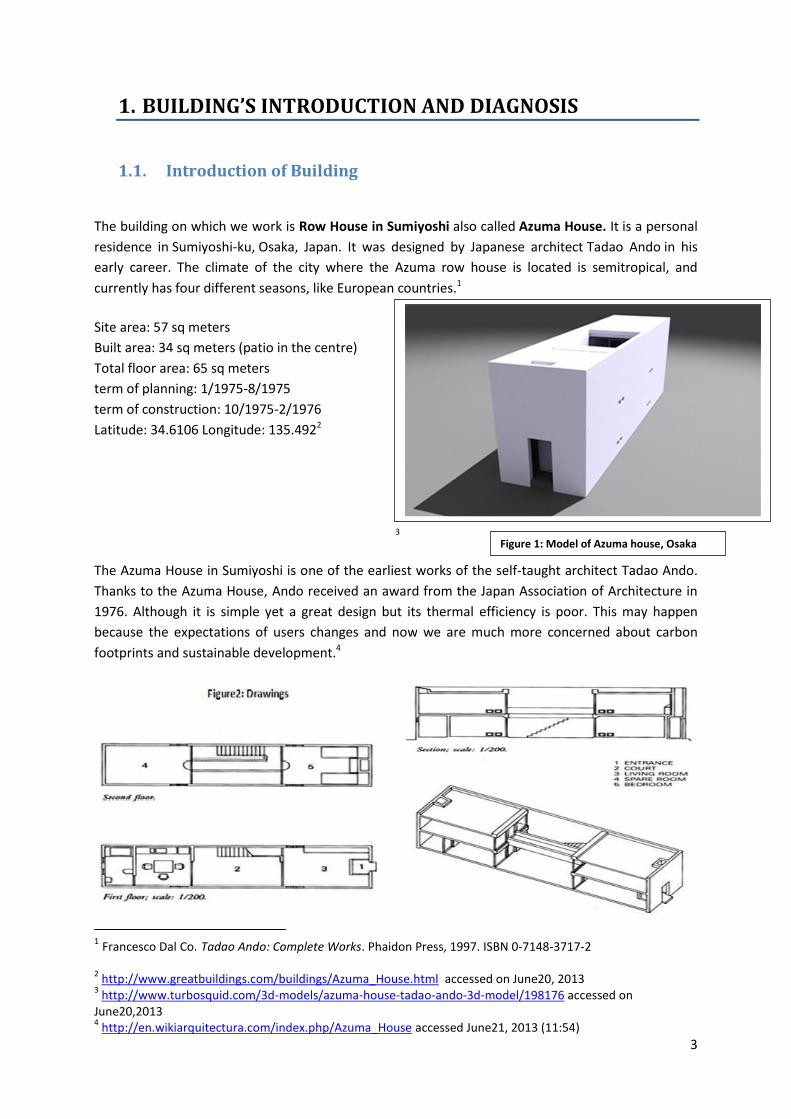
1. BUILDING’S INTRODUCTION AND DIAGNOSIS
1.1. Introduction of Building
The building on which we work is Row House in Sumiyoshi also called Azuma House. It is a personal
residence in Sumiyoshi-ku, Osaka, Japan. It was designed by Japanese architect Tadao Ando in his
early career. The climate of the city where the Azuma row house is located is semitropical, and
currently has four different seasons, like European countries.1
Site area: 57 sq meters
Built area: 34 sq meters (patio in the centre)
Total floor area: 65 sq meters
term of planning: 1/1975-8/1975
term of construction: 10/1975-2/1976
Latitude: 34.6106 Longitude: 135.4922
3
The Azuma House in Sumiyoshi is one of the earliest works of the self-taught architect Tadao Ando.
Thanks to the Azuma House, Ando received an award from the Japan Association of Architecture in
1976. Although it is simple yet a great design but its thermal efficiency is poor. This may happen
because the expectations of users changes and now we are much more concerned about carbon
footprints and sustainable development.4
1 Francesco Dal Co. Tadao Ando: Complete Works. Phaidon Press, 1997. ISBN 0-7148-3717-2
2 http://www.greatbuildings.com/buildings/Azuma_House.html accessed on June20, 2013
3 http://www.turbosquid.com/3d-models/azuma-house-tadao-ando-3d-model/198176 accessed on
June20,2013 4 http://en.wikiarquitectura.com/index.php/Azuma_House accessed June21, 2013 (11:54)
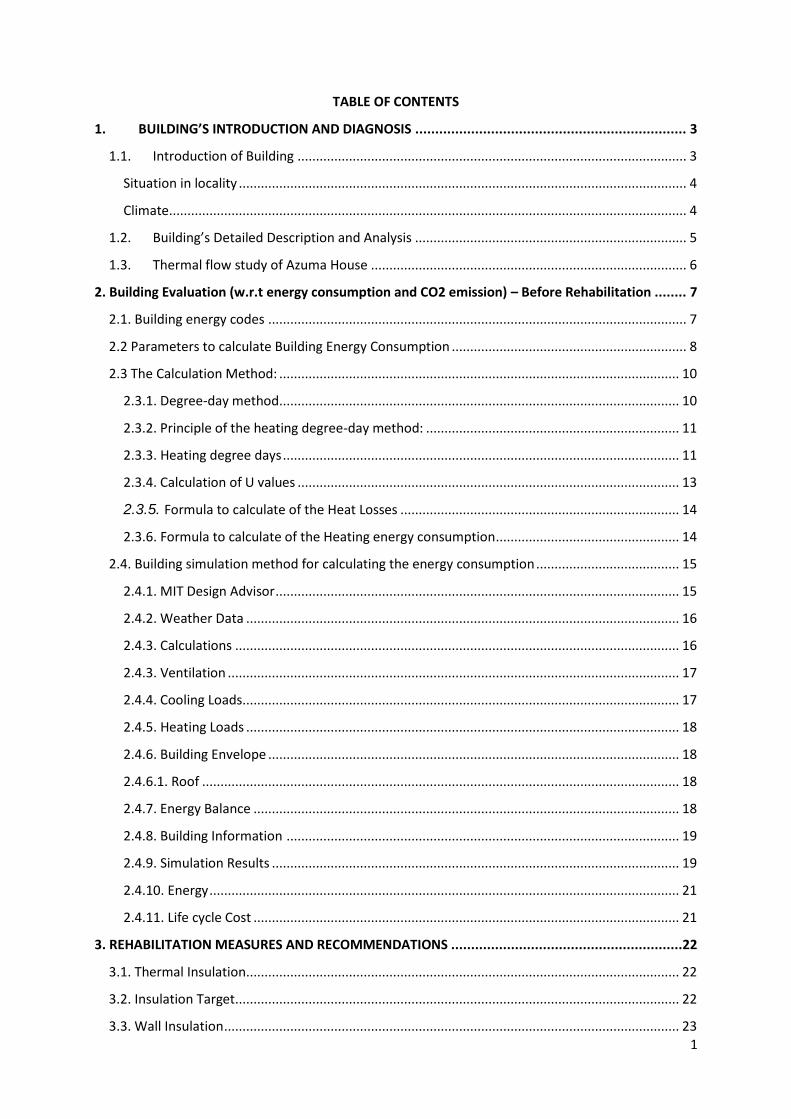
Figure 1: Model of Azuma house, Osaka
4
Situation in locality
Azuma house changed the trend in the locality, where wooden houses were found all around. While
this area is not the most chaotic of the city, there is a clear contrast between this "concrete box" and
its surrounding buildings.5
Climate
Osaka belongs to a semi-tropical zone and has a gift of four seasons. Its winters are generally mild,
having an average high of 9.3 °C (49 °F) and average low of 2.5 °C (36.5 °F)6 and with January being
the coldest month. Snowfall is a rare thing in Osaka. Spring in Osaka starts off mild, but ends up being
hot and humid. It also tends to be Osaka’s wettest season, with the Tsuyu or rainy season occurring
between late May and early July. Summers are very hot and humid. In the months of July and August,
the average daily high temperature approaches 35 °C (95 °F), while average night time temperatures
typically moves around 25 °C (77 °F). Fall in Osaka sees a cooling trend, with the early part of the
season resembling summer while the latter part of fall resembles winter.7
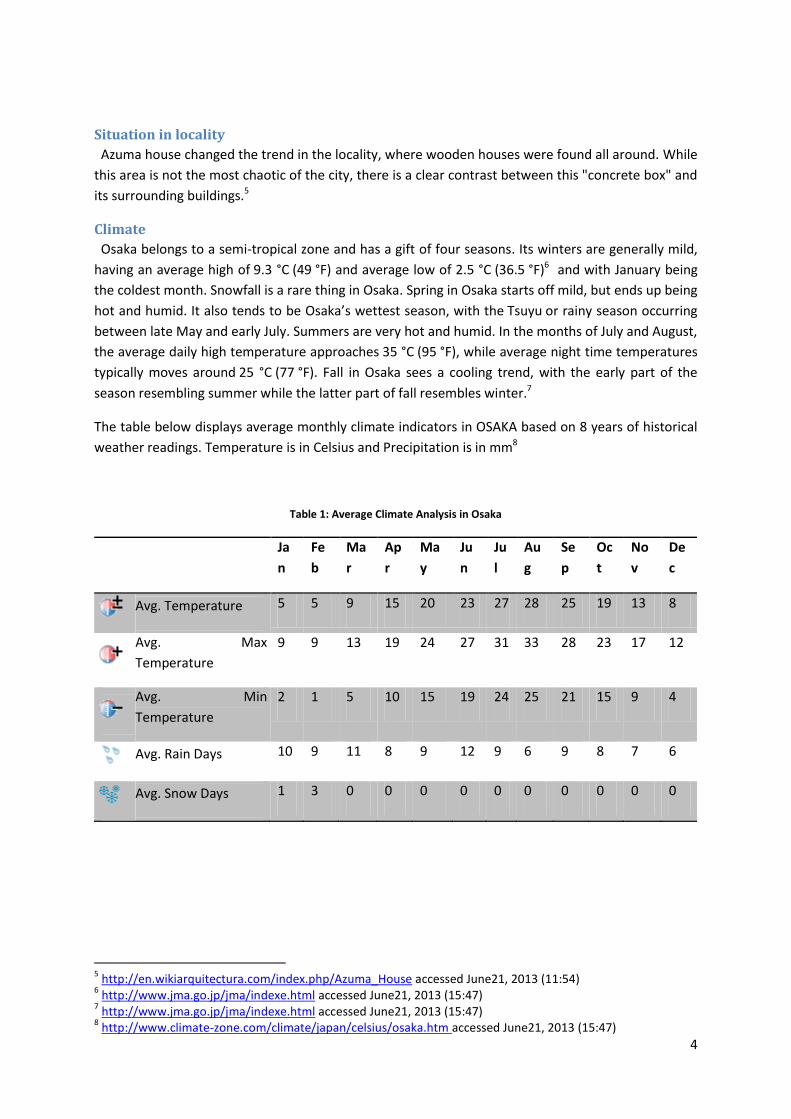
The table below displays average monthly climate indicators in OSAKA based on 8 years of historical
weather readings. Temperature is in Celsius and Precipitation is in mm8
Table 1: Average Climate Analysis in Osaka
Ja
n
Fe
b
Ma
r
Ap
r
Ma
y
Ju
n
Ju
l
Au
g
Se
p
Oc
t
No
v
De
c
Avg. Temperature
5 5 9 15 20 23 27 28 25 19 13 8
Avg. Max
Temperature
9 9 13 19 24 27 31 33 28 23 17 12
Avg. Min
Temperature
2 1 5 10 15 19 24 25 21 15 9 4
Avg. Rain Days
10 9 11 8 9 12 9 6 9 8 7 6
Avg. Snow Days
1 3 0 0 0 0 0 0 0 0 0 0
5 http://en.wikiarquitectura.com/index.php/Azuma_House accessed June21, 2013 (11:54)
6 http://www.jma.go.jp/jma/indexe.html accessed June21, 2013 (15:47)
7 http://www.jma.go.jp/jma/indexe.html accessed June21, 2013 (15:47)
8 http://www.climate-zone.com/climate/japan/celsius/osaka.htm accessed June21, 2013 (15:47)
5
1.2. Building’s Detailed Description and Analysis
Azuma house is built on a plot of 57.3 m². The total floor area of 64.7 m² is
divided into three equal sections: two floors and a patio yet the concrete box
occupy the entire site. On the ground floor, we have living room, kitchen &
bathroom separated by the central outside courtyard and the staircase that leads
to the upper floor, where the two bedrooms are joined by a walkway. The central
uncovered area is the only source of natural light throughout the house.9
On ground floor, courtyard separates the living room located at one end of the
ground floor from the kitchen-dining room and bathroom on the other end. On
the top floor, the children's rooms on one side face the master bedroom on the
other side of the central courtyard, which is reached by a bridge. The building
shows a blind or solid facade to the street10
Centralizing the building around courtyard makes it an integral part of
circulation and the focus of everyday life and there is no way to cross to either
side of the house without passing through open air courtyard. By this way,
occupants experience the nature every single day even if they stay within the
home all day11.
The building envelope of the Azuma Row House is simple and uniform, a. Apart
from its inward facing glass walls and minimal wood finish, the majority of the
envelope is cast concrete, which has a very high specific heat capacity (0.880
J/(gK)), and therefore capable of absorbing a lot of heat energy. This trait affects
the heating and cooling of the interior and courtyard in various ways.12
Constantly exposed to the sun, the concrete and stone slabs receive heat energy
from the sun’s direct radiation, diffused sky radiation, and any rays reflected off
of surrounding buildings. They cannot easily conduct or release this energy and
stores it throughout the day, gradually increasing in temperature. The ground can
retain a large amount of heat for hours, which can make standing in that space
uncomfortable. Also since hot air molecules rise, the air will be overheated and
uncomfortable as well. This is a greater concern in the summer time when
exposure and temperatures are high. Furthermore, by placing the exterior space
at the centre of the row house the building envelope’s surface area almost
doubles, which can be a crucial matter for envelope dominated structures.13
9 http://en.wikiarquitectura.com/index.php/Azuma_House accessed June21, 2013 (11:54)
10 http://en.wikiarquitectura.com/index.php/Azuma_House accessed June21, 2013 (11:54)
11 http://contrahabit.wordpress.com/2011/11/09/azuma-row-house-by-tadao-ando-designing-architecture-to-
purposefully-make-people-feel-uncomfortable/ accessed June21, 2013 (23:10) 12
http://contrahabit.wordpress.com/2011/11/09/azuma-row-house-by-tadao-ando-designing-architecture-to-purposefully-make-people-feel-uncomfortable/ accessed June21, 2013 (23:10) 13
http://contrahabit.wordpress.com/2011/11/09/azuma-row-house-by-tadao-ando-designing-architecture-to-purposefully-make-people-feel-uncomfortable/ accessed June21, 2013 (23:10)
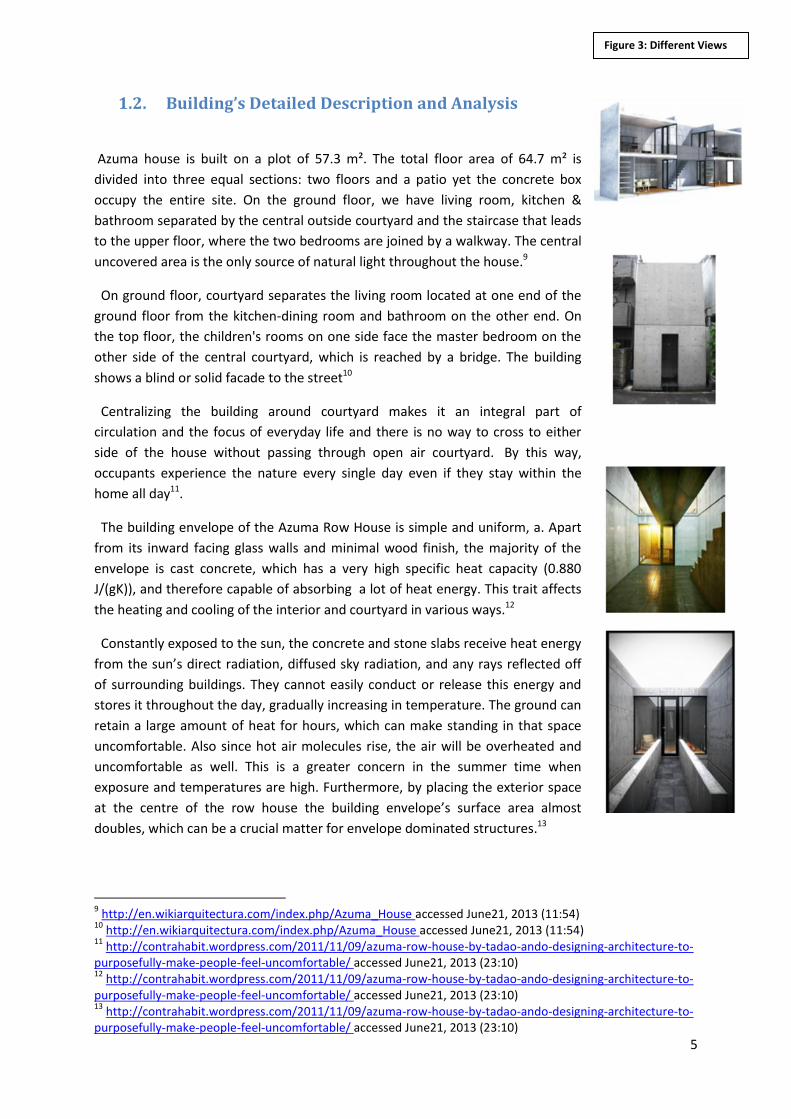
Figure 3: Different Views
6
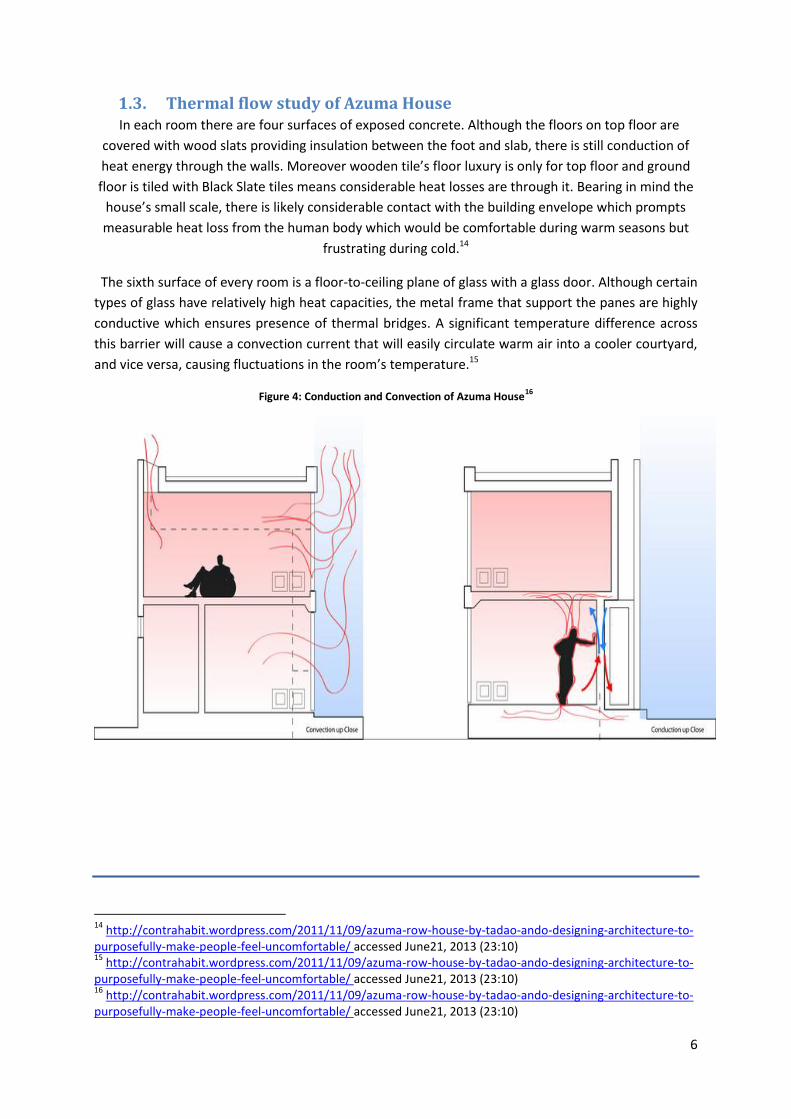
1.3. Thermal flow study of Azuma House In each room there are four surfaces of exposed concrete. Although the floors on top floor are
covered with wood slats providing insulation between the foot and slab, there is still conduction of
heat energy through the walls. Moreover wooden tile’s floor luxury is only for top floor and ground
floor is tiled with Black Slate tiles means considerable heat losses are through it. Bearing in mind the
house’s small scale, there is likely considerable contact with the building envelope which prompts
measurable heat loss from the human body which would be comfortable during warm seasons but
frustrating during cold.14
The sixth surface of every room is a floor-to-ceiling plane of glass with a glass door. Although certain
types of glass have relatively high heat capacities, the metal frame that support the panes are highly
conductive which ensures presence of thermal bridges. A significant temperature difference across
this barrier will cause a convection current that will easily circulate warm air into a cooler courtyard,
and vice versa, causing fluctuations in the room’s temperature.15
Figure 4: Conduction and Convection of Azuma House16
14
http://contrahabit.wordpress.com/2011/11/09/azuma-row-house-by-tadao-ando-designing-architecture-to-purposefully-make-people-feel-uncomfortable/ accessed June21, 2013 (23:10) 15
http://contrahabit.wordpress.com/2011/11/09/azuma-row-house-by-tadao-ando-designing-architecture-to-purposefully-make-people-feel-uncomfortable/ accessed June21, 2013 (23:10) 16
http://contrahabit.wordpress.com/2011/11/09/azuma-row-house-by-tadao-ando-designing-architecture-to-purposefully-make-people-feel-uncomfortable/ accessed June21, 2013 (23:10)
7
2. Building Evaluation (w.r.t energy consumption and CO2 emission) – Before Rehabilitation
2.1. Building energy codes
Japan has two building energy codes for residential buildings or houses (Table 1). The prescriptive-
based Design and Construction Guidelines on the Rationalization of Energy Use for Houses (1999), or
DCGREUH, includes insulation of the building envelope, HVAC, water heating, and the other one is
The Criteria for Clients on the Rationalization of Energy Use for Houses (1999), or CCREUH, a mixture
of performance and prescriptive-based building energy codes, has a heavy focus on HVAC. It also
provides performance-based yearly heating and cooling loads by building type.17
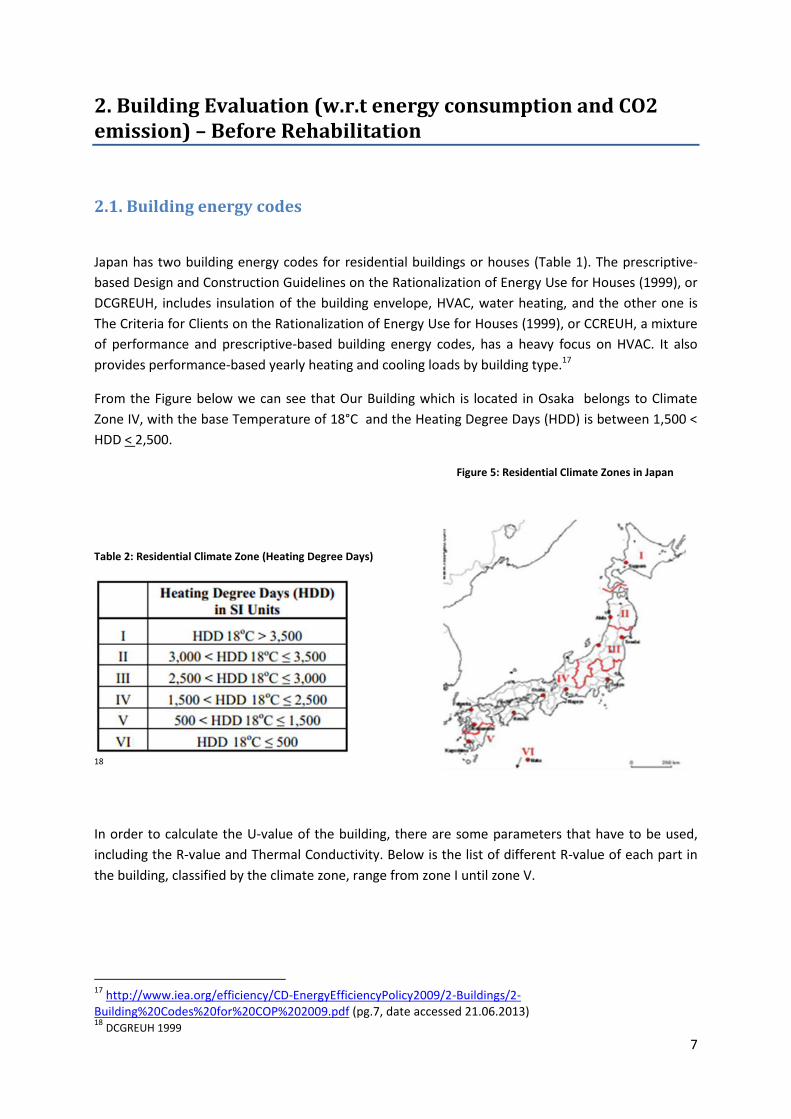
From the Figure below we can see that Our Building which is located in Osaka belongs to Climate
Zone IV, with the base Temperature of 18°C and the Heating Degree Days (HDD) is between 1,500 <
HDD < 2,500.
Table 2: Residential Climate Zone (Heating Degree Days)
18
In order to calculate the U-value of the building, there are some parameters that have to be used,
including the R-value and Thermal Conductivity. Below is the list of different R-value of each part in
the building, classified by the climate zone, range from zone I until zone V.
17
http://www.iea.org/efficiency/CD-EnergyEfficiencyPolicy2009/2-Buildings/2-Building%20Codes%20for%20COP%202009.pdf (pg.7, date accessed 21.06.2013) 18
DCGREUH 1999
Figure 5: Residential Climate Zones in Japan
8
2.2 Parameters to calculate Building Energy Consumption
There are different technical parameters that are needed to calculate the energy consumption,
specifically the heating consumption, and here are the followings:
Thermal Conductivity (λ or k-value): In simple terms this is a measure of the capacity of a
material to conduct heat through its mass. Different insulating materials and other types of
material have specific thermal conductivity values that can be used to measure their
insulating effectiveness.19
Thermal Conductance: the amount of heat (in kcal) conducted in one hour through 1 m2 of
material, with a thickness of 1 m, when the temperature drop through the material under
conditions of steady heat flow is 1 °C.20
Thermal resistance (R-value): The R-value can be defined in simple terms as the resistance
that any specific material offers to the heat flow. A good insulation material will have a high
R-value.
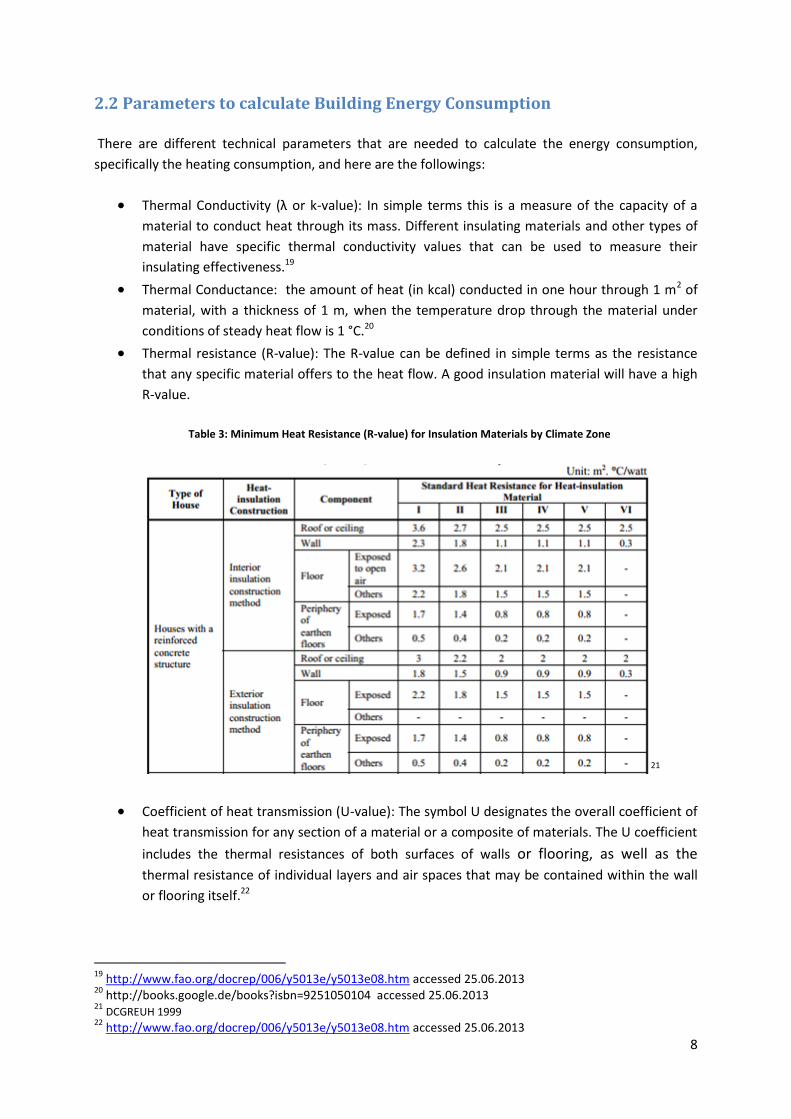
Table 3: Minimum Heat Resistance (R-value) for Insulation Materials by Climate Zone
21
Coefficient of heat transmission (U-value): The symbol U designates the overall coefficient of
heat transmission for any section of a material or a composite of materials. The U coefficient
includes the thermal resistances of both surfaces of walls or flooring, as well as the
thermal resistance of individual layers and air spaces that may be contained within the wall
or flooring itself.22
19
http://www.fao.org/docrep/006/y5013e/y5013e08.htm accessed 25.06.2013 20
http://books.google.de/books?isbn=9251050104 accessed 25.06.2013 21
DCGREUH 1999 22
http://www.fao.org/docrep/006/y5013e/y5013e08.htm accessed 25.06.2013
9
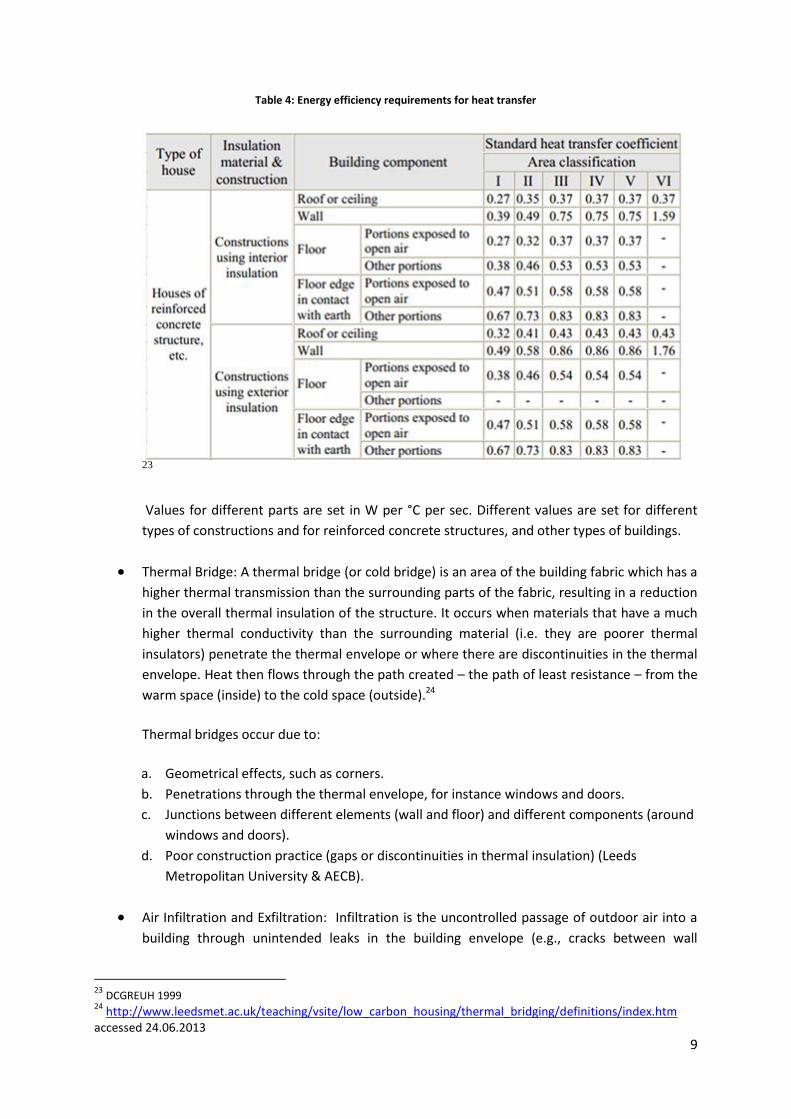
Table 4: Energy efficiency requirements for heat transfer
23
Values for different parts are set in W per °C per sec. Different values are set for different
types of constructions and for reinforced concrete structures, and other types of buildings.
Thermal Bridge: A thermal bridge (or cold bridge) is an area of the building fabric which has a
higher thermal transmission than the surrounding parts of the fabric, resulting in a reduction
in the overall thermal insulation of the structure. It occurs when materials that have a much
higher thermal conductivity than the surrounding material (i.e. they are poorer thermal
insulators) penetrate the thermal envelope or where there are discontinuities in the thermal
envelope. Heat then flows through the path created – the path of least resistance – from the
warm space (inside) to the cold space (outside).24
Thermal bridges occur due to:
a. Geometrical effects, such as corners.
b. Penetrations through the thermal envelope, for instance windows and doors.
c. Junctions between different elements (wall and floor) and different components (around
windows and doors).
d. Poor construction practice (gaps or discontinuities in thermal insulation) (Leeds
Metropolitan University & AECB).
Air Infiltration and Exfiltration: Infiltration is the uncontrolled passage of outdoor air into a
building through unintended leaks in the building envelope (e.g., cracks between wall
23
DCGREUH 1999 24
http://www.leedsmet.ac.uk/teaching/vsite/low_carbon_housing/thermal_bridging/definitions/index.htm accessed 24.06.2013
10
sections, wall-floor connections, corners, the roof-wall interface, around windows and
doors). Exfiltration is the opposite process.25
2.3 The Calculation Method:
In the following section we will describe two methods of calculating the Building Energy
consumptions. The first method will be based on the heating degree days, and the second method
will be simulated by a building energy simulation software, which is developed by Graduate’s
research of Massachusetts Institute of Technology, Boston, United States of America. First of all,
there are several aspects that have to be included when we want to calculate the whole building
energy consumption, and here are the ensuing aspects:
a. Thermal characteristics of the building (shell and interior partitions, etc.) and these
characteristics also include air-tightness
b. heating installation and hot water supply, including their insulation characteristics
c. ventilation
d. air-conditioning installation
e. built-in lighting installation (mainly the non-residential sector)
f. position and orientation of buildings, including outdoor climate
g. passive solar systems and solar protection
h. natural ventilation
i. Indoor climatic conditions, including the design indoor climate
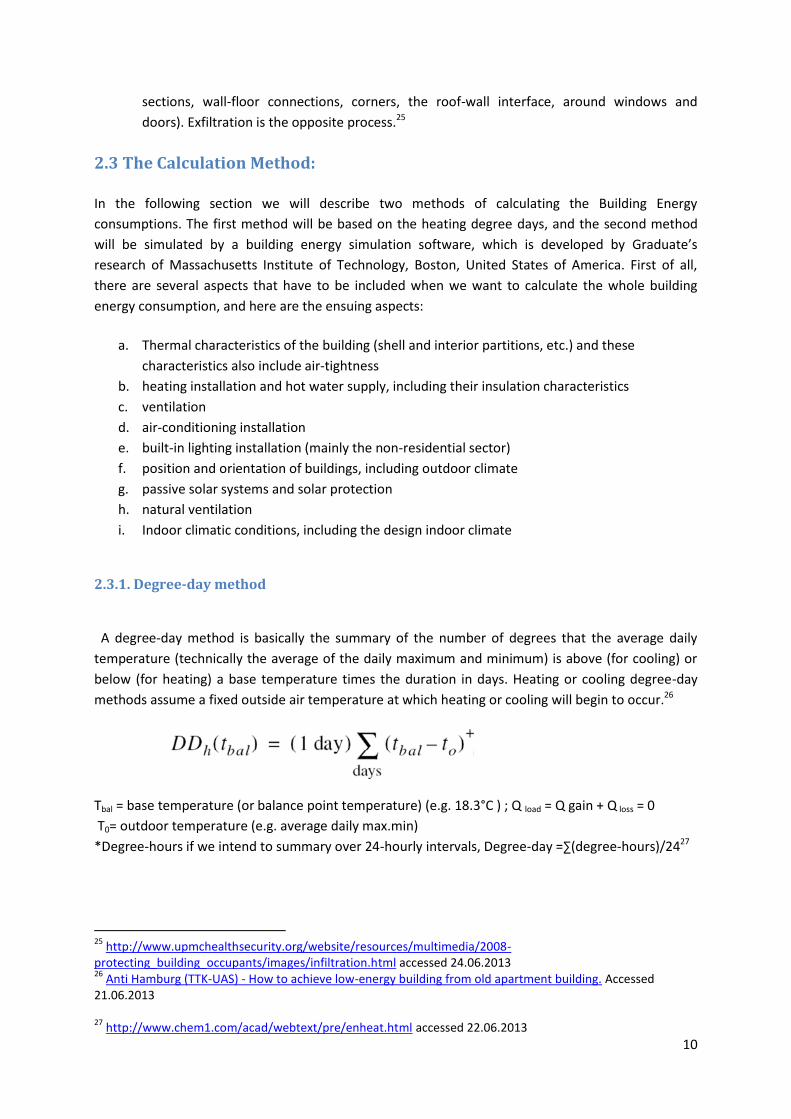
2.3.1. Degree-day method
A degree-day method is basically the summary of the number of degrees that the average daily
temperature (technically the average of the daily maximum and minimum) is above (for cooling) or
below (for heating) a base temperature times the duration in days. Heating or cooling degree-day
methods assume a fixed outside air temperature at which heating or cooling will begin to occur.26
Tbal = base temperature (or balance point temperature) (e.g. 18.3°C ) ; Q load = Q gain + Q loss = 0
T0= outdoor temperature (e.g. average daily max.min)
*Degree-hours if we intend to summary over 24-hourly intervals, Degree-day =∑(degree-hours)/2427
25
http://www.upmchealthsecurity.org/website/resources/multimedia/2008-protecting_building_occupants/images/infiltration.html accessed 24.06.2013 26
Anti Hamburg (TTK-UAS) - How to achieve low-energy building from old apartment building. Accessed 21.06.2013 27
http://www.chem1.com/acad/webtext/pre/enheat.html accessed 22.06.2013
11
2.3.2. Principle of the heating degree-day method:
Heat losses for heat emission and control of the indoor temperature in a building depend on:
• the building energy need for space heating (building thermal properties and the indoor as
well outdoor climate)
• non-uniform internal temperature distribution in each thermal zone (differences between air
temperature and mean radiant temperature)
• Emitters embedded in the building structure towards the outside or unheated spaces
• control of the operative temperature (local, central, set-back , thermal mass, etc)
• auxiliary consumption28
The calculation of emission losses shall take into account:
• energy interaction between type of emitters (radiator, convector, floor/wall/ceiling heating
systems) and space
• type of room/zone thermal control strategy and equipment (thermostatic valve, P, PI, PID
control) and their capability to reduce the temperature variations and drift;
• Position and characteristics of emitters. 29
Based on these data, the following output parameters for the heat emission sub-system, including
control, shall be calculated:
— total emission system heat losses;
— Auxiliary energy consumption;
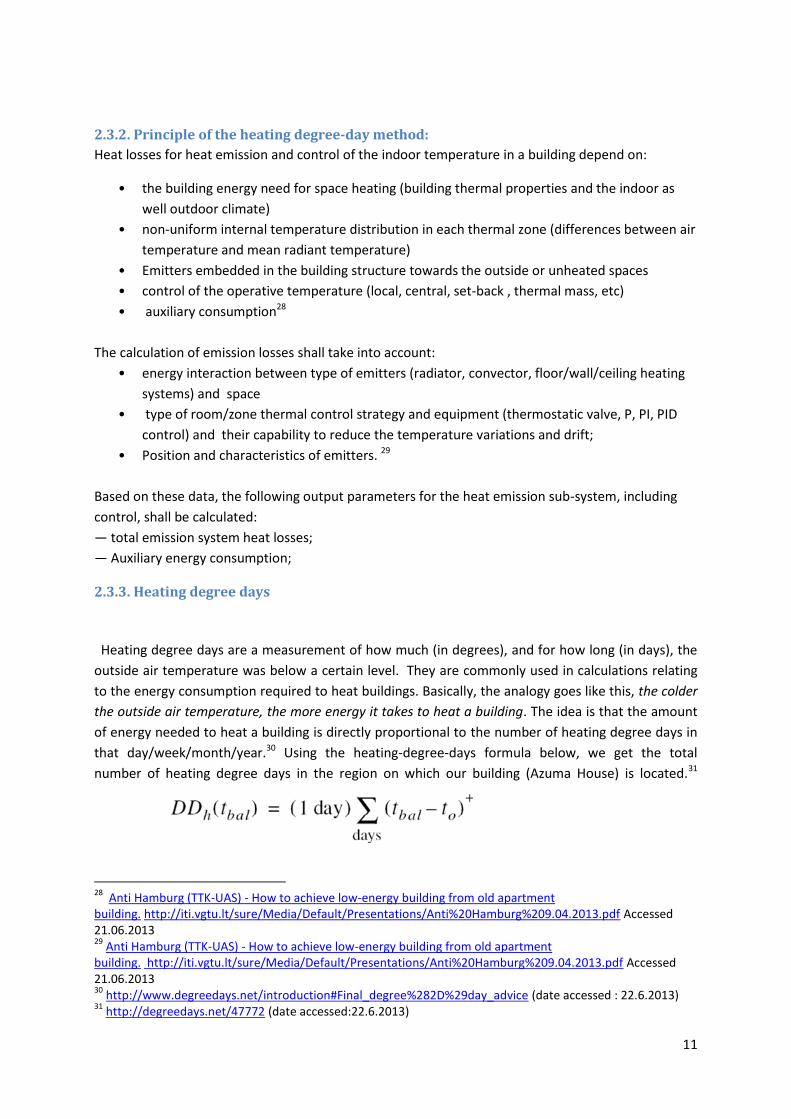
2.3.3. Heating degree days
Heating degree days are a measurement of how much (in degrees), and for how long (in days), the
outside air temperature was below a certain level. They are commonly used in calculations relating
to the energy consumption required to heat buildings. Basically, the analogy goes like this, the colder
the outside air temperature, the more energy it takes to heat a building. The idea is that the amount
of energy needed to heat a building is directly proportional to the number of heating degree days in
that day/week/month/year.30 Using the heating-degree-days formula below, we get the total
number of heating degree days in the region on which our building (Azuma House) is located.31
28
Anti Hamburg (TTK-UAS) - How to achieve low-energy building from old apartment building. http://iti.vgtu.lt/sure/Media/Default/Presentations/Anti%20Hamburg%209.04.2013.pdf Accessed 21.06.2013 29
Anti Hamburg (TTK-UAS) - How to achieve low-energy building from old apartment building. http://iti.vgtu.lt/sure/Media/Default/Presentations/Anti%20Hamburg%209.04.2013.pdf Accessed 21.06.2013 30
http://www.degreedays.net/introduction#Final_degree%282D%29day_advice (date accessed : 22.6.2013) 31
http://degreedays.net/47772 (date accessed:22.6.2013)
12
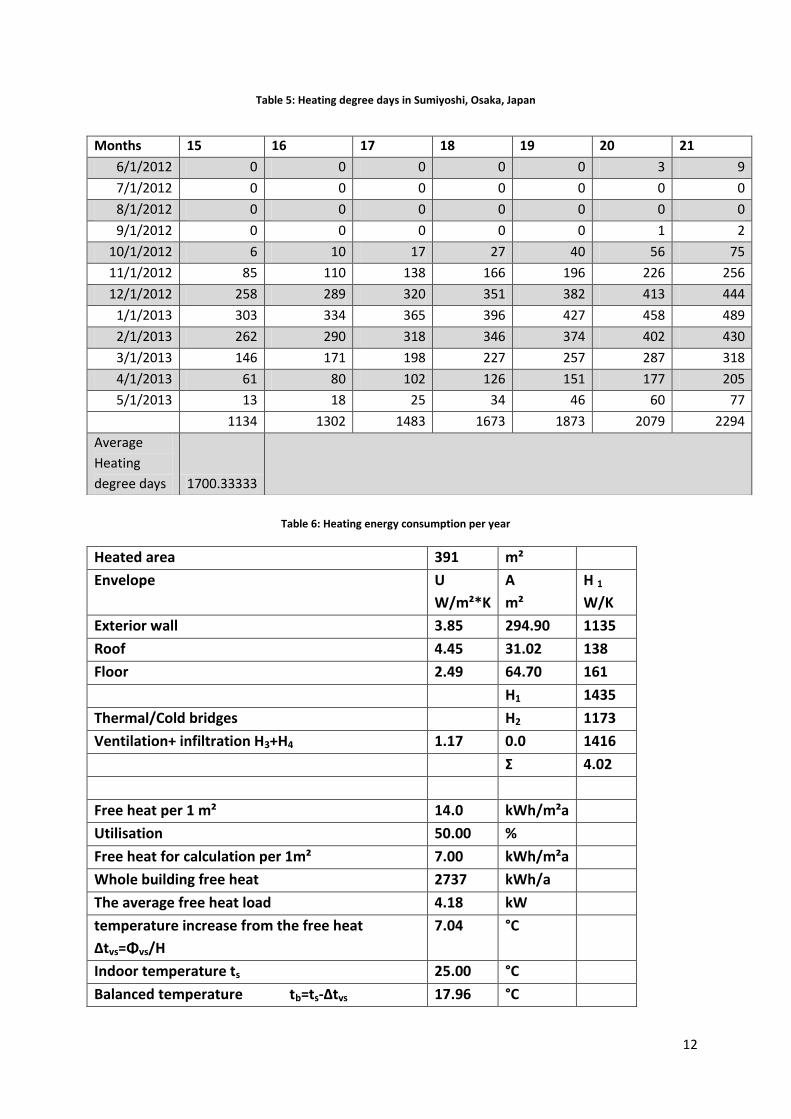
Table 5: Heating degree days in Sumiyoshi, Osaka, Japan
Table 6: Heating energy consumption per year
Heated area 391 m²
Envelope U
W/m²*K
A
m²
H 1
W/K
Exterior wall 3.85 294.90 1135
Roof 4.45 31.02 138
Floor 2.49 64.70 161
H1 1435
Thermal/Cold bridges H2 1173
Ventilation+ infiltration H3+H4 1.17 0.0 1416
Σ 4.02
Free heat per 1 m² 14.0 kWh/m²a
Utilisation 50.00 %
Free heat for calculation per 1m² 7.00 kWh/m²a
Whole building free heat 2737 kWh/a
The average free heat load 4.18 kW
temperature increase from the free heat
Δtvs=Φvs/H
7.04 °C
Indoor temperature ts 25.00 °C
Balanced temperature tb=ts-Δtvs 17.96 °C
Months 15 16 17 18 19 20 21
6/1/2012 0 0 0 0 0 3 9
7/1/2012 0 0 0 0 0 0 0
8/1/2012 0 0 0 0 0 0 0
9/1/2012 0 0 0 0 0 1 2
10/1/2012 6 10 17 27 40 56 75
11/1/2012 85 110 138 166 196 226 256
12/1/2012 258 289 320 351 382 413 444
1/1/2013 303 334 365 396 427 458 489
2/1/2013 262 290 318 346 374 402 430
3/1/2013 146 171 198 227 257 287 318
4/1/2013 61 80 102 126 151 177 205
5/1/2013 13 18 25 34 46 60 77
1134 1302 1483 1673 1873 2079 2294
Average
Heating
degree days 1700.33333
13
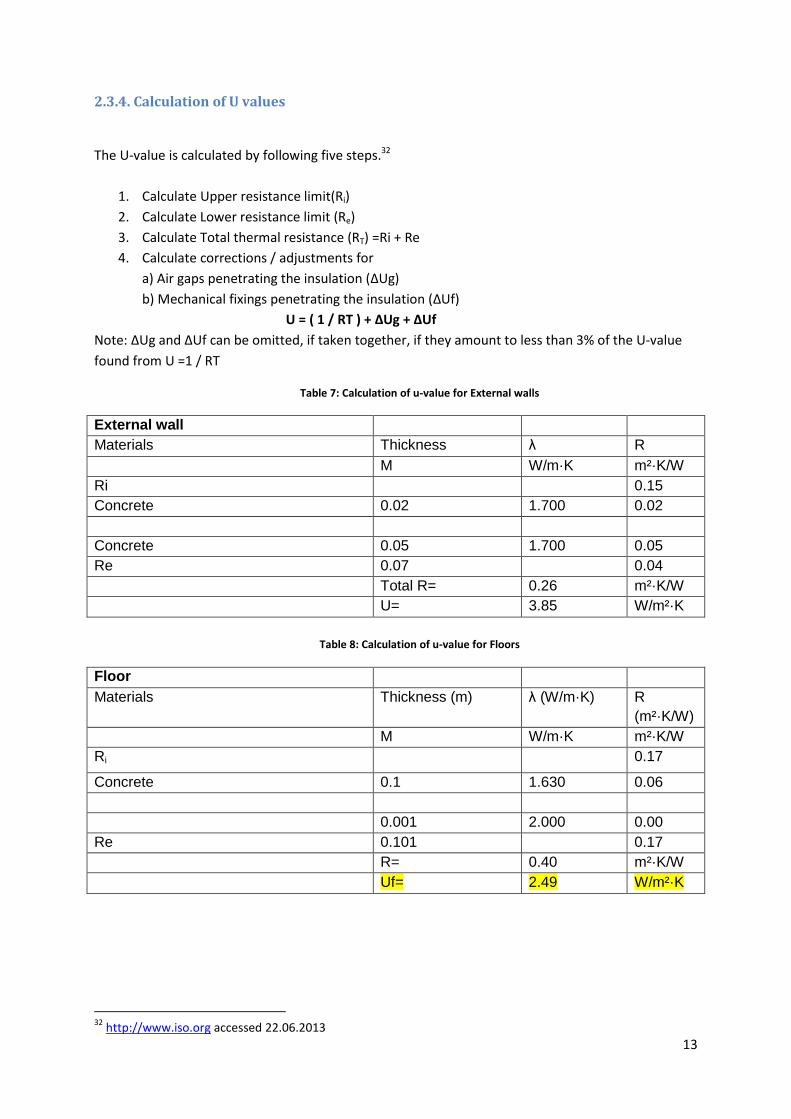
2.3.4. Calculation of U values
The U-value is calculated by following five steps.32
1. Calculate Upper resistance limit(Ri)
2. Calculate Lower resistance limit (Re)
3. Calculate Total thermal resistance (RT) =Ri + Re
4. Calculate corrections / adjustments for
a) Air gaps penetrating the insulation (ΔUg)
b) Mechanical fixings penetrating the insulation (ΔUf)
U = ( 1 / RT ) + ΔUg + ΔUf
Note: ΔUg and ΔUf can be omitted, if taken together, if they amount to less than 3% of the U-value
found from U =1 / RT
Table 7: Calculation of u-value for External walls
External wall
Materials Thickness λ R
M W/m·K m²·K/W
Ri 0.15
Concrete 0.02 1.700 0.02
Concrete 0.05 1.700 0.05
Re 0.07 0.04
Total R= 0.26 m²·K/W
U= 3.85 W/m²·K
Table 8: Calculation of u-value for Floors
Floor
Materials Thickness (m) λ (W/m·K) R
(m²·K/W)
M W/m·K m²·K/W
Ri 0.17
Concrete 0.1 1.630 0.06
0.001 2.000 0.00
Re 0.101 0.17
R= 0.40 m²·K/W
Uf= 2.49 W/m²·K
32
http://www.iso.org accessed 22.06.2013
14
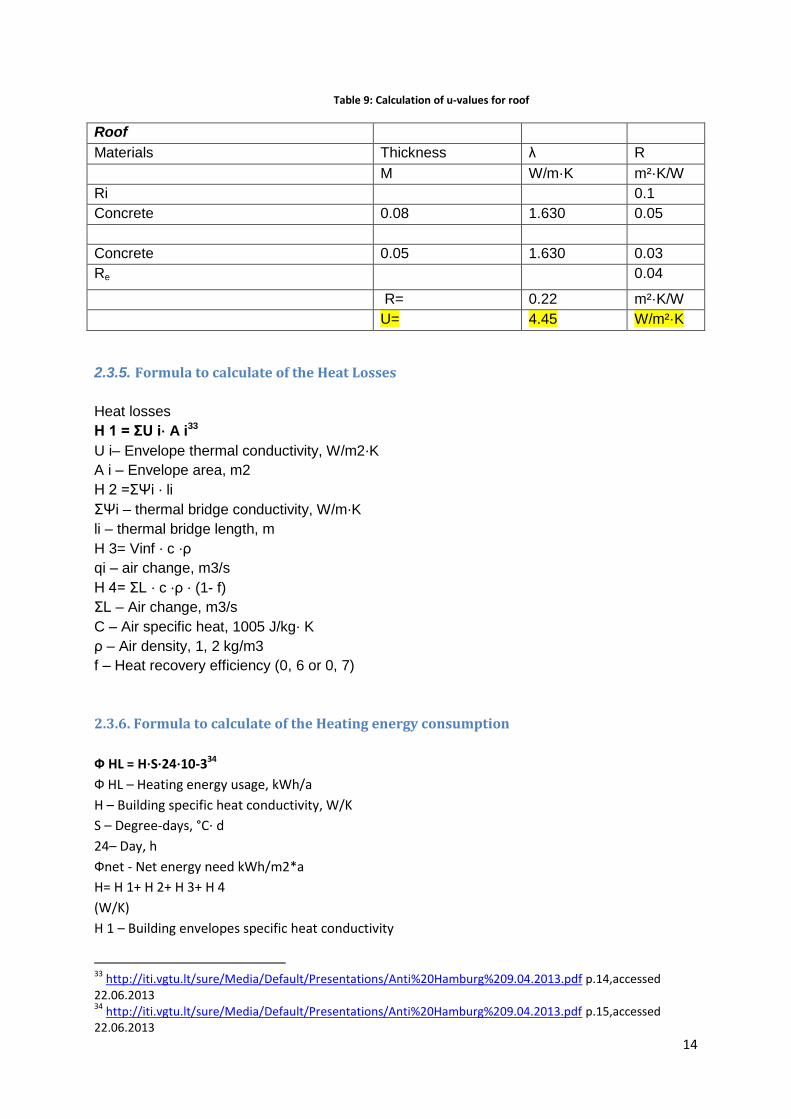
Table 9: Calculation of u-values for roof
Roof
Materials Thickness λ R
M W/m·K m²·K/W
Ri 0.1
Concrete 0.08 1.630 0.05
Concrete 0.05 1.630 0.03
Re 0.04
R= 0.22 m²·K/W
U= 4.45 W/m²·K
2.3.5. Formula to calculate of the Heat Losses
Heat losses
H 1 = ΣU i⋅ A i33
U i– Envelope thermal conductivity, W/m2⋅K
A i – Envelope area, m2
H 2 =ΣΨi ⋅ li
ΣΨi – thermal bridge conductivity, W/m⋅K
li – thermal bridge length, m
H 3= Vinf ⋅ c ⋅ρ
qi – air change, m3/s
H 4= ΣL ⋅ c ⋅ρ ⋅ (1- f)
ΣL – Air change, m3/s
C – Air specific heat, 1005 J/kg⋅ K
ρ – Air density, 1, 2 kg/m3
f – Heat recovery efficiency (0, 6 or 0, 7)
2.3.6. Formula to calculate of the Heating energy consumption
Ф HL = H⋅S⋅24⋅10-334
Ф HL – Heating energy usage, kWh/a
H – Building specific heat conductivity, W/K
S – Degree-days, °C⋅ d
24– Day, h
Фnet - Net energy need kWh/m2*a
H= H 1+ H 2+ H 3+ H 4
(W/K)
H 1 – Building envelopes specific heat conductivity
33
http://iti.vgtu.lt/sure/Media/Default/Presentations/Anti%20Hamburg%209.04.2013.pdf p.14,accessed 22.06.2013 34
http://iti.vgtu.lt/sure/Media/Default/Presentations/Anti%20Hamburg%209.04.2013.pdf p.15,accessed 22.06.2013
15
H 2 – Building cold bridges specific heat conductivity
H 3 – Infiltration specific heat conductivity
H 4 – Ventilation specific heat conductivity
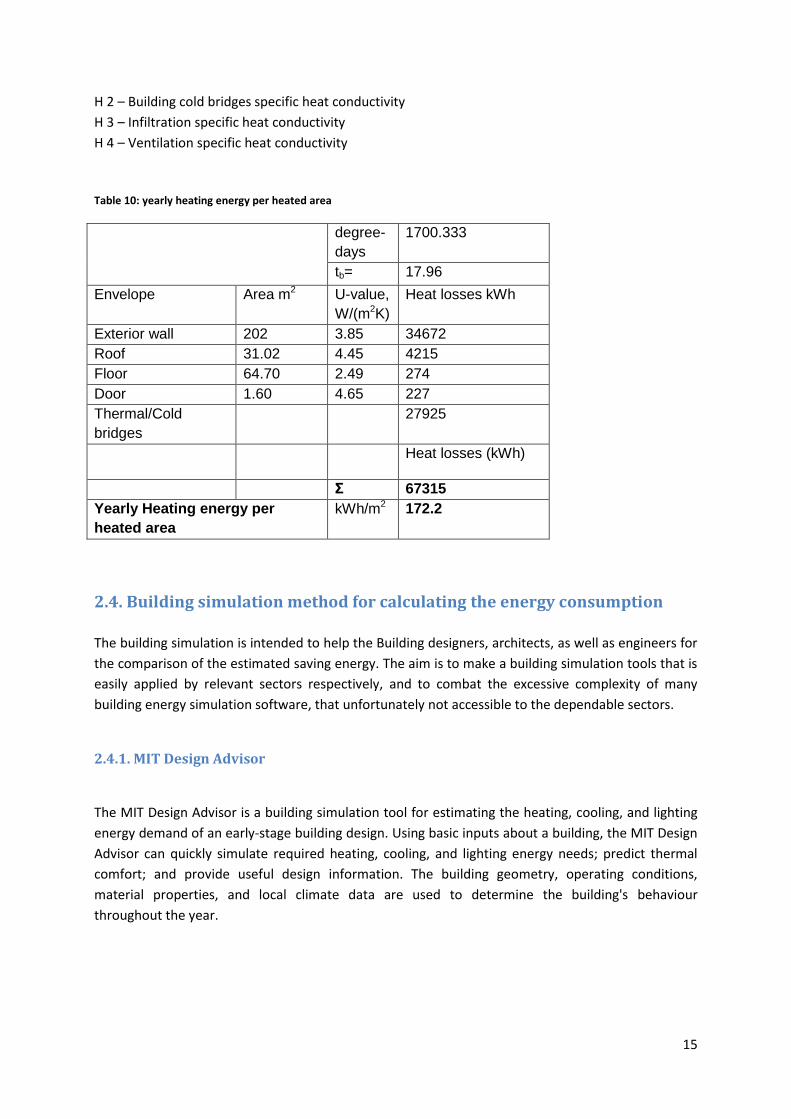
Table 10: yearly heating energy per heated area
degree-
days
1700.333
tb= 17.96
Envelope Area m2 U-value,
W/(m2K)
Heat losses kWh
Exterior wall 202 3.85 34672
Roof 31.02 4.45 4215
Floor 64.70 2.49 274
Door 1.60 4.65 227
Thermal/Cold
bridges
27925
Heat losses (kWh)
Σ 67315
Yearly Heating energy per
heated area
kWh/m2 172.2
2.4. Building simulation method for calculating the energy consumption
The building simulation is intended to help the Building designers, architects, as well as engineers for
the comparison of the estimated saving energy. The aim is to make a building simulation tools that is
easily applied by relevant sectors respectively, and to combat the excessive complexity of many
building energy simulation software, that unfortunately not accessible to the dependable sectors.
2.4.1. MIT Design Advisor
The MIT Design Advisor is a building simulation tool for estimating the heating, cooling, and lighting
energy demand of an early-stage building design. Using basic inputs about a building, the MIT Design
Advisor can quickly simulate required heating, cooling, and lighting energy needs; predict thermal
comfort; and provide useful design information. The building geometry, operating conditions,
material properties, and local climate data are used to determine the building's behaviour
throughout the year.
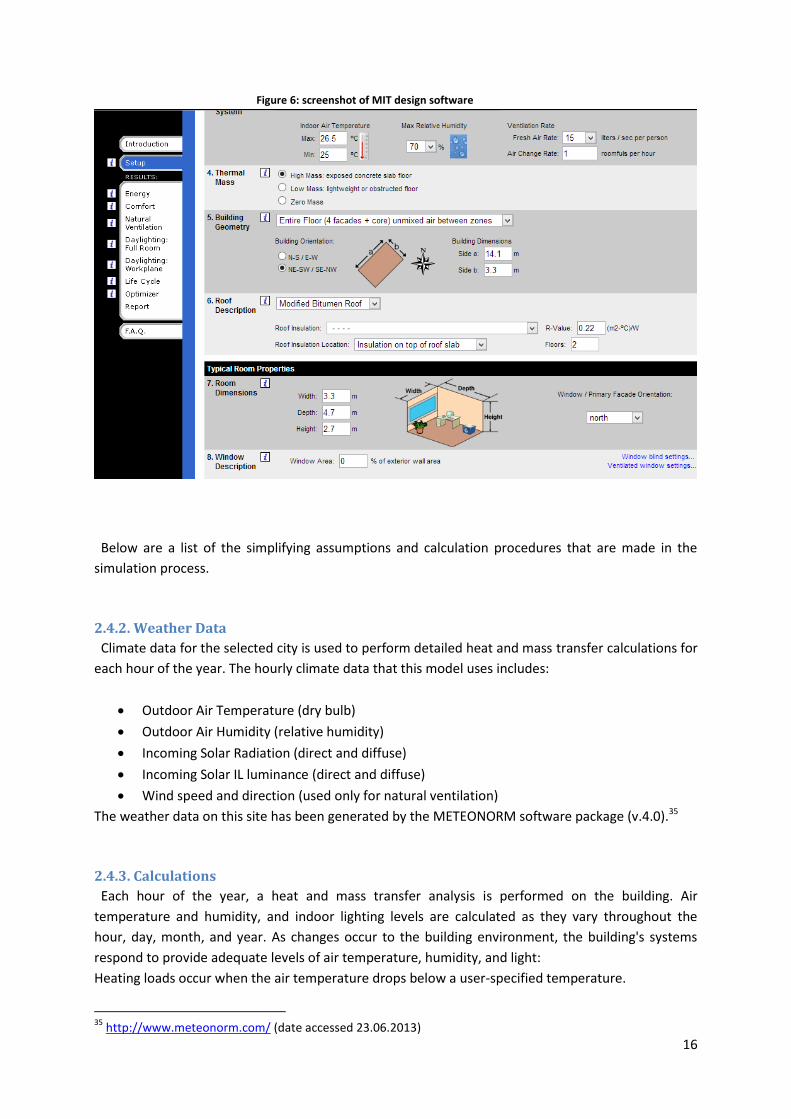
16
Figure 6: screenshot of MIT design software
Below are a list of the simplifying assumptions and calculation procedures that are made in the
simulation process.
2.4.2. Weather Data
Climate data for the selected city is used to perform detailed heat and mass transfer calculations for
each hour of the year. The hourly climate data that this model uses includes:
Outdoor Air Temperature (dry bulb)
Outdoor Air Humidity (relative humidity)
Incoming Solar Radiation (direct and diffuse)
Incoming Solar IL luminance (direct and diffuse)
Wind speed and direction (used only for natural ventilation)
The weather data on this site has been generated by the METEONORM software package (v.4.0).35
2.4.3. Calculations
Each hour of the year, a heat and mass transfer analysis is performed on the building. Air
temperature and humidity, and indoor lighting levels are calculated as they vary throughout the
hour, day, month, and year. As changes occur to the building environment, the building's systems
respond to provide adequate levels of air temperature, humidity, and light:
Heating loads occur when the air temperature drops below a user-specified temperature.
35
http://www.meteonorm.com/ (date accessed 23.06.2013)
17
Cooling loads occur when the air temperature or humidity increase above user-specified
limits.
Lighting loads depend on the minimum lighting requirement and the amount of available
daylight.
Heating, cooling, and lighting systems each use energy to maintain comfortable indoor
conditions. Several ventilation strategies can be simulated, and each affects the way that
loads are calculated. Assumptions are all described in the sections below.36
2.4.3. Ventilation
Ventilation is required to bring fresh air into the building. The user must specify the minimum
ventilation in air changes per hour. One air change is equivalent to replacing the entire volume of air
in the building with the same volume of fresh air. Air changes can be specified directly, or the air
change rate can be linked to the typical number of people in a room. Different values can be
specified for times when the building is occupied vs. unoccupied.37
Fresh air is usually introduced into a building in three ways:
1. Mechanical systems (intake and/or exhaust fans)
2. Natural ventilation (opening windows)
3. Infiltration (leaks around windows & doors)
And therefore, all three cases share the following assumptions:
Fresh air is brought into the building at the outdoor air temperature.
Indoor air is exhausted from the building at the indoor air temperature.
No energy is recovered from the exhaust air.
Fan energy is not considered.38
2.4.4. Cooling Loads
When the indoor air temperature climbs above the high temperature set point, a cooling load is
required. Similarly, when the indoor air relative humidity climbs above the maximum-humidity set
point, a (latent) cooling load is required. If Natural Ventilation Cooling is chosen, then no chiller
system is available and the cooling load is reported as zero. The air temperature will float freely
above the minimum temperature. In this case the user can view a histogram of the hours spent at a
given air temperature to determine how often the building would be uncomfortably hot without
using a mechanical chiller.39 Factors that contribute to the cooling load include:
• Solar gains: direct and diffuse radiation passing through window/blind system.
• Heat passing through the building envelope (walls, roof, and windows).
• Heat from electric lights.
• Heat from equipment.
• Heat from occupants: 75Watts/person (sensible) + 55Watts/person (latent).
• Ventilation and infiltration (air flows): Mass Flow x Cp x (T_inside – T_outside).40
36
http://designadvisor.mit.edu/design/assumptions.html#heating (date accessed 23.06.2013) 37
http://designadvisor.mit.edu/design/assumptions.html#ventilation (date accessed 23.06.2013) 38
http://designadvisor.mit.edu/design/assumptions.html#ventilation (date accessed 23.06.2013) 39
http://designadvisor.mit.edu/design/assumptions.html#cooling (date accessed 23.06.2013) 40
http://designadvisor.mit.edu/design/assumptions.html#cooling_loads (date accessed 23.06.2013)
18
2.4.5. Heating Loads
When the indoor air temperature falls below the low temperature set point, a (sensible) heating load
is required. Factors that contribute to the heating load include:
• Solar gains: direct and diffuse radiation passing through window/blind system.
• Heat passing through the building envelope (walls, roof, and windows).
• Heat from electric lights.
• Heat from equipment.
• Heat from occupants: 75Watts/person (sensible) + 55Watts/person (latent).
• Ventilation and infiltration (air flows): Mass Flow x Cp x (T_inside – T_outside).41
2.4.6. Building Envelope
The building envelope includes all exterior building surfaces - walls, doors, roofs - through which
heat and light may be exchanged with the outdoor environment. To simplify the simulation, the
contributions of the ground to the energy balance have been neglected.
Modelling assumptions for the envelope are as follows:
2.4.6.1. Roof
General Roof Model Assumptions:
Roof construction consists of a 15 cm concrete roof slab with insulation installed as specified
by user.
The convective transfer coefficient between the roof surface and outdoor air is taken to be
10 W/m²-K.
The infrared radiation heat transfer coefficient between the roof surface and the sky
temperature, which is assumed to be 10 K lower than the outdoor temperature, is 6 W/m²-K.
Concrete for roof slab has a Cp = 880 J/kg-K, a density = 2400 kg/m³, and conductivity = 1.4
W/m-K.
The overall heat transfer coefficient between the bottom of the roof slab, or ceiling, and
room is taken to be 10 W/m²-K. This value accounts for convection and radiation.
The energy consumption of the top floor (which has the roof above) is averaged with the
energy consumption of the interior floors (which have adiabatic ceilings), to reach an overall
building average.42
2.4.7. Energy Balance
An energy balance is carried out each hour using weather data for the selected city. The air in a
room is assumed to be well-mixed at a uniform temperature.
• The balance includes heat transfer between the air and thermal mass.
• The thermal mass temperature is calculated by dividing it up into 10 equal-thickness layers
and doing a heat balance for each layer.
• For heavy thermal mass the floor area is assumed to be 20 cm thick concrete with a bare
surface.
• Concrete for thermal mass has a Cp = 880 J/kg-K and a density = 2400 kg/m³
• The heat transfer coefficient between the floor surface and air is taken to be 8 W/m²-K.
41
http://designadvisor.mit.edu/design/assumptions.html#heating_loads (date accessed 23.06.2013) 42
http://designadvisor.mit.edu/design/assumptions.html#roof (date accessed 23.06.2013)
19
2.4.8. Building Information 43
Table 11 Building parameters for Azuma house
Building
Location Japan – Osaka
Building length, side A 14.1 m
Building length, side B 3.3 m
Simulation Type
Simulation Type four_sided_facade
Window Description
Window Area 0%
Wall Description
Insulation R-Value 0.26 m2-K/W
Occupancy
Type Low-rise Residential
Occupancy Load 0.050 people per m2
Lighting Requirements 300 lux
Equipment Load 5.00 W/m2
Room Ventilation
Air Change Rate per
Occupant
15.0 liters / sec per person
Total Air Change Rate 1.0 roomfuls per hour
Lighting Control
Lighting Control lights respond to sunlight: all lights controlled by a
single dimming switch
Representative Room
Orientation North
Room Depth 4.7 m
Room Width 3.3 m
Room Height 2.7 m
Thermal Mass
Thermal Mass High
Overhang
Overhang Depth 0 m
Roof
Roof Type Conventional roof
Roof Insulation R-Value 0.22 m2-K/W
Number of Floors 2 floor(s)
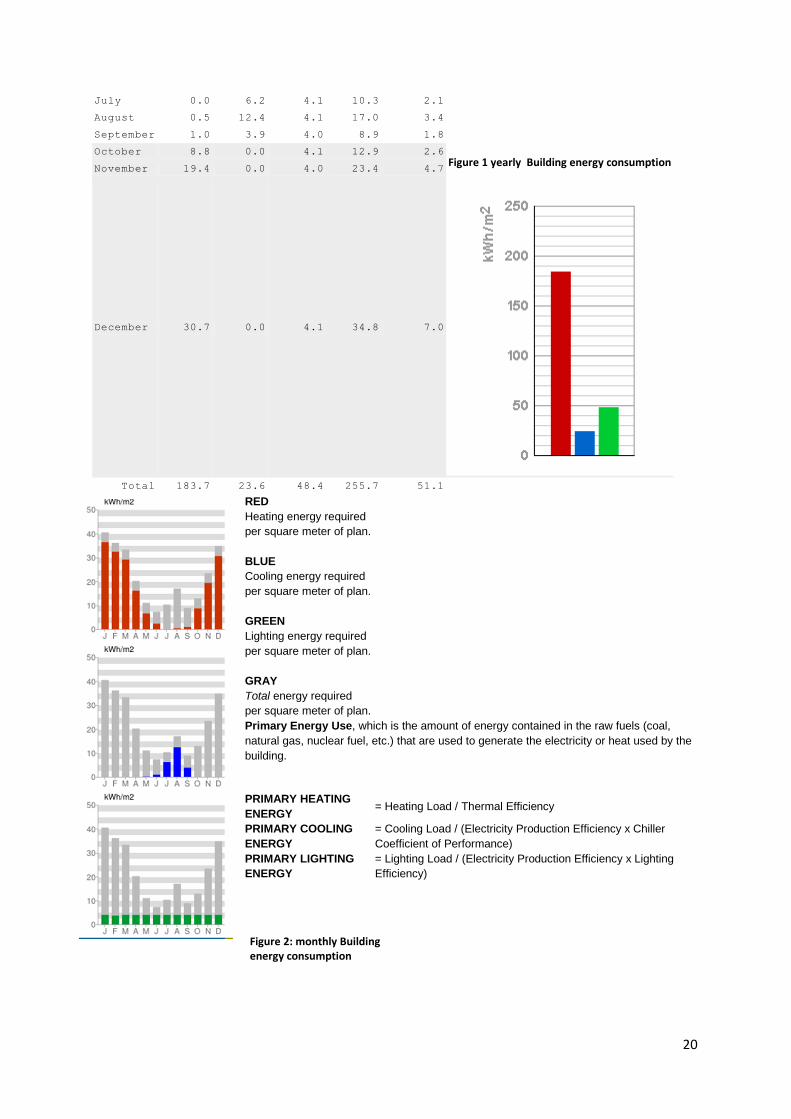
2.4.9. Simulation Results Table 12: Primary energy Use and Co2 emissions
heating
energy
cooling
energy
lighting
energy
total
energy
CO
emissions
(kWh/m ) (kWh/m ) (kWh/m ) (kWh/m ) (kg/m )
January 36.4 0.0 4.1 40.5 8.1
February 32.4 0.0 3.7 36.1 7.2
March 29.2 0.0 4.1 33.3 6.7
April 16.2 0.0 4.0 20.2 4.0
May 6.7 0.2 4.1 11.0 2.2
June 2.4 0.9 4.0 7.3 1.5
43
MIT design advisor http://designadvisor.mit.edu/design/
20
July 0.0 6.2 4.1 10.3 2.1
Figure 1 yearly Building energy consumption
August 0.5 12.4 4.1 17.0 3.4
September 1.0 3.9 4.0 8.9 1.8
October 8.8 0.0 4.1 12.9 2.6
November 19.4 0.0 4.0 23.4 4.7
December 30.7 0.0 4.1 34.8 7.0
Total 183.7 23.6 48.4 255.7 51.1
RED Heating energy required
per square meter of plan.
BLUE
Cooling energy required
per square meter of plan.
GREEN
Lighting energy required
per square meter of plan.
GRAY
Total energy required
per square meter of plan. Primary Energy Use, which is the amount of energy contained in the raw fuels (coal,
natural gas, nuclear fuel, etc.) that are used to generate the electricity or heat used by the
building.
PRIMARY HEATING
ENERGY = Heating Load / Thermal Efficiency
PRIMARY COOLING
ENERGY
= Cooling Load / (Electricity Production Efficiency x Chiller
Coefficient of Performance)
PRIMARY LIGHTING
ENERGY
= Lighting Load / (Electricity Production Efficiency x Lighting
Efficiency)
Figure 2: monthly Building energy consumption
21
2.4.10. Energy
Energy requirements are computed for the entire building and normalized to a per-floor-area basis.
Heating, cooling, and lighting loads are displayed independently on a yearly or monthly basis. The
displayed energy values reflect the primary or formal fuel requirements of the building - this energy
amount corresponds to the energy content of the fossil fuel (primary energy) that needs to be
burned to maintain the specified building conditions.44
2.4.11. Life cycle Cost
By specifying the unit cost of heating and electricity, years of operation, and an appropriate yearly
discount rate (to account for the time value of money), we can estimate the energy cost of the
proposed building. Typical costs for heating and electricity are given, but these can be varied to suit
the conditions. All costs must be entered in the same monetary units (for example, dollars per dollars
per kW-hr). The bars represent the cost of heating (red), cooling (blue), and lighting (green) all
normalized on a per-floor-area basis. The sum of heating, cooling, and lighting energies is displayed
below the graph ($/sq. meter).45
The energy models have undergone careful scrutiny to ensure accuracy although the MIT Design
Advisor model shows good agreement; it is worth noting that this tool is meant only to estimate
energy demand and building performance. Since building designs undergo many changes between
the conceptual stage and the finished product, it is unreasonable to expect accuracy that is better
than 10% of the final design. The focus is to show the relative impact of the most significant design
choices on the overall building performance, and accuracy is sufficient for this purpose.46
44
http://designadvisor.mit.edu/design/assumptions.html#energyhelp accessed 23.06.2013 45
http://designadvisor.mit.edu/design/assumptions.html#lifecyclecost accessed 23.06.2013 46
http://designadvisor.mit.edu/design/assumptions.html accessed 23.06.2013
22
3. REHABILITATION MEASURES AND RECOMMENDATIONS
3.1. Thermal Insulation
A heat transfer is the movement of heat from the space with higher temperature to the space with
lower temperature. The techniques and methods which are exploited so as to control and decrease
the rate of this transfer are known as the Thermal Insulation. This type of insulation has pursued the
goal of minimizing the energy wastage in a building in order to maximize the energy efficiency47. The
main reasons for using the Thermal Insulation are:
The most important target which is followed by using the thermal insulation is the reduction
in the rate of energy consumption. Various researches have confirmed that the appropriate
thermal insulation can effect extensively on the rate of electricity usage as it is able to
diminish this rate up to 50%. Thermal insulation can decrease the dependency of the users upon the air conditioners and
heating systems. Thermal insulation protects building components by limiting the temperature difference in
various components, the difference which is caused by different temperatures in different
period of a day48.
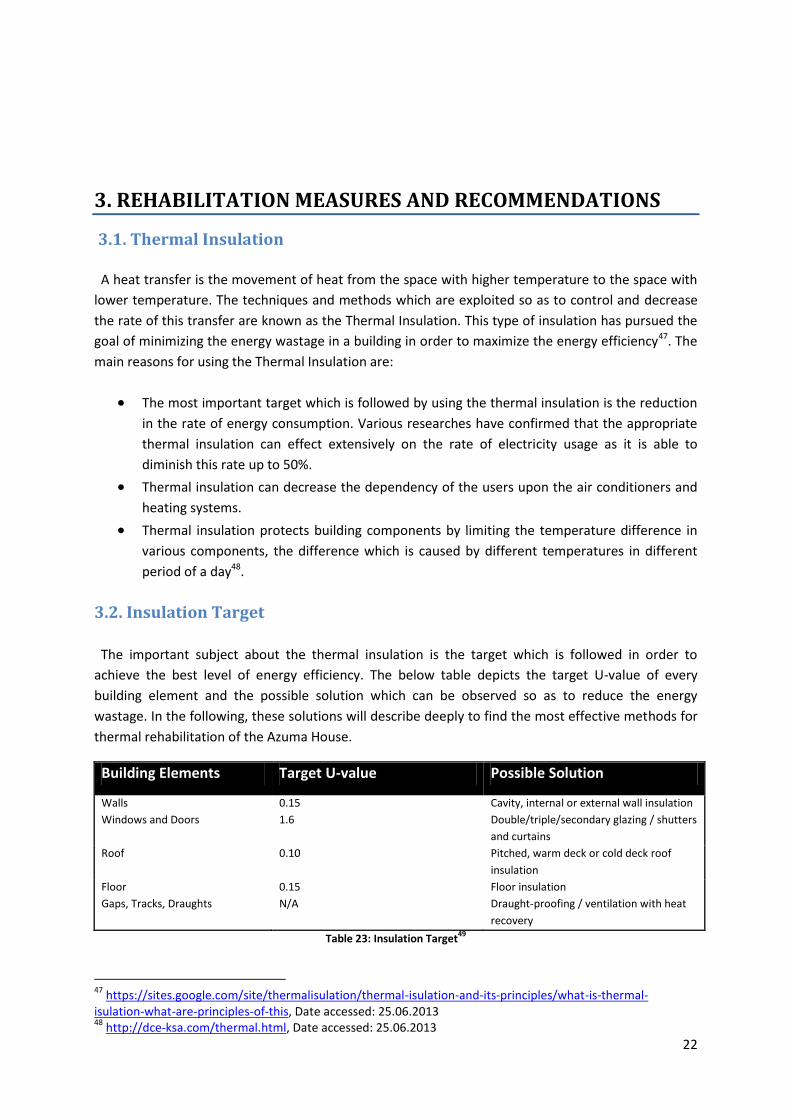
3.2. Insulation Target
The important subject about the thermal insulation is the target which is followed in order to
achieve the best level of energy efficiency. The below table depicts the target U-value of every
building element and the possible solution which can be observed so as to reduce the energy
wastage. In the following, these solutions will describe deeply to find the most effective methods for
thermal rehabilitation of the Azuma House.
Building Elements Target U-value Possible Solution
Walls 0.15 Cavity, internal or external wall insulation
Windows and Doors 1.6 Double/triple/secondary glazing / shutters
and curtains
Roof 0.10 Pitched, warm deck or cold deck roof
insulation
Floor 0.15 Floor insulation
Gaps, Tracks, Draughts N/A Draught-proofing / ventilation with heat
recovery
Table 23: Insulation Target49
47
https://sites.google.com/site/thermalisulation/thermal-isulation-and-its-principles/what-is-thermal-isulation-what-are-principles-of-this, Date accessed: 25.06.2013 48
http://dce-ksa.com/thermal.html, Date accessed: 25.06.2013
23
3.3. Wall Insulation
There are two main wall types, namely, Cavity and Solid Walls. There are, of course, other types of
walls which are not classified in these two types, for instance, steel-frame walls, wood-frame walls,
prefabricated concrete walls. Due to lack of gap, these walls can be considered as the solid walls
regarding the thermal insulation50.
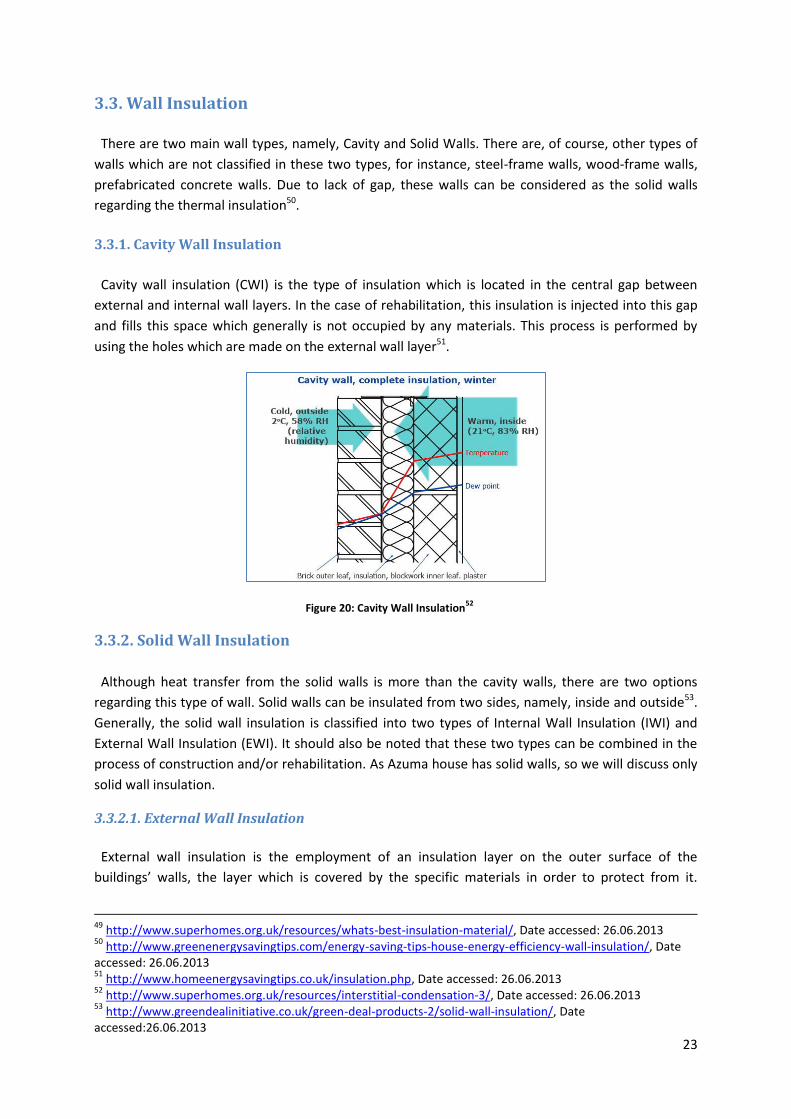
3.3.1. Cavity Wall Insulation
Cavity wall insulation (CWI) is the type of insulation which is located in the central gap between
external and internal wall layers. In the case of rehabilitation, this insulation is injected into this gap
and fills this space which generally is not occupied by any materials. This process is performed by
using the holes which are made on the external wall layer51.
Figure 20: Cavity Wall Insulation52
3.3.2. Solid Wall Insulation
Although heat transfer from the solid walls is more than the cavity walls, there are two options
regarding this type of wall. Solid walls can be insulated from two sides, namely, inside and outside53.
Generally, the solid wall insulation is classified into two types of Internal Wall Insulation (IWI) and
External Wall Insulation (EWI). It should also be noted that these two types can be combined in the
process of construction and/or rehabilitation. As Azuma house has solid walls, so we will discuss only
solid wall insulation.
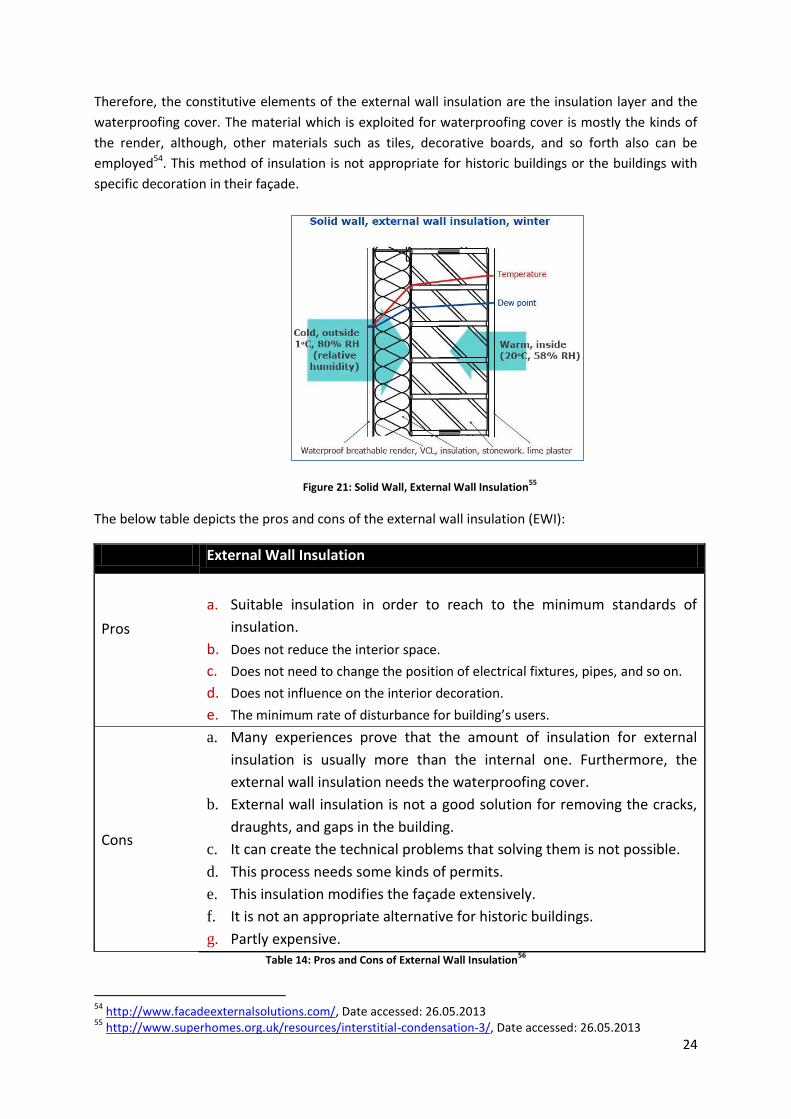
3.3.2.1. External Wall Insulation
External wall insulation is the employment of an insulation layer on the outer surface of the
buildings’ walls, the layer which is covered by the specific materials in order to protect from it.
49
http://www.superhomes.org.uk/resources/whats-best-insulation-material/, Date accessed: 26.06.2013 50
http://www.greenenergysavingtips.com/energy-saving-tips-house-energy-efficiency-wall-insulation/, Date accessed: 26.06.2013 51
http://www.homeenergysavingtips.co.uk/insulation.php, Date accessed: 26.06.2013 52
http://www.superhomes.org.uk/resources/interstitial-condensation-3/, Date accessed: 26.06.2013 53
http://www.greendealinitiative.co.uk/green-deal-products-2/solid-wall-insulation/, Date accessed:26.06.2013
24
Therefore, the constitutive elements of the external wall insulation are the insulation layer and the
waterproofing cover. The material which is exploited for waterproofing cover is mostly the kinds of
the render, although, other materials such as tiles, decorative boards, and so forth also can be
employed54. This method of insulation is not appropriate for historic buildings or the buildings with
specific decoration in their façade.
Figure 21: Solid Wall, External Wall Insulation55
The below table depicts the pros and cons of the external wall insulation (EWI):
External Wall Insulation
Pros
a. Suitable insulation in order to reach to the minimum standards of
insulation.
b. Does not reduce the interior space.
c. Does not need to change the position of electrical fixtures, pipes, and so on.
d. Does not influence on the interior decoration.
e. The minimum rate of disturbance for building’s users.
Cons
a. Many experiences prove that the amount of insulation for external
insulation is usually more than the internal one. Furthermore, the
external wall insulation needs the waterproofing cover.
b. External wall insulation is not a good solution for removing the cracks,
draughts, and gaps in the building.
c. It can create the technical problems that solving them is not possible.
d. This process needs some kinds of permits.
e. This insulation modifies the façade extensively.
f. It is not an appropriate alternative for historic buildings.
g. Partly expensive. Table 14: Pros and Cons of External Wall Insulation
56
54
http://www.facadeexternalsolutions.com/, Date accessed: 26.05.2013 55
http://www.superhomes.org.uk/resources/interstitial-condensation-3/, Date accessed: 26.05.2013
25
3.3.2.2. Internal Wall Insulation
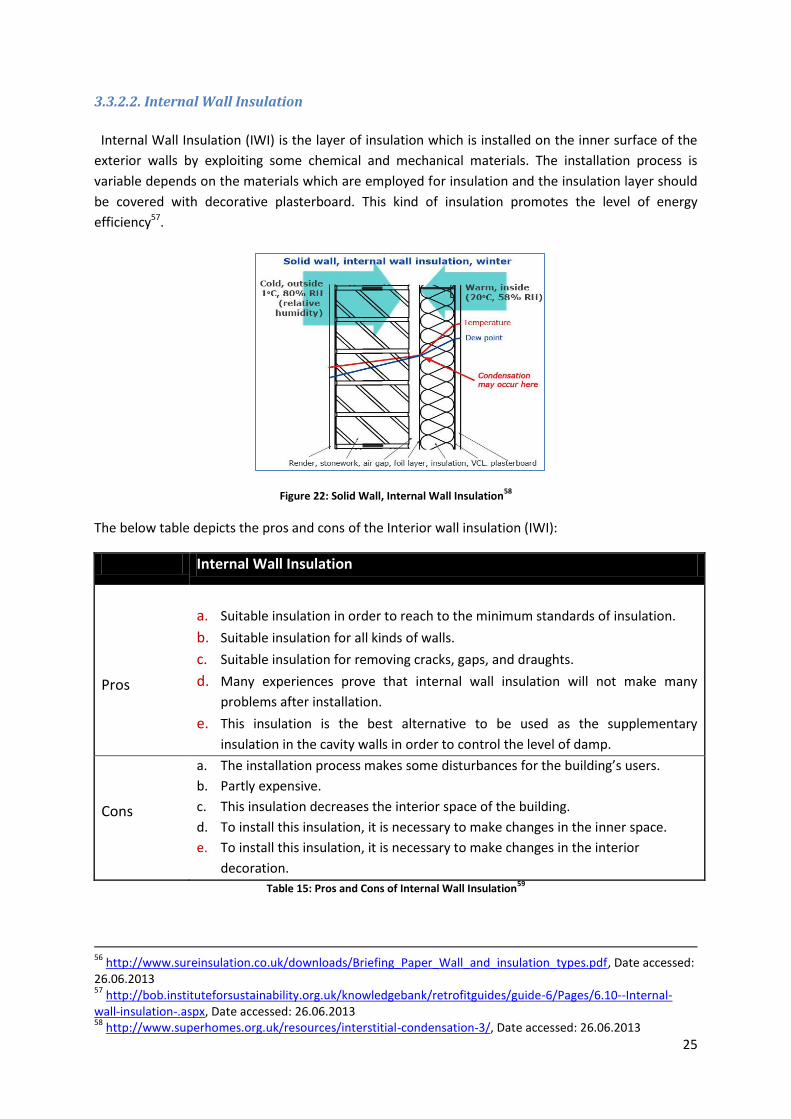
Internal Wall Insulation (IWI) is the layer of insulation which is installed on the inner surface of the
exterior walls by exploiting some chemical and mechanical materials. The installation process is
variable depends on the materials which are employed for insulation and the insulation layer should
be covered with decorative plasterboard. This kind of insulation promotes the level of energy
efficiency57.
Figure 22: Solid Wall, Internal Wall Insulation58
The below table depicts the pros and cons of the Interior wall insulation (IWI):
Internal Wall Insulation
Pros
a. Suitable insulation in order to reach to the minimum standards of insulation.
b. Suitable insulation for all kinds of walls.
c. Suitable insulation for removing cracks, gaps, and draughts.
d. Many experiences prove that internal wall insulation will not make many
problems after installation.
e. This insulation is the best alternative to be used as the supplementary
insulation in the cavity walls in order to control the level of damp.
Cons
a. The installation process makes some disturbances for the building’s users.
b. Partly expensive.
c. This insulation decreases the interior space of the building.
d. To install this insulation, it is necessary to make changes in the inner space.
e. To install this insulation, it is necessary to make changes in the interior
decoration.
Table 15: Pros and Cons of Internal Wall Insulation59
56
http://www.sureinsulation.co.uk/downloads/Briefing_Paper_Wall_and_insulation_types.pdf, Date accessed: 26.06.2013 57
http://bob.instituteforsustainability.org.uk/knowledgebank/retrofitguides/guide-6/Pages/6.10--Internal-wall-insulation-.aspx, Date accessed: 26.06.2013 58
http://www.superhomes.org.uk/resources/interstitial-condensation-3/, Date accessed: 26.06.2013
26
3.3.3. Comparison of Different Wall Insulation
All types of wall insulation have specified disadvantages and advantages. Many factors can effect on
the selection of the insulation type, namely, current situation, insulation needs, cost, technical
restriction, and so forth. The below table compares the internal wall insulations and external wall
insulation:
Excellent=9
Poor=1
Internal Wall Insulation External Wall Insulation
Effectiveness 9 7
Cost 2 1
Disruption 1 5
Success Rate 9 8
Addresses Draughts/Airtightness 9 2
Suitable for Individual House 9 1
Suitable for All House Types 9 1
Table 16: Comparison of Internal and External Wall Insulation60
3.4. Roof Insulation
In general, there are two types of roof, namely, the pitched roof and the flat roof. The insulation of
these two types can be classified into cold and warm roofs based on the place of insulation. On the
other hand, there are two other types of insulation which are called the cool roof and green roof. In
the following, the cool roof, green roof as well as the flat roof insulation will be described so as to
become acquainted with the pros and cons of these types of insulation.
3.4.1. Flat Roof
A roof with a slope of less than 10 degrees is determined as the flat roof. The place of the insulation
layer specifies that the building has the warm roof and/or cold roof 61.Therefore; generally, there are
two methods for roof insulation considering the position of the insulation.
3.4.1.1. The Cold Roof
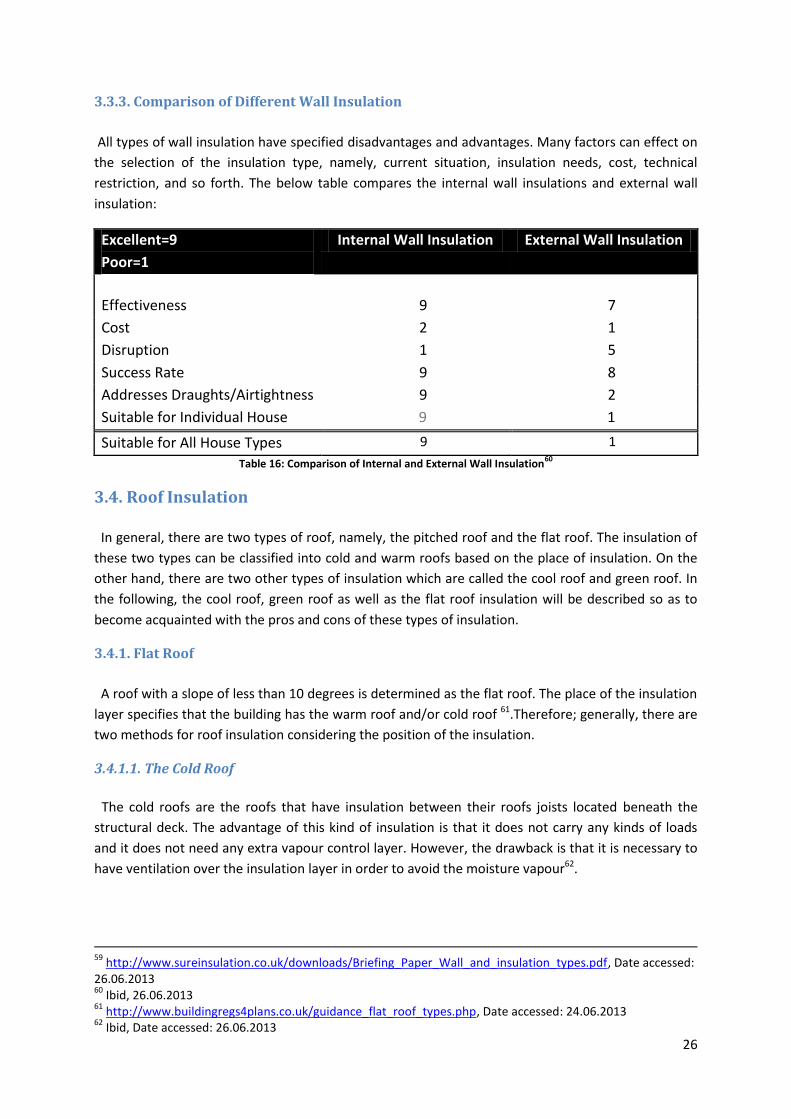
The cold roofs are the roofs that have insulation between their roofs joists located beneath the
structural deck. The advantage of this kind of insulation is that it does not carry any kinds of loads
and it does not need any extra vapour control layer. However, the drawback is that it is necessary to
have ventilation over the insulation layer in order to avoid the moisture vapour62.
59
http://www.sureinsulation.co.uk/downloads/Briefing_Paper_Wall_and_insulation_types.pdf, Date accessed: 26.06.2013 60
Ibid, 26.06.2013 61
http://www.buildingregs4plans.co.uk/guidance_flat_roof_types.php, Date accessed: 24.06.2013 62
Ibid, Date accessed: 26.06.2013
27
Figure 23: The Cold Roof63
3.4.1.2. Warm Deck Roof
The warm deck roof is the roof in which insulation layer is located on the structural deck. Unlike the
cold roof, the warm deck roof does not need the ventilation and it can protect from the outer layer
of the roof. Another advantage of this kind of roof insulation is that it can prevent from high
temperature differences in the roofs’ materials, the subject that causes to postpone the damage of
the material. Also, this type of roof insulation has the potential to control the condensation64. There
are two types of warm deck roof. These two types are:
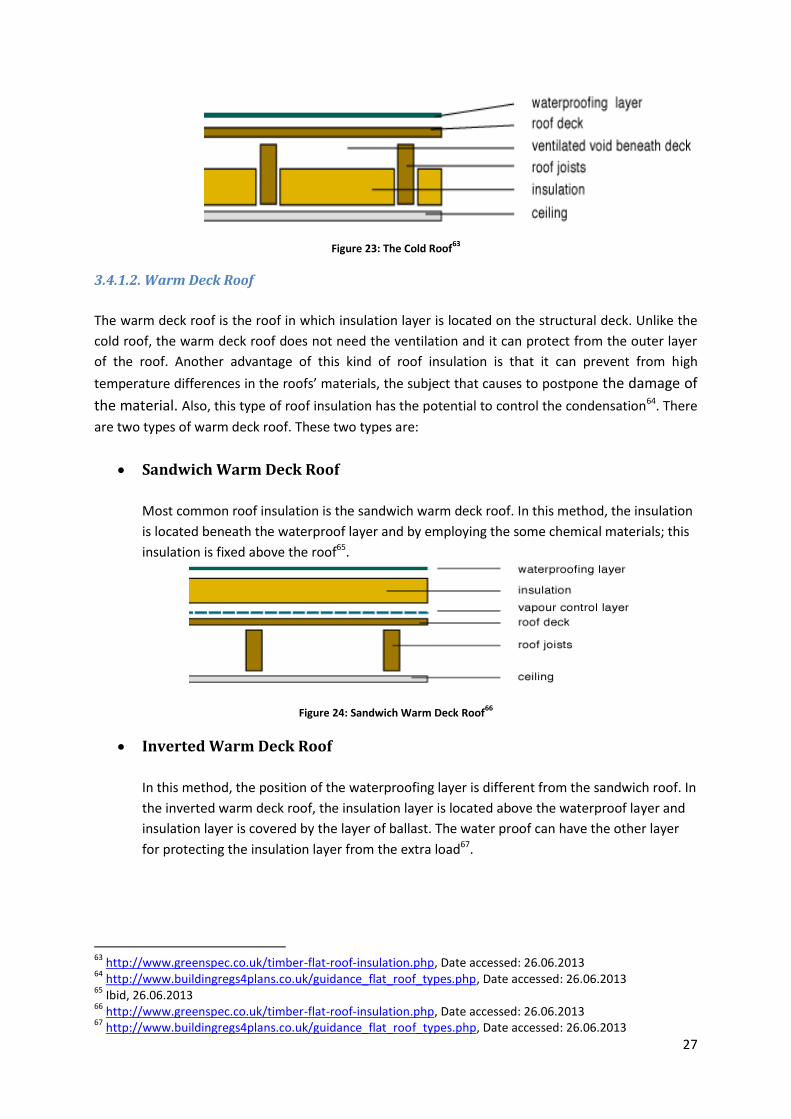
Sandwich Warm Deck Roof
Most common roof insulation is the sandwich warm deck roof. In this method, the insulation
is located beneath the waterproof layer and by employing the some chemical materials; this
insulation is fixed above the roof65.
Figure 24: Sandwich Warm Deck Roof66
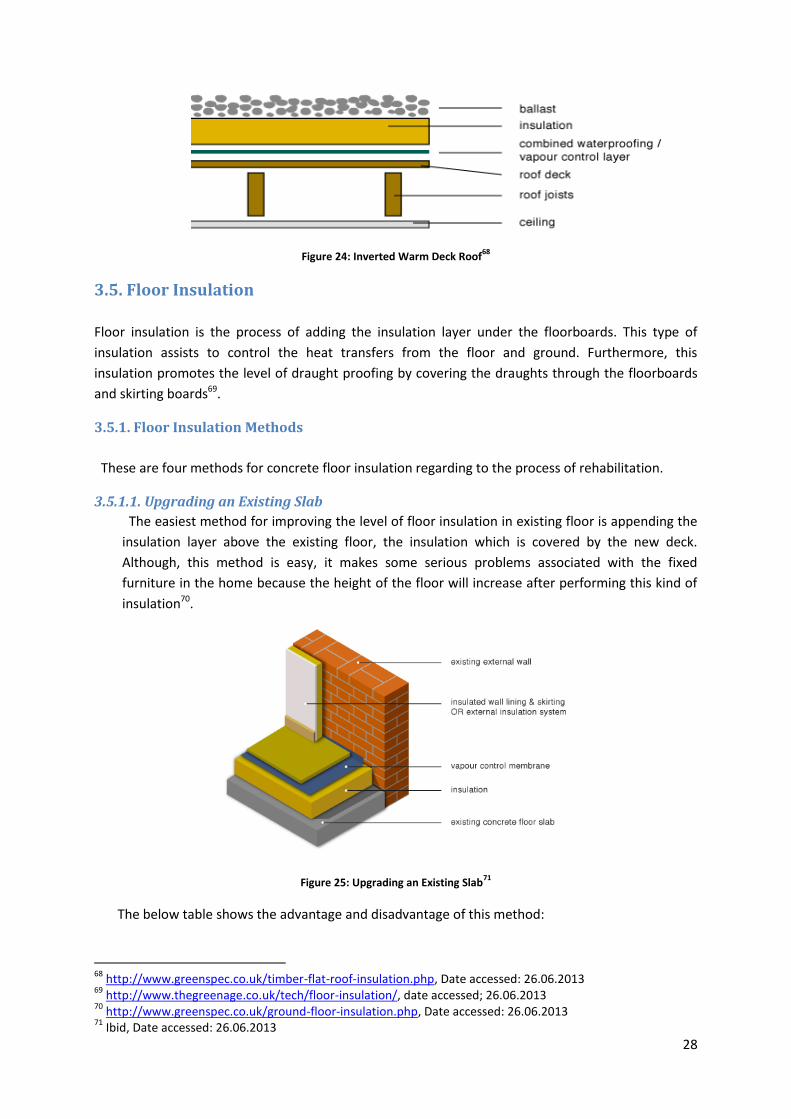
Inverted Warm Deck Roof
In this method, the position of the waterproofing layer is different from the sandwich roof. In
the inverted warm deck roof, the insulation layer is located above the waterproof layer and
insulation layer is covered by the layer of ballast. The water proof can have the other layer
for protecting the insulation layer from the extra load67.
63
http://www.greenspec.co.uk/timber-flat-roof-insulation.php, Date accessed: 26.06.2013 64
http://www.buildingregs4plans.co.uk/guidance_flat_roof_types.php, Date accessed: 26.06.2013 65
Ibid, 26.06.2013 66
http://www.greenspec.co.uk/timber-flat-roof-insulation.php, Date accessed: 26.06.2013 67
http://www.buildingregs4plans.co.uk/guidance_flat_roof_types.php, Date accessed: 26.06.2013
28
Figure 24: Inverted Warm Deck Roof68
3.5. Floor Insulation
Floor insulation is the process of adding the insulation layer under the floorboards. This type of
insulation assists to control the heat transfers from the floor and ground. Furthermore, this
insulation promotes the level of draught proofing by covering the draughts through the floorboards
and skirting boards69.
3.5.1. Floor Insulation Methods
These are four methods for concrete floor insulation regarding to the process of rehabilitation.
3.5.1.1. Upgrading an Existing Slab
The easiest method for improving the level of floor insulation in existing floor is appending the
insulation layer above the existing floor, the insulation which is covered by the new deck.
Although, this method is easy, it makes some serious problems associated with the fixed
furniture in the home because the height of the floor will increase after performing this kind of
insulation70.
Figure 25: Upgrading an Existing Slab71
The below table shows the advantage and disadvantage of this method:
68
http://www.greenspec.co.uk/timber-flat-roof-insulation.php, Date accessed: 26.06.2013 69
http://www.thegreenage.co.uk/tech/floor-insulation/, date accessed; 26.06.2013 70
http://www.greenspec.co.uk/ground-floor-insulation.php, Date accessed: 26.06.2013 71
Ibid, Date accessed: 26.06.2013
29
Upgrading an Existing Slab
Advantage
The simplest method for promoting the level of floor insulation
Disadvantage
Can create the serious problems about the fixed furniture of the
building. Table 13: Advantages and Disadvantages of Upgrading an Existing Slab
72
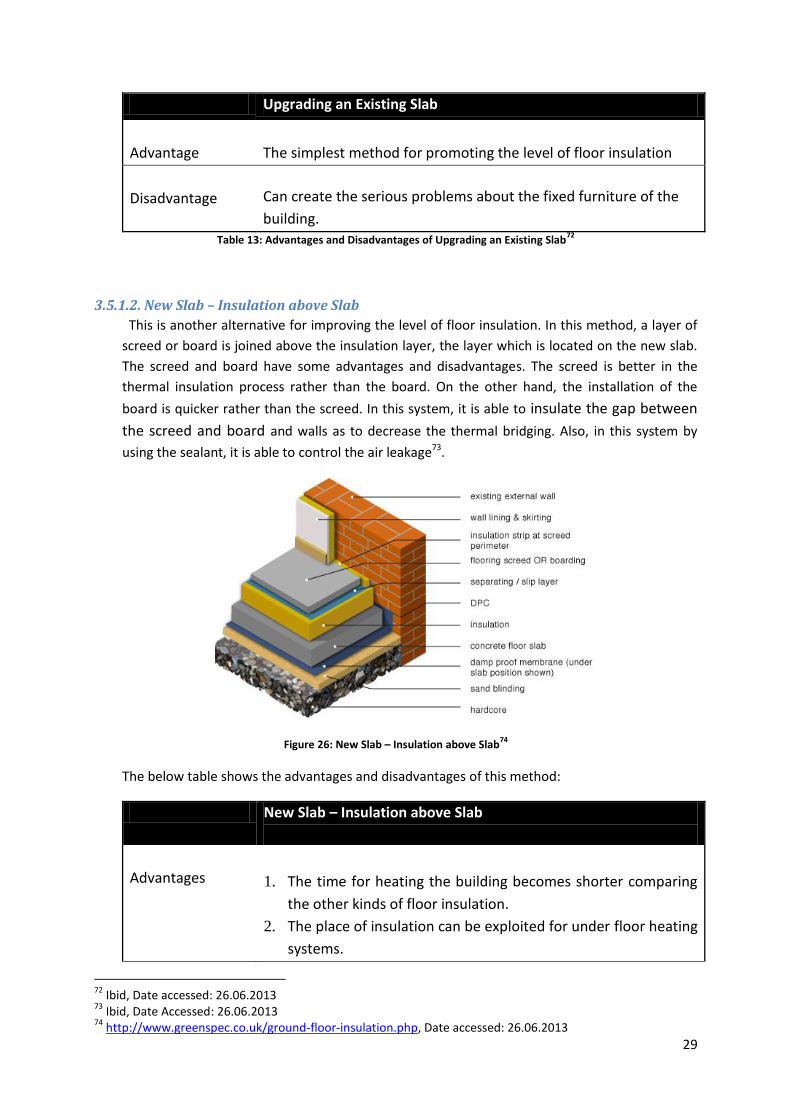
3.5.1.2. New Slab – Insulation above Slab
This is another alternative for improving the level of floor insulation. In this method, a layer of
screed or board is joined above the insulation layer, the layer which is located on the new slab.
The screed and board have some advantages and disadvantages. The screed is better in the
thermal insulation process rather than the board. On the other hand, the installation of the
board is quicker rather than the screed. In this system, it is able to insulate the gap between
the screed and board and walls as to decrease the thermal bridging. Also, in this system by
using the sealant, it is able to control the air leakage73.
Figure 26: New Slab – Insulation above Slab74
The below table shows the advantages and disadvantages of this method:
New Slab – Insulation above Slab
Advantages
1. The time for heating the building becomes shorter comparing
the other kinds of floor insulation.
2. The place of insulation can be exploited for under floor heating
systems.
72
Ibid, Date accessed: 26.06.2013 73
Ibid, Date Accessed: 26.06.2013 74
http://www.greenspec.co.uk/ground-floor-insulation.php, Date accessed: 26.06.2013
30
Disadvantages
1. From the technical view, it is important to consider the loads
which must be borne by the insulation layer.
2. In the wet space such as bathrooms and toilets, this kind of
insulation is not suitable.
Table 14: Advantages and Disadvantages of New Slab - Insulation above Slab75
3.5.1.3. New Slab – Insulation below Slab
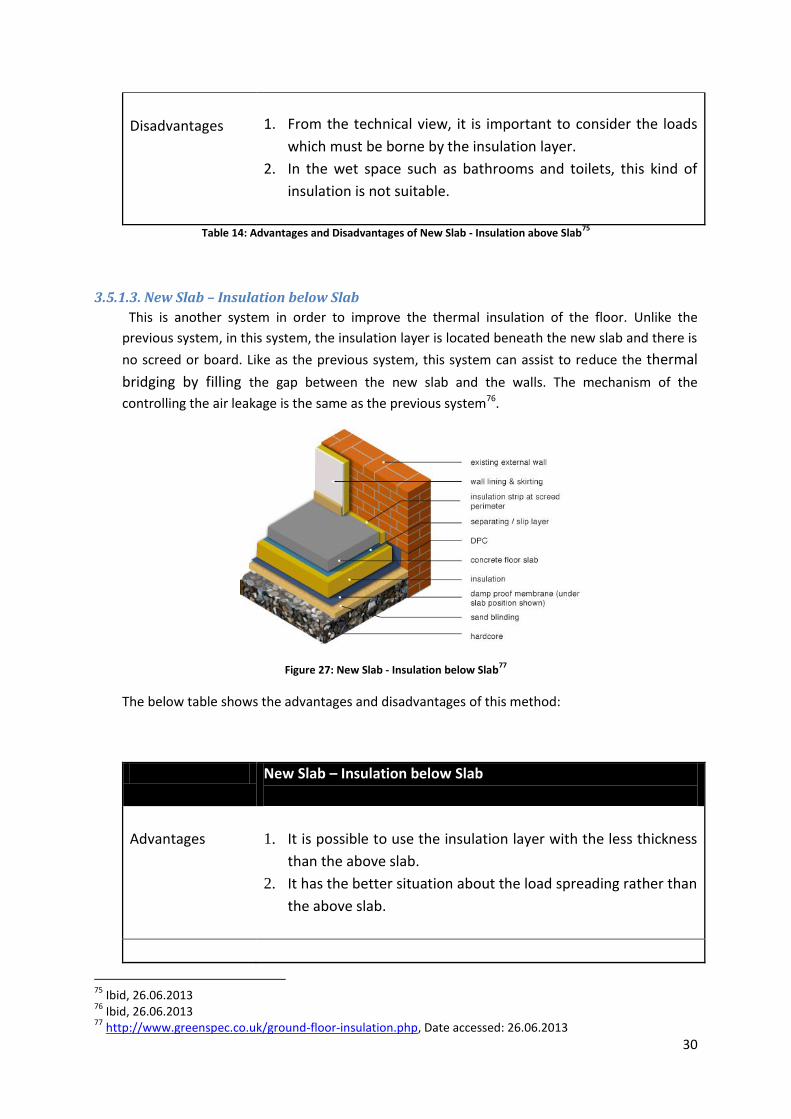
This is another system in order to improve the thermal insulation of the floor. Unlike the
previous system, in this system, the insulation layer is located beneath the new slab and there is
no screed or board. Like as the previous system, this system can assist to reduce the thermal
bridging by filling the gap between the new slab and the walls. The mechanism of the
controlling the air leakage is the same as the previous system76.
Figure 27: New Slab - Insulation below Slab77
The below table shows the advantages and disadvantages of this method:
New Slab – Insulation below Slab
Advantages
1. It is possible to use the insulation layer with the less thickness
than the above slab.
2. It has the better situation about the load spreading rather than
the above slab.
75
Ibid, 26.06.2013 76
Ibid, 26.06.2013 77
http://www.greenspec.co.uk/ground-floor-insulation.php, Date accessed: 26.06.2013
31
Disadvantages The quickness of heating in this system is less than above slab
system.
Table 15: Advantages and Disadvantages of the New Slab - Insulation below Slab78
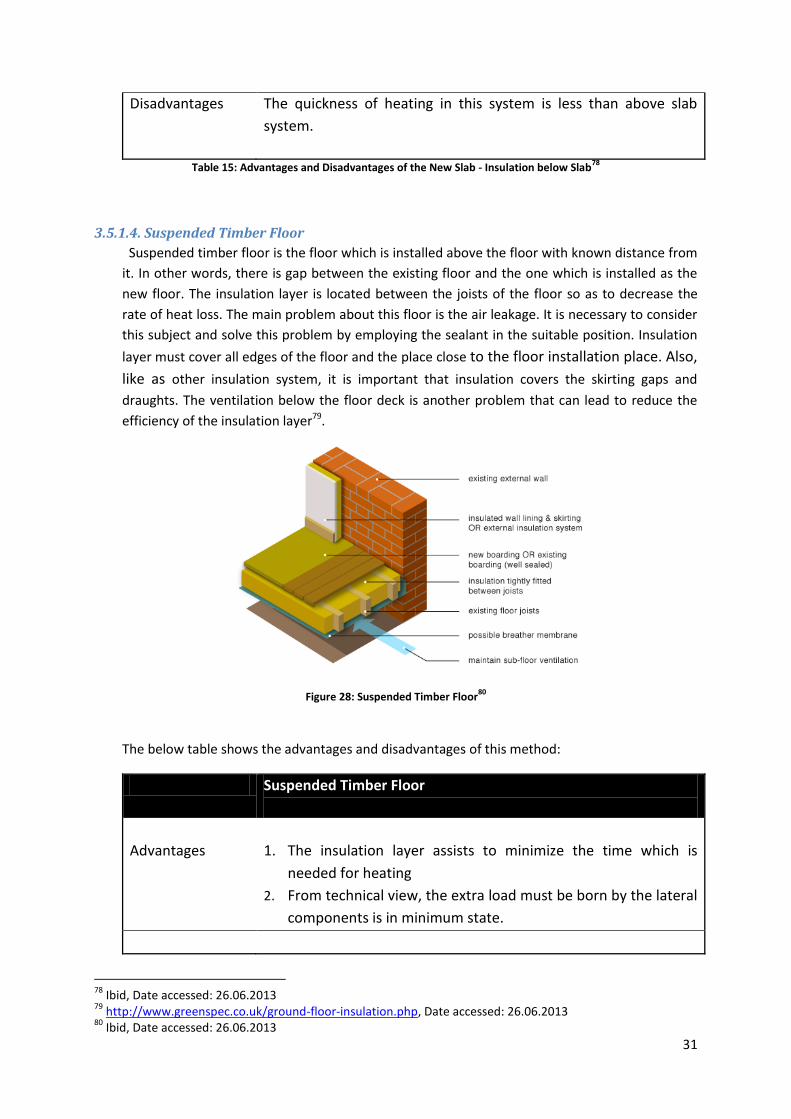
3.5.1.4. Suspended Timber Floor
Suspended timber floor is the floor which is installed above the floor with known distance from
it. In other words, there is gap between the existing floor and the one which is installed as the
new floor. The insulation layer is located between the joists of the floor so as to decrease the
rate of heat loss. The main problem about this floor is the air leakage. It is necessary to consider
this subject and solve this problem by employing the sealant in the suitable position. Insulation
layer must cover all edges of the floor and the place close to the floor installation place. Also,
like as other insulation system, it is important that insulation covers the skirting gaps and
draughts. The ventilation below the floor deck is another problem that can lead to reduce the
efficiency of the insulation layer79.
Figure 28: Suspended Timber Floor80
The below table shows the advantages and disadvantages of this method:
Suspended Timber Floor
Advantages
1. The insulation layer assists to minimize the time which is
needed for heating
2. From technical view, the extra load must be born by the lateral
components is in minimum state.
78
Ibid, Date accessed: 26.06.2013 79
http://www.greenspec.co.uk/ground-floor-insulation.php, Date accessed: 26.06.2013 80
Ibid, Date accessed: 26.06.2013
32
Disadvantages 1. There is no thermal mass about this system
2. There is serious problem about air leakage
3. Ventilation below the floor decreases the efficiency of the
insulation layer
Table 6: Advantages and Disadvantages of Suspended Timber Floor81
3.6. Draught Proofing
Draught proofing is the kind of insulation that assists to control the movement of air from warm to
cold space. The draughts, gaps, and cracks in the building work like as the ventilation and waste the
energy which is used in order to heat or cool the space. Draught proofing is the set of techniques
which are employed to fill the gaps, draughts, and cracks in the building so as to reduce the energy
consumption82. Draught proofing can be considered about the windows, doors leading outside, inside
doors, floors, entry lofts, loft rooms, chimneys and fireplaces, pipes, disused air conditioning vents
and extractor fans, and cracks in walls. Draught proofing helps to reduce the uncontrolled
infiltration, the subject that causes to reduce the heat loss83.
3.7. Selection Criteria for Insulation Material
Insulation materials must be sustainable, resistant, durable, cost effective and require minimum
maintenance. Also, it is necessary that this material have a suitable covers when they are employed
at the outer space. Furthermore, it is necessary that these materials are protected from fire risk.
Insulation materials can be classified into two categories of Organic and Non-organic materials. In
addition, the organic materials are also categorized in Natural and Synthetic materials. This
classification is founded based on the raw materials which are used in them84. The below table
depicts some insulation material with related k-value based on the above classification and the place
which these materials are used.
Insulating Material K-value Usage Place Notes
Organic Natural
Wood fiber batts 0.038 – 0.043 Roofs, Walls, Ceilings
Cellulose (loose, batt or board) 0.038 – 0.040 Horizontal surfaces Recyclable, renewable,
made from finely shredded
newspaper, easy to install
Flax batts, slabs and rolls Approximately
0.042
Roof ,Wall, Floor Hard to obtain and expensive
Cork board 0.042 – 0.050 Commonly used as
underlay under
hardwood and
ceramic floors.
Fiber Cement Gladding 0.24 Horizontal Surfaces Made by Sand, Cement, and
81
Ibid, Date accessed: 26.06.2013 82
http://www.thegreenage.co.uk/tech/draught-proofing/, Date accessed: 26.06.2013 83
Ibid, Date accessed: 26.06.2013 84
http://nesa1.uni-siegen.de/wwwextern/idea/keytopic/6.htm, Date accessed: 26.06.2013
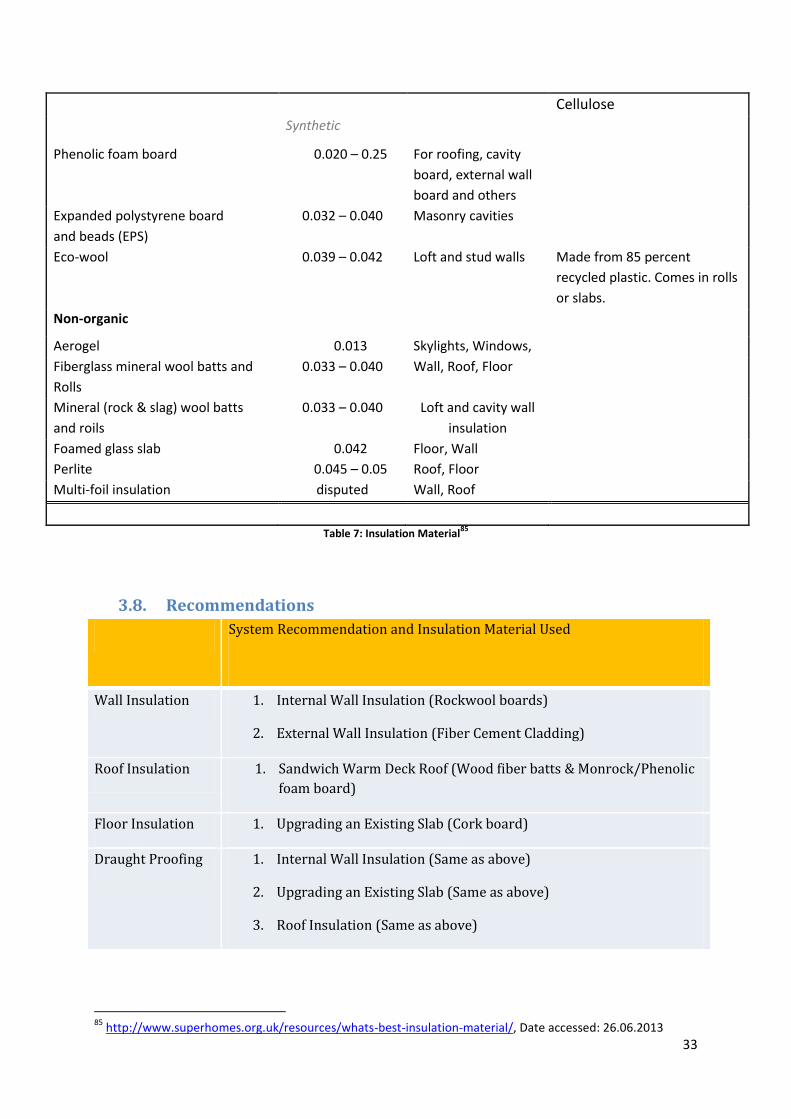
33
Cellulose
Synthetic
Phenolic foam board 0.020 – 0.25 For roofing, cavity
board, external wall
board and others
Expanded polystyrene board
and beads (EPS)
0.032 – 0.040 Masonry cavities
Eco-wool 0.039 – 0.042 Loft and stud walls Made from 85 percent
recycled plastic. Comes in rolls
or slabs.
Non-organic
Aerogel 0.013 Skylights, Windows,
Fiberglass mineral wool batts and
Rolls
0.033 – 0.040 Wall, Roof, Floor
Mineral (rock & slag) wool batts
and roils
0.033 – 0.040 Loft and cavity wall
insulation
Foamed glass slab 0.042 Floor, Wall
Perlite 0.045 – 0.05 Roof, Floor
Multi-foil insulation disputed Wall, Roof
Table 7: Insulation Material85
3.8. Recommendations
System Recommendation and Insulation Material Used
Wall Insulation 1. Internal Wall Insulation (Rockwool boards)
2. External Wall Insulation (Fiber Cement Cladding)
Roof Insulation 1. Sandwich Warm Deck Roof (Wood fiber batts & Monrock/Phenolic
foam board)
Floor Insulation 1. Upgrading an Existing Slab (Cork board)
Draught Proofing 1. Internal Wall Insulation (Same as above)
2. Upgrading an Existing Slab (Same as above)
3. Roof Insulation (Same as above)
85
http://www.superhomes.org.uk/resources/whats-best-insulation-material/, Date accessed: 26.06.2013
34
3.9. Solar Shading Systems
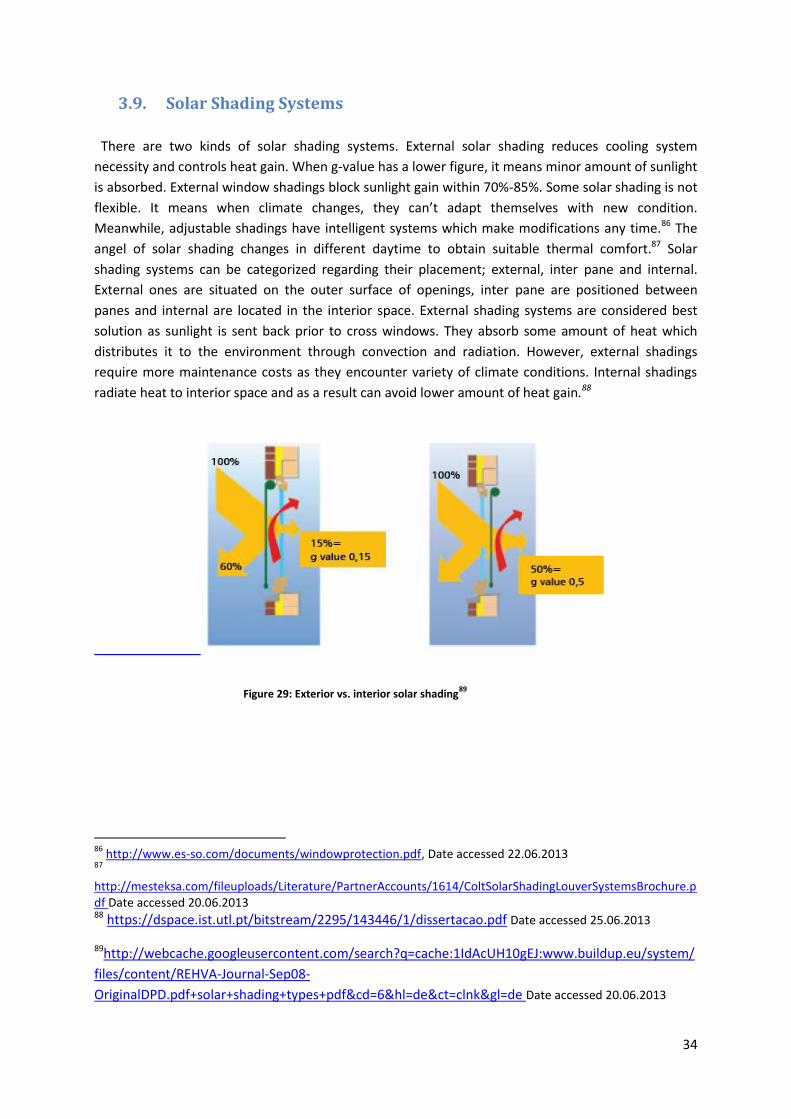
There are two kinds of solar shading systems. External solar shading reduces cooling system
necessity and controls heat gain. When g-value has a lower figure, it means minor amount of sunlight
is absorbed. External window shadings block sunlight gain within 70%-85%. Some solar shading is not
flexible. It means when climate changes, they can’t adapt themselves with new condition.
Meanwhile, adjustable shadings have intelligent systems which make modifications any time.86 The
angel of solar shading changes in different daytime to obtain suitable thermal comfort.87 Solar
shading systems can be categorized regarding their placement; external, inter pane and internal.
External ones are situated on the outer surface of openings, inter pane are positioned between
panes and internal are located in the interior space. External shading systems are considered best
solution as sunlight is sent back prior to cross windows. They absorb some amount of heat which
distributes it to the environment through convection and radiation. However, external shadings
require more maintenance costs as they encounter variety of climate conditions. Internal shadings
radiate heat to interior space and as a result can avoid lower amount of heat gain.88
Figure 29: Exterior vs. interior solar shading89
86
http://www.es-so.com/documents/windowprotection.pdf, Date accessed 22.06.2013 87
http://mesteksa.com/fileuploads/Literature/PartnerAccounts/1614/ColtSolarShadingLouverSystemsBrochure.pdf Date accessed 20.06.2013 88 https://dspace.ist.utl.pt/bitstream/2295/143446/1/dissertacao.pdf Date accessed 25.06.2013
89http://webcache.googleusercontent.com/search?q=cache:1IdAcUH10gEJ:www.buildup.eu/system/
files/content/REHVA-Journal-Sep08-
OriginalDPD.pdf+solar+shading+types+pdf&cd=6&hl=de&ct=clnk&gl=de Date accessed 20.06.2013
35
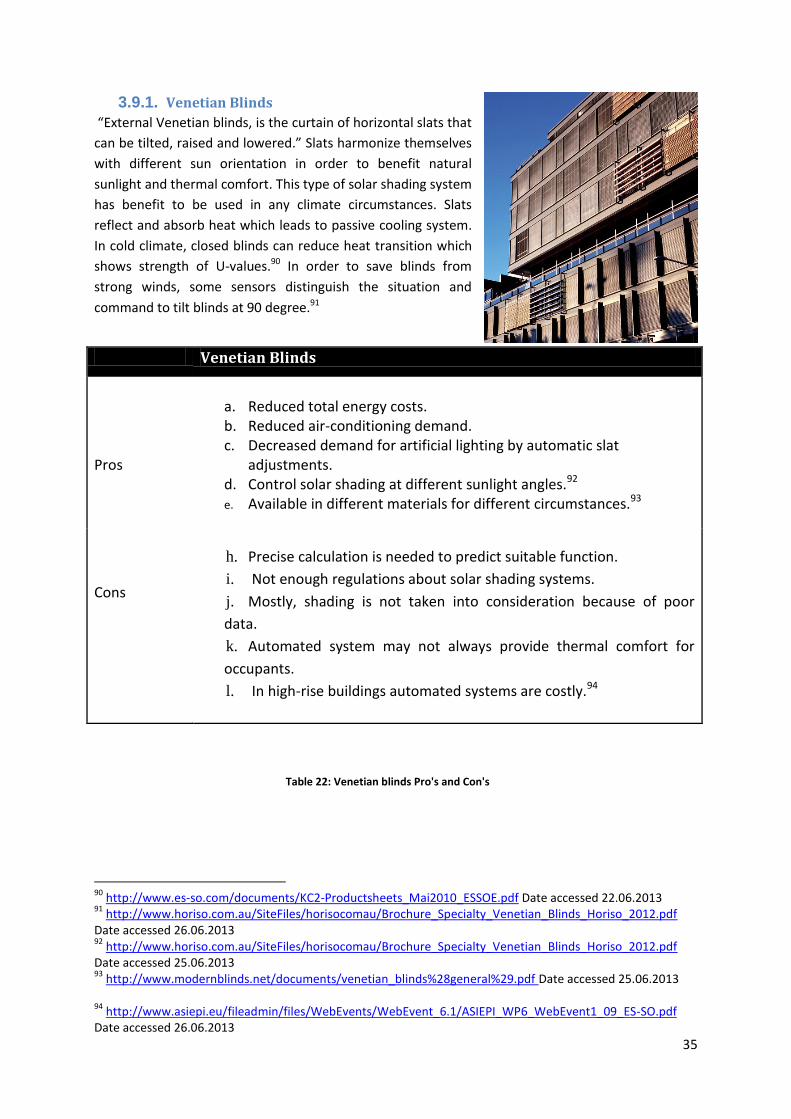
3.9.1. Venetian Blinds
“External Venetian blinds, is the curtain of horizontal slats that
can be tilted, raised and lowered.” Slats harmonize themselves
with different sun orientation in order to benefit natural
sunlight and thermal comfort. This type of solar shading system
has benefit to be used in any climate circumstances. Slats
reflect and absorb heat which leads to passive cooling system.
In cold climate, closed blinds can reduce heat transition which
shows strength of U-values.90 In order to save blinds from
strong winds, some sensors distinguish the situation and
command to tilt blinds at 90 degree.91
Table 22: Venetian blinds Pro's and Con's
90
http://www.es-so.com/documents/KC2-Productsheets_Mai2010_ESSOE.pdf Date accessed 22.06.2013 91
http://www.horiso.com.au/SiteFiles/horisocomau/Brochure_Specialty_Venetian_Blinds_Horiso_2012.pdf Date accessed 26.06.2013 92
http://www.horiso.com.au/SiteFiles/horisocomau/Brochure_Specialty_Venetian_Blinds_Horiso_2012.pdf Date accessed 25.06.2013 93
http://www.modernblinds.net/documents/venetian_blinds%28general%29.pdf Date accessed 25.06.2013 94
http://www.asiepi.eu/fileadmin/files/WebEvents/WebEvent_6.1/ASIEPI_WP6_WebEvent1_09_ES-SO.pdf Date accessed 26.06.2013
Venetian Blinds
Pros
a. Reduced total energy costs. b. Reduced air-conditioning demand. c. Decreased demand for artificial lighting by automatic slat
adjustments. d. Control solar shading at different sunlight angles.92 e. Available in different materials for different circumstances.93
Cons
h. Precise calculation is needed to predict suitable function.
i. Not enough regulations about solar shading systems.
j. Mostly, shading is not taken into consideration because of poor
data.
k. Automated system may not always provide thermal comfort for
occupants.
l. In high-rise buildings automated systems are costly.94
36
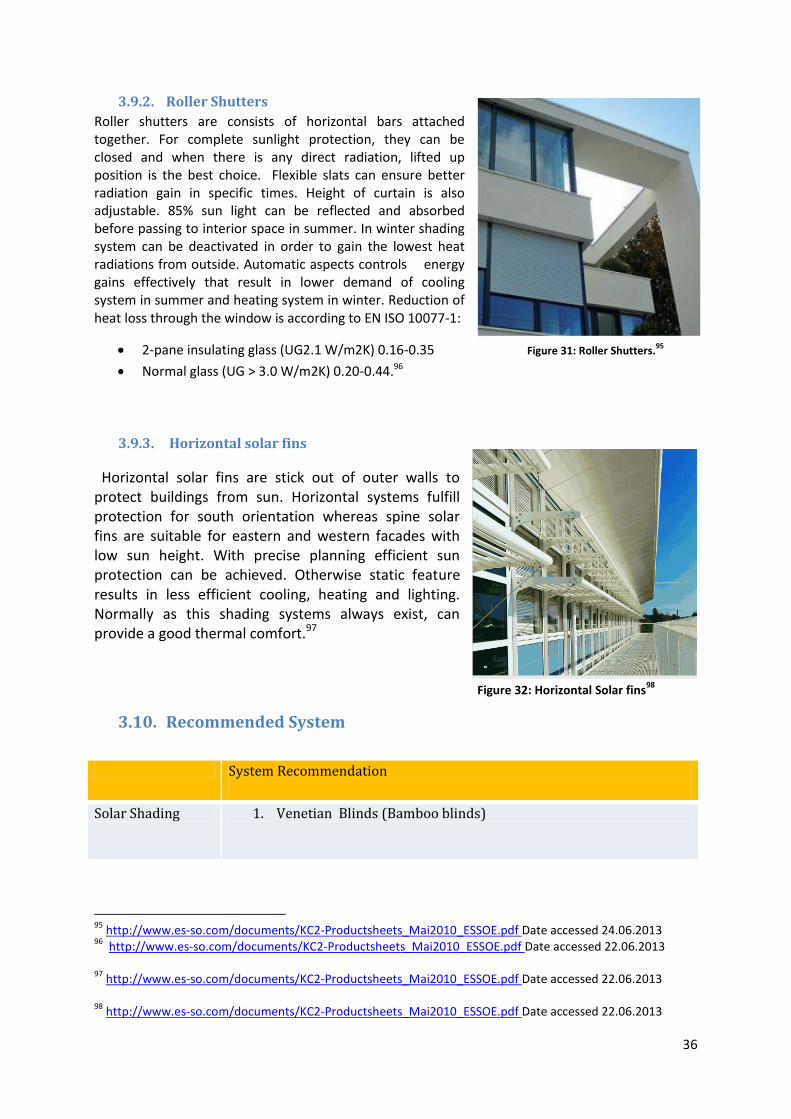
3.9.2. Roller Shutters
Roller shutters are consists of horizontal bars attached together. For complete sunlight protection, they can be closed and when there is any direct radiation, lifted up position is the best choice. Flexible slats can ensure better radiation gain in specific times. Height of curtain is also adjustable. 85% sun light can be reflected and absorbed before passing to interior space in summer. In winter shading system can be deactivated in order to gain the lowest heat radiations from outside. Automatic aspects controls energy gains effectively that result in lower demand of cooling system in summer and heating system in winter. Reduction of heat loss through the window is according to EN ISO 10077-1:
2-pane insulating glass (UG2.1 W/m2K) 0.16-0.35 Figure 31: Roller Shutters.95
Normal glass (UG > 3.0 W/m2K) 0.20-0.44.96
3.9.3. Horizontal solar fins
Horizontal solar fins are stick out of outer walls to protect buildings from sun. Horizontal systems fulfill protection for south orientation whereas spine solar fins are suitable for eastern and western facades with low sun height. With precise planning efficient sun protection can be achieved. Otherwise static feature results in less efficient cooling, heating and lighting. Normally as this shading systems always exist, can provide a good thermal comfort.97
Figure 32: Horizontal Solar fins
98
3.10. Recommended System
System Recommendation
Solar Shading 1. Venetian Blinds (Bamboo blinds)
95
http://www.es-so.com/documents/KC2-Productsheets_Mai2010_ESSOE.pdf Date accessed 24.06.2013 96
http://www.es-so.com/documents/KC2-Productsheets_Mai2010_ESSOE.pdf Date accessed 22.06.2013 97
http://www.es-so.com/documents/KC2-Productsheets_Mai2010_ESSOE.pdf Date accessed 22.06.2013 98
http://www.es-so.com/documents/KC2-Productsheets_Mai2010_ESSOE.pdf Date accessed 22.06.2013
37
4. Building energy consumption – After Refurbishment
4.1. Results of MIT design Software
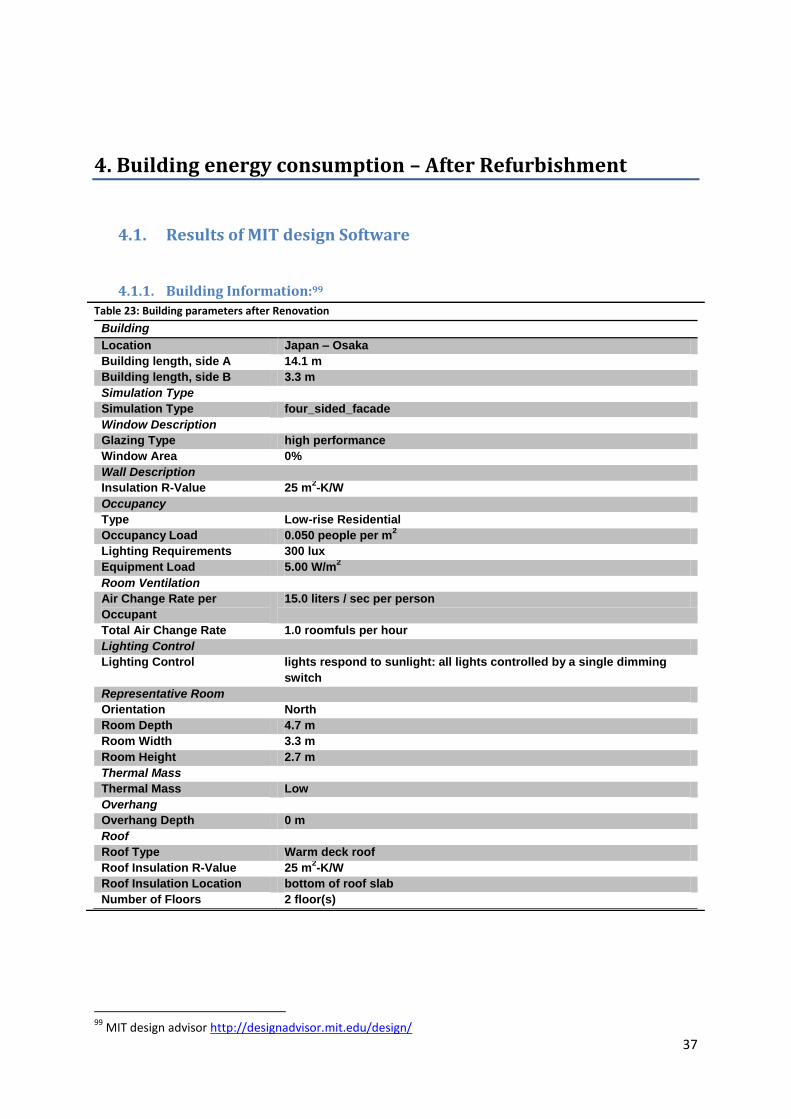
4.1.1. Building Information:99
Table 23: Building parameters after Renovation
Building
Location Japan – Osaka
Building length, side A 14.1 m
Building length, side B 3.3 m
Simulation Type
Simulation Type four_sided_facade
Window Description
Glazing Type high performance
Window Area 0%
Wall Description
Insulation R-Value 25 m2-K/W
Occupancy
Type Low-rise Residential
Occupancy Load 0.050 people per m2
Lighting Requirements 300 lux
Equipment Load 5.00 W/m2
Room Ventilation
Air Change Rate per
Occupant
15.0 liters / sec per person
Total Air Change Rate 1.0 roomfuls per hour
Lighting Control
Lighting Control lights respond to sunlight: all lights controlled by a single dimming
switch
Representative Room
Orientation North
Room Depth 4.7 m
Room Width 3.3 m
Room Height 2.7 m
Thermal Mass
Thermal Mass Low
Overhang
Overhang Depth 0 m
Roof
Roof Type Warm deck roof
Roof Insulation R-Value 25 m2-K/W
Roof Insulation Location bottom of roof slab
Number of Floors 2 floor(s)
99
MIT design advisor http://designadvisor.mit.edu/design/
38
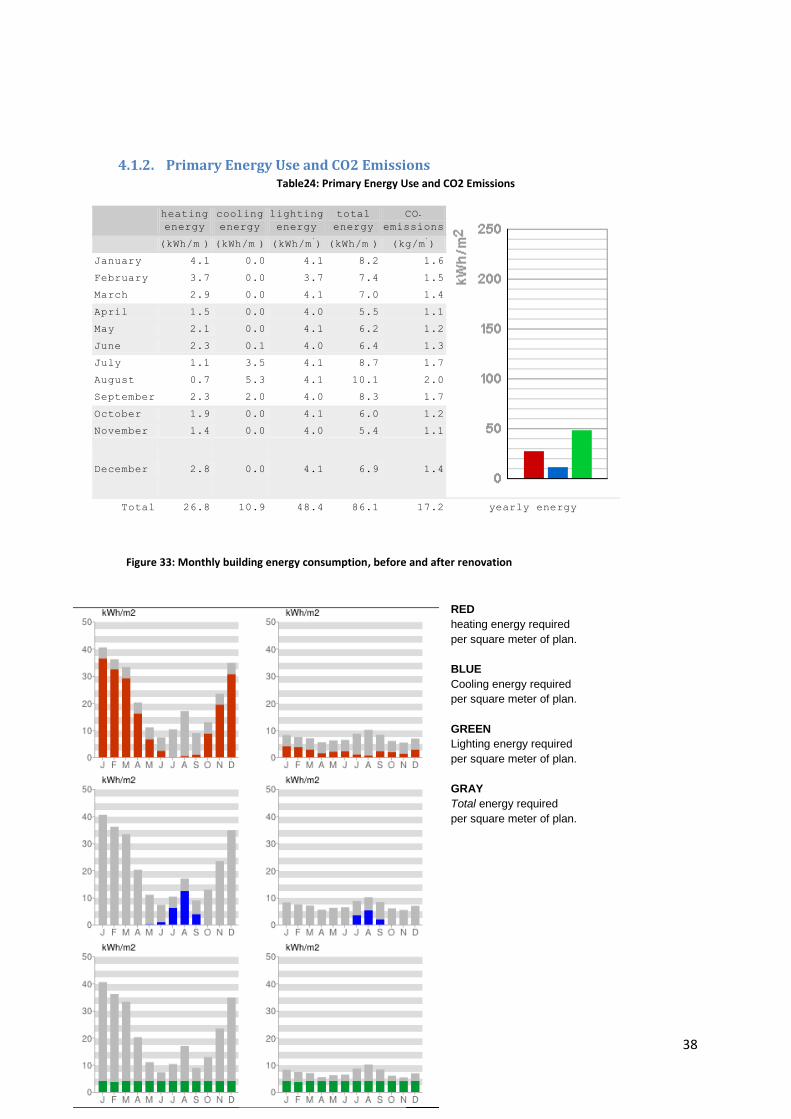
4.1.2. Primary Energy Use and CO2 Emissions Table24: Primary Energy Use and CO2 Emissions
heating
energy
cooling
energy
lighting
energy
total
energy
CO
emissions
(kWh/m ) (kWh/m ) (kWh/m ) (kWh/m ) (kg/m )
January 4.1 0.0 4.1 8.2 1.6
February 3.7 0.0 3.7 7.4 1.5
March 2.9 0.0 4.1 7.0 1.4
April 1.5 0.0 4.0 5.5 1.1
May 2.1 0.0 4.1 6.2 1.2
June 2.3 0.1 4.0 6.4 1.3
July 1.1 3.5 4.1 8.7 1.7
August 0.7 5.3 4.1 10.1 2.0
September 2.3 2.0 4.0 8.3 1.7
October 1.9 0.0 4.1 6.0 1.2
November 1.4 0.0 4.0 5.4 1.1
December 2.8 0.0 4.1 6.9 1.4
Total 26.8 10.9 48.4 86.1 17.2 yearly energy
RED
heating energy required
per square meter of plan.
BLUE
Cooling energy required
per square meter of plan.
GREEN
Lighting energy required
per square meter of plan.
GRAY
Total energy required
per square meter of plan.
Figure 33: Monthly building energy consumption, before and after renovation
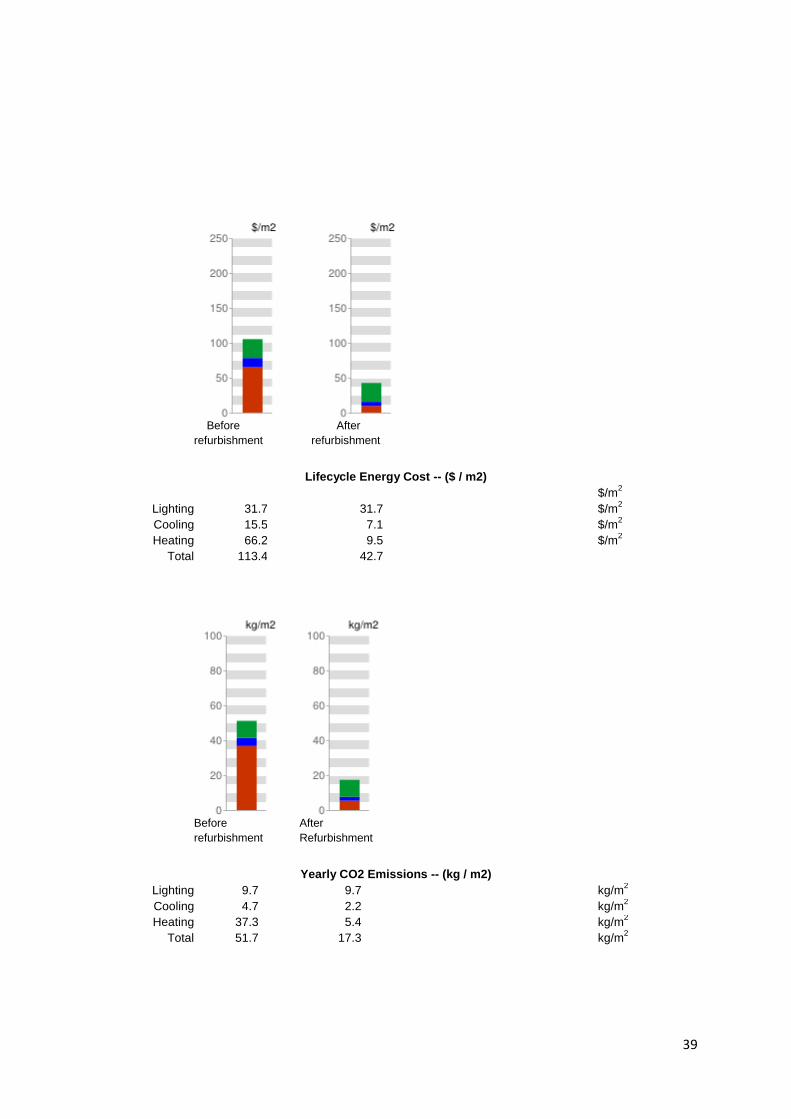
39
Before
refurbishment
After
refurbishment
Lifecycle Energy Cost -- ($ / m2)
Lighting
Cooling
Heating
Total
31.7
15.5
66.2
113.4
31.7
7.1
9.5
42.7
$/m2
$/m2
$/m2
$/m2
Before
refurbishment
After
Refurbishment
Yearly CO2 Emissions -- (kg / m2)
Lighting
Cooling
Heating
Total
9.7
4.7
37.3
51.7
9.7
2.2
5.4
17.3
kg/m2
kg/m2
kg/m2
kg/m2
40
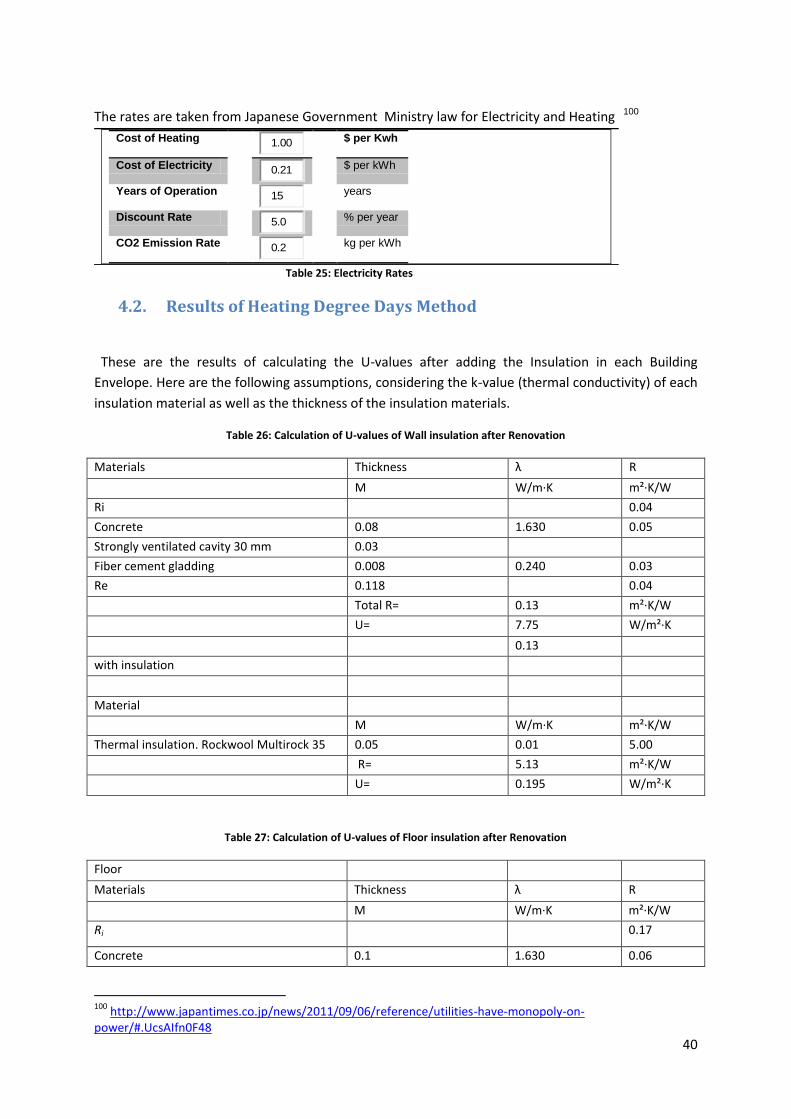
The rates are taken from Japanese Government Ministry law for Electricity and Heating 100
Cost of Heating
1.00
$ per Kwh
Cost of Electricity 0.21
$ per kWh
Years of Operation 15
years
Discount Rate 5.0
% per year
CO2 Emission Rate 0.2
kg per kWh
Table 25: Electricity Rates
4.2. Results of Heating Degree Days Method
These are the results of calculating the U-values after adding the Insulation in each Building
Envelope. Here are the following assumptions, considering the k-value (thermal conductivity) of each
insulation material as well as the thickness of the insulation materials.
Table 26: Calculation of U-values of Wall insulation after Renovation
Materials Thickness λ R
M W/m·K m²·K/W
Ri 0.04
Concrete 0.08 1.630 0.05
Strongly ventilated cavity 30 mm 0.03
Fiber cement gladding 0.008 0.240 0.03
Re 0.118 0.04
Total R= 0.13 m²·K/W
U= 7.75 W/m²·K
0.13
with insulation
Material
M W/m·K m²·K/W
Thermal insulation. Rockwool Multirock 35 0.05 0.01 5.00
R= 5.13 m²·K/W
U= 0.195 W/m²·K
Table 27: Calculation of U-values of Floor insulation after Renovation
Floor
Materials Thickness λ R
M W/m·K m²·K/W
Ri 0.17
Concrete 0.1 1.630 0.06
100
http://www.japantimes.co.jp/news/2011/09/06/reference/utilities-have-monopoly-on-power/#.UcsAIfn0F48
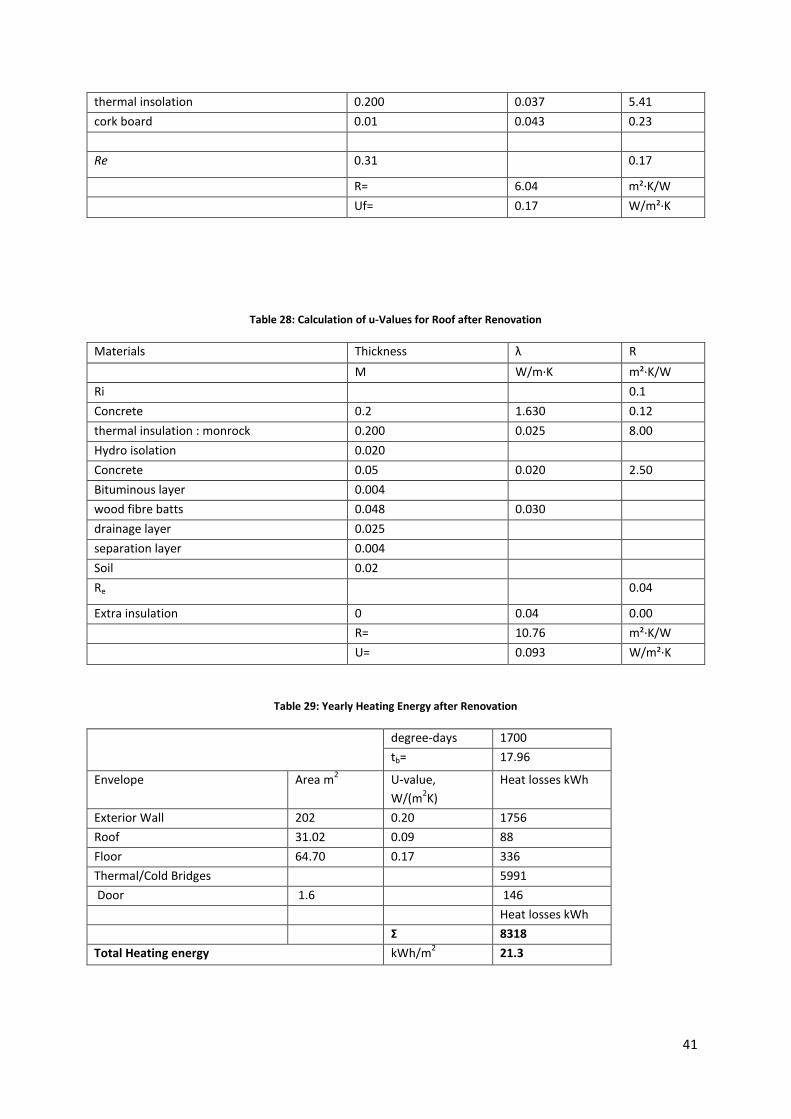
41
thermal insolation 0.200 0.037 5.41
cork board 0.01 0.043 0.23
Re 0.31 0.17
R= 6.04 m²·K/W
Uf= 0.17 W/m²·K
Table 28: Calculation of u-Values for Roof after Renovation
Materials Thickness λ R
M W/m·K m²·K/W
Ri 0.1
Concrete 0.2 1.630 0.12
thermal insulation : monrock 0.200 0.025 8.00
Hydro isolation 0.020
Concrete 0.05 0.020 2.50
Bituminous layer 0.004
wood fibre batts 0.048 0.030
drainage layer 0.025
separation layer 0.004
Soil 0.02
Re 0.04
Extra insulation 0 0.04 0.00
R= 10.76 m²·K/W
U= 0.093 W/m²·K
Table 29: Yearly Heating Energy after Renovation
degree-days 1700
tb= 17.96
Envelope Area m2 U-value,
W/(m2K)
Heat losses kWh
Exterior Wall 202 0.20 1756
Roof 31.02 0.09 88
Floor 64.70 0.17 336
Thermal/Cold Bridges 5991
Door 1.6 146
Heat losses kWh
Σ 8318
Total Heating energy kWh/m2 21.3
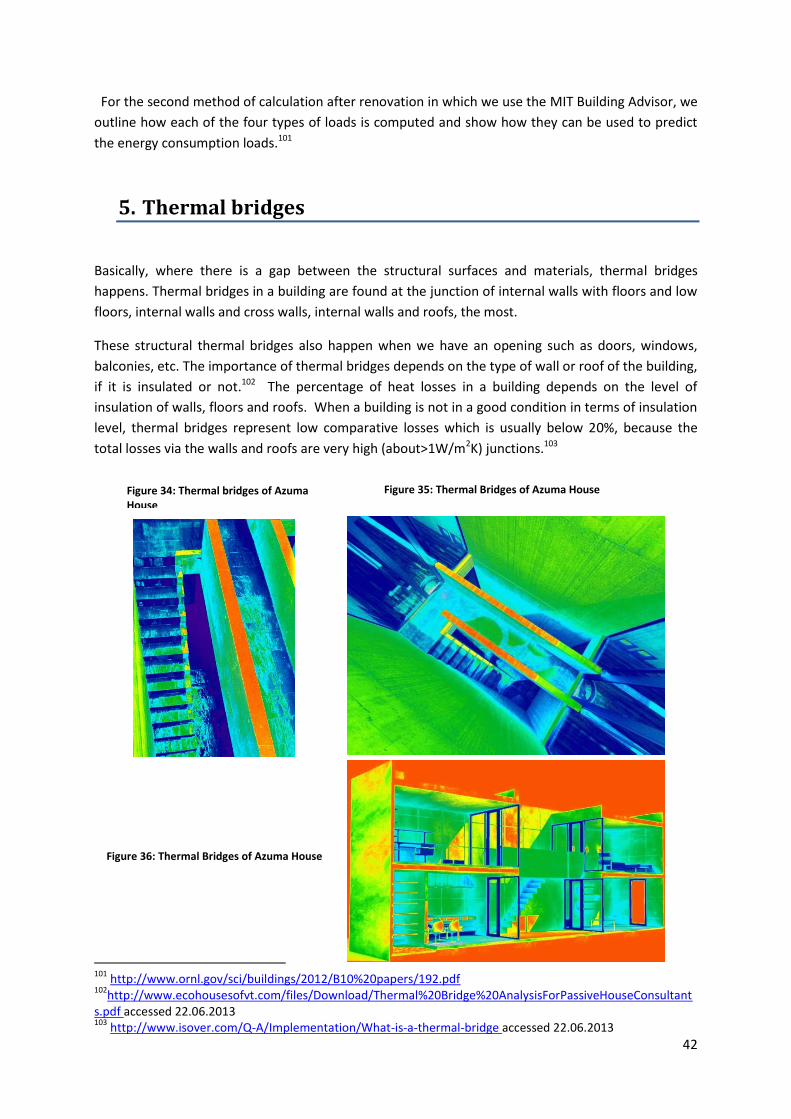
42
For the second method of calculation after renovation in which we use the MIT Building Advisor, we
outline how each of the four types of loads is computed and show how they can be used to predict
the energy consumption loads.101
5. Thermal bridges
Basically, where there is a gap between the structural surfaces and materials, thermal bridges
happens. Thermal bridges in a building are found at the junction of internal walls with floors and low
floors, internal walls and cross walls, internal walls and roofs, the most.
These structural thermal bridges also happen when we have an opening such as doors, windows,
balconies, etc. The importance of thermal bridges depends on the type of wall or roof of the building,
if it is insulated or not.102 The percentage of heat losses in a building depends on the level of
insulation of walls, floors and roofs. When a building is not in a good condition in terms of insulation
level, thermal bridges represent low comparative losses which is usually below 20%, because the
total losses via the walls and roofs are very high (about>1W/m2K) junctions.103
Figure 36: Thermal Bridges of Azuma House
101
http://www.ornl.gov/sci/buildings/2012/B10%20papers/192.pdf 102
http://www.ecohousesofvt.com/files/Download/Thermal%20Bridge%20AnalysisForPassiveHouseConsultants.pdf accessed 22.06.2013 103
http://www.isover.com/Q-A/Implementation/What-is-a-thermal-bridge accessed 22.06.2013
Figure 34: Thermal bridges of Azuma House
Figure 35: Thermal Bridges of Azuma House
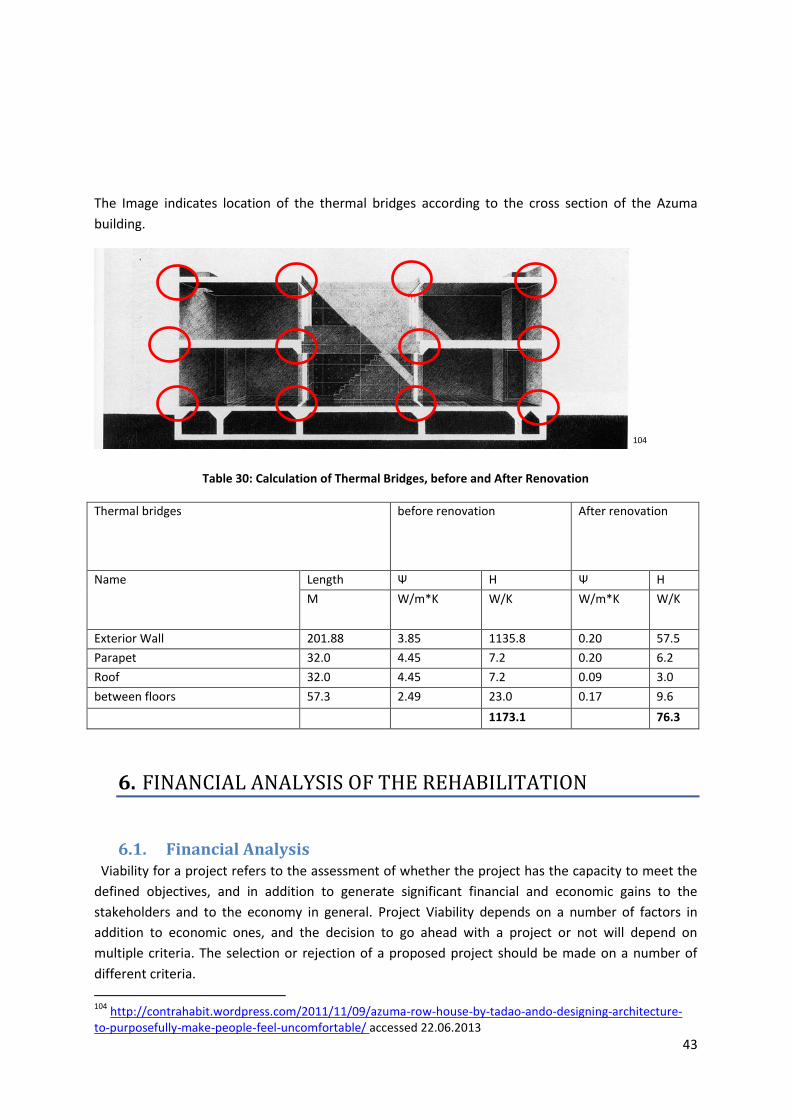
43
The Image indicates location of the thermal bridges according to the cross section of the Azuma
building.
104
Table 30: Calculation of Thermal Bridges, before and After Renovation
Thermal bridges before renovation After renovation
Name Length Ψ H Ψ H
M W/m*K W/K W/m*K W/K
Exterior Wall 201.88 3.85 1135.8 0.20 57.5
Parapet 32.0 4.45 7.2 0.20 6.2
Roof 32.0 4.45 7.2 0.09 3.0
between floors 57.3 2.49 23.0 0.17 9.6
1173.1 76.3
6. FINANCIAL ANALYSIS OF THE REHABILITATION
6.1. Financial Analysis Viability for a project refers to the assessment of whether the project has the capacity to meet the
defined objectives, and in addition to generate significant financial and economic gains to the
stakeholders and to the economy in general. Project Viability depends on a number of factors in
addition to economic ones, and the decision to go ahead with a project or not will depend on
multiple criteria. The selection or rejection of a proposed project should be made on a number of
different criteria.
104
http://contrahabit.wordpress.com/2011/11/09/azuma-row-house-by-tadao-ando-designing-architecture-to-purposefully-make-people-feel-uncomfortable/ accessed 22.06.2013
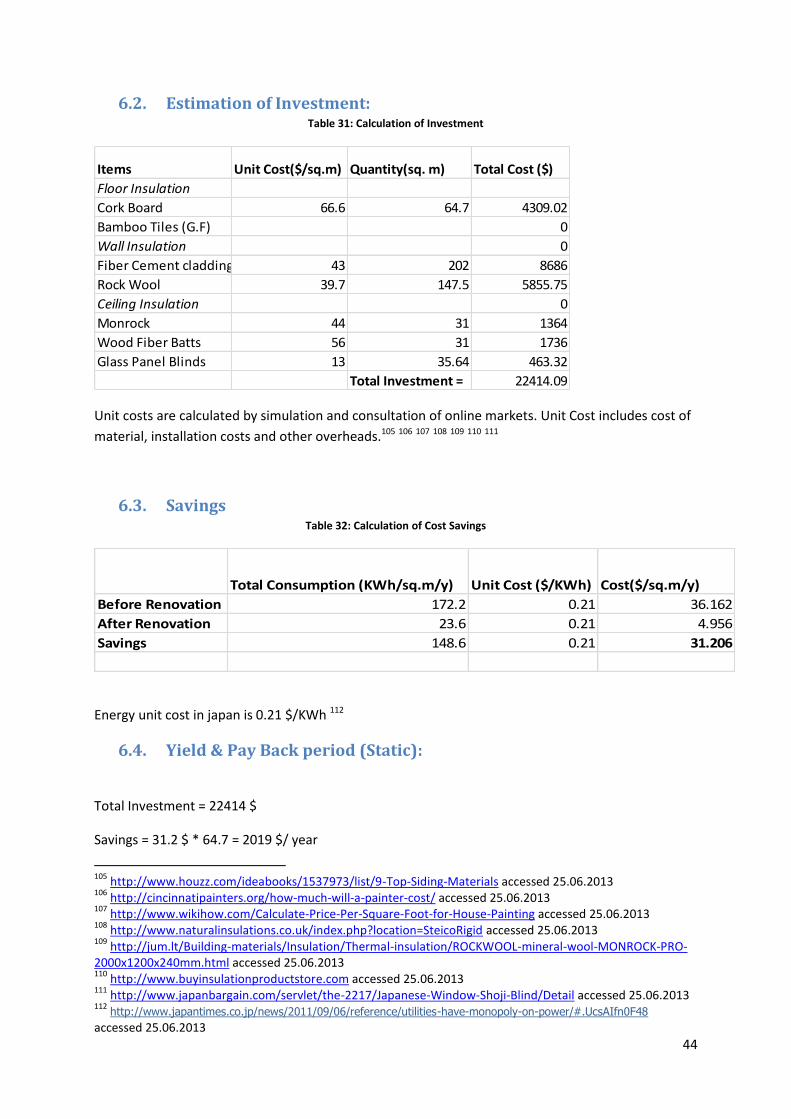
44
6.2. Estimation of Investment: Table 31: Calculation of Investment
Items Unit Cost($/sq.m) Quantity(sq. m) Total Cost ($)
Floor Insulation
Cork Board 66.6 64.7 4309.02
Bamboo Tiles (G.F) 0
Wall Insulation 0
Fiber Cement cladding 43 202 8686
Rock Wool 39.7 147.5 5855.75
Ceiling Insulation 0
Monrock 44 31 1364
Wood Fiber Batts 56 31 1736
Glass Panel Blinds 13 35.64 463.32
Total Investment = 22414.09
Unit costs are calculated by simulation and consultation of online markets. Unit Cost includes cost of
material, installation costs and other overheads.105 106 107 108 109 110 111
6.3. Savings Table 32: Calculation of Cost Savings
Total Consumption (KWh/sq.m/y) Unit Cost ($/KWh) Cost($/sq.m/y)
Before Renovation 172.2 0.21 36.162
After Renovation 23.6 0.21 4.956
Savings 148.6 0.21 31.206
Energy unit cost in japan is 0.21 $/KWh 112
6.4. Yield & Pay Back period (Static):
Total Investment = 22414 $
Savings = 31.2 $ * 64.7 = 2019 $/ year
105
http://www.houzz.com/ideabooks/1537973/list/9-Top-Siding-Materials accessed 25.06.2013 106
http://cincinnatipainters.org/how-much-will-a-painter-cost/ accessed 25.06.2013 107
http://www.wikihow.com/Calculate-Price-Per-Square-Foot-for-House-Painting accessed 25.06.2013 108
http://www.naturalinsulations.co.uk/index.php?location=SteicoRigid accessed 25.06.2013 109
http://jum.lt/Building-materials/Insulation/Thermal-insulation/ROCKWOOL-mineral-wool-MONROCK-PRO-2000x1200x240mm.html accessed 25.06.2013 110
http://www.buyinsulationproductstore.com accessed 25.06.2013 111
http://www.japanbargain.com/servlet/the-2217/Japanese-Window-Shoji-Blind/Detail accessed 25.06.2013 112
http://www.japantimes.co.jp/news/2011/09/06/reference/utilities-have-monopoly-on-power/#.UcsAIfn0F48 accessed 25.06.2013
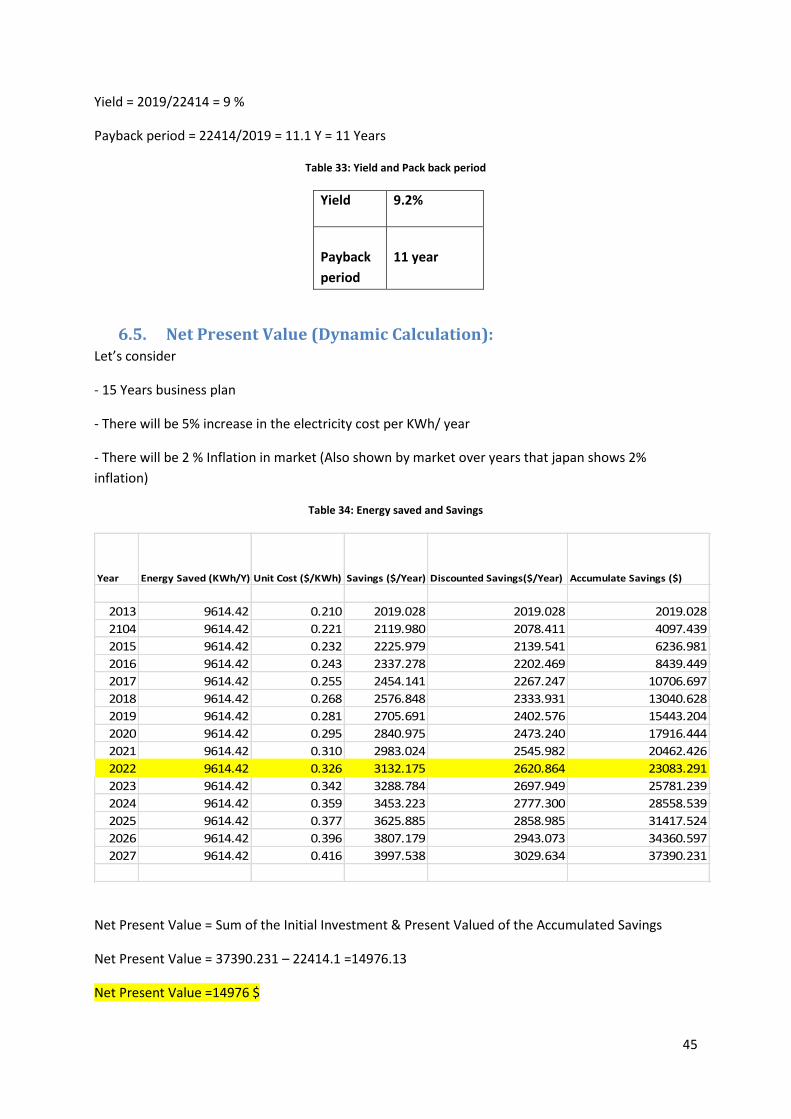
45
Yield = 2019/22414 = 9 %
Payback period = 22414/2019 = 11.1 Y = 11 Years
Table 33: Yield and Pack back period
Yield 9.2%
Payback
period
11 year
6.5. Net Present Value (Dynamic Calculation): Let’s consider
- 15 Years business plan
- There will be 5% increase in the electricity cost per KWh/ year
- There will be 2 % Inflation in market (Also shown by market over years that japan shows 2%
inflation)
Table 34: Energy saved and Savings
Year Energy Saved (KWh/Y) Unit Cost ($/KWh) Savings ($/Year) Discounted Savings($/Year) Accumulate Savings ($)
2013 9614.42 0.210 2019.028 2019.028 2019.028
2104 9614.42 0.221 2119.980 2078.411 4097.439
2015 9614.42 0.232 2225.979 2139.541 6236.981
2016 9614.42 0.243 2337.278 2202.469 8439.449
2017 9614.42 0.255 2454.141 2267.247 10706.697
2018 9614.42 0.268 2576.848 2333.931 13040.628
2019 9614.42 0.281 2705.691 2402.576 15443.204
2020 9614.42 0.295 2840.975 2473.240 17916.444
2021 9614.42 0.310 2983.024 2545.982 20462.426
2022 9614.42 0.326 3132.175 2620.864 23083.291
2023 9614.42 0.342 3288.784 2697.949 25781.239
2024 9614.42 0.359 3453.223 2777.300 28558.539
2025 9614.42 0.377 3625.885 2858.985 31417.524
2026 9614.42 0.396 3807.179 2943.073 34360.597
2027 9614.42 0.416 3997.538 3029.634 37390.231
Net Present Value = Sum of the Initial Investment & Present Valued of the Accumulated Savings
Net Present Value = 37390.231 – 22414.1 =14976.13
Net Present Value =14976 $
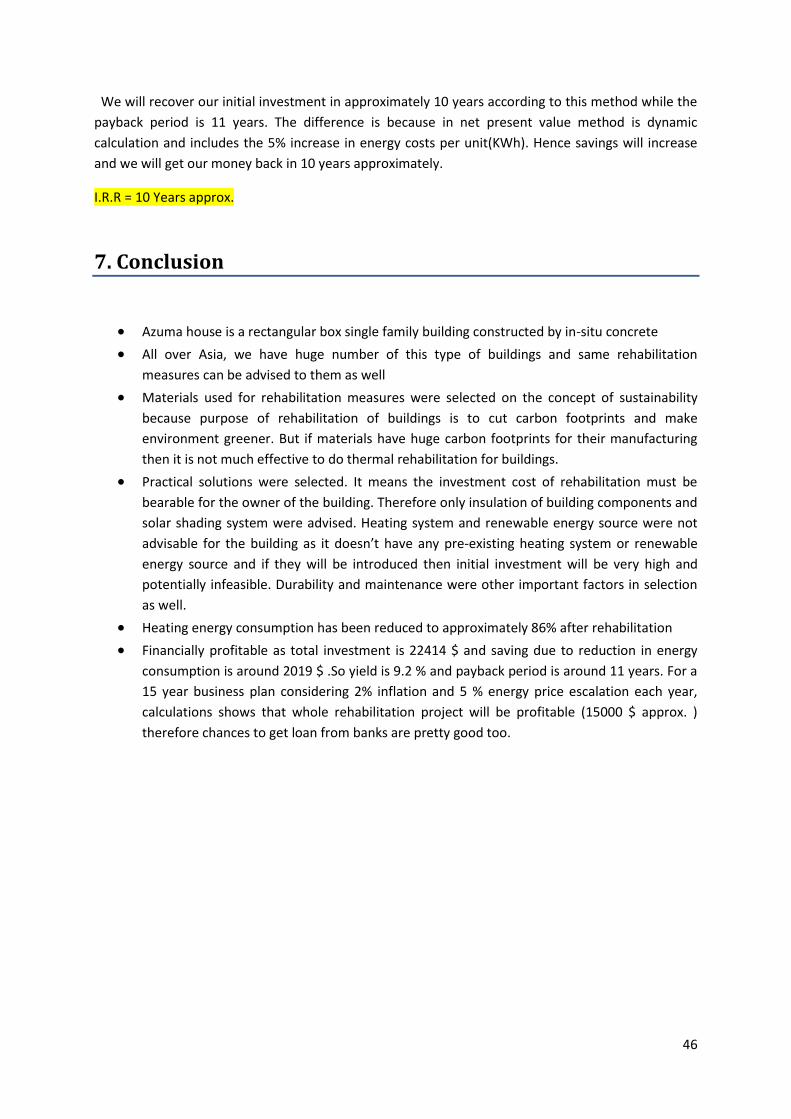
46
We will recover our initial investment in approximately 10 years according to this method while the
payback period is 11 years. The difference is because in net present value method is dynamic
calculation and includes the 5% increase in energy costs per unit(KWh). Hence savings will increase
and we will get our money back in 10 years approximately.
I.R.R = 10 Years approx.
7. Conclusion
Azuma house is a rectangular box single family building constructed by in-situ concrete
All over Asia, we have huge number of this type of buildings and same rehabilitation
measures can be advised to them as well
Materials used for rehabilitation measures were selected on the concept of sustainability
because purpose of rehabilitation of buildings is to cut carbon footprints and make
environment greener. But if materials have huge carbon footprints for their manufacturing
then it is not much effective to do thermal rehabilitation for buildings.
Practical solutions were selected. It means the investment cost of rehabilitation must be
bearable for the owner of the building. Therefore only insulation of building components and
solar shading system were advised. Heating system and renewable energy source were not
advisable for the building as it doesn’t have any pre-existing heating system or renewable
energy source and if they will be introduced then initial investment will be very high and
potentially infeasible. Durability and maintenance were other important factors in selection
as well.
Heating energy consumption has been reduced to approximately 86% after rehabilitation
Financially profitable as total investment is 22414 $ and saving due to reduction in energy
consumption is around 2019 $ .So yield is 9.2 % and payback period is around 11 years. For a
15 year business plan considering 2% inflation and 5 % energy price escalation each year,
calculations shows that whole rehabilitation project will be profitable (15000 $ approx. )
therefore chances to get loan from banks are pretty good too.