Embed Size (px)
Citation preview
Thermo-Mechanical Processing of Dual-Phase
Steels and Its Effects on the Work Hardening
Behaviour
By
Hossein Seyedrezai
A thesis submitted to the
Department of Mechanical and Materials Engineering
in conformity with the requirements for
the degree of Doctor of Philosophy
Queen’s University
Kingston, Ontario, Canada
December 2014
Copyright© Hossein Seyedrezai, 2014

To my Mother and Father
i
Abstract
This thesis focuses on understanding the relationship between the microstructure
and the different work hardening mechanisms of DP steels. Through the applica-
tion of various thermo-mechanical processing schedules prior to inter-critical (IC)
annealing, five distinctly different microstructural variants were produced. The work
hardening behaviour of the five microstructural variants was examined in terms of
the true work hardening rate, θ, the instantaneous work hardening exponent, n, and
the dislocation annihilation factor, h. Additionally, back stresses were measured in
selected microstructural variants having similar martensite volume fraction of ∼15%,
using a custom-made in-plane forward-reverse shear testing fixture.
At small strains (<2%), the work hardening behaviour was found to be domi-
nated by the introduction of back stresses and the generation of GNDs in the ferrite
matrix. The work hardening response at this stage was characterized by θǫp=0.5%
and a minimum value in the instantaneous work hardening exponent, nmin. Both of
these parameters were determined to be functions of√
f/d (f is the volume fraction
and d is the size of martensite particles), the mean ferrite grain size as well as the
morphology and spatial distribution of martensite particles.
At higher strains (2-3%), a maximum value in the instantaneous work hardening
exponent is reached (nmax). This parameter, which can be considered as the work
hardening capacity of the material, was found to be a function of mean ferrite grain
size but is independent of√
f/d. The relative contribution of back stresses was
also found to reach a constant value at a similar von Mises equivalent strain. This
observation suggests that at strains above those associated with nmax, other work
ii
hardening mechanisms become more important.
At strains over 4%, dislocation annihilation by dynamic recovery becomes the
controlling factor for the rate of work hardening. This phenomenon is described by
the dislocation annihilation factor, h, and is a function of√
f/d, the mean ferrite
grain size as well as the morphology and spatial distribution of martensite particles.
Finally, it was concluded that the ideal DP microstructure will contain a uniform
distribution of fine, equiaxed martensite particles in a fine, equiaxed ferrite matrix.
iii
Co-Authorship
This dissertation is based on the following manuscripts which are published, sub-
mitted or will be submitted for publication:
Chapter 3
H. Seyedrezai, A.K. Pilkey, J.D. Boyd, “Effect of Pre-IC Annealing Treat-
ments on the Final Microstructure and Work Hardening Behaviour of a
Dual-Phase Steel”, Published in: Materials Science and Engineering A,
vol. 594 (2014) pp. 178–188
Chapter 4
H. Seyedrezai, A.K. Pilkey, J.D. Boyd, “Effect of Ferrite Grain Size and
Spatial Distribution of Martensite Particles on the Work Hardening Be-
haviour of a Dual-Phase Steel”, Submitted to: Materials Science and
Engineering A (currently under review)
Chapter 5
H. Seyedrezai, A.K. Pilkey, J.D. Boyd, “Measurement of Back Stress
Contribution to Work Hardening”, Will be condensed and submitted to:
Materials Science and Engineering A or Acta Materialia
The work presented in this dissertation is original and my own with co-authors
acting in an advisory capacity.
iv
Acknowledgements
I would like to start by thanking my supervisors Professor Doug Boyd and
Professor Keith Pilkey for their guidance and support during my work at Queen’s
University. They were with me every step of the way and they gave me the knowl-
edge and understanding required to be a better researcher. The completion of this
thesis would have not been possible without their continued advice, patience, encour-
agement and friendship.
I am grateful to Professor Bradley Diak for his advice on mechanical testing proce-
dures and equipment. A big thank you also goes to Mr. Charlie Cooney. His endless
help and guidance in the lab made all of my experimental challenges easier. Further-
more, the McLaughlin Hall Machine Shop members, especially Mr. Andy Bryson, are
appreciated for their understanding and support. I would also like to acknowledge
the financial support of the AUTO21 NCE and the Natural Sciences and Engineering
Research Council of Canada (NSERC).
Of course, many thanks go to my friends and colleagues who made my journey
at Queen’s more rewarding. There are simply too many people to name but specifi-
cally, I am grateful to (alphabetical order): Grant Bell, Jasmine Chiang, Christopher
Cochrane, Andrew Sloan and Christopher Walasek.
Finally, I am forever grateful to my family; to my mom and dad, who have been
providing me with endless love, support and encouragement all of my life, without
which, I would have not been the man that I am today. And to my sister, Shadi, who
has always been there for me with her kindness and care.
v
Table of Contents
Abstract ii
Co-Authorship iv
Acknowledgements v
List of Tables xi
List of Figures xiii
List of Abbreviations xviii
List of Symbols xix
Chapter 1: Introduction 1
1.1 Background . . . . . . . . . . . . . . . . . . . . . . . . . . . . . . . . 1
1.1.1 Dual-Phase Steels in the Automotive Industry . . . . . . . . . 1
1.2 Motivation . . . . . . . . . . . . . . . . . . . . . . . . . . . . . . . . . 3
1.3 Research Objectives . . . . . . . . . . . . . . . . . . . . . . . . . . . . 4
1.4 Organization of the Thesis . . . . . . . . . . . . . . . . . . . . . . . . 5
1.5 References . . . . . . . . . . . . . . . . . . . . . . . . . . . . . . . . . 6
Chapter 2: Literature Survey 8
2.1 Introduction . . . . . . . . . . . . . . . . . . . . . . . . . . . . . . . . 8
2.2 Processing of DP Steels . . . . . . . . . . . . . . . . . . . . . . . . . . 8
vi
2.2.1 Inter-Critical Annealing . . . . . . . . . . . . . . . . . . . . . 10
2.3 Mechanical Behaviour . . . . . . . . . . . . . . . . . . . . . . . . . . 14
2.3.1 Yielding . . . . . . . . . . . . . . . . . . . . . . . . . . . . . . 15
2.3.1.1 Residual Stresses . . . . . . . . . . . . . . . . . . . . 15
2.3.1.2 Transformation Dislocations . . . . . . . . . . . . . . 16
2.3.2 Work Hardening . . . . . . . . . . . . . . . . . . . . . . . . . 20
2.3.2.1 Back-Stress Hardening . . . . . . . . . . . . . . . . . 24
2.3.2.2 Geometrically Necessary Dislocations . . . . . . . . . 28
2.4 References . . . . . . . . . . . . . . . . . . . . . . . . . . . . . . . . . 32
Chapter 3: Effect of Pre-IC Annealing Treatments on the Final Mi-
crostructure and Work Hardening Behaviour of a Dual-
Phase Steel 37
3.1 Introduction . . . . . . . . . . . . . . . . . . . . . . . . . . . . . . . . 38
3.2 Experimental Procedure . . . . . . . . . . . . . . . . . . . . . . . . . 40
3.2.1 Materials . . . . . . . . . . . . . . . . . . . . . . . . . . . . . 40
3.2.2 Heat Treatments . . . . . . . . . . . . . . . . . . . . . . . . . 41
3.2.3 Microstructure Characterization . . . . . . . . . . . . . . . . . 43
3.2.4 Mechanical Testing . . . . . . . . . . . . . . . . . . . . . . . . 45
3.3 Results . . . . . . . . . . . . . . . . . . . . . . . . . . . . . . . . . . . 46
3.3.1 Microstructures . . . . . . . . . . . . . . . . . . . . . . . . . . 46
3.3.2 Uniaxial Tensile Behaviour . . . . . . . . . . . . . . . . . . . . 53
3.4 Discussion . . . . . . . . . . . . . . . . . . . . . . . . . . . . . . . . . 56
3.4.1 Microstructure . . . . . . . . . . . . . . . . . . . . . . . . . . 56
3.4.2 Uniaxial Tensile Behaviour . . . . . . . . . . . . . . . . . . . . 58
3.4.2.1 True work hardening rate . . . . . . . . . . . . . . . 59
vii
3.4.2.2 Instantaneous work hardening rate . . . . . . . . . . 63
3.4.2.3 Dislocation annihilation factor . . . . . . . . . . . . . 65
3.5 Conclusions . . . . . . . . . . . . . . . . . . . . . . . . . . . . . . . . 68
3.6 Acknowledgments . . . . . . . . . . . . . . . . . . . . . . . . . . . . . 70
3.7 References . . . . . . . . . . . . . . . . . . . . . . . . . . . . . . . . . 71
Chapter 4: Effect of Ferrite Grain Size and Spatial Distribution of
Martensite Particles on the Work Hardening Behaviour
of a Dual-Phase Steel 74
4.1 Introduction . . . . . . . . . . . . . . . . . . . . . . . . . . . . . . . . 75
4.2 Experimental Procedure . . . . . . . . . . . . . . . . . . . . . . . . . 76
4.2.1 Materials . . . . . . . . . . . . . . . . . . . . . . . . . . . . . 76
4.2.2 Thermo-Mechanical Processing . . . . . . . . . . . . . . . . . 77
4.2.3 Microstructure Characterization . . . . . . . . . . . . . . . . . 79
4.2.4 Mechanical Testing . . . . . . . . . . . . . . . . . . . . . . . . 80
4.3 Results . . . . . . . . . . . . . . . . . . . . . . . . . . . . . . . . . . . 81
4.3.1 Microstructures . . . . . . . . . . . . . . . . . . . . . . . . . . 81
4.3.2 Uniaxial Tensile Behaviour . . . . . . . . . . . . . . . . . . . . 88
4.4 Discussion . . . . . . . . . . . . . . . . . . . . . . . . . . . . . . . . . 91
4.4.1 Microstructures . . . . . . . . . . . . . . . . . . . . . . . . . . 91
4.4.2 Uniaxial Tensile Behaviour . . . . . . . . . . . . . . . . . . . . 94
4.4.2.1 True Work Hardening Rate . . . . . . . . . . . . . . 96
4.4.2.2 Instantaneous Work Hardening Rate . . . . . . . . . 100
4.4.2.3 Dislocation Annihilation Factor . . . . . . . . . . . . 102
4.5 Conclusions . . . . . . . . . . . . . . . . . . . . . . . . . . . . . . . . 106
4.6 Acknowledgments . . . . . . . . . . . . . . . . . . . . . . . . . . . . . 107
viii
4.7 References . . . . . . . . . . . . . . . . . . . . . . . . . . . . . . . . . 108
Chapter 5: Measurement of Back Stress Contribution toWork Hard-
ening 112
5.1 Introduction . . . . . . . . . . . . . . . . . . . . . . . . . . . . . . . . 112
5.2 Experimental Procedure . . . . . . . . . . . . . . . . . . . . . . . . . 118
5.2.1 Shear Specimen Geometry . . . . . . . . . . . . . . . . . . . . 118
5.2.2 Shear Fixture . . . . . . . . . . . . . . . . . . . . . . . . . . . 121
5.2.3 Stress and Strain Measurements . . . . . . . . . . . . . . . . . 126
5.2.4 Shear Experiments . . . . . . . . . . . . . . . . . . . . . . . . 128
5.2.5 Shear Data Analysis . . . . . . . . . . . . . . . . . . . . . . . 132
5.2.5.1 Calibration Experiments . . . . . . . . . . . . . . . . 132
5.2.5.2 Back Stress Experiments . . . . . . . . . . . . . . . . 135
5.3 Results . . . . . . . . . . . . . . . . . . . . . . . . . . . . . . . . . . . 135
5.3.1 Calibration . . . . . . . . . . . . . . . . . . . . . . . . . . . . 135
5.3.1.1 Strain Maps . . . . . . . . . . . . . . . . . . . . . . . 135
5.3.1.2 Shear Stress - Shear Strain Plots . . . . . . . . . . . 140
5.3.1.3 Back Stress Calculations . . . . . . . . . . . . . . . . 143
5.3.2 Back Stress Experiments . . . . . . . . . . . . . . . . . . . . . 145
5.4 Discussion . . . . . . . . . . . . . . . . . . . . . . . . . . . . . . . . . 155
5.5 Conclusions . . . . . . . . . . . . . . . . . . . . . . . . . . . . . . . . 163
5.6 References . . . . . . . . . . . . . . . . . . . . . . . . . . . . . . . . . 165
Chapter 6: Complementary Discussion 169
6.1 Microstructure Evolution During IC Annealing . . . . . . . . . . . . . 169
6.2 Effect of Microstructural Parameters on Work Hardening of DP steels 171
ix
6.3 Practical Implications of the Present Research . . . . . . . . . . . . . 178
6.4 References . . . . . . . . . . . . . . . . . . . . . . . . . . . . . . . . . 181
Chapter 7: Conclusions and Future Work 182
7.1 Conclusions . . . . . . . . . . . . . . . . . . . . . . . . . . . . . . . . 182
7.2 Original Contributions to the Field . . . . . . . . . . . . . . . . . . . 184
7.3 Future Work . . . . . . . . . . . . . . . . . . . . . . . . . . . . . . . . 186
Appendix A: Specimen Designation Conversions 189
Appendix B: Kocks-Mecking Fitting Procedure 190
Appendix C: Technical Drawings of the Shear Fixture 191
x
List of Tables
3.1 Chemical compositions of DP780-CR and IF steel sheets (in wt. %). . 41
3.2 Summary of specimens and their respective heat treatment schedules 43
3.3 Martensite particle measurements for microstructures shown in Figure
3.2 . . . . . . . . . . . . . . . . . . . . . . . . . . . . . . . . . . . . . 52
3.4 Carbide particle measurements for microstructures shown in Figure 3.2 52
3.5 Martensite particle measurements for three different starting condi-
tions after IC annealing at 735◦C . . . . . . . . . . . . . . . . . . . . 58
3.6 Work hardening rates, θ, at plastic strain of 0.5% and dislocation an-
nihilation factor, h, for the uniaxial tensile data shown in Figure 3.4. 68
4.1 Chemical composition (in wt. %) of DP780-CR and DP780-HB steel
sheets . . . . . . . . . . . . . . . . . . . . . . . . . . . . . . . . . . . 77
4.2 Summary of TMP schedules for the three microstructure variants . . 78
4.3 Ferrite and martensite measurements for microstructures shown in Fig-
ure 4.3 . . . . . . . . . . . . . . . . . . . . . . . . . . . . . . . . . . . 86
4.4 Uniaxial Tensile parameters calculated from Figure 4.4a . . . . . . . . 91
4.5 The dislocation annihilation factor, h, and the uniform elongation val-
ues for the three microstructural variants of Figure 4.4. . . . . . . . . 105
5.1 Chemical composition of the steels used in this research . . . . . . . . 128
5.2 Details of the shear testing calibration experiments . . . . . . . . . . 130
5.3 Microstructural parameters of the five DP780 microstructural variants
with similar volume fraction of martensite particles . . . . . . . . . . 130
xi
5.4 Details of the back stress experiments for the DP780 microstructural
variants . . . . . . . . . . . . . . . . . . . . . . . . . . . . . . . . . . 131
5.5 Comparison of the experimental back stress values (0.002 offset method)
with the permanent softening back stress defined as 0.5 × ∆τPS for
DP780 microstructural variants after average real forward pre-shear
strain of 0.263 ± 0.015 . . . . . . . . . . . . . . . . . . . . . . . . . . 154
5.6 Comparison of the experimental back stress values (0.002 offset) with
the predictions of the B & S model for DP780 microstructural variants
after average real forward pre-shear strain of 0.263 ± 0.015 . . . . . . 156
5.7 The Bauschinger stress parameter (β0.002σ ) obtained from forward-reverse
shear tests of DP780 microstructural variants and IF steel after average
real forward pre-shear strain of 0.263 ± 0.015 . . . . . . . . . . . . . 162
A.1 Specimen designation conversions . . . . . . . . . . . . . . . . . . . . 189
xii
List of Figures
1.1 Plots of the uniform elongation values for different steel microstructures
with respect to their tensile strength . . . . . . . . . . . . . . . . . . 2
2.1 Schematic of a typical industrial galvannealing schedule for the pro-
duction of dual-phase steel . . . . . . . . . . . . . . . . . . . . . . . . 10
2.2 Tensile behaviour of DP steels in comparison with other HSLA steels 15
2.3 Mobile dislocations near ferrite/martensite interface . . . . . . . . . . 17
2.4 Application of EBSD in calculating GND distribution . . . . . . . . . 18
2.5 Micro-pillar test results showing variations of ferrite strength at ferrite
grain interior and at the locations close to the ferrite/martensite interface 19
2.6 An example of a Hollomon analysis of DP steel’s tensile behaviour . . 21
2.7 An example of Jaoul-Crussard analysis of DP steel’s tensile behaviour 22
2.8 Plastic inhomogeneity in a DP microstructure captured by a Digital
Image Correlation (DIC) technique . . . . . . . . . . . . . . . . . . . 22
2.9 Variation in the magnitude of back stresses as a function of pre-strain
in a DP steel . . . . . . . . . . . . . . . . . . . . . . . . . . . . . . . 27
2.10 Schematic representation of the evolution of SSD and GND densities
with strain . . . . . . . . . . . . . . . . . . . . . . . . . . . . . . . . . 30
3.1 SEM micrographs of the CR, AT, Q2T, Q7T and Q12T conditions . . 48
3.2 SEM micrographs of the CR+IC25, AT+IC20 and Q7T+IC35 mi-
crostructural variants at both low and high magnifications . . . . . . 51
xiii
3.3 Bright field TEM image of a thin foil and a carbon extraction replica
specimens obtained from the Q7T+IC35 microstructural variant . . . 52
3.4 Engineering stress-strain tensile curves and the instantaneous work
hardening versus engineering strain plots for the CR+IC25, AT+IC20
and Q7T+IC35 microstructural variants . . . . . . . . . . . . . . . . 54
3.5 Engineering stress-strain curves for CR+IC microstructural variants
tested along RD and TD directions . . . . . . . . . . . . . . . . . . . 55
3.6 SEM micrograph of the Q2T+IC20 (30) specimen. The heat treat-
ment history involves the QT (920◦C) pre-treatment followed by IC
annealing at 720◦C for 30 minutes. . . . . . . . . . . . . . . . . . . . 57
3.7 The true work hardening rate, θ, plotted as a function of√
f/d for
the CR+IC, AT+IC and QT+IC microstructural variants at plastic
strains of 0.5%, 2% and 5% . . . . . . . . . . . . . . . . . . . . . . . 60
3.8 Minimum and maximum instantaneous hardening exponents, nmin and
nmax, plotted as a function of√
f/d for CR+IC, AT+IC and QT+IC
microstructural variants . . . . . . . . . . . . . . . . . . . . . . . . . 64
3.9 Dislocation annihilation factor, h, plotted as a function of√
f/d for
the CR+IC, AT+IC and QT+IC microstructural variants . . . . . . 67
4.1 SEM micrographs of the HB, AT and QT conditions . . . . . . . . . 82
4.2 SEM micrographs of the CR, AT+CR8 and QT+CR8 conditions . . . 84
4.3 SEMmicrographs of CR+IC725, AT+CR8+IC720 and QT+CR8+IC720
microstructural variants at both low and high magnifications . . . . . 87
4.4 Engineering stress-strain tensile curves and the instantaneous work
hardening vs. engineering strain plots for the CR+IC725, AT+CR8+IC720
and QT+CR8+IC720 microstructural variants . . . . . . . . . . . . . 90
xiv
4.5 Microstructure of the QT+CR8 specimen heated to the IC annealing
temperature and immediately quenched without any holding time . . 94
4.6 The true work hardening rate, θ, plotted as a function of√
f/d for the
CR+IC, AT+CR8+IC and QT+CR8+IC microstructural variants at
plastic strains of 0.5% and 2% . . . . . . . . . . . . . . . . . . . . . . 97
4.7 Minimum and maximum instantaneous hardening exponents, nmin and
nmax, plotted as a function of√
f/d for the CR+IC, AT+CR8+IC and
QT+CR8+IC microstructural variants . . . . . . . . . . . . . . . . . 101
4.8 Dislocation annihilation factor, h, plotted as a function of√
f/d for
the CR+IC, AT+CR8+IC and QT+CR8+IC microstructural variants 104
5.1 Schematic of forward-reverse deformation test results . . . . . . . . . 113
5.2 Geometry of the shear specimen . . . . . . . . . . . . . . . . . . . . . 121
5.3 The shear fixture . . . . . . . . . . . . . . . . . . . . . . . . . . . . . 123
5.4 The shear test assembly procedure . . . . . . . . . . . . . . . . . . . 125
5.5 Example of imposed grid pattern: “Full Grid” specimen used for cal-
ibration tests and “Camera Grid” specimen used in both calibration
and back-stress experiments . . . . . . . . . . . . . . . . . . . . . . . 127
5.6 Details of the offset and the softening (τF−τR) methods used in analysis
of the shear results . . . . . . . . . . . . . . . . . . . . . . . . . . . . 134
5.7 IF steel specimen after forward shear (5mm displacement) . . . . . . 136
5.8 Distribution of normal and shear strain in IF steel specimen prior to
reverse loading (5mm forward displacement) . . . . . . . . . . . . . . 137
5.9 Distribution of normal and shear strain in IF steel specimen at the
end of the reverse loading after the initial forward deformation (5mm
forward-5mm reverse displacements) . . . . . . . . . . . . . . . . . . 139
xv
5.10 Shear strains measured in the left shear zone plotted against shear
strains in the right shear zone . . . . . . . . . . . . . . . . . . . . . . 140
5.11 Total shear and accumulative shear plots for IF steel . . . . . . . . . 142
5.12 Back stress (τ offsetB ) measurements plotted against forward pre-shear
strain for the calibration IF steel specimens . . . . . . . . . . . . . . 144
5.13 τF −τR plotted against reverse shear strains for the calibration IF steel
specimens . . . . . . . . . . . . . . . . . . . . . . . . . . . . . . . . . 145
5.14 Accumulative shear stress-shear strain (raw) plots for DP780 microstruc-
tural variants . . . . . . . . . . . . . . . . . . . . . . . . . . . . . . . 146
5.15 Evolution of Back stress (τ 0.002B ) as a function of forward pre-shear for
the DP780 microstructural variants . . . . . . . . . . . . . . . . . . . 150
5.16 τF − τR plotted against reverse shear strains for all forward pre-shear
experiments . . . . . . . . . . . . . . . . . . . . . . . . . . . . . . . . 152
5.17 Bauschinger stress parameter, β0.002σ , plotted as a function of forward
pre-shear strain for DP780 microstructural variants . . . . . . . . . . 162
6.1 The true work hardening rate at ǫP = 0.5% (θǫP=0.5%), and the min-
imum instantaneous work hardening exponents, nmin, for the five DP
steel microstructural variants investigated in this research . . . . . . . 173
6.2 The maximum instantaneous work hardening exponents, nmax, for the
five DP steel microstructural variants investigated in this research . . 175
6.3 Uniform elongation values of the five DP steel microstructural variants
plotted against their respective tensile strengths . . . . . . . . . . . . 178
B.1 Example of the Kocks-Mecking fitting procedure . . . . . . . . . . . . 190
C.1 Drawing of the Shear Specimen . . . . . . . . . . . . . . . . . . . . . 192
xvi
C.2 Drawing of the Shear Fixture’s Base . . . . . . . . . . . . . . . . . . 193
C.3 Drawing of the Shear Fixture’s Cover . . . . . . . . . . . . . . . . . . 194
C.4 Drawing of the Shear Fixture’s Plunger . . . . . . . . . . . . . . . . . 195
C.5 Drawing of the Shear Fixture’s Spacer . . . . . . . . . . . . . . . . . 196
C.6 Drawing of the Shear Fixture’s Connector to the Instron . . . . . . . 197
xvii
List of Abbreviations
A1 Eutectoid transformation temperature
A3 Austenite/Austenite+Ferrite transformation temperature
AHSS Advanced High Strength Steel
B & S Brown and Stobbs (model)
DP Dual-Phase (steel)
GND Geometrically Necessary Dislocations
HSLA High-Strength Low-Alloy (steel)
IC Inter-Critical (annealing)
IF Interstitial-Free (steel)
KM Kocks-Mecking (model)
SSD Statistically Stored Dislocations
Stage 1, 2, 3 Stages 1, 2 and 3 of work hardening for DP steels based on the
Jaoul-Crussard analysis
Stage I, II, III Stages I, II and III of work hardening for single crystals
Stage A, B, C Stages A, B and C of work hardening for DP steels based on the
instantaneous work hardening exponent analysis
UTS Ultimate Tensile Strength
xviii

List of Symbols
b Burgers vector
C carbon content, wt.%
D ferrite grain diameter (size)
d martensite particle diameter (size)
E modulus of elasticity
f volume fraction of martensite
h dislocation annihilation factor
n instantaneous work hardening exponent
m Ludwik work hardening exponent
r martensite particle radius
βOffsetσ Bauschinger stress parameter (offset method)
γ shear strain
γp plastic shear strain
γ∗
p unrelaxed plastic shear strain
ǫ normal strain
ǫt martensitic transformation strain in ferrite
ǫp normal plastic strain
θ true work hardening rate
θ0 athermal work hardening rate
∆τPS permanent softening
λg geometric slip distance
xix
ν Poisson’s ratio
µ shear modulus
ρ dislocation density (general term)
ρGND geometrically necessary dislocations (GNDs) density
ρSSD statistically stored dislocations (SSDs) density
ρtotal total dislocation density
σ normal stress
σres equivalent residual stress
σ0 baseline strength
σB normal back stress
σS non-directional strengthening component
σv scaling stress (Kocks-Mecking model)
σy yield stress
τ shear stress
τB shear back stress (general term)
τOffsetB shear back stress (offset method)
τF forward flow stress
τUnloadF forward unloading stress
τR reverse flow stress
τOffsetR reverse yield stress (offset method)
φ accommodation factor (Brown and Stobbs model)
xx
CHAPTER 1
Introduction
1.1 Background
1.1.1 Dual-Phase Steels in the Automotive Industry
Through the years, the automotive industry has been continuously working to
improve the performance of vehicles while satisfying stricter safety requirements. Ad-
ditionally, rising oil prices, increasingly stringent emissions regulations as well as
the environmental consciousness of consumers demand significant weight reductions
to increase fuel efficiency while reducing green house gas emissions. The challenge,
therefore, is to achieve this weight reduction goal while concurrently enhancing the
safety and crashworthiness of the vehicle.
With improvements in processing technologies, many new lightweight materials,
mainly aluminum alloys, are emerging as alternatives to conventional high strength
steels. To ensure competitiveness of ferrous alloys, new grades of steel are being
produced which have combinations of superior strength, good formability and good
failure properties. These new steels, referred to as Advanced High Strength Steels
(AHSS), allow for the implementation of thinner gauge and higher strength steel
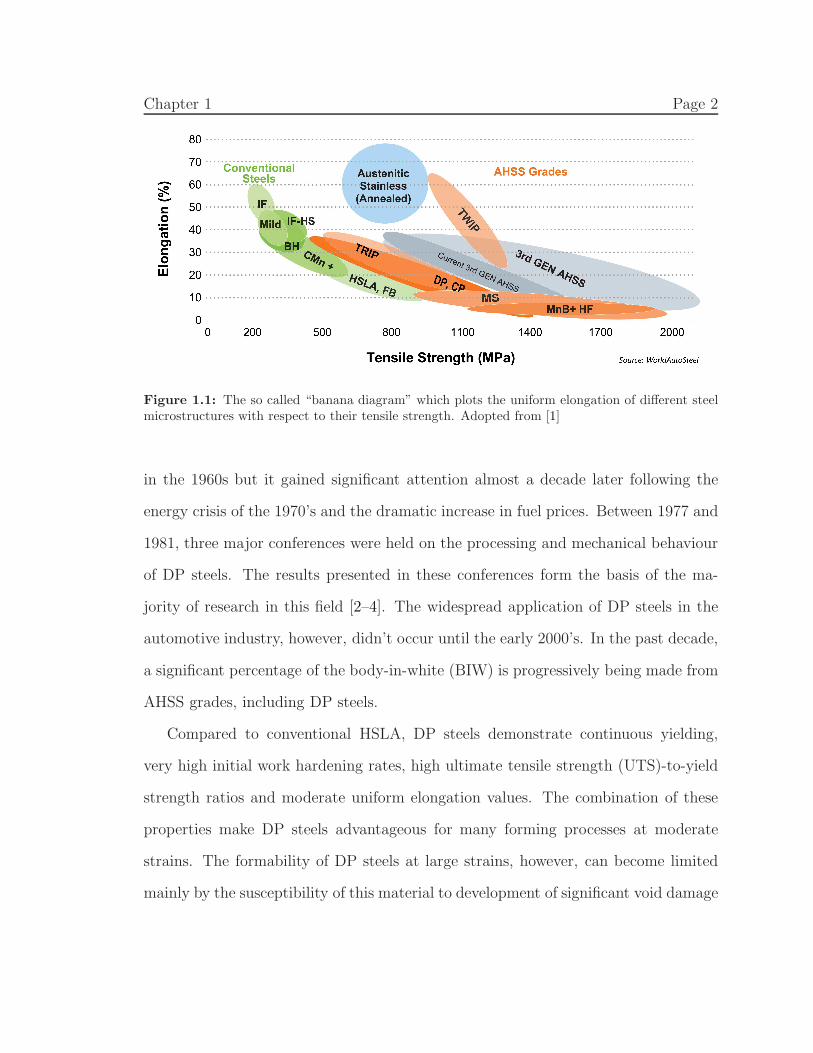
sheets for structural components. As seen in Figure 1.1, the AHSS grades have higher
uniform elongation values for a given tensile strength compared to conventional steels,
such as HSLA [1].
The present research is focused on an AHSS grade called Dual Phase (DP) steel
which consists of ferrite and martensite phases. This steel was originally developed
1
Chapter 1 Page 2
Figure 1.1: The so called “banana diagram” which plots the uniform elongation of different steelmicrostructures with respect to their tensile strength. Adopted from [1]
in the 1960s but it gained significant attention almost a decade later following the
energy crisis of the 1970’s and the dramatic increase in fuel prices. Between 1977 and
1981, three major conferences were held on the processing and mechanical behaviour
of DP steels. The results presented in these conferences form the basis of the ma-
jority of research in this field [2–4]. The widespread application of DP steels in the
automotive industry, however, didn’t occur until the early 2000’s. In the past decade,
a significant percentage of the body-in-white (BIW) is progressively being made from
AHSS grades, including DP steels.
Compared to conventional HSLA, DP steels demonstrate continuous yielding,
very high initial work hardening rates, high ultimate tensile strength (UTS)-to-yield
strength ratios and moderate uniform elongation values. The combination of these
properties make DP steels advantageous for many forming processes at moderate
strains. The formability of DP steels at large strains, however, can become limited
mainly by the susceptibility of this material to development of significant void damage
Chapter 1 Page 3
emanating from martensite particles in the ferrite matrix.
1.2 Motivation
It is known that the improved mechanical behaviour of DP steels is due to the
plastic incompatibility between the soft, deformable ferrite and hard, non-deformable
martensite. This incompatibility leads to the introduction of long-range internal back
stresses as well as the generation of geometrically necessary dislocations (GNDs) into
the ferrite matrix. These two phenomena further work-harden the ferrite matrix and
result in the significantly high initial work hardening rate of DP steels.
The work hardening of DP steels is known to be a function of the volume frac-
tion, f , and size, d, of the martensite particles. However, the effects of morphology
and spatial distribution of martensite particles on work hardening has received very
little attention in the research literature. It is apparent that in order to improve the
mechanical behaviour of DP steels even further, it is essential to have a clearer under-
standing of the effects of all microstructural features on individual strain hardening
mechanisms.
Specifically, the majority of experimental research on the work hardening of DP
steels has focused on the work hardening effects due to the generation of GNDs while
little data exists on the back stress hardening in these steels. This is generally due
to the difficulties associated with the application of forward-reverse deformation to
sheet samples, which is required for the measurement of back stresses. Information
on the effects of microstructural parameters on the development of back stresses is
also lacking and any further insight into this area would be of significant value.
Chapter 1 Page 4
1.3 Research Objectives
The three fundamental objectives of the present research are as follows:
I Investigate the relationship between thermo-mechanical processing (TMP) pa-
rameters and the microstructure of DP steels in terms of ferrite grain size as well
as size, volume fraction, morphology and spatial distribution of martensite par-
ticles. This task was done by applying different thermo-mechanical processing
(TMP) schedules prior to the IC annealing step in order to produce five distinct
DP microstructural variants.
II Examine the relationship between the microstructural parameters, particularly
ferrite grain size as well as volume fraction, size, morphology and spatial distri-
bution of martensite particles, and the work hardening rate at both small and
large plastic strains. Application of the Ashby’s work hardening model to the
results will be used to determine the influence of microstructural parameters on
the work hardening due to the GNDs.
III Study the effects of microstructural parameters on the evolution of back stresses
in the five distinct DP microstructural variants by means of a custom in-plane
shear testing fixture capable of applying forward-reverse shear deformation. This
study will be the first comprehensive study of its kind reported in the literature.
Chapter 1 Page 5
1.4 Organization of the Thesis
The contents of this thesis is organized as followed:� Chapter 2 provides a review of the relevant literature. As this thesis is written in
a manuscript format, the literature review chapter was intentionally kept rela-
tively short to avoid repetition. Additionally, the review of literature concerning
the measurements of back stresses is presented in Chapter 5.� Chapter 3 presents a paper published in Materials Science and Engineering A [5],
which reports the results of a study on a cold-rolled DP780 starting material.
Through application of different heat treatments prior to inter-critical (IC) an-
nealing, three distinctly different microstructural variants were produced with a
range of martensite volume fractions and with different ferrite grain size as well
as size, morphology and spatial distribution of martensite particles. The evolu-
tion of microstructures at different stages of thermo-mechanical processing was
investigated. The work hardening behaviour of the three microstructural vari-
ants was then examined in terms of the true work hardening rate, θ = dσ/dǫ, the
instantaneous work hardening exponent, n = dlogσ/dlogǫ and the dislocation
annihilation parameter, h = −(θ − θ0)/(σ − σ0).� Chapter 4 presents a second paper submitted to, and currently under review
at, Materials Science and Engineering A. This chapter describes the effects of
introducing an additional 80% cold-rolling step between the pre-heat treatment
step and IC annealing. Two distinctly different microstructural variants were
produced having a range of martensite volume fractions and with different fer-
rite grain size as well as size and spatial distribution of martensite particles.
Chapter 1 Page 6
The yielding and work hardening behaviour of these microstructures were com-
pared with that of the cold-rolled (untreated) and IC annealed microstructural
variant from Chapter 3. The structure of this paper is similar to Chapter 3,
however, the emphasis is on the significant refinement of the ferrite grain size
obtained through the interaction between austenite transformation and ferrite
recrystallization, as well as its effect on the work hardening behaviour.� Chapter 5 details the design, manufacture, implementation and application of
an in-plane shear testing fixture capable of performing forward-reverse shear
deformation on the five DP microstructural variants discussed in Chapters 3
and 4. Measurements of back stresses obtained from the shear tests are pre-
sented and explained with respect to the differences in selected microstructural
parameters among the five DP microstructural variants.� Chapter 6 provides a complementary discussion to the thesis considering the
collective results of Chapters 3–5. Additional comments on the practical impli-
cations of the critical findings in this research are also given.� Chapter 7 presents the primary conclusions of the present research as well as
the original contributions to this field of study. Some suggestions for future
work are also provided.
1.5 References
[1] http://worldautosteel.org/, Online Source, 2014.
[2] A. T. Davenport (Ed.), Formable HSLA and Dual-Phase Steels, The Metallurgical
Society of AIME, Warrendale, PA, 1977.
[3] R. A. Kot, J. W. Moris (Eds.), Structure and Properties of Dual-Phase Steels,
The Metallurgical Society of AIME, Warrendale, PA, 1979.

Chapter 1 Page 7
[4] R. A. Kot, B. L. Bramfitt (Eds.), Fundamentals of Dual-Phase Steels, The Met-
allurgical Society of AIME, Warrendale, PA, 1981.
[5] H. Seyedrezai, A. K. Pilkey, J. D. Boyd, Mater. Sci. Eng. A 594 (2014) 178–188.
CHAPTER 2
Literature Survey
2.1 Introduction
Dual-Phase (DP) steels are one grade of the first-generation Advanced High
Strength Steels (AHSS). Their microstructure comprise non-ferritic phase (NFP) par-
ticles distributed in a ferrite matrix. Traditionally, martensite is the only NFP; how-
ever, in steels with a more complicated processing history, other NFPs such as bainite
and retained austenite may also be present. A typical DP steel contains a low carbon
content (∼0.1 wt.%) and ∼1-2 wt.% manganese. Other alloying elements, such as
chromium, molybdenum and silicon, are also present in DP steels. In addition to
increasing the strength, these alloying elements also ensure a high hardenability of
the steel which is required for the martensitic transformation at typical industrial
cooling rates.
2.2 Processing of DP Steels
To produce DP steel sheet on a commercial scale, cold-rolled sheet is passed
through a continuous galvanizing/galvannealing line [1–3]. A schematic of this thermo-
mechanical processing (TMP) route is presented in Figure 2.1. The starting cold-
rolled sheet generally contains a mixture of ferrite, pearlite and sometimes bai-
nite. During soaking at the inter-critical (IC) annealing temperature, nucleation and
growth of austenite particles takes place and the starting microstructure transforms
to a mixture of ferrite and austenite (Section 2.2.1). After a short soaking time of
8
Chapter 2 Page 9
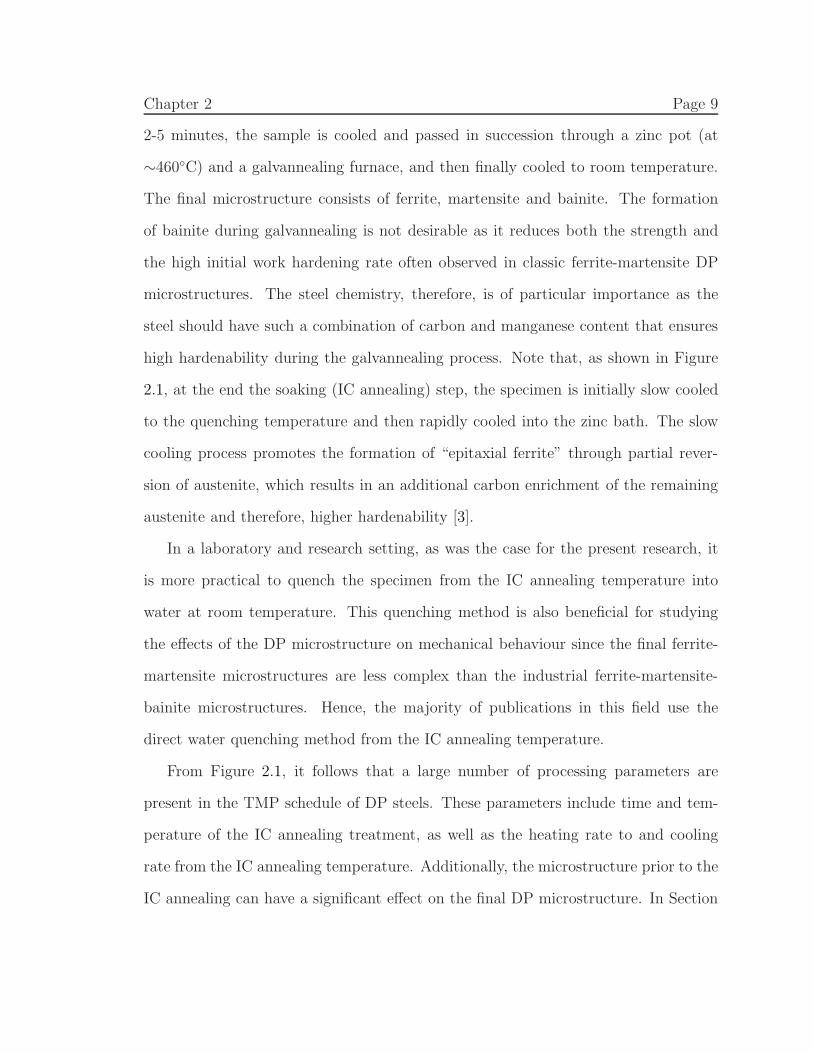
2-5 minutes, the sample is cooled and passed in succession through a zinc pot (at
∼460◦C) and a galvannealing furnace, and then finally cooled to room temperature.
The final microstructure consists of ferrite, martensite and bainite. The formation
of bainite during galvannealing is not desirable as it reduces both the strength and
the high initial work hardening rate often observed in classic ferrite-martensite DP
microstructures. The steel chemistry, therefore, is of particular importance as the
steel should have such a combination of carbon and manganese content that ensures
high hardenability during the galvannealing process. Note that, as shown in Figure
2.1, at the end the soaking (IC annealing) step, the specimen is initially slow cooled
to the quenching temperature and then rapidly cooled into the zinc bath. The slow
cooling process promotes the formation of “epitaxial ferrite” through partial rever-
sion of austenite, which results in an additional carbon enrichment of the remaining
austenite and therefore, higher hardenability [3].
In a laboratory and research setting, as was the case for the present research, it
is more practical to quench the specimen from the IC annealing temperature into
water at room temperature. This quenching method is also beneficial for studying
the effects of the DP microstructure on mechanical behaviour since the final ferrite-
martensite microstructures are less complex than the industrial ferrite-martensite-
bainite microstructures. Hence, the majority of publications in this field use the
direct water quenching method from the IC annealing temperature.
From Figure 2.1, it follows that a large number of processing parameters are
present in the TMP schedule of DP steels. These parameters include time and tem-
perature of the IC annealing treatment, as well as the heating rate to and cooling
rate from the IC annealing temperature. Additionally, the microstructure prior to the
IC annealing can have a significant effect on the final DP microstructure. In Section
Chapter 2 Page 10
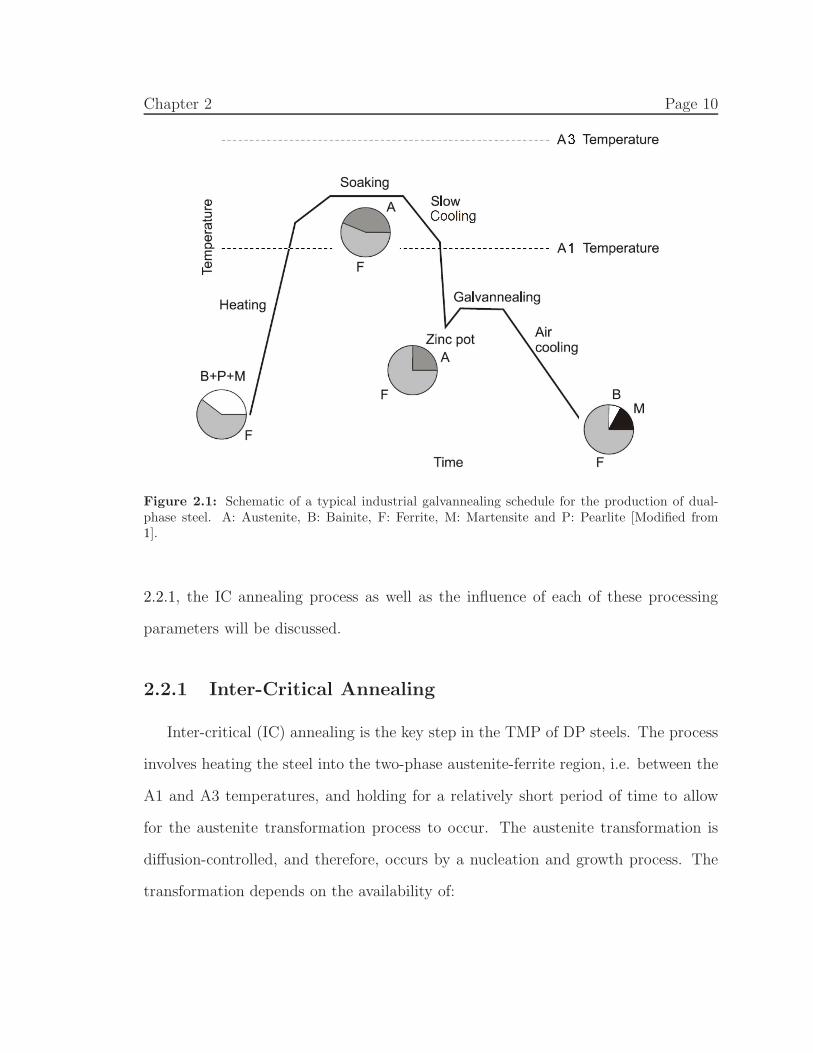
Figure 2.1: Schematic of a typical industrial galvannealing schedule for the production of dual-phase steel. A: Austenite, B: Bainite, F: Ferrite, M: Martensite and P: Pearlite [Modified from1].
2.2.1, the IC annealing process as well as the influence of each of these processing
parameters will be discussed.
2.2.1 Inter-Critical Annealing
Inter-critical (IC) annealing is the key step in the TMP of DP steels. The process
involves heating the steel into the two-phase austenite-ferrite region, i.e. between the
A1 and A3 temperatures, and holding for a relatively short period of time to allow
for the austenite transformation process to occur. The austenite transformation is
diffusion-controlled, and therefore, occurs by a nucleation and growth process. The
transformation depends on the availability of:
Chapter 2 Page 11
(i) Suitable nucleation sites: These sites are locations within the matrix that are
associated with high surface/interfacial energies, which assists the heterogeneous
nucleation of austenite by lowering the critical nucleation activation energy, ∆∗
G.
(ii) Sufficient carbon content: Austenite is a carbon-rich phase that requires prox-
imity to high carbon content sources for its growth.
In the starting DP steel microstructure, the carbon-rich constituents are pearlite,
individual cementite particles and martensite. Therefore, when the ferrite matrix is
fully recrystallized prior to reaching the austenite transformation temperature, the
ferrite/cementite interface in pearlite colonies and cementite particles located on fer-
rite grain boundaries, are the two preferred nucleation sites for austenite [4, 5]. This
preference has been attributed to the additional surface energy associated with grain
boundaries which reduces the required activation energy for austenite nucleation,
∆G∗. Note that cementite particles which are not located on ferrite grain boundaries
remain intact during IC annealing. This observation can be attributed to the lack of
additional surface energy associated with grain boundaries, which results in a larger
critical austenite nucleation energy (∆G∗ ), thereby rendering these particles ineffec-
tive for the nucleation of austenite [4–6]. It is evident that the final DP microstructure
(after IC annealing) is directly related to the initial starting microstructure through
the variations in composition, size, morphology and spatial distribution of the start-
ing constituents. Indeed, a large number of studies have focused on optimizing the
final DP microstructure through the addition of various “pre-heat treatments” prior
to IC annealing [7–9].
The above discussion does not consider the effect of deformed microstructure
prior to IC annealing. If the ferrite matrix is not fully recrystallized before reaching
the IC annealing temperature, it has been demonstrated that the stored energy of
Chapter 2 Page 12
the unrecrystallized ferrite grains leads to an additional reduction of the activation
energy for austenite nucleation (∆G∗), thereby inducing a significant nucleation of
austenite on cementite particles located on sub-grain boundaries of unrecrystallized
ferrite grains [4, 5, 10]. To maintain an unrecrystallized, or partially recystallized
ferrite matrix prior to reaching the IC annealing temperature, the heating rate to the
IC annealing temperature represents the critical parameter, such that relatively high
heating rates (>10◦C/sec) are usually required [11].
This change in the austenite nucleation process caused by the presence of un-
recrystallized ferrite grains can result in a significant refinement of the final DP mi-
crostructure. Hence, in recent years, a number of researchers have combined a form of
high deformation process with IC annealing [12–16]. Note that the austenite trans-
formation and ferrite recrystallization processes have been shown to be competing
processes. That is, austenite nucleation results in a partial relaxation of the high
strain energies associated with deformed ferrite grains, which in turn lowers the driv-
ing force for ferrite recrystallization [17]. Moreover, austenite grains that are formed
during IC annealing have a pinning effect on the ferrite grain boundaries which con-
sequently renders these boundaries immobile. For these reasons, in microstructures
where the ferrite matrix is not recrystallized prior to reaching the IC annealing tem-
perature, it is possible to observe a number of unrecrystallized ferrite grains in the
final DP microstructure [17].
Following austenite nucleation, the austenite growth process takes place in three
different stages [18–22]:
1. Complete transformation of pearlite (or bainite) into austenite: This process, in
which a high carbon content austenite is produced, is often controlled by carbon
diffusion. Since the diffusion distances are short (on the order of inter-lamellar
Chapter 2 Page 13
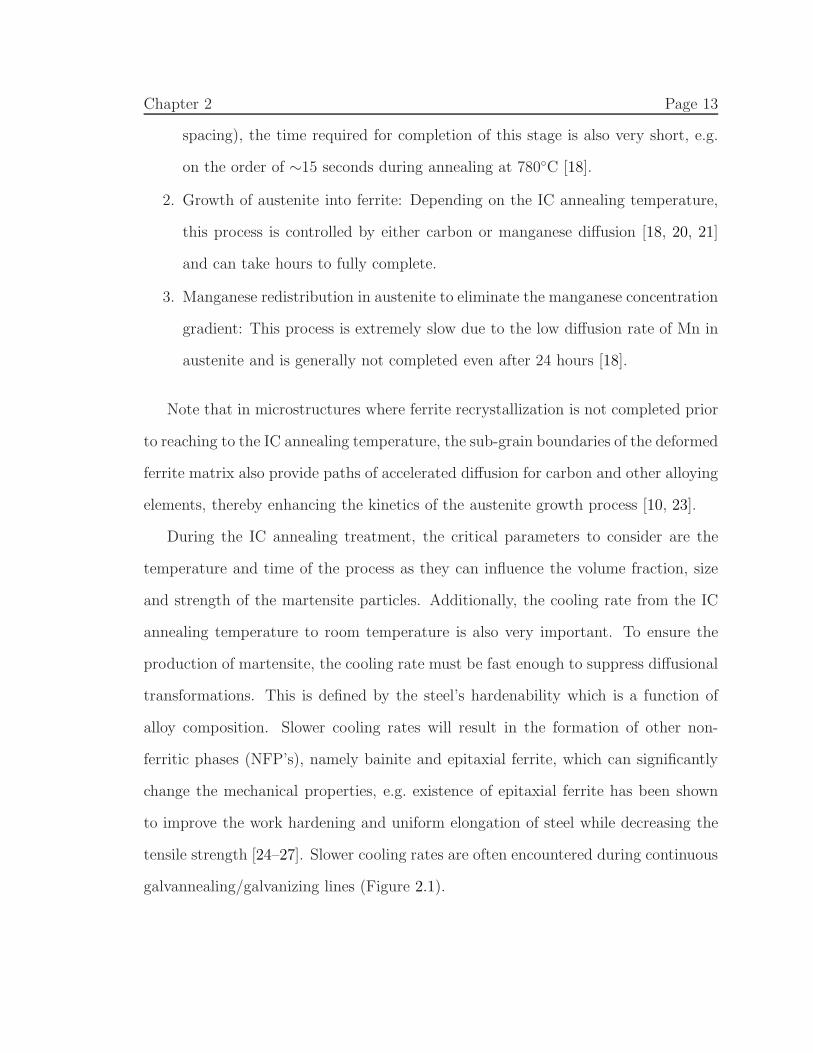
spacing), the time required for completion of this stage is also very short, e.g.
on the order of ∼15 seconds during annealing at 780◦C [18].
2. Growth of austenite into ferrite: Depending on the IC annealing temperature,
this process is controlled by either carbon or manganese diffusion [18, 20, 21]
and can take hours to fully complete.
3. Manganese redistribution in austenite to eliminate the manganese concentration
gradient: This process is extremely slow due to the low diffusion rate of Mn in
austenite and is generally not completed even after 24 hours [18].
Note that in microstructures where ferrite recrystallization is not completed prior
to reaching to the IC annealing temperature, the sub-grain boundaries of the deformed
ferrite matrix also provide paths of accelerated diffusion for carbon and other alloying
elements, thereby enhancing the kinetics of the austenite growth process [10, 23].
During the IC annealing treatment, the critical parameters to consider are the
temperature and time of the process as they can influence the volume fraction, size
and strength of the martensite particles. Additionally, the cooling rate from the IC
annealing temperature to room temperature is also very important. To ensure the
production of martensite, the cooling rate must be fast enough to suppress diffusional
transformations. This is defined by the steel’s hardenability which is a function of
alloy composition. Slower cooling rates will result in the formation of other non-
ferritic phases (NFP’s), namely bainite and epitaxial ferrite, which can significantly
change the mechanical properties, e.g. existence of epitaxial ferrite has been shown
to improve the work hardening and uniform elongation of steel while decreasing the
tensile strength [24–27]. Slower cooling rates are often encountered during continuous
galvannealing/galvanizing lines (Figure 2.1).
Chapter 2 Page 14
2.3 Mechanical Behaviour
DP steels exhibit a characteristic tensile behaviour which is of great interest from
a metal forming point of view. This includes continuous yielding, a very high initial
work hardening rate which transitions to moderate hardening levels at larger strains,
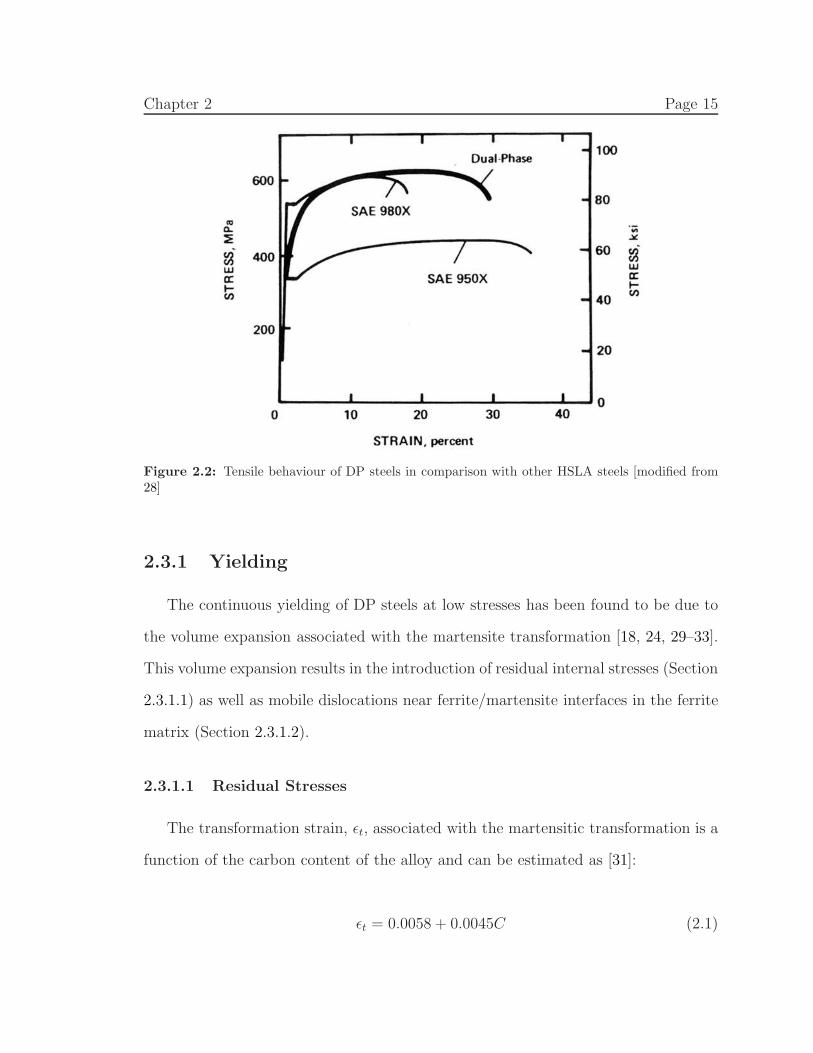
and a low yield-to-tensile strength ratio. Figure 2.2 compares the tensile behaviour
of a typical DP steel with two different HSLA steels (SAE 950X and 980X). The
continuous yielding of DP steel is evident. Moreover, at similar strength levels, the
DP steel exhibits more uniform elongation. In general, these improvements in the
plastic behaviour of DP steels are associated with two phenomena:
1. The martensitic transformation after IC annealing is accompanied by a volume
expansion of 3-4% which is resisted by the ferrite. Consequently, residual elastic
stresses are developed in both the ferrite matrix (tensile) and martensite par-
ticles (compressive). Additionally, mobile dislocations are introduced into the
ferrite near ferrite/martensite interfaces in order to relax these elastic stresses.
These two phenomena result in continuous yielding of DP steels at relatively
low stresses, discussed further in Section 2.3.1.
2. During the plastic deformation of a DP steel strain inhomogeneity is introduced
in the structure due to the plastic incompatibility between the constitutive
phases, i.e. hard non-deforming martensite embedded in soft-deformable ferrite.
As explained in Section 2.3.2, this incompatibility leads to the development
of back-stresses and the generation of the geometrically necessary dislocations
(GNDs) in the ferrite matrix, both of which can act as significant work hardening
mechanisms.
Chapter 2 Page 15
Figure 2.2: Tensile behaviour of DP steels in comparison with other HSLA steels [modified from28]
2.3.1 Yielding
The continuous yielding of DP steels at low stresses has been found to be due to
the volume expansion associated with the martensite transformation [18, 24, 29–33].
This volume expansion results in the introduction of residual internal stresses (Section
2.3.1.1) as well as mobile dislocations near ferrite/martensite interfaces in the ferrite
matrix (Section 2.3.1.2).
2.3.1.1 Residual Stresses
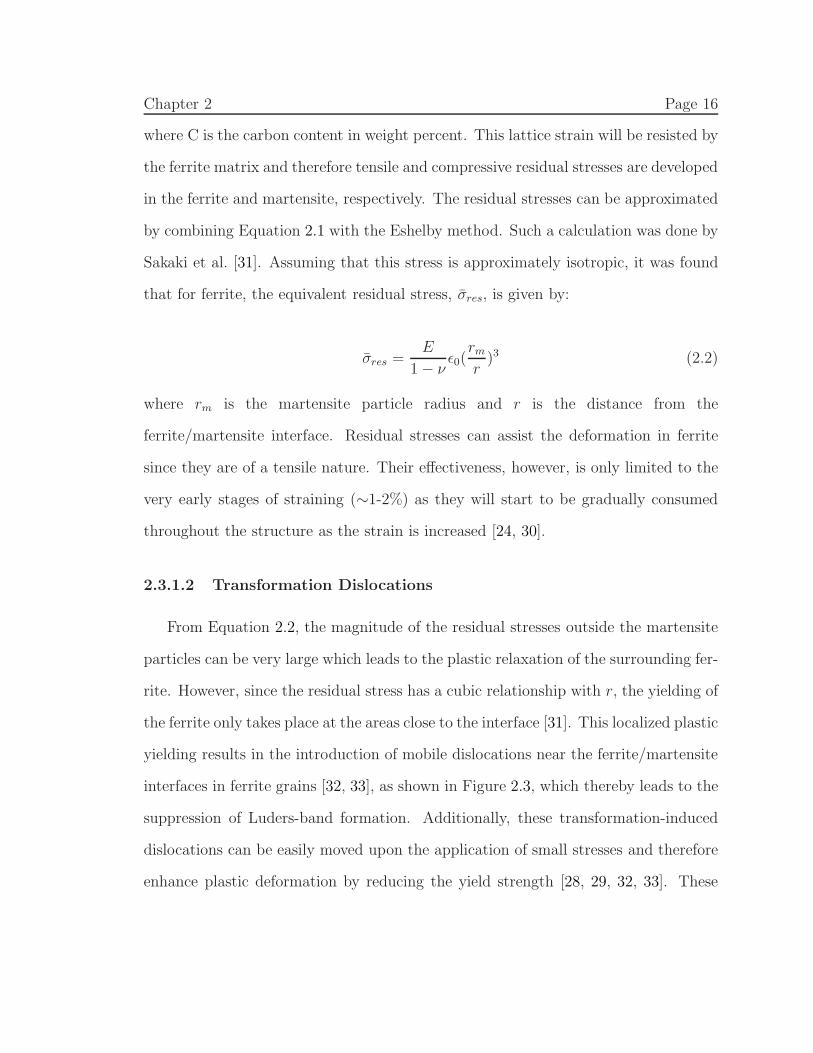
The transformation strain, ǫt, associated with the martensitic transformation is a
function of the carbon content of the alloy and can be estimated as [31]:
ǫt = 0.0058 + 0.0045C (2.1)
Chapter 2 Page 16
where C is the carbon content in weight percent. This lattice strain will be resisted by
the ferrite matrix and therefore tensile and compressive residual stresses are developed
in the ferrite and martensite, respectively. The residual stresses can be approximated
by combining Equation 2.1 with the Eshelby method. Such a calculation was done by
Sakaki et al. [31]. Assuming that this stress is approximately isotropic, it was found
that for ferrite, the equivalent residual stress, σres, is given by:
σres =E
1− νǫ0(
rmr)3 (2.2)
where rm is the martensite particle radius and r is the distance from the
ferrite/martensite interface. Residual stresses can assist the deformation in ferrite
since they are of a tensile nature. Their effectiveness, however, is only limited to the
very early stages of straining (∼1-2%) as they will start to be gradually consumed
throughout the structure as the strain is increased [24, 30].
2.3.1.2 Transformation Dislocations
From Equation 2.2, the magnitude of the residual stresses outside the martensite
particles can be very large which leads to the plastic relaxation of the surrounding fer-
rite. However, since the residual stress has a cubic relationship with r, the yielding of
the ferrite only takes place at the areas close to the interface [31]. This localized plastic
yielding results in the introduction of mobile dislocations near the ferrite/martensite
interfaces in ferrite grains [32, 33], as shown in Figure 2.3, which thereby leads to the
suppression of Luders-band formation. Additionally, these transformation-induced
dislocations can be easily moved upon the application of small stresses and therefore
enhance plastic deformation by reducing the yield strength [28, 29, 32, 33]. These
Chapter 2 Page 17
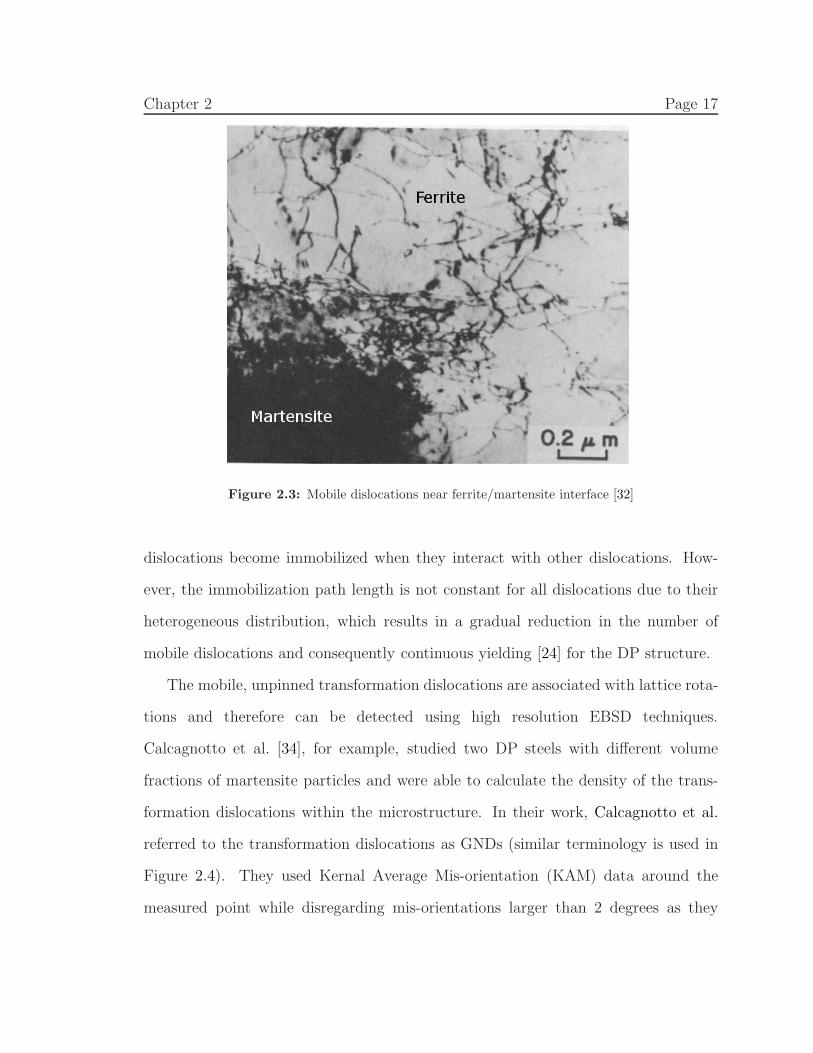
Figure 2.3: Mobile dislocations near ferrite/martensite interface [32]
dislocations become immobilized when they interact with other dislocations. How-
ever, the immobilization path length is not constant for all dislocations due to their
heterogeneous distribution, which results in a gradual reduction in the number of
mobile dislocations and consequently continuous yielding [24] for the DP structure.
The mobile, unpinned transformation dislocations are associated with lattice rota-
tions and therefore can be detected using high resolution EBSD techniques.
Calcagnotto et al. [34], for example, studied two DP steels with different volume
fractions of martensite particles and were able to calculate the density of the trans-
formation dislocations within the microstructure. In their work, Calcagnotto et al.
referred to the transformation dislocations as GNDs (similar terminology is used in
Figure 2.4). They used Kernal Average Mis-orientation (KAM) data around the
measured point while disregarding mis-orientations larger than 2 degrees as they
Chapter 2 Page 18
(a) (b) (c)
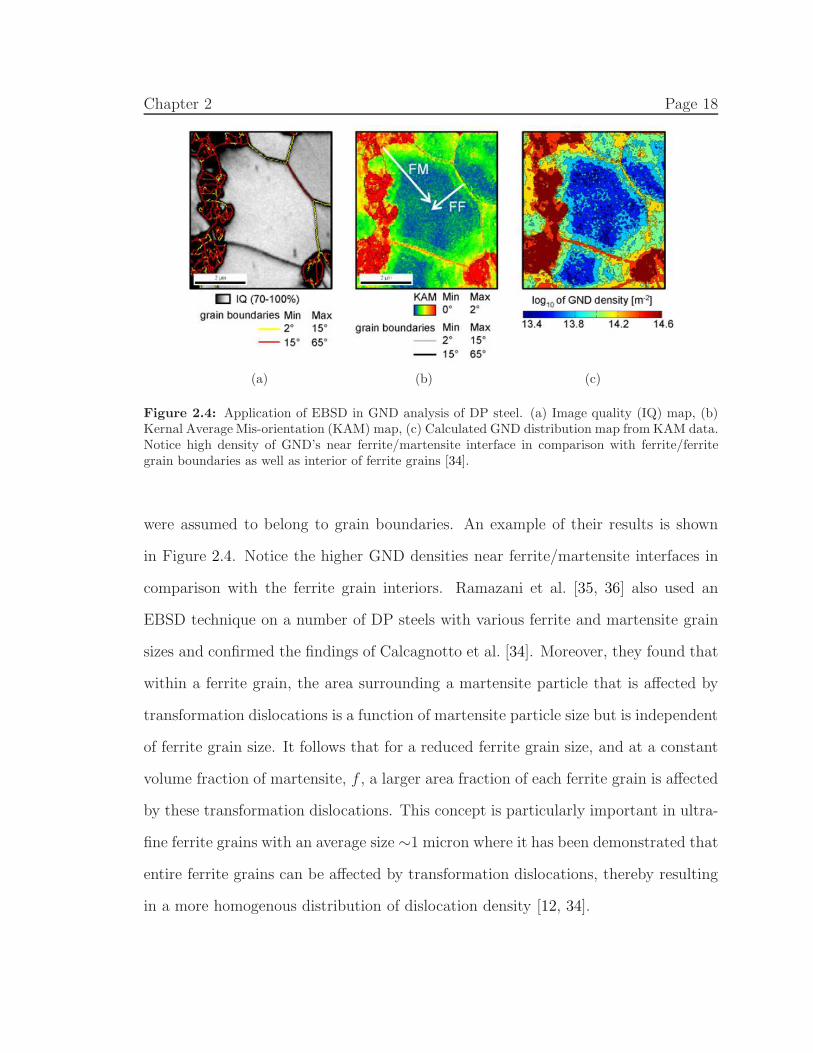
Figure 2.4: Application of EBSD in GND analysis of DP steel. (a) Image quality (IQ) map, (b)Kernal Average Mis-orientation (KAM) map, (c) Calculated GND distribution map from KAM data.Notice high density of GND’s near ferrite/martensite interface in comparison with ferrite/ferritegrain boundaries as well as interior of ferrite grains [34].
were assumed to belong to grain boundaries. An example of their results is shown
in Figure 2.4. Notice the higher GND densities near ferrite/martensite interfaces in
comparison with the ferrite grain interiors. Ramazani et al. [35, 36] also used an
EBSD technique on a number of DP steels with various ferrite and martensite grain
sizes and confirmed the findings of Calcagnotto et al. [34]. Moreover, they found that
within a ferrite grain, the area surrounding a martensite particle that is affected by
transformation dislocations is a function of martensite particle size but is independent
of ferrite grain size. It follows that for a reduced ferrite grain size, and at a constant
volume fraction of martensite, f , a larger area fraction of each ferrite grain is affected
by these transformation dislocations. This concept is particularly important in ultra-
fine ferrite grains with an average size ∼1 micron where it has been demonstrated that
entire ferrite grains can be affected by transformation dislocations, thereby resulting
in a more homogenous distribution of dislocation density [12, 34].
Chapter 2 Page 19
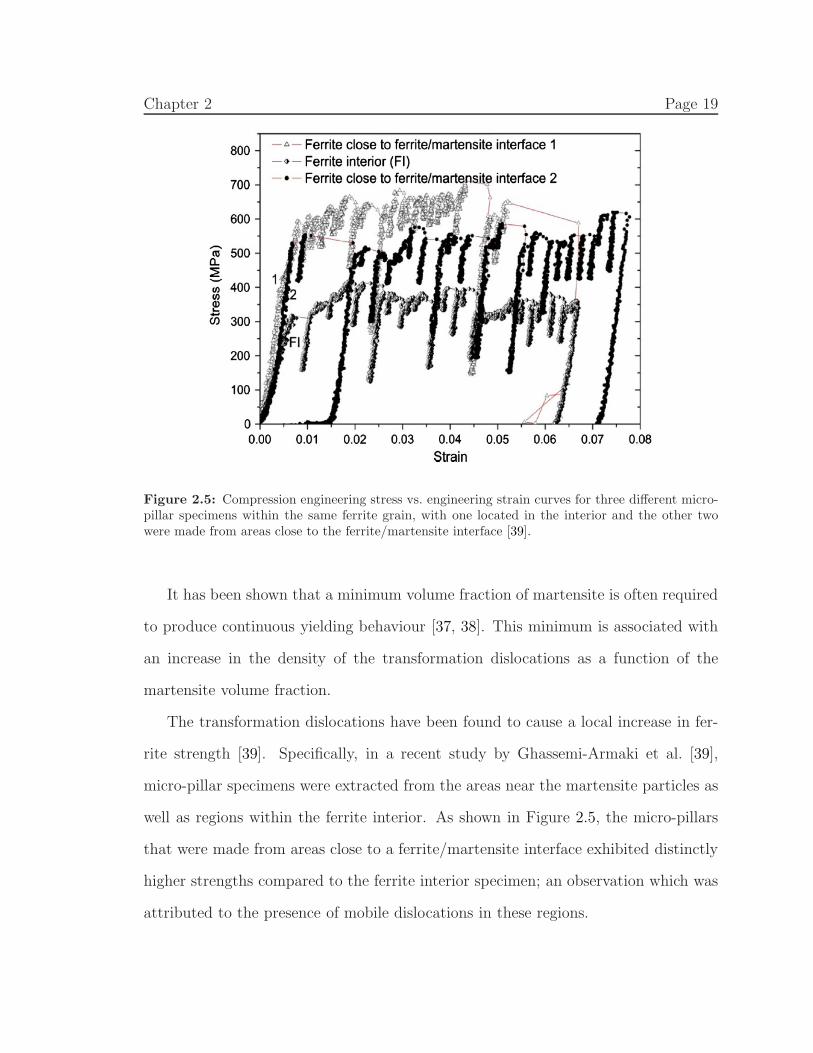
Figure 2.5: Compression engineering stress vs. engineering strain curves for three different micro-pillar specimens within the same ferrite grain, with one located in the interior and the other twowere made from areas close to the ferrite/martensite interface [39].
It has been shown that a minimum volume fraction of martensite is often required
to produce continuous yielding behaviour [37, 38]. This minimum is associated with
an increase in the density of the transformation dislocations as a function of the
martensite volume fraction.
The transformation dislocations have been found to cause a local increase in fer-
rite strength [39]. Specifically, in a recent study by Ghassemi-Armaki et al. [39],
micro-pillar specimens were extracted from the areas near the martensite particles as
well as regions within the ferrite interior. As shown in Figure 2.5, the micro-pillars
that were made from areas close to a ferrite/martensite interface exhibited distinctly
higher strengths compared to the ferrite interior specimen; an observation which was
attributed to the presence of mobile dislocations in these regions.
Chapter 2 Page 20
2.3.2 Work Hardening
For many materials, the work hardening response has been traditionally expressed
using a simple power law relationship (Hollomon rule):
σ = Kǫn. (2.3)
When the material follows the Hollomon rule, the plot of log dσ/dǫ versus log ǫ
should be linear with slope of n. However, this is not the case for DP steels, as shown
in Figure 2.6. To better describe the work hardening of DP steels, an analysis based
on Ludwik’s work hardening rule is often used, given by:
σ = σ0 +Kǫmp (2.4)
where ǫp is the plastic strain. Differentiating Equation 2.4 with respect to ǫp results
in a linear relationship between log dσ/dǫ and log ǫp at a constant m, such that:
log dσ/dǫ = log (K.m) + (m− 1) log ǫp . (2.5)
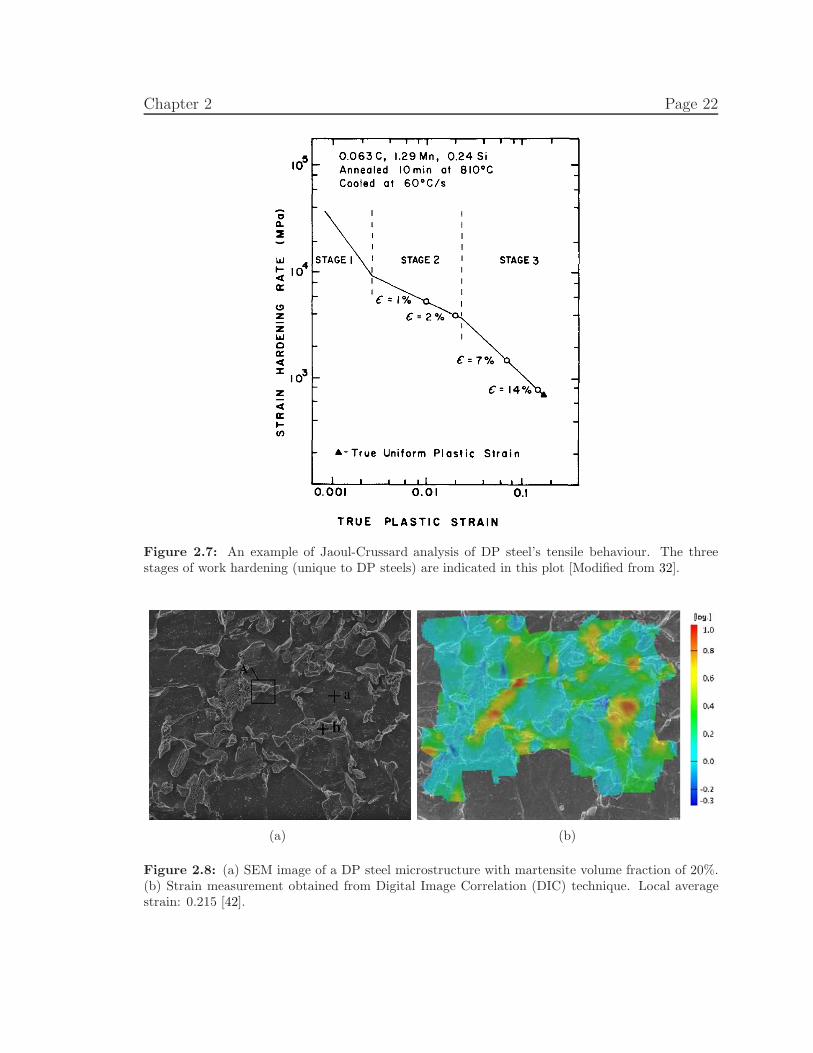
Analysis of the stress-strain data of a DP steel using Equation 2.5 is referred to
as the Jaoul-Crussard analysis and it reveals three different stages of work hardening
with distinct linear slopes [9, 24, 32]. An example of such an analysis is shown in Fig-
ure 2.7. These different stages indicate that in addition to the conventional strength-
ening effects, i.e. solid solution hardening, grain boundary hardening (Hall-Petch
effect) and precipitation hardening, other hardening mechanisms are also present in
DP steels. The additional work hardening contributions are due to the mechanical
differences between the constituent phases; Namely, ferrite is a soft, deformable phase,
Chapter 2 Page 21
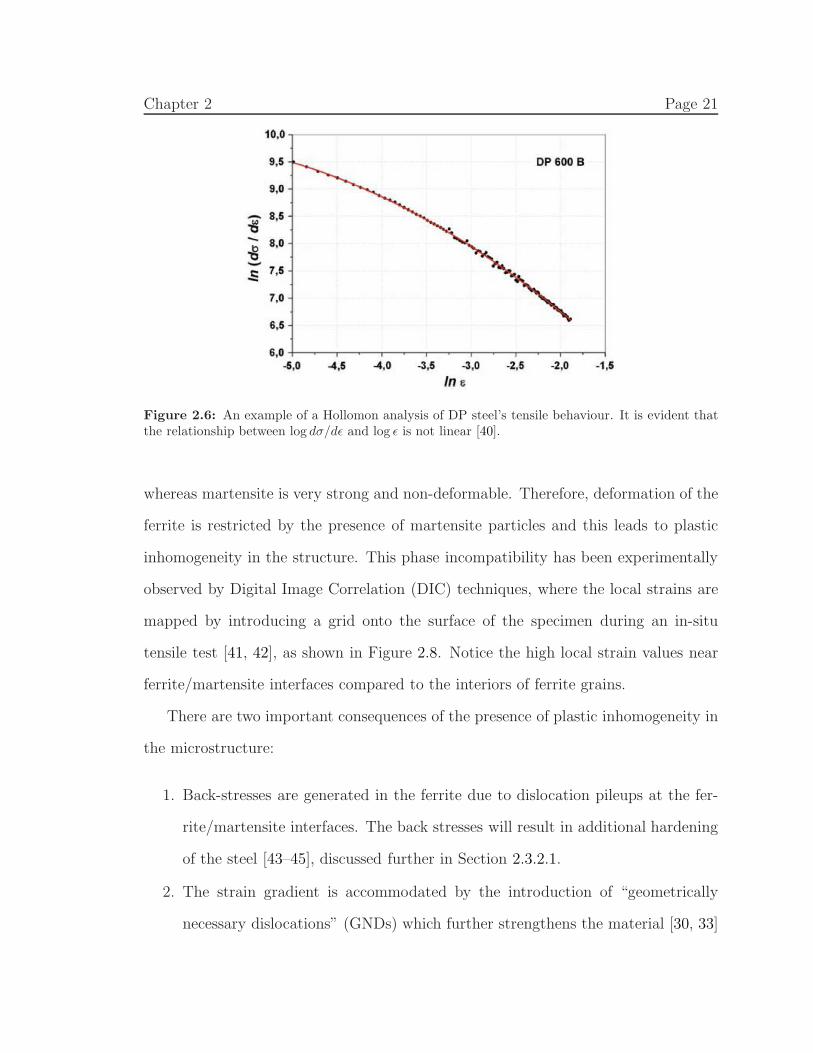
Figure 2.6: An example of a Hollomon analysis of DP steel’s tensile behaviour. It is evident thatthe relationship between log dσ/dǫ and log ǫ is not linear [40].
whereas martensite is very strong and non-deformable. Therefore, deformation of the
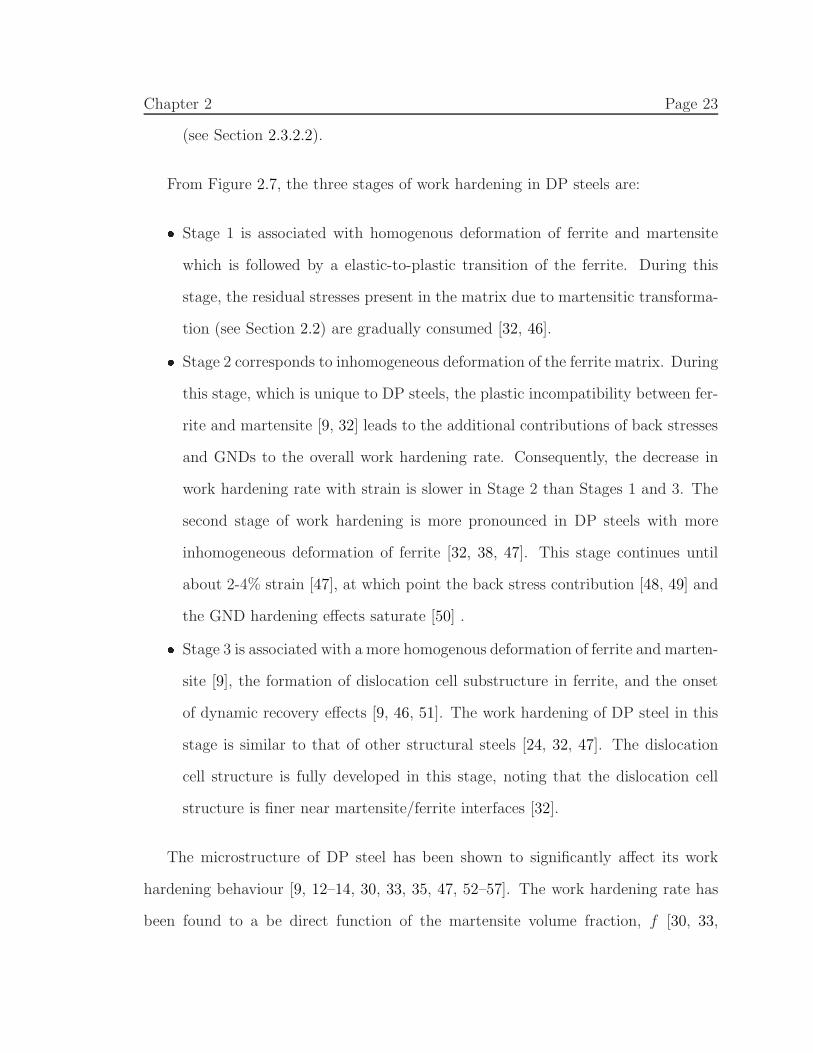
ferrite is restricted by the presence of martensite particles and this leads to plastic
inhomogeneity in the structure. This phase incompatibility has been experimentally
observed by Digital Image Correlation (DIC) techniques, where the local strains are
mapped by introducing a grid onto the surface of the specimen during an in-situ
tensile test [41, 42], as shown in Figure 2.8. Notice the high local strain values near
ferrite/martensite interfaces compared to the interiors of ferrite grains.
There are two important consequences of the presence of plastic inhomogeneity in
the microstructure:
1. Back-stresses are generated in the ferrite due to dislocation pileups at the fer-
rite/martensite interfaces. The back stresses will result in additional hardening
of the steel [43–45], discussed further in Section 2.3.2.1.
2. The strain gradient is accommodated by the introduction of “geometrically
necessary dislocations” (GNDs) which further strengthens the material [30, 33]
Chapter 2 Page 22
Figure 2.7: An example of Jaoul-Crussard analysis of DP steel’s tensile behaviour. The threestages of work hardening (unique to DP steels) are indicated in this plot [Modified from 32].
(a) (b)
Figure 2.8: (a) SEM image of a DP steel microstructure with martensite volume fraction of 20%.(b) Strain measurement obtained from Digital Image Correlation (DIC) technique. Local averagestrain: 0.215 [42].
Chapter 2 Page 23
(see Section 2.3.2.2).
From Figure 2.7, the three stages of work hardening in DP steels are:� Stage 1 is associated with homogenous deformation of ferrite and martensite
which is followed by a elastic-to-plastic transition of the ferrite. During this
stage, the residual stresses present in the matrix due to martensitic transforma-
tion (see Section 2.2) are gradually consumed [32, 46].� Stage 2 corresponds to inhomogeneous deformation of the ferrite matrix. During
this stage, which is unique to DP steels, the plastic incompatibility between fer-
rite and martensite [9, 32] leads to the additional contributions of back stresses
and GNDs to the overall work hardening rate. Consequently, the decrease in
work hardening rate with strain is slower in Stage 2 than Stages 1 and 3. The
second stage of work hardening is more pronounced in DP steels with more
inhomogeneous deformation of ferrite [32, 38, 47]. This stage continues until
about 2-4% strain [47], at which point the back stress contribution [48, 49] and
the GND hardening effects saturate [50] .� Stage 3 is associated with a more homogenous deformation of ferrite and marten-
site [9], the formation of dislocation cell substructure in ferrite, and the onset
of dynamic recovery effects [9, 46, 51]. The work hardening of DP steel in this
stage is similar to that of other structural steels [24, 32, 47]. The dislocation
cell structure is fully developed in this stage, noting that the dislocation cell
structure is finer near martensite/ferrite interfaces [32].
The microstructure of DP steel has been shown to significantly affect its work
hardening behaviour [9, 12–14, 30, 33, 35, 47, 52–57]. The work hardening rate has
been found to a be direct function of the martensite volume fraction, f [30, 33,
Chapter 2 Page 24
47, 52–54], and an inverse function of the martensite particle size, d [52, 58, 59].
Furthermore, the spatial distribution and morphology of martensite particles have
also been shown to influence the work hardening rate [9, 35, 52, 56, 57, 60, 61]
although due to various definitions of these parameters in different publications, a
clear relationship cannot be established. The effect of ferrite grain size, D, on the work
hardening rate of DP steels has also been studied [12–14]. However, in these studies,
other microstructural parameters, such as size, morphology and spatial distribution
of martensite particles, are usually also changed along with the ferrite grain size;
therefore, a definitive conclusion on the effect of ferrite grain size alone cannot be
made.
To provide a better understanding of the effects of microstructure on the work
hardening behaviour of DP steels, the two additional work hardening mechanisms of
back stress hardening and GND hardening will be reviewed in more detail in Sections
2.3.2.1 and 2.3.2.2.
2.3.2.1 Back-Stress Hardening
Through a series of publications in the 1970s [43, 44, 62], Brown and Stobbs
provided a comprehensive understanding of the deformation mechanism of a soft
matrix embedded with hard, non-deformable second phase particles. Their work
provides the framework required for understanding the evolution of back-stresses in
DP steels and many other materials with second-phase hard particles.
In terms of dislocation theory, bypass of a dislocation from a non-deforming par-
ticle leaves an Orowan loop around the particle. Two different internal stresses are
then developed as a result of Orowan loops [43]: (a) short range internal stress, some-
times referred to as source shortening stress and (b) long range internal stress which
Chapter 2 Page 25
is known as back stress. The former stress, is essentially a locally varying stress field
with zero mean value. This stress reduces the effective inter-particle spacing which
forces successive dislocations to stand off from an Orowan loop around a particle. The
source shortening stress is frictional in nature and is non-directional [62–64]. The long
range internal stress, on the other hand, is the global image stress that is imposed on
the ferrite matrix. For a first approximation, using Eshelby’s approach, Brown and
Stobbs calculated the back-stress as:
τB = 2µφfγp (2.6)
where, µ is the shear modulus, φ is the morphology-dependent accomodation factor
(typically assumed ∼ 0.5 for spherical particles), f is the volume fraction of the
second-phase and γp is the plastic shear strain. Note that Equation 2.6 is based on
the assumption that both the particle and the matrix have similar elastic moduli. This
is a correct assumption in terms of DP steels; however, in other materials, a correction
to Equation 2.6 has to be made to account for differences in the elastic moduli of the
constituent phases. The back stress increases linearly with the plastic strain, until
at relatively small strains, local plastic relaxation via introduction of secondary slip
dislocations occurs in the soft matrix, near the hard particles’ interface [44]. Through
this plastic relaxation, a large amount of the elastic stresses are relieved. Due to the
interaction between secondary and primary slip systems, the material work hardens
very rapidly and complete relaxation of back-stresses is not possible. Consequently,
Equation 2.6 should be adjusted to include only the contribution from the unrelaxed
portion (γ∗
p) of total plastic shear strain (γp). The secondary slip dislocation array was
found to be identical to the geometrically necessary dislocations (GNDs) proposed
by Ashby [65, 66](Section 2.3.2.2). Therefore, using Ashby’s work hardening model
Chapter 2 Page 26
[65, 66], unrelaxed plastic shear strain, γ∗
p , can be calculate as:
γ∗
p ≅ α
[
8γpb
πr
]1/2
(2.7)
where α is a constant describing forest hardening strength (typically ∼ 0.3-0.4), b is
the Burgers vector and r is the particle radius. Combining Equations 2.6 and 2.7, it
follows that in the presence of plastic relaxation, the back stress can be written as:
τB = 2αµφf
[
8γpb
πr
]1/2
. (2.8)
A forward-reverse loading test is often employed to measure the back stresses
from the difference observed in the stress levels before and after strain reversal. A
comprehensive review of these tests is given in Chapter 5. In this chapter, only
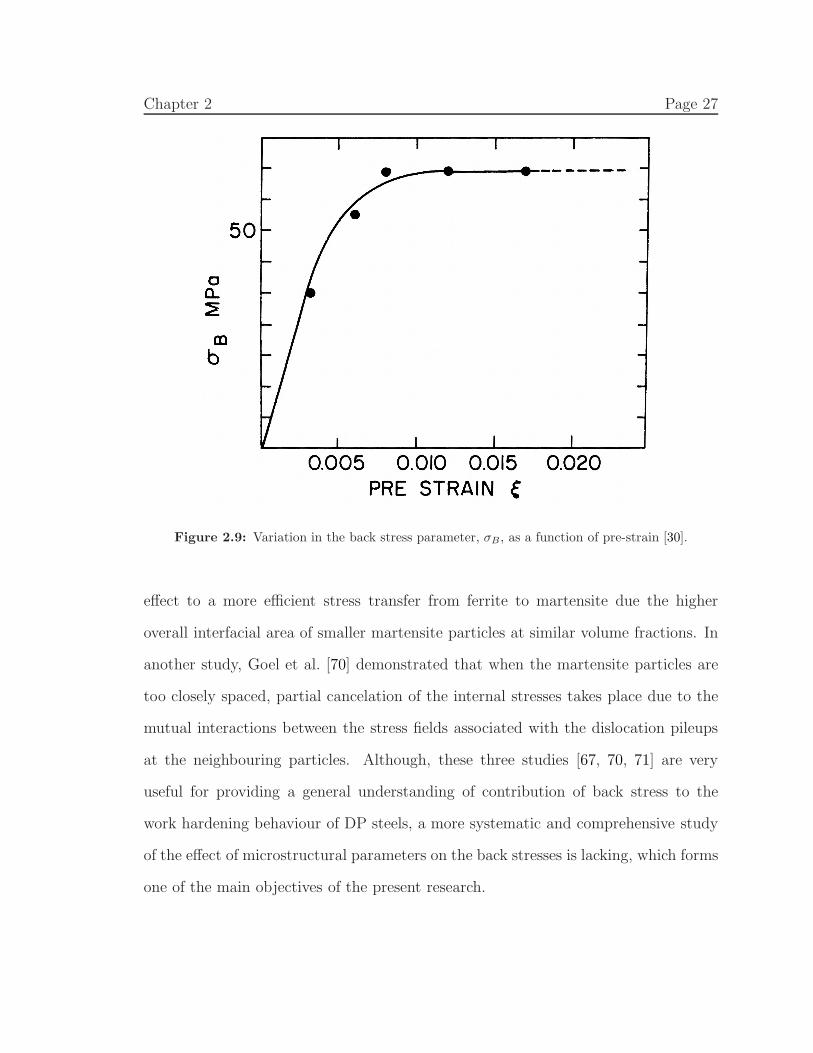
the important results of these tests are provided. Gerbase et al. [30] measured the
back-stress evolution of a DP steel and found that in agreement with the Brown and
Stobbs model [43, 44], the magnitude of the back stress increases with the amount of
pre-strain. These results are shown in Figure 2.9. An interesting feature in this figure
is the saturation of back-stress values at relatively small pre-strain values. Similar
observations were also reported by Li and Gu [67], Tomota [68] and Han et al. [69].
Gerbase et al. attributed this saturation to the occurrence of other competing process
such as the plastic deformation and/or fracture of the martensite particles [30].
Studies concerning the effects of microstructural parameters of DP steels on back
stress hardening are limited. The back stress has been found to increase with the
volume fraction of martensite [67, 70, 71]. With respect to other microstructural
parameter, Erdogan and Priestner [71] observed a higher back stress contribution
in a DP microstructure with a finer martensite particles size. They attributed this
Chapter 2 Page 27
Figure 2.9: Variation in the back stress parameter, σB, as a function of pre-strain [30].
effect to a more efficient stress transfer from ferrite to martensite due the higher
overall interfacial area of smaller martensite particles at similar volume fractions. In
another study, Goel et al. [70] demonstrated that when the martensite particles are
too closely spaced, partial cancelation of the internal stresses takes place due to the
mutual interactions between the stress fields associated with the dislocation pileups
at the neighbouring particles. Although, these three studies [67, 70, 71] are very
useful for providing a general understanding of contribution of back stress to the
work hardening behaviour of DP steels, a more systematic and comprehensive study
of the effect of microstructural parameters on the back stresses is lacking, which forms
one of the main objectives of the present research.
Chapter 2 Page 28
2.3.2.2 Geometrically Necessary Dislocations
As discussed in Section 2.3.2.1, the magnitude of elastic back stresses increases
very rapidly with increasing plastic strain. Using a copper/silica system, Brown
and Stobbs [44] showed that eventually at relatively small strains, the relaxation of
elastic back stresses occurs by the formation of secondary slip dislocations. Ashby
demonstrated that the accumulation of secondary dislocations can be related to the
gradient of strain by simple geometrical considerations [65, 66]. Therefore, these
dislocations are referred to as “geometrically necessary dislocations” (GNDs) and
their density can be calculated as [66]:
ρGND = (1
λg)4γ
b(2.9)
where γ is the shear strain, b is Burgers vector and λg is the geometric slip distance.
For spherical particles with raduis r and volume fraction f , this distance is equal to:
λg =r
f. (2.10)
In areas away from the hard particles, the dislocation accumulation is statistical
in nature, and these dislocations are referred to as “statistically stored dislocations”
(SSDs). In addition to GNDs, the SSDs are also accumulated near the marten-
site/ferrite interface. To calculate the overall dislocation strengthening contribution
to work hardening, both SSDs and GNDs should be included in the Taylor relation-
ship, given by:
τdislocation = αµb√
ρTotal (2.11)
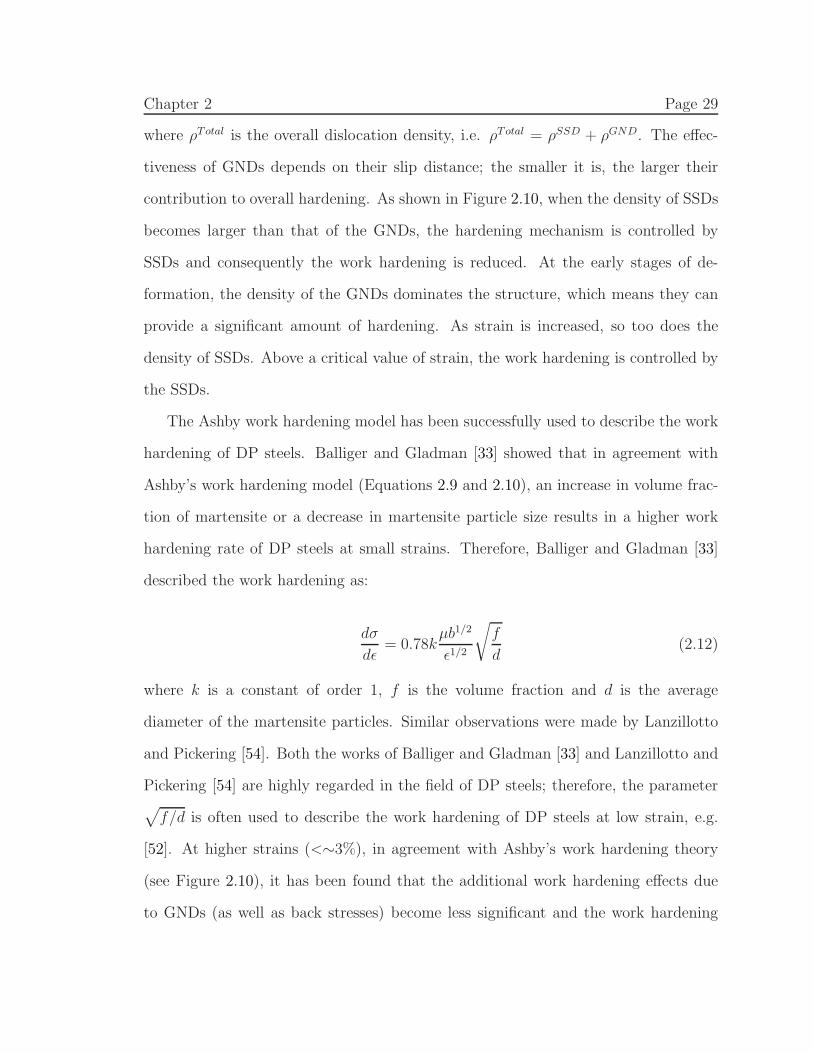
Chapter 2 Page 29
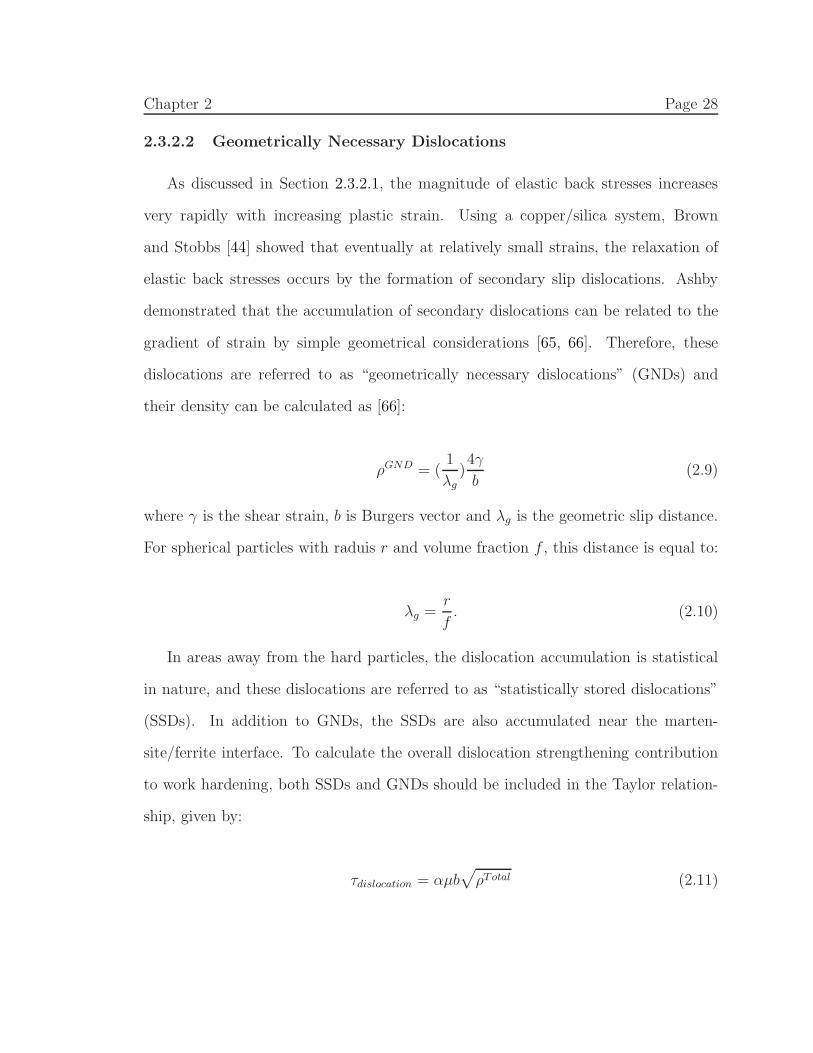
where ρTotal is the overall dislocation density, i.e. ρTotal = ρSSD + ρGND. The effec-
tiveness of GNDs depends on their slip distance; the smaller it is, the larger their
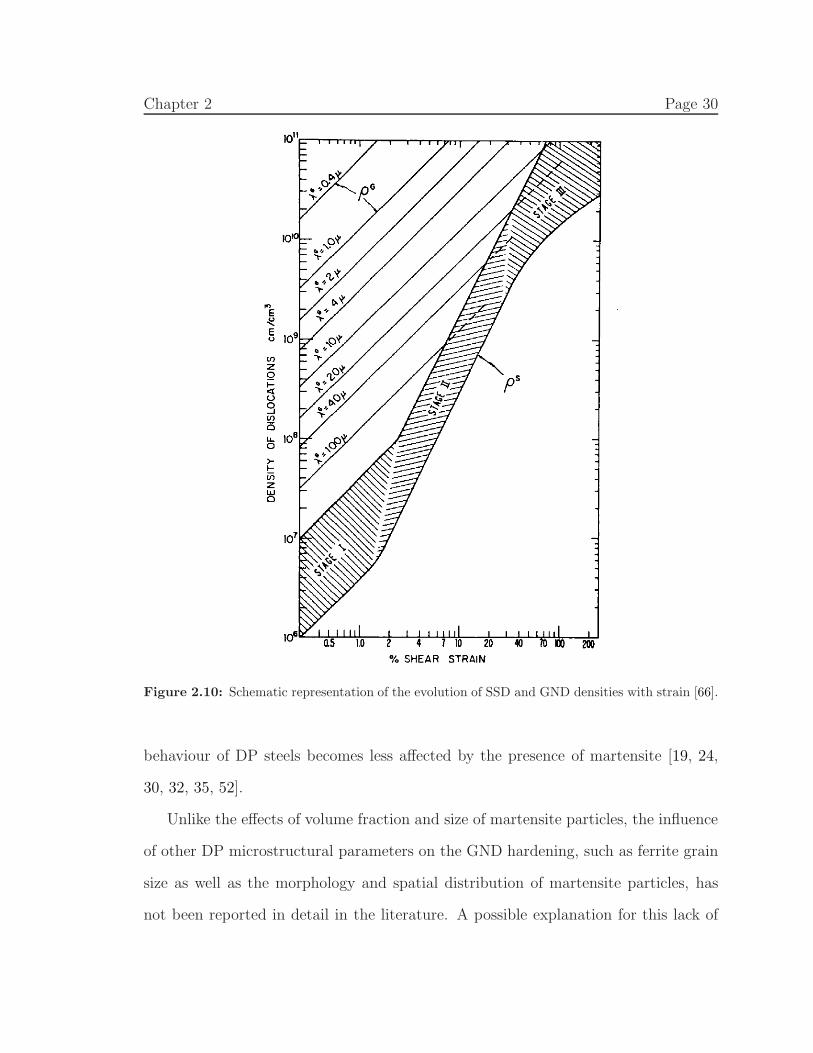
contribution to overall hardening. As shown in Figure 2.10, when the density of SSDs
becomes larger than that of the GNDs, the hardening mechanism is controlled by
SSDs and consequently the work hardening is reduced. At the early stages of de-
formation, the density of the GNDs dominates the structure, which means they can
provide a significant amount of hardening. As strain is increased, so too does the
density of SSDs. Above a critical value of strain, the work hardening is controlled by
the SSDs.
The Ashby work hardening model has been successfully used to describe the work
hardening of DP steels. Balliger and Gladman [33] showed that in agreement with
Ashby’s work hardening model (Equations 2.9 and 2.10), an increase in volume frac-
tion of martensite or a decrease in martensite particle size results in a higher work
hardening rate of DP steels at small strains. Therefore, Balliger and Gladman [33]
described the work hardening as:
dσ
dǫ= 0.78k
µb1/2
ǫ1/2
√
f
d(2.12)
where k is a constant of order 1, f is the volume fraction and d is the average
diameter of the martensite particles. Similar observations were made by Lanzillotto
and Pickering [54]. Both the works of Balliger and Gladman [33] and Lanzillotto and
Pickering [54] are highly regarded in the field of DP steels; therefore, the parameter√
f/d is often used to describe the work hardening of DP steels at low strain, e.g.
[52]. At higher strains (<∼3%), in agreement with Ashby’s work hardening theory
(see Figure 2.10), it has been found that the additional work hardening effects due
to GNDs (as well as back stresses) become less significant and the work hardening
Chapter 2 Page 30
Figure 2.10: Schematic representation of the evolution of SSD and GND densities with strain [66].
behaviour of DP steels becomes less affected by the presence of martensite [19, 24,
30, 32, 35, 52].
Unlike the effects of volume fraction and size of martensite particles, the influence
of other DP microstructural parameters on the GND hardening, such as ferrite grain
size as well as the morphology and spatial distribution of martensite particles, has
not been reported in detail in the literature. A possible explanation for this lack of
Chapter 2 Page 31
information is that generally the DP microstructural parameters are coupled with
each other which makes the study of individual effects particularly challenging. Due
to the importance of these parameters, however, a systematic study is much needed
to provide a better understanding of the influences of ferrite grain size as well as
morphology and spatial distribution of martensite particles on the GND hardening
of DP steels. As a result, this constitutes one of the main objectives of the present
research.
Chapter 2 Page 32
2.4 References
[1] J. Zrnik, I. Mamuzi-, S. V. Dobatkin, Metalurgija 45 (2006) 323–331.
[2] R. O. Rocha, T. M. F. Melo, E. V. Pereloma, D. B. Santos, Mater. Sci. Eng. A
391 (2005) 296–304.
[3] D. Bhattacharya, in: The Joint International Conference of HSLA Steels, Chin.
Soc. Metals, 2005, pp. 69–75.
[4] C. I. Garcia, A. J. Deardo, Metall. Trans. A 12 (1981) 521–530.
[5] D. Z. Yang, E. L. Brown, D. K. Matlock, G. Krauss, Metall. Trans. A 16 (1985)
1385–1392.
[6] J. Y. Joon, S. K. In, S. C. Hyung, Metall. Trans. A 16 (1985) 1237–1245.
[7] N. J. Kim, G. Thomas, Metall. Trans. A 12 (1981) 483–489.
[8] M. Westphal, J. R. McDermid, J. D. Boyd, J. D. Embury, Can. Metall. Q. 47
(2008) 83–90.
[9] D. Das, P. P. Chattopadhyay, J. Mater. Sci. 44 (2009) 2957–2965.
[10] M. Kulakov, W. J. Poole, M. Militzer, Metall. Mater. Trans. A 44 (2013) 3564–
3576.
[11] J. Huang, W. J. Poole, M. Militzer, Metall. Mater. Trans. A 35 (2004) 3363–3375.
[12] M. Calcagnotto, D. Ponge, D. Raabe, Mater. Sci. Eng. A 527 (2010) 7832–7840.
[13] M. Calcagnotto, Y. Adachi, D. Ponge, D. Raabe, Acta. Mater. 59 (2011) 658–
670.
[14] K. T. Park, Y. K. Lee, D. H. Shin, ISIJ Int. 45 (2005) 750–755.
[15] M. Calcagnotto, D. Ponge, D. Raabe, ISIJ Int. 52 (2012) 874–883.
[16] H. Azizi-Alizamini, M. Militzer, W. J. Poole, ISIJ Int. 51 (2011) 958–964.
Chapter 2 Page 33
[17] A. Chbihi, D. Barbier, L. Germain, A. Hazotte, M. Goune, J. Mater. Sci. 49
(2014) 3608–3621.
[18] G. R. Speich, V. A. Demarest, R. L. Miller, Metall. Trans. A 12 (1981) 1419–
1428.
[19] G. R. Speich, R. L. Miller, in: R. A. Kot, J. W. Morris (Eds.), Structure and
Properties of Dual-Phase Steels, Metall. Soc. of AIME, 1979, pp. 145–182.
[20] P. Wycliffe, G. R. Purdy, J. D. Embury, in: R. A. Kot, B. L. Bramfitt (Eds.),
Fundamentals of Dual-Phase Steels, Metall. Soc. of AIME, 1981, pp. 59–83.
[21] P. A. Wycliffe, G. R. Purdy, J. D. Embury, Can. Metall. Q. 20 (1981) 339–350.
[22] N. Pussegoda, W. R. Tyson, P. Wycliffe, G. R. Purdy, Metall. Trans. A 15 (1984)
1499–1502.
[23] M. Goune, P. Maugis, J. Drillet, J. Mater. Sci. Technol. 28 (2012) 728–736.
[24] M. Erdogan, R. Priestner, Mater. Sci. Technol. 15 (1999) 1273–1284.
[25] M. Sarwar, E. Ahmad, K. A. Qureshi, T. Manzoor, Mater. Des. 28 (2007) 335–
340.
[26] M. Erdogan, J. Mater. Sci. 37 (2002) 3623–3630.
[27] W. Jeong, C. Kim, Scripta Metall. 19 (1985) 37–42.
[28] G. R. Speich, in: R. A. Kot, B. L. Bramfitt (Eds.), Fundamentals of Dual-Phase
Steels, Metall. Soc. of AIME, 1981, pp. 3–45.
[29] R. G. Davies, Metall. Trans. A 10 (1979) 1549–1555.
[30] J. Gerbase, J. D. Embury, R. M. Hobbs, in: R. A. Kot, J. W. Morris (Eds.),
Structure and Properties of Dual-Phase Steels, Metall. Soc. of AIME, 1979, pp.
118–144.
[31] T. Sakaki, K. Sugimoto, T. Fukuzato, Acta Metall. 31 (1983) 1737–1746.
[32] D. A. Korzekwa, D. K. Matlock, G. Krauss, Metall. Trans. A 15 (1984) 1221–
1228.
Chapter 2 Page 34
[33] N. K. Balliger, T. Gladman, Metal Sci. 15 (1981) 95–108.
[34] M. Calcagnotto, D. Ponge, E. Demir, D. Raabe, Mater. Sci. Eng. A 527 (2010)
2738–2746.
[35] A. Ramazani, K. Mukherjee, A. Schwedt, P. Goravanchi, U. Prahl, W. Bleck,
Int. J. Plast. 43 (2013) 128–152.
[36] A. Ramazani, K. Mukherjee, U. Prahl, W. Bleck, Metall. Mater. Trans. A 43
(2012) 3850–3869.
[37] N. Fonstein, M. Kapustin, N. Pottore, I. Gupta, O. Yakubovsky, Phys. Metals
Metall. 104 (2007) 315–323.
[38] D. K. Matlock, G. Krauss, L. F. Ramos, G. S. Huppi, in: R. A. Kot, J. W.
Morris (Eds.), Structure and Properties of Dual-Phase Steels, Metall. Soc. of
AIME, 1979, pp. 62–90.
[39] H. Ghassemi-Armaki, R. Maaß, S. Sriram, J. R. Greer, K. S. Kumar, Acta.
Mater. 62 (2014) 197–211.
[40] V. Colla, M. D. Sanctis, A. Dimatteo, G. Lovicu, A. Solina, R. Valentini, Metall.
Mater. Trans. A 40 (2009) 2557–2567.
[41] Y. Ososkov, D. S. Wilkinson, M. Jain, T. Simpson, Int. J. Mater. Res. 98 (2007)
664–673.
[42] J. Kang, Y. Ososkov, J. D. Embury, D. S. Wilkinson, Scripta Mater. 56 (2007)
999–1002.
[43] L. M. Brown, W. M. Stobbs, Philos. Mag. 23 (1971) 1185–1199.
[44] L. M. Brown, W. M. Stobbs, Philos. Mag. 23 (1971) 1201–1233.
[45] L. M. Brown, Acta Metall. 21 (1973) 879–885.
[46] G. R. Speich, R. L. Miller, in: R. A. Kot, B. L. Bramfitt (Eds.), Fundamentals
of Dual-Phase Steels, Metall. Soc. of AIME, 1981, pp. 279–304.
[47] R. F. Lawson, D. K. Matlock, G. Krauss, in: R. A. Kot, B. L. Bramfitt (Eds.),
Fundamentals of Dual-Phase Steels, Metall. Soc. of AIME, 1981, pp. 347–381.
Chapter 2 Page 35
[48] A. M. Sarosiek, W. S. Owen, Mater. Sci. Eng. 66 (1984) 13–34.
[49] Y. W. Chang, R. J. Asaro, Metal Sci. 12 (1978) 277–284.
[50] Z. Jiang, J. Liu, J. Lian, Acta Metall. Mater. 40 (1992) 1587–1597.
[51] W. R. Cribb, J. M. Rigsbee, in: R. A. Kot, J. W. Morris (Eds.), Structure and
Properties of Dual-Phase Steels, Metall. Soc. of AIME, 1979, pp. 91–117.
[52] M. Westphal, J. R. McDermid, J. D. Boyd, J. D. Embury, Can. Metall. Q. 49
(2010) 91–98.
[53] J. D. Embury, J. L. Duncan, in: R. A. Kot, B. L. Bramfitt (Eds.), Fundamentals
of Dual-Phase Steels, Metall. Soc. of AIME, 1981, pp. 333–345.
[54] C. A. N. Lanzillotto, F. B. Pickering, Metal Sci. 16 (1982) 371–382.
[55] Z. Jiang, Z. Guan, J. Lian, Mater. Sci. Eng. A A190 (1995) 55–64.
[56] M. Mazinani, W. J. Poole, Metall. Mater. Trans. A 38 (2007) 328–339.
[57] C. Thomser, V. Uthaisangsuk, W. Bleck, Steel Res. 80 (2009) 582–587.
[58] K. Mukherjee, S. Hazra, P. Petkov, M. Militzer, Mater. Manuf. Process. 22 (2007)
511–515.
[59] E. Maire, O. Bouaziz, M. D. Michiel, C. Verdu, Acta. Mater. 56 (2008) 4954–
4964.
[60] H. Seyedrezai, A. K. Pilkey, J. D. Boyd, Mater. Sci. Eng. A 594 (2014) 178–188.
[61] Y. Tomita, J. Mater. Sci. 25 (1990) 5179–5184.
[62] J. D. Atkinson, L. M. Brown, W. M. Stobbs, Philos. Mag. 30 (1974) 1247–1280.
[63] L. M. Brown, Scripta Metall. 11 (1977) 127–131.
[64] D. V. Wilson, P. S. Bate, Acta Metall. 34 (1986) 1107–1120.
[65] M. F. Ashby, Philos. Mag. 14 (1966) 1157–1178.
[66] M. F. Ashby, Philos. Mag. 21 (1970) 399–424.
Chapter 2 Page 36
[67] Z. Li, H. Gu, Metall. Trans. A 21 (1990) 725–732.
[68] Y. Tomota, Mater. Sci. Technol. 3 (1987) 415–421.
[69] K. Han, C. J. van Tyne, B. S. Levy, Metall. Mater. Trans. A 36 (2005) 2379–2384.
[70] A. Goel, R. K. Ray, G. S. Murty, Scripta Metall. 17 (1983) 375–380.
[71] M. Erdogan, R. Priestner, Mater. Sci. Technol. 18 (2002) 369–376.
CHAPTER 3
Effect of Pre-IC Annealing Treatments on
the Final Microstructure and Work
Hardening Behaviour of a Dual-Phase
Steel
Abstract
This paper investigates the relationship between the microstructure and the work
hardening behaviour of a dual-phase (DP) steel. Various DP microstructures were
systematically produced by applications of different pre-IC annealing heat treatments
as well as changing the IC annealing temperature. It was found that various austenite
nucleation sites such as grain boundaries, prior pearlite colonies, martensite particles
and cementite particles, have different nucleation and growth effectiveness which sig-
nificantly influences the microstructure after IC annealing. Following a quantitative
analysis of all microstructures, the effect of microstructural parameters including
martensite particle size, volume fraction as well as their spatial distribution and mor-
phology, on the mechanical behaviour of DP steels is examined by considering true
work hardening rate, instantaneous work hardening rate and the dislocation annihila-
tion factor from the Kocks-Mecking analysis. These analyses reveal that at constant
ratios of volume fraction to size of martensite particles, there are significant differ-
ences in all three work hardening parameters. It is proposed that these observations
are due to the effects of morphology and spatial distribution of martensite particles.
Furthermore, it was shown that the contribution of martensite particles to work hard-
ening behaviour, via geometrically necessary dislocations, is only significant at the
early stages of deformation.
37
Chapter 3 Page 38
3.1 Introduction
There is a continuing trend in the automotive industry to move towards lighter,
more fuel-efficient vehicles. To ensure competitiveness of ferrous alloys, new grades of
Advanced High Strength Steels (AHSS) are being developed with a superior combina-
tion of strength and formability. The present research investigates dual-phase (DP)
steels which contain non-ferritic phase (NFP) particles distributed in a ferrite matrix.
In traditional DP steels, martensite is the only NFP. However, for more complicated
processing routes, other NFPs such as bainite are also present. The standard pro-
cessing of DP steels involves inter-critical (IC) annealing of cold-rolled ferrite-pearlite
steel in the ferrite-austenite phase field. During this treatment, austenite nucleates
at the interfaces between ferrite and cementite particles, either as individual particles
or within pearlite colonies [1–3]. The carbides provide the elevated carbon content
required for the growth of austenite. However, their effectiveness as austenite nu-
cleation sites varies with their location within the microstructure. Earlier studies
[4, 5] have shown that pearlite is the first phase that is dissolved and replaced by
austenite. This process is very rapid and occurs within a few seconds of heating
to the IC temperature [5]. The effect of individual carbide particles on austenite
nucleation, however, is more complex. Following pearlite colonies, grain boundary
carbides are primary austenite nucleation sites, whereas grain interior carbides are
less effective for austenite nucleation [5–7]. This difference can be attributed to the
extra surface energy associated with the grain boundaries. It is therefore expected
that the starting microstructure, i.e. prior to IC annealing, directly influences the
final DP microstructure, a correlation that has been demonstrated in several studies
[1, 3, 8–13].
Chapter 3 Page 39
DP steels exhibit continuous yielding, low yield-to-tensile strength ratios, large
uniform elongations and very high initial work hardening rates. The continuous yield-
ing of DP steels at low stresses is associated with the presence of mobile dislocations
at ferrite/martensite interfaces as well as residual stresses produced by quenching
from the IC annealing temperature [11, 14–18]. On the other hand, the high initial
work hardening rate is a direct consequence of the strain incompatibility between fer-
rite and martensite which results in load transfer between soft, deformable ferrite and
hard, non-deformable martensite [10, 11, 18–20]. Furthermore, this strain incompat-
ibility results in the introduction of additional hardening mechanisms in the ferrite
matrix due to the development of back stresses and the production of geometrically
necessary dislocations (GNDs) near particle interfaces [11, 17, 18, 20–22]. However,
as total plastic strain is increased, the effectiveness of these additional hardening
mechanisms is reduced and subsequently the work hardening behaviour of DP steels
is determined by the balance between the accumulation of statistically stored dislo-
cations [20, 21, 23–25] and dislocation annihilation due to dynamic recovery [26, 27].
Microstructural parameters such as ferrite grain size as well as the volume fraction,
size, morphology and spatial distribution of martensite particles are known to have
a significant effect on the tensile behaviour of DP steels [10, 11, 18, 24, 28–36]. The
volume fraction of martensite, f , is found to directly affect the amount of load transfer
between ferrite and martensite [10], the yield strength [11, 12, 21, 22, 29, 32, 33] as
well as the work hardening rate due to back stresses [20, 24, 30] and GND hardening
[9, 11, 20, 31]. The mean size of martensite particles, d, is known to inversely affect the
tensile properties, in particular work hardening due to GNDs [11, 31]. Consequently,
on the basis of Ashby’s work hardening model for the deformation of plastically
inhomogeneous alloys [37, 38], work hardening models for DP steels typically consider
Chapter 3 Page 40
the parameter√
f/d as the main microstructural parameter that controls the uniaxial
tensile behaviour [11, 24, 31]. In addition, the spatial distribution and morphology of
martensite have also been shown to influence the yield strength [1, 36], work hardening
rate [8, 10, 23, 24, 35] and load transfer between ferrite and martensite [10]. The effects
of DP steel microstructural parameters on dislocation annihilation effects by dynamic
recovery have not been studied extensively. There are only a limited number of studies
[26, 27] that model the dislocation annihilation effect using a Kock-Mecking approach
for DP steels [39–41] but these models are very general and do not incorporate the
effects of microstructural parameters.
The majority of reported studies on the work hardening behaviour of DP steels
do not distinctly separate the effects of martensite morphology and spatial distribu-
tion from that of martensite size and volume fraction. Therefore, the objectives of
the present study are to utilize pre-IC annealing heat treatments to produce distinct
variations in the morphology and spatial distribution of martensite particles at a con-
stant√
f/d ratio, and to investigate the effects of these microstructural parameters
on the work hardening behaviour.
3.2 Experimental Procedure
3.2.1 Materials
The material used for this study was provided by US Steel Canada as cold-rolled,
commercial DP780 grade, 0.95mm thick sheet (DP780-CR). The composition is given
in Table 3.1. Blanks of size 100mm by 20mm were cut from the CR sheet with the
long axis either along the rolling direction (RD) or the transverse (TD) direction.
Only a limited number of blanks were prepared along TD. Therefore, all specimens
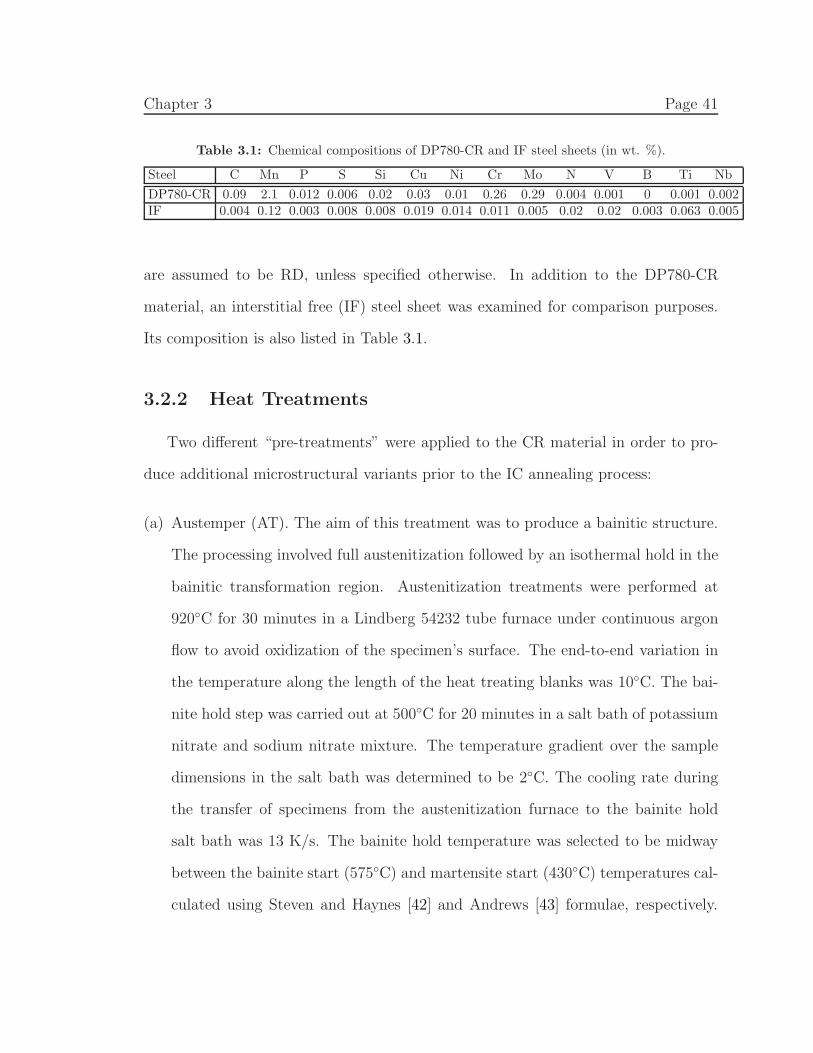
Chapter 3 Page 41
Table 3.1: Chemical compositions of DP780-CR and IF steel sheets (in wt. %).
Steel C Mn P S Si Cu Ni Cr Mo N V B Ti Nb
DP780-CR 0.09 2.1 0.012 0.006 0.02 0.03 0.01 0.26 0.29 0.004 0.001 0 0.001 0.002IF 0.004 0.12 0.003 0.008 0.008 0.019 0.014 0.011 0.005 0.02 0.02 0.003 0.063 0.005
are assumed to be RD, unless specified otherwise. In addition to the DP780-CR
material, an interstitial free (IF) steel sheet was examined for comparison purposes.
Its composition is also listed in Table 3.1.
3.2.2 Heat Treatments
Two different “pre-treatments” were applied to the CR material in order to pro-
duce additional microstructural variants prior to the IC annealing process:
(a) Austemper (AT). The aim of this treatment was to produce a bainitic structure.
The processing involved full austenitization followed by an isothermal hold in the
bainitic transformation region. Austenitization treatments were performed at
920◦C for 30 minutes in a Lindberg 54232 tube furnace under continuous argon
flow to avoid oxidization of the specimen’s surface. The end-to-end variation in
the temperature along the length of the heat treating blanks was 10◦C. The bai-
nite hold step was carried out at 500◦C for 20 minutes in a salt bath of potassium
nitrate and sodium nitrate mixture. The temperature gradient over the sample
dimensions in the salt bath was determined to be 2◦C. The cooling rate during
the transfer of specimens from the austenitization furnace to the bainite hold
salt bath was 13 K/s. The bainite hold temperature was selected to be midway
between the bainite start (575◦C) and martensite start (430◦C) temperatures cal-
culated using Steven and Haynes [42] and Andrews [43] formulae, respectively.
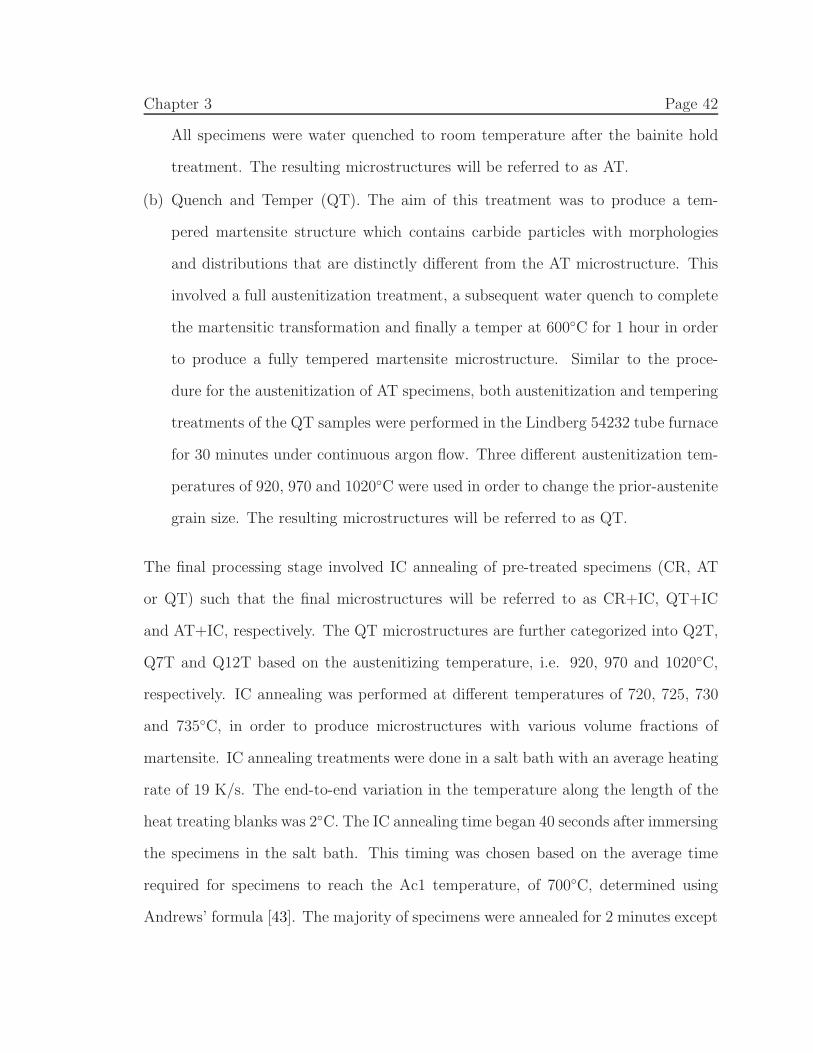
Chapter 3 Page 42
All specimens were water quenched to room temperature after the bainite hold
treatment. The resulting microstructures will be referred to as AT.
(b) Quench and Temper (QT). The aim of this treatment was to produce a tem-
pered martensite structure which contains carbide particles with morphologies
and distributions that are distinctly different from the AT microstructure. This
involved a full austenitization treatment, a subsequent water quench to complete
the martensitic transformation and finally a temper at 600◦C for 1 hour in order
to produce a fully tempered martensite microstructure. Similar to the proce-
dure for the austenitization of AT specimens, both austenitization and tempering
treatments of the QT samples were performed in the Lindberg 54232 tube furnace
for 30 minutes under continuous argon flow. Three different austenitization tem-
peratures of 920, 970 and 1020◦C were used in order to change the prior-austenite
grain size. The resulting microstructures will be referred to as QT.
The final processing stage involved IC annealing of pre-treated specimens (CR, AT
or QT) such that the final microstructures will be referred to as CR+IC, QT+IC
and AT+IC, respectively. The QT microstructures are further categorized into Q2T,
Q7T and Q12T based on the austenitizing temperature, i.e. 920, 970 and 1020◦C,
respectively. IC annealing was performed at different temperatures of 720, 725, 730
and 735◦C, in order to produce microstructures with various volume fractions of
martensite. IC annealing treatments were done in a salt bath with an average heating
rate of 19 K/s. The end-to-end variation in the temperature along the length of the
heat treating blanks was 2◦C. The IC annealing time began 40 seconds after immersing
the specimens in the salt bath. This timing was chosen based on the average time
required for specimens to reach the Ac1 temperature, of 700◦C, determined using
Andrews’ formula [43]. The majority of specimens were annealed for 2 minutes except
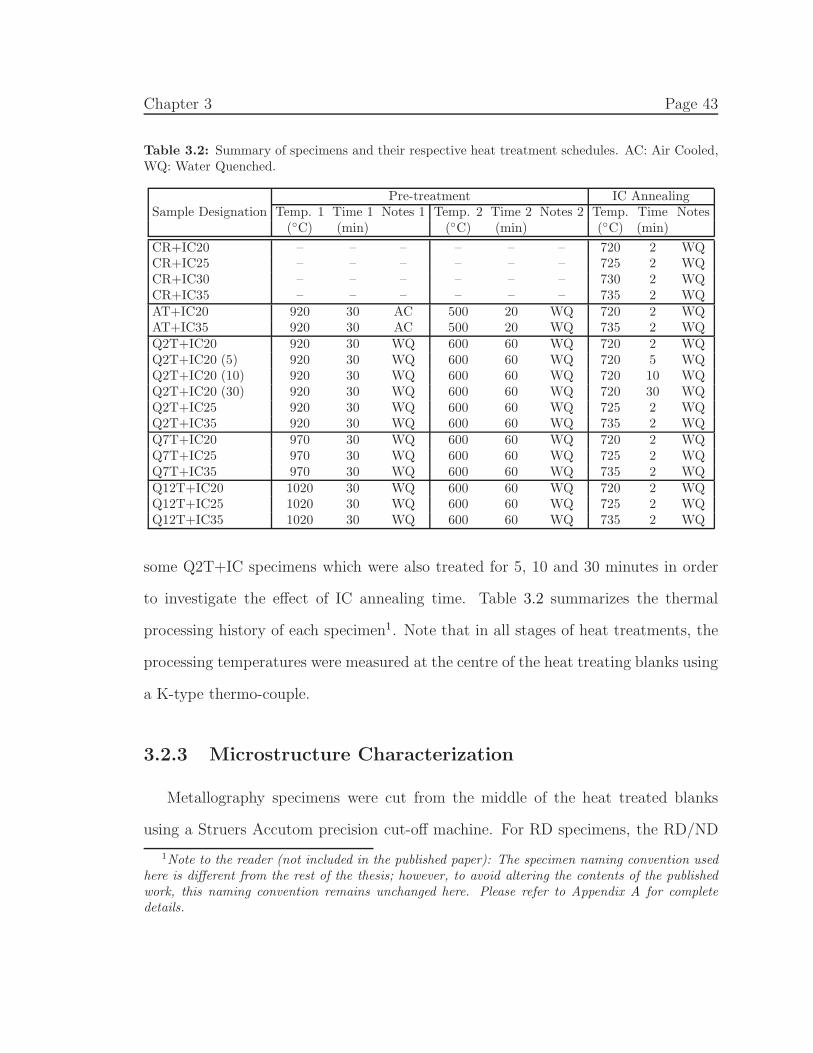
Chapter 3 Page 43
Table 3.2: Summary of specimens and their respective heat treatment schedules. AC: Air Cooled,WQ: Water Quenched.
Sample DesignationPre-treatment IC Annealing
Temp. 1 Time 1 Notes 1 Temp. 2 Time 2 Notes 2 Temp. Time Notes(◦C) (min) (◦C) (min) (◦C) (min)
CR+IC20 – – – – – – 720 2 WQCR+IC25 – – – – – – 725 2 WQCR+IC30 – – – – – – 730 2 WQCR+IC35 – – – – – – 735 2 WQAT+IC20 920 30 AC 500 20 WQ 720 2 WQAT+IC35 920 30 AC 500 20 WQ 735 2 WQQ2T+IC20 920 30 WQ 600 60 WQ 720 2 WQQ2T+IC20 (5) 920 30 WQ 600 60 WQ 720 5 WQQ2T+IC20 (10) 920 30 WQ 600 60 WQ 720 10 WQQ2T+IC20 (30) 920 30 WQ 600 60 WQ 720 30 WQQ2T+IC25 920 30 WQ 600 60 WQ 725 2 WQQ2T+IC35 920 30 WQ 600 60 WQ 735 2 WQQ7T+IC20 970 30 WQ 600 60 WQ 720 2 WQQ7T+IC25 970 30 WQ 600 60 WQ 725 2 WQQ7T+IC35 970 30 WQ 600 60 WQ 735 2 WQQ12T+IC20 1020 30 WQ 600 60 WQ 720 2 WQQ12T+IC25 1020 30 WQ 600 60 WQ 725 2 WQQ12T+IC35 1020 30 WQ 600 60 WQ 735 2 WQ
some Q2T+IC specimens which were also treated for 5, 10 and 30 minutes in order
to investigate the effect of IC annealing time. Table 3.2 summarizes the thermal
processing history of each specimen1. Note that in all stages of heat treatments, the
processing temperatures were measured at the centre of the heat treating blanks using
a K-type thermo-couple.
3.2.3 Microstructure Characterization
Metallography specimens were cut from the middle of the heat treated blanks
using a Struers Accutom precision cut-off machine. For RD specimens, the RD/ND
1Note to the reader (not included in the published paper): The specimen naming convention usedhere is different from the rest of the thesis; however, to avoid altering the contents of the publishedwork, this naming convention remains unchanged here. Please refer to Appendix A for completedetails.
Chapter 3 Page 44
sections were investigated while for TD specimens, the plane of interest was TD/ND
where ND is the normal, through-thickness, direction. After mounting, specimens
were polished down to a 0.06 micron surface finish using standard metallography
procedures. They were then etched using either 2% Nital for 13 seconds or 4% Picral
plus zaphiran chloride addition for 40 seconds (with 3 seconds of 2% Nital pre-etch).
The former etchant revealed ferrite grain boundaries as well as martensite and carbide
particles, while the latter only etched carbides. The metallographic specimens were
then examined using a JEOL 840 scanning electron microscope (SEM) at a working
distance of 15mm and with an accelerating voltage of 20kV. Selected specimens were
also etched with the LePera’s etchant [44] for 40 seconds (with 3 seconds of 2% Nital
pre-etch) and examined using a Zeiss Axiophot optical microscope.
The average size and volume fraction of martensite particles and carbide particles,
were measured for all microstructures. Volume fraction measurements were obtained
using a manual point counting technique with a minimum of ∼4000 points in ac-
cordance with ASTM-E562. Measurements of the average particle size, i.e. mean
particle diameter, were made following ASTM-E112 using the intercept method with
three concentric circles. Carbide particle measurements were performed on selected
Picral-etched microstructures, i.e. CR+IC25, AT+IC20 and Q2T+IC25, Q7T+IC35,
Q12T+IC35. For martensite particle analysis, Nital-etched specimens were used.
Since Nital etches both martensite and carbide phases, it was important to establish
a criterion for distinguishing between these two phases. During carbide measurements
(using Picral-etched specimens), it was observed that carbides are generally circular
in shape and very small in size (∼0.07 ± 0.01 microns). Therefore, for martensite
particle measurements using Nital-etched specimens, any particle that fit this carbide
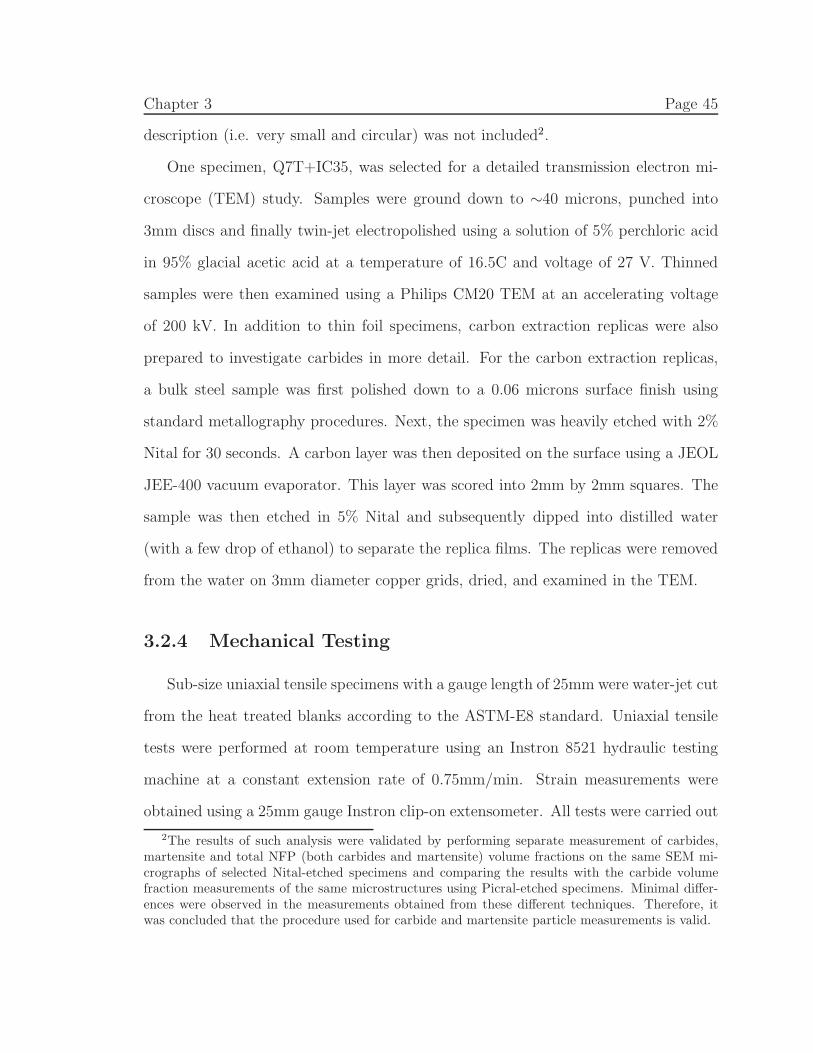
Chapter 3 Page 45
description (i.e. very small and circular) was not included2.
One specimen, Q7T+IC35, was selected for a detailed transmission electron mi-
croscope (TEM) study. Samples were ground down to ∼40 microns, punched into
3mm discs and finally twin-jet electropolished using a solution of 5% perchloric acid
in 95% glacial acetic acid at a temperature of 16.5C and voltage of 27 V. Thinned
samples were then examined using a Philips CM20 TEM at an accelerating voltage
of 200 kV. In addition to thin foil specimens, carbon extraction replicas were also
prepared to investigate carbides in more detail. For the carbon extraction replicas,
a bulk steel sample was first polished down to a 0.06 microns surface finish using
standard metallography procedures. Next, the specimen was heavily etched with 2%
Nital for 30 seconds. A carbon layer was then deposited on the surface using a JEOL
JEE-400 vacuum evaporator. This layer was scored into 2mm by 2mm squares. The
sample was then etched in 5% Nital and subsequently dipped into distilled water
(with a few drop of ethanol) to separate the replica films. The replicas were removed
from the water on 3mm diameter copper grids, dried, and examined in the TEM.
3.2.4 Mechanical Testing
Sub-size uniaxial tensile specimens with a gauge length of 25mm were water-jet cut
from the heat treated blanks according to the ASTM-E8 standard. Uniaxial tensile
tests were performed at room temperature using an Instron 8521 hydraulic testing
machine at a constant extension rate of 0.75mm/min. Strain measurements were
obtained using a 25mm gauge Instron clip-on extensometer. All tests were carried out
2The results of such analysis were validated by performing separate measurement of carbides,martensite and total NFP (both carbides and martensite) volume fractions on the same SEM mi-crographs of selected Nital-etched specimens and comparing the results with the carbide volumefraction measurements of the same microstructures using Picral-etched specimens. Minimal differ-ences were observed in the measurements obtained from these different techniques. Therefore, itwas concluded that the procedure used for carbide and martensite particle measurements is valid.
Chapter 3 Page 46
to failure. True stress (σ) versus true strain (ǫ) tensile curves were calculated along
with the work hardening rate, θ = dσ/dǫ , and the instantaneous work hardening
exponent, n = dlogσ/dlogǫ [45].
3.3 Results
3.3.1 Microstructures
The starting microstructures, i.e. prior to the IC annealing treatment, are shown
in Figure 3.1. The following observations can be made from these micrographs:� The CR microstructure (Figure 3.1a) consists of a heavily deformed mixture
of ferrite, pearlite and small amounts of martensite. Consequently, this mi-
crostructure has the finest ferrite grains in comparison with the other pre-treated
materials.� The AT microstructure (Figure 3.1b) is composed of upper bainite (UB), i.e.
carbide free ferrite laths with martensite/retained austenite (M/A) between
the laths, granular bainite (GB), i.e. carbide-free irregular ferrite grains with
M/A, and also individual martensite (M) particles. This microstructure is in
agreement with the published CCT and TTT plots of steels with similar com-
positions [46, 47]. In terms of the non-ferritic phases, this material has the
coarsest microstructure among the pre-treated specimens.� All three QT microstructures (having different austenitization temperatures)
show a tempered martensite structure with a uniform spatial distribution of
fine carbides located at the prior austenite grain boundaries as well as prior
martensite lath boundaries. Additionally, from Figures 3.1c to 3.1e, it can be
Chapter 3 Page 47
seen that the austenitization temperature does not have a significant effect on
the microstructure other than an increase in the prior austenite grain size.
IC annealing was carried out on the pre-treated materials (shown in Figure 3.1) at
various temperatures, as summarized in Table 3.2. Three conditions were chosen for
the base comparison: CR+IC25, Q7T+IC35 and AT+IC20. These microstructures,
shown in Figure 3.2, were selected due to the similarity in their martensite volume
fractions (average of 14.7 ± 3.2 %). Measurements of volume fraction and average size
are given in Tables 3.3 and 3.4 for the martensite and carbide particles, respectively.
Table 3.3 also includes descriptions of the morphology and spatial distribution of
martensite particles. The following observations can be made:� In microstructure CR+IC25 (Figures 3.2a and 3.2d), the martensite particles
are primarily located at the ferrite grain boundaries and they are mostly aligned
along the rolling direction. This corresponds directly with the distribution of
carbides/pearlite colonies in the starting cold-rolled (CR) microstructure (Fig-
ure 3.1a). The martensite particles in this microstructure have a rather uniform
shape and size, i.e. they are mostly equiaxed and there is a small variation in
their size. Finally, the ferrite matrix is fully recrystallized as demonstrated by
equiaxed ferrite grains and a lack of visible prior deformation. Note that fer-
rite grains have a bimodal size distribution, i.e. ferrite grains along the prior
pearlite bands are generally smaller in size compared to those located in prior
pearlite-free regions.� Microstructure AT+IC20 (Figures 3.2b and 3.2e) consists of elongated marten-
site particles positioned along prior bainite lath boundary locations of the AT
microstructure. In addition, smaller martensite particles are also present at the
Chapter 3 Page 48
(a) (b)
(c) (d)
(e)
Figure 3.1: Microstructures after pre-heat treatments. (a) CR, (b) AT, (c) Q2T (920C), (d) Q7T(970C) and (e) Q12T (1020C). SEM-SE, 2% Nital etch. In the CR and AT microstructures, thepearlite (P), martensite (M), upper bainite (UB) and granular bainite (GB) constituents are marked.White phases are carbides and martensite, the black phase is ferrite.
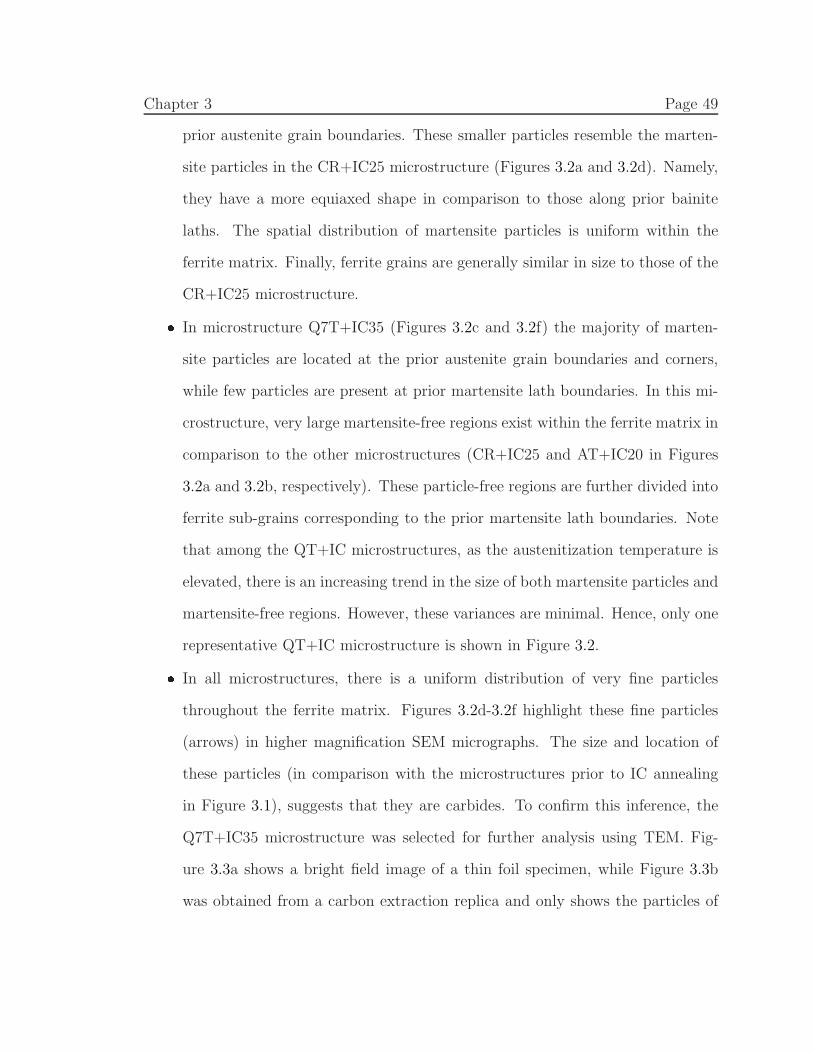
Chapter 3 Page 49
prior austenite grain boundaries. These smaller particles resemble the marten-
site particles in the CR+IC25 microstructure (Figures 3.2a and 3.2d). Namely,
they have a more equiaxed shape in comparison to those along prior bainite
laths. The spatial distribution of martensite particles is uniform within the
ferrite matrix. Finally, ferrite grains are generally similar in size to those of the
CR+IC25 microstructure.� In microstructure Q7T+IC35 (Figures 3.2c and 3.2f) the majority of marten-
site particles are located at the prior austenite grain boundaries and corners,
while few particles are present at prior martensite lath boundaries. In this mi-
crostructure, very large martensite-free regions exist within the ferrite matrix in
comparison to the other microstructures (CR+IC25 and AT+IC20 in Figures
3.2a and 3.2b, respectively). These particle-free regions are further divided into
ferrite sub-grains corresponding to the prior martensite lath boundaries. Note
that among the QT+IC microstructures, as the austenitization temperature is
elevated, there is an increasing trend in the size of both martensite particles and
martensite-free regions. However, these variances are minimal. Hence, only one
representative QT+IC microstructure is shown in Figure 3.2.� In all microstructures, there is a uniform distribution of very fine particles
throughout the ferrite matrix. Figures 3.2d-3.2f highlight these fine particles
(arrows) in higher magnification SEM micrographs. The size and location of
these particles (in comparison with the microstructures prior to IC annealing
in Figure 3.1), suggests that they are carbides. To confirm this inference, the
Q7T+IC35 microstructure was selected for further analysis using TEM. Fig-
ure 3.3a shows a bright field image of a thin foil specimen, while Figure 3.3b
was obtained from a carbon extraction replica and only shows the particles of
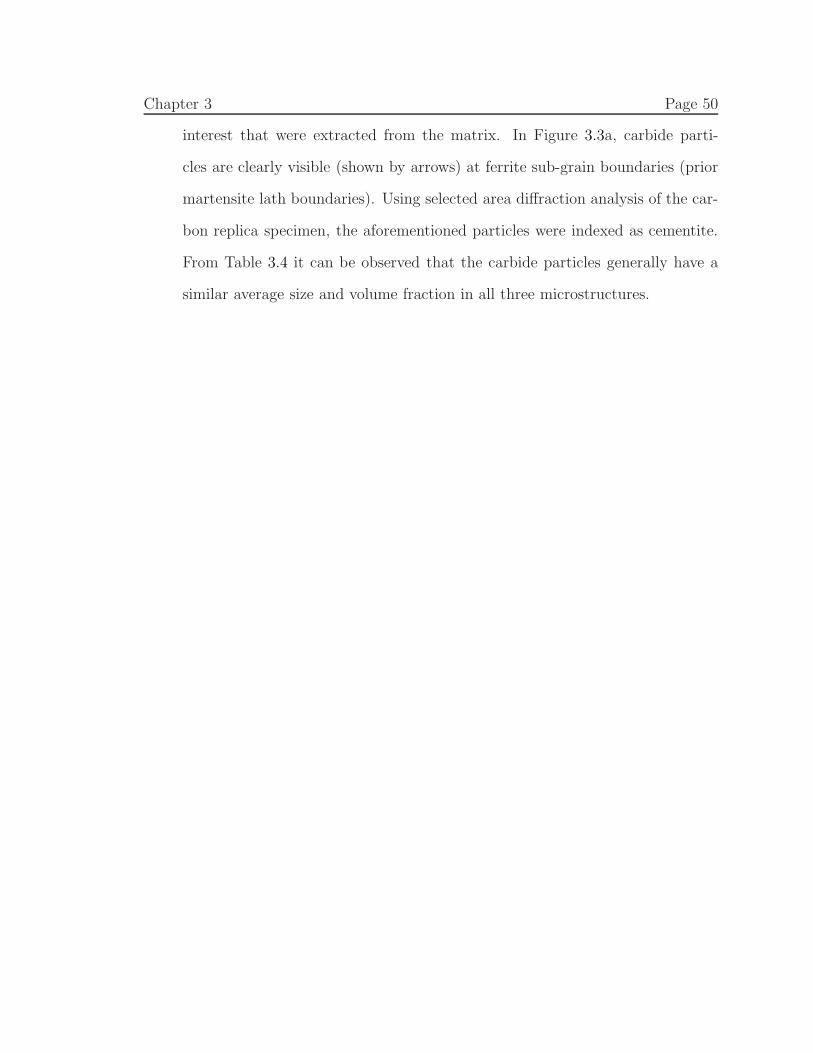
Chapter 3 Page 50
interest that were extracted from the matrix. In Figure 3.3a, carbide parti-
cles are clearly visible (shown by arrows) at ferrite sub-grain boundaries (prior
martensite lath boundaries). Using selected area diffraction analysis of the car-
bon replica specimen, the aforementioned particles were indexed as cementite.
From Table 3.4 it can be observed that the carbide particles generally have a
similar average size and volume fraction in all three microstructures.
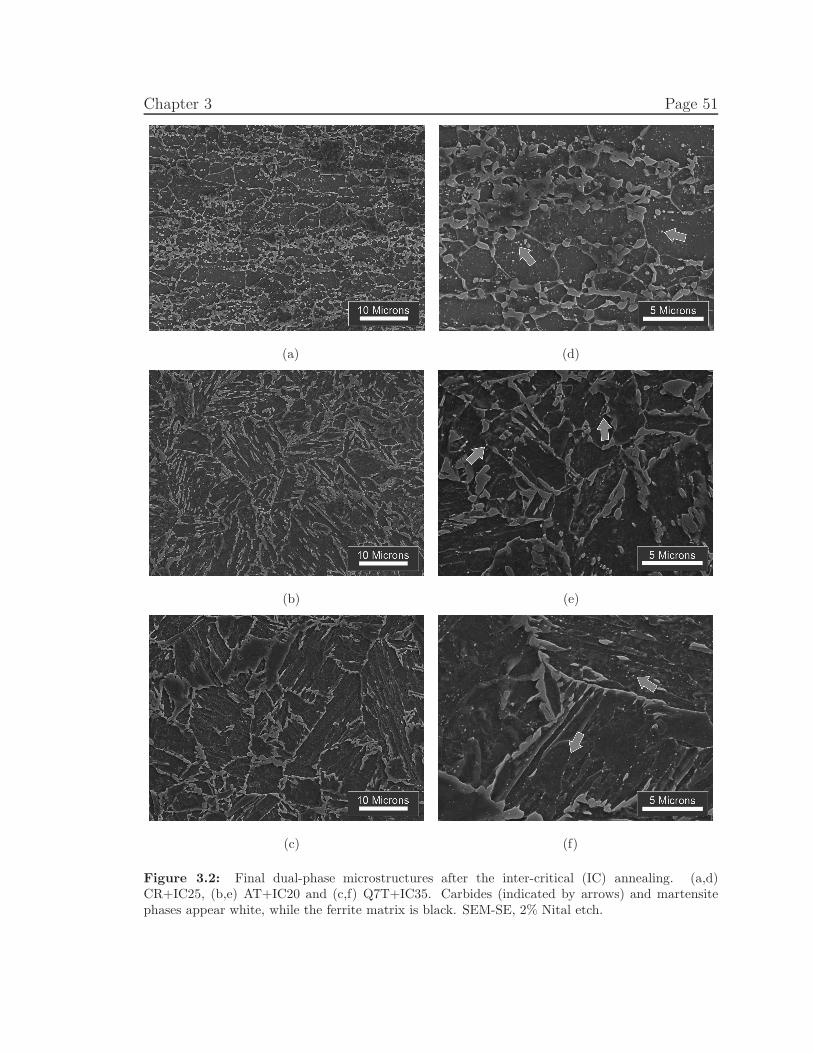
Chapter 3 Page 51
(a) (d)
(b) (e)
(c) (f)
Figure 3.2: Final dual-phase microstructures after the inter-critical (IC) annealing. (a,d)CR+IC25, (b,e) AT+IC20 and (c,f) Q7T+IC35. Carbides (indicated by arrows) and martensitephases appear white, while the ferrite matrix is black. SEM-SE, 2% Nital etch.
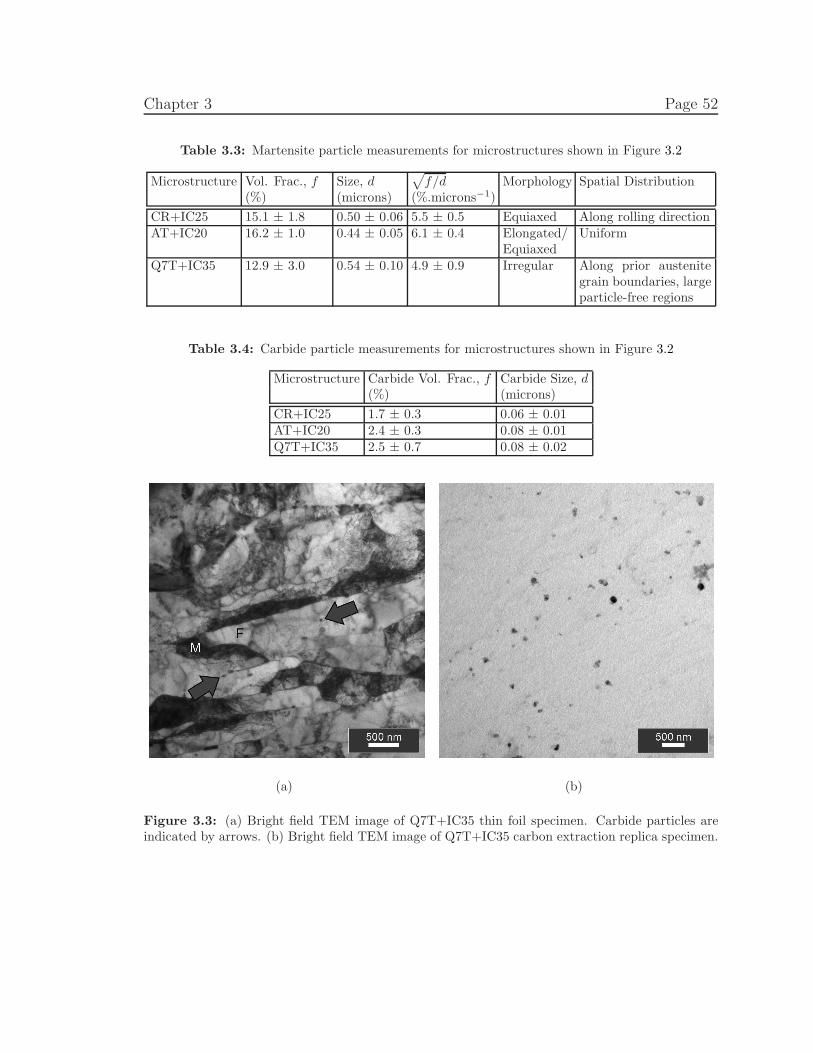
Chapter 3 Page 52
Table 3.3: Martensite particle measurements for microstructures shown in Figure 3.2
Microstructure Vol. Frac., f Size, d√
f/d Morphology Spatial Distribution(%) (microns) (%.microns−1)
CR+IC25 15.1 ± 1.8 0.50 ± 0.06 5.5 ± 0.5 Equiaxed Along rolling directionAT+IC20 16.2 ± 1.0 0.44 ± 0.05 6.1 ± 0.4 Elongated/
EquiaxedUniform
Q7T+IC35 12.9 ± 3.0 0.54 ± 0.10 4.9 ± 0.9 Irregular Along prior austenitegrain boundaries, largeparticle-free regions
Table 3.4: Carbide particle measurements for microstructures shown in Figure 3.2
Microstructure Carbide Vol. Frac., f Carbide Size, d(%) (microns)
CR+IC25 1.7 ± 0.3 0.06 ± 0.01AT+IC20 2.4 ± 0.3 0.08 ± 0.01Q7T+IC35 2.5 ± 0.7 0.08 ± 0.02
(a) (b)
Figure 3.3: (a) Bright field TEM image of Q7T+IC35 thin foil specimen. Carbide particles areindicated by arrows. (b) Bright field TEM image of Q7T+IC35 carbon extraction replica specimen.
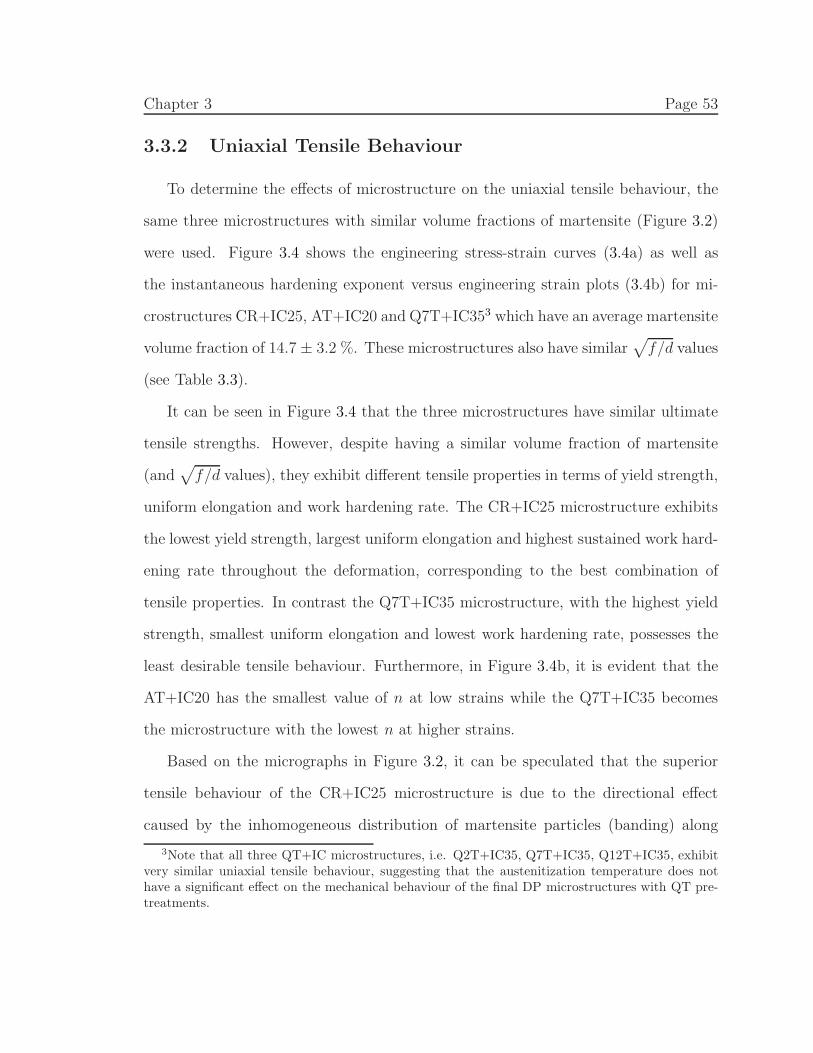
Chapter 3 Page 53
3.3.2 Uniaxial Tensile Behaviour
To determine the effects of microstructure on the uniaxial tensile behaviour, the
same three microstructures with similar volume fractions of martensite (Figure 3.2)
were used. Figure 3.4 shows the engineering stress-strain curves (3.4a) as well as
the instantaneous hardening exponent versus engineering strain plots (3.4b) for mi-
crostructures CR+IC25, AT+IC20 and Q7T+IC353 which have an average martensite
volume fraction of 14.7 ± 3.2 %. These microstructures also have similar√
f/d values
(see Table 3.3).
It can be seen in Figure 3.4 that the three microstructures have similar ultimate
tensile strengths. However, despite having a similar volume fraction of martensite
(and√
f/d values), they exhibit different tensile properties in terms of yield strength,
uniform elongation and work hardening rate. The CR+IC25 microstructure exhibits
the lowest yield strength, largest uniform elongation and highest sustained work hard-
ening rate throughout the deformation, corresponding to the best combination of
tensile properties. In contrast the Q7T+IC35 microstructure, with the highest yield
strength, smallest uniform elongation and lowest work hardening rate, possesses the
least desirable tensile behaviour. Furthermore, in Figure 3.4b, it is evident that the
AT+IC20 has the smallest value of n at low strains while the Q7T+IC35 becomes
the microstructure with the lowest n at higher strains.
Based on the micrographs in Figure 3.2, it can be speculated that the superior
tensile behaviour of the CR+IC25 microstructure is due to the directional effect
caused by the inhomogeneous distribution of martensite particles (banding) along
3Note that all three QT+IC microstructures, i.e. Q2T+IC35, Q7T+IC35, Q12T+IC35, exhibitvery similar uniaxial tensile behaviour, suggesting that the austenitization temperature does nothave a significant effect on the mechanical behaviour of the final DP microstructures with QT pre-treatments.
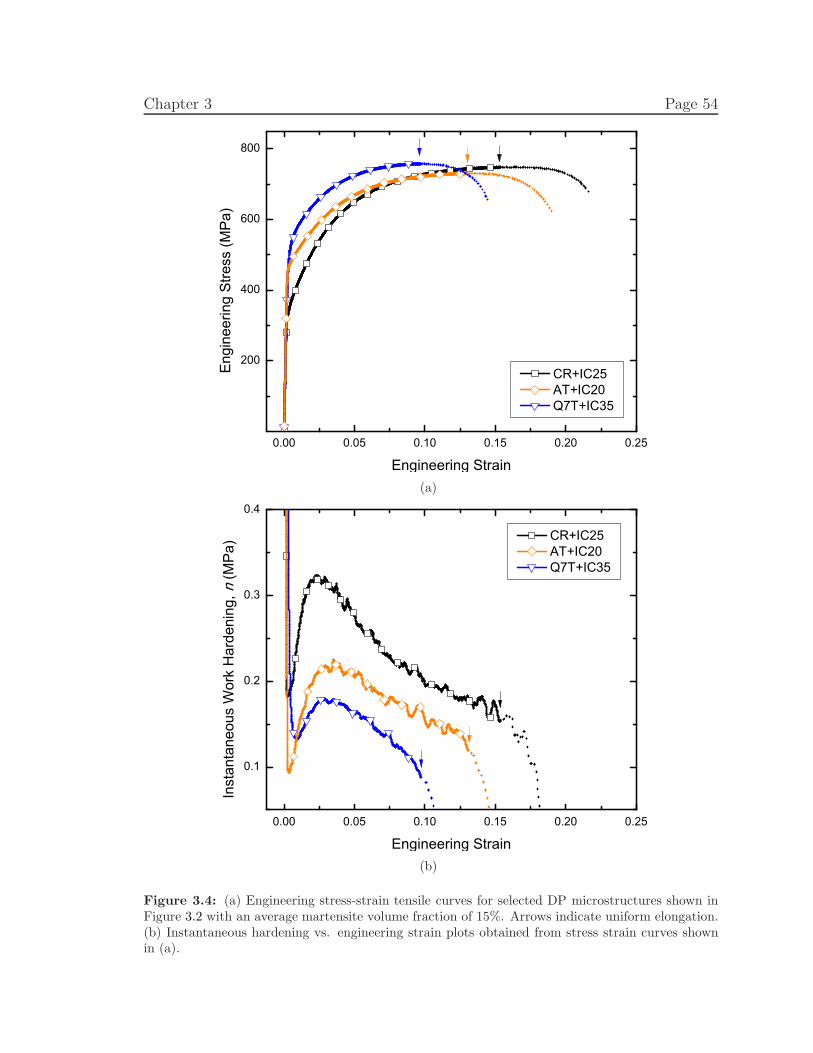
Chapter 3 Page 54
0.00 0.05 0.10 0.15 0.20 0.25
200
400
600
800
CR+IC25 AT+IC20 Q7T+IC35
Engi
neer
ing
Stre
ss (M
Pa)
Engineering Strain(a)
0.00 0.05 0.10 0.15 0.20 0.25
0.1
0.2
0.3
0.4
CR+IC25 AT+IC20 Q7T+IC35
Inst
anta
neou
s W
ork
Har
deni
ng, n
(MPa
)
Engineering Strain(b)
Figure 3.4: (a) Engineering stress-strain tensile curves for selected DP microstructures shown inFigure 3.2 with an average martensite volume fraction of 15%. Arrows indicate uniform elongation.(b) Instantaneous hardening vs. engineering strain plots obtained from stress strain curves shownin (a).
Chapter 3 Page 55
0.00 0.05 0.10 0.15 0.20 0.250
200
400
600
800
CR+IC25 RD (U.EL=0.153) CR+IC30 RD (U.EL=0.132) CR+IC35 RD (U.EL=0.100) CR+IC25 TD (U.EL=0.153) CR+IC30 TD (U.EL=0.132) CR+IC35 TD (U.EL=0.099)
Engi
neer
ing
Stre
ss (M
Pa)
Engineering Strain
Figure 3.5: Engineering stress-strain curves for CR+IC microstructures tested along RD and TDdirections.
the tensile direction, i.e. rolling direction of the sheet. To investigate this possibility,
two groups of specimens were prepared from the initial CR material: one with the
loading direction along the RD and a second set along the TD. These specimens
were then IC annealed at three different temperatures of 725, 730 and 735◦C. The
results of these RD versus TD uniaxial tensile tests are plotted in Figure 3.5. With
the exception of a small difference in ultimate tensile strength, it is evident that the
tensile behaviour is similar in both RD and TD directions. In particular, the uniform
elongation, i.e. strain at the UTS, is virtually identical in each sample pair. This
similarity in RD versus TD tensile response suggests that the superior behaviour
of the CR+IC25 microstructure, in comparison with QT+IC and AT+IC20, is not
simply a result of the banding of martensite particles in the loading direction of RD
specimens.
Chapter 3 Page 56
3.4 Discussion
3.4.1 Microstructure
It is evident from Figures 3.1 and 3.2 that the microstructures prior to and after
IC annealing correlate directly with one another. In the final DP microstructures,
martensite particles are primarily located at ferrite grain boundaries as well as other
locations of high carbon concentration such as previous pearlite colonies, carbides
and martensite particles. It is known that the rate of austenite transformation from
pearlite colonies and martensite particles is very rapid [5]. In the case of individual
carbide particles, however, the situation is more complicated. Referring to the QT mi-
crostructures (Figures 3.1c-3.1e), the microstructure prior to IC annealing is tempered
martensite with a uniform spatial distribution of very fine carbide particles through-
out the structure. It is known that carbide particles are a primary nucleation site
for austenite since they provide a high concentration of carbon required for austenite
nucleation [5–7]. However, from Figures 3.2c and 3.2f, it can be observed that not all
of the carbide particles seem to have the same effectiveness for austenite nucleation.
That is, the majority of martensite particles in the final DP microstructure are lo-
cated along prior austenite grain boundaries, whereas there are a very limited number
of martensite particles at ferrite sub-grain boundaries and most of the sub-grain car-
bides appear to be unaffected by the IC annealing process. This discrepancy may be
explained by considering the grain boundary effect in lowering the critical nucleation
energy. That is, the formation of austenite on grain boundaries reduces the surface
energy associated with these grain boundaries, and therefore, austenite nucleation on
the ferrite grain boundaries (high energy) can decrease the total surface energy of
the system more effectively than nucleation on the ferrite sub-grain boundaries (low
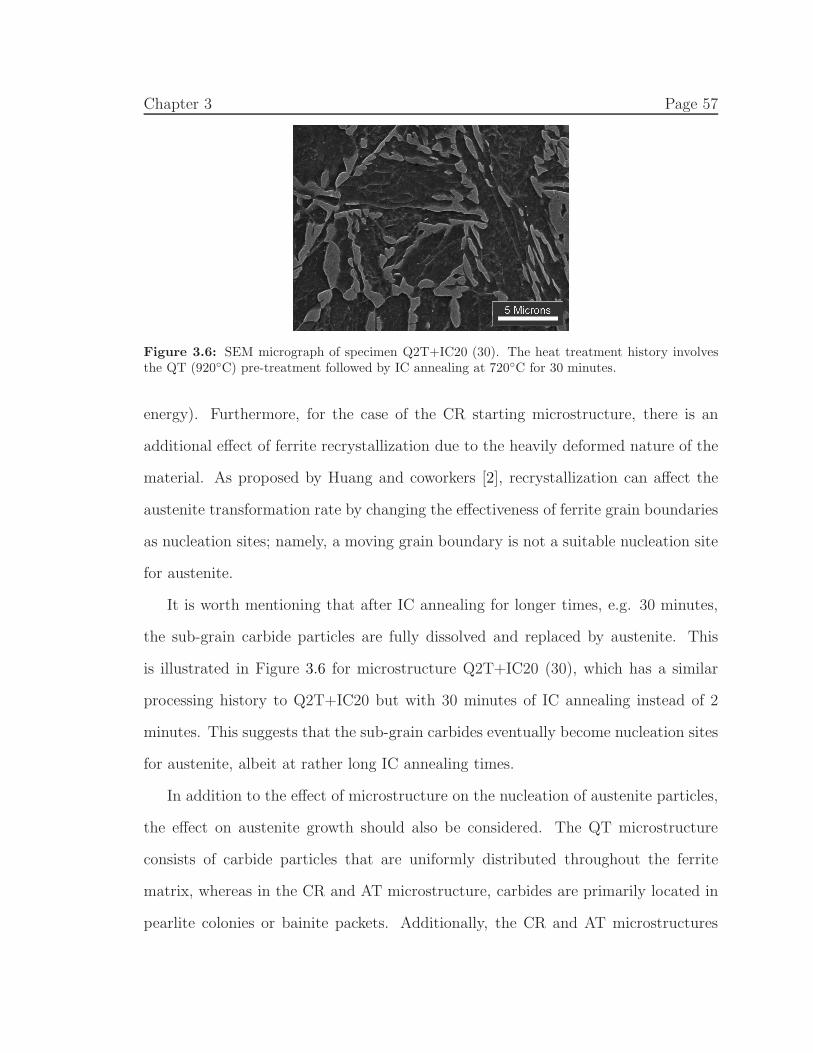
Chapter 3 Page 57
Figure 3.6: SEM micrograph of specimen Q2T+IC20 (30). The heat treatment history involvesthe QT (920◦C) pre-treatment followed by IC annealing at 720◦C for 30 minutes.
energy). Furthermore, for the case of the CR starting microstructure, there is an
additional effect of ferrite recrystallization due to the heavily deformed nature of the
material. As proposed by Huang and coworkers [2], recrystallization can affect the
austenite transformation rate by changing the effectiveness of ferrite grain boundaries
as nucleation sites; namely, a moving grain boundary is not a suitable nucleation site
for austenite.
It is worth mentioning that after IC annealing for longer times, e.g. 30 minutes,
the sub-grain carbide particles are fully dissolved and replaced by austenite. This
is illustrated in Figure 3.6 for microstructure Q2T+IC20 (30), which has a similar
processing history to Q2T+IC20 but with 30 minutes of IC annealing instead of 2
minutes. This suggests that the sub-grain carbides eventually become nucleation sites
for austenite, albeit at rather long IC annealing times.
In addition to the effect of microstructure on the nucleation of austenite particles,
the effect on austenite growth should also be considered. The QT microstructure
consists of carbide particles that are uniformly distributed throughout the ferrite
matrix, whereas in the CR and AT microstructure, carbides are primarily located in
pearlite colonies or bainite packets. Additionally, the CR and AT microstructures
Chapter 3 Page 58
Table 3.5: Martensite particle measurements for three different starting materials after IC annealingat 735◦C
Microstructure Vol. Frac., f Size, d√
f/d(%) (microns) (%.microns−1)
CR+IC35 21.2 ± 1.9 0.54 ± 0.03 6.2 ± 0.3AT+IC35 28.7 ± 2.4 0.56 ± 0.11 7.1 ± 0.7Q7T+IC35 12.9 ± 4.2 0.54 ± 0.10 4.9 ± 0.9
also contain small amounts of martensite and M/A particles, respectively. Since the
rate of austenite growth from pearlite colonies and martensite particles is known to
be very rapid [5], it is expected the austenite transformation is faster for both the
CR and AT starting conditions in comparison with QT.
In summary, it can be seen that the starting microstructure prior to the IC an-
nealing will affect the kinetics of both austenite nucleation and growth, leading to the
observed differences in martensite volume fractions for the various starting microstruc-
tures subjected to common IC annealing treatments. Accordingly, the martensite vol-
ume fraction was found to be the highest for the AT starting material while the QT
starting microstructure produced the smallest martensite content. This relationship
is summarized in Table 3.5 for the case of IC annealing at 735◦C for 2 minutes.
3.4.2 Uniaxial Tensile Behaviour
In Figure 3.4, it can be seen that the CR+IC25, AT+IC20 and Q7T+IC35 mi-
crostructures exhibit different tensile behaviours in terms of uniform elongation and
work hardening rates, despite having similar volume fractions (and√
f/d values) of
martensite particles (see Table 3.3). These differences in uniaxial tensile behaviour
are therefore likely due to the other microstructural parameters such as spatial distri-
bution and morphology of the martensite particles. The Q7T+IC35 microstructure
with the least uniform spatial distribution of elongated martensite particles produces
Chapter 3 Page 59
the most inferior uniaxial behaviour. The large particle free regions in the ferrite
matrix are likely a contributing factor for the inferior performance of this microstruc-
ture in comparison with the other two. Between the CR+IC25 and AT+IC20, the
former has more equiaxed and fewer large martensite particles, which could explain
the better uniaxial tensile behaviour of this microstructure. Moreover, martensite
particles are more similarly sized in the CR+IC25 microstructure when compared to
AT+IC20, which could also produce differences in tensile behaviour.
By including the complete data sets of tensile work hardening properties for each
of the heat treatment conditions (Table 3.2), the effect of microstructure on the work
hardening behaviour can be investigated in more detail by considering the variations
with√
f/d for three parameters: (i) the true work hardening rate, θ = dσ/dǫ, (ii)
the instantaneous work hardening rate, n = dlogσ/dlogǫ and (iii) the dislocation
annihilation factor from the Kocks-Mecking model, h = −(θ − θ0)/(σ − σ0) .
3.4.2.1 True work hardening rate
From the uniaxial tensile test data of all microstructures (Table 3.2), a series
of master curves can be produced, such that the true work hardening rate of each
microstructure, θ = dσ/dǫ , is plotted as a function of√
f/d at plastic strains of
0.5%, 2% and 5% (Figure 3.7). It can be seen that for the QT+IC and AT+IC
microstructures, at early stages of deformation (ǫp = 0.5%), θ follows a near linear
relationship with√
f/d . This is in agreement with Ashby’s work hardening model
[37, 38], where the work hardening rate of a DP steel is directly related to the density
of geometrically necessary dislocations (GND’s), which is in turn proportional to the
martensite volume fraction, f , and inversely related to the martensite particle size, d
[9, 11, 20, 31].
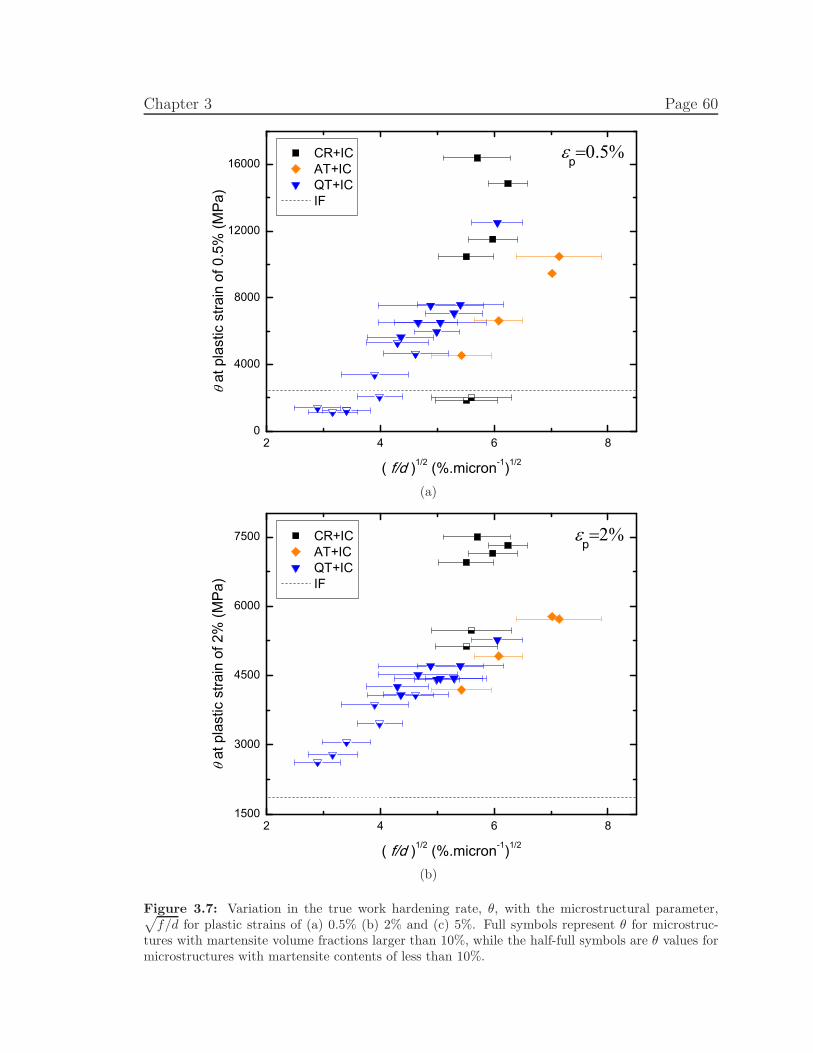
Chapter 3 Page 60
2 4 6 80
4000
8000
12000
16000 p
at p
last
ic s
train
of 0
.5%
(MPa
)
( f/d )1/2 (%.micron-1)1/2
CR+IC AT+IC QT+IC IF
(a)
2 4 6 81500
3000
4500
6000
7500p
at p
last
ic s
train
of 2
% (M
Pa)
( f/d )1/2 (%.micron-1)1/2
CR+IC AT+IC QT+IC IF
(b)
Figure 3.7: Variation in the true work hardening rate, θ, with the microstructural parameter,√
f/d for plastic strains of (a) 0.5% (b) 2% and (c) 5%. Full symbols represent θ for microstruc-tures with martensite volume fractions larger than 10%, while the half-full symbols are θ values formicrostructures with martensite contents of less than 10%.
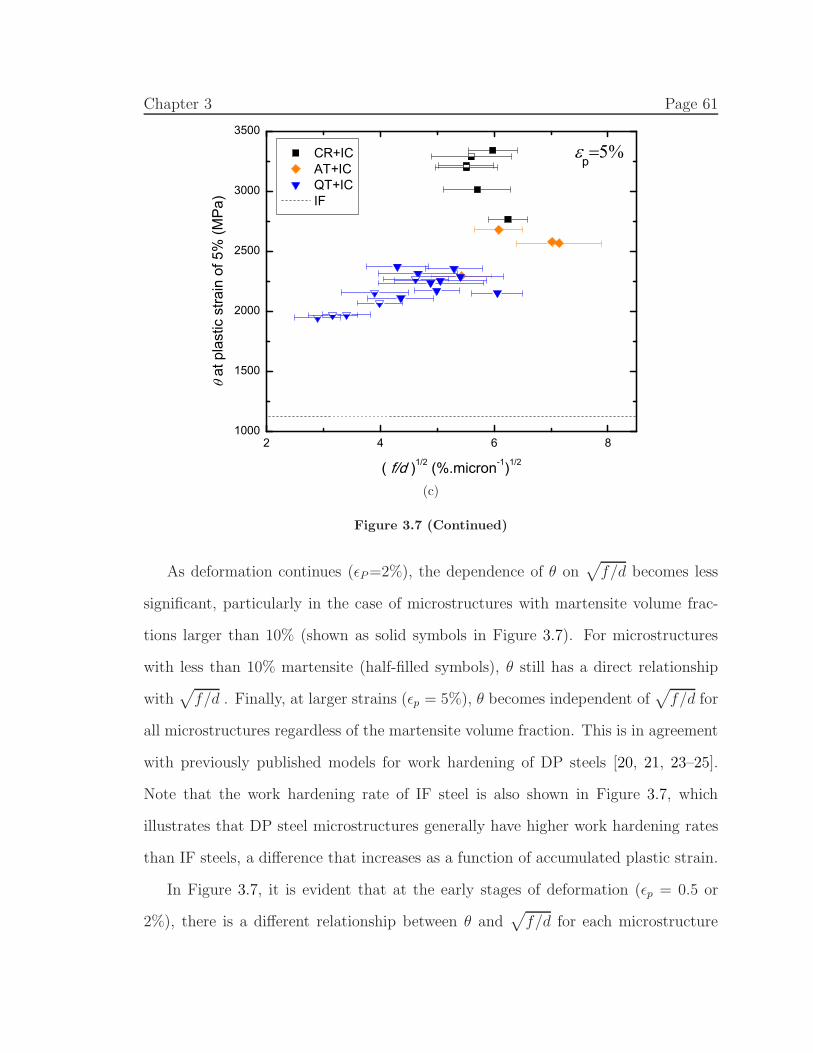
Chapter 3 Page 61
2 4 6 81000
1500
2000
2500
3000
3500
p
at p
last
ic s
train
of 5
% (M
Pa)
( f/d )1/2 (%.micron-1)1/2
CR+IC AT+IC QT+IC IF
(c)
Figure 3.7 (Continued)
As deformation continues (ǫP=2%), the dependence of θ on√
f/d becomes less
significant, particularly in the case of microstructures with martensite volume frac-
tions larger than 10% (shown as solid symbols in Figure 3.7). For microstructures
with less than 10% martensite (half-filled symbols), θ still has a direct relationship
with√
f/d . Finally, at larger strains (ǫp = 5%), θ becomes independent of√
f/d for
all microstructures regardless of the martensite volume fraction. This is in agreement
with previously published models for work hardening of DP steels [20, 21, 23–25].
Note that the work hardening rate of IF steel is also shown in Figure 3.7, which
illustrates that DP steel microstructures generally have higher work hardening rates
than IF steels, a difference that increases as a function of accumulated plastic strain.
In Figure 3.7, it is evident that at the early stages of deformation (ǫp = 0.5 or
2%), there is a different relationship between θ and√
f/d for each microstructure
Chapter 3 Page 62
group. Additionally, at larger strains (ǫp =5%), θ reaches a different saturation value
for each of the microstructure groups. This saturation value of θ is the highest for
the CR+IC microstructure while AT+IC has the lowest value. It can therefore be
concluded that in addition to size and volume fraction of martensite particles, θ is
also dependent upon martensite morphology and spatial distribution.
Note that, for the CR+IC microstructures, θ is not a function of√
f/d at any
of the values of plastic strain plotted in Figure 3.7. This suggests that the work
hardening of these microstructures is primarily controlled by other factors such as
ferrite grain size. Studies are currently underway to confirm this effect.
Finally, when comparing the tensile behaviour of multiple microstructures, it is
important to consider the effect of changes in martensite strength caused by varia-
tions in the martensite volume fraction. That is, due to a lower carbon content, the
strength of martensite is decreased by increasing the martensite volume fraction as
well as the IC annealing temperature. Changes to the martensite strength will re-
sult in different levels of strain partitioning between ferrite and martensite. However,
based on the results of Mazinani and Poole [10], for the volume fractions of martensite
investigated in this paper (maximum of 28.7 ± 2.4), it can be assumed that marten-
site remains elastic throughout the applied deformation. Therefore, the variations
of strain partitioning among different specimens should be minimal4. Additionally,
it follows that Ashby’s work hardening model is valid for the volume fractions of
martensite investigated here, which means that the generation of GND’s is a function
of geometry rather than the strain partitioning level between the constituents [11, 38].
4Note to the reader (not included in the published paper): Following the work reported inChapter 4, this statement was found to be inaccurate. The stress partitioning between ferrite andmartensite is indeed a function of their respective strengths, both of which are changing in differentmicrostructures. This will be discussed in more detail in Chapter 4.
Chapter 3 Page 63
Note that at higher volume fractions of martensite (not investigated here), marten-
site is expected to deform plastically to some extent, such that the work hardening
behaviour could be affected by variations in martensite strength.
3.4.2.2 Instantaneous work hardening rate
The uniaxial tensile data can also be analyzed using the instantaneous hardening
rate, n = dlogσ/dlogǫ. This parameter provides an instantaneous mathematical
representation of the work hardening rate during uniaxial tensile deformation (see
Figure 3.4b). During the transition from elastic to plastic deformation, it is generally
observed that n decreases rapidly from 1 (elastic behaviour) to a minimum value,
referred to as nmin. Upon further straining, n increases to a maximum value, nmax, and
then gradually decreases again until the onset of plastic instability. The increase from
nmin to nmax takes place within the early stages of deformation (on average, ǫ = 2.2%
± 0.7%). It has been previously reported in the literature that the contribution of
martensite particles to the work hardening of DP steels is most prominent during the
early stages of deformation [20, 21, 23–25]. Therefore, the instantaneous hardening
rate analysis based on nmin and nmax can provide a suitable method for identifying
effects of microstructure on tensile behaviour. The results of such an analysis are
shown in Figure 3.8.
In Figure 3.8, the nmin (solid symbols) and nmax (empty symbols), are plotted
for each microstructure as a function of√
f/d. A direct relationship between nmin
and√
f/d is evident, a trend that agrees with the previously established DP work
hardening models (i.e. particle hardening mechanism) suggested by Ashby [37, 38].
Additionally, it is evident from Figure 3.8, that the AT+IC microstructures generally
have smaller nmin values in comparison with CR+IC and QT+IC (regardless of the
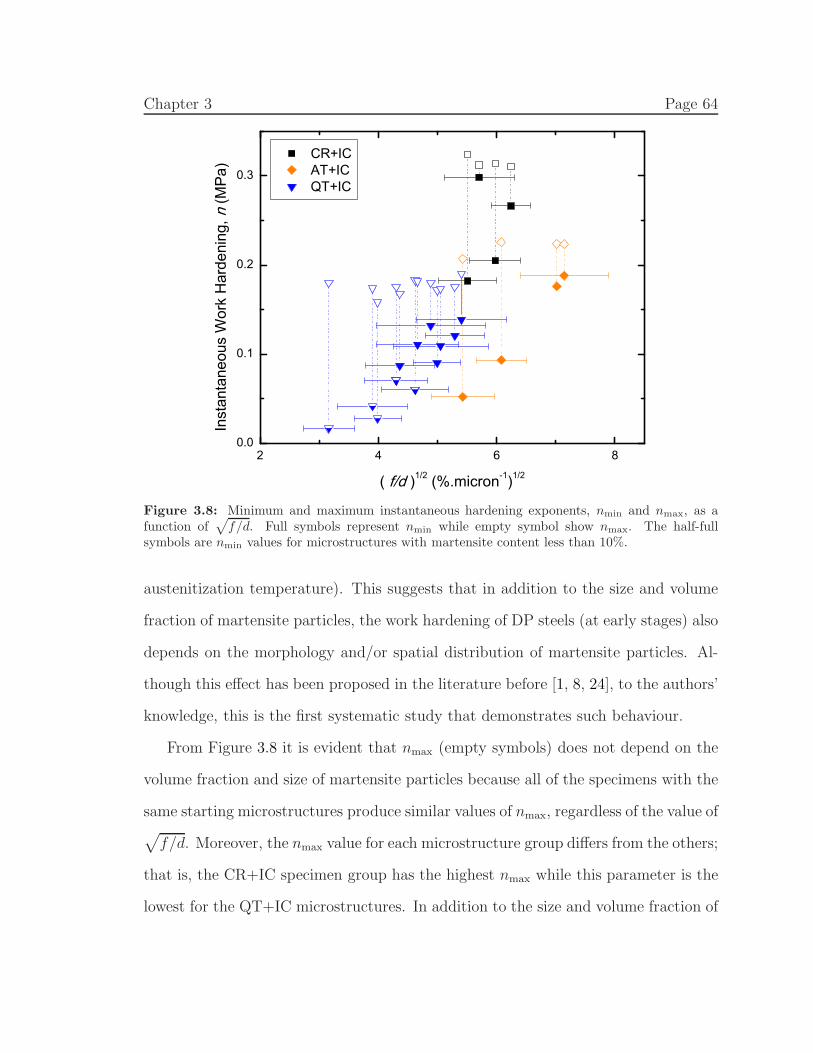
Chapter 3 Page 64
2 4 6 80.0
0.1
0.2
0.3
CR+IC AT+IC QT+IC
Inst
anta
neou
s W
ork
Har
deni
ng, n
(MPa
)
( f/d )1/2 (%.micron-1)1/2
Figure 3.8: Minimum and maximum instantaneous hardening exponents, nmin and nmax, as afunction of
√
f/d. Full symbols represent nmin while empty symbol show nmax. The half-fullsymbols are nmin values for microstructures with martensite content less than 10%.
austenitization temperature). This suggests that in addition to the size and volume
fraction of martensite particles, the work hardening of DP steels (at early stages) also
depends on the morphology and/or spatial distribution of martensite particles. Al-
though this effect has been proposed in the literature before [1, 8, 24], to the authors’
knowledge, this is the first systematic study that demonstrates such behaviour.
From Figure 3.8 it is evident that nmax (empty symbols) does not depend on the
volume fraction and size of martensite particles because all of the specimens with the
same starting microstructures produce similar values of nmax, regardless of the value of√
f/d. Moreover, the nmax value for each microstructure group differs from the others;
that is, the CR+IC specimen group has the highest nmax while this parameter is the
lowest for the QT+IC microstructures. In addition to the size and volume fraction of
Chapter 3 Page 65
martensite particles, these microstructure groups also differ from one another in terms
of martensite particle morphology and spatial distribution. Hence, the variation in
nmax can be attributed to these latter two parameters.
The results presented in Figure 3.7 correspond with the findings of this instan-
taneous work hardening analysis. That is, at early stages of deformation, θ follows
virtually the same relationship with√
f/d as does nmin. At ǫp = 2%, the dependence
of θ on√
f/d becomes less significant, particularly for microstructures with marten-
site volume fractions larger than 10% (full symbols). Finally, at larger strains (ǫp =
5%), θ becomes independent of√
f/d for all microstructures. This change in depen-
dency agrees with the literature [20, 21, 23–25] and can be explained using Ashby’s
work hardening model [37, 38], where the work hardening contribution of GNDs is
only significant in the early stages of plastic deformation when their respective dislo-
cation density, ρGND, is larger than that of the statistically stored dislocations (SSDs),
ρSSD.
3.4.2.3 Dislocation annihilation factor
The third approach for studying the effect of microstructure on the work hardening
behaviour of DP steels is based on the Kocks-Mecking (KM) model [39–41]. In brief,
the evolution of the dislocation density with strain is assumed to be a function of a
dislocation storage term (athermal) and a dislocation annihilation term (strain rate
and temperature dependent). According to the KM model, the work hardening rate,
θ, follows a linear relationship with stress during stage III of work hardening [41],
defined by:
θ = θ0 −θ0σV
(σ − σ0) (3.1)
Chapter 3 Page 66
where θ0 is the athermal hardening rate and σ0 is the flow stress due to strength-
ening mechanisms that do not include dislocation-dislocation interactions, such as
friction stress, back stresses, solid solution hardening and composite effects. σV is a
microstructure-dependant scaling factor that accounts for dynamic recovery effects
due to dislocation annihilation and is function of the strain rate and temperature.
For the sake of brevity, the θ0/σV will be referred to as the dislocation annihilation
factor, h, throughout this discussion. The KM model was originally proposed for fcc
materials; however, it has also been successfully applied to bcc structures such as
multiphase steels [48, 49].
In order to apply the KM model to the results of the current study, σ0 has to
be calculated. For DP steels with additional complications due to the presence of
residual stresses as well as initial mobile dislocations in the structure prior to loading
[11, 14–18], the calculation of σ0 is not trivial. A simpler approach is to assume that
the standard 0.2% proof stress represents the onset of plastic deformation. While
this may be considered an oversimplification of the problem, due to its consistency,
the 0.2% proof stress can provide a good starting point for comparison of different
microstructures. Note that the determination of σ0 can affect the value of θ0 obtained
from fitting Equation 3.1 to the data. Therefore, the KM model here is only used to
compare the dislocation annihilation terms of the various DP microstructures.
By fitting Equation 3.1 to the stress-strain data (see Appendix B for an example
of the fitting procedure), the relationships between h and√
f/d can be found for
each microstructure group as shown in Figure 3.9. It can be seen that the dislocation
annihilation rate, h, increases with increasing values of√
f/d. Additionally, the
AT+IC microstructure generally has smaller h values in comparison with QT+IC and
CR+IC. All of the DP steel microstructures, regardless of their martensite volume
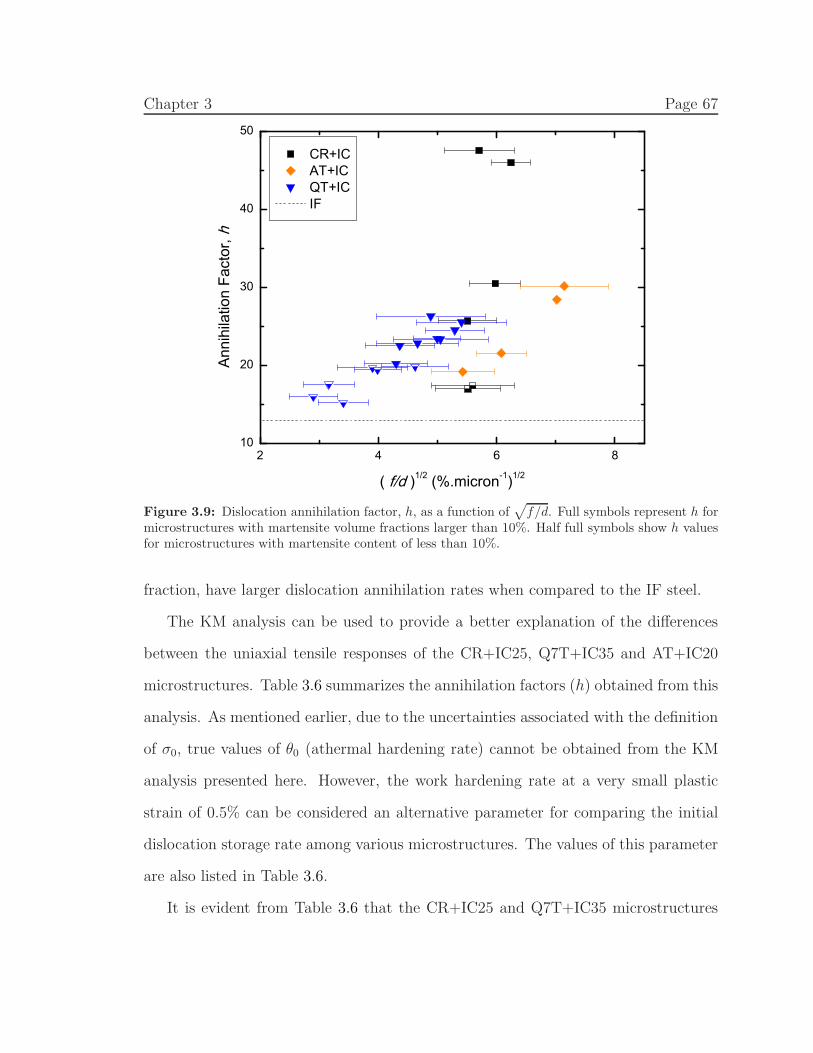
Chapter 3 Page 67
2 4 6 810
20
30
40
50
Anni
hila
tion
Fact
or, h
( f/d )1/2 (%.micron-1)1/2
CR+IC AT+IC QT+IC IF
Figure 3.9: Dislocation annihilation factor, h, as a function of√
f/d. Full symbols represent h formicrostructures with martensite volume fractions larger than 10%. Half full symbols show h valuesfor microstructures with martensite content of less than 10%.
fraction, have larger dislocation annihilation rates when compared to the IF steel.
The KM analysis can be used to provide a better explanation of the differences
between the uniaxial tensile responses of the CR+IC25, Q7T+IC35 and AT+IC20
microstructures. Table 3.6 summarizes the annihilation factors (h) obtained from this
analysis. As mentioned earlier, due to the uncertainties associated with the definition
of σ0, true values of θ0 (athermal hardening rate) cannot be obtained from the KM
analysis presented here. However, the work hardening rate at a very small plastic
strain of 0.5% can be considered an alternative parameter for comparing the initial
dislocation storage rate among various microstructures. The values of this parameter
are also listed in Table 3.6.
It is evident from Table 3.6 that the CR+IC25 and Q7T+IC35 microstructures
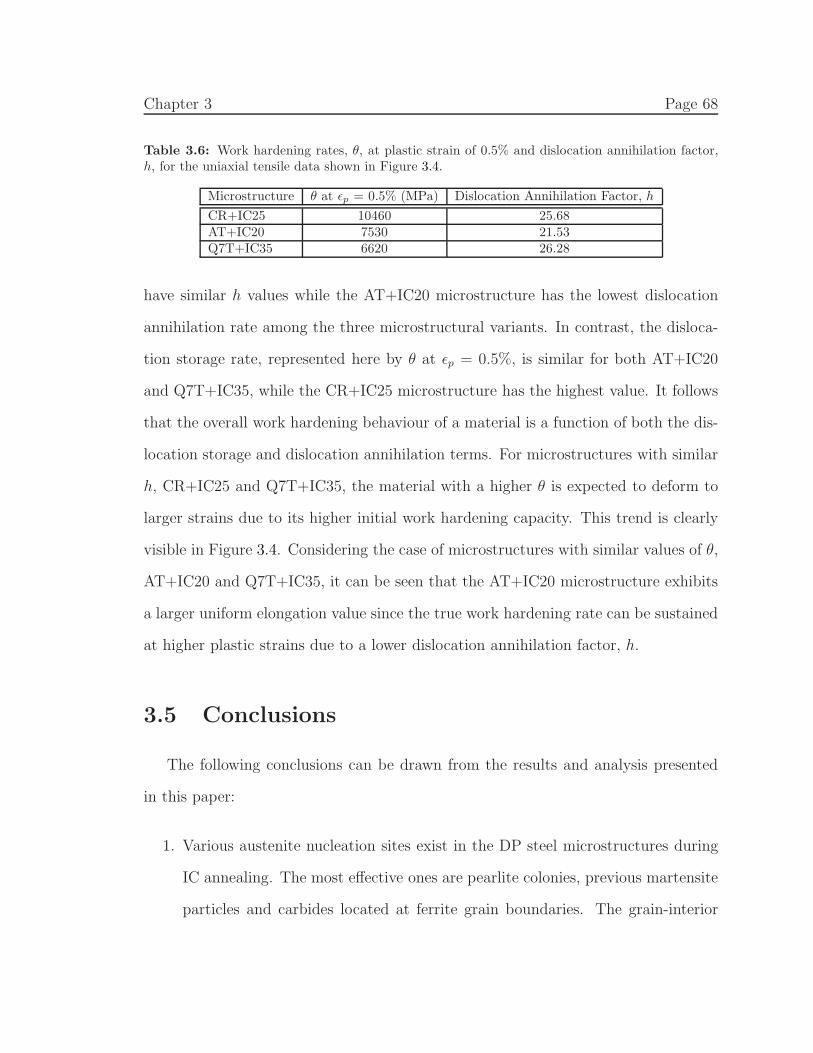
Chapter 3 Page 68
Table 3.6: Work hardening rates, θ, at plastic strain of 0.5% and dislocation annihilation factor,h, for the uniaxial tensile data shown in Figure 3.4.
Microstructure θ at ǫp = 0.5% (MPa) Dislocation Annihilation Factor, h
CR+IC25 10460 25.68AT+IC20 7530 21.53Q7T+IC35 6620 26.28
have similar h values while the AT+IC20 microstructure has the lowest dislocation
annihilation rate among the three microstructural variants. In contrast, the disloca-
tion storage rate, represented here by θ at ǫp = 0.5%, is similar for both AT+IC20
and Q7T+IC35, while the CR+IC25 microstructure has the highest value. It follows
that the overall work hardening behaviour of a material is a function of both the dis-
location storage and dislocation annihilation terms. For microstructures with similar
h, CR+IC25 and Q7T+IC35, the material with a higher θ is expected to deform to
larger strains due to its higher initial work hardening capacity. This trend is clearly
visible in Figure 3.4. Considering the case of microstructures with similar values of θ,
AT+IC20 and Q7T+IC35, it can be seen that the AT+IC20 microstructure exhibits
a larger uniform elongation value since the true work hardening rate can be sustained
at higher plastic strains due to a lower dislocation annihilation factor, h.
3.5 Conclusions
The following conclusions can be drawn from the results and analysis presented
in this paper:
1. Various austenite nucleation sites exist in the DP steel microstructures during
IC annealing. The most effective ones are pearlite colonies, previous martensite
particles and carbides located at ferrite grain boundaries. The grain-interior
Chapter 3 Page 69
carbides are not very effective for austenite formation.
2. The starting microstructure can affect the austenite transformation during IC
annealing by changing the kinetics of both austenite nucleation and growth.
Consequently, the three main DP steel microstructural variants, CR+IC, QT+IC
(regardless of austenitization temperature) and AT+IC, differ significantly from
one another in terms of martensite particle volume fraction, size, morphology
and spatial distribution.
3. The three main DP steel microstructural variants exhibit very different uniax-
ial tensile behaviours. The QT+IC microstructure has the most non-uniform
spatial distribution of martensite particles and produces the least desirable uni-
axial tensile properties in terms of uniform elongation and work hardening rate.
The CR+IC microstructure on the other hand, despite having a non-uniform
distribution of martensite particles, produces the best combination of uniform
elongation and work hardening rate among the three microstructural variants.
Additionally, the work hardening rate of CR+IC microstructure is not a func-
tion of√
f/d and this discrepancy was attributed to the potential effect of
ferrite grain size.
4. It was found that, in addition to the particle size and volume fraction, the
work hardening behaviour of DP steels is also influenced by the morphology
and spatial distribution of martensite particles. This influence can be observed
by changes in both initial work hardening rate (which is a function of the dis-
location accumulation rate) as well as the dislocation annihilation rate.
5. The contribution of martensite particles to work hardening behaviour, via geo-
metrically necessary dislocations (GNDs), is only significant at the early stages

Chapter 3 Page 70
of deformation. As deformation proceeds, the work hardening rate decays to a
similar value for each microstructural variant, i.e. independent of the ratio of
martensite volume fraction to average particle size (√
f/d).
3.6 Acknowledgments
The authors would like to thank the AUTO21 NCE and the Natural Sciences and
Engineering Research Council of Canada (NSERC) for their financial support of this
research.
Chapter 3 Page 71
3.7 References
[1] N. J. Kim, G. Thomas, Metall. Trans. A 12 (1981) 483–489.
[2] J. Huang, W. J. Poole, M. Militzer, Metall. Mater. Trans. A 35 (2004) 3363–3375.
[3] M. Westphal, J. R. McDermid, J. D. Boyd, J. D. Embury, Can. Metall. Q. 47
(2008) 83–90.
[4] G. R. Speich, V. A. Demarest, R. L. Miller, Metall. Trans. A 12 (1981) 1419–
1428.
[5] C. I. Garcia, A. J. Deardo, Metall. Trans. A 12 (1981) 521–530.
[6] S. Estay, L. Chengji, G. R. Purdy, Can. Metall. Q. 23 (1984) 121–130.
[7] J. Y. Joon, S. K. In, S. C. Hyung, Metall. Trans. A 16 (1985) 1237–1245.
[8] D. Das, P. P. Chattopadhyay, J. Mater. Sci. 44 (2009) 2957–2965.
[9] R. F. Lawson, D. K. Matlock, G. Krauss, in: R. A. Kot, B. L. Bramfitt (Eds.),
Fundamentals of Dual-Phase Steels, Metall. Soc. of AIME, 1981, pp. 347–381.
[10] M. Mazinani, W. J. Poole, Metall. Mater. Trans. A 38 (2007) 328–339.
[11] N. K. Balliger, T. Gladman, Metal Sci. 15 (1981) 95–108.
[12] G. R. Speich, in: R. A. Kot, B. L. Bramfitt (Eds.), Fundamentals of Dual-Phase
Steels, Metall. Soc. of AIME, 1981, pp. 3–45.
[13] N. C. Law, D. V. Edmonds, Metall. Trans. A 11 (1980) 33–46.
[14] T. Sakaki, K. Sugimoto, T. Fukuzato, Acta Metall. 31 (1983) 1737–1746.
[15] R. G. Davies, Metall. Trans. A 10 (1979) 1549–1555.
[16] J. M. Rigsbee, P. J. VanderArend, in: A. T. Davenport (Ed.), Formable HSLA
and Dual-Phase Steels, Metall. Soc. of AIME, 1977, pp. 56–86.
[17] A. M. Sarosiek, W. S. Owen, Mater. Sci. Eng. 66 (1984) 13–34.
Chapter 3 Page 72
[18] D. A. Korzekwa, D. K. Matlock, G. Krauss, Metall. Trans. A 15 (1984) 1221–
1228.
[19] P. J. Jacques, Q. Furnemont, F. Lani, T. Pardoen, F. Delannay, Acta. Mater. 55
(2007) 3681–3693.
[20] J. Gerbase, J. D. Embury, R. M. Hobbs, in: R. A. Kot, J. W. Morris (Eds.),
Structure and Properties of Dual-Phase Steels, Metall. Soc. of AIME, 1979, pp.
118–144.
[21] G. R. Speich, R. L. Miller, in: R. A. Kot, J. W. Morris (Eds.), Structure and
Properties of Dual-Phase Steels, Metall. Soc. of AIME, 1979, pp. 145–182.
[22] N. Fonstein, M. Kapustin, N. Pottore, I. Gupta, O. Yakubovsky, Phys. Metals
Metall. 104 (2007) 315–323.
[23] A. Ramazani, K. Mukherjee, A. Schwedt, P. Goravanchi, U. Prahl, W. Bleck,
Int. J. Plast. 43 (2013) 128–152.
[24] M. Westphal, J. R. McDermid, J. D. Boyd, J. D. Embury, Can. Metall. Q. 49
(2010) 91–98.
[25] Z. Li, H. Gu, Metall. Trans. A 21 (1990) 717–724.
[26] O. Bouaziz, T. Lung, M. Kandel, C. Lecomte, Le Journal de Physique IV 11
(2001) Pr4–223–Pr4–231.
[27] M. Delince, Y. Brechet, J. D. Embury, M. G. D. Geers, P. J. Jacques, T. Pardoen,
Acta. Mater. 55 (2007) 2337–2350.
[28] M. Calcagnotto, D. Ponge, E. Demir, D. Raabe, Mater. Sci. Eng. A 527 (2010)
2738–2746.
[29] G. R. Speich, R. L. Miller, in: R. A. Kot, B. L. Bramfitt (Eds.), Fundamentals
of Dual-Phase Steels, Metall. Soc. of AIME, 1981, pp. 279–304.
[30] J. D. Embury, J. L. Duncan, in: R. A. Kot, B. L. Bramfitt (Eds.), Fundamentals
of Dual-Phase Steels, Metall. Soc. of AIME, 1981, pp. 333–345.
[31] C. A. N. Lanzillotto, F. B. Pickering, Metal Sci. 16 (1982) 371–382.
Chapter 3 Page 73
[32] P. Movahed, S. Kolahgar, S. P. H. Marashi, M. Pouranvari, N. Parvin, Mater.
Sci. Eng. A 518 (2009) 1–6.
[33] A. Kumar, S. B. Singh, K. K. Ray, Mater. Sci. Eng. A 474 (2008) 270–282.
[34] E. Ahmad, T. Manzoor, M. M. A. Ziai, N. Hussain, J. Mat. Eng. Perform. 21
(2012) 382–387.
[35] C. Thomser, V. Uthaisangsuk, W. Bleck, Steel Res. 80 (2009) 582–587.
[36] A. Bag, K. K. Ray, E. S. Dwarakadasa, Metall. Mater. Trans. A 30 (1999) 1193–
1202.
[37] M. F. Ashby, Philos. Mag. 14 (1966) 1157–1178.
[38] M. F. Ashby, Philos. Mag. 21 (1970) 399–424.
[39] Y. Estrin, H. Mecking, Acta Metall. 32 (1984) 57–70.
[40] U. F. Kocks, H. Mecking, Prog. Mater. Sci. 48 (2003).
[41] H. Mecking, U. F. Kocks, Acta Metall. 29 (1981) 1865–1875.
[42] W. Steven, A. G. Haynes, J. Iron Steel Inst. 183 (1956) 349–359.
[43] K. W. Andrews, J. Iron Steel Inst. 203 (1965) 721–727.
[44] F. S. LePera, J. Metal. 32 (1980) 38–39.
[45] H. Paruz, D. V. Edmonds, Mater. Sci. Eng. A A117 (1989) 67–74.
[46] Y. Tobiyama, K. Osawa, M. Hirata, Kawasaki Steel Giho 31 (1999) 181–184.
[47] G. F. Vander Voort, Atlas of Time-temperature Diagrams for Irons and Steels,
ASM International, Materials Park, OH, 1991.
[48] J. Bouquerel, K. Verbeken, B. C. D. Cooman, Acta. Mater. 54 (2006) 1443–1456.
[49] I. Gutierrez, M. A. Altuna, Acta. Mater. 56 (2008) 4682–4690.
CHAPTER 4
Effect of Ferrite Grain Size and Spatial
Distribution of Martensite Particles on
the Work Hardening Behaviour of a
Dual-Phase Steel
Abstract
This paper reports on a study of the relationship between microstructure and
work hardening of dual-phase (DP) steel sheets. Through the addition of a cold-
rolling step between pre-heat treatment and IC annealing, three distinct DP steel mi-
crostructural variants with a significantly refined ferrite matrix were produced. These
variants differ with respect to their mean ferrite grain size, D, as well as the volume
fraction, f , mean size, d, morphology and spatial distribution of martensite particles.
The work hardening behaviour of uniaxial tensile specimens was analyzed using the
true work hardening rate, θ = dσ/dǫ, the instantaneous work hardening exponent,
n = dlogσ/dlogǫ and the dislocation annihilation factor, h = −(θ− θ0)/(σ− σ0) . At
small strains (ǫp = 0.5%), the work hardening rate was found to be dominated by the
generation of geometrically necessary dislocations (GNDs) in the ferrite grains. The
work hardening response at this stage was characterized by θ at ǫp = 0.5% and a min-
imum in the instantaneous work hardening exponent, nmin. Both of these parameters
were determined to be functions of√
f/d, the mean ferrite grain size and the spa-
tial distribution of martensite particles. At larger plastic strains (>4%), dislocation
annihilation by dynamic recovery becomes the controlling factor for work hardening.
This phenomena is described by the dislocation annihilation factor, h, and is also a
function of√
f/d, the mean ferrite grain size and the spatial distribution of marten-
site particles. The uniform elongation was found to be inversely proportional to the
dislocation annihilation factor, h. Finally, the three work hardening parameters of θ
at ǫp = 0.5%, nmin and h all exhibit similar relationship with√
f/d and a consistent
74
Chapter 4 Page 75
trend between the three microstructural variants under study. This observation sug-
gests a common role of internal stresses on the two work hardening mechanisms of
GND hardening and dynamic recovery.
4.1 Introduction
Dual-phase (DP) steels are known for their attractive combination of strength and
formability as they exhibit continuous yielding, low yield-to-tensile strength ratios,
large uniform elongations and very high initial work hardening rates. The traditional
microstructure of these steels comprises martensite particles distributed in a ferrite
matrix. The continuous yielding at low stresses is associated with the presence of
mobile dislocations at ferrite/martensite interfaces as well as residual stresses in the
ferrite matrix which are produced by quenching from the inter-critical annealing tem-
perature [1–6]. The high initial work hardening rate, on the other hand, is due to
the strain incompatibility between the soft, ductile ferrite and hard, non-deformable
martensite. This incompatibility results in additional work hardening of the ferrite
matrix due to the development of long-range elastic back-stresses and the genera-
tion of geometrically necessary dislocations (GNDs) at ferrite/martensite interfaces
[1, 2, 4, 7, 8]. It has been found that the work hardening rate of DP steels is primarily
controlled by the volume fraction, f [4, 7, 9–12], and average size, d [4, 12], of marten-
site particles through the parameter√
f/d. Other microstructural parameters, such
as the ferrite grain size [13–16] as well as the morphology and spatial distribution
of martensite particles [9, 17–21], have also been shown to be significant. However,
since these parameters often cannot be changed independently of one another, it has
proven difficult to understand their individual effects on work hardening behaviour.
In the previous work [18], three distinct microstructures were produced, while
Chapter 4 Page 76
controlling the parameter√
f/d, to investigate the effects of morphology and spatial
distribution of martensite particles on the work hardening rate of DP steels. It was
found that the work hardening rate was clearly affected by these parameters; how-
ever, this finding was not conclusive because the three microstructures had a range
of ferrite grain sizes. Therefore, the current research programme was designed to
determine the specific effects of ferrite grain size and spatial distribution of marten-
site particles on work hardening behaviour. This goal was accomplished by including
an additional cold-rolling step prior to the inter-critical (IC) annealing of two differ-
ent starting microstructures: (i) austempered (AT) and (ii) quenched and tempered
(QT). The cold-rolling step was added to refine the ferrite grain size through ferrite
recrystallization during the IC annealing process [22–26]. These two microstructures
and their tensile properties are compared to a baseline microstructure obtained by
direct IC annealing of an industrial cold-rolled ferrite/pearlite structure without any
additional pre-heat treatment. Specifically, the work hardening behaviour of each
microstructural variant was characterized using: (i) the true work hardening rate,
θ = dσ/dǫ; (ii) the instantaneous work hardening exponent, n = dlogσ/dlogǫ [27, 28];
and (iii) the dislocation annihilation parameter, h = −(θ − θ0)/(σ − σ0) [18].
4.2 Experimental Procedure
4.2.1 Materials
The material used for this study was a commercial DP780 grade steel provided
by US Steel Canada in two conditions: (i) 0.95mm thick cold-rolled sheet (CR) and
(ii) 3.12mm thick hot-rolled sheet (HB). The chemical analyses of the two sample
materials are given in Table 4.1. Prior to thermo-mechanical processing, 100mm by
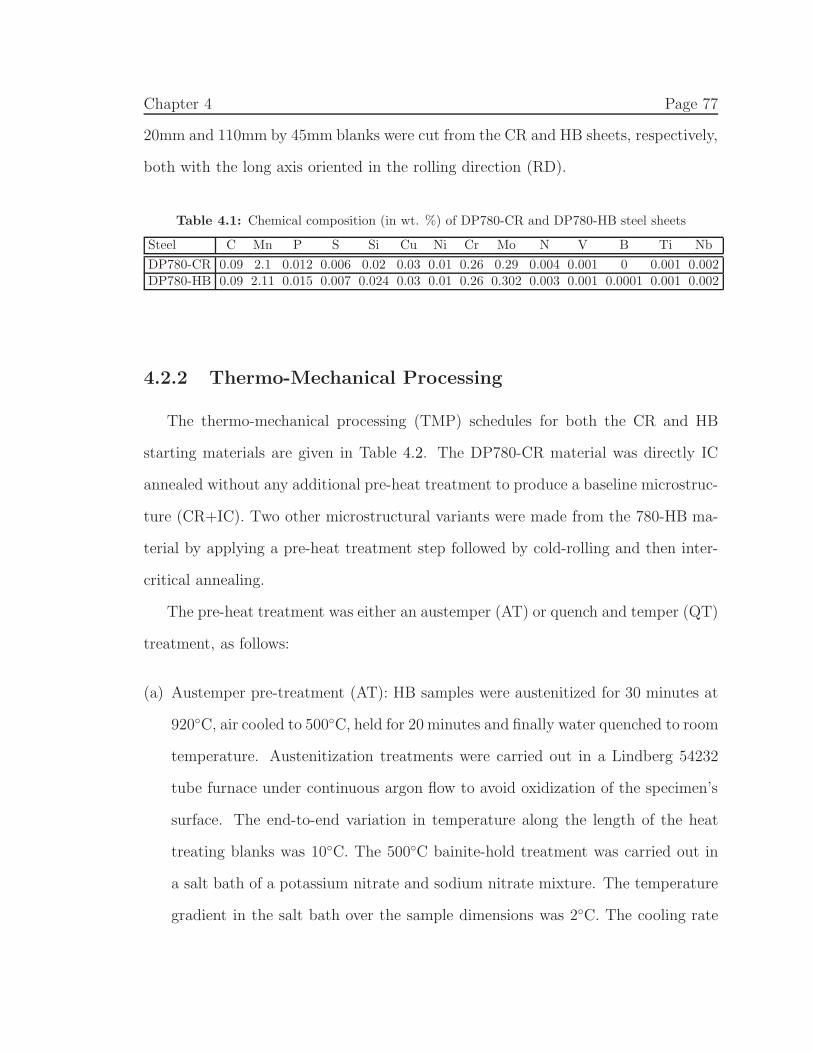
Chapter 4 Page 77
20mm and 110mm by 45mm blanks were cut from the CR and HB sheets, respectively,
both with the long axis oriented in the rolling direction (RD).
Table 4.1: Chemical composition (in wt. %) of DP780-CR and DP780-HB steel sheets
Steel C Mn P S Si Cu Ni Cr Mo N V B Ti Nb
DP780-CR 0.09 2.1 0.012 0.006 0.02 0.03 0.01 0.26 0.29 0.004 0.001 0 0.001 0.002DP780-HB 0.09 2.11 0.015 0.007 0.024 0.03 0.01 0.26 0.302 0.003 0.001 0.0001 0.001 0.002
4.2.2 Thermo-Mechanical Processing
The thermo-mechanical processing (TMP) schedules for both the CR and HB
starting materials are given in Table 4.2. The DP780-CR material was directly IC
annealed without any additional pre-heat treatment to produce a baseline microstruc-
ture (CR+IC). Two other microstructural variants were made from the 780-HB ma-
terial by applying a pre-heat treatment step followed by cold-rolling and then inter-
critical annealing.
The pre-heat treatment was either an austemper (AT) or quench and temper (QT)
treatment, as follows:
(a) Austemper pre-treatment (AT): HB samples were austenitized for 30 minutes at
920◦C, air cooled to 500◦C, held for 20 minutes and finally water quenched to room
temperature. Austenitization treatments were carried out in a Lindberg 54232
tube furnace under continuous argon flow to avoid oxidization of the specimen’s
surface. The end-to-end variation in temperature along the length of the heat
treating blanks was 10◦C. The 500◦C bainite-hold treatment was carried out in
a salt bath of a potassium nitrate and sodium nitrate mixture. The temperature
gradient in the salt bath over the sample dimensions was 2◦C. The cooling rate
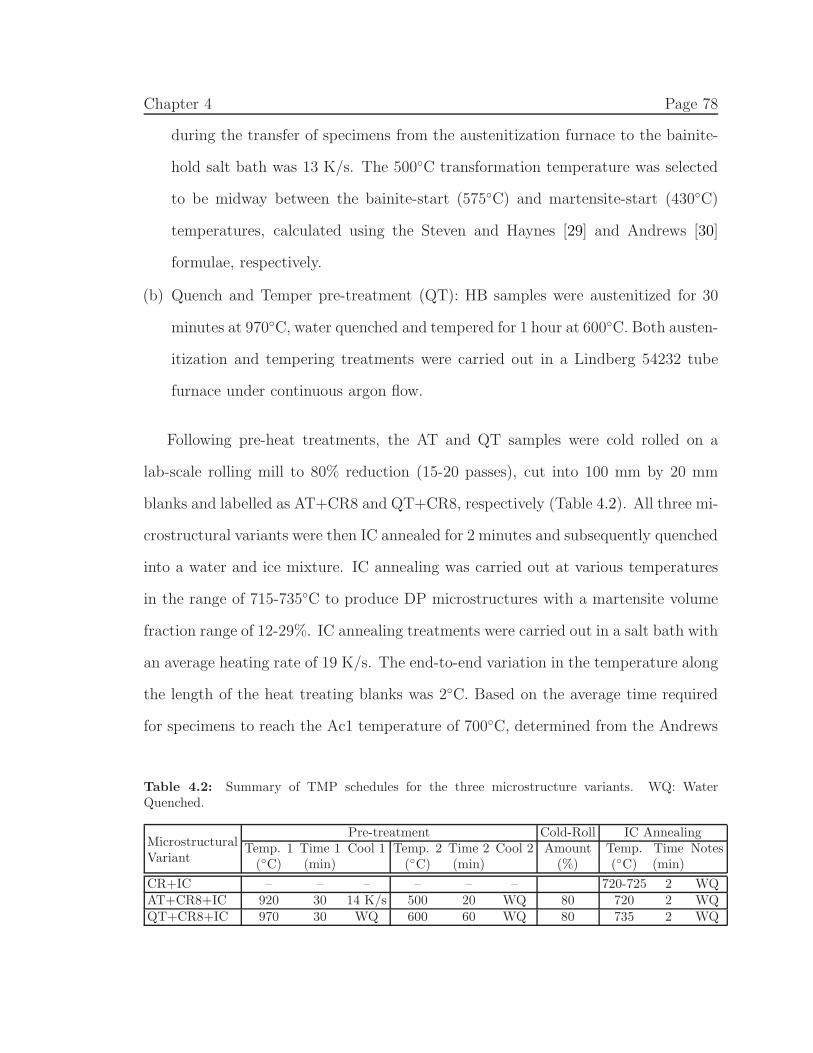
Chapter 4 Page 78
during the transfer of specimens from the austenitization furnace to the bainite-
hold salt bath was 13 K/s. The 500◦C transformation temperature was selected
to be midway between the bainite-start (575◦C) and martensite-start (430◦C)
temperatures, calculated using the Steven and Haynes [29] and Andrews [30]
formulae, respectively.
(b) Quench and Temper pre-treatment (QT): HB samples were austenitized for 30
minutes at 970◦C, water quenched and tempered for 1 hour at 600◦C. Both austen-
itization and tempering treatments were carried out in a Lindberg 54232 tube
furnace under continuous argon flow.
Following pre-heat treatments, the AT and QT samples were cold rolled on a
lab-scale rolling mill to 80% reduction (15-20 passes), cut into 100 mm by 20 mm
blanks and labelled as AT+CR8 and QT+CR8, respectively (Table 4.2). All three mi-
crostructural variants were then IC annealed for 2 minutes and subsequently quenched
into a water and ice mixture. IC annealing was carried out at various temperatures
in the range of 715-735◦C to produce DP microstructures with a martensite volume
fraction range of 12-29%. IC annealing treatments were carried out in a salt bath with
an average heating rate of 19 K/s. The end-to-end variation in the temperature along
the length of the heat treating blanks was 2◦C. Based on the average time required
for specimens to reach the Ac1 temperature of 700◦C, determined from the Andrews
Table 4.2: Summary of TMP schedules for the three microstructure variants. WQ: WaterQuenched.
MicrostructuralVariant
Pre-treatment Cold-Roll IC AnnealingTemp. 1 Time 1 Cool 1 Temp. 2 Time 2 Cool 2 Amount Temp. Time Notes(◦C) (min) (◦C) (min) (%) (◦C) (min)
CR+IC – – – – – – 720-725 2 WQAT+CR8+IC 920 30 14 K/s 500 20 WQ 80 720 2 WQQT+CR8+IC 970 30 WQ 600 60 WQ 80 735 2 WQ
Chapter 4 Page 79
formula [30], the IC annealing time began 40 seconds after immersing the specimens
in the salt bath. The details of the TMP schedules for the three microstructural
variants investigated are presented in Table 4.2. At all stages of pre-heat treatment
and IC annealing, the temperature was measured at the centre of the heat treatment
blanks using a K-type thermocouple.
4.2.3 Microstructure Characterization
Metallographic specimens were cut from the middle of the heat treated blanks
using a Struers Accutom precision cut-off machine. The RD/ND sections were ex-
amined for all specimens, where RD is the rolling direction and ND is the normal,
through-thickness direction. After mounting, specimens were polished to a 0.06 mi-
cron surface finish using standard metallography procedures and etched in 2% Nital
for 13 seconds to reveal the ferrite grain structure as well as the martensite and
carbide particles. The metallographic specimens were examined using a JEOL 840
scanning electron microscope (SEM) under secondary electron (SE) imaging mode at
a working distance of 15mm and with an accelerating voltage of 20kV.
Identification of martensite and carbide particles followed the procedure reported
elsewhere [18]. Martensite volume fraction measurements were performed on the SEM
micrographs using a manual point counting technique with a minimum of 4000 points
in accordance with ASTM-E562. Measurements of mean ferrite grain size (diameter)
and mean martensite particle size (diameter) were made using the three concentric
circles intercept method of ASTM-E112.
Chapter 4 Page 80
4.2.4 Mechanical Testing
Sub-size uniaxial tensile specimens with a gauge length of 25mm were water-
jet cut from the heat treated blanks according to ASTM-E8. All specimens had
their long axis oriented in the RD. Uniaxial tensile tests were performed at room
temperature using an Instron 8521 hydraulic testing machine at a constant extension
rate of 0.75mm/min. Strain measurements were obtained using a 25mm gauge Instron
clip-on extensometer. For each microstructural variant, a minimum of three specimens
was tested with all tests completed to failure. Work hardening analyses were carried
out using the uniaxial tensile test data by calculating the true work hardening rate,
θ = dσ/dǫ, the instantaneous work hardening exponent, n = dlogσ/dlogǫ [27, 28] and
the dislocation annihilation parameter, h = −(θ − θ0)/(σ − σ0) [18].
Chapter 4 Page 81
4.3 Results
4.3.1 Microstructures
The microstructure of the as-received HB material is presented in Figure 4.1a.
This microstructure comprises ferrite, pearlite and small amounts of martensite. Fig-
ure 4.1b, depicts the microstructures following the austempering (AT) pre-heat treat-
ment (Table 4.2) which contains a mixture of granular bainite (GB), i.e. irregular
ferrite grains with M/A, and upper bainite (UB), i.e. ferrite laths with marten-
site/retained austenite (M/A) between the laths. These observations are consistent
with both experimental results [31–33] as well as the predications of published CCT
and TTT diagrams [34–36] for steels of similar compositions. Note that individual
martensite (M) particles are also present in the AT microstructure. These martensite
particles were formed upon quenching of the remaining untransformed austenite at the
end of the bainite-hold step. In specimens subjected to the quench and temper pre-
heat treatment (QT), Figure 4.1c, a tempered martensite microstructure is obtained
where fine carbide particles are distributed along prior austenite grain boundaries and
prior martensite lath boundaries.
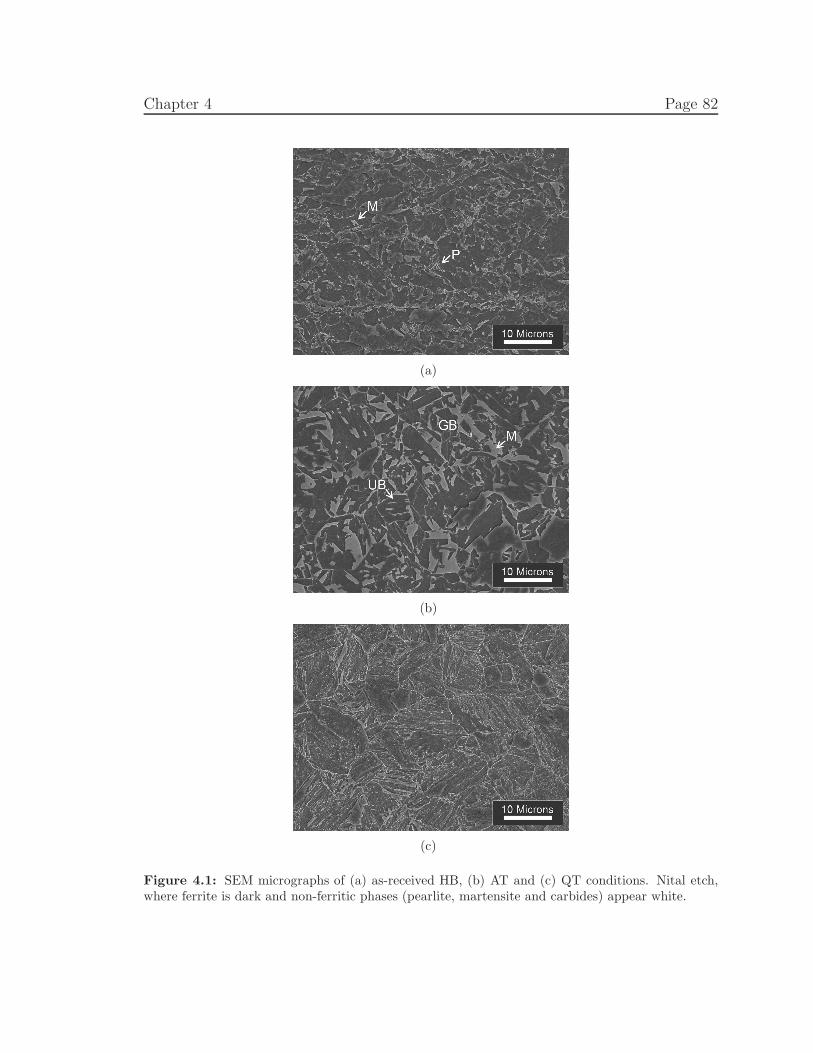
Chapter 4 Page 82
(a)
(b)
(c)
Figure 4.1: SEM micrographs of (a) as-received HB, (b) AT and (c) QT conditions. Nital etch,where ferrite is dark and non-ferritic phases (pearlite, martensite and carbides) appear white.
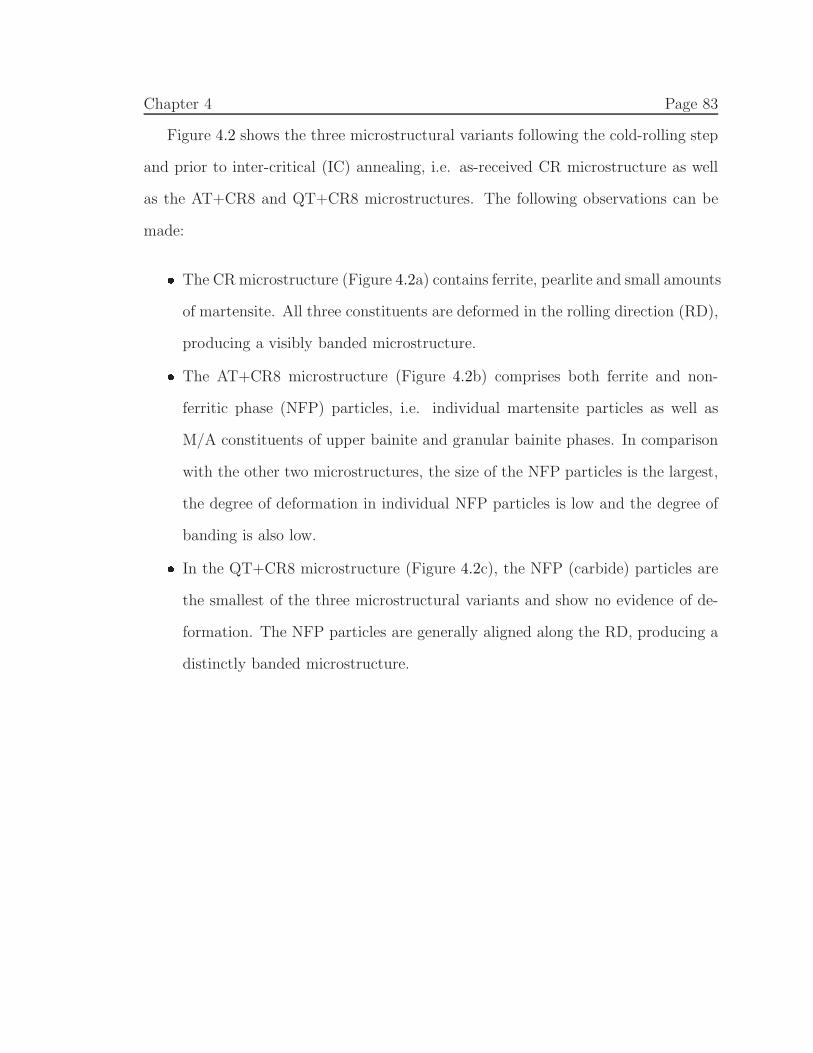
Chapter 4 Page 83
Figure 4.2 shows the three microstructural variants following the cold-rolling step
and prior to inter-critical (IC) annealing, i.e. as-received CR microstructure as well
as the AT+CR8 and QT+CR8 microstructures. The following observations can be
made:� The CRmicrostructure (Figure 4.2a) contains ferrite, pearlite and small amounts
of martensite. All three constituents are deformed in the rolling direction (RD),
producing a visibly banded microstructure.� The AT+CR8 microstructure (Figure 4.2b) comprises both ferrite and non-
ferritic phase (NFP) particles, i.e. individual martensite particles as well as
M/A constituents of upper bainite and granular bainite phases. In comparison
with the other two microstructures, the size of the NFP particles is the largest,
the degree of deformation in individual NFP particles is low and the degree of
banding is also low.� In the QT+CR8 microstructure (Figure 4.2c), the NFP (carbide) particles are
the smallest of the three microstructural variants and show no evidence of de-
formation. The NFP particles are generally aligned along the RD, producing a
distinctly banded microstructure.
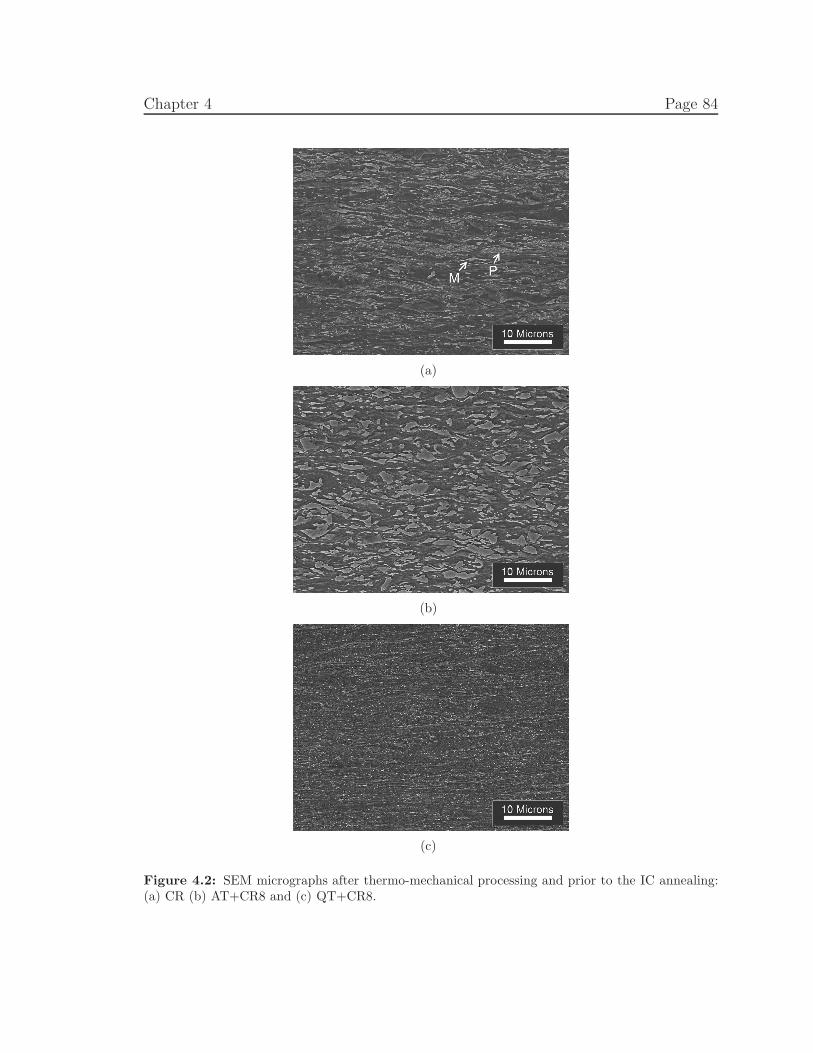
Chapter 4 Page 84
(a)
(b)
(c)
Figure 4.2: SEM micrographs after thermo-mechanical processing and prior to the IC annealing:(a) CR (b) AT+CR8 and (c) QT+CR8.
Chapter 4 Page 85
The three microstructures depicted in Figure 4.2 underwent an IC annealing treat-
ment for 2 minutes at various temperatures to obtain a range of volume fractions of
martensite. To compare the microstructures after IC annealing, representative spec-
imens with a similar volume fraction, f , of 15% were selected from each of the three
microstructural variants, i.e. CR+IC725, AT+CR8+IC720 and QT+CR8+IC720
(Table 4.3). Figure 4.3 shows the microstructures for these conditions at low (4.3a-
4.3c) and high (4.3d-e) magnifications. The mean ferrite grain size, D, mean marten-
site particle size, d, mean martensite volume fraction, f , and the mean√
f/d values
are presented in Table 4.3. From Figure 4.3 and Table 4.3, it is evident that the
martensite particles have an equiaxed morphology and a relatively uniform size dis-
tribution in all three microstructural variants. The martensite particles are also pri-
marily located at ferrite grain boundaries and corners in all cases. Hence, the spatial
distribution of the martensite particles in each microstructure is directly related to
the ferrite grain structure. Specifically, the following observations can be made:� In the CR+IC725 microstructure (Figures 4.3a and 4.3d), the ferrite matrix is
fully recrystallized with a bimodal grain size distribution, i.e. small, equi-axed
grains at prior pearlite band locations (e.g. grain #1 in Figure 4.3d) and large
grains at prior ferrite sites (e.g. grain #2 in Figure 4.3d). Consequently, the
martensite particles are spatially distributed in bands along the RD. The mean
ferrite grain size and the mean martensite particle size are the largest for this
condition.� In the AT+CR8+IC720 microstructure (Figures 4.3b and 4.3e), the ferrite ma-
trix is fully recrystallized and ferrite grains are equiaxed, uniform in size and
have the smallest average size in comparison with the other variants. As a re-
sult, no visible banding of martensite particles is present. The mean martensite
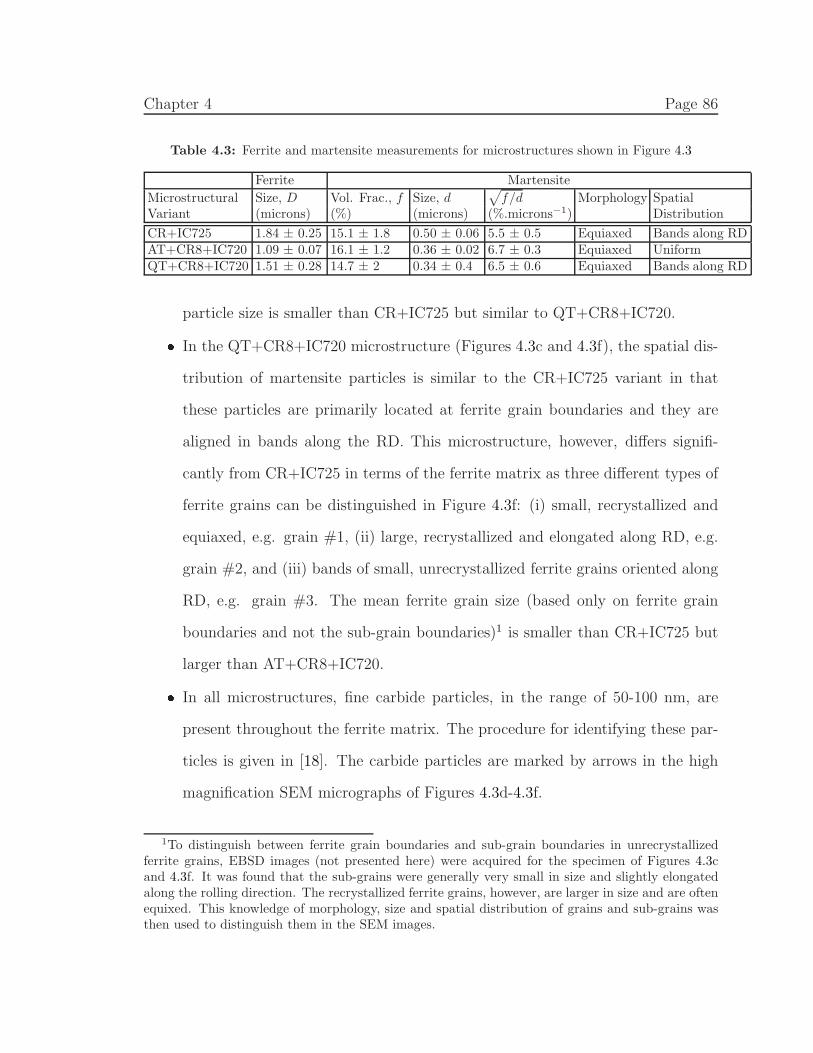
Chapter 4 Page 86
Table 4.3: Ferrite and martensite measurements for microstructures shown in Figure 4.3
Ferrite Martensite
Microstructural Size, D Vol. Frac., f Size, d√
f/d Morphology SpatialVariant (microns) (%) (microns) (%.microns−1) Distribution
CR+IC725 1.84 ± 0.25 15.1 ± 1.8 0.50 ± 0.06 5.5 ± 0.5 Equiaxed Bands along RDAT+CR8+IC720 1.09 ± 0.07 16.1 ± 1.2 0.36 ± 0.02 6.7 ± 0.3 Equiaxed UniformQT+CR8+IC720 1.51 ± 0.28 14.7 ± 2 0.34 ± 0.4 6.5 ± 0.6 Equiaxed Bands along RD
particle size is smaller than CR+IC725 but similar to QT+CR8+IC720.� In the QT+CR8+IC720 microstructure (Figures 4.3c and 4.3f), the spatial dis-
tribution of martensite particles is similar to the CR+IC725 variant in that
these particles are primarily located at ferrite grain boundaries and they are
aligned in bands along the RD. This microstructure, however, differs signifi-
cantly from CR+IC725 in terms of the ferrite matrix as three different types of
ferrite grains can be distinguished in Figure 4.3f: (i) small, recrystallized and
equiaxed, e.g. grain #1, (ii) large, recrystallized and elongated along RD, e.g.
grain #2, and (iii) bands of small, unrecrystallized ferrite grains oriented along
RD, e.g. grain #3. The mean ferrite grain size (based only on ferrite grain
boundaries and not the sub-grain boundaries)1 is smaller than CR+IC725 but
larger than AT+CR8+IC720.� In all microstructures, fine carbide particles, in the range of 50-100 nm, are
present throughout the ferrite matrix. The procedure for identifying these par-
ticles is given in [18]. The carbide particles are marked by arrows in the high
magnification SEM micrographs of Figures 4.3d-4.3f.
1To distinguish between ferrite grain boundaries and sub-grain boundaries in unrecrystallizedferrite grains, EBSD images (not presented here) were acquired for the specimen of Figures 4.3cand 4.3f. It was found that the sub-grains were generally very small in size and slightly elongatedalong the rolling direction. The recrystallized ferrite grains, however, are larger in size and are oftenequixed. This knowledge of morphology, size and spatial distribution of grains and sub-grains wasthen used to distinguish them in the SEM images.
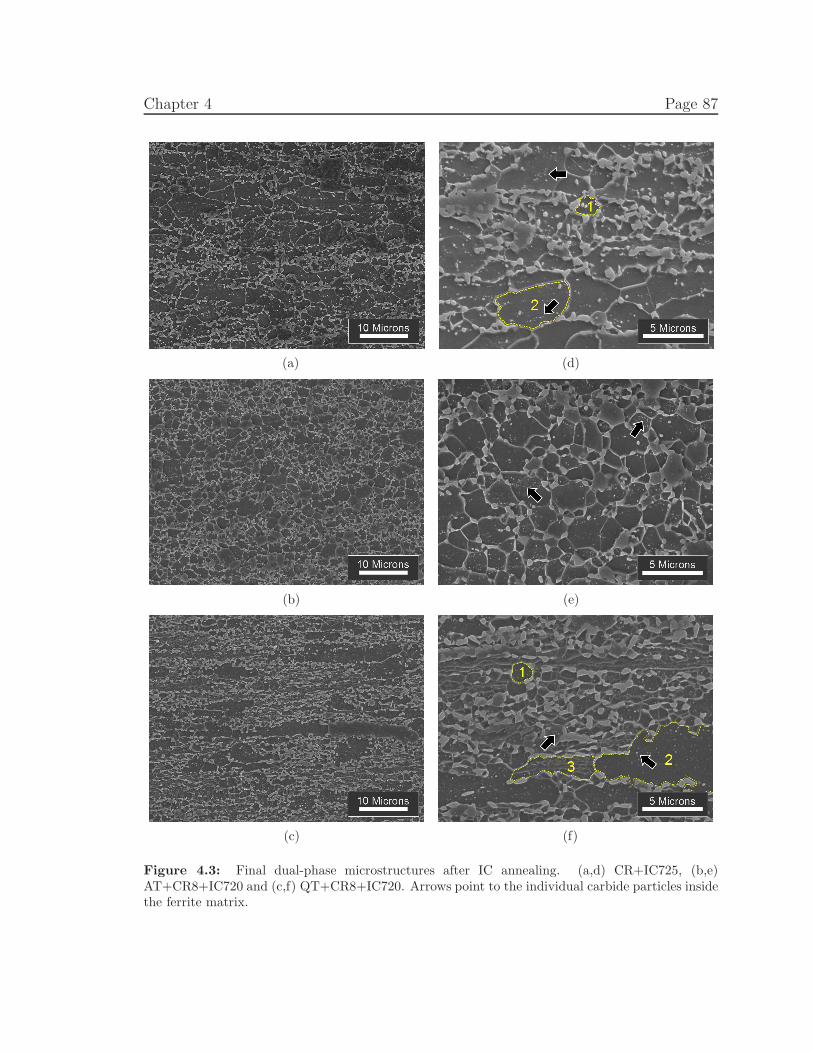
Chapter 4 Page 87
(a) (d)
(b) (e)
(c) (f)
Figure 4.3: Final dual-phase microstructures after IC annealing. (a,d) CR+IC725, (b,e)AT+CR8+IC720 and (c,f) QT+CR8+IC720. Arrows point to the individual carbide particles insidethe ferrite matrix.
Chapter 4 Page 88
4.3.2 Uniaxial Tensile Behaviour
The uniaxial tensile behaviour of the microstructures shown in Figure 4.3 (with an
average martensite volume fraction of 15%) are compared in Figure 4.4. Engineering
stress-strain curves are presented in Figure 4.4a and plots of the instantaneous work
hardening exponent, n = dlogσ/dlogǫ, versus engineering strain are given in Figure
4.4b. The latter parameter provides an instantaneous mathematical representation of
the work hardening rate during uniaxial tensile deformation. The yield strength, σy,
ultimate tensile strength, UTS, and uniform elongation, i.e. strain at UTS, are listed
in Table 4.4. The following observations can be made from Figure 4.4 and Table 4.4:� The CR+IC725 microstructure demonstrates continuous yielding behaviour,
whereas both AT+CR8+IC720 and QT+CR8+IC720 microstructures exhibit
discontinuous yielding (Figure 4.4a).� Despite the differences in their yielding behaviour, all three microstructures
show similar ultimate tensile strength (UTS) values. However, the uniform elon-
gation is very different among the three microstructures, i.e. the AT+CR8+IC720
has the largest uniform elongation and QT+CR8+IC720 the lowest (Table 4.4).� In terms of the instantaneous work hardening exponent (Figure 4.4b), each
microstructure demonstrates typical three-stage behaviour, labelled by A, B and
C, respectively. That is, at the beginning of deformation, n decreases rapidly
from elastic behaviour to a minimum value, nmin (Stage A), then increases to a
maximum value, nmax (Stage B), and finally gradually decreases again until the
onset of plastic instability (Stage C). From Figure 4.4b, it is evident that at early
stages of deformation (Stage A with 0 - 2% strain), the CR+IC725 condition
has the highest value of n while AT+CR8+IC720 has the lowest n. However,

Chapter 4 Page 89
at higher strains (Stage C with strains larger than 4%), the AT+CR8+IC720
microstructure exhibits the highest value of n and QT+CR8+IC720 produces
the lowest.
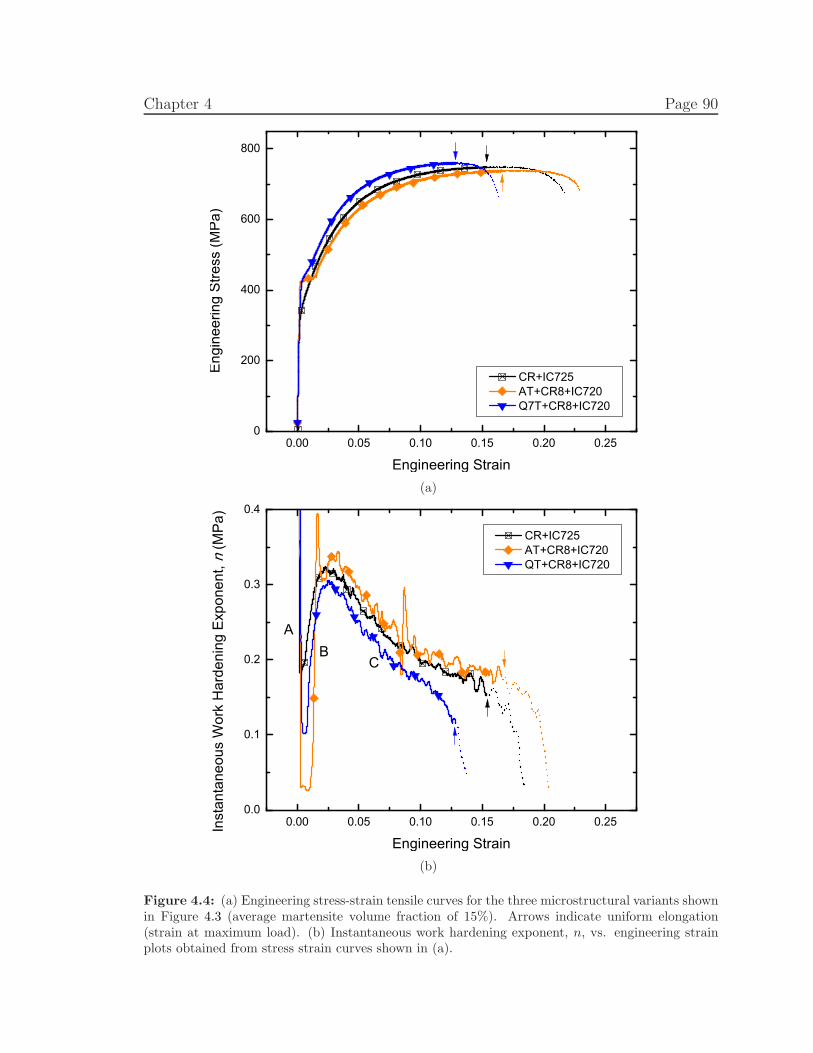
Chapter 4 Page 90
0.00 0.05 0.10 0.15 0.20 0.250
200
400
600
800
CR+IC725 AT+CR8+IC720 Q7T+CR8+IC720
Eng
inee
ring
Stre
ss (M
Pa)
Engineering Strain(a)
0.00 0.05 0.10 0.15 0.20 0.250.0
0.1
0.2
0.3
0.4
BC
Inst
anta
neou
s W
ork
Har
deni
ng E
xpon
ent,
n (M
Pa)
Engineering Strain
CR+IC725 AT+CR8+IC720 QT+CR8+IC720
A
(b)
Figure 4.4: (a) Engineering stress-strain tensile curves for the three microstructural variants shownin Figure 4.3 (average martensite volume fraction of 15%). Arrows indicate uniform elongation(strain at maximum load). (b) Instantaneous work hardening exponent, n, vs. engineering strainplots obtained from stress strain curves shown in (a).
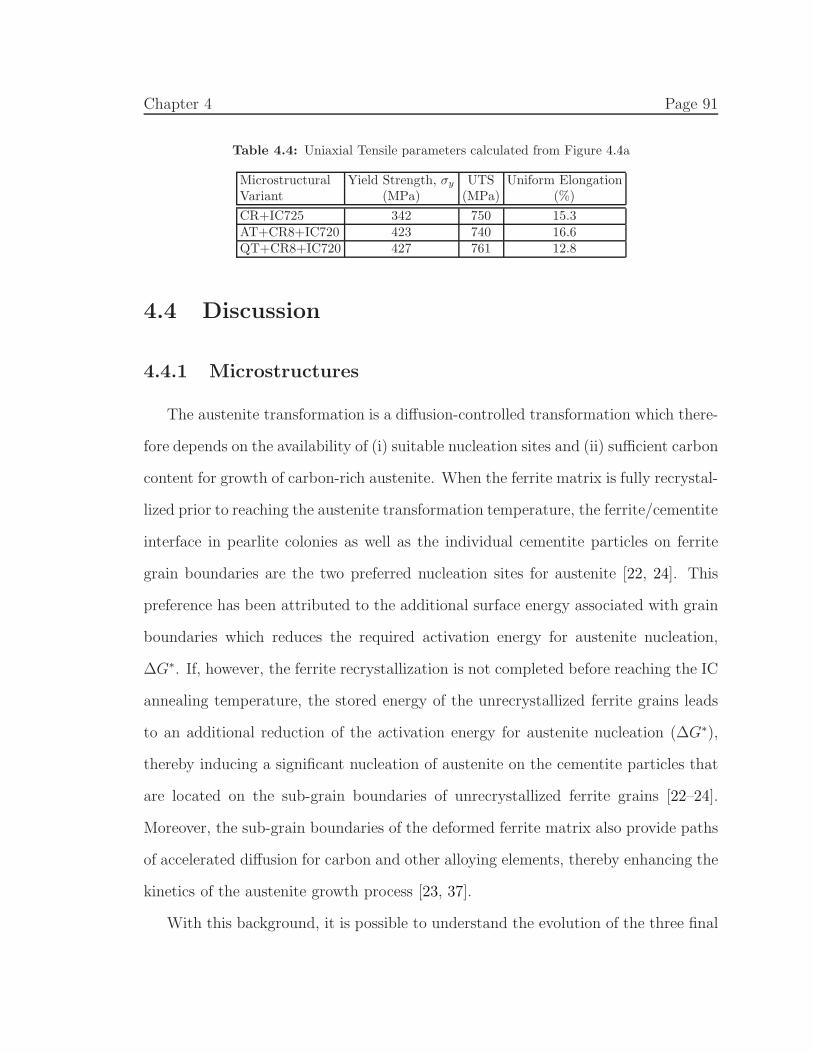
Chapter 4 Page 91
Table 4.4: Uniaxial Tensile parameters calculated from Figure 4.4a
Microstructural Yield Strength, σy UTS Uniform ElongationVariant (MPa) (MPa) (%)
CR+IC725 342 750 15.3AT+CR8+IC720 423 740 16.6QT+CR8+IC720 427 761 12.8
4.4 Discussion
4.4.1 Microstructures
The austenite transformation is a diffusion-controlled transformation which there-
fore depends on the availability of (i) suitable nucleation sites and (ii) sufficient carbon
content for growth of carbon-rich austenite. When the ferrite matrix is fully recrystal-
lized prior to reaching the austenite transformation temperature, the ferrite/cementite
interface in pearlite colonies as well as the individual cementite particles on ferrite
grain boundaries are the two preferred nucleation sites for austenite [22, 24]. This
preference has been attributed to the additional surface energy associated with grain
boundaries which reduces the required activation energy for austenite nucleation,
∆G∗. If, however, the ferrite recrystallization is not completed before reaching the IC
annealing temperature, the stored energy of the unrecrystallized ferrite grains leads
to an additional reduction of the activation energy for austenite nucleation (∆G∗),
thereby inducing a significant nucleation of austenite on the cementite particles that
are located on the sub-grain boundaries of unrecrystallized ferrite grains [22–24].
Moreover, the sub-grain boundaries of the deformed ferrite matrix also provide paths
of accelerated diffusion for carbon and other alloying elements, thereby enhancing the
kinetics of the austenite growth process [23, 37].
With this background, it is possible to understand the evolution of the three final
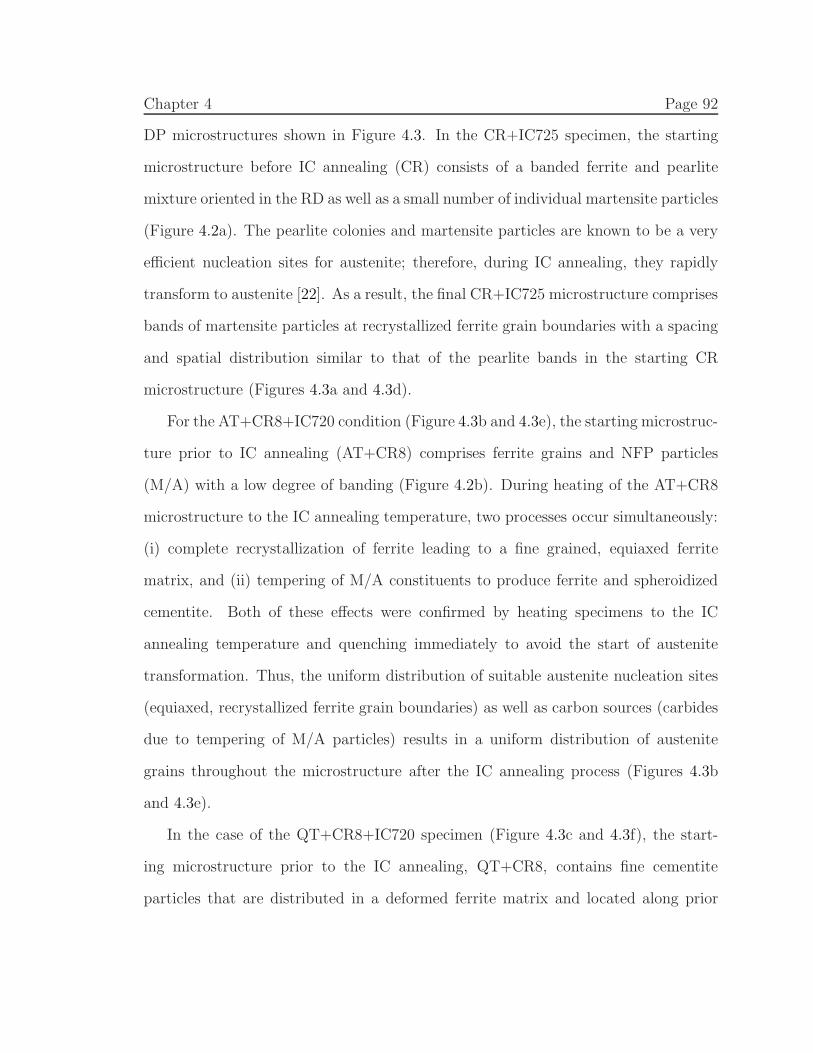
Chapter 4 Page 92
DP microstructures shown in Figure 4.3. In the CR+IC725 specimen, the starting
microstructure before IC annealing (CR) consists of a banded ferrite and pearlite
mixture oriented in the RD as well as a small number of individual martensite particles
(Figure 4.2a). The pearlite colonies and martensite particles are known to be a very
efficient nucleation sites for austenite; therefore, during IC annealing, they rapidly
transform to austenite [22]. As a result, the final CR+IC725 microstructure comprises
bands of martensite particles at recrystallized ferrite grain boundaries with a spacing
and spatial distribution similar to that of the pearlite bands in the starting CR
microstructure (Figures 4.3a and 4.3d).
For the AT+CR8+IC720 condition (Figure 4.3b and 4.3e), the starting microstruc-
ture prior to IC annealing (AT+CR8) comprises ferrite grains and NFP particles
(M/A) with a low degree of banding (Figure 4.2b). During heating of the AT+CR8
microstructure to the IC annealing temperature, two processes occur simultaneously:
(i) complete recrystallization of ferrite leading to a fine grained, equiaxed ferrite
matrix, and (ii) tempering of M/A constituents to produce ferrite and spheroidized
cementite. Both of these effects were confirmed by heating specimens to the IC
annealing temperature and quenching immediately to avoid the start of austenite
transformation. Thus, the uniform distribution of suitable austenite nucleation sites
(equiaxed, recrystallized ferrite grain boundaries) as well as carbon sources (carbides
due to tempering of M/A particles) results in a uniform distribution of austenite
grains throughout the microstructure after the IC annealing process (Figures 4.3b
and 4.3e).
In the case of the QT+CR8+IC720 specimen (Figure 4.3c and 4.3f), the start-
ing microstructure prior to the IC annealing, QT+CR8, contains fine cementite
particles that are distributed in a deformed ferrite matrix and located along prior
Chapter 4 Page 93
austenite grain boundaries and prior martensite lath boundaries (Figure 4.2c). When
heated to the IC annealing temperature (Figure 4.5), the majority of ferrite grains
in the QT+CR8 remain unrecrystallized, while the few recrystallized ferrite grains
exhibit significant growth. Comparing Figure 4.5 with Figure 4.3c suggests that
these large recrystallized grains correspond to the large ferrite grains in the final
QT+CR8+IC720 microstructure. Furthermore, during the IC annealing treatment,
the austenite nucleation primarily takes place on the carbide particles that are located
on the unrecrystallized ferrite grain (and subgrain) boundaries, due to the high strain
energy at these locations. Since the majority of these grain (and subgrain) bound-
aries are elongated along the RD, the spatial distribution of martensite particles in
the final DP microstructure is also banded along the RD. Finally, a comparison of
Figures 4.3c (and 4.3f) with Figure 4.5 reveals that some of the unrecrystallized fer-
rite grains do not recrystallize during the 2-minute IC annealing treatment, possibly
due to the pinning effect of the austenite grains (formed during IC annealing) on the
ferrite grain boundaries. Additionally, the competition between austenite transfor-
mation and ferrite recrystallization can also lead to an incomplete recrystallization of
ferrite grains [25]. That is, austenite nucleation results in a partial relaxation of the
high strain energies associated with deformed ferrite grains which in turn lowers the
driving force for ferrite recrystallization [26].
As a final observation, the cementite particles that are not located on ferrite grain
boundaries (recrystallized or unrecrystallized) in the three starting microstructures
(Figure 4.2) remain intact during IC annealing, as shown in Figures 4.3d-4.3f (marked
with arrows). This outcome is expected [22, 24] since the lack of additional surface
energy associated with the grain (and subgrain) boundaries results in a larger critical
austenite nucleation energy (∆G∗), thereby rendering these particles ineffective for
Chapter 4 Page 94
Figure 4.5: Microstructure of the QT+CR8 specimen heated to the IC annealing temperature andimmediately quenched without any holding time.
the nucleation of austenite.
4.4.2 Uniaxial Tensile Behaviour
As shown in Figure 4.4 and Table 4.4, at similar volume fractions of martensite
( 15%), the three microstructural variants exhibit similar UTS values while their yield-
ing behaviour, work hardening rate and uniform elongation values are significantly
different. In terms of yielding behaviour, it is well known that the continuous yielding
of DP steels results from the presence of mobile dislocations at ferrite/martensite in-
terfaces which are produced by the volume expansion associated with the martensitic
transformation during quenching from the IC annealing temperature [1–6]. The den-
sity of these transformation dislocations is a function of the martensite volume fraction
(f) and a minimum volume fraction of martensite is needed to produce continuous
yielding behaviour [38]. Since f is similar in all three microstructures investigated
here, the discontinuous yielding in two of the microstructures, i.e. AT+CR8+IC720
and QT+CR8+IC720, requires further explanation. Using EBSD measurements, Ra-
mazani et al. [39] found that, within a ferrite grain, the area surrounding a martensite
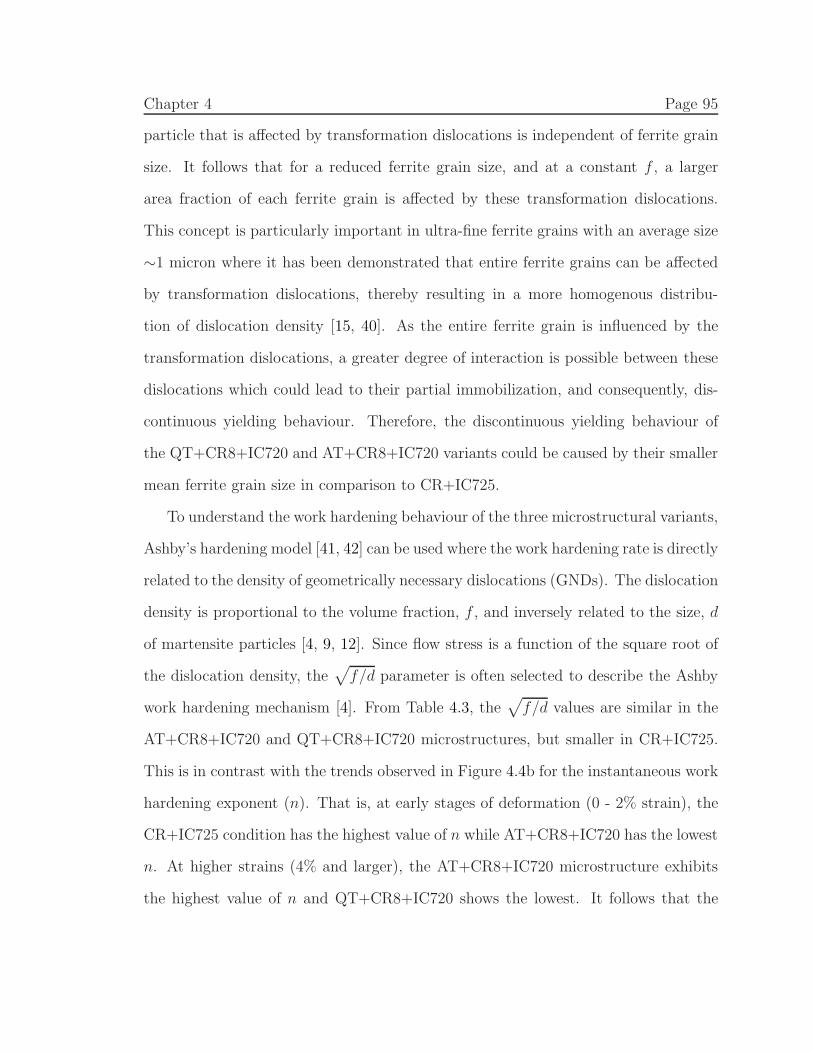
Chapter 4 Page 95
particle that is affected by transformation dislocations is independent of ferrite grain
size. It follows that for a reduced ferrite grain size, and at a constant f , a larger
area fraction of each ferrite grain is affected by these transformation dislocations.
This concept is particularly important in ultra-fine ferrite grains with an average size
∼1 micron where it has been demonstrated that entire ferrite grains can be affected
by transformation dislocations, thereby resulting in a more homogenous distribu-
tion of dislocation density [15, 40]. As the entire ferrite grain is influenced by the
transformation dislocations, a greater degree of interaction is possible between these
dislocations which could lead to their partial immobilization, and consequently, dis-
continuous yielding behaviour. Therefore, the discontinuous yielding behaviour of
the QT+CR8+IC720 and AT+CR8+IC720 variants could be caused by their smaller
mean ferrite grain size in comparison to CR+IC725.
To understand the work hardening behaviour of the three microstructural variants,
Ashby’s hardening model [41, 42] can be used where the work hardening rate is directly
related to the density of geometrically necessary dislocations (GNDs). The dislocation
density is proportional to the volume fraction, f , and inversely related to the size, d
of martensite particles [4, 9, 12]. Since flow stress is a function of the square root of
the dislocation density, the√
f/d parameter is often selected to describe the Ashby
work hardening mechanism [4]. From Table 4.3, the√
f/d values are similar in the
AT+CR8+IC720 and QT+CR8+IC720 microstructures, but smaller in CR+IC725.
This is in contrast with the trends observed in Figure 4.4b for the instantaneous work
hardening exponent (n). That is, at early stages of deformation (0 - 2% strain), the
CR+IC725 condition has the highest value of n while AT+CR8+IC720 has the lowest
n. At higher strains (4% and larger), the AT+CR8+IC720 microstructure exhibits
the highest value of n and QT+CR8+IC720 shows the lowest. It follows that the
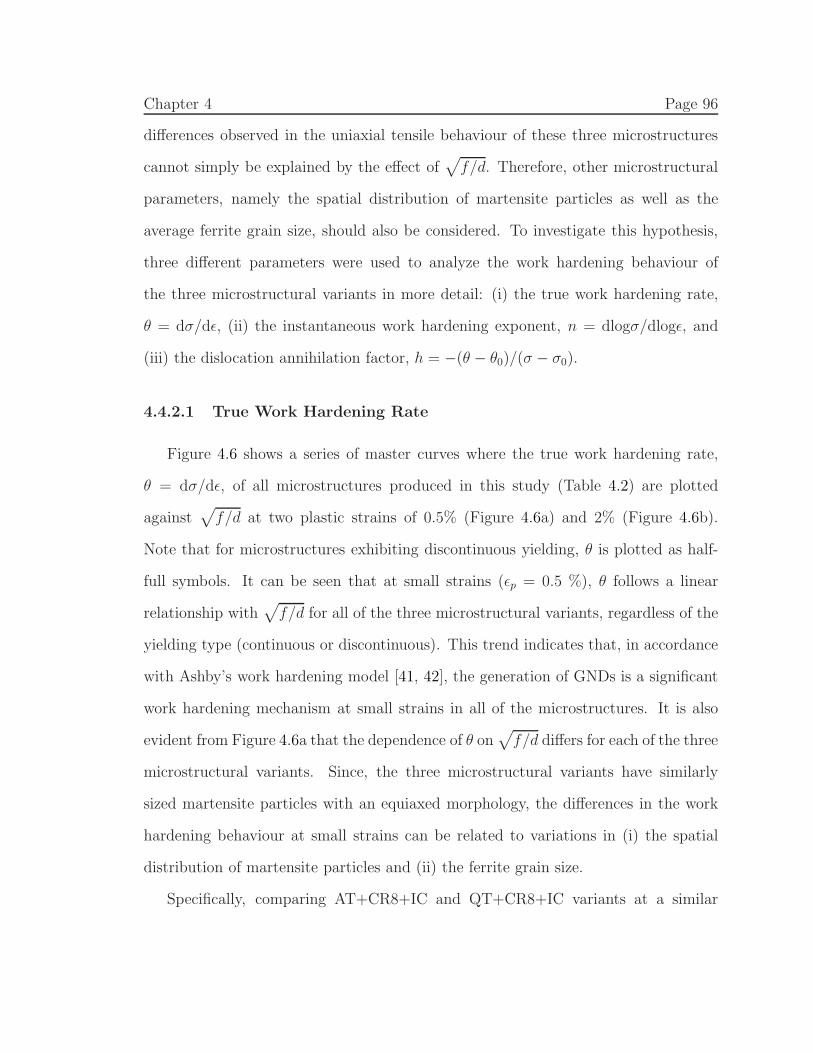
Chapter 4 Page 96
differences observed in the uniaxial tensile behaviour of these three microstructures
cannot simply be explained by the effect of√
f/d. Therefore, other microstructural
parameters, namely the spatial distribution of martensite particles as well as the
average ferrite grain size, should also be considered. To investigate this hypothesis,
three different parameters were used to analyze the work hardening behaviour of
the three microstructural variants in more detail: (i) the true work hardening rate,
θ = dσ/dǫ, (ii) the instantaneous work hardening exponent, n = dlogσ/dlogǫ, and
(iii) the dislocation annihilation factor, h = −(θ − θ0)/(σ − σ0).
4.4.2.1 True Work Hardening Rate
Figure 4.6 shows a series of master curves where the true work hardening rate,
θ = dσ/dǫ, of all microstructures produced in this study (Table 4.2) are plotted
against√
f/d at two plastic strains of 0.5% (Figure 4.6a) and 2% (Figure 4.6b).
Note that for microstructures exhibiting discontinuous yielding, θ is plotted as half-
full symbols. It can be seen that at small strains (ǫp = 0.5 %), θ follows a linear
relationship with√
f/d for all of the three microstructural variants, regardless of the
yielding type (continuous or discontinuous). This trend indicates that, in accordance
with Ashby’s work hardening model [41, 42], the generation of GNDs is a significant
work hardening mechanism at small strains in all of the microstructures. It is also
evident from Figure 4.6a that the dependence of θ on√
f/d differs for each of the three
microstructural variants. Since, the three microstructural variants have similarly
sized martensite particles with an equiaxed morphology, the differences in the work
hardening behaviour at small strains can be related to variations in (i) the spatial
distribution of martensite particles and (ii) the ferrite grain size.
Specifically, comparing AT+CR8+IC and QT+CR8+IC variants at a similar
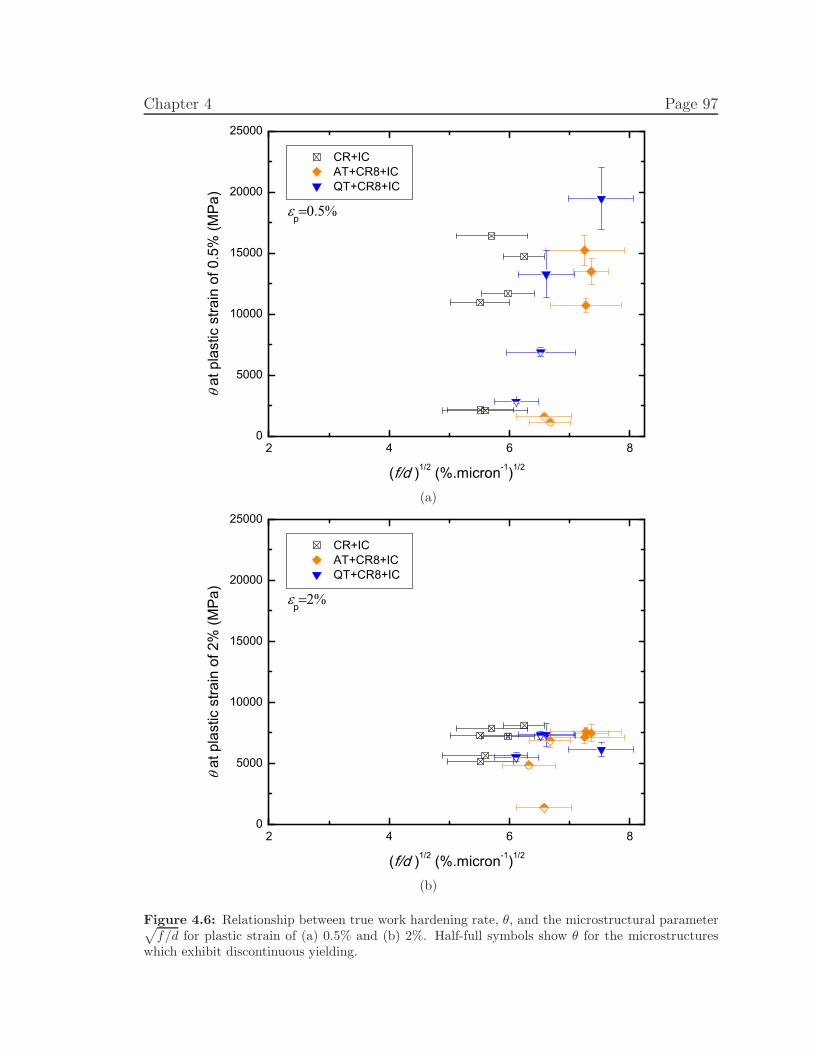
Chapter 4 Page 97
2 4 6 80
5000
10000
15000
20000
25000
p a
t pla
stic
stra
in o
f 0.5
% (M
Pa)
(f/d )1/2 (%.micron-1)1/2
CR+IC AT+CR8+IC QT+CR8+IC
(a)
2 4 6 80
5000
10000
15000
20000
25000
at p
last
ic s
train
of 2
% (M
Pa)
(f/d )1/2 (%.micron-1)1/2
p
CR+IC AT+CR8+IC QT+CR8+IC
(b)
Figure 4.6: Relationship between true work hardening rate, θ, and the microstructural parameter√
f/d for plastic strain of (a) 0.5% and (b) 2%. Half-full symbols show θ for the microstructureswhich exhibit discontinuous yielding.
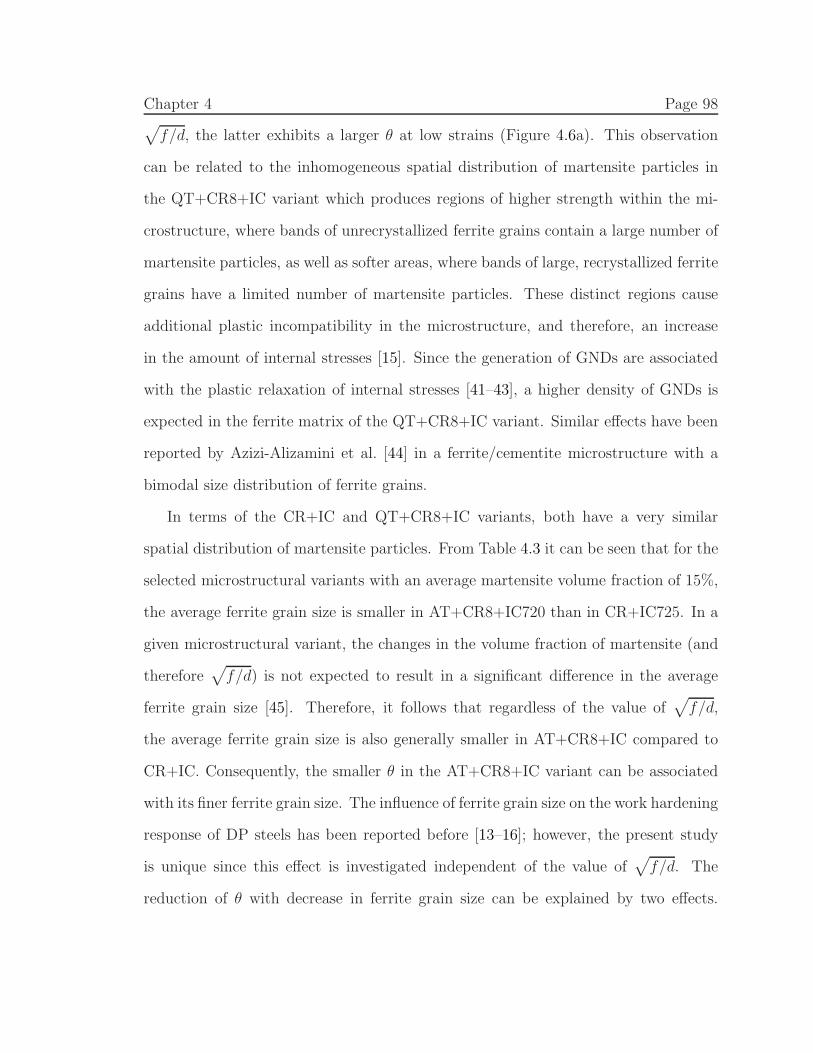
Chapter 4 Page 98√
f/d, the latter exhibits a larger θ at low strains (Figure 4.6a). This observation
can be related to the inhomogeneous spatial distribution of martensite particles in
the QT+CR8+IC variant which produces regions of higher strength within the mi-
crostructure, where bands of unrecrystallized ferrite grains contain a large number of
martensite particles, as well as softer areas, where bands of large, recrystallized ferrite
grains have a limited number of martensite particles. These distinct regions cause
additional plastic incompatibility in the microstructure, and therefore, an increase
in the amount of internal stresses [15]. Since the generation of GNDs are associated
with the plastic relaxation of internal stresses [41–43], a higher density of GNDs is
expected in the ferrite matrix of the QT+CR8+IC variant. Similar effects have been
reported by Azizi-Alizamini et al. [44] in a ferrite/cementite microstructure with a
bimodal size distribution of ferrite grains.
In terms of the CR+IC and QT+CR8+IC variants, both have a very similar
spatial distribution of martensite particles. From Table 4.3 it can be seen that for the
selected microstructural variants with an average martensite volume fraction of 15%,
the average ferrite grain size is smaller in AT+CR8+IC720 than in CR+IC725. In a
given microstructural variant, the changes in the volume fraction of martensite (and
therefore√
f/d) is not expected to result in a significant difference in the average
ferrite grain size [45]. Therefore, it follows that regardless of the value of√
f/d,
the average ferrite grain size is also generally smaller in AT+CR8+IC compared to
CR+IC. Consequently, the smaller θ in the AT+CR8+IC variant can be associated
with its finer ferrite grain size. The influence of ferrite grain size on the work hardening
response of DP steels has been reported before [13–16]; however, the present study
is unique since this effect is investigated independent of the value of√
f/d. The
reduction of θ with decrease in ferrite grain size can be explained by two effects.
Chapter 4 Page 99
First, upon refinement of the ferrite matrix, a larger area fraction of ferrite grains is
expected to be affected by the transformation dislocations (formed upon quenching
from IC annealing). The transformation dislocations cause a local increase in ferrite
strength [46]; therefore, as the ferrite grain size is decreased, the strength of the
ferrite is increased by the effect of the transformation dislocations [15]. In addition
to the Hall-Petch effect, this also leads to a smaller stress/strain incompatibility
between ferrite and martensite [13], thereby reducing the magnitude of the internal
stress and consequently, GND hardening. Second, since the martensite particles are
primarily located at ferrite grain boundaries in both microstructural variants, the
inter-particle spacing of martensite is expected to decrease with a reduced ferrite grain
size. These more closely spaced martensite particles are reported to result in mutual
interaction and cancelation of the stress fields associated with dislocation pileups at
the neighbouring particles, thereby reducing the magnitude of overall internal stress
[47], and hence, GND hardening.
The ferrite grain size effect could also explain the lower θ data for AT+CR8+IC
since it has the smallest average ferrite grain size of all three microstructural variants.
However, in this case, it is impossible to clearly separate out the effects of ferrite
grain size and spatial distribution of martensite particles in AT+CR8+IC as these
two microstructural parameters are coupled with one another.
From Figure 4.6b it is evident that as the plastic strain is increased to 2% (ǫp =
2%), the dependence of θ on√
f/d is absent and θ becomes essentially similar for
all three microstructural variants. This common upper limit, suggests that at higher
plastic strains, the work hardening due to GNDs is not the primary work hardening
mechanism; hence, other work hardening effects (not exclusive to DP steels) become
more prominent. This transition in the work hardening mechanism will be discussed
Chapter 4 Page 100
in more detail in Section 4.4.2.2.
4.4.2.2 Instantaneous Work Hardening Rate
The instantaneous hardening (n) curve of a DP steel, as seen in Figure 4.4b, can
be divided into three stages. In Stage A, n decreases rapidly from elastic behavior
to a minimum value of nmin. Upon further straining (Stage B), n increases to a
maximum value of nmax, and finally during Stage C, n gradually decreases until
the onset of plastic instability. The three stages of n corresponds directly with the
three work hardening stages typically observed in the Jaoul-Crussards (JC) analysis
[2, 19, 48, 49]. Stage A generally corresponds to the elastic to plastic transition of
ferrite [2, 19, 48]. Stage B is attributed to the plastic incompatibility between ferrite
and martensite [2, 19] which leads to the additional contributions of back-stresses and
GNDs to the overall work hardening rate, thereby increasing n from nmin to nmax.
Finally, Stage C is associated with a more homogenous deformation of ferrite and
martensite [19], the formation of dislocation cell substructure in ferrite, and the onset
of dynamic recovery effects [2, 48].
In Figure 4.7, the nmin (solid symbols) and nmax (empty symbols) values associated
with all of the DP microstructures investigated in this study (Table 4.2) have been
plotted as a function of√
f/d. Note that for microstructures exhibiting discontinuous
yielding, nmin is plotted as half-full symbols. It can be seen that nmin follows a
linear relationship with√
f/d, regardless of the yielding behaviour, i.e. continuous
or discontinuous. Additionally, for a given√
f/d, the dependence of nmin on√
f/d
differs for each of the three microstructural variants. These observations are similar
to those of the true work hardening rate (θ) at ǫp = 0.5% (Figure 4.6a), signifying
the dominance of the GND hardening mechanism at low strains. In comparison
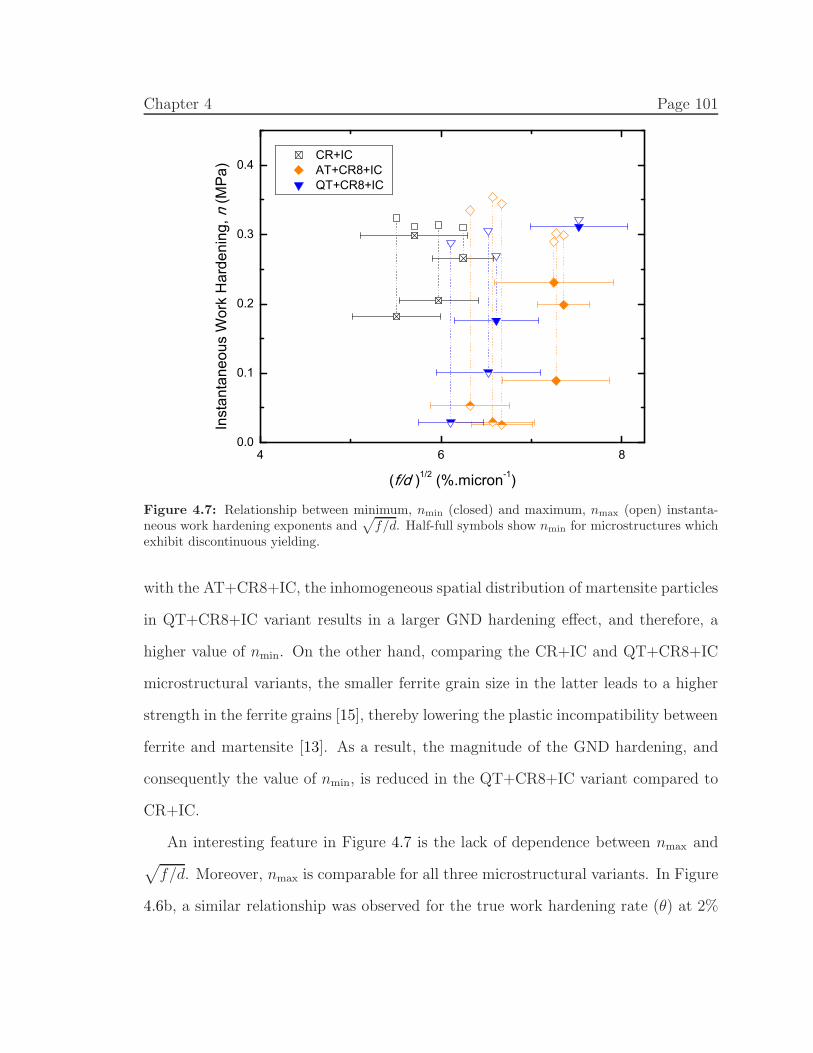
Chapter 4 Page 101
4 6 80.0
0.1
0.2
0.3
0.4
Inst
anta
neou
s W
ork
Har
deni
ng, n
(MP
a)
(f/d )1/2 (%.micron-1)
CR+IC AT+CR8+IC QT+CR8+IC
Figure 4.7: Relationship between minimum, nmin (closed) and maximum, nmax (open) instanta-neous work hardening exponents and
√
f/d. Half-full symbols show nmin for microstructures whichexhibit discontinuous yielding.
with the AT+CR8+IC, the inhomogeneous spatial distribution of martensite particles
in QT+CR8+IC variant results in a larger GND hardening effect, and therefore, a
higher value of nmin. On the other hand, comparing the CR+IC and QT+CR8+IC
microstructural variants, the smaller ferrite grain size in the latter leads to a higher
strength in the ferrite grains [15], thereby lowering the plastic incompatibility between
ferrite and martensite [13]. As a result, the magnitude of the GND hardening, and
consequently the value of nmin, is reduced in the QT+CR8+IC variant compared to
CR+IC.
An interesting feature in Figure 4.7 is the lack of dependence between nmax and√
f/d. Moreover, nmax is comparable for all three microstructural variants. In Figure
4.6b, a similar relationship was observed for the true work hardening rate (θ) at 2%
Chapter 4 Page 102
plastic strain, i.e. θ is independent of√
f/d and the microstructural variant. This
outcome implies that at strain levels associated with nmax (∼2-3%) the additional
work hardening effects due to GNDs are less significant and other work hardening
mechanisms, not specific to DP steels, are more important [2, 7–9, 20, 50]. Among the
three microstructural variants, the primary non-martensite related parameter is the
mean ferrite grain size. For this reason, it is hypothesized that nmax is a function of the
ferrite grain size. In the three microstructural variants, the average ferrite grain size is
very small and ranges from 1 to 1.8 microns. It is possible that despite the differences
in the work hardening behaviour at the beginning of the deformation (as demonstrated
by nmin and θ at ǫp = 0.5%), the entire ferrite grains are filled with GNDs as the
deformation proceeds due to the small mean size of ferrite grains. Therefore, the
work hardening of the three microstructural variants become relatively similar at
larger strains associated with nmax (∼2-3%), which leads to the comparable nmax
values observed in Figure 4.7. This argument is further strengthened by considering
the results of previous work [18], where nmax was found to be an inverse function of
ferrite grain size in materials with a larger ferrite grain size.
4.4.2.3 Dislocation Annihilation Factor
Stage C of work hardening in DP steels (above 4% strain) is associated with the
formation of dislocation cell substructures and the influence of dislocation annihi-
lation through dynamic recovery effects at high strains [2, 48]. To investigate this
phenomenon in more detail, the Kocks-Mecking (KM) approach can be applied where
the evolution of dislocation density with strain is assumed to be a function of a dis-
location storage term (athermal) and a dislocation annihilation term (strain rate and
temperature dependent) [51–53]. According to the KM model, the work hardening
Chapter 4 Page 103
rate, θ, follows a linear relationship with stress during Stage III of work hardening in
polycrystalline materials [18, 52], given by:
θ = θ0 − h(σ − σ0) (4.1)
where θ0 is the athermal hardening rate and σ0 is the flow stress due to strength-
ening mechanisms that do not include dislocation-dislocation interactions, such as
friction stress, back stresses, solid solution hardening and composite effects. The
parameter h is a microstructure-dependant “annihilation factor” that accounts for
dislocation annihilation and is a function of the strain rate and temperature.
To calculate h for the current data set, using Equation 4.1, a straight line was fit
to the θ vs (σ−σ0) plots at high strains (>4%). An example of the fitting procedure
is provided in Appendix B. For consistency, a 0.2% proof stress was used for σ0.
Since the objective was to calculate h, i.e. the slope of the fitted line, and not θ0,
this oversimplification is deemed appropriate (more details on this fitting procedure
can be found elsewhere [18]). The calculated h values for all of the microstructures
in Table 4.2 are plotted in Figure 4.8. It is evident that within each microstructural
variant, the dislocation annihilation factor, h, increases with√
f/d. Moreover, at a
given√
f/d, h increases in the order of AT+CR8+IC, QT+CR8+IC and CR+IC. The
values of the dislocation annihilation factor (h) and uniform elongations are compared
in Table 4.5 for the three selected microstructural variants with average martensite
volume fraction of ∼15%. It is evident that uniform elongation is inversely related to
h, which indicates the significance of the dislocation annihilation process to the overall
work hardening response of DP steels. This inverse relationship is understandable,
since as shown in Figure 4.8, all three microstructural variants have similar nmax,
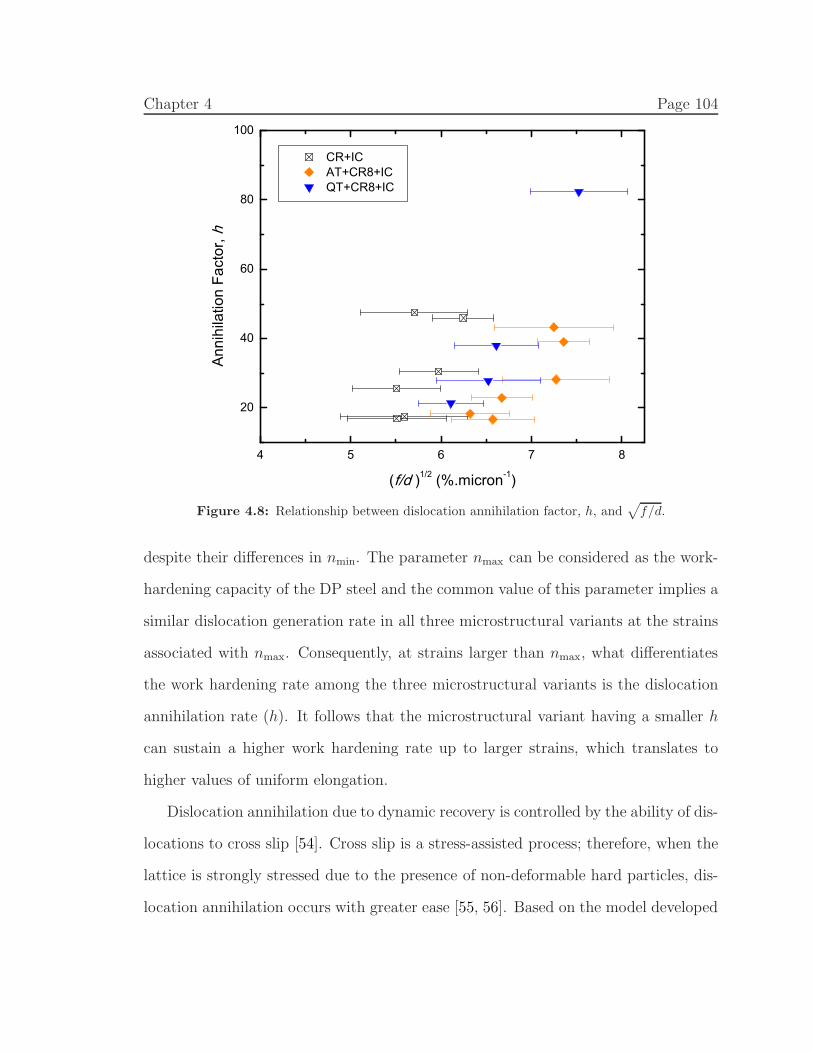
Chapter 4 Page 104
4 5 6 7 8
20
40
60
80
100
CR+IC AT+CR8+IC QT+CR8+IC
Ann
ihila
tion
Fact
or, h
(f/d )1/2 (%.micron-1)
Figure 4.8: Relationship between dislocation annihilation factor, h, and√
f/d.
despite their differences in nmin. The parameter nmax can be considered as the work-
hardening capacity of the DP steel and the common value of this parameter implies a
similar dislocation generation rate in all three microstructural variants at the strains
associated with nmax. Consequently, at strains larger than nmax, what differentiates
the work hardening rate among the three microstructural variants is the dislocation
annihilation rate (h). It follows that the microstructural variant having a smaller h
can sustain a higher work hardening rate up to larger strains, which translates to
higher values of uniform elongation.
Dislocation annihilation due to dynamic recovery is controlled by the ability of dis-
locations to cross slip [54]. Cross slip is a stress-assisted process; therefore, when the
lattice is strongly stressed due to the presence of non-deformable hard particles, dis-
location annihilation occurs with greater ease [55, 56]. Based on the model developed
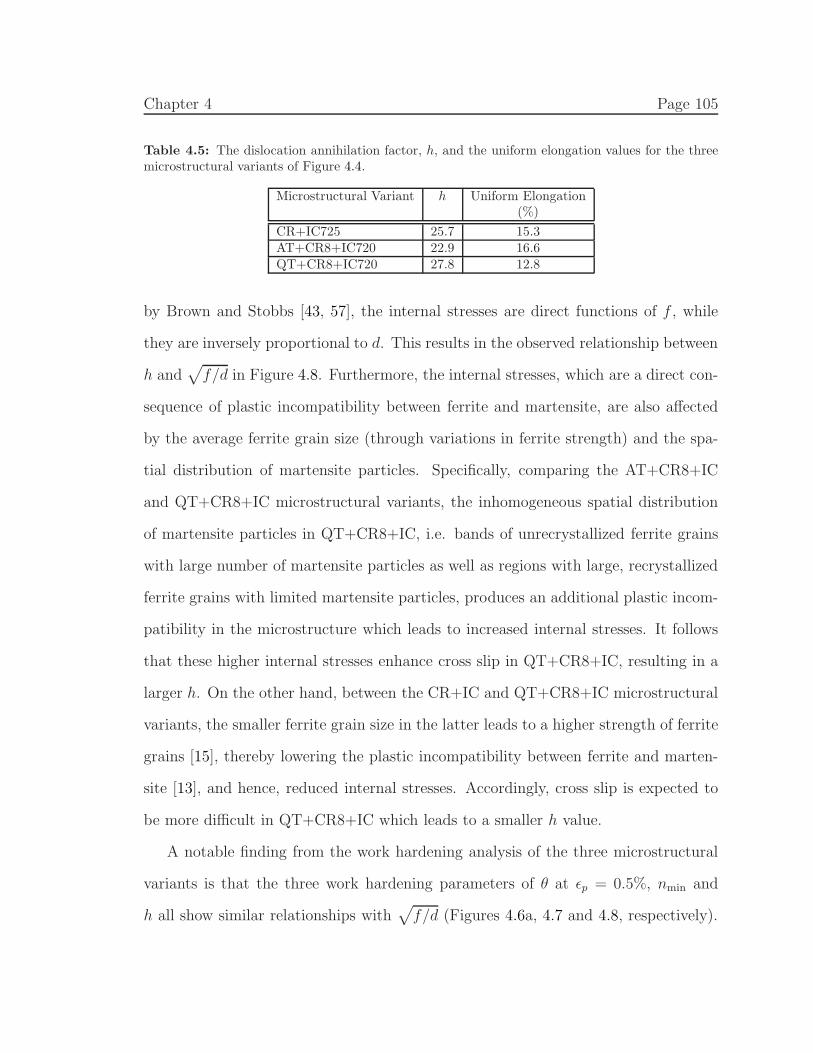
Chapter 4 Page 105
Table 4.5: The dislocation annihilation factor, h, and the uniform elongation values for the threemicrostructural variants of Figure 4.4.
Microstructural Variant h Uniform Elongation(%)
CR+IC725 25.7 15.3AT+CR8+IC720 22.9 16.6QT+CR8+IC720 27.8 12.8
by Brown and Stobbs [43, 57], the internal stresses are direct functions of f , while
they are inversely proportional to d. This results in the observed relationship between
h and√
f/d in Figure 4.8. Furthermore, the internal stresses, which are a direct con-
sequence of plastic incompatibility between ferrite and martensite, are also affected
by the average ferrite grain size (through variations in ferrite strength) and the spa-
tial distribution of martensite particles. Specifically, comparing the AT+CR8+IC
and QT+CR8+IC microstructural variants, the inhomogeneous spatial distribution
of martensite particles in QT+CR8+IC, i.e. bands of unrecrystallized ferrite grains
with large number of martensite particles as well as regions with large, recrystallized
ferrite grains with limited martensite particles, produces an additional plastic incom-
patibility in the microstructure which leads to increased internal stresses. It follows
that these higher internal stresses enhance cross slip in QT+CR8+IC, resulting in a
larger h. On the other hand, between the CR+IC and QT+CR8+IC microstructural
variants, the smaller ferrite grain size in the latter leads to a higher strength of ferrite
grains [15], thereby lowering the plastic incompatibility between ferrite and marten-
site [13], and hence, reduced internal stresses. Accordingly, cross slip is expected to
be more difficult in QT+CR8+IC which leads to a smaller h value.
A notable finding from the work hardening analysis of the three microstructural
variants is that the three work hardening parameters of θ at ǫp = 0.5%, nmin and
h all show similar relationships with√
f/d (Figures 4.6a, 4.7 and 4.8, respectively).
Chapter 4 Page 106
Additionally, the trend observed between the individual microstructural variants is
identical for these three work hardening parameters, i.e. at a given√
f/d, θ at ǫp =
0.5% , nmin and h increase in the order of AT+CR8+IC, QT+CR8+IC and CR+IC.
These observations are intriguing as the work hardening mechanisms associated with
these parameters are not similar, i.e. GND hardening for ǫp = 0.5% and nmin, and
dynamic recovery for h. These two work hardening mechanisms, however, are linked
with each other through the internal stresses that are produced due to the incompat-
ibility between ferrite and martensite. That is, the GND hardening corresponds to
the plastic relaxation of internal stresses [41–43] while dynamic recovery is enhanced
by unrelaxed portion of the internal stresses. Additional research is currently under-
way to study the effect of microstructural parameters on these internal stresses using
forward-reverse in-plane shear experiments.
4.5 Conclusions
1. Through the addition of a cold-rolling step between pre-heat treatments and
IC annealing, three distinct DP microstructural variants, having a significantly
refined ferrite grain size were produced. At a similar volume fraction of marten-
site, the variants differ with respect to their mean ferrite grain size and spatial
distribution of martensite particles.
2. At small strains (ǫp = 0.5%), the work hardening behaviour was found to be
dominated by the generation of geometrically necessary dislocations (GNDs)
in the ferrite grains and near the martensite particles. The work hardening
response at this stage was characterized by θ at ǫp = 0.5% and a minimum in
the instantaneous work hardening exponent, nmin. Both of these parameters
Chapter 4 Page 107
were determined to be functions of√
f/d, the mean ferrite grain size and the
spatial distribution of martensite particles. At higher strains (2-3%), however,
all three microstructural variants reach a similar work hardening limit, denoted
by a maximum value in the instantaneous work hardening exponent, nmax. This
parameter, which can be considered as the work hardening capacity of the DP
steel, was found to be independent of√
f/d.
3. At larger plastic strains (>4%), dislocation annihilation by dynamic recovery
becomes the controlling factor for the rate of work hardening. This phenomenon
is described by the dislocation annihilation factor, h, and is a function of√
f/d,
the mean ferrite grain size and the spatial distribution of martensite particles.
It was also shown that, for the three microstructural variants under study,
the uniform elongation is inversely proportional to the dislocation annihilation
factor, h.
4. The three work hardening parameters of θ at ǫp = 0.5%, nmin and h all ex-
hibit similar relationship with√
f/d and consistent trends between the three
microstructural variants under study. This observation suggest a common role
of internal stresses on the two work hardening mechanisms of GND hardening
and dynamic recovery. That is, the GND hardening corresponds to the plastic
relaxation of internal stresses while dynamic recovery is enhanced by unrelaxed
internal stresses.
4.6 Acknowledgments
Authors would like to acknowledge the financial support of the AUTO21 NCE
and the Natural Sciences and Engineering Research Council of Canada (NSERC).
Chapter 4 Page 108
4.7 References
[1] A. M. Sarosiek, W. S. Owen, Mater. Sci. Eng. 66 (1984) 13–34.
[2] D. A. Korzekwa, D. K. Matlock, G. Krauss, Metall. Trans. A 15 (1984) 1221–
1228.
[3] R. G. Davies, Metall. Trans. A 10 (1979) 1549–1555.
[4] N. K. Balliger, T. Gladman, Metal Sci. 15 (1981) 95–108.
[5] T. Sakaki, K. Sugimoto, T. Fukuzato, Acta Metall. 31 (1983) 1737–1746.
[6] J. M. Rigsbee, P. J. VanderArend, in: A. T. Davenport (Ed.), Formable HSLA
and Dual-Phase Steels, Metall. Soc. of AIME, 1977, pp. 56–86.
[7] J. Gerbase, J. D. Embury, R. M. Hobbs, in: R. A. Kot, J. W. Morris (Eds.),
Structure and Properties of Dual-Phase Steels, Metall. Soc. of AIME, 1979, pp.
118–144.
[8] G. R. Speich, R. L. Miller, in: R. A. Kot, J. W. Morris (Eds.), Structure and
Properties of Dual-Phase Steels, Metall. Soc. of AIME, 1979, pp. 145–182.
[9] M. Westphal, J. R. McDermid, J. D. Boyd, J. D. Embury, Can. Metall. Q. 49
(2010) 91–98.
[10] J. D. Embury, J. L. Duncan, in: R. A. Kot, B. L. Bramfitt (Eds.), Fundamentals
of Dual-Phase Steels, Metall. Soc. of AIME, 1981, pp. 333–345.
[11] R. F. Lawson, D. K. Matlock, G. Krauss, in: R. A. Kot, B. L. Bramfitt (Eds.),
Fundamentals of Dual-Phase Steels, Metall. Soc. of AIME, 1981, pp. 347–381.
[12] C. A. N. Lanzillotto, F. B. Pickering, Metal Sci. 16 (1982) 371–382.
[13] M. Calcagnotto, Y. Adachi, D. Ponge, D. Raabe, Acta. Mater. 59 (2011) 658–
670.
[14] K. T. Park, Y. K. Lee, D. H. Shin, ISIJ Int. 45 (2005) 750–755.
[15] M. Calcagnotto, D. Ponge, D. Raabe, Mater. Sci. Eng. A 527 (2010) 7832–7840.
Chapter 4 Page 109
[16] Z. Jiang, Z. Guan, J. Lian, Mater. Sci. Eng. A A190 (1995) 55–64.
[17] M. Mazinani, W. J. Poole, Metall. Mater. Trans. A 38 (2007) 328–339.
[18] H. Seyedrezai, A. K. Pilkey, J. D. Boyd, Mater. Sci. Eng. A 594 (2014) 178–188.
[19] D. Das, P. P. Chattopadhyay, J. Mater. Sci. 44 (2009) 2957–2965.
[20] A. Ramazani, K. Mukherjee, A. Schwedt, P. Goravanchi, U. Prahl, W. Bleck,
Int. J. Plast. 43 (2013) 128–152.
[21] C. Thomser, V. Uthaisangsuk, W. Bleck, Steel Res. 80 (2009) 582–587.
[22] C. I. Garcia, A. J. Deardo, Metall. Trans. A 12 (1981) 521–530.
[23] M. Kulakov, W. J. Poole, M. Militzer, Metall. Mater. Trans. A 44 (2013) 3564–
3576.
[24] D. Z. Yang, E. L. Brown, D. K. Matlock, G. Krauss, Metall. Trans. A 16 (1985)
1385–1392.
[25] J. Huang, W. J. Poole, M. Militzer, Metall. Mater. Trans. A 35 (2004) 3363–3375.
[26] A. Chbihi, D. Barbier, L. Germain, A. Hazotte, M. Goune, J. Mater. Sci. 49
(2014) 3608–3621.
[27] H. Paruz, D. V. Edmonds, Mater. Sci. Eng. A A117 (1989) 67–74.
[28] A. K. Sachdev, Acta Metall. 31 (1983) 2037–2042.
[29] W. Steven, A. G. Haynes, J. Iron Steel Inst. 183 (1956) 349–359.
[30] K. W. Andrews, J. Iron Steel Inst. 203 (1965) 721–727.
[31] J. S. Kang, J. B. Seol, C. G. Park, Mater. Charact. 79 (2013) 110–121.
[32] P. C. M. Rodrigues, E. V. Pereloma, D. B. Santos, Mater. Sci. Eng. A 283 (2000)
136–143.
[33] F. G. Caballero, H. Roelofs, S. Hasler, C. Capdevila, J. s. Chao, J. Cornide,
C. Garcia-Mateo, Mater. Sci. Technol. 28 (2012) 95–102.
Chapter 4 Page 110
[34] G. F. Vander Voort, Atlas of Time-temperature Diagrams for Irons and Steels,
ASM International, Materials Park, OH, 1991.
[35] P. A. Manohar, T. Chandra, C. R. Killmore, ISIJ Int. 36 (1996) 1486–1493.
[36] R. R. Mohanty, O. A. Girina, N. M. Fonstein, Metall. Mater. Trans. A 42 (2011)
3680–3690.
[37] M. Goune, P. Maugis, J. Drillet, J. Mater. Sci. Technol. 28 (2012) 728–736.
[38] N. Fonstein, M. Kapustin, N. Pottore, I. Gupta, O. Yakubovsky, Phys. Metals
Metall. 104 (2007) 315–323.
[39] A. Ramazani, K. Mukherjee, U. Prahl, W. Bleck, Metall. Mater. Trans. A 43
(2012) 3850–3869.
[40] M. Calcagnotto, D. Ponge, E. Demir, D. Raabe, Mater. Sci. Eng. A 527 (2010)
2738–2746.
[41] M. F. Ashby, Philos. Mag. 14 (1966) 1157–1178.
[42] M. F. Ashby, Philos. Mag. 21 (1970) 399–424.
[43] L. M. Brown, W. M. Stobbs, Philos. Mag. 23 (1971) 1201–1233.
[44] H. Azizi-Alizamini, M. Militzer, W. J. Poole, Scripta Mater. 57 (2007) 1065–
1068.
[45] M. Calcagnotto, D. Ponge, D. Raabe, ISIJ Int. 52 (2012) 874–883.
[46] H. Ghassemi-Armaki, R. Maaß, S. Sriram, J. R. Greer, K. S. Kumar, Acta.
Mater. 62 (2014) 197–211.
[47] A. Goel, R. K. Ray, G. S. Murty, Scripta Metall. 17 (1983) 375–380.
[48] W. R. Cribb, J. M. Rigsbee, in: R. A. Kot, J. W. Morris (Eds.), Structure and
Properties of Dual-Phase Steels, Metall. Soc. of AIME, 1979, pp. 91–117.
[49] Y. Tomita, K. Okabayashi, Metall. Trans. A 16 (1985) 865–872.
[50] M. Erdogan, R. Priestner, Mater. Sci. Technol. 15 (1999) 1273–1284.
Chapter 4 Page 111
[51] Y. Estrin, H. Mecking, Acta Metall. 32 (1984) 57–70.
[52] U. F. Kocks, H. Mecking, Prog. Mater. Sci. 48 (2003).
[53] H. Mecking, U. F. Kocks, Acta Metall. 29 (1981) 1865–1875.
[54] M. A. Meyers, K. K. Chawla, Mechanical Metallurgy: Principles and Applica-
tions, Prentice-Hall, Inc., Englewood Cliffs, NJ, 1984.
[55] O. Bouaziz, D. Barbier, J. D. Embury, G. Badinier, Philos. Mag. 93 (2013)
247–255.
[56] G. Fribourg, Y. Brechet, A. Deschamps, A. Simar, Acta. Mater. 59 (2011) 3621–
3635.
[57] L. M. Brown, W. M. Stobbs, Philos. Mag. 23 (1971) 1185–1199.
CHAPTER 5
Measurement of Back Stress Contribution
to Work Hardening
5.1 Introduction
The high initial work hardening rates of dual-phase (DP) steels have been at-
tributed to the plastic incompatibility between the soft ferrite and hard martensite.
This plastic incompatibility leads to an introduction of long-range internal elastic
stress into the ferrite matrix [1, 2] which is often referred to as “back stress”. The
back stress is directional in nature as it inhibits the further motion of dislocations in
the forward direction while it assists dislocation slip in the reverse direction. Due to
this directionally of back stress, its effect can be observed in forward-reverse deforma-
tion tests. In these tests, the specimen is first deformed to a pre-defined strain value
and then the strain path is reversed to continue deformation in the reverse direction.
An example of the stress-strain behaviour in a forward-reverse test is presented in
Figure 5.1. Two important effects are observed during reverse loading: (a) the tran-
sient softening effect, which is described by the reduced yield stress, i.e. σyR < σU
F ,
as well as the continuous yielding (regardless of the yielding response during forward
loading), and (b) the permanent softening effect, ∆σPS, which is represented by the
difference between the forward and reverse flow curves, typically measured after the
point where parallelism is established. Both of these effects are associated with the
directional internal stresses, i.e. back stresses, within the matrix. Additionally, during
forward loading, pileup of dislocations at barriers results in an increased resistance
112
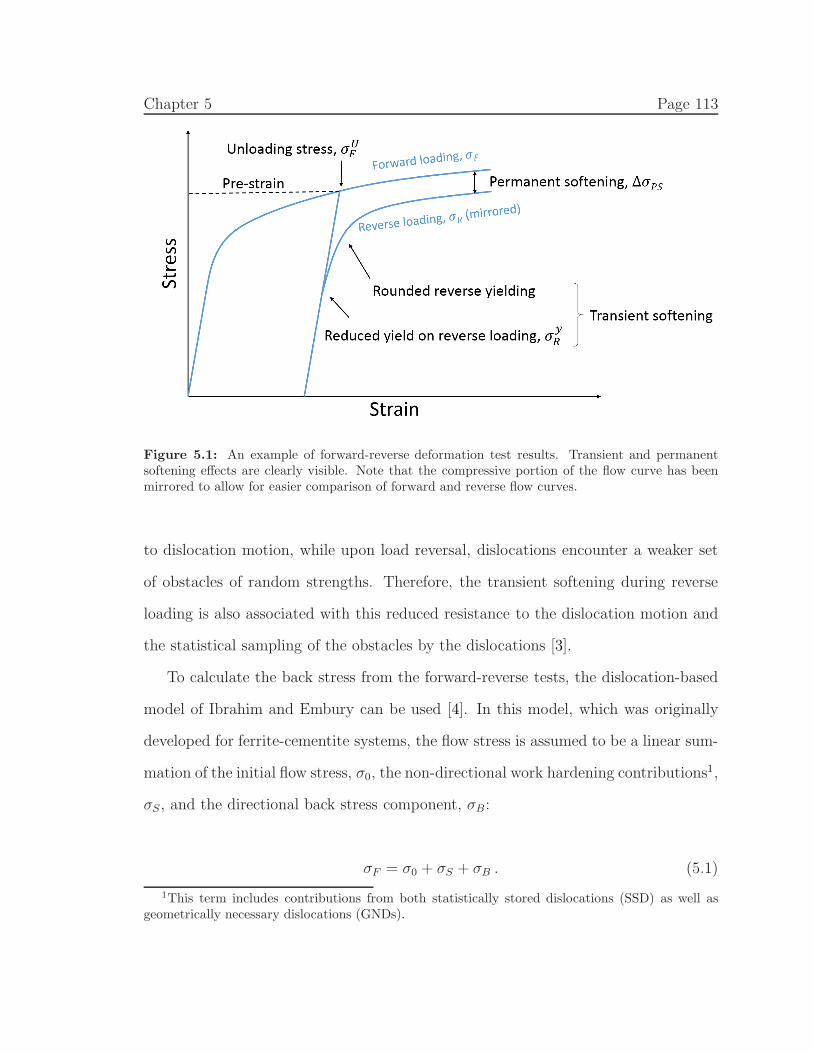
Chapter 5 Page 113
Figure 5.1: An example of forward-reverse deformation test results. Transient and permanentsoftening effects are clearly visible. Note that the compressive portion of the flow curve has beenmirrored to allow for easier comparison of forward and reverse flow curves.
to dislocation motion, while upon load reversal, dislocations encounter a weaker set
of obstacles of random strengths. Therefore, the transient softening during reverse
loading is also associated with this reduced resistance to the dislocation motion and
the statistical sampling of the obstacles by the dislocations [3].
To calculate the back stress from the forward-reverse tests, the dislocation-based
model of Ibrahim and Embury can be used [4]. In this model, which was originally
developed for ferrite-cementite systems, the flow stress is assumed to be a linear sum-
mation of the initial flow stress, σ0, the non-directional work hardening contributions1,
σS, and the directional back stress component, σB:
σF = σ0 + σS + σB . (5.1)
1This term includes contributions from both statistically stored dislocations (SSD) as well asgeometrically necessary dislocations (GNDs).
Chapter 5 Page 114
During reverse loading, the back stress assists the motion of dislocations and
therefore the reverse flow stress can be written as:
σR = σ0 + σS − σB (5.2)
Assuming the structure that gave rise to σS remains unchanged upon strain re-
versal, the back stress can be calculated as:
σB =σF − σR
2. (5.3)
It follows that in order to measure back stress, σF and σR should first be deter-
mined. In a pioneering study, Atkinson et al. [3] showed that taking the permanent
softening parameter (∆σPS) as σF − σR, correct measurements of back stress can be
made. This approach has been adopted by a number of researchers [4–10]. However,
more recently, using careful X-ray measurements of internal stress, Wilson and Bate
[11, 12] have demonstrated that this method underestimates the value of the back
stress. They offered an explanation that during reverse straining up to the point of
parallelism between forward and reverse flow curves, the dislocation substructure that
gives rise to the non-directional hardening component (σS) is actually modified and
therefore permanent softening is not solely a function of the back stress. Specifically,
in the TEM studies of Gardey et al. [13, 14], changes in the dislocation substructure
upon reverse loading were clearly observed for the case of DP steels. Additionally,
such effects were also manifested in the reverse flow curve by the appearance of a
work hardening stagnation region, i.e. a transitionary negative work hardening rate,
as well as a lack of parallelism between the forward and reverse flow curves [13, 14].
A practical difficulty in using the permanent softening parameter to calculate the
Chapter 5 Page 115
back stress is the large strains required to achieve the parallelism between forward
and reverse flow curves. For this reason, as well as the aforementioned inaccuracies
associated with the permanent softening method, in recent years, and particularly in
the case of DP steels, the back stress has instead been calculated from the difference
between the forward unloading stress (σUF ) and the reverse yield stress (σy
R) [2, 6, 15–
19]. An inherent complication in such analyses is the lack of a clear yield point during
reverse loading due to the presence of the transient softening effects. To overcome
this uncertainty, the offset method is often utilized. Different true-strain offset values
have been reported, e.g. 0.0005 [15, 16], 0.001 [6, 17, 18] and 0.002 [2, 19]. Although
it has been shown that the choice of the offset strain changes the absolute magnitude
of the calculated back stress, the trends observed between back stress and pre-strain
remain unaffected [18].
Another complication in determining σR is the plastic relaxation that occurs dur-
ing unloading [10, 11, 20, 21]. This effect has been associated with the relaxation and
runback of the repulsive pileup dislocations during unloading [20, 21]. Moreover, this
plastic relaxation has also been attributed to the local variations of internal stress
and obstacle strength [11]. In the absence of forward-reverse test equipment, several
researchers used unload-reload type tests to measure the back stress from the inelastic
unloading behaviour after different amounts of pre-straining [22–24]. Although useful,
this approach clearly produces an overestimation of the back stress since the inelastic
relaxation is only associated with the movement of a limited number of dislocations
which have favorable local effects.
Traditionally, the forward-reverse deformation test comprises a tension-compression
strain path. However, in the case of sheet materials, this type of testing is limited
by the buckling of the specimen during compressive loading. Therefore, alternative
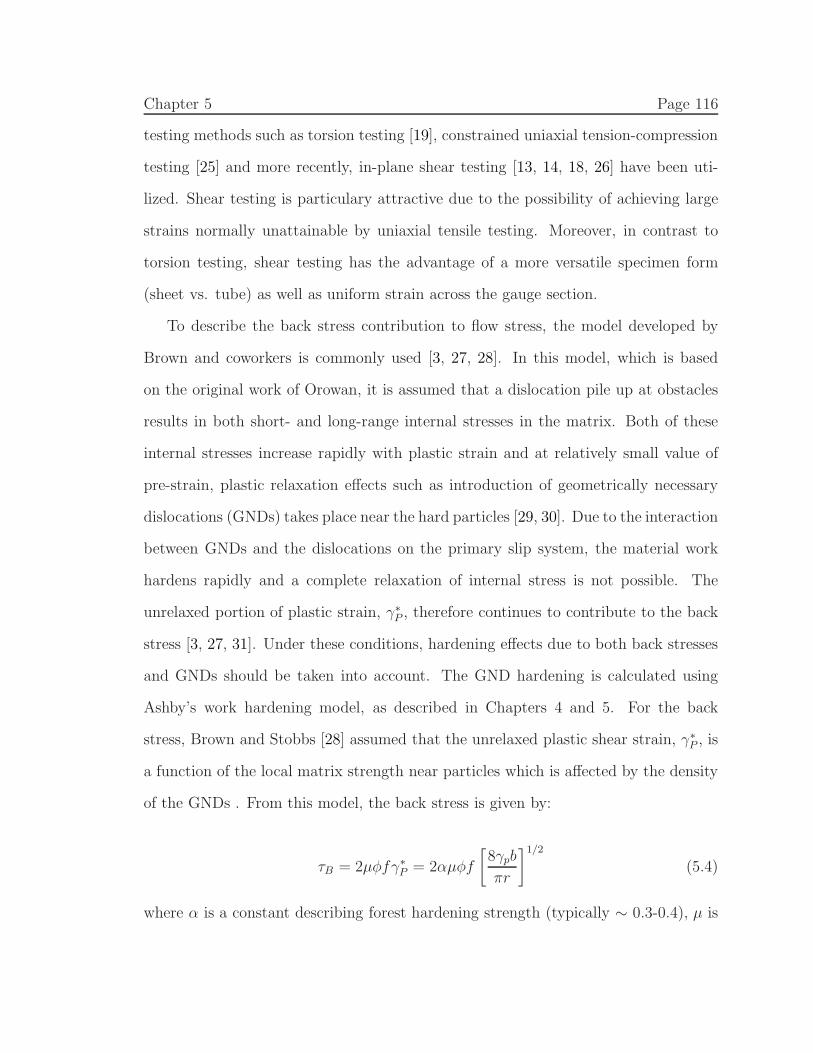
Chapter 5 Page 116
testing methods such as torsion testing [19], constrained uniaxial tension-compression
testing [25] and more recently, in-plane shear testing [13, 14, 18, 26] have been uti-
lized. Shear testing is particulary attractive due to the possibility of achieving large
strains normally unattainable by uniaxial tensile testing. Moreover, in contrast to
torsion testing, shear testing has the advantage of a more versatile specimen form
(sheet vs. tube) as well as uniform strain across the gauge section.
To describe the back stress contribution to flow stress, the model developed by
Brown and coworkers is commonly used [3, 27, 28]. In this model, which is based
on the original work of Orowan, it is assumed that a dislocation pile up at obstacles
results in both short- and long-range internal stresses in the matrix. Both of these
internal stresses increase rapidly with plastic strain and at relatively small value of
pre-strain, plastic relaxation effects such as introduction of geometrically necessary
dislocations (GNDs) takes place near the hard particles [29, 30]. Due to the interaction
between GNDs and the dislocations on the primary slip system, the material work
hardens rapidly and a complete relaxation of internal stress is not possible. The
unrelaxed portion of plastic strain, γ∗
P , therefore continues to contribute to the back
stress [3, 27, 31]. Under these conditions, hardening effects due to both back stresses
and GNDs should be taken into account. The GND hardening is calculated using
Ashby’s work hardening model, as described in Chapters 4 and 5. For the back
stress, Brown and Stobbs [28] assumed that the unrelaxed plastic shear strain, γ∗
P , is
a function of the local matrix strength near particles which is affected by the density
of the GNDs . From this model, the back stress is given by:
τB = 2µφfγ∗
P = 2αµφf
[
8γpb
πr
]1/2
(5.4)
where α is a constant describing forest hardening strength (typically ∼ 0.3-0.4), µ is
Chapter 5 Page 117
the shear modulus2, φ is the morphology-dependant accommodation factor (typically
assumed ∼ 0.5 for spherical particles), f is the volume fraction of hard particles, b is
the Burgers vector, r is the particle radius and γp is the plastic shear strain.
Experimental research on back stress effects in DP steels has been limited. The
majority of these publications have focused on providing a general understanding
of back stresses [6, 15, 18], while studies concerning the effect of microstructural
parameters on back stress hardening are limited. As expected, the back stress has
been found to increase with the volume fraction of martensite [2, 10, 16, 17]. However,
in terms of other microstructural parameters, such as the size and spatial distribution
of martensite particles, the reported studies are not systematic such that a clear
conclusion regarding their influence on back stress hardening cannot be made [16, 17].
In the present study, the primary objective was to provide a more comprehensive
understanding of the relationship between back stress hardening and microstructural
parameters in DP steels, specifically ferrite grain size as well as the size, morphology
and spatial distribution of martensite particles. To accomplish this goal, an in-plane
shear fixture was designed and built in order to perform forward-reverse tests on five
different DP780 microstructural variants with similar volume fractions of martensite
(described in Chapters 3 and 4). In the remainder of this Chapter, the design, con-
struction and calibration of the shear fixture is described, followed by a presentation
and discussion of forward-reverse shear test results obtained using the five DP780
microstructural variants.
2 Equation 5.4 is based on the assumption of similar elastic moduli for both the matrix (µ) and
hard particle (µ∗). If this is not the case, then a correction factor of µ∗
µ∗−φ(µ∗
−µ) , must be included
in Equation 5.4.
Chapter 5 Page 118
5.2 Experimental Procedure
The design of the shear fixture is presented in Sections 5.2.1 and 5.2.2. A summary
of the stress and strain measurement procedure is provided in Section 5.2.3. Finally,
the testing routine as well as the analysis protocols are discussed in Sections 5.2.4
and 5.2.5, respectively.
5.2.1 Shear Specimen Geometry
The design criteria for the shear specimen were as follows:
1. Simplicity: The specimen design shall be such that calculations of shear strain
and stress are straightforward. A sample geometry that produces a “simple
shear” deformation was therefore selected.
2. Strain homogeneity: The developed strain field within the shear zone shall be
as uniform as possible and with the minimum amount of inhomogeneities such
as end effects. The FEM calculations of Bouvier et al. [32] showed that reducing
the width-to-height ratio of the shear gauge area (w/H) results in a more uni-
form and homogeneous distribution of the shear stress field. Consequently,
Bouvier et al. [26] used the ratio of 1:5 in their design and obtained a rela-
tively uniform distribution of shear at the areas away from the edges. Similar
considerations were used in the present design.
3. Balanced moments: The shear zone in the specimen shall be symmetrical such
that the net moment within the setup remains zero. Therefore, in the shear
test developed here, a specimen with two symmetrical and identical shear zones
was used.
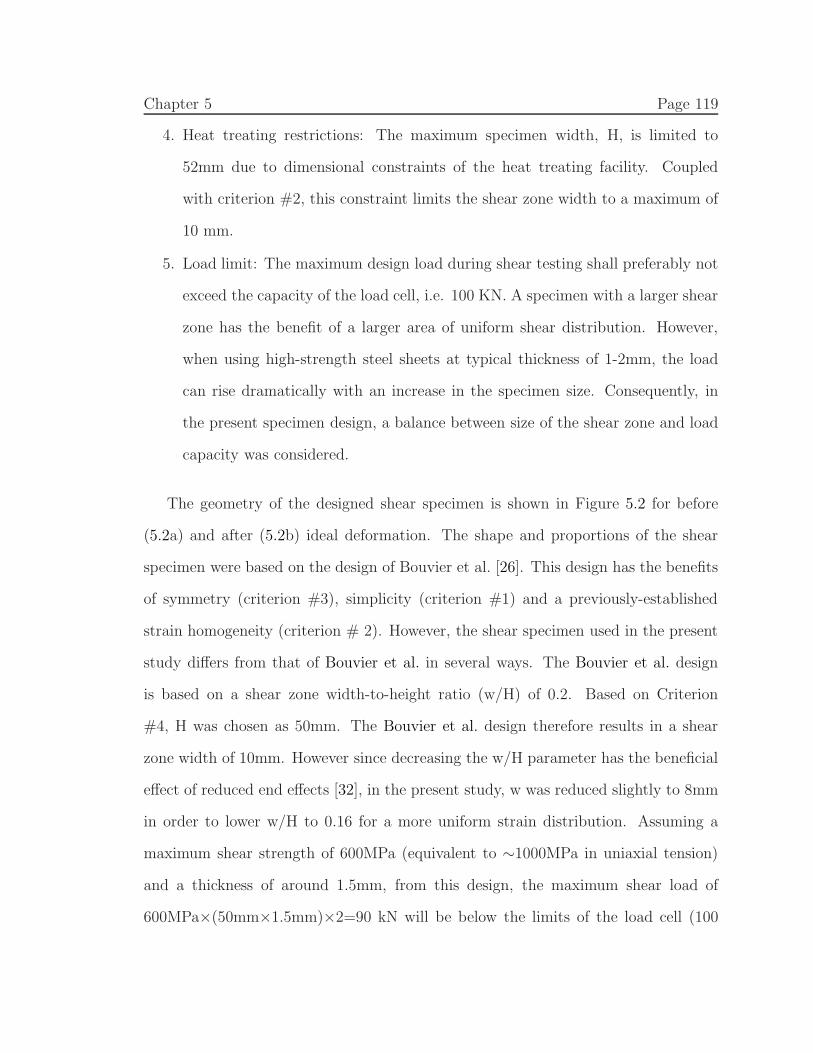
Chapter 5 Page 119
4. Heat treating restrictions: The maximum specimen width, H, is limited to
52mm due to dimensional constraints of the heat treating facility. Coupled
with criterion #2, this constraint limits the shear zone width to a maximum of
10 mm.
5. Load limit: The maximum design load during shear testing shall preferably not
exceed the capacity of the load cell, i.e. 100 KN. A specimen with a larger shear
zone has the benefit of a larger area of uniform shear distribution. However,
when using high-strength steel sheets at typical thickness of 1-2mm, the load
can rise dramatically with an increase in the specimen size. Consequently, in
the present specimen design, a balance between size of the shear zone and load
capacity was considered.
The geometry of the designed shear specimen is shown in Figure 5.2 for before
(5.2a) and after (5.2b) ideal deformation. The shape and proportions of the shear
specimen were based on the design of Bouvier et al. [26]. This design has the benefits
of symmetry (criterion #3), simplicity (criterion #1) and a previously-established
strain homogeneity (criterion # 2). However, the shear specimen used in the present
study differs from that of Bouvier et al. in several ways. The Bouvier et al. design
is based on a shear zone width-to-height ratio (w/H) of 0.2. Based on Criterion
#4, H was chosen as 50mm. The Bouvier et al. design therefore results in a shear
zone width of 10mm. However since decreasing the w/H parameter has the beneficial
effect of reduced end effects [32], in the present study, w was reduced slightly to 8mm
in order to lower w/H to 0.16 for a more uniform strain distribution. Assuming a
maximum shear strength of 600MPa (equivalent to ∼1000MPa in uniaxial tension)
and a thickness of around 1.5mm, from this design, the maximum shear load of
600MPa×(50mm×1.5mm)×2=90 kN will be below the limits of the load cell (100
Chapter 5 Page 120
kN), therefore satisfying Criterion #5. Finally, all remaining dimensions other than
H and w were selected to allow for a proper placement of eight 10mm holes (in the
gripping regions of the specimen), according to design standards, i.e. a hole spacing
of 2.5 × hole diameter and an edge separation of 1.25 × hole diameter. A detailed
drawing of the shear specimen is given in Appendix C.
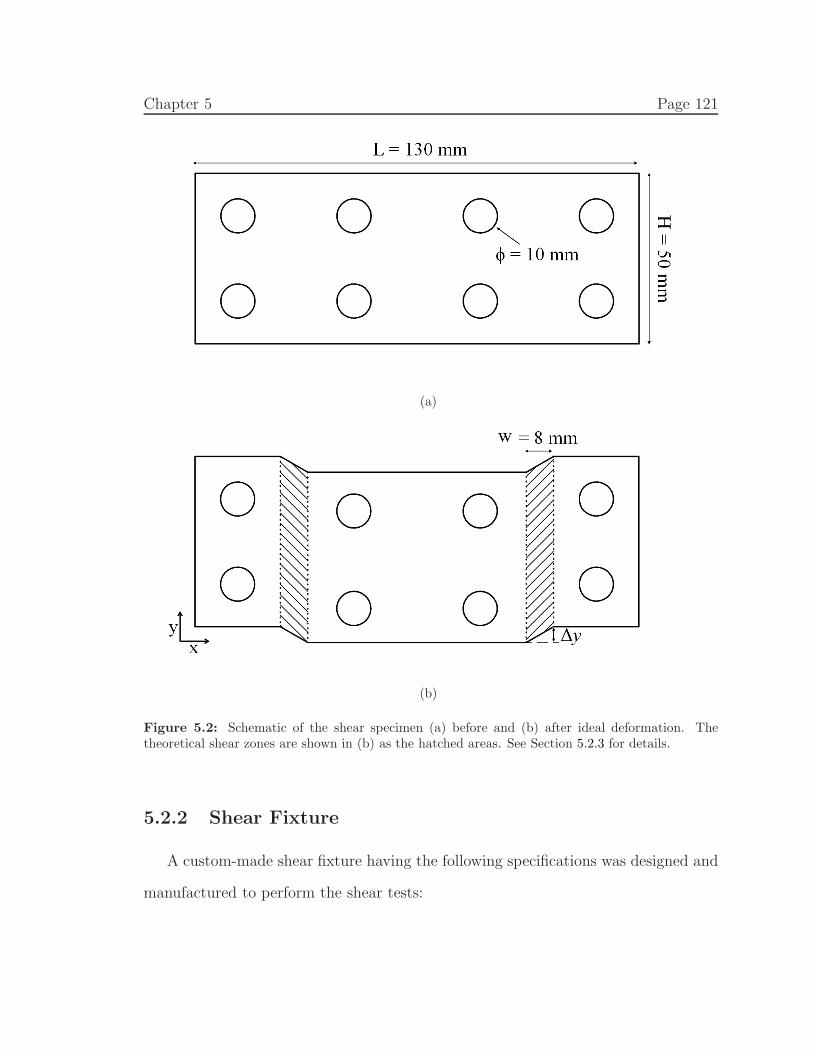
Chapter 5 Page 121
(a)
(b)
Figure 5.2: Schematic of the shear specimen (a) before and (b) after ideal deformation. Thetheoretical shear zones are shown in (b) as the hatched areas. See Section 5.2.3 for details.
5.2.2 Shear Fixture
A custom-made shear fixture having the following specifications was designed and
manufactured to perform the shear tests:
Chapter 5 Page 122
1. Easy assembly: The fixture assembly prior to the testing shall be easy and
straightforward.
2. Interruption-free strain reversal: The strain reversal shall be able to be per-
formed without disassembling and reassembling of the setup.
3. Compatibility: With only minimal adjustments, the fixture shall be compatible
with the available Instron hydraulic machine.
4. Optical access to the shear zone: The shear zone shall be visible during the test
so that strains can be instantaneously measured using an imposed grid pattern.
5. Safety: Due to very high loads encountered during the test, the setup shall meet
all applicable safe practice requirements.
The designed shear fixture, made from untreated 4140 alloy steel (nominal hard-
ness of Rockwell B90), is shown in Figure 5.3. The fixture consists of a fixed grip
(Figure 5.3a) and a moving grip (Figure 5.3b). The fixed grip includes the base
and the cover while the moving grip comprises the plunger and the spacer. The
spacer is designed to stabilize the plunger by restricting the out-of-plane deforma-
tion. The detailed drawings of the individual components of the shear fixture can
be found in Appendix A. Note that in Figure 5.3, the two shear zones as well as the
gripping regions are marked. Additionally, as will be explained in Section 5.2.4, all
contact/moving surfaces in the fixture are lubricated with dry graphite to reduce the
frictional effects. These surfaces are labeled “L” in Figures 5.3a and 5.3b.
The specimen mounting procedure is shown in Figure 5.4 and is as follows:
1. With the aid of four high strength bolts (Class 10.9), the spacer and specimen
are aligned and placed together on the plunger (Figure 5.4a and b).
2. The bolts are loosely secured using compatible high strength nuts (SAE Grade 8).
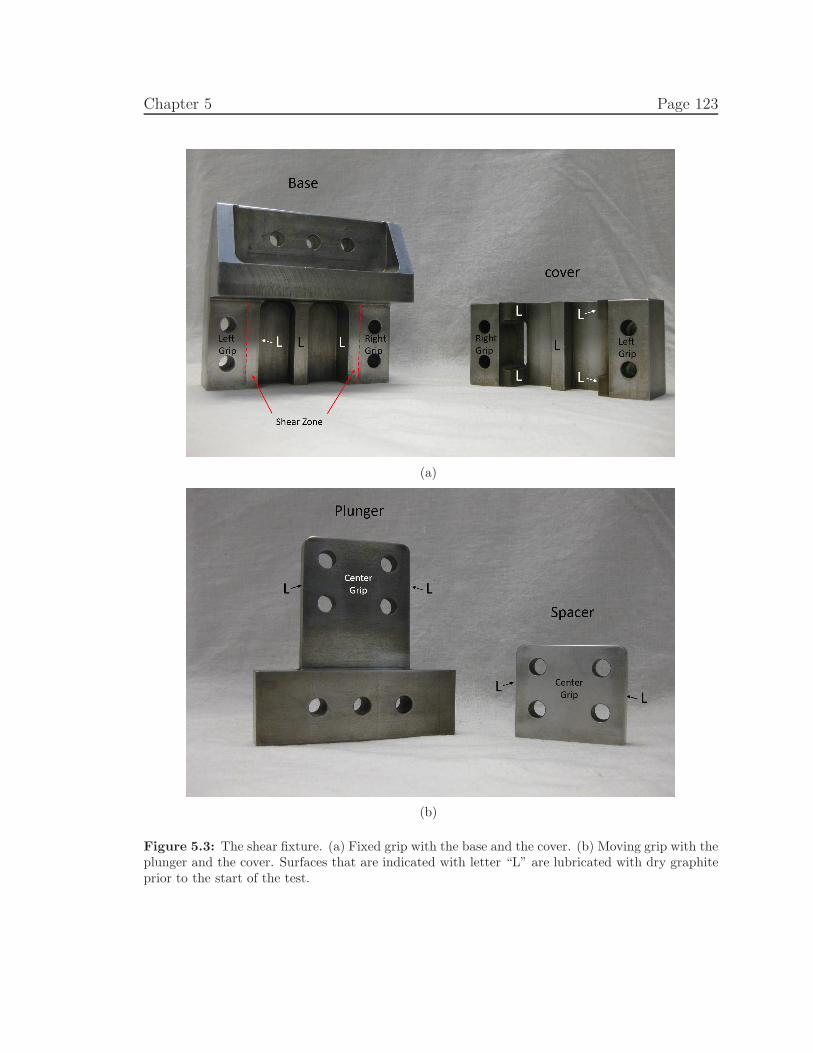
Chapter 5 Page 123
(a)
(b)
Figure 5.3: The shear fixture. (a) Fixed grip with the base and the cover. (b) Moving grip with theplunger and the cover. Surfaces that are indicated with letter “L” are lubricated with dry graphiteprior to the start of the test.
Chapter 5 Page 124
3. The plunger is moved to the zero position and the specimen holes are aligned
with the fixed grip base (Figure 5.4c).
4. With the specimen aligned properly, plunger bolts are tightened using a torque
wrench with 53ft.lb of torque, i.e. recommended torque for dry, unlubricated
M10 Class 10.9 bolts.
5. The fixed grip cover is placed on the rest of the fixture and is secured using four
additional high strength bolts and nuts, again with 53 ft.lb of torque (Figure
5.4d).

Chapter 5 Page 125
(a)
(b)
(c) (d)
Figure 5.4: Assembly procedure for the shear test. Refer to text for details.
Chapter 5 Page 126
5.2.3 Stress and Strain Measurements
For a first approximation, the shear strain can be measured from the crosshead
displacement data. Based on the geometry of the specimen, and under ideal shear
conditions where: (a) shear occurs purely within the theoretical shear zone, shown in
Figure 5.2b, and (b) all other strains, except the primary shear strain (γxy), are zero,
the raw shear strain can be expressed by:
γxy =∆y
w. (5.5)
To provide a more accurate measurement of the strain, a square grid pattern of
dots with 2 mm by 2 mm spacing was applied to the surface of every shear specimen.
This gridding was done using a custom made marker press attached to a computer-
controlled microscope stage. The strain field, including normal and shear components,
can be calculated by comparing the grid before and after deformation. Two types of
grid patterns were used:
1. Full Grid: For the calibration experiments, the complete strain field was mea-
sured using a 12×25 point grid pattern that was imposed on both sides, i.e. left
and right, of the shear specimens (Figure 5.5a). To calculate the strains, the
specimen was scanned before and after deformation using a HP Scanjet G4050
scanner at a resolution of 600dpi.
2. Camera Grid: For all specimens used in the non-calibration experiments, the
exact strain at the point of the strain path reversal during forward-reverse tests
was measured using a 5× 25 point grid pattern applied on both gauge sections
(left and right). The pattern, which is shown in Figure 5.5b, is placed such that
it will be visible during the test through the viewfinder of the shear fixture.
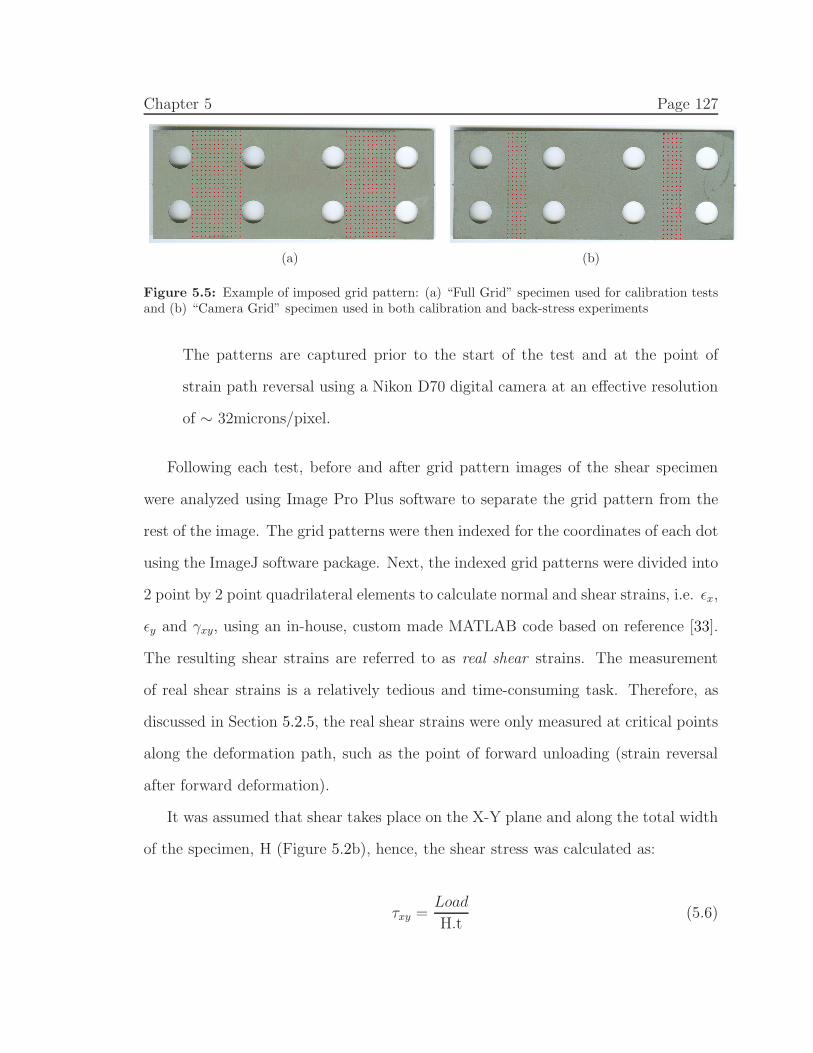
Chapter 5 Page 127
(a) (b)
Figure 5.5: Example of imposed grid pattern: (a) “Full Grid” specimen used for calibration testsand (b) “Camera Grid” specimen used in both calibration and back-stress experiments
The patterns are captured prior to the start of the test and at the point of
strain path reversal using a Nikon D70 digital camera at an effective resolution
of ∼ 32microns/pixel.
Following each test, before and after grid pattern images of the shear specimen
were analyzed using Image Pro Plus software to separate the grid pattern from the
rest of the image. The grid patterns were then indexed for the coordinates of each dot
using the ImageJ software package. Next, the indexed grid patterns were divided into
2 point by 2 point quadrilateral elements to calculate normal and shear strains, i.e. ǫx,
ǫy and γxy, using an in-house, custom made MATLAB code based on reference [33].
The resulting shear strains are referred to as real shear strains. The measurement
of real shear strains is a relatively tedious and time-consuming task. Therefore, as
discussed in Section 5.2.5, the real shear strains were only measured at critical points
along the deformation path, such as the point of forward unloading (strain reversal
after forward deformation).
It was assumed that shear takes place on the X-Y plane and along the total width
of the specimen, H (Figure 5.2b), hence, the shear stress was calculated as:
τxy =Load
H.t(5.6)
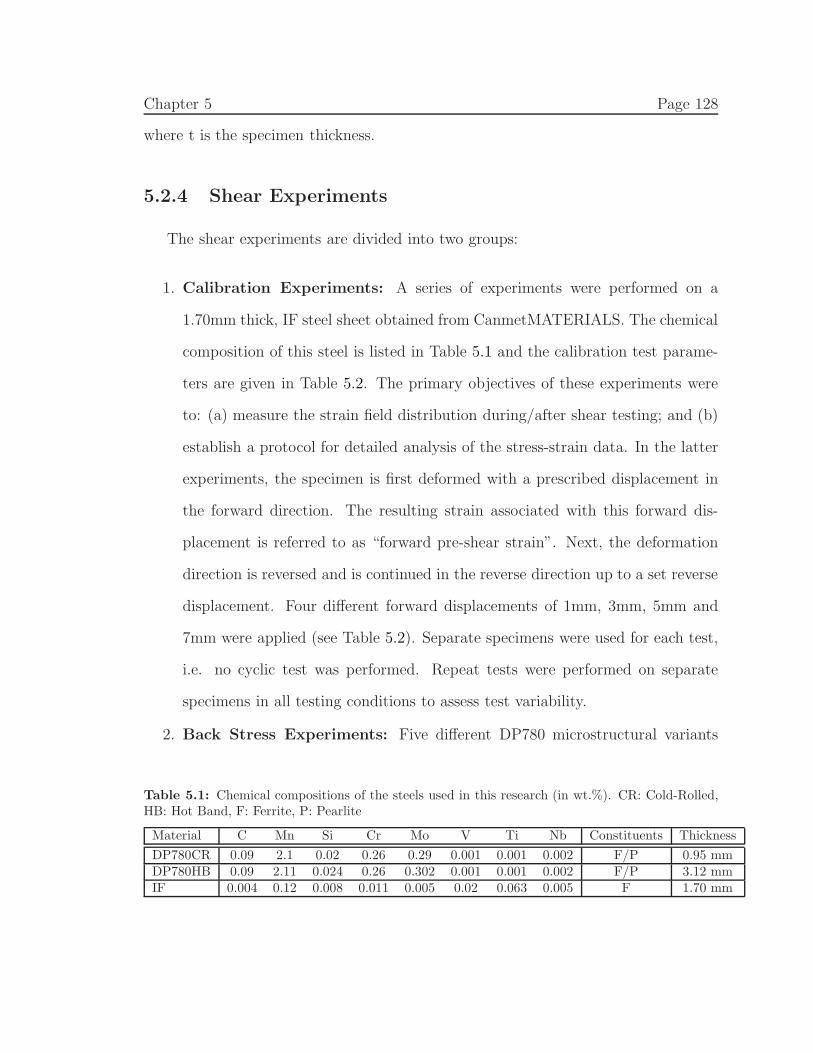
Chapter 5 Page 128
where t is the specimen thickness.
5.2.4 Shear Experiments
The shear experiments are divided into two groups:
1. Calibration Experiments: A series of experiments were performed on a
1.70mm thick, IF steel sheet obtained from CanmetMATERIALS. The chemical
composition of this steel is listed in Table 5.1 and the calibration test parame-
ters are given in Table 5.2. The primary objectives of these experiments were
to: (a) measure the strain field distribution during/after shear testing; and (b)
establish a protocol for detailed analysis of the stress-strain data. In the latter
experiments, the specimen is first deformed with a prescribed displacement in
the forward direction. The resulting strain associated with this forward dis-
placement is referred to as “forward pre-shear strain”. Next, the deformation
direction is reversed and is continued in the reverse direction up to a set reverse
displacement. Four different forward displacements of 1mm, 3mm, 5mm and
7mm were applied (see Table 5.2). Separate specimens were used for each test,
i.e. no cyclic test was performed. Repeat tests were performed on separate
specimens in all testing conditions to assess test variability.
2. Back Stress Experiments: Five different DP780 microstructural variants
Table 5.1: Chemical compositions of the steels used in this research (in wt.%). CR: Cold-Rolled,HB: Hot Band, F: Ferrite, P: Pearlite
Material C Mn Si Cr Mo V Ti Nb Constituents Thickness
DP780CR 0.09 2.1 0.02 0.26 0.29 0.001 0.001 0.002 F/P 0.95 mmDP780HB 0.09 2.11 0.024 0.26 0.302 0.001 0.001 0.002 F/P 3.12 mmIF 0.004 0.12 0.008 0.011 0.005 0.02 0.063 0.005 F 1.70 mm
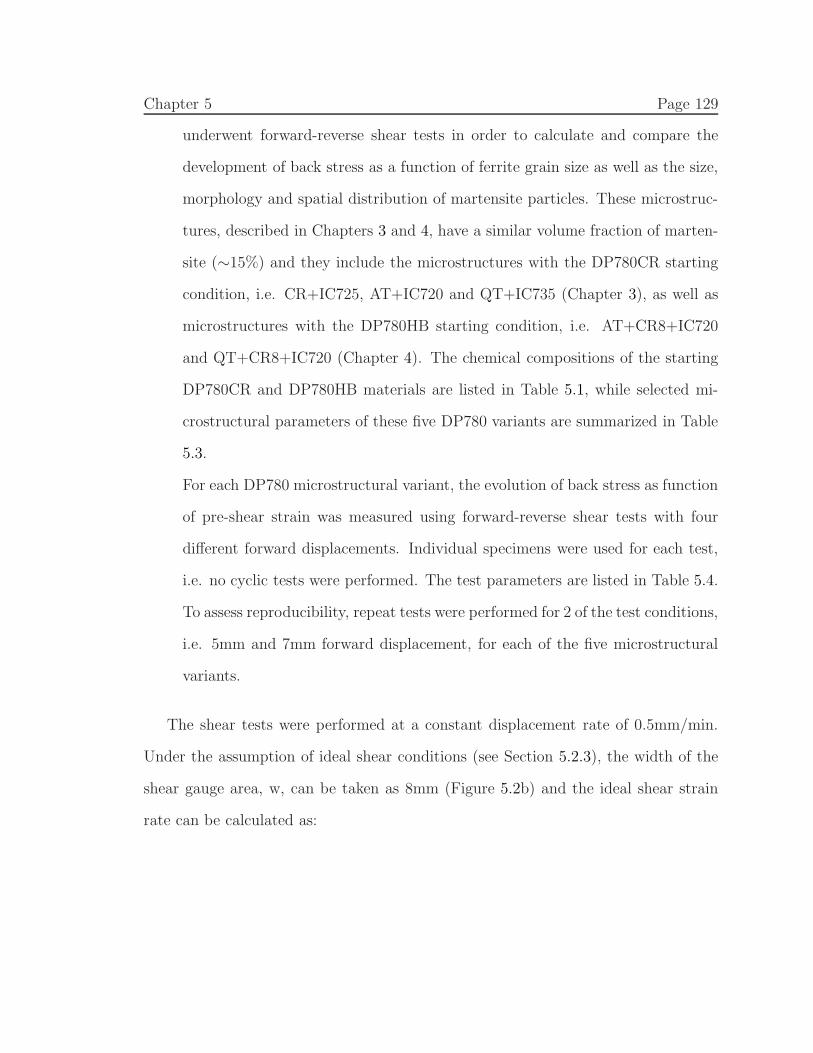
Chapter 5 Page 129
underwent forward-reverse shear tests in order to calculate and compare the
development of back stress as a function of ferrite grain size as well as the size,
morphology and spatial distribution of martensite particles. These microstruc-
tures, described in Chapters 3 and 4, have a similar volume fraction of marten-
site (∼15%) and they include the microstructures with the DP780CR starting
condition, i.e. CR+IC725, AT+IC720 and QT+IC735 (Chapter 3), as well as
microstructures with the DP780HB starting condition, i.e. AT+CR8+IC720
and QT+CR8+IC720 (Chapter 4). The chemical compositions of the starting
DP780CR and DP780HB materials are listed in Table 5.1, while selected mi-
crostructural parameters of these five DP780 variants are summarized in Table
5.3.
For each DP780 microstructural variant, the evolution of back stress as function
of pre-shear strain was measured using forward-reverse shear tests with four
different forward displacements. Individual specimens were used for each test,
i.e. no cyclic tests were performed. The test parameters are listed in Table 5.4.
To assess reproducibility, repeat tests were performed for 2 of the test conditions,
i.e. 5mm and 7mm forward displacement, for each of the five microstructural
variants.
The shear tests were performed at a constant displacement rate of 0.5mm/min.
Under the assumption of ideal shear conditions (see Section 5.2.3), the width of the
shear gauge area, w, can be taken as 8mm (Figure 5.2b) and the ideal shear strain
rate can be calculated as:
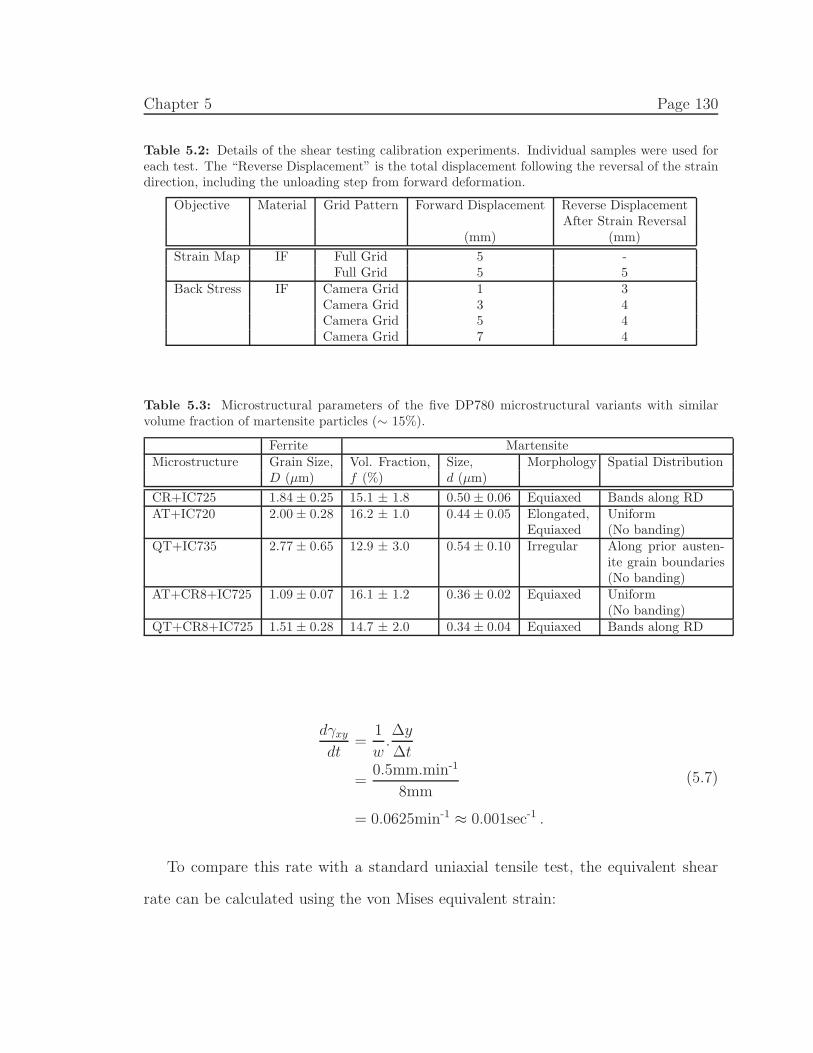
Chapter 5 Page 130
Table 5.2: Details of the shear testing calibration experiments. Individual samples were used foreach test. The “Reverse Displacement” is the total displacement following the reversal of the straindirection, including the unloading step from forward deformation.
Objective Material Grid Pattern Forward Displacement Reverse DisplacementAfter Strain Reversal
(mm) (mm)
Strain Map IF Full Grid 5 -Full Grid 5 5
Back Stress IF Camera Grid 1 3Camera Grid 3 4Camera Grid 5 4Camera Grid 7 4
Table 5.3: Microstructural parameters of the five DP780 microstructural variants with similarvolume fraction of martensite particles (∼ 15%).
Ferrite MartensiteMicrostructure Grain Size, Vol. Fraction, Size, Morphology Spatial Distribution
D (µm) f (%) d (µm)
CR+IC725 1.84 ± 0.25 15.1 ± 1.8 0.50 ± 0.06 Equiaxed Bands along RDAT+IC720 2.00 ± 0.28 16.2 ± 1.0 0.44 ± 0.05 Elongated,
EquiaxedUniform(No banding)
QT+IC735 2.77 ± 0.65 12.9 ± 3.0 0.54 ± 0.10 Irregular Along prior austen-ite grain boundaries(No banding)
AT+CR8+IC725 1.09 ± 0.07 16.1 ± 1.2 0.36 ± 0.02 Equiaxed Uniform(No banding)
QT+CR8+IC725 1.51 ± 0.28 14.7 ± 2.0 0.34 ± 0.04 Equiaxed Bands along RD
dγxydt
=1
w.∆y
∆t
=0.5mm.min-1
8mm
= 0.0625min-1≈ 0.001sec-1 .
(5.7)
To compare this rate with a standard uniaxial tensile test, the equivalent shear
rate can be calculated using the von Mises equivalent strain:
Chapter 5 Page 131
Table 5.4: Details of the back stress experiments for the DP780 variants. Individual samples wereused for each test. For specimens with underlined displacement amounts, a complete repeat testwas performed. The “Reverse Displacement” refer to the total displacement immediately after thereversal of the strain direction, hence including the unloading step from forward deformation.
Material Grid Pattern Forward Displacement Reverse DisplacementAfter Strain Reversal
(mm) (mm)
CR+IC725 Camera Grid 1.2 2.5Camera Grid 3 3.5Camera Grid 5 4Camera Grid 7 4
AT+IC720 Camera Grid 1.2 2.5Camera Grid 3 3.5Camera Grid 5 4Camera Grid 7 4
QT+IC735 Camera Grid 1.2 2.5Camera Grid 3 3.5Camera Grid 5 4Camera Grid 7 4
AT+CR8+IC720 Camera Grid 1.2 2.5Camera Grid 3 3.5Camera Grid 5 4Camera Grid 7 4
QT+CR8+IC720 Camera Grid 1.2 2.5Camera Grid 3 3.5Camera Grid 5 4Camera Grid 7 4
e =
√
2
3(ǫ2x + ǫ2y + ǫ2z) +
1
3(γ2
xy + γ2yz + γ2
xz) . (5.8)
This results in an equivalent strain rate of 5.7 × 10⁻⁴s-1 which is similar to that
used in the uniaxial tensile tests reported in Chapters 3 and 4.
The second important shear testing parameter is the lubrication of the shear fix-
ture. To reduce the friction between moving surfaces, dry graphite was used as a
lubricant and it was applied only to the moving surfaces of the shear fixture (ex-
cluding the gripping areas). These surfaces are marked with letter “L” in Figure 5.3.
Following the completion of each test, the fixture was fully cleaned using ethyl-alcohol
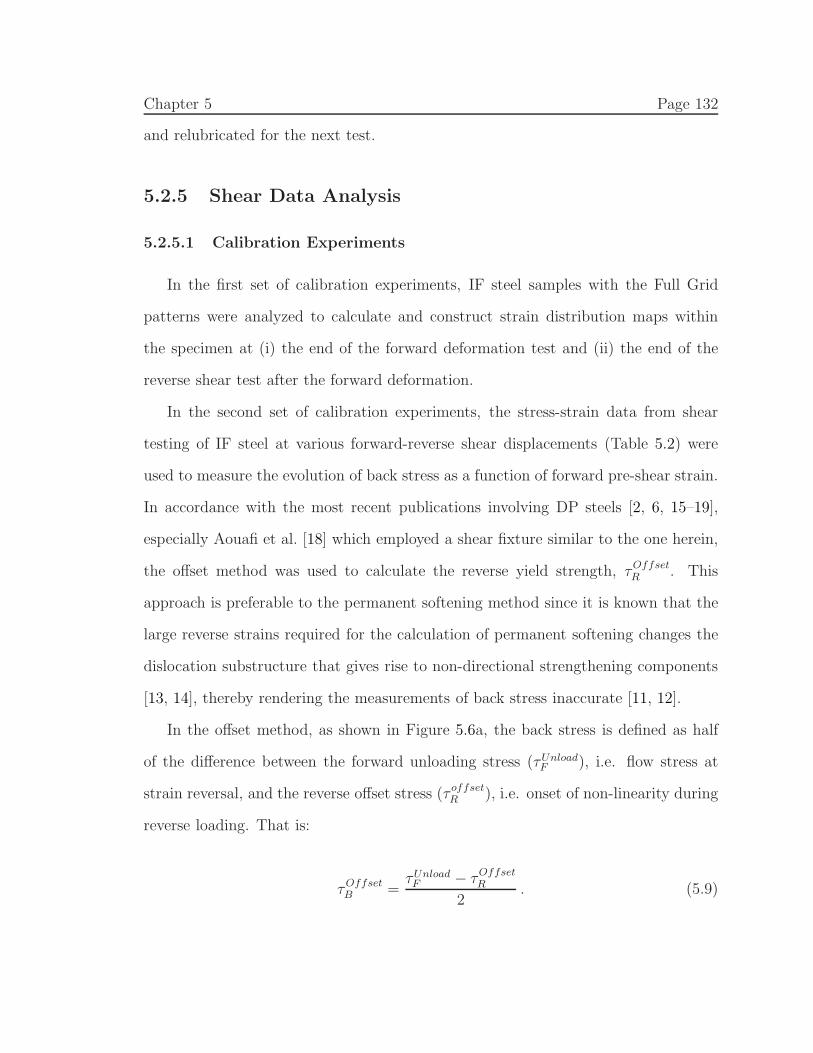
Chapter 5 Page 132
and relubricated for the next test.
5.2.5 Shear Data Analysis
5.2.5.1 Calibration Experiments
In the first set of calibration experiments, IF steel samples with the Full Grid
patterns were analyzed to calculate and construct strain distribution maps within
the specimen at (i) the end of the forward deformation test and (ii) the end of the
reverse shear test after the forward deformation.
In the second set of calibration experiments, the stress-strain data from shear
testing of IF steel at various forward-reverse shear displacements (Table 5.2) were
used to measure the evolution of back stress as a function of forward pre-shear strain.
In accordance with the most recent publications involving DP steels [2, 6, 15–19],
especially Aouafi et al. [18] which employed a shear fixture similar to the one herein,
the offset method was used to calculate the reverse yield strength, τOffsetR . This
approach is preferable to the permanent softening method since it is known that the
large reverse strains required for the calculation of permanent softening changes the
dislocation substructure that gives rise to non-directional strengthening components
[13, 14], thereby rendering the measurements of back stress inaccurate [11, 12].
In the offset method, as shown in Figure 5.6a, the back stress is defined as half
of the difference between the forward unloading stress (τUnloadF ), i.e. flow stress at
strain reversal, and the reverse offset stress (τ offsetR ), i.e. onset of non-linearity during
reverse loading. That is:
τOffsetB =
τUnloadF − τOffset
R
2. (5.9)
Chapter 5 Page 133
Three different strain offset values of 0.0005, 0.001 and 0.002 were used to in-
vestigate the effect of offset amount on the measurements of back stress. Note that
in plotting the stress-strain data, the choice of the shear strain type, i.e. raw (from
crosshead displacement data) versus real (from grid point data), can be important as
the slope of the elastic region can be affected. However, in the offset method, used to
calculate the onset of the non-linearity, the absolute value of the elastic region’s slope
is not crucial; it is the deviation from the linearity that is of interest. Therefore, for
consistency, the raw shear stress-strain data were used to calculate the reverse offset
stresses in all specimens. Additionally, for each sample, the real forward pre-shear
strains were also measured from the the grid patterns at the end of the forward defor-
mation, i.e. forward unloading point, as described in Section 5.2.3. The back stress
data were then plotted with respect to the real forward pre-shear strains.
A second method to analyze the forward and reverse shear data is to measure the
differences between the forward, σF , and the reverse, σR, flow curves, i.e. τF − τR.
This analysis technique is referred to henceforth as the “Softening Method” and its
details are shown in Figure 5.6b. The softening curves (τF − τR) were calculated
for all forward pre-shear experiments and the results were plotted with respect to
the reverse shear strains (see Figure 5.6b for the definition of reverse shear strain).
Note that the softening curves are useful since they show both the effects of transient
softening (at small reverse shear strains) and permanent softening (at large reverse
shear strains where the forward and the reverse flow curves become parallel).
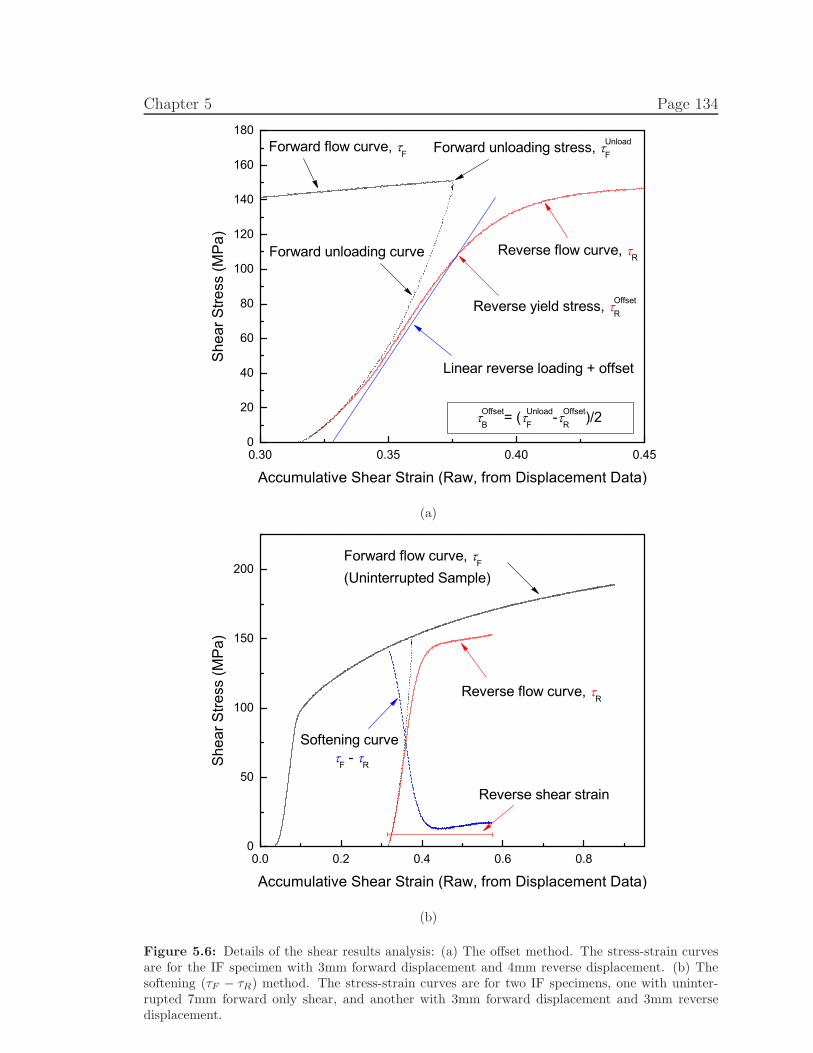
Chapter 5 Page 134
0.30 0.35 0.40 0.450
20
40
60
80
100
120
140
160
180
OffsetB
= ( UnloadF
- OffsetR
)/2
She
ar S
tress
(MP
a)
Accumulative Shear Strain (Raw, from Displacement Data)
Forward unloading curve
Reverse flow curve, R
Reverse yield stress, OffsetR
Linear reverse loading + offset
Forward unloading stress, UnloadF
Forward flow curve, F
(a)
0.0 0.2 0.4 0.6 0.80
50
100
150
200
Reverse shear strain
She
ar S
tress
(MP
a)
Accumulative Shear Strain (Raw, from Displacement Data)
Softening curve F -
R
Reverse flow curve, R
Forward flow curve, F
(Uninterrupted Sample)
(b)
Figure 5.6: Details of the shear results analysis: (a) The offset method. The stress-strain curvesare for the IF specimen with 3mm forward displacement and 4mm reverse displacement. (b) Thesoftening (τF − τR) method. The stress-strain curves are for two IF specimens, one with uninter-rupted 7mm forward only shear, and another with 3mm forward displacement and 3mm reversedisplacement.
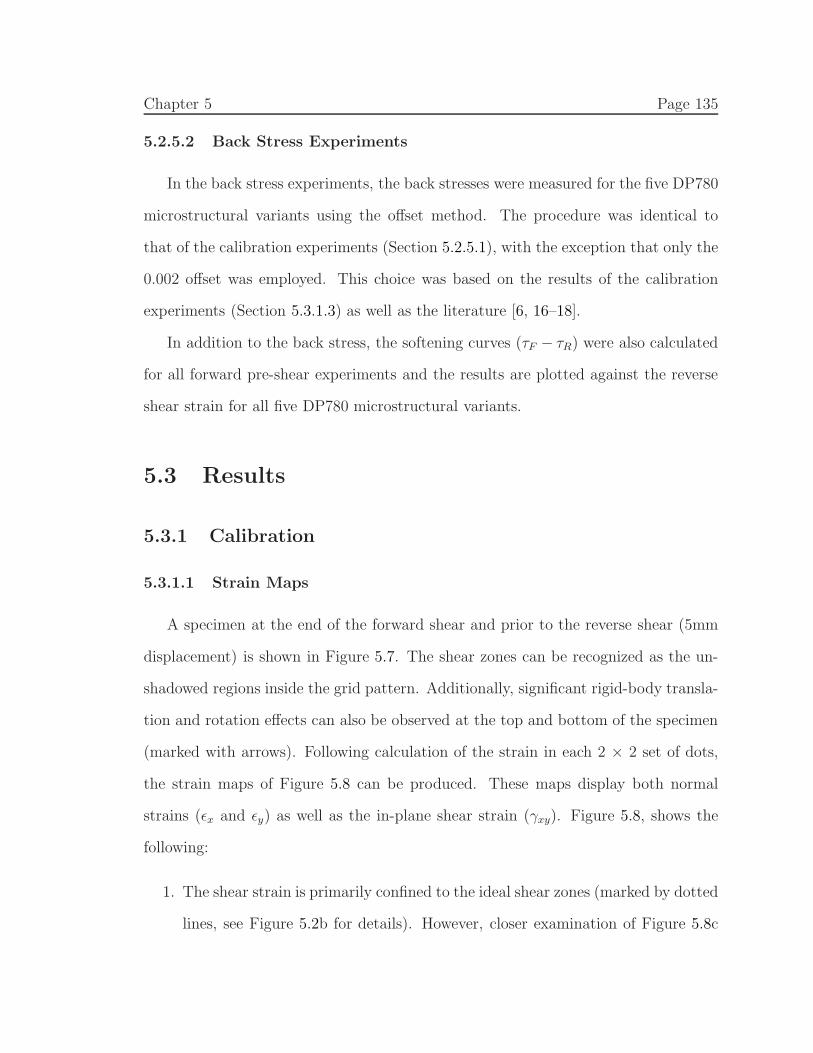
Chapter 5 Page 135
5.2.5.2 Back Stress Experiments
In the back stress experiments, the back stresses were measured for the five DP780
microstructural variants using the offset method. The procedure was identical to
that of the calibration experiments (Section 5.2.5.1), with the exception that only the
0.002 offset was employed. This choice was based on the results of the calibration
experiments (Section 5.3.1.3) as well as the literature [6, 16–18].
In addition to the back stress, the softening curves (τF − τR) were also calculated
for all forward pre-shear experiments and the results are plotted against the reverse
shear strain for all five DP780 microstructural variants.
5.3 Results
5.3.1 Calibration
5.3.1.1 Strain Maps
A specimen at the end of the forward shear and prior to the reverse shear (5mm
displacement) is shown in Figure 5.7. The shear zones can be recognized as the un-
shadowed regions inside the grid pattern. Additionally, significant rigid-body transla-
tion and rotation effects can also be observed at the top and bottom of the specimen
(marked with arrows). Following calculation of the strain in each 2 × 2 set of dots,
the strain maps of Figure 5.8 can be produced. These maps display both normal
strains (ǫx and ǫy) as well as the in-plane shear strain (γxy). Figure 5.8, shows the
following:
1. The shear strain is primarily confined to the ideal shear zones (marked by dotted
lines, see Figure 5.2b for details). However, closer examination of Figure 5.8c
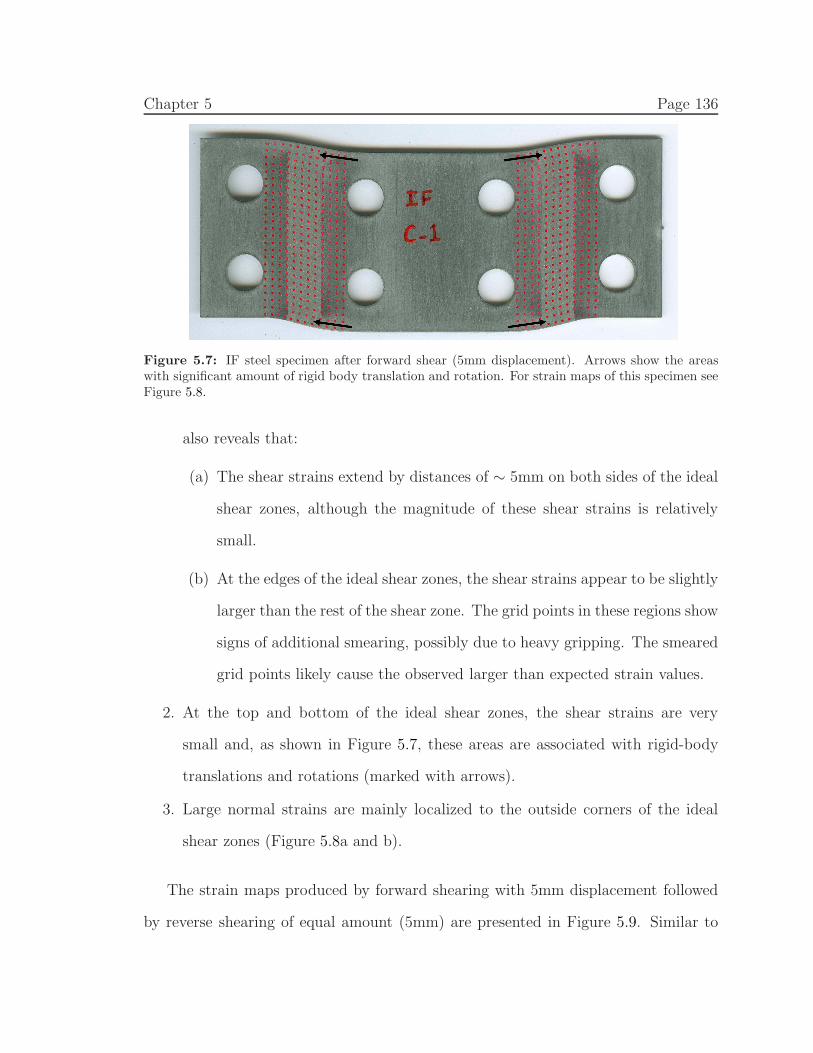
Chapter 5 Page 136
Figure 5.7: IF steel specimen after forward shear (5mm displacement). Arrows show the areaswith significant amount of rigid body translation and rotation. For strain maps of this specimen seeFigure 5.8.
also reveals that:
(a) The shear strains extend by distances of ∼ 5mm on both sides of the ideal
shear zones, although the magnitude of these shear strains is relatively
small.
(b) At the edges of the ideal shear zones, the shear strains appear to be slightly
larger than the rest of the shear zone. The grid points in these regions show
signs of additional smearing, possibly due to heavy gripping. The smeared
grid points likely cause the observed larger than expected strain values.
2. At the top and bottom of the ideal shear zones, the shear strains are very
small and, as shown in Figure 5.7, these areas are associated with rigid-body
translations and rotations (marked with arrows).
3. Large normal strains are mainly localized to the outside corners of the ideal
shear zones (Figure 5.8a and b).
The strain maps produced by forward shearing with 5mm displacement followed
by reverse shearing of equal amount (5mm) are presented in Figure 5.9. Similar to
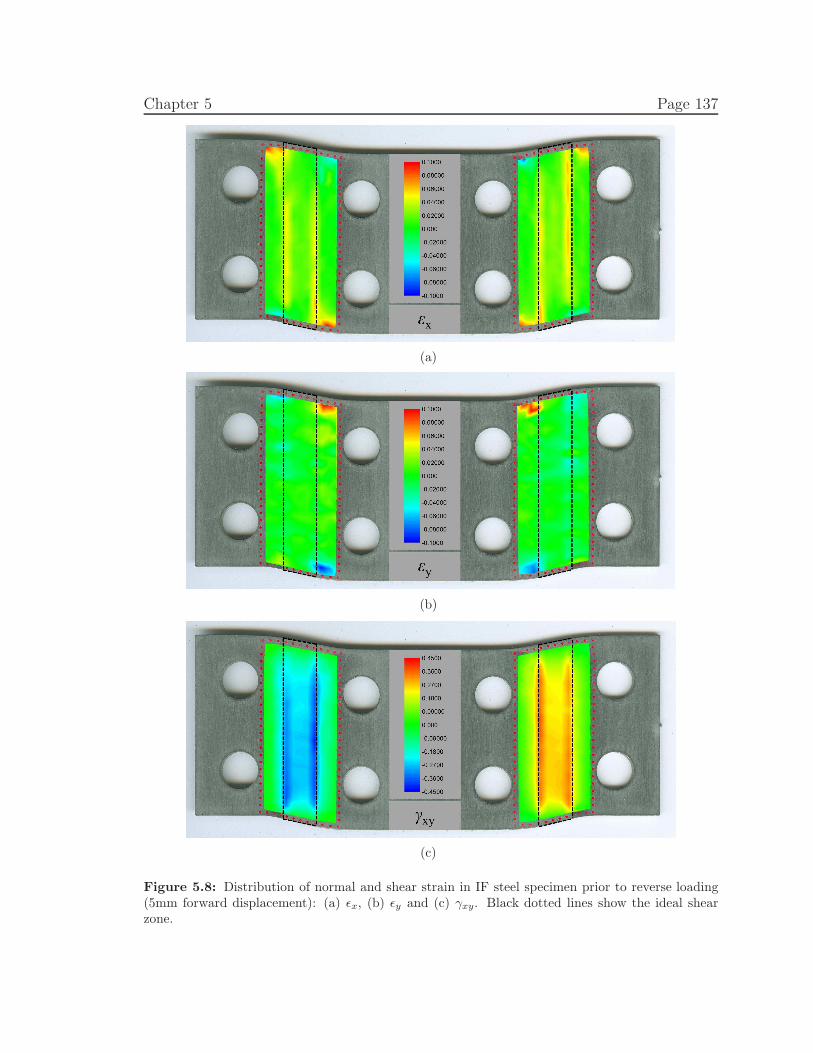
Chapter 5 Page 137
(a)
(b)
(c)
Figure 5.8: Distribution of normal and shear strain in IF steel specimen prior to reverse loading(5mm forward displacement): (a) ǫx, (b) ǫy and (c) γxy. Black dotted lines show the ideal shearzone.
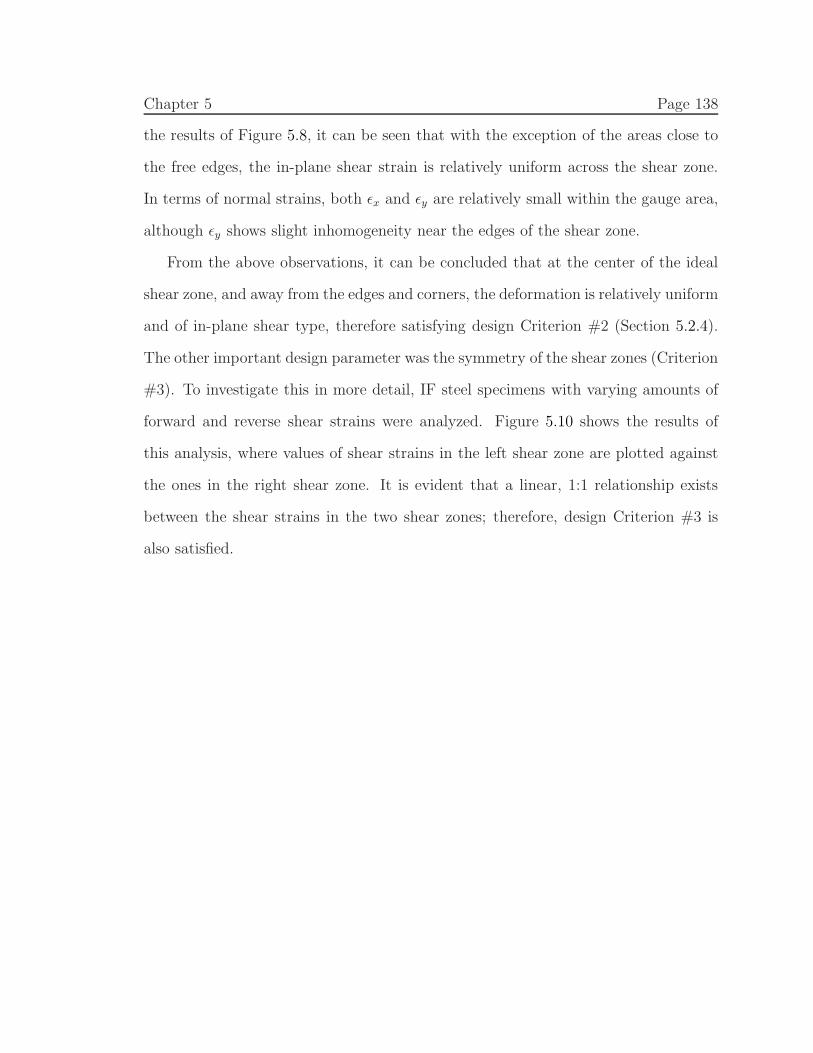
Chapter 5 Page 138
the results of Figure 5.8, it can be seen that with the exception of the areas close to
the free edges, the in-plane shear strain is relatively uniform across the shear zone.
In terms of normal strains, both ǫx and ǫy are relatively small within the gauge area,
although ǫy shows slight inhomogeneity near the edges of the shear zone.
From the above observations, it can be concluded that at the center of the ideal
shear zone, and away from the edges and corners, the deformation is relatively uniform
and of in-plane shear type, therefore satisfying design Criterion #2 (Section 5.2.4).
The other important design parameter was the symmetry of the shear zones (Criterion
#3). To investigate this in more detail, IF steel specimens with varying amounts of
forward and reverse shear strains were analyzed. Figure 5.10 shows the results of
this analysis, where values of shear strains in the left shear zone are plotted against
the ones in the right shear zone. It is evident that a linear, 1:1 relationship exists
between the shear strains in the two shear zones; therefore, design Criterion #3 is
also satisfied.
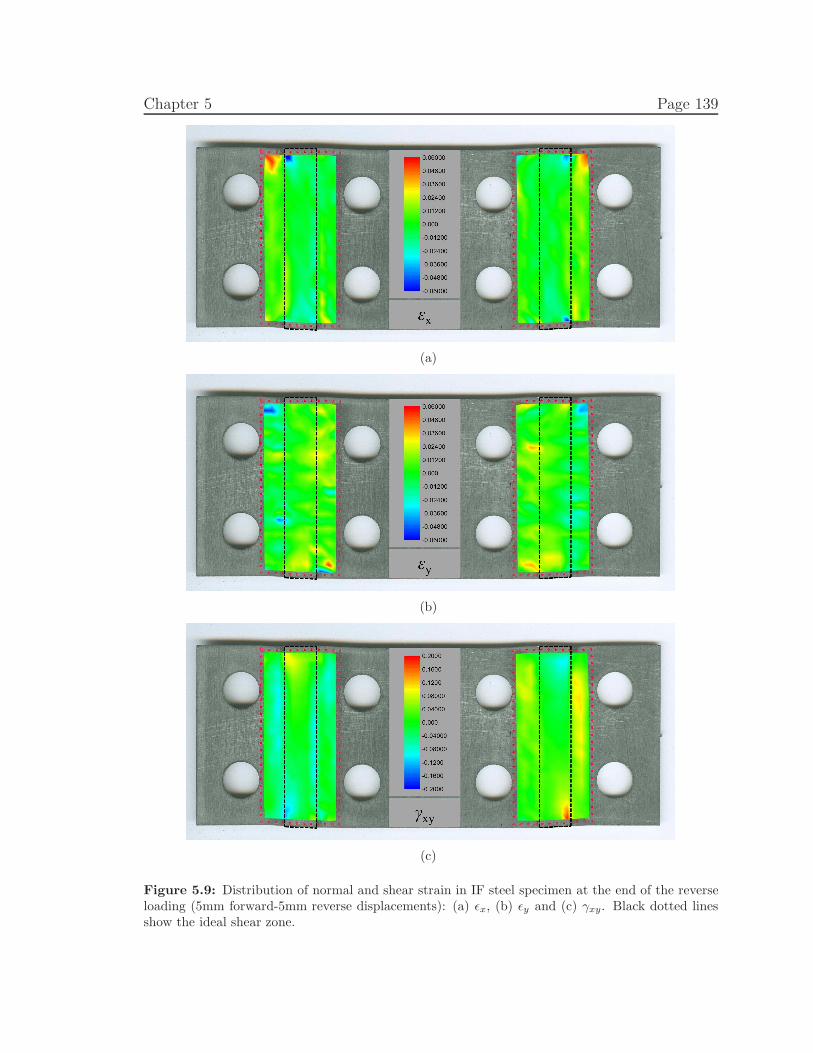
Chapter 5 Page 139
(a)
(b)
(c)
Figure 5.9: Distribution of normal and shear strain in IF steel specimen at the end of the reverseloading (5mm forward-5mm reverse displacements): (a) ǫx, (b) ǫy and (c) γxy. Black dotted linesshow the ideal shear zone.
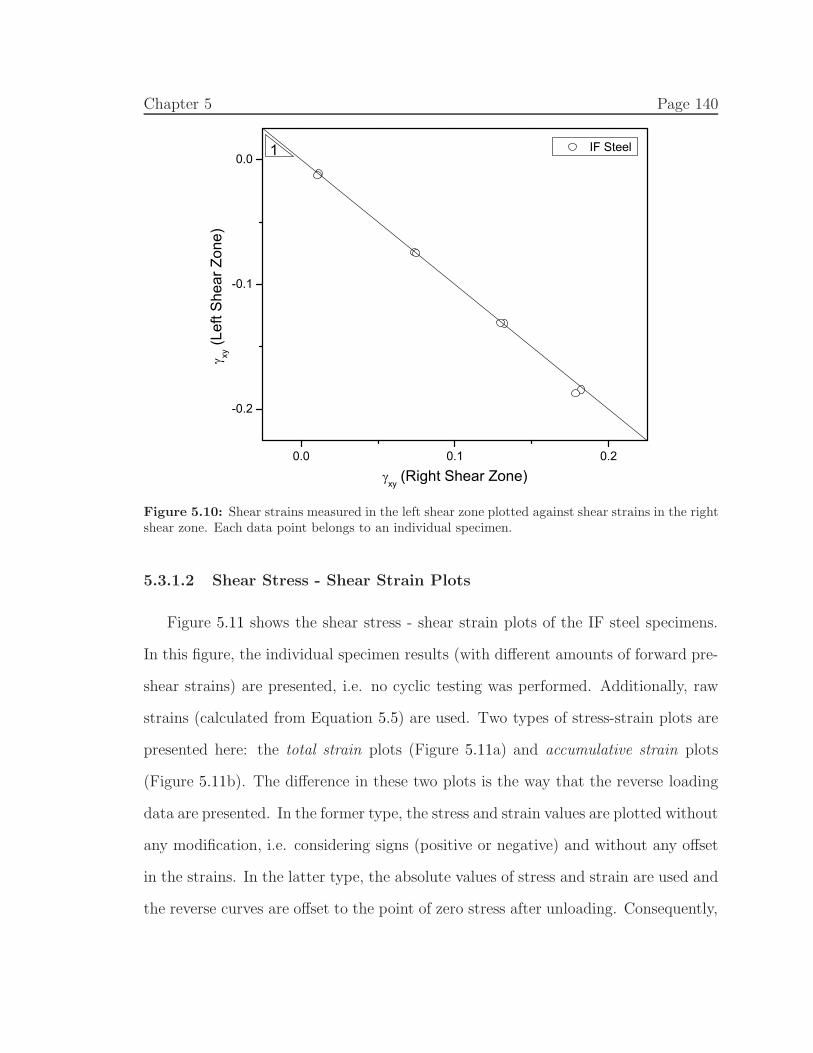
Chapter 5 Page 140
0.0 0.1 0.2
-0.2
-0.1
0.0
xy (Right Shear Zone)
xy (L
eft S
hear
Zon
e)
IF Steel1
Figure 5.10: Shear strains measured in the left shear zone plotted against shear strains in the rightshear zone. Each data point belongs to an individual specimen.
5.3.1.2 Shear Stress - Shear Strain Plots
Figure 5.11 shows the shear stress - shear strain plots of the IF steel specimens.
In this figure, the individual specimen results (with different amounts of forward pre-
shear strains) are presented, i.e. no cyclic testing was performed. Additionally, raw
strains (calculated from Equation 5.5) are used. Two types of stress-strain plots are
presented here: the total strain plots (Figure 5.11a) and accumulative strain plots
(Figure 5.11b). The difference in these two plots is the way that the reverse loading
data are presented. In the former type, the stress and strain values are plotted without
any modification, i.e. considering signs (positive or negative) and without any offset
in the strains. In the latter type, the absolute values of stress and strain are used and
the reverse curves are offset to the point of zero stress after unloading. Consequently,
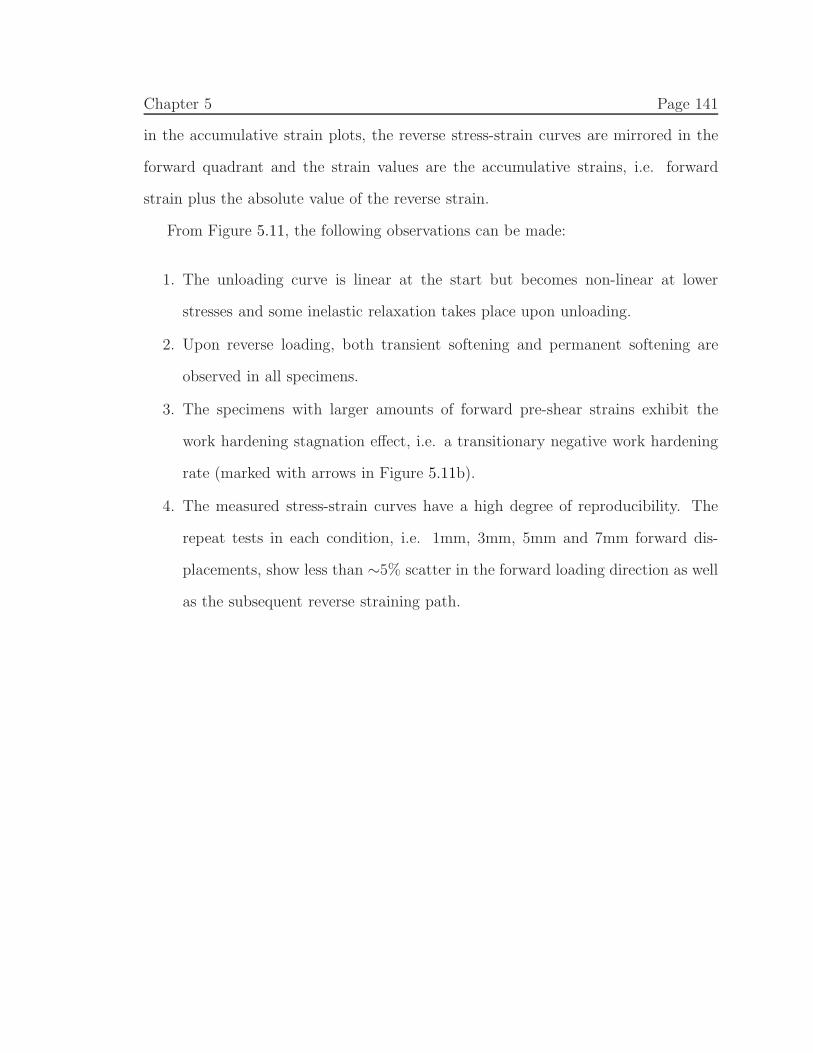
Chapter 5 Page 141
in the accumulative strain plots, the reverse stress-strain curves are mirrored in the
forward quadrant and the strain values are the accumulative strains, i.e. forward
strain plus the absolute value of the reverse strain.
From Figure 5.11, the following observations can be made:
1. The unloading curve is linear at the start but becomes non-linear at lower
stresses and some inelastic relaxation takes place upon unloading.
2. Upon reverse loading, both transient softening and permanent softening are
observed in all specimens.
3. The specimens with larger amounts of forward pre-shear strains exhibit the
work hardening stagnation effect, i.e. a transitionary negative work hardening
rate (marked with arrows in Figure 5.11b).
4. The measured stress-strain curves have a high degree of reproducibility. The
repeat tests in each condition, i.e. 1mm, 3mm, 5mm and 7mm forward dis-
placements, show less than ∼5% scatter in the forward loading direction as well
as the subsequent reverse straining path.
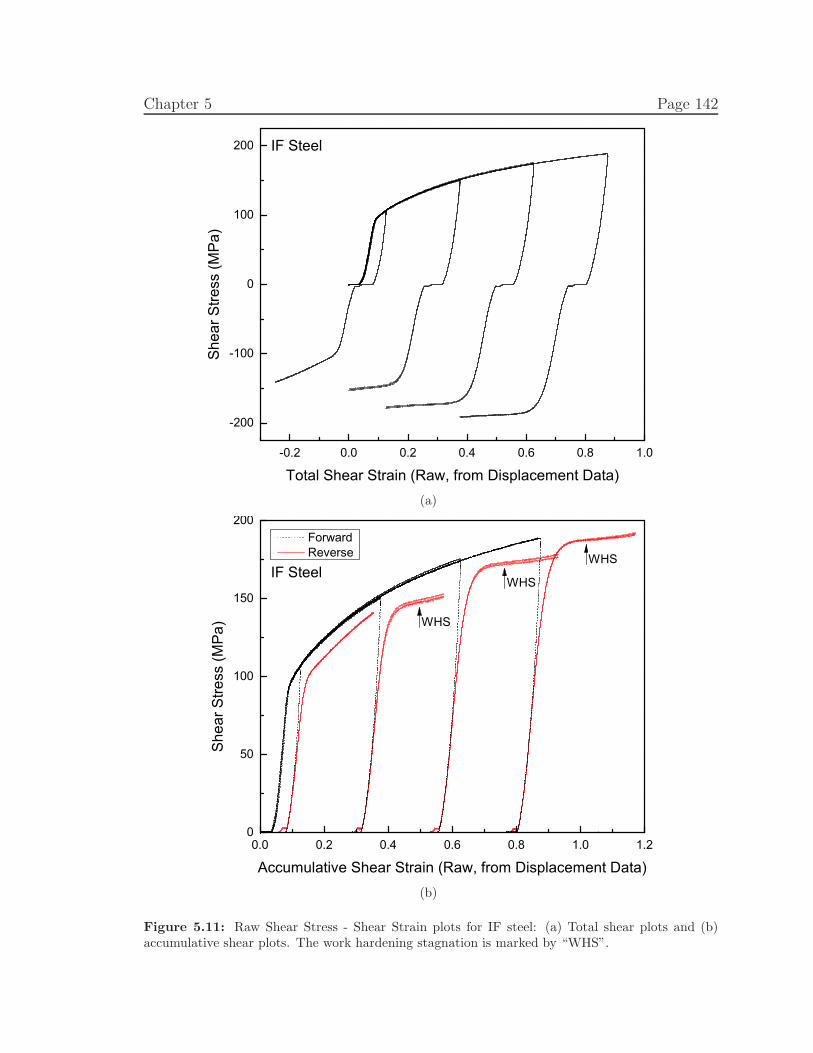
Chapter 5 Page 142
-0.2 0.0 0.2 0.4 0.6 0.8 1.0
-200
-100
0
100
200 IF Steel
She
ar S
tress
(MP
a)
Total Shear Strain (Raw, from Displacement Data)(a)
0.0 0.2 0.4 0.6 0.8 1.0 1.20
50
100
150
200
IF Steel
Forward Reverse
She
ar S
tress
(MP
a)
Accumulative Shear Strain (Raw, from Displacement Data)
WHS
WHS
WHS
(b)
Figure 5.11: Raw Shear Stress - Shear Strain plots for IF steel: (a) Total shear plots and (b)accumulative shear plots. The work hardening stagnation is marked by “WHS”.
Chapter 5 Page 143
5.3.1.3 Back Stress Calculations
For the calibration experiments, three different offset values of 0.0005, 0.001 and
0.002 were used to calculate the back stress in the calibration experiments. Figure
5.12 presents the measured back stress values with respect to the real forward pre-
shear values (obtained from grid point data) for all IF steel calibration specimens.
The following observations can be made:
1. The back stress is an increasing function of the forward pre-shear strain. The
rate of increase is relatively high at small pre-strains and it decreases at higher
pre-strains.
2. The measured back stress depends on the offset value. Larger offset values
result in smaller back stresses. A total difference of ∼10 MPa can be observed
between the back stresses measured using the 0.0005 and 0.002 offsets.
3.
4. The measured back stresses have a high degree of reproducibility, i.e. less than
∼10% scatter in each of the pre-shear strain conditions.
The back stress results presented here are comparable with previously published
data in the literature [6, 16–18] in terms of both the magnitude and the trend with
respect to the amount of pre-shear strain.
In the literature, the 0.0005 and 0.001 offset values are commonly used to deter-
mine the back stress [6, 16–18]. Comparing raw and real shear strains in the present
study, these offset values translate into ∼0.002 raw shear. For this reason, and since
the offset value does not change the overall trends between back stress and pre-shear
strain (Figure 5.12), only the offset value of 0.002 is used to measure back stress in
the “Back Stress Experiments” (Section 5.3.2).
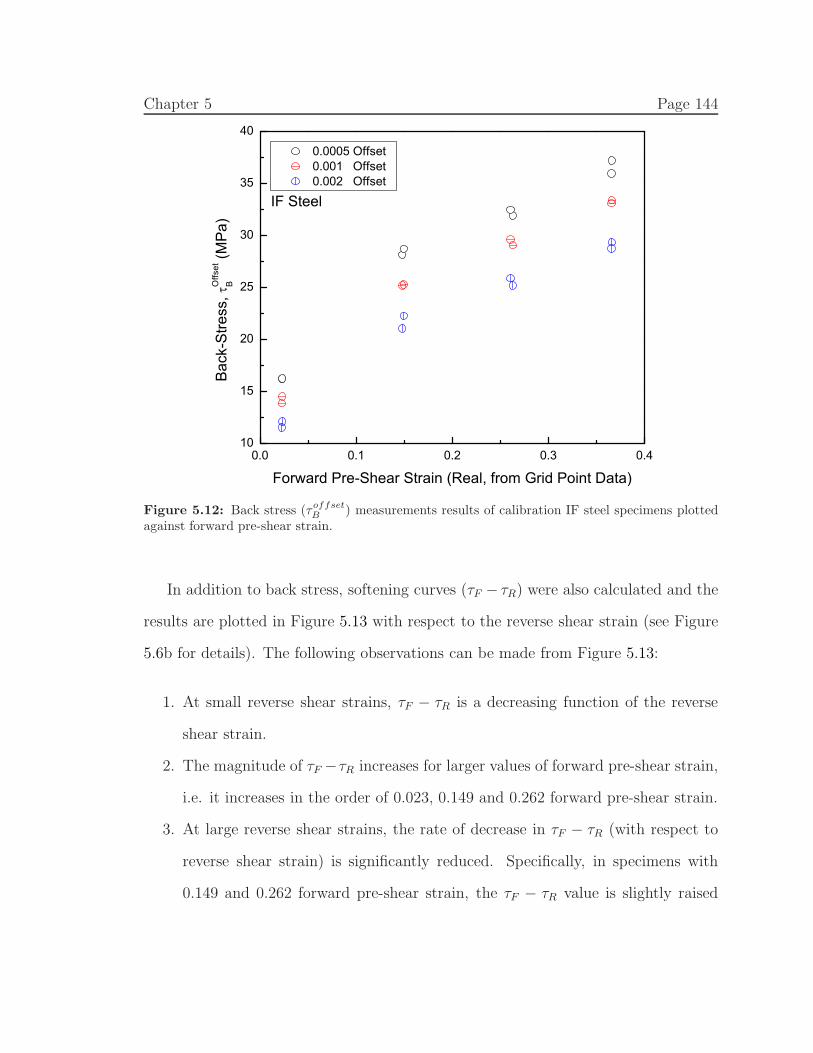
Chapter 5 Page 144
0.0 0.1 0.2 0.3 0.410
15
20
25
30
35
40
IF SteelB
ack-
Stre
ss,
Offs
etB
(MP
a)
Forward Pre-Shear Strain (Real, from Grid Point Data)
0.0005 Offset 0.001 Offset 0.002 Offset
Figure 5.12: Back stress (τoffsetB ) measurements results of calibration IF steel specimens plottedagainst forward pre-shear strain.
In addition to back stress, softening curves (τF − τR) were also calculated and the
results are plotted in Figure 5.13 with respect to the reverse shear strain (see Figure
5.6b for details). The following observations can be made from Figure 5.13:
1. At small reverse shear strains, τF − τR is a decreasing function of the reverse
shear strain.
2. The magnitude of τF −τR increases for larger values of forward pre-shear strain,
i.e. it increases in the order of 0.023, 0.149 and 0.262 forward pre-shear strain.
3. At large reverse shear strains, the rate of decrease in τF − τR (with respect to
reverse shear strain) is significantly reduced. Specifically, in specimens with
0.149 and 0.262 forward pre-shear strain, the τF − τR value is slightly raised
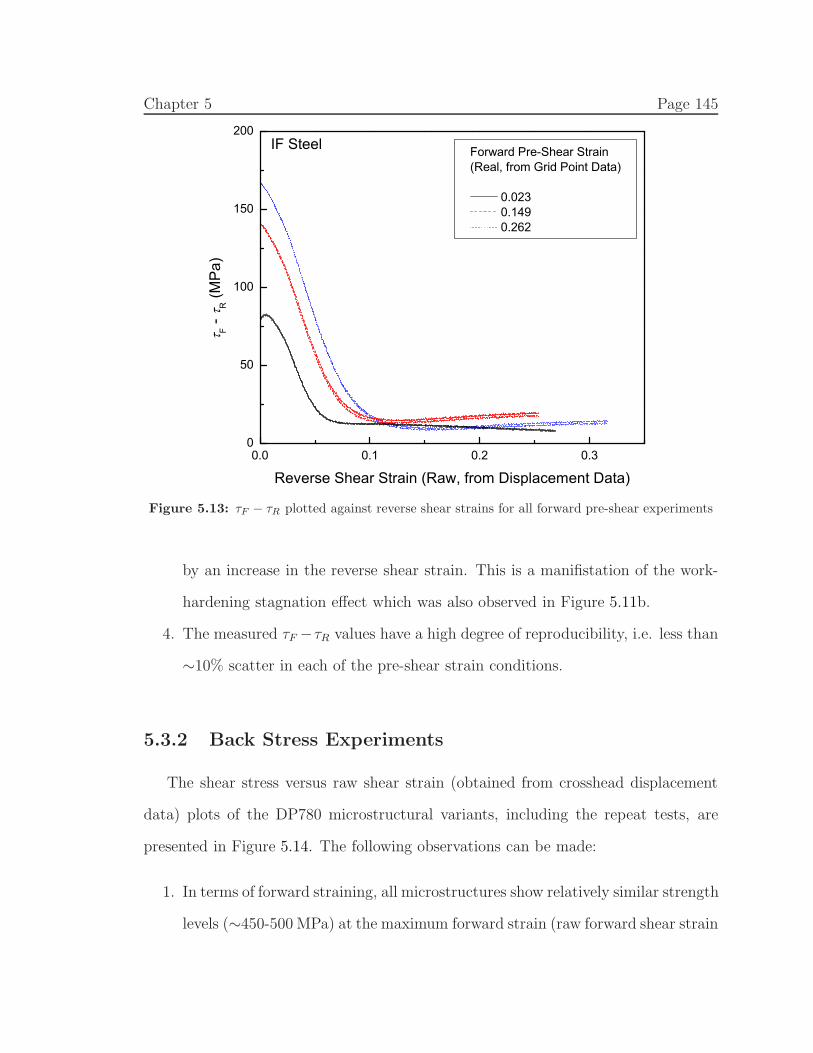
Chapter 5 Page 145
0.0 0.1 0.2 0.30
50
100
150
200
Forward Pre-Shear Strain(Real, from Grid Point Data)
0.023 0.149 0.262
IF Steel
F - R (M
Pa)
Reverse Shear Strain (Raw, from Displacement Data)
Figure 5.13: τF − τR plotted against reverse shear strains for all forward pre-shear experiments
by an increase in the reverse shear strain. This is a manifistation of the work-
hardening stagnation effect which was also observed in Figure 5.11b.
4. The measured τF −τR values have a high degree of reproducibility, i.e. less than
∼10% scatter in each of the pre-shear strain conditions.
5.3.2 Back Stress Experiments
The shear stress versus raw shear strain (obtained from crosshead displacement
data) plots of the DP780 microstructural variants, including the repeat tests, are
presented in Figure 5.14. The following observations can be made:
1. In terms of forward straining, all microstructures show relatively similar strength
levels (∼450-500 MPa) at the maximum forward strain (raw forward shear strain
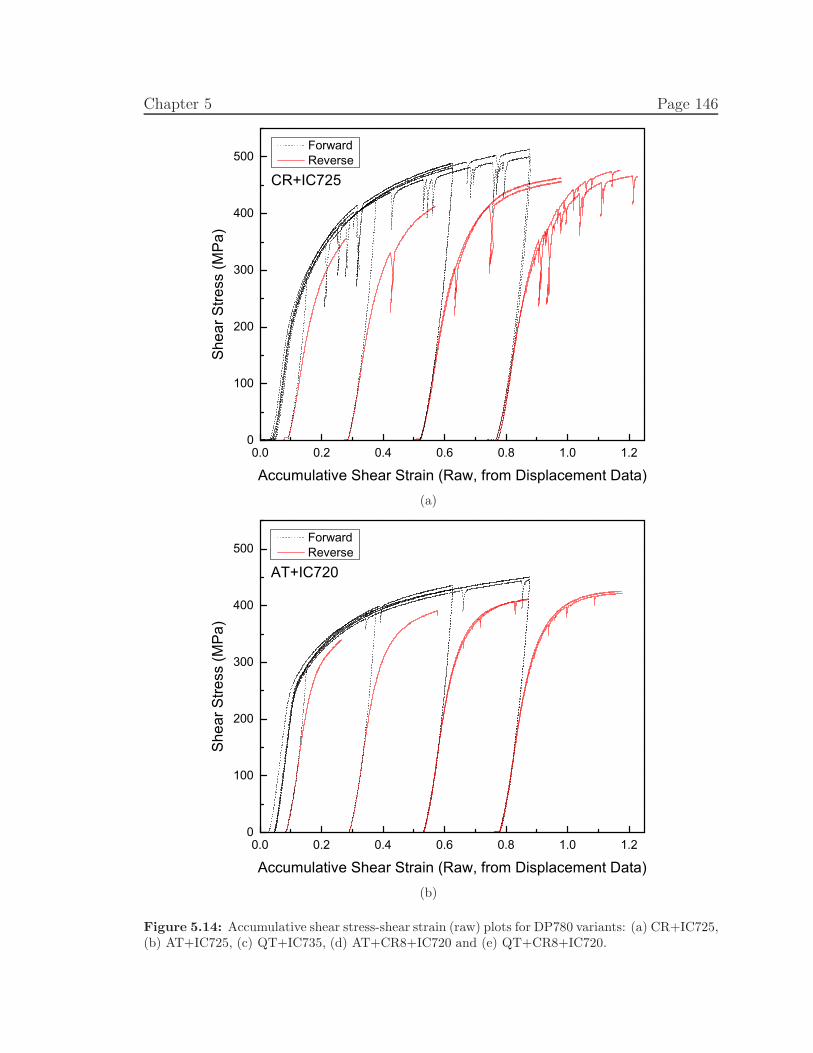
Chapter 5 Page 146
0.0 0.2 0.4 0.6 0.8 1.0 1.20
100
200
300
400
500
She
ar S
tress
(MP
a)
Accumulative Shear Strain (Raw, from Displacement Data)
CR+IC725
Forward Reverse
(a)
0.0 0.2 0.4 0.6 0.8 1.0 1.20
100
200
300
400
500
She
ar S
tress
(MP
a)
Accumulative Shear Strain (Raw, from Displacement Data)
AT+IC720
Forward Reverse
(b)
Figure 5.14: Accumulative shear stress-shear strain (raw) plots for DP780 variants: (a) CR+IC725,(b) AT+IC725, (c) QT+IC735, (d) AT+CR8+IC720 and (e) QT+CR8+IC720.
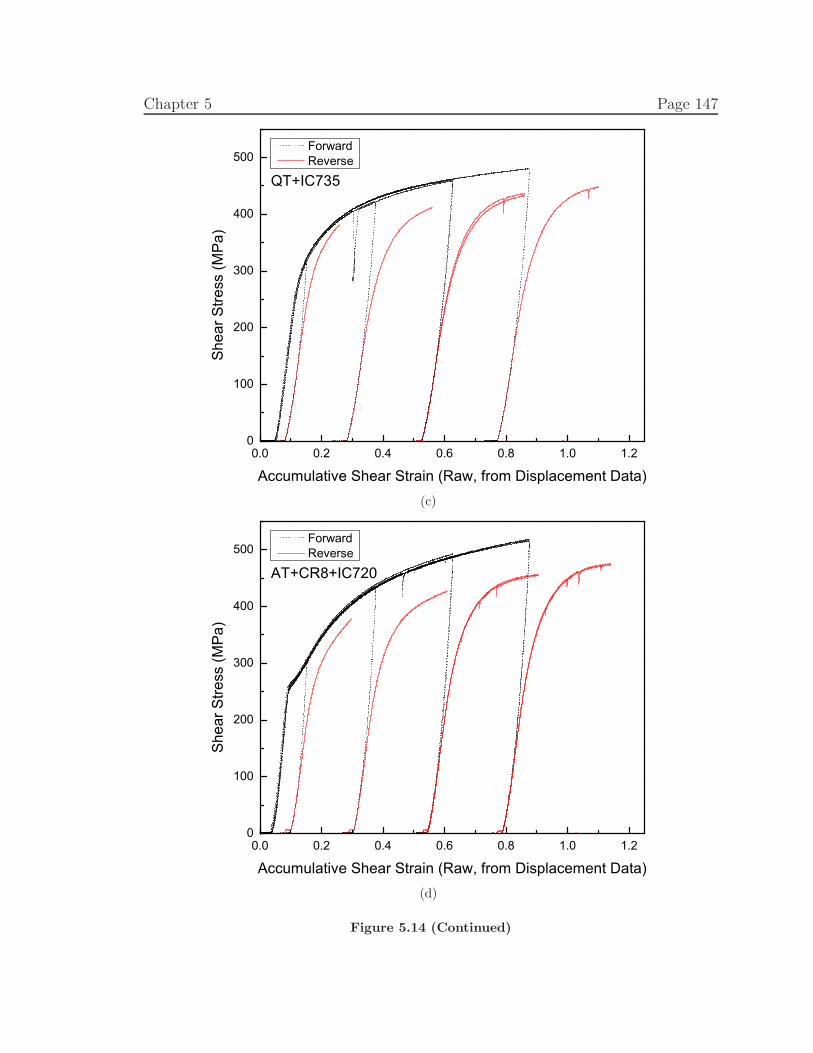
Chapter 5 Page 147
0.0 0.2 0.4 0.6 0.8 1.0 1.20
100
200
300
400
500
She
ar S
tress
(MP
a)
Accumulative Shear Strain (Raw, from Displacement Data)
QT+IC735
Forward Reverse
(c)
0.0 0.2 0.4 0.6 0.8 1.0 1.20
100
200
300
400
500
She
ar S
tress
(MP
a)
Accumulative Shear Strain (Raw, from Displacement Data)
AT+CR8+IC720
Forward Reverse
(d)
Figure 5.14 (Continued)
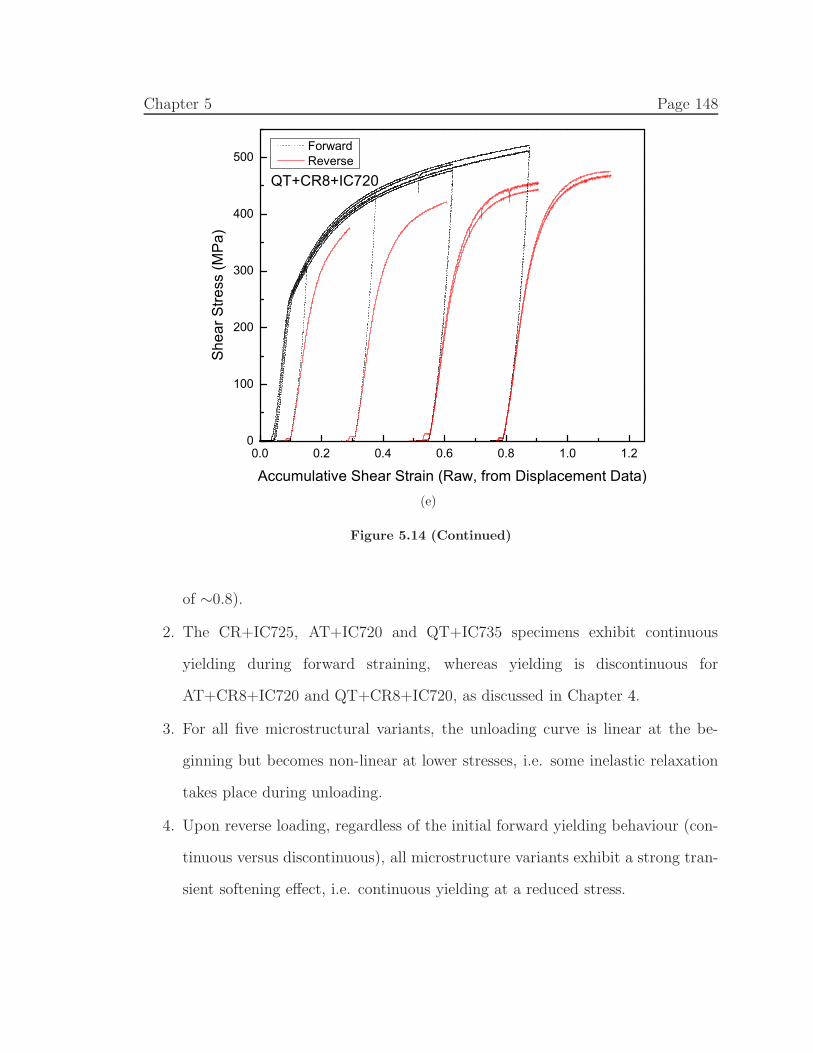
Chapter 5 Page 148
0.0 0.2 0.4 0.6 0.8 1.0 1.20
100
200
300
400
500
She
ar S
tress
(MP
a)
Accumulative Shear Strain (Raw, from Displacement Data)
QT+CR8+IC720
Forward Reverse
(e)
Figure 5.14 (Continued)
of ∼0.8).
2. The CR+IC725, AT+IC720 and QT+IC735 specimens exhibit continuous
yielding during forward straining, whereas yielding is discontinuous for
AT+CR8+IC720 and QT+CR8+IC720, as discussed in Chapter 4.
3. For all five microstructural variants, the unloading curve is linear at the be-
ginning but becomes non-linear at lower stresses, i.e. some inelastic relaxation
takes place during unloading.
4. Upon reverse loading, regardless of the initial forward yielding behaviour (con-
tinuous versus discontinuous), all microstructure variants exhibit a strong tran-
sient softening effect, i.e. continuous yielding at a reduced stress.
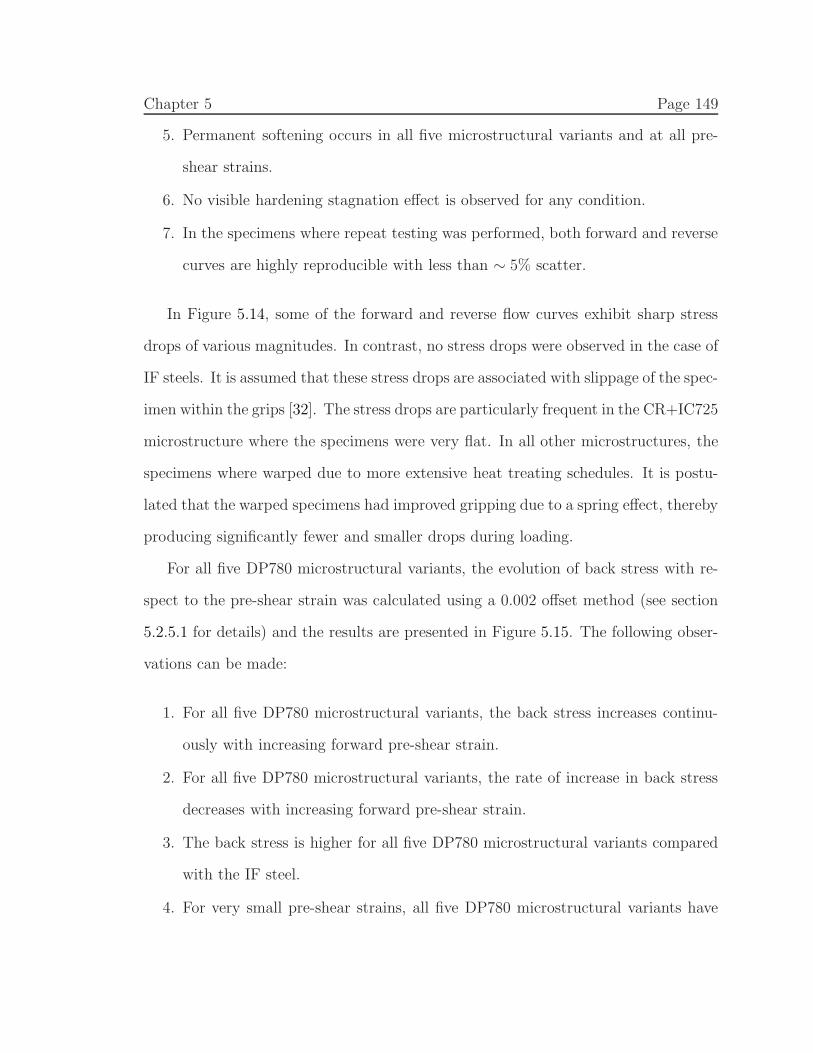
Chapter 5 Page 149
5. Permanent softening occurs in all five microstructural variants and at all pre-
shear strains.
6. No visible hardening stagnation effect is observed for any condition.
7. In the specimens where repeat testing was performed, both forward and reverse
curves are highly reproducible with less than ∼ 5% scatter.
In Figure 5.14, some of the forward and reverse flow curves exhibit sharp stress
drops of various magnitudes. In contrast, no stress drops were observed in the case of
IF steels. It is assumed that these stress drops are associated with slippage of the spec-
imen within the grips [32]. The stress drops are particularly frequent in the CR+IC725
microstructure where the specimens were very flat. In all other microstructures, the
specimens where warped due to more extensive heat treating schedules. It is postu-
lated that the warped specimens had improved gripping due to a spring effect, thereby
producing significantly fewer and smaller drops during loading.
For all five DP780 microstructural variants, the evolution of back stress with re-
spect to the pre-shear strain was calculated using a 0.002 offset method (see section
5.2.5.1 for details) and the results are presented in Figure 5.15. The following obser-
vations can be made:
1. For all five DP780 microstructural variants, the back stress increases continu-
ously with increasing forward pre-shear strain.
2. For all five DP780 microstructural variants, the rate of increase in back stress
decreases with increasing forward pre-shear strain.
3. The back stress is higher for all five DP780 microstructural variants compared
with the IF steel.
4. For very small pre-shear strains, all five DP780 microstructural variants have
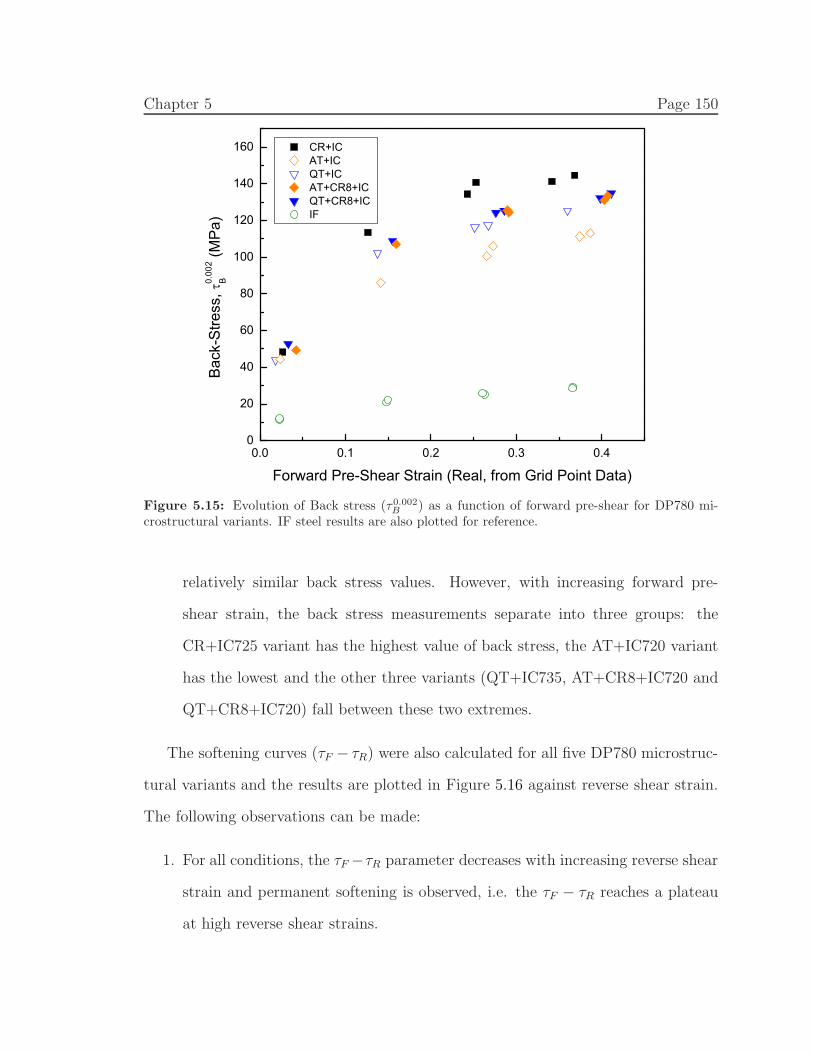
Chapter 5 Page 150
0.0 0.1 0.2 0.3 0.40
20
40
60
80
100
120
140
160
Bac
k-S
tress
, 0.
002
B (M
Pa)
Forward Pre-Shear Strain (Real, from Grid Point Data)
CR+IC AT+IC QT+IC AT+CR8+IC QT+CR8+IC IF
Figure 5.15: Evolution of Back stress (τ0.002B ) as a function of forward pre-shear for DP780 mi-crostructural variants. IF steel results are also plotted for reference.
relatively similar back stress values. However, with increasing forward pre-
shear strain, the back stress measurements separate into three groups: the
CR+IC725 variant has the highest value of back stress, the AT+IC720 variant
has the lowest and the other three variants (QT+IC735, AT+CR8+IC720 and
QT+CR8+IC720) fall between these two extremes.
The softening curves (τF − τR) were also calculated for all five DP780 microstruc-
tural variants and the results are plotted in Figure 5.16 against reverse shear strain.
The following observations can be made:
1. For all conditions, the τF −τR parameter decreases with increasing reverse shear
strain and permanent softening is observed, i.e. the τF − τR reaches a plateau
at high reverse shear strains.
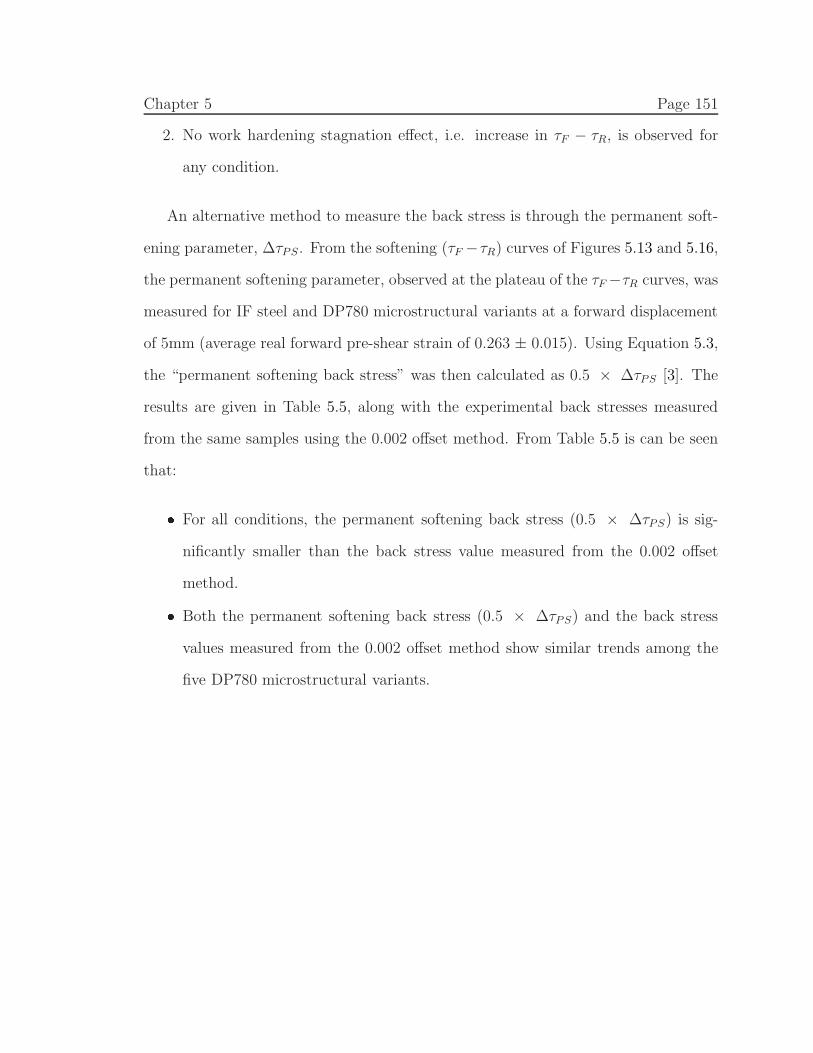
Chapter 5 Page 151
2. No work hardening stagnation effect, i.e. increase in τF − τR, is observed for
any condition.
An alternative method to measure the back stress is through the permanent soft-
ening parameter, ∆τPS. From the softening (τF −τR) curves of Figures 5.13 and 5.16,
the permanent softening parameter, observed at the plateau of the τF −τR curves, was
measured for IF steel and DP780 microstructural variants at a forward displacement
of 5mm (average real forward pre-shear strain of 0.263 ± 0.015). Using Equation 5.3,
the “permanent softening back stress” was then calculated as 0.5 × ∆τPS [3]. The
results are given in Table 5.5, along with the experimental back stresses measured
from the same samples using the 0.002 offset method. From Table 5.5 is can be seen
that:� For all conditions, the permanent softening back stress (0.5 × ∆τPS) is sig-
nificantly smaller than the back stress value measured from the 0.002 offset
method.� Both the permanent softening back stress (0.5 × ∆τPS) and the back stress
values measured from the 0.002 offset method show similar trends among the
five DP780 microstructural variants.
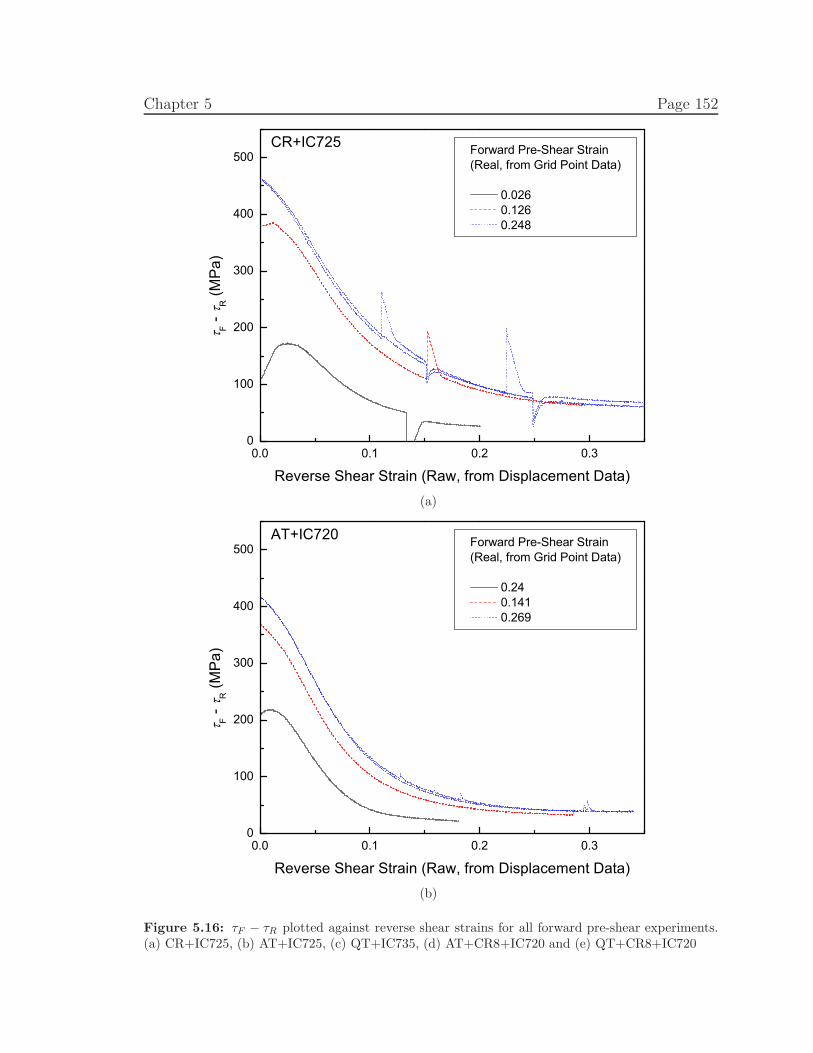
Chapter 5 Page 152
0.0 0.1 0.2 0.30
100
200
300
400
500 Forward Pre-Shear Strain(Real, from Grid Point Data)
0.026 0.126 0.248
CR+IC725
F - R (M
Pa)
Reverse Shear Strain (Raw, from Displacement Data)(a)
0.0 0.1 0.2 0.30
100
200
300
400
500 Forward Pre-Shear Strain(Real, from Grid Point Data)
0.24 0.141 0.269
F - R (M
Pa)
Reverse Shear Strain (Raw, from Displacement Data)
AT+IC720
(b)
Figure 5.16: τF − τR plotted against reverse shear strains for all forward pre-shear experiments.(a) CR+IC725, (b) AT+IC725, (c) QT+IC735, (d) AT+CR8+IC720 and (e) QT+CR8+IC720
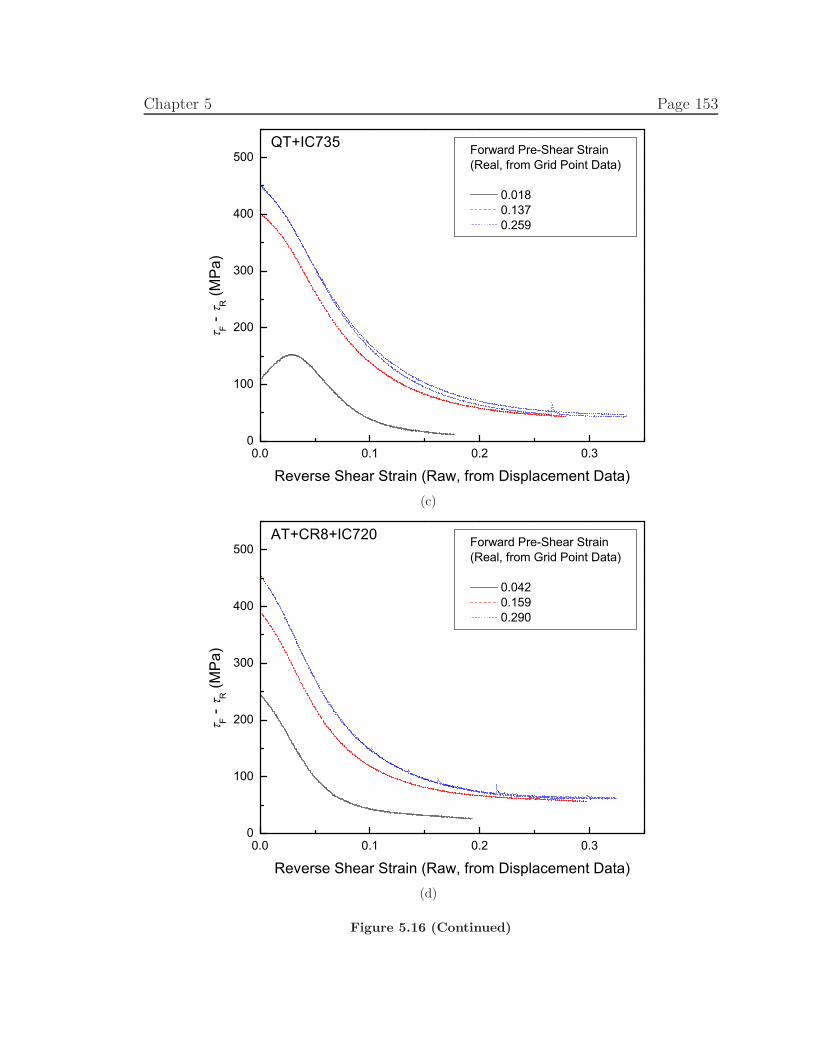
Chapter 5 Page 153
0.0 0.1 0.2 0.30
100
200
300
400
500 Forward Pre-Shear Strain(Real, from Grid Point Data)
0.018 0.137 0.259
QT+IC735
F - R (M
Pa)
Reverse Shear Strain (Raw, from Displacement Data)(c)
0.0 0.1 0.2 0.30
100
200
300
400
500 Forward Pre-Shear Strain(Real, from Grid Point Data)
0.042 0.159 0.290
AT+CR8+IC720
F - R (M
Pa)
Reverse Shear Strain (Raw, from Displacement Data)(d)
Figure 5.16 (Continued)
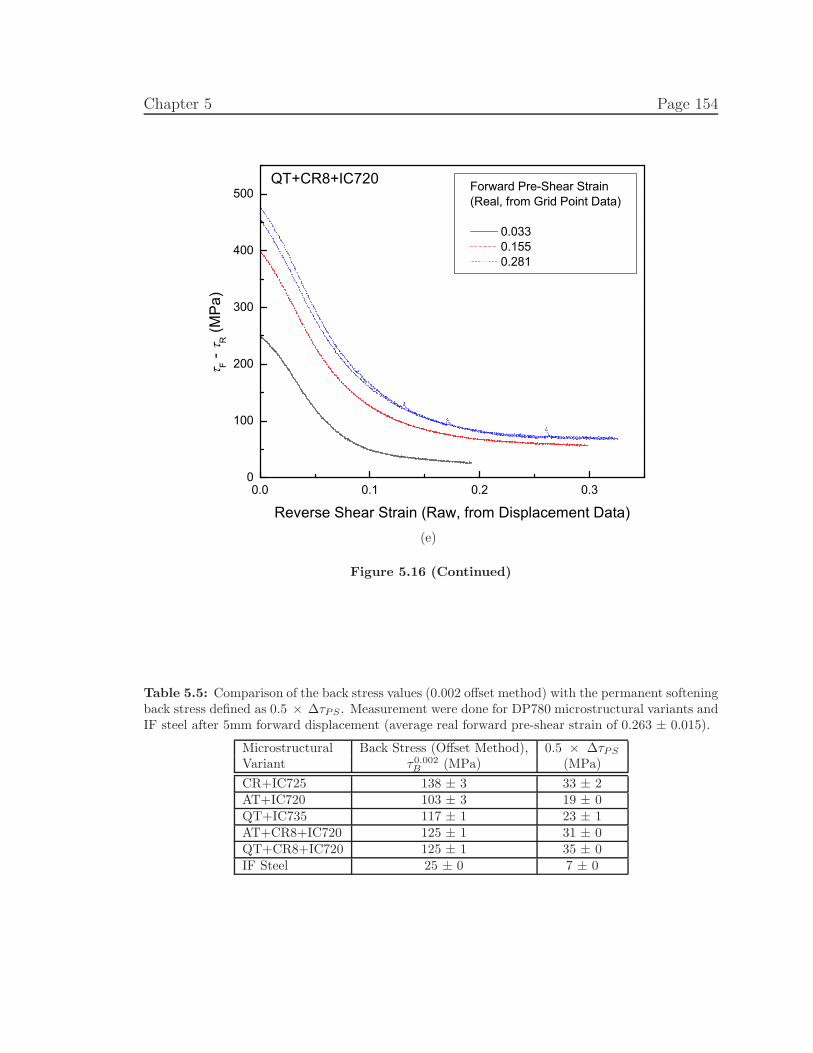
Chapter 5 Page 154
0.0 0.1 0.2 0.30
100
200
300
400
500 Forward Pre-Shear Strain(Real, from Grid Point Data)
0.033 0.155 0.281
QT+CR8+IC720
F - R (M
Pa)
Reverse Shear Strain (Raw, from Displacement Data)(e)
Figure 5.16 (Continued)
Table 5.5: Comparison of the back stress values (0.002 offset method) with the permanent softeningback stress defined as 0.5 × ∆τPS . Measurement were done for DP780 microstructural variants andIF steel after 5mm forward displacement (average real forward pre-shear strain of 0.263 ± 0.015).
Microstructural Back Stress (Offset Method), 0.5 × ∆τPS
Variant τ0.002B (MPa) (MPa)
CR+IC725 138 ± 3 33 ± 2AT+IC720 103 ± 3 19 ± 0QT+IC735 117 ± 1 23 ± 1AT+CR8+IC720 125 ± 1 31 ± 0QT+CR8+IC720 125 ± 1 35 ± 0IF Steel 25 ± 0 7 ± 0
Chapter 5 Page 155
5.4 Discussion
As shown in Figure 5.15, the back stress is an increasing function of the pre-shear
strain in all specimens, i.e. IF steel as well as five DP780 microstructural variants. The
rate of increase in back stress, however, decreases at larger forward pre-shear strain.
Using the Brown and Stobbs model [28], this decreased rate of change is associated
with the establishment of plastic relaxation effects such as the introduction of GNDs
near hard particles. Plastic relaxation is often not complete, such that the unrelaxed
portion of plastic strain results in the development of additional back stress [3, 27, 31]
through Equation 5.4. In addition to back stress effects, plastic relaxation of elastic
stresses through the generation of GNDs also produces significant work hardening in
the matrix; therefore, this contribution should be accounted for using Ashby’s GND
hardening theory, as previously done in Chapters 3 and 4.
To compare the measured back stresses with the Brown and Stobbs (B & S) model
[3, 27, 31], Equation 5.4 was applied to all five DP780 microstructural variants at the
forward pre-shear strains associated with a forward displacement of 5mm (average real
shear strain of 0.263 ± 0.015). For the volume fraction (f) and size (d) of martensite
particles, the values given in Table 5.3 were used, along with the following values:
α = 0.35 (halfway within the range of 0.3-0.4 [34–38]), µ = 80 GPa [35], b = 2.48×10¹⁰
m [38], and φ ≈ 0.5 [27]. The calculated back stress values of the B & S model are
listed in Table 5.6, alongside the experimentally measured back stress values (using
a 0.002 offset method). It is evident that in all five DP780 microstructural variants,
the experimentally measured back stresses fall within the range of the B & S model
predictions. This observation also supports the choice of a 0.002 offset strain in
calculating the experimental back stresses.
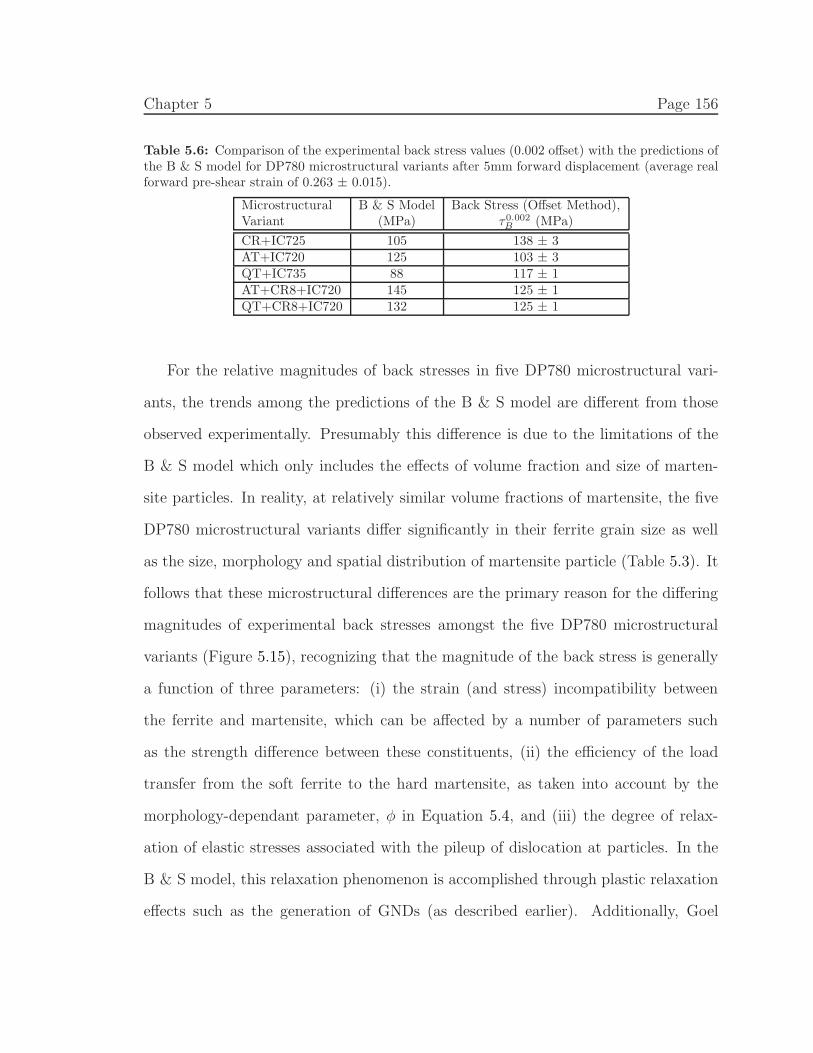
Chapter 5 Page 156
Table 5.6: Comparison of the experimental back stress values (0.002 offset) with the predictions ofthe B & S model for DP780 microstructural variants after 5mm forward displacement (average realforward pre-shear strain of 0.263 ± 0.015).
Microstructural B & S Model Back Stress (Offset Method),Variant (MPa) τ0.002B (MPa)
CR+IC725 105 138 ± 3AT+IC720 125 103 ± 3QT+IC735 88 117 ± 1AT+CR8+IC720 145 125 ± 1QT+CR8+IC720 132 125 ± 1
For the relative magnitudes of back stresses in five DP780 microstructural vari-
ants, the trends among the predictions of the B & S model are different from those
observed experimentally. Presumably this difference is due to the limitations of the
B & S model which only includes the effects of volume fraction and size of marten-
site particles. In reality, at relatively similar volume fractions of martensite, the five
DP780 microstructural variants differ significantly in their ferrite grain size as well
as the size, morphology and spatial distribution of martensite particle (Table 5.3). It
follows that these microstructural differences are the primary reason for the differing
magnitudes of experimental back stresses amongst the five DP780 microstructural
variants (Figure 5.15), recognizing that the magnitude of the back stress is generally
a function of three parameters: (i) the strain (and stress) incompatibility between
the ferrite and martensite, which can be affected by a number of parameters such
as the strength difference between these constituents, (ii) the efficiency of the load
transfer from the soft ferrite to the hard martensite, as taken into account by the
morphology-dependant parameter, φ in Equation 5.4, and (iii) the degree of relax-
ation of elastic stresses associated with the pileup of dislocation at particles. In the
B & S model, this relaxation phenomenon is accomplished through plastic relaxation
effects such as the generation of GNDs (as described earlier). Additionally, Goel
Chapter 5 Page 157
et al. [2] demonstrated that when the martensite particles are closer to each other,
i.e. smaller inter-particle spacing, further relaxation occurs by the mutual interac-
tions of the stress fields associated with the pileups at neighbouring particles, thereby
resulting in a partial reduction of the internal stresses in the ferrite matrix [2, 39].
From Figure 5.15 it is evident that the AT+CR8+IC720 and
QT+CR8+IC720 variants (both starting from the as-received HB material) have
smaller back stresses in comparison with CR+IC725. Specifically, comparing
QT+CR8+IC720 and CR+IC725 (Figure 4.3 in Chapter 4), it can be seen that while
both variants have a banded spatial distribution of martensite particles with a similar
morphology (equiaxed), they particularly differ with respect to their ferrite grain size.
On average, the ferrite grain size is smaller in QT+CR8+IC720, particulary due to
the presence of very small and sometimes unrecrystallized (but fully recovered) fer-
rite grains within martensite bands (Table 5.3). As discussed in Chapter 4, a smaller
ferrite grain size reduces the magnitude of internal stresses for two reasons. First, in
a ferrite matrix with finer grains, a larger area fraction of ferrite grains are affected by
the transformation dislocations that are formed upon quenching after IC annealing
[40, 41]. The transformation dislocations cause a local increase in ferrite strength
[42]. Consequently, the strength of ferrite is increased as the ferrite grain size is de-
creased3 [41]. This leads to a smaller stress/strain incompatibility between ferrite
and martensite [44], thereby reducing the internal stresses. Second, since martensite
particles are primarily located at ferrite grain boundaries in both of these microstruc-
tures, the inter-particle spacing of martensite is expected to decrease with a reduced
ferrite grain size, resulting in a partial cancelation of the internal stresses due to the
3For the range of ferrite grain sizes investigated here, the variation in the Hall-Petch effect isnot significant and therefore is not considered, e.g. using a Hall-Petch coefficient of 4 MP.mm1/2
[41, 43], a difference of 10 MPa can be calculated between the ferrite yield strength of CR+IC720and QT+CR8+IC720.
Chapter 5 Page 158
mutual interactions between the stress fields associated with pileups at neighbouring
particles [2, 39].
In Figure 5.15, the back stresses of the AT+CR8+IC720 and QT+CR8+IC720
variants are observed to be relatively similar. From Chapter 4 (Figure 5.3), both
variants comprise equiaxed martensite particles located at ferrite grain (and sub-
grain) boundaries. Therefore, in these microstructures, the spatial distribution of
martensite particles is directly related to ferrite grain size distribution, which is
uniform and equiaxed in AT+CR8+IC720 while it is banded and heavily bimodal in
QT+CR8+IC720. The inhomogeneous spatial distribution of martensite particles in
QT+CR8+IC leads to the presence of locally hard regions within the microstructure,
where bands of unrecrystallized ferrite grains with large number of martensite parti-
cles are located, as well as softer areas, containing bands of large, recrystallized ferrite
grains with few martensite particles. These distinct regions cause an additional de-
gree of plastic incompatibility in the microstructure, and therefore, an increase in
the magnitude of internal stresses [41]. Furthermore, the average ferrite grain size is
larger in the QT+CR8+IC720 variant (Table 5.3), which could lead to higher back
stress in this microstructure. The similar back stresses observed in Figure 5.15 are
therefore unexpected and could possibly be due to the heavily bimodal size distri-
bution of ferrite grains in QT+CR8+IC720. That is, although the average ferrite
grain size is larger in the QT+CR8+IC720 microstructure, there are bands of very
fine ferrite grains with large numbers of martensite particles at the grain boundaries
which lead to a significantly smaller inter-particle spacing and thereby, reduction of
back stresses in QT+CR8+IC720.
Regarding the CR starting microstructures in Figure 5.15, i.e. CR+IC725,
QT+IC735 and AT+IC720, the back stress is observed to increase in the order of
Chapter 5 Page 159
AT+IC720, QT+IC735 and CR+IC725. The larger magnitude of back stress in
CR+IC725 relative to QT+IC735 can be explained by the spatial distribution of
martensite particles. In both microstructures, the majority of martensite particles
are located at ferrite grain boundaries while virtually no martensite particle exists
inside ferrite grains. Moreover, specifically in the QT+IC735, due to the larger fer-
rite grain size, the ferrite grain boundaries are completely covered by inter-connected
martensite particles (Figure 4.2). It follows that the inter-particle spacing between
martensite particles is very small, which results in a smaller back stress in QT+IC735
compared to CR+IC725.
With respect to AT+IC720, a close examination of Figures 4.2 (Chapter 3) and
5.3 (Chapter 4) reveals that this microstructure has two distinct features that differ-
entiate it from all of the other DP780 variants: (i) the elongated morphology of the
majority of martensite particles, and (ii) the presence of martensite particles inside
ferrite grains. The different morphology of martensite particles clearly affects the load
transfer between ferrite and martensite, and therefore, the magnitude of back stress
through parameter φ in Equation 5.4. On the other hand, the existence of martensite
particles inside ferrite grains reduces the inter-particle spacing of martensite particles
compared to the other two CR starting microstructures, thereby resulting in a smaller
back stress in the AT+IC720 variant.
From Figure 5.15, it is evident that the back stress values for the IF steel are
significantly smaller than for the DP780 variants, which can be explained by the lack
of hard particles in the IF steel microstructure. In IF steels, the back stress originates
from the polarized heterogeneous dislocation cell substructures that are formed during
forward loading [13, 45] and its magnitude is generally smaller in comparison with
those introduced by hard particles, such as the martensite islands in DP steels.
Chapter 5 Page 160
An alternative method to measure the back stress is through the permanent soft-
ening parameter, ∆τPS. From Table 5.5, it can be seen that for all conditions, the
permanent softening back stress (0.5 × ∆τPS) is significantly smaller than both
the experimental (0.002 offset) and the B & S model back stresses. This difference
can be attributed to the changes in the non-directional hardening component (σS of
Equations 5.1 and 5.2) during reverse straining to the large reverse strains required
for the measurements of the permanent softening parameter, as suggested by Wilson
and Bate [11, 12]. This change has been experimentally reported in the TEM stud-
ies of Gardey et al. where they observed the partial dissolution of dislocation cell
structures during reverse straining at large reverse strains [13, 14]. This phenomenon
can also result in the appearance of the work hardening stagnation effect [13, 14], as
observed in the case of IF specimens, where the softening curves (Figure 5.13) show a
slight increase with increasing reverse shear strain. Therefore, in conjunction with the
above argument, the experimental results presented here confirm that the permanent
softening back stress is not an accurate representation of the actual back stress due
to the changes associated with the the non-directional hardening component (σS) at
larger reverse strains.
Finally, the importance of back stress to overall strength can be realized from the
parameter known as the Bauschinger stress parameter, βOffsetσ , which is defined as
[15]:
βOffsetσ =
τUnloadF − τOffset
R
τUnloadF
. (5.10)
The Bauschinger stress parameter provides a convenient method for presenting
the contribution of the back stress hardening relative to other hardening mechanisms.
This parameter was calculated for all microstructures (using a 0.002 offset) and the
Chapter 5 Page 161
results are presented in Figure 5.17. Additionally, for the specimens with a forward
displacement of 5mm (average real forward pre-shear strain of 0.263 ± 0.015), the
β0.002σ values are listed in Table 5.7. From Figure 5.17, it can be seen that for all
conditions, the β0.002σ follows a similar trend with forward pre-shear strain as the
back stress (5.15). The magnitudes of β0.002σ for the DP780 microstructural variants
(∼ 0.3−0.5) are in agreement with the available literature [15, 18] and suggest a strong
contribution of the back stresses to the overall strength of DP steels. Moreover, as
expected, β0.002σ is significantly smaller for IF steels in comparison with the DP780
microstructural variants. The more interesting finding from Figure 5.17, however, is
that β0.002σ reaches a saturation limit for all specimens at high strains (above ∼0.1).
This saturation effect has been reported before and is believed to be associated with
the initiation of alternate relaxation processes such as plastic deformation and/or
cracking of hard particles [4, 7, 15]. A saturation in β0.002σ is very intriguing because
it suggests that after a certain amount of shear deformation, the contribution of back
stress to overall strength is constant. The saturation of β0.002σ occurs at shear strains
in the order of ∼ 0.1, which translates to a von Mises equivalent strain of ∼0.05-
0.06. Interestingly, these strain levels are close to those associated with the transition
from GND dominated Stage B work hardening, to Stage C where non DP-specific
hardening mechanisms are more prominent (see Chapter 4). This correspondence
suggests that both the saturation of β0.002σ and the transition from Stage B work
hardening to Stage C are due to a similar mechanism, such as the plastic deformation
and/or fracture of martensite particles. These effects have both been experimentally
observed in the literature before [44, 46, 47].
Finally, from Equation 5.10, the β0.002σ parameter was defined as the normalized
back stress value with respect to the forward unloading stress. As the forward flow
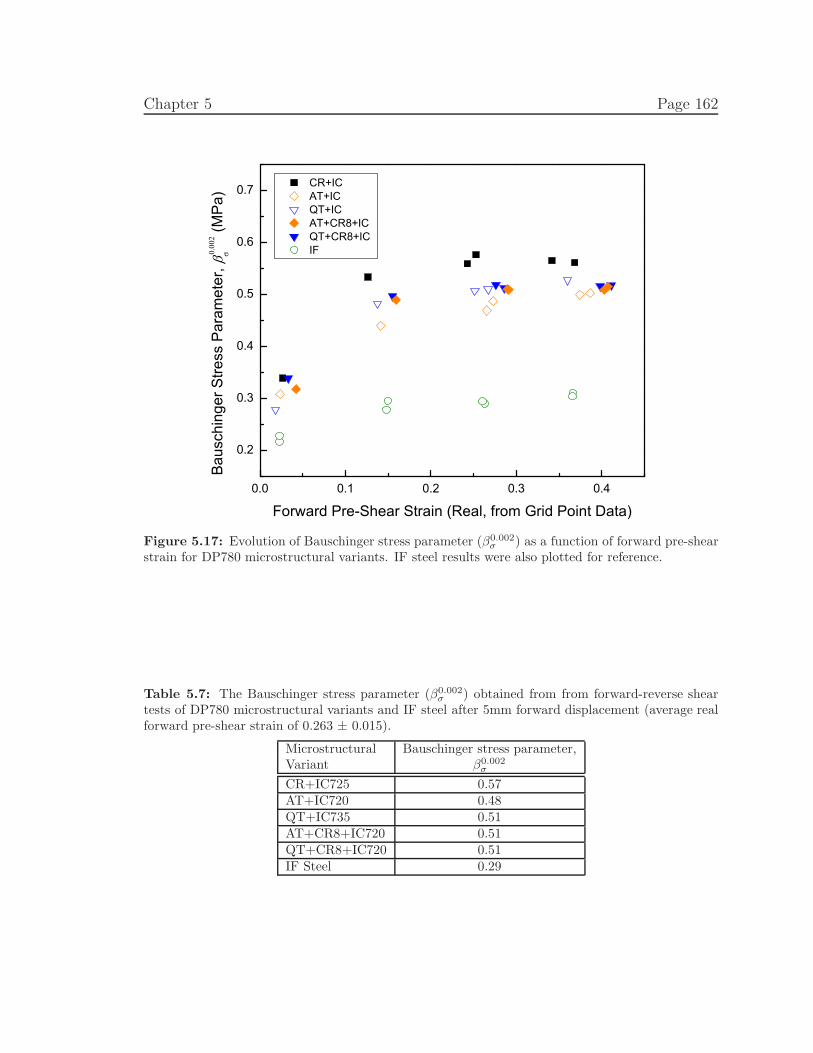
Chapter 5 Page 162
0.0 0.1 0.2 0.3 0.4
0.2
0.3
0.4
0.5
0.6
0.7
Bau
schi
nger
Stre
ss P
aram
eter
, (M
Pa)
Forward Pre-Shear Strain (Real, from Grid Point Data)
CR+IC AT+IC QT+IC AT+CR8+IC QT+CR8+IC IF
Figure 5.17: Evolution of Bauschinger stress parameter (β0.002σ ) as a function of forward pre-shear
strain for DP780 microstructural variants. IF steel results were also plotted for reference.
Table 5.7: The Bauschinger stress parameter (β0.002σ ) obtained from from forward-reverse shear
tests of DP780 microstructural variants and IF steel after 5mm forward displacement (average realforward pre-shear strain of 0.263 ± 0.015).
Microstructural Bauschinger stress parameter,Variant β0.002
σ
CR+IC725 0.57AT+IC720 0.48QT+IC735 0.51AT+CR8+IC720 0.51QT+CR8+IC720 0.51IF Steel 0.29
Chapter 5 Page 163
stress is an ever increasing function of strain, the saturation of β0.002σ suggests that
for the case of back stresses, a saturation limit is not reached and only the rate
of back stress increase is significantly reduced at higher strains. This behaviour
is understandable since as deformation continues, the martensite particles still act
as barriers to dislocation motion and therefore result in dislocation pileups despite
their plastic deformation and/or fracture. The plastic deformation and/or fracture of
martensite particles have two consequences. First, it reduces the magnitude of plastic
incompatibility between ferrite and martensite, which leads to a smaller increase in
the internal stresses as deformation proceeds. Second, it causes an additional plastic
relaxation of the internal stresses. Both of these effects are consistent with the results
of Chapters 3 and 4 where the work hardening contribution due to the generation of
GNDs was found to be insignificant at larger strains of magnitudes similar to those
associated with the saturation of back stress. It follows that, at higher strains, where
plastic deformation and/or fracture of martensite particles is taking place, the back
stresses are still expected to increase with applied strain, albeit at significantly slower
rates (Figure 5.15).
5.5 Conclusions
1. An in-plane shear test fixture was designed and commissioned to enable the
measurement of back stress in steel sheet through forward-reverse shear tests.
2. Forward-reverse shear tests were performed on an IF steel as well as the five
DP780 microstructural variants described in Chapters 3 and 4. The five DP780
microstructural variants had similar volume fractions of martensite but var-
ied in their average ferrite grain size as well as the average size, morphology
Chapter 5 Page 164
and spatial distribution of martensite particles. The reverse flow curves were
used to calculate and compare the back stress as well as the Bauschinger stress
parameter for each microstructure.
3. It was found that within the five DP780 microstructural variants, the CR+IC725
variant exhibited the highest value of back stress, while the AT+IC720 vari-
ant offered the lowest magnitude of back stress and the other three variants
(QT+IC735, AT+CR8+IC720 and QT+CR8+IC720) fell between these two
extremes. These differences are attributed to the variation in the average fer-
rite grain size as well as the spatial distribution and morphology of martensite
particles. The former two parameters affect the stress-strain incompatibility
between ferrite (soft) and martensite (hard), while the latter influences the ef-
ficiency of load transfer from the ferrite matrix to the martensite particles.
4. In all five DP780 microstructures, the Bauschinger stress parameter (β0.002σ )
reaches a saturation limit at a von Mises equivalent strain similar to that of
the transition from Stage B to Stage C of work hardening, suggesting that this
transition is likely due to the initiation of other plastic relaxation effects such
as the plastic deformation and/or cracking of martensite particles.
Chapter 5 Page 165
5.6 References
[1] G. R. Speich, R. L. Miller, in: R. A. Kot, J. W. Morris (Eds.), Structure and
Properties of Dual-Phase Steels, Metall. Soc. of AIME, 1979, pp. 145–182.
[2] A. Goel, R. K. Ray, G. S. Murty, Scripta Metall. 17 (1983) 375–380.
[3] J. D. Atkinson, L. M. Brown, W. M. Stobbs, Philos. Mag. 30 (1974) 1247–1280.
[4] N. Ibrahim, J. D. Embury, Mater. Sci. Eng. 19 (1975) 147–149.
[5] J. Gerbase, J. D. Embury, R. M. Hobbs, in: R. A. Kot, J. W. Morris (Eds.),
Structure and Properties of Dual-Phase Steels, Metall. Soc. of AIME, 1979, pp.
118–144.
[6] M. T. Ma, B. Z. Sun, Y. Tomota, ISIJ Int. 29 (1989) 74–77.
[7] D. Uko, R. Sowerby, J. D. Embury, Metals Technol. London 7 (1980) 359–367.
[8] R. Sowerby, D. K. Uko, Y. Tomita, Mater. Sci. Eng. 41 (1979) 43–58.
[9] Y. W. Chang, R. J. Asaro, Metal Sci. 12 (1978) 277–284.
[10] Z. Li, H. Gu, Metall. Trans. A 21 (1990) 725–732.
[11] P. S. Bate, D. V. Wilson, Acta Metall. 34 (1986) 1097–1105.
[12] D. V. Wilson, P. S. Bate, Acta Metall. 34 (1986) 1107–1120.
[13] B. Gardey, S. Bouvier, V. Richard, B. Bacroix, Mater. Sci. Eng. A 400-401 (2005)
136–141.
[14] B. Gardey, S. Bouvier, B. Bacroix, Metall. Mater. Trans. A 36 (2005) 2937–2945.
[15] K. Han, C. J. van Tyne, B. S. Levy, Metall. Mater. Trans. A 36 (2005) 2379–2384.
[16] M. Erdogan, R. Priestner, Mater. Sci. Technol. 18 (2002) 369–376.
[17] Y. Tomota, Mater. Sci. Technol. 3 (1987) 415–421.
Chapter 5 Page 166
[18] A. Aouafi, S. Bouvier, M. Gasperini, X. Lemoine, O. Bouaziz, in: E. Cueto,
F. Chinesta (Eds.), 10th ESAFORM Conference on Material Forming, 18-20
April 2007, volume 907 of AIP Conf. Proc., LPMTM-CNRS, Univ. Paris, Vil-
letaneuse, France, pp. 100–105.
[19] C. Zhongchun, S. Maekawa, T. Takeda, Metall. Mater. Trans. A 30 (1999) 3069–
3078.
[20] H. Kim, C. Kim, F. Barlat, E. Pavlina, M. G. Lee, Mater. Sci. Eng. A 562 (2013)
161–171.
[21] R. M. Cleveland, A. K. Ghosh, Int. J. Plast. 18 (2002) 769–785.
[22] M. Westphal, J. R. McDermid, J. D. Boyd, J. D. Embury, Can. Metall. Q. 49
(2010) 91–98.
[23] Y. Bian, Microstructure and Mechanical Properties of Al and Al/Si Alloyed
TRIP-assisted Steels Produced through Galvanizing Heat Treatments, The-
sis/dissertation, McMaster University, Hamilton, ON, Canada, 2009.
[24] K. Spencer, The work hardening of austenitic stainless steel, applied to the fab-
rication of high-strength conductors, Thesis/dissertation, McMaster University,
Hamilton, ON, Canada, 2004.
[25] F. Yoshida, T. Uemori, K. Fujiwara, Int. J. Plast. 18 (2002) 633–659.
[26] S. Bouvier, B. Gardey, H. Haddadi, C. Teodosiu, J. Mater. Process. Technol. 174
(2006) 115–126.
[27] L. M. Brown, W. M. Stobbs, Philos. Mag. 23 (1971) 1185–1199.
[28] L. M. Brown, W. M. Stobbs, Philos. Mag. 23 (1971) 1201–1233.
[29] M. F. Ashby, Philos. Mag. 14 (1966) 1157–1178.
[30] M. F. Ashby, Philos. Mag. 21 (1970) 399–424.
[31] L. M. Brown, Acta Metall. 21 (1973) 879–885.
[32] S. Bouvier, H. Haddadi, P. Levqe, C. Teodosiu, J. Mater. Process. Technol. 172
(2006) 96–103.
Chapter 5 Page 167
[33] G. A. S. Bell, The relationship between microstructure and damage evolution
in hot-rolled complex-phase steel sheet, Thesis/dissertation, Queen’s University,
Kingston, ON, Canada, 2013.
[34] A. Ramazani, K. Mukherjee, A. Schwedt, P. Goravanchi, U. Prahl, W. Bleck,
Int. J. Plast. 43 (2013) 128–152.
[35] O. Bouaziz, T. Lung, M. Kandel, C. Lecomte, Le Journal de Physique IV 11
(2001) Pr4–223–Pr4–231.
[36] M. Delince, Y. Brechet, J. D. Embury, M. G. D. Geers, P. J. Jacques, T. Pardoen,
Acta. Mater. 55 (2007) 2337–2350.
[37] O. Bouaziz, D. Barbier, J. D. Embury, G. Badinier, Philos. Mag. 93 (2013)
247–255.
[38] J. Bouquerel, K. Verbeken, B. C. D. Cooman, Acta. Mater. 54 (2006) 1443–1456.
[39] Y. Tomota, I. Tamura, Transactions of the Iron and Steel Institute of Japan 22
(1982) 665–677.
[40] M. Calcagnotto, D. Ponge, E. Demir, D. Raabe, Mater. Sci. Eng. A 527 (2010)
2738–2746.
[41] M. Calcagnotto, D. Ponge, D. Raabe, Mater. Sci. Eng. A 527 (2010) 7832–7840.
[42] H. Ghassemi-Armaki, R. Maaß, S. Sriram, J. R. Greer, K. S. Kumar, Acta.
Mater. 62 (2014) 197–211.
[43] A. Ramazani, K. Mukherjee, U. Prahl, W. Bleck, Metall. Mater. Trans. A 43
(2012) 3850–3869.
[44] M. Calcagnotto, Y. Adachi, D. Ponge, D. Raabe, Acta. Mater. 59 (2011) 658–
670.
[45] B. Peeters, S. R. Kalidindi, P. V. Houtte, E. Aernoudt, Acta. Mater. 48 (2000)
2123–2133.
[46] P. J. Jacques, Q. Furnemont, F. Lani, T. Pardoen, F. Delannay, Acta. Mater. 55
(2007) 3681–3693.

Chapter 5 Page 168
[47] M. Mazinani, W. J. Poole, Metall. Mater. Trans. A 38 (2007) 328–339.
CHAPTER 6
Complementary Discussion
6.1 Microstructure Evolution During IC Annealing
In Chapters 3 and 4, five distinct DP microstructural variants, namely CR+IC,
AT+IC, QT+IC, AT+CR8+IC and QT+CR8+IC, were presented. For each vari-
ant, a microstructure with a martensite volume fraction of ∼15% was selected, i.e.
CR+IC725, AT+IC720, QT+IC7351, AT+CR8+IC720 and QT+CR8+IC720, and
the evolution of microstructure during IC annealing was extensively discussed us-
ing the concepts of austenite transformation and ferrite recrystallization. It was
shown that the most suitable austenite nucleation sites are those associated with
both (i) high carbon content necessary for austenite growth and (ii) high interfa-
cial and/or stored energies required to reduce the activation energy for austenite
nucleation (∆G∗). When the ferrite matrix is fully recrystallized prior to reaching
the austenite transformation temperature, the ferrite/cementite interface in pearlite
colonies as well as the individual cementite particles on ferrite grain boundaries are
the two preferred nucleation sites for austenite [1, 2]. On the other hand, when ferrite
recrystallization is not completed before reaching the IC annealing temperature, sig-
nificant nucleation of austenite takes place on the cementite particles that are located
on the sub-grain boundaries of unrecrystallized ferrite grains [1–3].
A comparison of Figures 3.2 and 4.3 reveals that the addition of a cold-rolling step
between pre-heat treatments and IC annealing can result in significant modifications
1This specimen was referred to as Q7T+IC35 in Chapter 3
169
Chapter 6 Page 170
to the final DP microstructures. Specifically, in the microstructures with the AT
starting pre-heat treatments, i.e. AT+IC720 and AT+CR8+IC720, the latter has a
considerably refined microstructure with fine, fully recrystallized and equiaxed ferrite
grains. Moreover, in AT+CR8+IC720, the martensite particles are relatively smaller
in size and they have an equiaxed morphology (compared to the elongated morphol-
ogy in AT+IC720). The spatial distribution of martensite particles, however, are
similarly uniform in both variants. These differences can be related to the deformed
microstructure of the pre-IC annealing AT+CR8 condition (Figure 4.2) compared to
AT (Figure 3.1), for two reasons: (i) in the AT+CR8 condition, the high carbon con-
tent M/A particles are deformed and redistributed in the deformed ferrite matrix, and
(ii) upon heating to the IC annealing temperature complete ferrite recrystallization
of AT+CR leads to a fine-grained, equiaxed ferrite matrix, as compared to AT.
In the microstructural variants with the QT pre-heat treatments, i.e. QT+IC735
and QT+CR8+IC720, the addition of the cold rolling step also results in distinctly
different microstructures. During IC annealing of the QT+IC735, only a small por-
tion of cementite particles, located on the ferrite grain boundaries, can act as effective
austenite nucleation sites. This leads to a final DP microstructure where the majority
of martensite particles are located at the prior austenite grain boundaries and cor-
ners, leaving some very large martensite-free regions within the ferrite matrix. On
the other hand, in the QT+CR8+IC720 variant, the addition of a cold rolling step
after the QT pre-treatment results in a partial recrystallization of the deformed ferrite
matrix during heating to the IC annealing temperature (Figure 4.5) and therefore,
a more refined ferrite matrix compared to QT+IC735. Moreover, as carbide parti-
cles are primarily located at either the recrystallized ferrite grain boundaries or the
Chapter 6 Page 171
unrecrystallized subgrain boundaries, the majority of them can act as austenite nu-
cleation sites during IC annealing, which leads to a more uniform spatial distribution
of martensite particles in QT+CR8+IC720 compared to QT+IC720.
6.2 Effect of Microstructural Parameters on Work
Hardening of DP steels
In Chapters 3 and 4, the work hardening behaviour of the five DP780 microstruc-
tural variants were analyzed and discussed individually using three work hardening
parameters: the true work hardening rate (θ), the instantaneous work hardening rate
(n), and the annihilation factor (h). To complete this discussion, the work hardening
rate will be analyzed further here by comparing the results of Chapters 3, 4 and 5.
Figure 6.1a presents the the true work hardening rate at ǫP = 0.5% (θǫP=0.5%) for
the five microstructural variants investigated in this research, i.e. CR+IC, AT+IC,
QT+IC, AT+CR8+IC and QT+CR8+IC. In Figure 6.1b, a similar comparison is
made using the minimum instantaneous work hardening exponent, nmin. Both of
these parameters represent the work hardening behaviour of DP steels at small strains
which was assumed to be dominated by the generation of geometrically necessary
dislocations (GNDs). The different relationships of θǫP=0.5% and nmin with√
f/d for
the five microstructural variants was extensively discussed in Chapters 3 and 4 and
they were related to the effects of the mean ferrite grain size as well as the morphology
and spatial distribution of martensite particles. It is evident from Figures 6.1 that
in the variants with an additional cold-rolling pre-treatment step, i.e. AT+CR8+IC
and QT+CR8+IC, both the θǫP=0.5% and nmin plots (i) are shifted to higher values of√
f/d and (ii) are generally more sensitive to the value of√
f/d, i.e. higher slopes
Chapter 6 Page 172
with√
f/d. Both of these observations can be related to the finer microstructure of
the AT+CR8+IC and QT+CR8+IC variants compared to the AT+IC and QT+IC
(see Table 5.3). In the former two microstructural variants, a smaller martensite
particle size leads to a higher value of√
f/d. On other hand, as discussed in Chapter
4, due to the finer mean ferrite grain size in AT+CR8+IC and QT+CR8+IC, a
larger area fraction of ferrite grains is expected to be affected by the transformation
dislocations [4, 5], leading to a higher strength of ferrite grains [5] and hence, a smaller
stress/strain incompatibility between ferrite and martensite [6]. Consequently, GND
hardening is expected to be lower in AT+CR8+IC and QT+CR8+IC compared to
AT+IC and QT+IC. In addition to the ferrite grain size effect, between AT+IC and
AT+CR8+IC, the morphology of the martensite particles is different, while between
QT+IC and QT+CR8+IC, the spatial distribution of martensite particles is changed.
In Chapters 3 and 4, differing morphology and spatial distribution of martensite
particles were shown to result in additional variations in GND hardening, although
since these parameters are coupled with the effect of ferrite grain size, it is difficult
to independently discuss their influence on AT+IC versus AT+CR8+IC, as well as
on QT+IC versus QT+CR8+IC.
At larger strains (∼2-3%), the instantaneous work hardening rate reaches a max-
imum limit which is referred to as nmax. It was found that in each microstructural
variant, nmax is independent of the√
f/d value, which implies that at these strain
levels, the work hardening effects due to GNDs are less significant. This observation
correlates well with the back stress results of Chapter 5. That is, the relative con-
tribution to back stresses, i.e. Bauschinger stress parameter (β0.002σ ), was also shown
to increase very rapidly at the beginning of applied deformation, while reaching a
saturation value at strains similar to those associated with the nmax (see Section
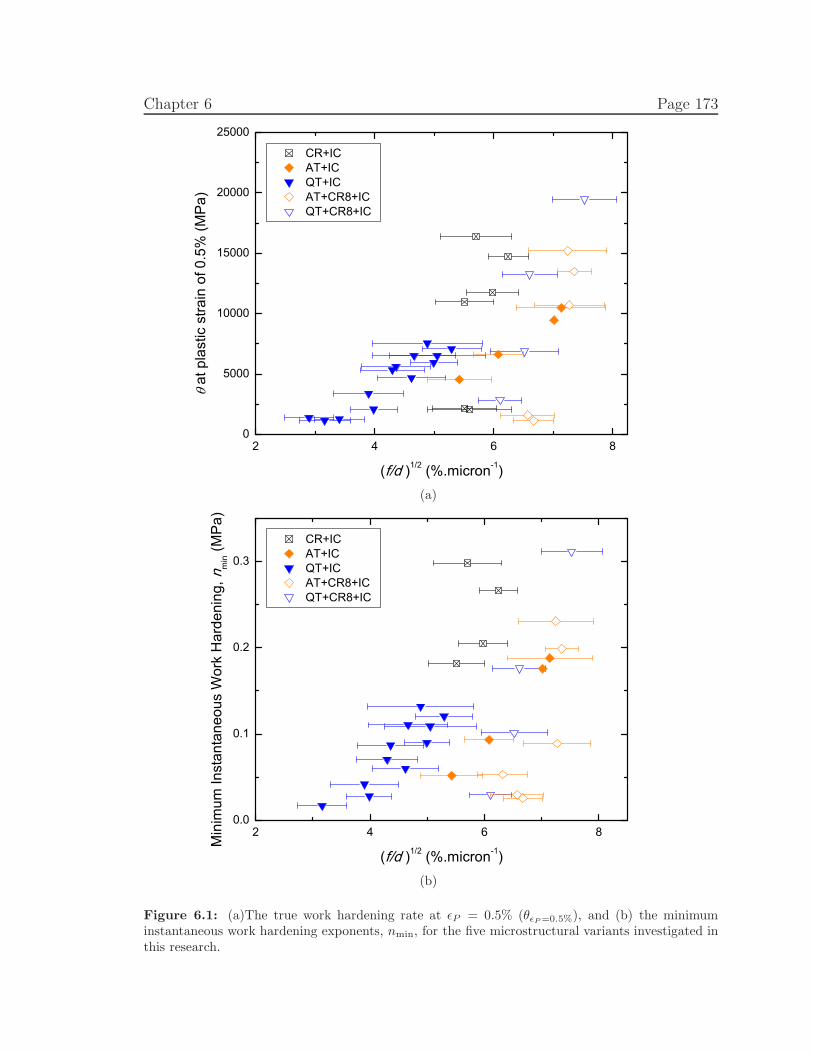
Chapter 6 Page 173
2 4 6 80
5000
10000
15000
20000
25000
CR+IC AT+IC QT+IC AT+CR8+IC QT+CR8+IC
at p
last
ic s
train
of 0
.5%
(MP
a)
(f/d )1/2 (%.micron-1)(a)
2 4 6 80.0
0.1
0.2
0.3
CR+IC AT+IC QT+IC AT+CR8+IC QT+CR8+IC
Min
imum
Inst
anta
neou
s W
ork
Har
deni
ng, n
min (M
Pa)
(f/d )1/2 (%.micron-1)(b)
Figure 6.1: (a)The true work hardening rate at ǫP = 0.5% (θǫP=0.5%), and (b) the minimuminstantaneous work hardening exponents, nmin, for the five microstructural variants investigated inthis research.
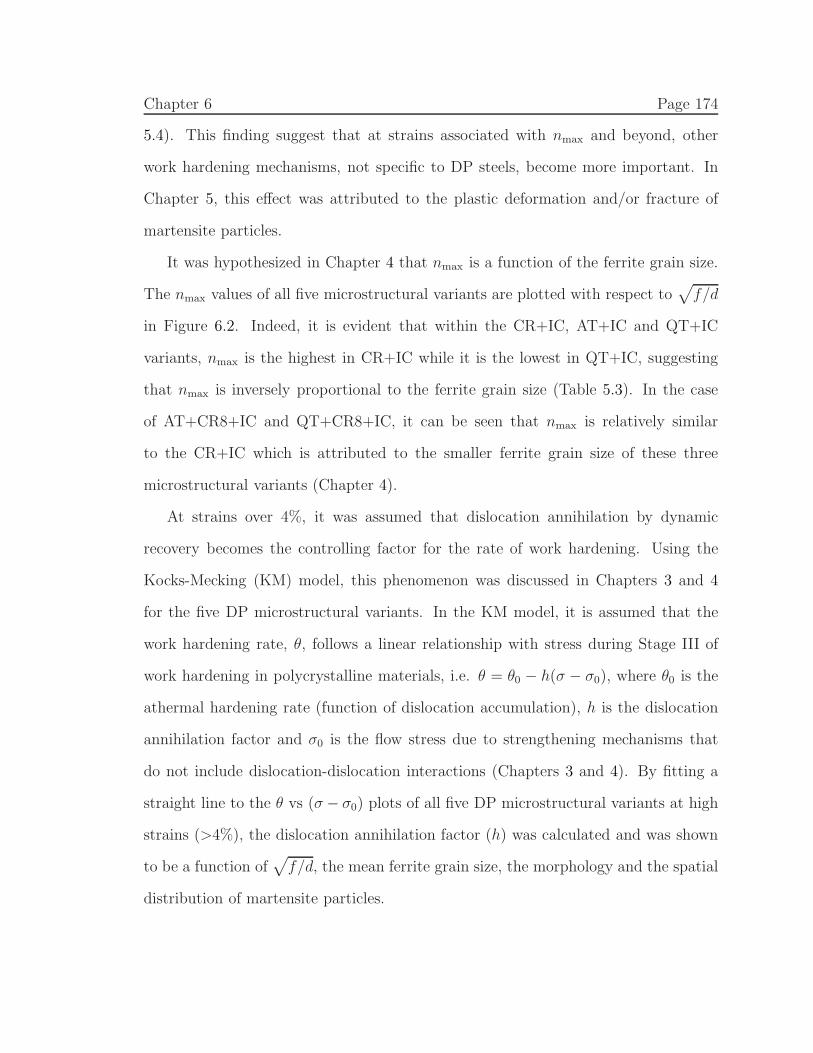
Chapter 6 Page 174
5.4). This finding suggest that at strains associated with nmax and beyond, other
work hardening mechanisms, not specific to DP steels, become more important. In
Chapter 5, this effect was attributed to the plastic deformation and/or fracture of
martensite particles.
It was hypothesized in Chapter 4 that nmax is a function of the ferrite grain size.
The nmax values of all five microstructural variants are plotted with respect to√
f/d
in Figure 6.2. Indeed, it is evident that within the CR+IC, AT+IC and QT+IC
variants, nmax is the highest in CR+IC while it is the lowest in QT+IC, suggesting
that nmax is inversely proportional to the ferrite grain size (Table 5.3). In the case
of AT+CR8+IC and QT+CR8+IC, it can be seen that nmax is relatively similar
to the CR+IC which is attributed to the smaller ferrite grain size of these three
microstructural variants (Chapter 4).
At strains over 4%, it was assumed that dislocation annihilation by dynamic
recovery becomes the controlling factor for the rate of work hardening. Using the
Kocks-Mecking (KM) model, this phenomenon was discussed in Chapters 3 and 4
for the five DP microstructural variants. In the KM model, it is assumed that the
work hardening rate, θ, follows a linear relationship with stress during Stage III of
work hardening in polycrystalline materials, i.e. θ = θ0 − h(σ − σ0), where θ0 is the
athermal hardening rate (function of dislocation accumulation), h is the dislocation
annihilation factor and σ0 is the flow stress due to strengthening mechanisms that
do not include dislocation-dislocation interactions (Chapters 3 and 4). By fitting a
straight line to the θ vs (σ − σ0) plots of all five DP microstructural variants at high
strains (>4%), the dislocation annihilation factor (h) was calculated and was shown
to be a function of√
f/d, the mean ferrite grain size, the morphology and the spatial
distribution of martensite particles.
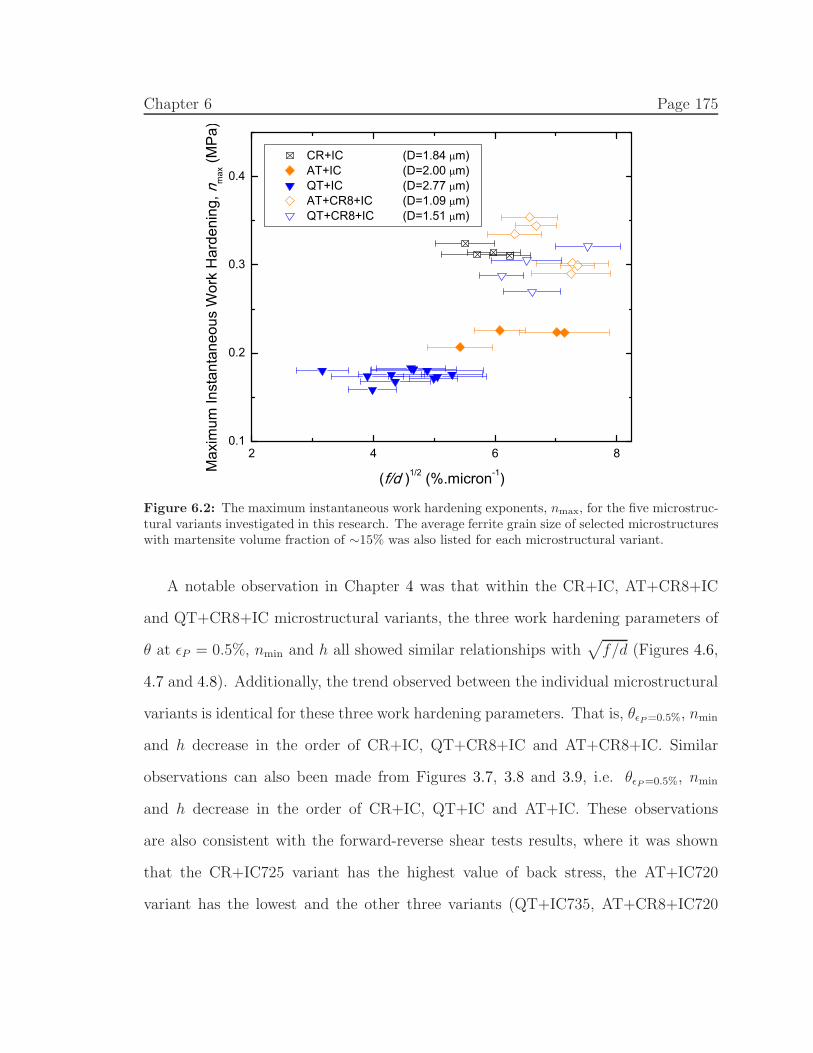
Chapter 6 Page 175
2 4 6 80.1
0.2
0.3
0.4
CR+IC (D=1.84 m) AT+IC (D=2.00 m) QT+IC (D=2.77 m) AT+CR8+IC (D=1.09 m) QT+CR8+IC (D=1.51 m)
Max
imum
Inst
anta
neou
s W
ork
Har
deni
ng, n
max
(MP
a)
(f/d )1/2 (%.micron-1)
Figure 6.2: The maximum instantaneous work hardening exponents, nmax, for the five microstruc-tural variants investigated in this research. The average ferrite grain size of selected microstructureswith martensite volume fraction of ∼15% was also listed for each microstructural variant.
A notable observation in Chapter 4 was that within the CR+IC, AT+CR8+IC
and QT+CR8+IC microstructural variants, the three work hardening parameters of
θ at ǫP = 0.5%, nmin and h all showed similar relationships with√
f/d (Figures 4.6,
4.7 and 4.8). Additionally, the trend observed between the individual microstructural
variants is identical for these three work hardening parameters. That is, θǫP=0.5%, nmin
and h decrease in the order of CR+IC, QT+CR8+IC and AT+CR8+IC. Similar
observations can also been made from Figures 3.7, 3.8 and 3.9, i.e. θǫP=0.5%, nmin
and h decrease in the order of CR+IC, QT+IC and AT+IC. These observations
are also consistent with the forward-reverse shear tests results, where it was shown
that the CR+IC725 variant has the highest value of back stress, the AT+IC720
variant has the lowest and the other three variants (QT+IC735, AT+CR8+IC720
Chapter 6 Page 176
and QT+CR8+IC720) fall between these two extremes. This consistent trend further
strengthens the argument made in Chapter 4 that GND hardening and dynamic
recovery effects are linked with each other through the internal stresses produced by
the incompatibility between ferrite and martensite.
From the Considere criterion, it follows that an ideal DP microstructure with the
highest uniform elongation will have a combination of a large initial work hardening
rate, and a small h value. Hence, the KM model was applied to the work hardening
data at strains larger than ∼4%, where the work hardening rate showed a linear
relationship with the stress (σ − σd). The two important parameters of the KM
model are θ0, the athermal hardening rate (function of dislocation storage), and h,
the dislocation annihilation factor. It was discussed in Chapter 3 and 4 that only h can
be reliability measured and a true value of θ0 cannot be obtained due to the complex
yielding behaviour of DP steels. However, since in KMmodel, θ0 is defined as the work
hardening rate at σ − σd=0 (i.e. the intercept of the KM fit with the ordinate), the
work hardening rate at ǫP = 0.5% was instead considered as an alternative parameter
to compare the initial dislocation storage rate among various microstructural variants
(Chapter 3).
At small strains (ǫP = 0.5%), the work hardening was found to be controlled by
the generation of geometrically necessary dislocations (GNDs) and the development
of back stresses in the ferrite grains. Additionally, it was demonstrated that at a given√
f/d, the θǫp=0.5% and nmin were functions of the mean ferrite grain size as well as the
morphology and spatial distribution of martensite particles. As the deformation pro-
ceeds, at strains of ∼2-3%, the work hardening rate reaches a maximum limit, nmax,
which is also microstructure-dependent but not a function of√
f/d. The nmax can be
considered as the work hardening capacity of the DP steel for a given microstructural
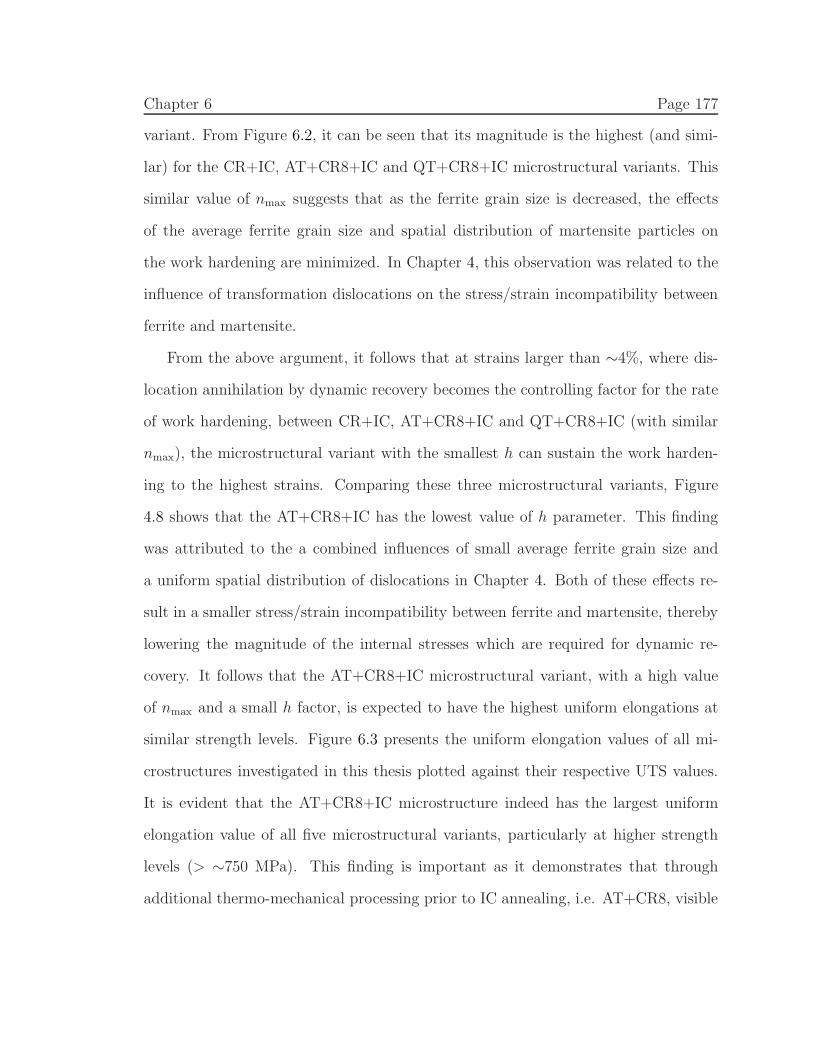
Chapter 6 Page 177
variant. From Figure 6.2, it can be seen that its magnitude is the highest (and simi-
lar) for the CR+IC, AT+CR8+IC and QT+CR8+IC microstructural variants. This
similar value of nmax suggests that as the ferrite grain size is decreased, the effects
of the average ferrite grain size and spatial distribution of martensite particles on
the work hardening are minimized. In Chapter 4, this observation was related to the
influence of transformation dislocations on the stress/strain incompatibility between
ferrite and martensite.
From the above argument, it follows that at strains larger than ∼4%, where dis-
location annihilation by dynamic recovery becomes the controlling factor for the rate
of work hardening, between CR+IC, AT+CR8+IC and QT+CR8+IC (with similar
nmax), the microstructural variant with the smallest h can sustain the work harden-
ing to the highest strains. Comparing these three microstructural variants, Figure
4.8 shows that the AT+CR8+IC has the lowest value of h parameter. This finding
was attributed to the a combined influences of small average ferrite grain size and
a uniform spatial distribution of dislocations in Chapter 4. Both of these effects re-
sult in a smaller stress/strain incompatibility between ferrite and martensite, thereby
lowering the magnitude of the internal stresses which are required for dynamic re-
covery. It follows that the AT+CR8+IC microstructural variant, with a high value
of nmax and a small h factor, is expected to have the highest uniform elongations at
similar strength levels. Figure 6.3 presents the uniform elongation values of all mi-
crostructures investigated in this thesis plotted against their respective UTS values.
It is evident that the AT+CR8+IC microstructure indeed has the largest uniform
elongation value of all five microstructural variants, particularly at higher strength
levels (> ∼750 MPa). This finding is important as it demonstrates that through
additional thermo-mechanical processing prior to IC annealing, i.e. AT+CR8, visible
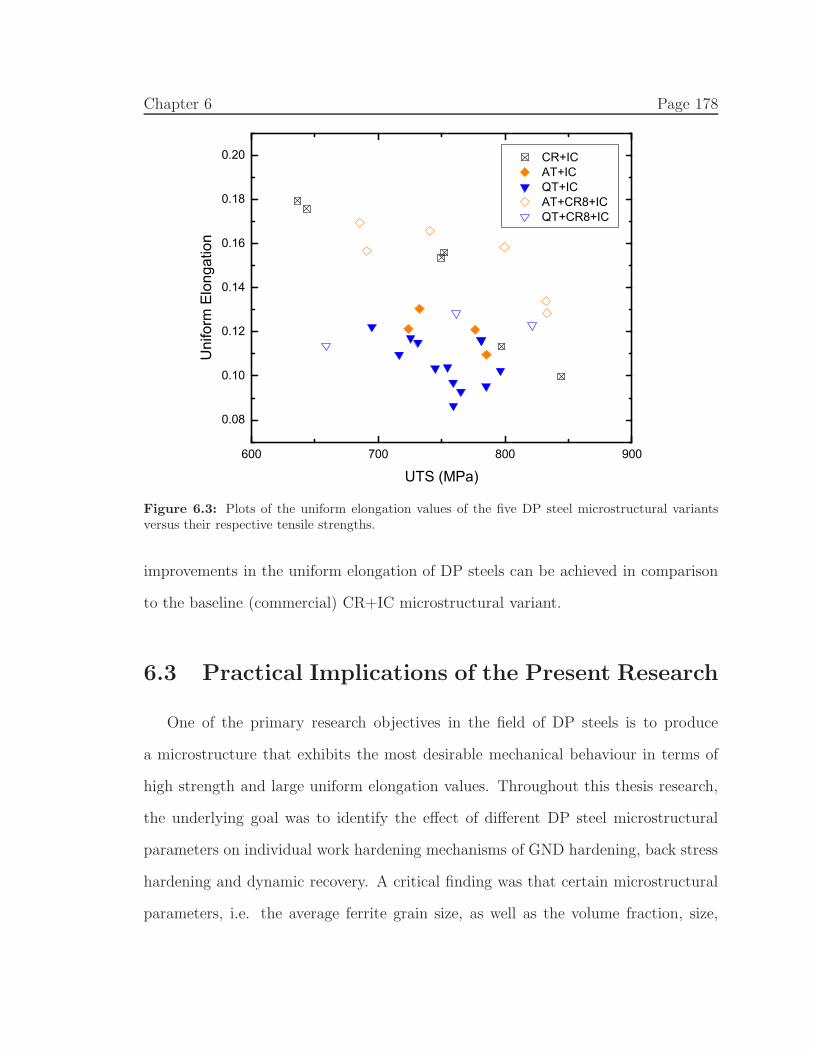
Chapter 6 Page 178
600 700 800 900
0.08
0.10
0.12
0.14
0.16
0.18
0.20 CR+IC AT+IC QT+IC AT+CR8+IC QT+CR8+IC
Uni
form
Elo
ngat
ion
UTS (MPa)
Figure 6.3: Plots of the uniform elongation values of the five DP steel microstructural variantsversus their respective tensile strengths.
improvements in the uniform elongation of DP steels can be achieved in comparison
to the baseline (commercial) CR+IC microstructural variant.
6.3 Practical Implications of the Present Research
One of the primary research objectives in the field of DP steels is to produce
a microstructure that exhibits the most desirable mechanical behaviour in terms of
high strength and large uniform elongation values. Throughout this thesis research,
the underlying goal was to identify the effect of different DP steel microstructural
parameters on individual work hardening mechanisms of GND hardening, back stress
hardening and dynamic recovery. A critical finding was that certain microstructural
parameters, i.e. the average ferrite grain size, as well as the volume fraction, size,
Chapter 6 Page 179
morphology and spatial distribution of martensite particles, not only affect the initial
work hardening behaviour (GND hardening and back stress hardening), but they
also significantly influence the work hardening properties at large strains through
variations in the dynamic recovery (dislocation annihilation) process.
Despite the variation of θǫp=0.5%, nmin and h with√
f/d, each microstructural
variant exhibited similar nmax values at strains of ∼2-3% which are associated with
the transition from Stage B to Stage C work hardening. The nmax parameter is not a
function of√
f/d and for this reason, it can be considered as the work hardening ca-
pacity of each microstructural variant. An important finding in the present research
was the effect of ferrite grain size on nmax. That is, in DP steels with a refined ferrite
matrix, the influence of the ferrite grain size and the spatial distribution of martensite
particles on nmax becomes minimal, irrespective of the differences in nmin. This out-
come suggests that nmax is limited by a certain ferrite grain size; therefore, significant
improvement in the uniform elongation of a DP steel requires a microstructure with
a low h parameter, as the Considere criterion is then satisfied at larger strains. In
this research, it was shown that both the reduction of the ferrite grain size and the
uniform spatial distribution of martensite particles leads to a smaller h value, which
is the case for the AT+CR8+IC microstructural variant. It can be concluded that
in order to produce a DP steel with a large uniform elongation and a high strength,
the processing should be designed to result in a microstructure with the uniform spa-
tial distribution of martensite particles in a significantly refined ferrite matrix. To
produce such a microstructure, the AT+CR8+IC processing route could be modified
by: decreasing the initial austenitization temperature to reduce the prior austenite
grain size, thereby refining the AT microstructure, or by increasing the amount of
Chapter 6 Page 180
cold rolling after the AT pre-heat treatments and prior to the IC annealing to fur-
ther reduce the ferrite grain size. The latter modification is particularly interesting
since, as discussed in Chapter 4, one practical difficulty in the present research was
that the changes in the spatial distribution of martensite particles were also generally
accompanied by a variation in ferrite grain size, e.g. compare AT+CR8+IC with
QT+CR8+IC and CR+IC. As a result, it was impossible to investigate these two
effects independently. Presumably, the amount of the cold rolling can be changed to
50, 60 ,70 and 90%, instead of the 80% value used here, to obtain microstructural
variants with a wide range of ferrite grain sizes. This leads to a larger data set of
microstructural variants with different ferrite grain sizes as well as sizes and spatial
distributions of martensite particles, which could possibly allow for an independent
study of the separate effects of ferrite grain size and spatial distribution of martensite
particles on the work hardening properties of DP steels.
Chapter 6 Page 181
6.4 References
[1] C. I. Garcia, A. J. Deardo, Metall. Trans. A 12 (1981) 521–530.
[2] D. Z. Yang, E. L. Brown, D. K. Matlock, G. Krauss, Metall. Trans. A 16 (1985)
1385–1392.
[3] M. Kulakov, W. J. Poole, M. Militzer, Metall. Mater. Trans. A 44 (2013) 3564–
3576.
[4] M. Calcagnotto, D. Ponge, E. Demir, D. Raabe, Mater. Sci. Eng. A 527 (2010)
2738–2746.
[5] M. Calcagnotto, D. Ponge, D. Raabe, Mater. Sci. Eng. A 527 (2010) 7832–7840.
[6] M. Calcagnotto, Y. Adachi, D. Ponge, D. Raabe, Acta. Mater. 59 (2011) 658–670.
CHAPTER 7
Conclusions and Future Work
7.1 Conclusions
1. The addition of a cold-rolling step between the pre-heat treatments and IC
annealing leads to a significant refinement of the final DP microstructure com-
pared to similar processing conditions without a cold-rolling step. This refine-
ment can be explained by the interactions between the ferrite recrystallization
and austenite transformation processes.
2. At small strains (ǫp = 0.5%), the work hardening behaviour of the five DP
microstructural variants was found to be dominated by the generation of ge-
ometrically necessary dislocations (GNDs) in the ferrite grains and near the
martensite particles. The work hardening response at this stage was charac-
terized by θ at ǫp = 0.5% and a minimum value in the instantaneous work
hardening exponent, nmin. Both of these parameters were determined to be
functions of√
f/d, the mean ferrite grain size as well as the morphology and
spatial distribution of martensite particles.
3. At higher strains (2-3%), a maximum value in the instantaneous work harden-
ing exponent (nmax) is reached. This parameter, which can be considered as
the work hardening capacity of the material, was found to be independent of√
f/d. Additionally, the relative contribution of back stresses was also found
to reach a constant value at a similar von Mises equivalent strain. This ob-
servation suggests that at strains associated with nmax and above, other work
182
Chapter 7 Page 183
hardening mechanisms, not specific to DP steels, become more important. For
microstructural variants with larger ferrite grains, nmax was found to be a func-
tion of ferrite grain size while variants with a refined ferrite matrix showed no
dependence of nmax on ferrite grain size.
4. At strains over 4%, dislocation annihilation by dynamic recovery becomes the
controlling factor for the rate of work hardening. This phenomenon is described
by the dislocation annihilation factor, h, and is a function of√
f/d, the mean
ferrite grain size as well as the morphology and spatial distribution of martensite
particles.
5. The three work hardening parameters of θ at ǫp = 0.5%, nmin and h exhibit
similar relationships with√
f/d and consistent trends between the five mi-
crostructural variants under study. This observation which is in agreement
with the trends observed in measured back stresses, suggests a common role of
internal stresses on the two work hardening mechanisms of GND hardening and
dynamic recovery.
6. At a given UTS value, the AT+CR8+IC microstructural variant, comprising a
uniform distribution of fine, equiaxed martensite particles in a fine, equiaxed
ferrite matrix, exhibited the largest uniform elongation values of all five mi-
crostructural variants, particularly at higher strength levels. Having a nmax pa-
rameter similar to the other two microstructural variants with a refined ferrite
matrix (CR+IC and QT+CR8+IC), the improved uniform elongation values
for AT+CR8+IC were attributed to the smallest h parameter associated with
this microstructural variant.
Chapter 7 Page 184
7.2 Original Contributions to the Field
1. In the present research, five distinctly different DP microstructural variants
with a range of ferrite grain sizes (D), as well as volume fractions (f), sizes (d),
morphologies and spatial distributions of martensite particles were produced.
Characterizing these microstructural variants based on the√
f/d parameter
allowed for an investigation of the effects of ferrite grain size as well as mor-
phology and spatial distribution of martensite particles on the work hardening
behaviour, independent of the volume fraction (f) and the size (d) of marten-
site particles. This new characterization method is particularly useful since
modification of the former three microstructural parameters through thermo-
mechanical processing often results in a different size of martensite particles,
hence, limiting the applicability of characterizations based solely on f , as re-
ported in the literature.
2. This research utilized three different parameters to analyze the work hardening
behaviour of DP steels at various strain levels: the true work hardening rate, θ,
the instantaneous work hardening exponent, n, and the dislocation annihilation
parameter, h. A critical finding was that the microstructural parameters, i.e.
the average ferrite grain size, as well as the volume fraction, size, morphology
and spatial distribution of martensite particles, not only affect the initial work
hardening behaviour (GND hardening and back stress hardening), but they also
significantly influence the work hardening properties at large strains through the
dynamic recovery (dislocation annihilation) process.
3. Despite the variation of the work hardening parameters at both small and large
strains with√
f/d, each microstructural variant exhibited similar instantaneous
Chapter 7 Page 185
work hardening exponent values, nmax, at strains of ∼2-3%. This is a unique
observation for DP steels and suggests the presence of a work hardening ca-
pacity for each microstructural variant, independent of the√
f/d parameter.
An important finding was the effect of ferrite grain size on nmax. That is, for
microstructural variants with large ferrite grains, nmax was found to be a func-
tion of ferrite grain size while variants with a refined ferrite matrix showed no
dependence of nmax on ferrite grain size.
4. Until now, experimental research on back stress effects in DP steels has been
limited. The majority of these publications have been focused on the effect of the
volume fraction of martensite on back stress hardening and studies regarding
the influence of other microstructural parameters on back stresses have been
sparse and often inconclusive. This deficiency was addressed in the present
research by providing a better understanding of the effect of ferrite grain size as
well as the size, morphology and spatial distribution of martensite particles on
back stress hardening, through application of the in-plane forward-reverse shear
deformation tests. Furthermore, it was found that the relative contribution of
back stresses to overall work hardening (β0.002σ ) is generally significant in all
microstructures. Additionally, this contribution reached a constant value at a
von Mises equivalent strain similar to that associated with the transition from
Stage B to Stage C of work hardening in DP steels.
Chapter 7 Page 186
7.3 Future Work
The following extensions to the present study are suggested:
1. Additional thermo-mechanical processing should be done to refine both the fer-
rite grain size and the martensite particle size in the AT+CR8+IC microstruc-
tural variant in order to further improve the uniform elongation values at sim-
ilar strength levels. For example, this goal can be accomplished by decreasing
the initial austenitization temperature to reduce the prior austenite grain size,
thereby refining the AT microstructure, or by increasing the amount of cold-
rolling after the AT pre-treatments and prior to the IC annealing to further
refine the final ferrite grain size.
2. For both the AT+CR8+IC and QT+CR8+IC microstructural variants, the
amount of cold-rolling should be changed to 50, 60, 70 and 90%, instead of
the 80% value used here, thereby producing a series of microstructural variants
with a wide range of ferrite grain sizes. A larger data set of microstructural
variants with different ferrite grain sizes as well as sizes and spatial distribu-
tions of martensite particles could possibly allow for an independent study of
the separate effects of ferrite grain size and spatial distribution of martensite
particles on the work hardening behaviour of DP steels.
3. High resolution EBSD should be used to directly measure the density of the
GNDs in the five microstructural variants investigated herein. These EBSD
experiments should be carried out on an un-deformed specimen as well as spec-
imens with plastic strains of 0.5%, 3% (transition from stage B to C work
hardening) and 5%.
Chapter 7 Page 187
4. To observe and characterize the dislocation substructures formed during defor-
mation, TEM studies should be performed on the five microstructural variants
investigated herein using an undeformed specimen as well as specimens with
plastic strains of 0.5%, 3% and 5%.
5. Neutron diffraction experiments should be performed to measure the internal
stresses associated with ferrite and martensite during in-situ tensile testing of
the five selected DP780 microstructural variants (with martensite volume frac-
tion of ∼15%). The measured internal stresses could then be compared with the
experimental back stresses obtained from forward-reverse in-plane shear testing.
6. Metallography specimens should be made from interrupted shear tests of the five
selected DP780 microstructural variants at a strain level close to that associated
with the saturation of the Bauschinger stress parameter, β0.002σ . Each specimen
should then be examined in the SEM to detect the plastic deformation and/or
fracture of martensite particles.
7. The forward-reverse shear tests on the five microstructural variants should be
extended to other volume fractions of martensite in order to produce master
curves of back stresses with respect to√
f/d.

Appendices
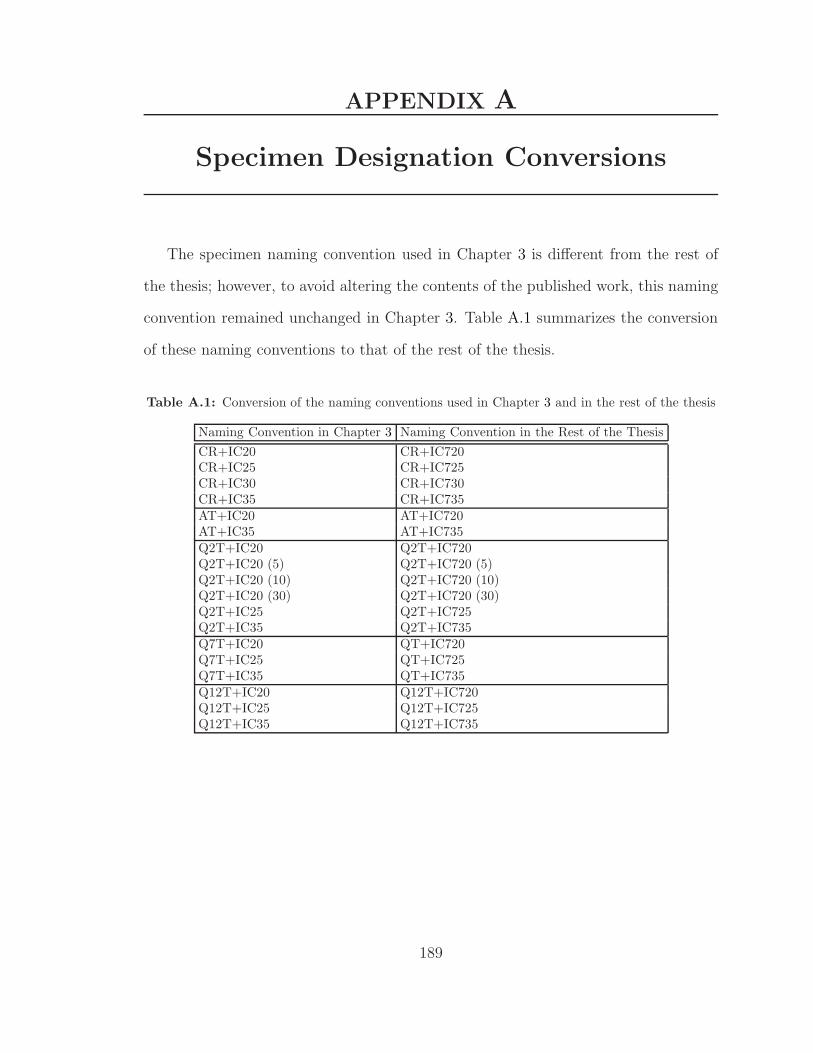
APPENDIX A
Specimen Designation Conversions
The specimen naming convention used in Chapter 3 is different from the rest of
the thesis; however, to avoid altering the contents of the published work, this naming
convention remained unchanged in Chapter 3. Table A.1 summarizes the conversion
of these naming conventions to that of the rest of the thesis.
Table A.1: Conversion of the naming conventions used in Chapter 3 and in the rest of the thesis
Naming Convention in Chapter 3 Naming Convention in the Rest of the Thesis
CR+IC20 CR+IC720CR+IC25 CR+IC725CR+IC30 CR+IC730CR+IC35 CR+IC735AT+IC20 AT+IC720AT+IC35 AT+IC735Q2T+IC20 Q2T+IC720Q2T+IC20 (5) Q2T+IC720 (5)Q2T+IC20 (10) Q2T+IC720 (10)Q2T+IC20 (30) Q2T+IC720 (30)Q2T+IC25 Q2T+IC725Q2T+IC35 Q2T+IC735Q7T+IC20 QT+IC720Q7T+IC25 QT+IC725Q7T+IC35 QT+IC735Q12T+IC20 Q12T+IC720Q12T+IC25 Q12T+IC725Q12T+IC35 Q12T+IC735
189
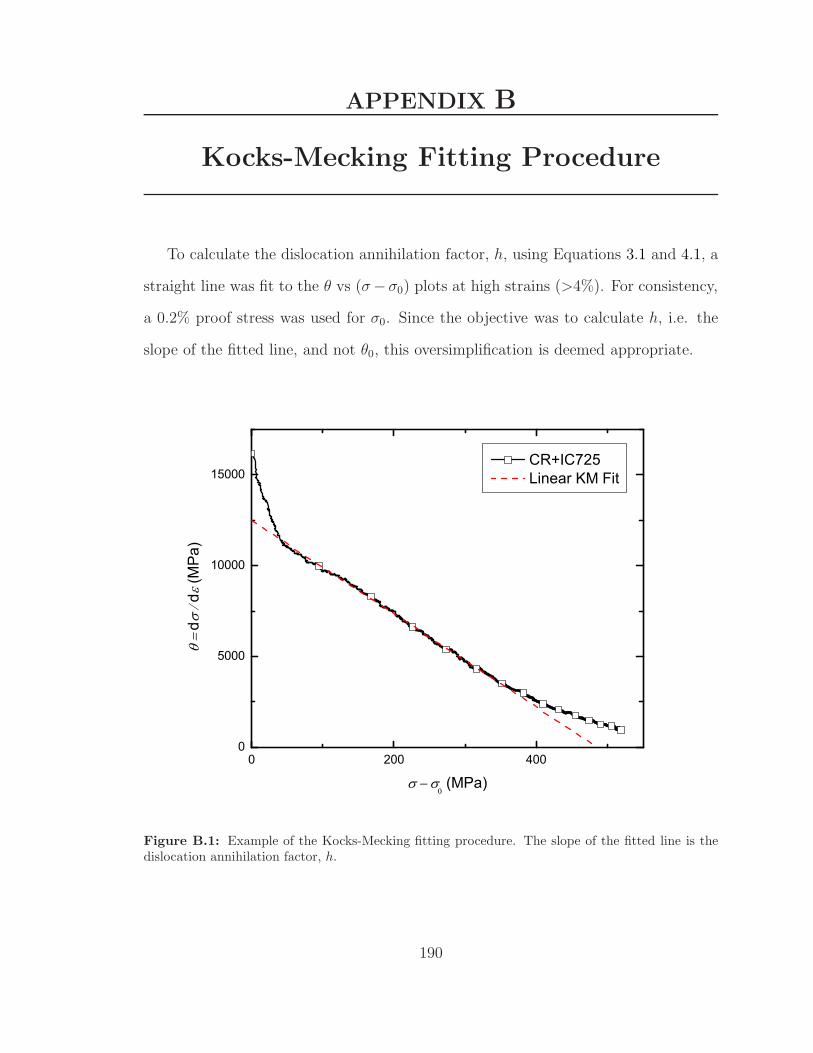
APPENDIX B
Kocks-Mecking Fitting Procedure
To calculate the dislocation annihilation factor, h, using Equations 3.1 and 4.1, a
straight line was fit to the θ vs (σ−σ0) plots at high strains (>4%). For consistency,
a 0.2% proof stress was used for σ0. Since the objective was to calculate h, i.e. the
slope of the fitted line, and not θ0, this oversimplification is deemed appropriate.
0 200 4000
5000
10000
15000
d
d (M
Pa)
CR+IC725 Linear KM Fit
(MPa)
Figure B.1: Example of the Kocks-Mecking fitting procedure. The slope of the fitted line is thedislocation annihilation factor, h.
190

APPENDIX C
Technical Drawings of the Shear Fixture
191
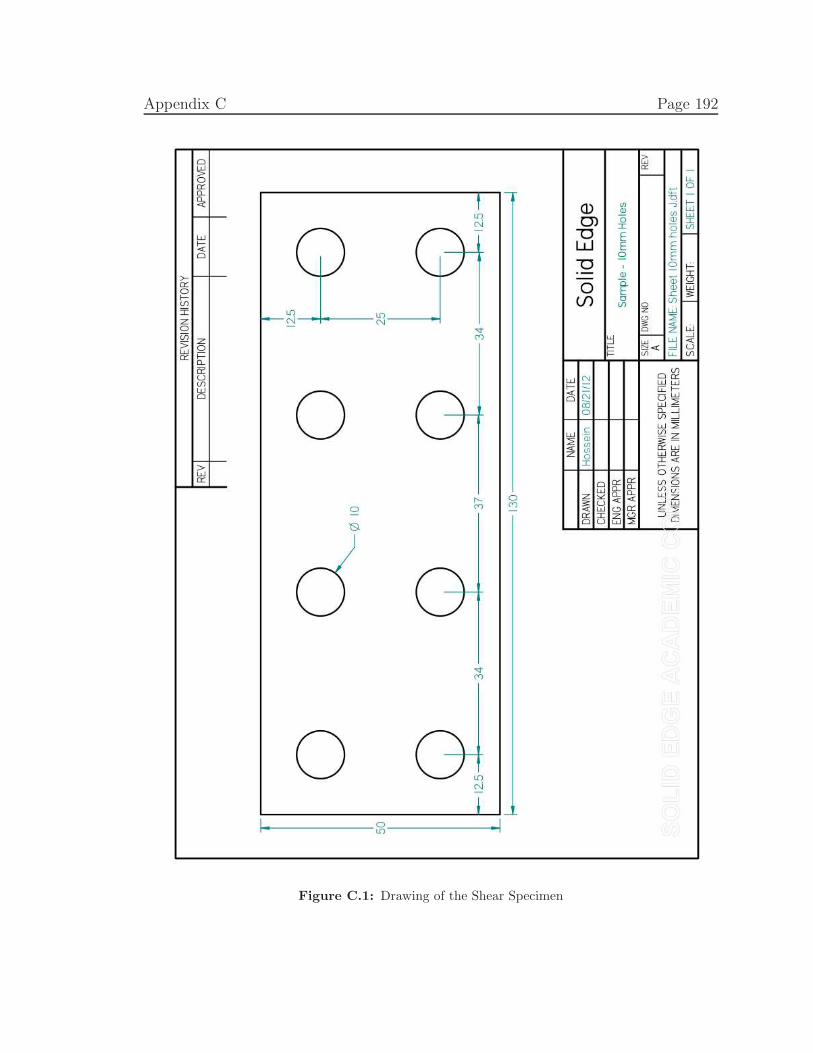
Appendix C Page 192
Figure C.1: Drawing of the Shear Specimen
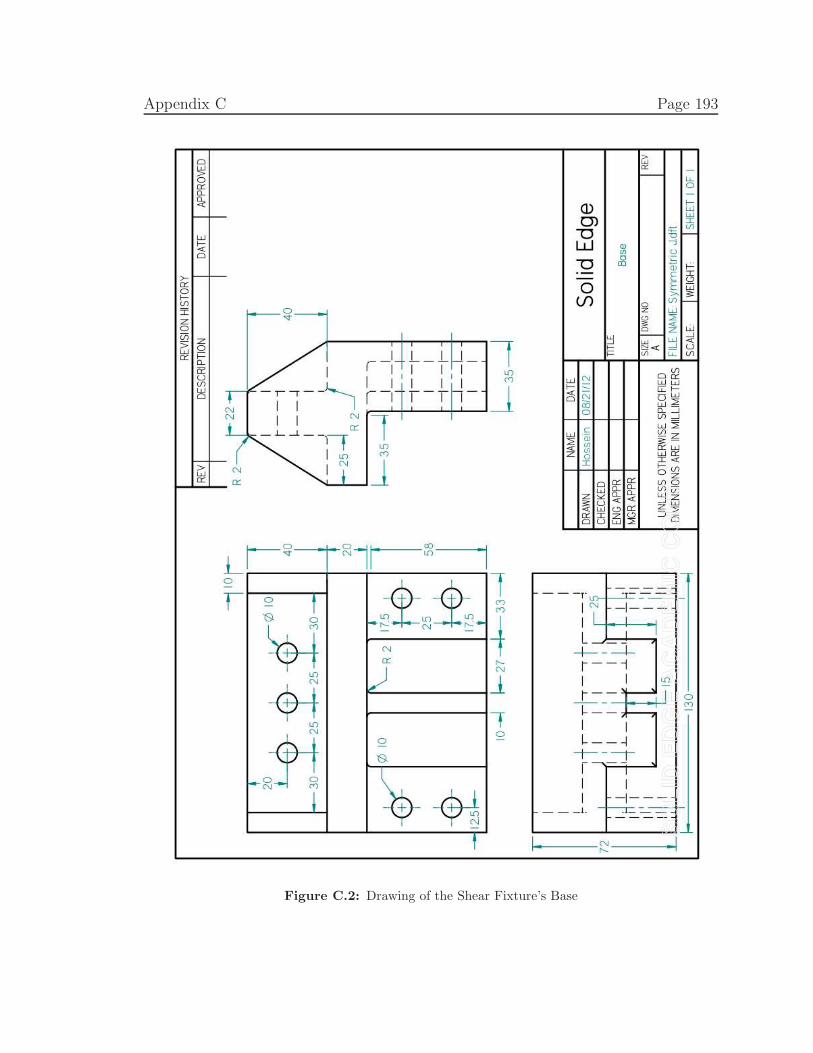
Appendix C Page 193
Figure C.2: Drawing of the Shear Fixture’s Base
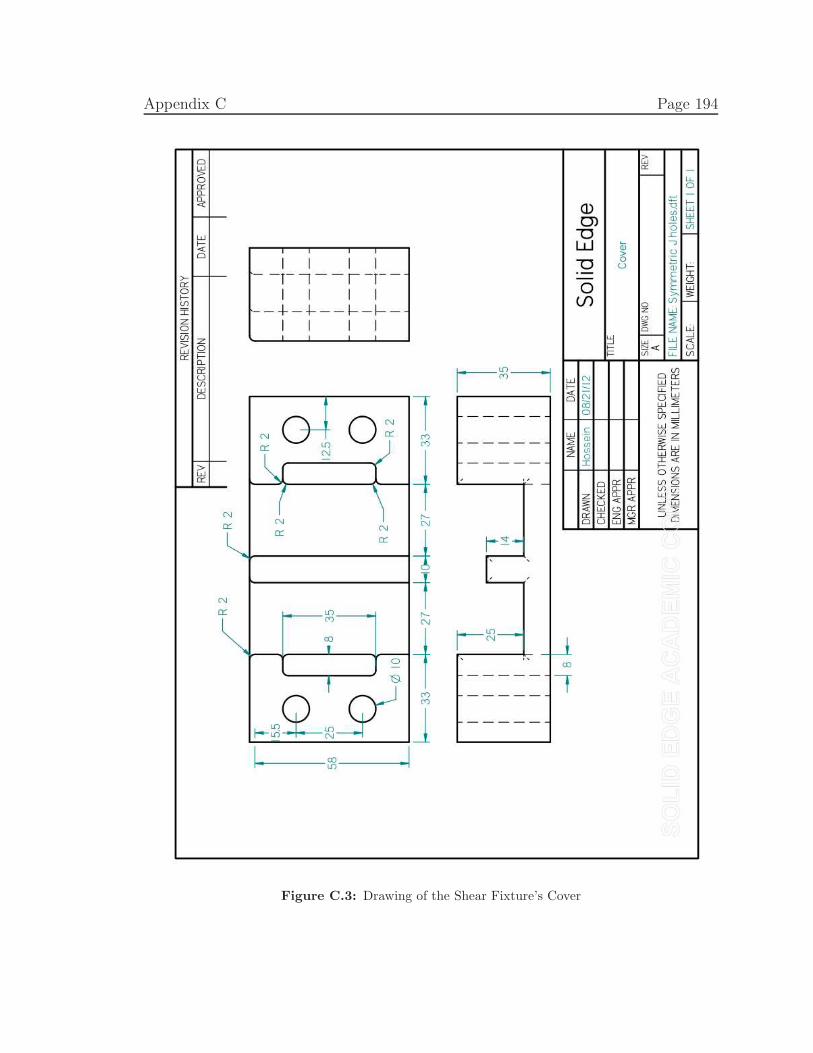
Appendix C Page 194
Figure C.3: Drawing of the Shear Fixture’s Cover
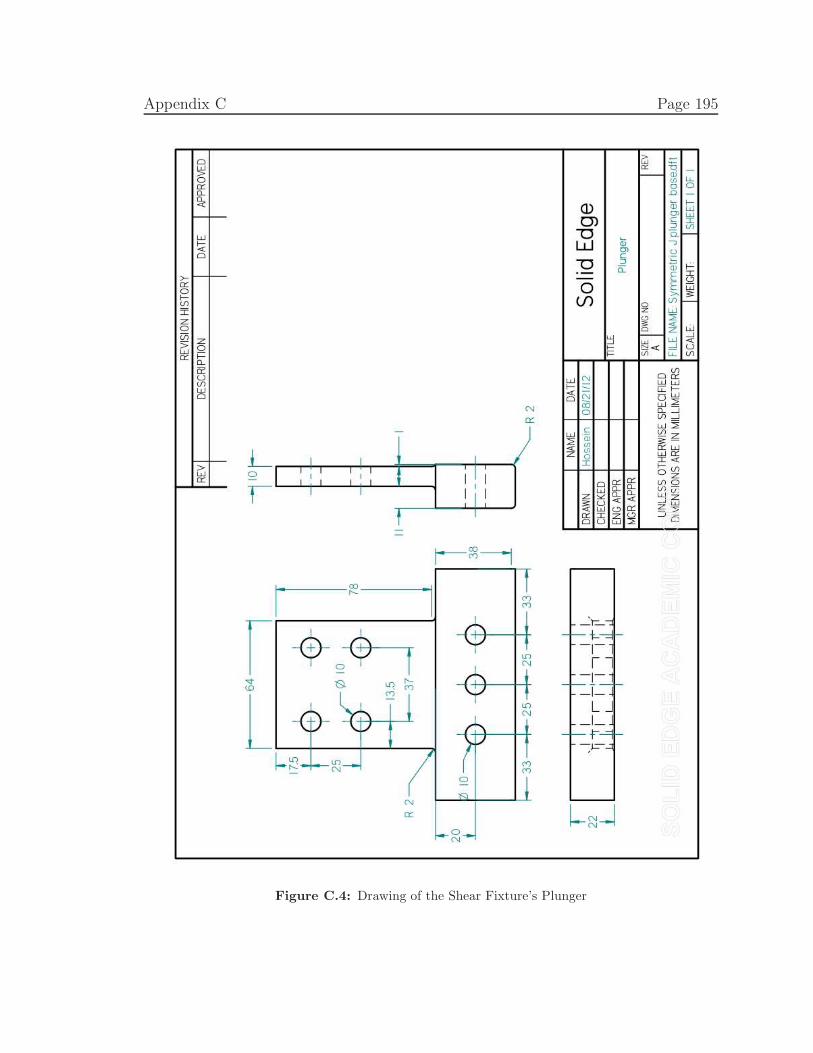
Appendix C Page 195
Figure C.4: Drawing of the Shear Fixture’s Plunger
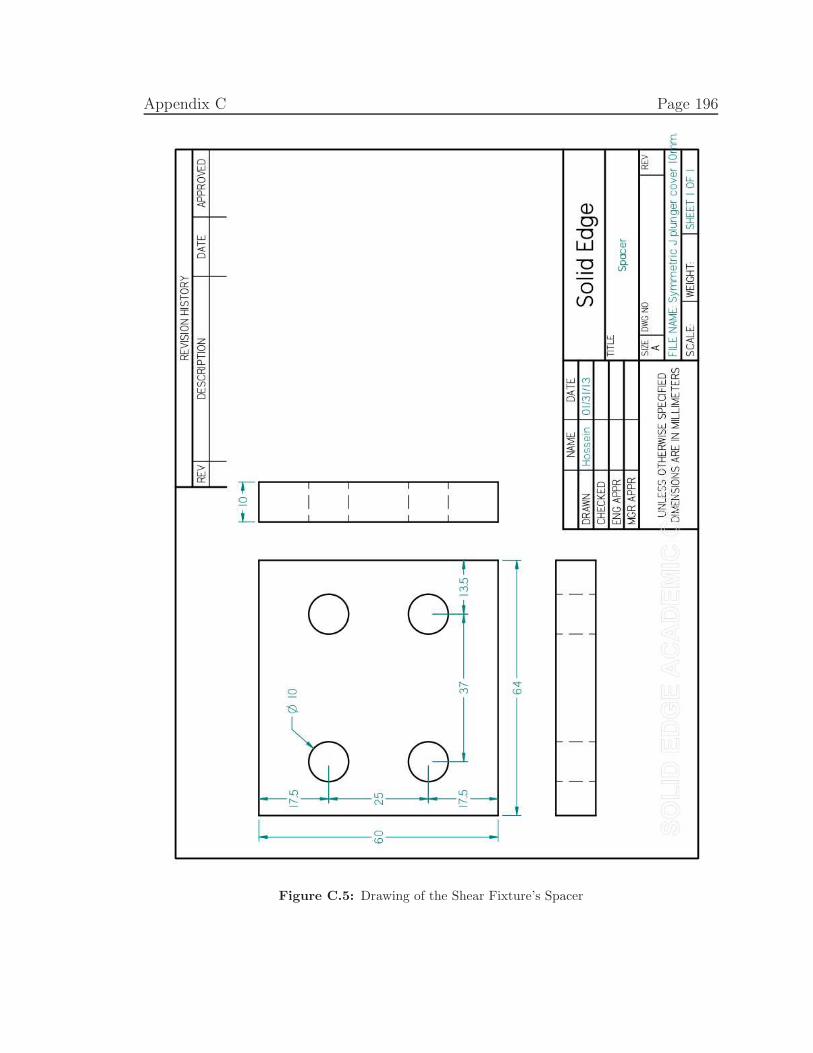
Appendix C Page 196
Figure C.5: Drawing of the Shear Fixture’s Spacer
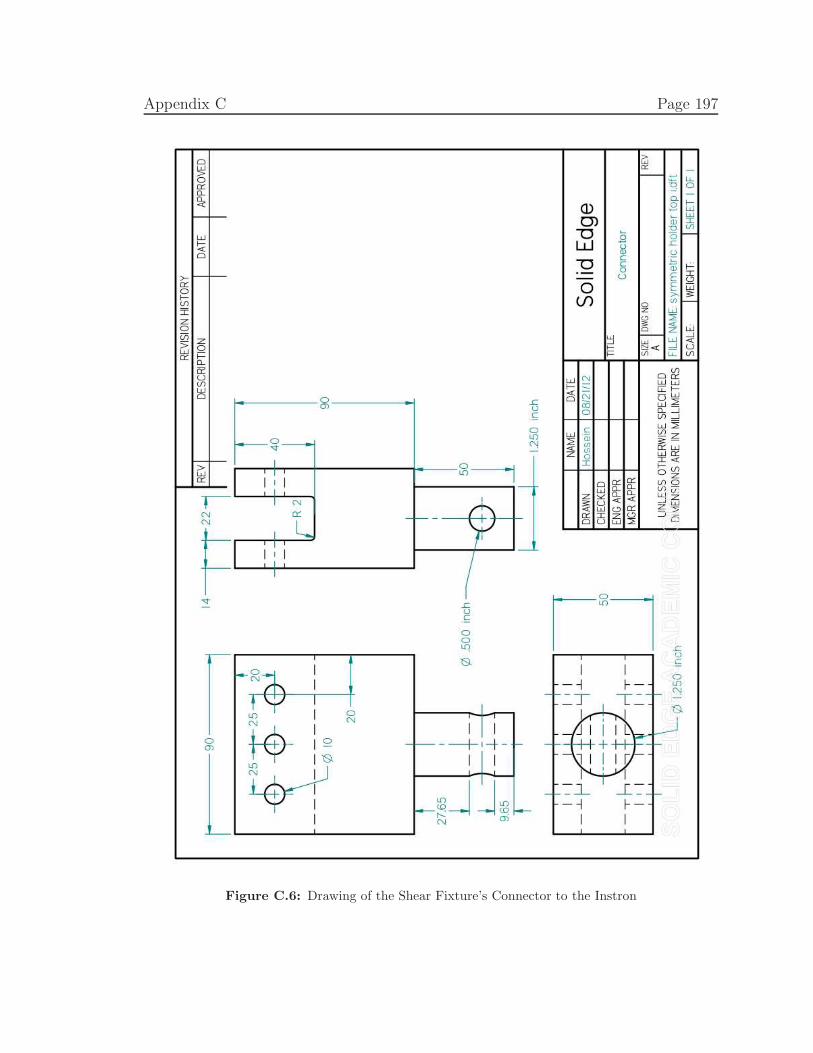
Appendix C Page 197
Figure C.6: Drawing of the Shear Fixture’s Connector to the Instron

A word cloud of the thesis