Embed Size (px)
Citation preview
185
Chapter 8
Thermo-mechanical Properties of Epoxy
Nanocomposites
8.1 Introduction
Increasing use of nanocomposites in various applications emphasizes its importance
and growing significance in ngineering. The heat dissipation in electrical and
electronic devices and apparatus is very important because of increase in operating
electrical/mechanical stresses, current and temperature of equipments. With rapid
developments in electronic devices and equipments, better properties are required for
substrate and packaging materials. These include good thermal conductivity, low co-
efficient of thermal expansion, low dielectric constant, high dielectric strength and
high thermal stability [339]. There is a debate in electronic packaging sector about the
ways and means to achieve packaging reliability when materials of different co-
efficient of thermal expansions (CTE) are needed leading to CTE mismatch and
unequal distribution of stress which can cause fractures.
To effectively solve the thermal dissipation problem and to obtain
comprehensively higher performance, different fillers have been introduced into the
polymer to provide thermally conductive but electrically insulating polymer
nanocomposites [340]. The primary purpose of loading SiO2 fillers in the applications
of no-flow under fill is to reduce the co-efficient of thermal expansion and to increase
the elastic modulus. These two thermo-mechanical properties are critical parameters
to achieve thermo-mechanical reliability of flip-chip packages [341].
Though nanofiller composite sample surface is helpful for conduction of
thermal phonon, it may be also susceptible to breakdown. Voids in sample are not
only the barriers against thermal conduction but are also the pathways for breakdown.
Therefore, it is expected that breakdown strength is also increased by adding fillers.
Moreover, it is already observed that, after the addition of nanofiller, the partial
discharge (PD) resistance of base polymer increases and breakdown strength is
generally enhanced [10, 342]. It is also clarified that tighter interface between filler
and epoxy matrix leads to not only higher thermal conductivity but also higher
breakdown strength [343, 344].
This chapter focuses on DMA, heat deflection temperature, co-efficient of
thermal expansion and thermal conductivity of epoxy-SiO2/Al2O3/ZnO
nanocomposites. Analytical equations are used to predict thermal conductivity of
nanocomposite and their validation is presented.
186
8.2 Dynamic mechanical analysis
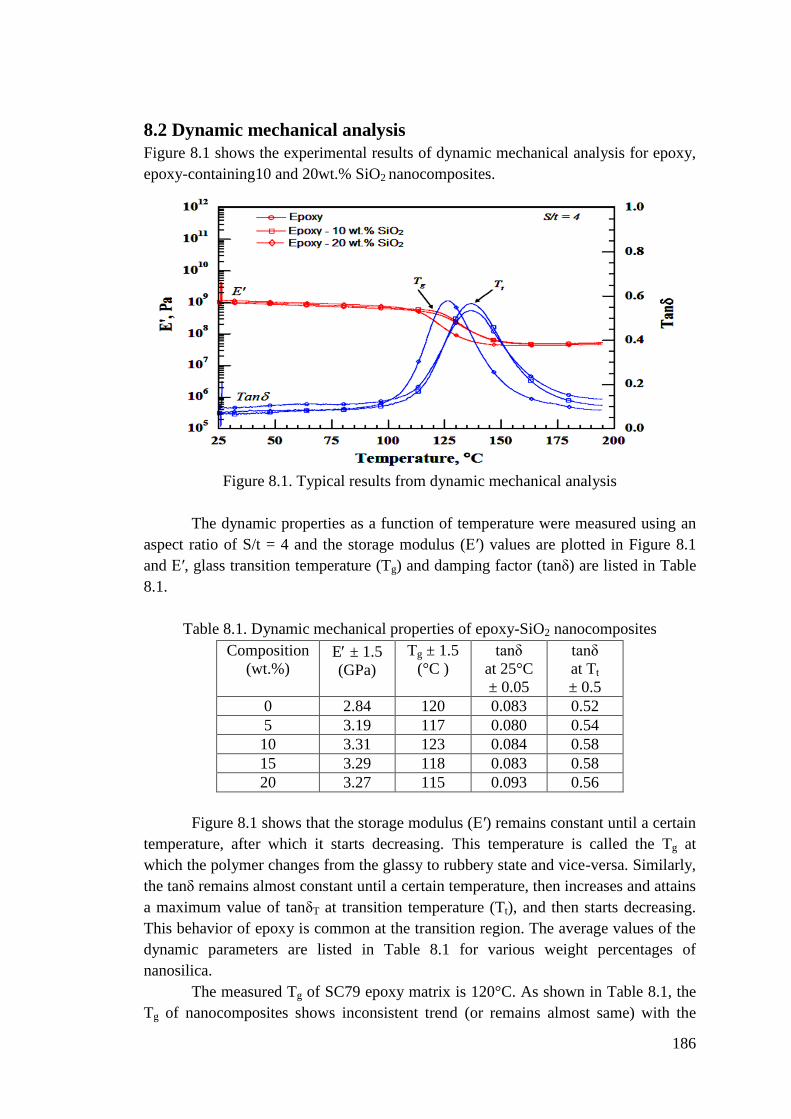
Figure 8.1 shows the experimental results of dynamic mechanical analysis for epoxy,
epoxy-containing10 and 20wt.% SiO2 nanocomposites.
Figure 8.1. Typical results from dynamic mechanical analysis
The dynamic properties as a function of temperature were measured using an
aspect ratio of S/t = 4 and the storage modulus (E′) values are plotted in Figure 8.1
and E′, glass transition temperature (Tg) and damping factor (tanδ) are listed in Table
8.1.
Table 8.1. Dynamic mechanical properties of epoxy-SiO2 nanocomposites
Composition
(wt.%) E ± 1.5
(GPa)
Tg ± 1.5
(°C )
tanδ
at 25°C
± 0.05
tanδ
at Tt
± 0.5
0 2.84 120 0.083 0.52
5 3.19 117 0.080 0.54
10 3.31 123 0.084 0.58
15 3.29 118 0.083 0.58
20 3.27 115 0.093 0.56
Figure 8.1 shows that the storage modulus (E′) remains constant until a certain
temperature, after which it starts decreasing. This temperature is called the Tg at
which the polymer changes from the glassy to rubbery state and vice-versa. Similarly,
the tanδ remains almost constant until a certain temperature, then increases and attains
a maximum value of tanδT at transition temperature (Tt), and then starts decreasing.
This behavior of epoxy is common at the transition region. The average values of the
dynamic parameters are listed in Table 8.1 for various weight percentages of
nanosilica.
The measured Tg of SC79 epoxy matrix is 120°C. As shown in Table 8.1, the
Tg of nanocomposites shows inconsistent trend (or remains almost same) with the
187
percentage weight of nanosilica. For the addition of 20wt.% of nanosilica, the Tg of
nanocomposite is 5°C less than that of SC79 epoxy matrix. While Johnsen and co-
authors [151] have observed similar results, Ma and co-authors [152] have observed a
slight increase in the Tg and have attributed this to the restriction of epoxy molecular
movements by nanosilica at higher temperatures. However, some authors have
observed significant reductions in the Tg of nanosilica modified epoxy resins [155,
345]. It should be noted that the Tg may be reduced because of improper curing and/or
stoichiometric imbalance between the resin and curing agent.
Polymers and composites that exhibit viscoelastic behavior are predominantly
elastic and stiff at 25°C. The molecular motion at 25°C is frozen causing the polymers
to respond like an elastic solid under applied stress. By increasing the temperature, the
viscous damping contribution of the polymer starts to increase and the storage
modulus starts to decrease, thus resulting in a low damping factor (tanδ) at 25°C and
highest damping factor at Tt.
The damping factor at Tt is referred to as the peak-damping factor (tanδT). The
tanδ does not change up to 15wt.% of SiO2 concentration. For 20wt.% SiO2, tanδ
increased by 12%. This may be due to limitations of the experimental method.
Various mechanisms like matrix viscoelasticity, filler/filler interfacial friction,
filler/matrix interfacial friction, etc., could also increase the damping capacity of the
polymer composites. However, as mentioned previously, the molecular motion at
25°C is frozen, and this may not contribute to the damping mechanisms.
At Tt, the tanδ is maximum indicating viscous damping because of the
segmental motion in the polymer [346]. The tanδT of the nanocomposites is in general
is higher than that of epoxy matrix. The tanδT value is maximum for 10 and 15wt.%
of SiO2 and it is about 16% higher than that of epoxy matrix. The reason for this
increase in the damping factor is difficult to explain. Even though this material has
been widely studied, not many authors have reported results of damping factor. Ma
and co-workers [152] have observed that the damping factor of nanocomposite is
lower than that of base resin over a temperature range, and they attributed this to the
strong nanoparticle/matrix interfacial adhesion. Chen and co-authors [345] have
reported a significant increase in the damping factor of nanocomposites as compared
to that of base matrix.
The storage modulus of SC79 epoxy matrix measured at 25°C is 2.84GPa. The
addition of SiO2 to epoxy matrix is expected to reinforce the matrix and increase its
elastic modulus. This can be seen from results in Table 8.1, which shows higher
modulus for epoxy-SiO2 nanocomposites. The storage modulus of nanocomposites is
observed to increase monotonically with the SiO2 content. The maximum storage
modulus is observed at 10wt.% SiO2, which is about 17% higher than that of epoxy
matrix. Beyond 10wt.%, addition of more SiO2 had little effect on the storage
modulus of nanocomposites, and it remains constant. The modulus of epoxy-SiO2
nanocomposite is predicted using the Halpin-Tsai equations [347, 348] (with AR = 1)
as described by equations (8.1) and (8.2).
188
1
1
f
m
m
VE E
V
(8.1)
1 /f f
m m
E E
E E
(8.2)
where, Ef = Modulus of filler, Em = Modulus of matrix, Vf = Volume fraction
of filler, Vm = Volume fraction of matrix and ξ = Shape factor
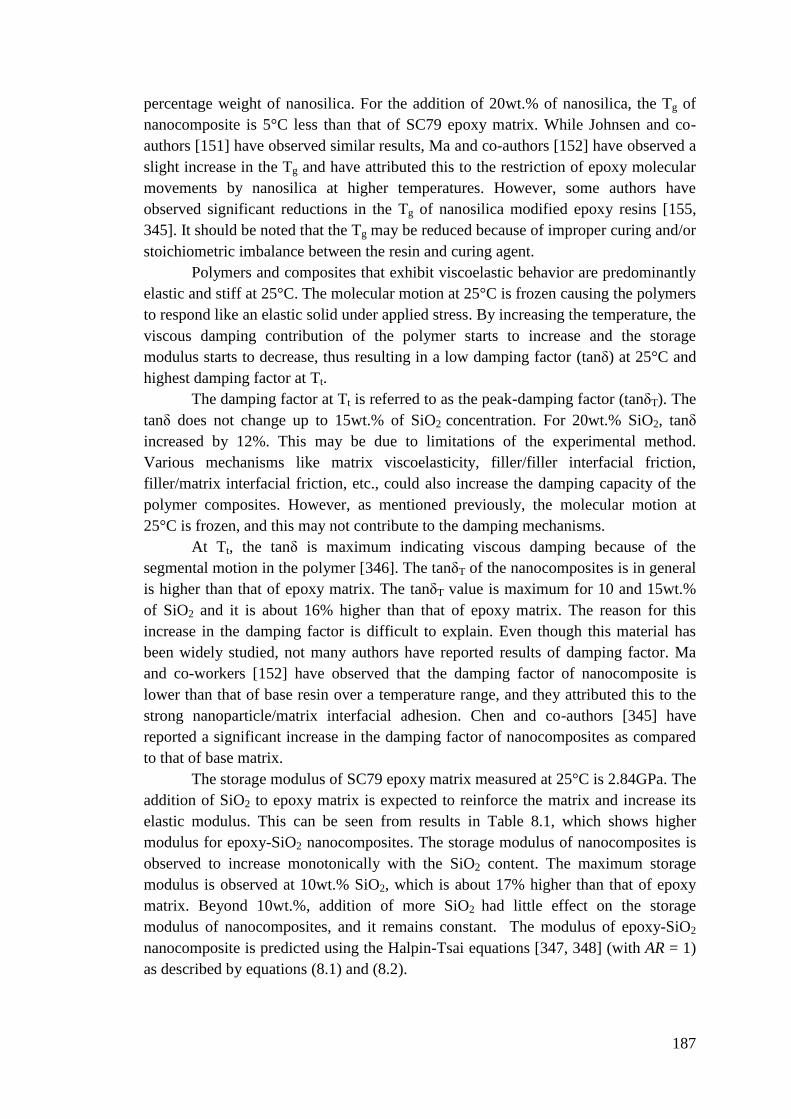
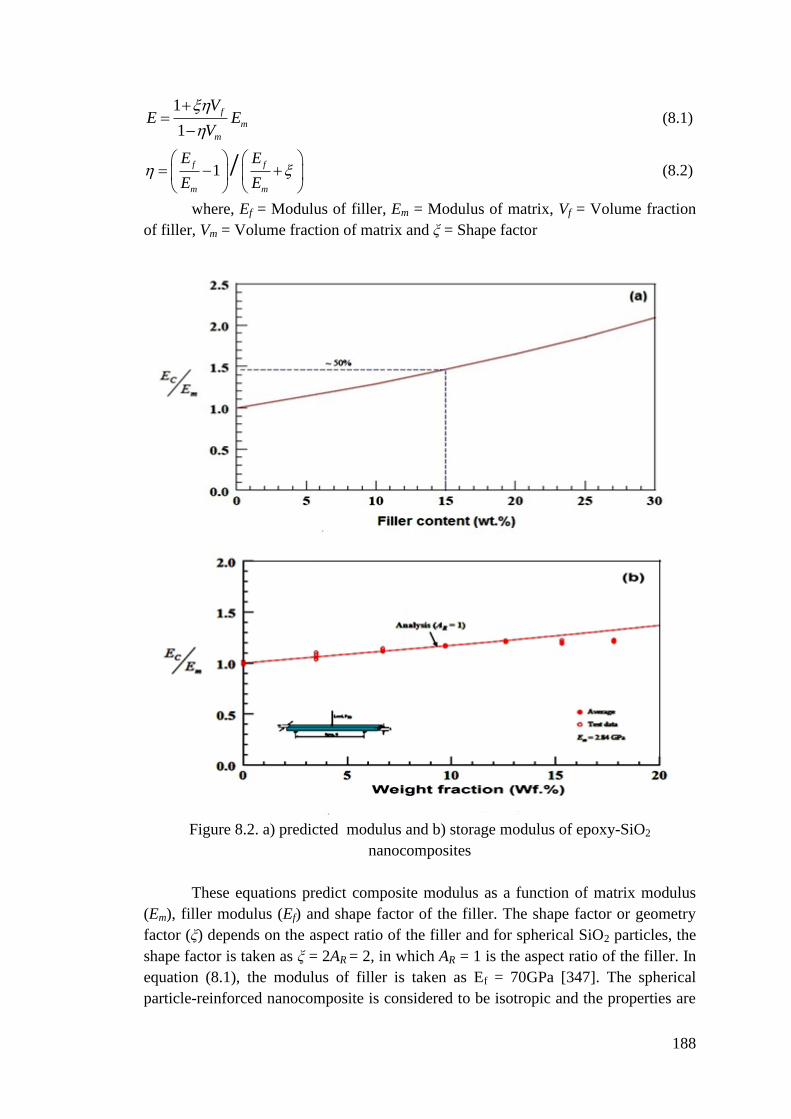
Figure 8.2. a) predicted modulus and b) storage modulus of epoxy-SiO2
nanocomposites
These equations predict composite modulus as a function of matrix modulus
(Em), filler modulus (Ef) and shape factor of the filler. The shape factor or geometry
factor (ξ) depends on the aspect ratio of the filler and for spherical SiO2 particles, the
shape factor is taken as ξ = 2AR = 2, in which AR = 1 is the aspect ratio of the filler. In
equation (8.1), the modulus of filler is taken as Ef = 70GPa [347]. The spherical
particle-reinforced nanocomposite is considered to be isotropic and the properties are
189
same in all directions. Figure 8.2 shows the plot of Ec v/s Vf of epoxy-SiO2 reinforced
nanocomposites, where Ec is the modulus of the nanocomposite. It is observed that
for a practically limited volume fraction of 15%, a 50% improvement in the modulus
is achieved. It can be concluded that SiO2 shows excellent potential for enhancing the
modulus of epoxy matrix. Figure 8.2 also shows a comparison of experimental and
analytical results, and an excellent agreement exists between the two up to 12.6wt.%
of SiO2 concentration. Similar results are observed by Johnsen and co-authors [151].
They computed the modulus of epoxy-SiO2 nanocomposites and observed it to
increase monotonically up to 20wt.%. SiO2 concentration.
However, their experimental and analytical results matched only up to
11.1wt.% of nanosilica. Beyond this, they observed that the modulus of
nanocomposites is lower than that of the analytical predictions. They attribute the
difference between the experimental and analytical results to the imperfect
nanoparticle/matrix interface, which are not considered in the analytical model.
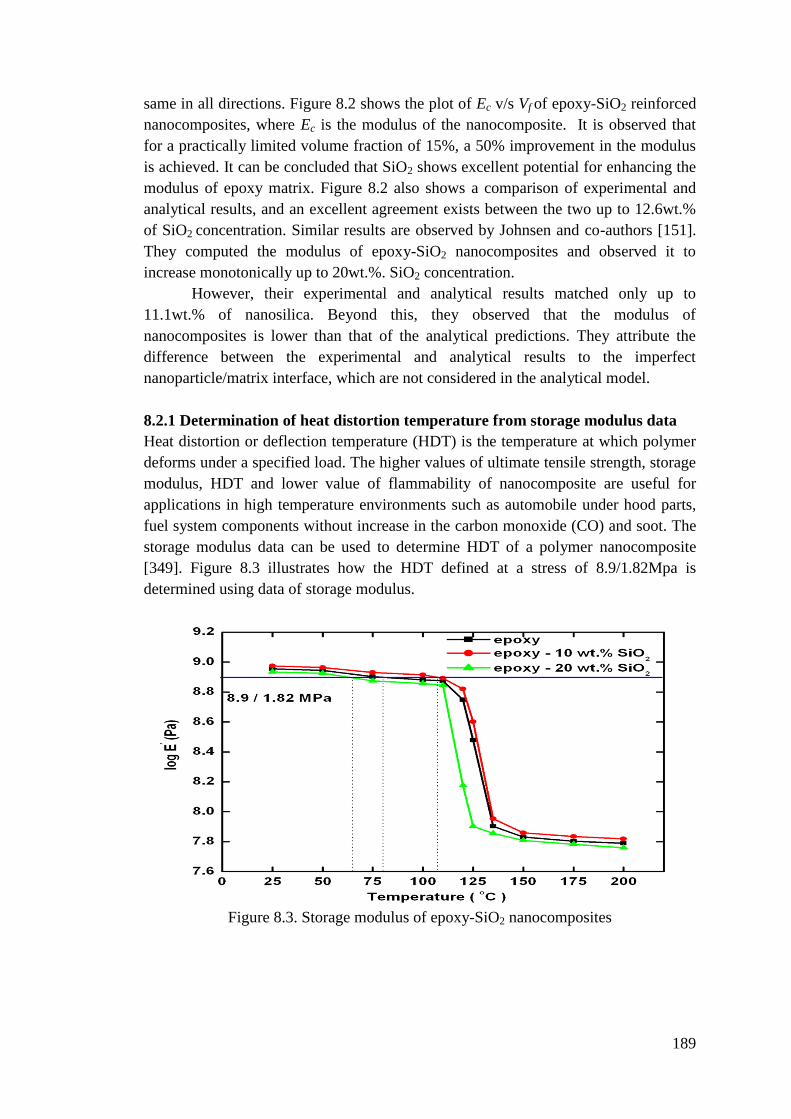
8.2.1 Determination of heat distortion temperature from storage modulus data
Heat distortion or deflection temperature (HDT) is the temperature at which polymer
deforms under a specified load. The higher values of ultimate tensile strength, storage
modulus, HDT and lower value of flammability of nanocomposite are useful for
applications in high temperature environments such as automobile under hood parts,
fuel system components without increase in the carbon monoxide (CO) and soot. The
storage modulus data can be used to determine HDT of a polymer nanocomposite
[349]. Figure 8.3 illustrates how the HDT defined at a stress of 8.9/1.82Mpa is
determined using data of storage modulus.
Figure 8.3. Storage modulus of epoxy-SiO2 nanocomposites
190
Table 8.2. Heat deflection temperature of epoxy-SiO2 nanocomposite
Composition
(wt.%)
Theoretical
HDT (°C)
Experimental
HDT (°C)
0 67 69
5 89 92
10 110 113
15 102 103
20 80 82
The intersection of these curves with the horizontal line is a good
approximation to the HDT. The addition of 10 and 20wt.% of SiO2 into epoxy
increases the HDT by 43 and 13C and this temperature rise is a benchmark for many
engineering applications. Dispersion of SiO2 within the epoxy matrix results in a
considerable increase in stiffness at all temperatures, as shown in the plot of storage
modulus in Figure 8.3. Heat deflection temperature of epoxy-SiO2 nanocomposites
are listed in Table 8.2. The improved HDT for epoxy-SiO2 nanocomposite arise
primarily from the combination of high modulus and aspect ratio of SiO2 filler, rather
than from changes in the epoxy matrix caused by the SiO2 particles. The increase of
HDT due to nanofiller dispersion is very important for epoxy, not only from the
industrial application view point, but also because it is difficult to achieve similar
enhancements by chemical modification or reinforcement by other fillers [349]. The
improvement in HDT originates from better mechanical stability of the
nanocomposites as compared to pure epoxy.
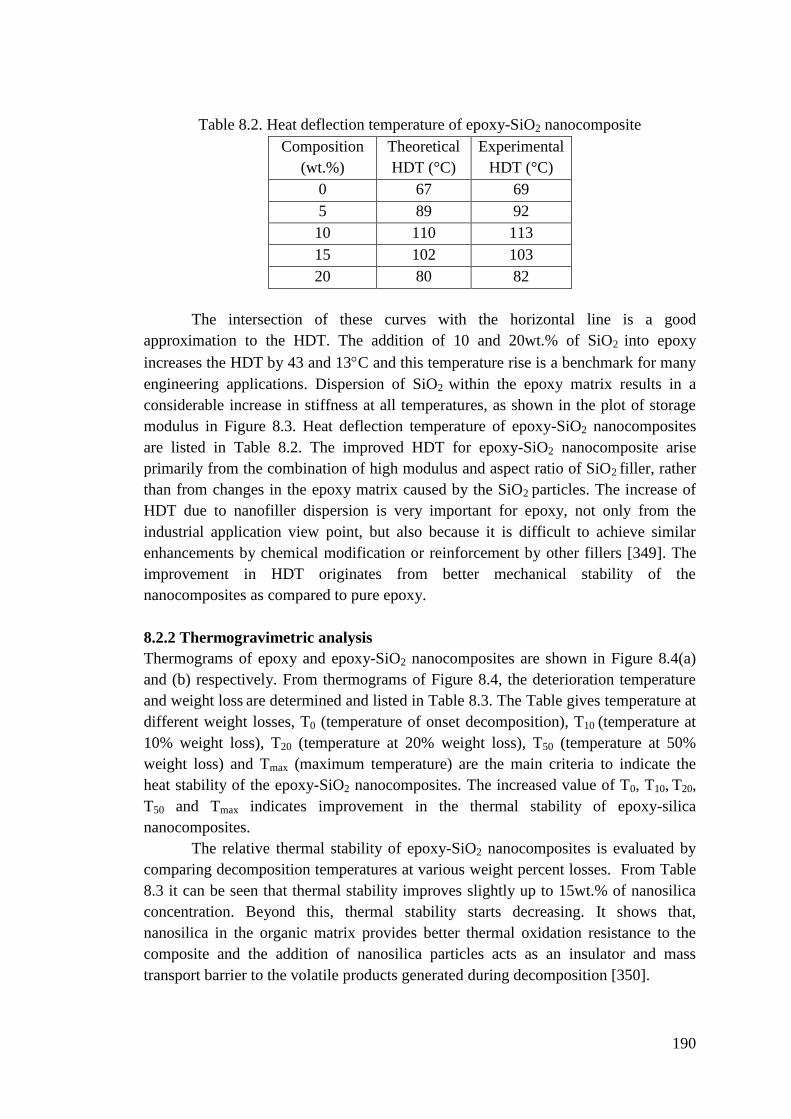
8.2.2 Thermogravimetric analysis
Thermograms of epoxy and epoxy-SiO2 nanocomposites are shown in Figure 8.4(a)
and (b) respectively. From thermograms of Figure 8.4, the deterioration temperature
and weight loss are determined and listed in Table 8.3. The Table gives temperature at
different weight losses, T0 (temperature of onset decomposition), T10 (temperature at
10% weight loss), T20 (temperature at 20% weight loss), T50 (temperature at 50%
weight loss) and Tmax (maximum temperature) are the main criteria to indicate the
heat stability of the epoxy-SiO2 nanocomposites. The increased value of T0, T10, T20,
T50 and Tmax indicates improvement in the thermal stability of epoxy-silica
nanocomposites.
The relative thermal stability of epoxy-SiO2 nanocomposites is evaluated by
comparing decomposition temperatures at various weight percent losses. From Table
8.3 it can be seen that thermal stability improves slightly up to 15wt.% of nanosilica
concentration. Beyond this, thermal stability starts decreasing. It shows that,
nanosilica in the organic matrix provides better thermal oxidation resistance to the
composite and the addition of nanosilica particles acts as an insulator and mass
transport barrier to the volatile products generated during decomposition [350].
191
For 20wt.% of loading, agglomerates of silica particles are observed. Thus it
is expected that at this loading, the thermal stability will be low compared to lower
filler loading because of agglomeration, filler-filler interaction and less filler-epoxy
matrix interaction. Hence thermal performance shows signs of deterioration. From
thermograms of Figure 8.4(b), the values of onset (To) and maximum degradation
temperature (Tp) of epoxy and epoxy-SiO2 nanocomposites are computed and
presented in Table 8.3.
Figure 8.4. TGA thermograms: a) weight loss and b) derivative weight of pure epoxy
and epoxy-SiO2 nanocomposites
It is observed from Table 8.4 that inorganic content remains as residue for all
the filler loading except with pure epoxy matrix. Vyazovkin and co-workers [351]
have reported that the virgin polymer degrades without forming any residue and in
comparison nanocomposites of this studies (as expected) leave some residue behind.
192
Table 8.3. Transition data obtained from TGA curves for epoxy-SiO2 nanocomposites
Composition
(wt.%)
Temperature at different
weight loss ±3%
T0 T10 T20 T50 Tmax
0 297 358 367 396 692
5 299 359 369 399 744
10 300 361 372 403 744
15 301 362 373 404 744
20 230 281 289 346 550
Table 8.4. TGA results for epoxy-SiO2 nanocomposites
Composition
(wt.%)
Transition temperature ± 3%
T0 Tp Tc Residue (%)
0 297 368 393 0.0078
5 299 370 392 3.6630
10 300 373 398 7.1900
15 301 376 390 10.800
20 230 251 301 17.260
As observed from Figure. 8.4(b), the thermal degradation appears to involve a
single step. The maximum degradation temperature (Tp) of epoxy matrix is 368°C and
it increases with silica concentration up to 15wt.% and reduces significantly at
20wt.%. This is due to increase in adhesion of the polymer molecular chains to SiO2
particle surface.
The pattern of the thermograms for all the epoxy-SiO2 nanocomposites are
identical since the thermal weight loss of the nanocomposites is due to organic epoxy
matrix. Generally, exothermic peaks are observed involving weight loss. There is no
weight change and weight gain which are known to be the result of combustion,
crystallization and oxidation [260].
8.2.3 Thermal conductivity
Thermal conductivity () is a kinetic property determined by the contributions from
the vibration, rotational, and electronic degrees of freedom. It is an extremely
important material property when high-power/high-temperature electronic and
optoelectronic device applications are considered. Any improvement in the thermal
conductivity and the corresponding heat capacity leads to the formation of a heat sink
dissipating the reaction heat of the composite. These prevent local overheating and
also result in the reduction of shrinkage stresses.
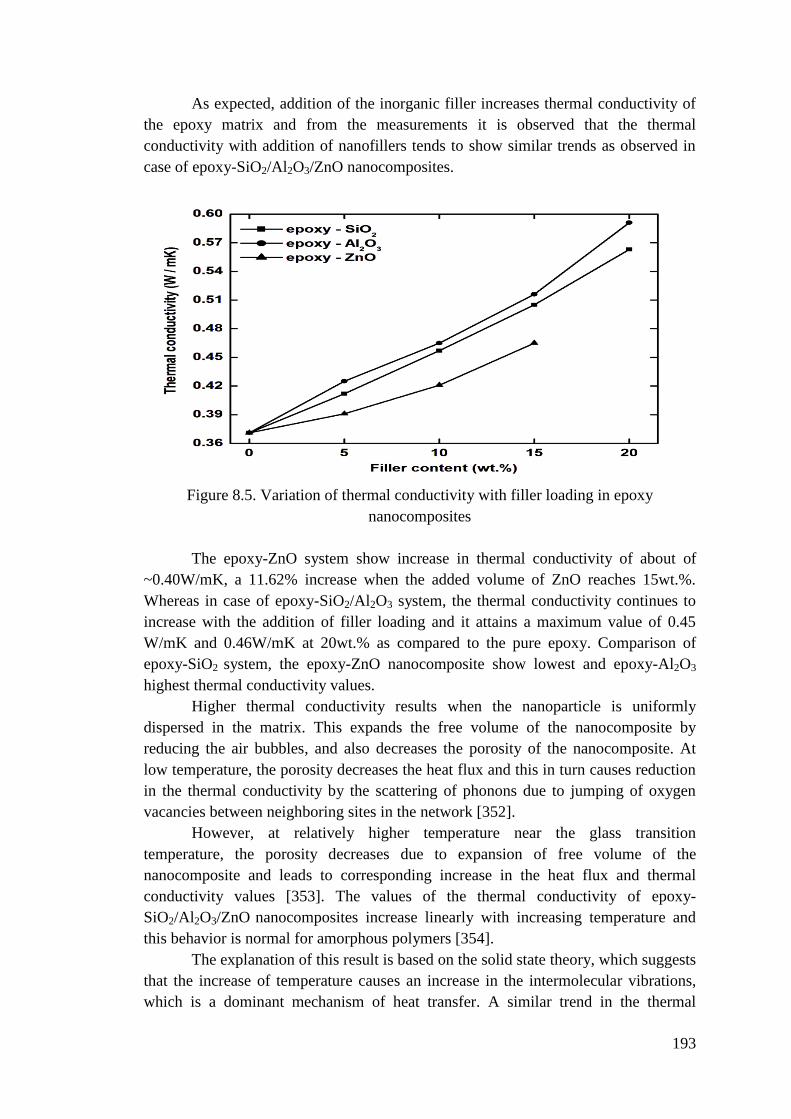
From Figure 8.5, it is observed that the thermal conductivity of
SiO2/Al2O3/ZnO filled epoxy nanocomposites increases by 34%, 37% and 25% as
compared to the pure epoxy. This result can be explained on the basis of the higher
value of SiO2/Al2O3/ZnO nanoparticles in comparison with the pure epoxy. The of
SiO2=12W/mK, Al2O3=30W/mK and ZnO=0.85W/mK and of epoxy=0.371W/mK.
193
As expected, addition of the inorganic filler increases thermal conductivity of
the epoxy matrix and from the measurements it is observed that the thermal
conductivity with addition of nanofillers tends to show similar trends as observed in
case of epoxy-SiO2/Al2O3/ZnO nanocomposites.
Figure 8.5. Variation of thermal conductivity with filler loading in epoxy
nanocomposites
The epoxy-ZnO system show increase in thermal conductivity of about of
~0.40W/mK, a 11.62% increase when the added volume of ZnO reaches 15wt.%.
Whereas in case of epoxy-SiO2/Al2O3 system, the thermal conductivity continues to
increase with the addition of filler loading and it attains a maximum value of 0.45
W/mK and 0.46W/mK at 20wt.% as compared to the pure epoxy. Comparison of
epoxy-SiO2 system, the epoxy-ZnO nanocomposite show lowest and epoxy-Al2O3
highest thermal conductivity values.
Higher thermal conductivity results when the nanoparticle is uniformly
dispersed in the matrix. This expands the free volume of the nanocomposite by
reducing the air bubbles, and also decreases the porosity of the nanocomposite. At
low temperature, the porosity decreases the heat flux and this in turn causes reduction
in the thermal conductivity by the scattering of phonons due to jumping of oxygen
vacancies between neighboring sites in the network [352].
However, at relatively higher temperature near the glass transition
temperature, the porosity decreases due to expansion of free volume of the
nanocomposite and leads to corresponding increase in the heat flux and thermal
conductivity values [353]. The values of the thermal conductivity of epoxy-
SiO2/Al2O3/ZnO nanocomposites increase linearly with increasing temperature and
this behavior is normal for amorphous polymers [354].
The explanation of this result is based on the solid state theory, which suggests
that the increase of temperature causes an increase in the intermolecular vibrations,
which is a dominant mechanism of heat transfer. A similar trend in the thermal
194
conductivity of pure epoxy by the addition of Al2O3 nanofiller was observed by
Kochetov and co-authors [354] and Okasaki and co-authors [355]. Among the three
nanocomposites, higher value of thermal conductivity is achieved in case of epoxy-
Al2O3 nanocomposite due to higher thermal conductivity values of Al2O3.
The thermal resistance, which is caused by phonon scattering processes, plays
a dominant role in limiting the thermal conductivity. The scattering phenomenon of
phonons in composite materials is mainly due to the existence of a thermal barrier,
originating from the acoustic mismatch at the interface between the organic polymer
host and the ceramic filler. The composite containing the largest number of
nanoparticles means lowest particle surface area, and highest thermal conductivity
value. This is because the interfacial thermal barrier is relatively small as compared to
other nanocomposites.
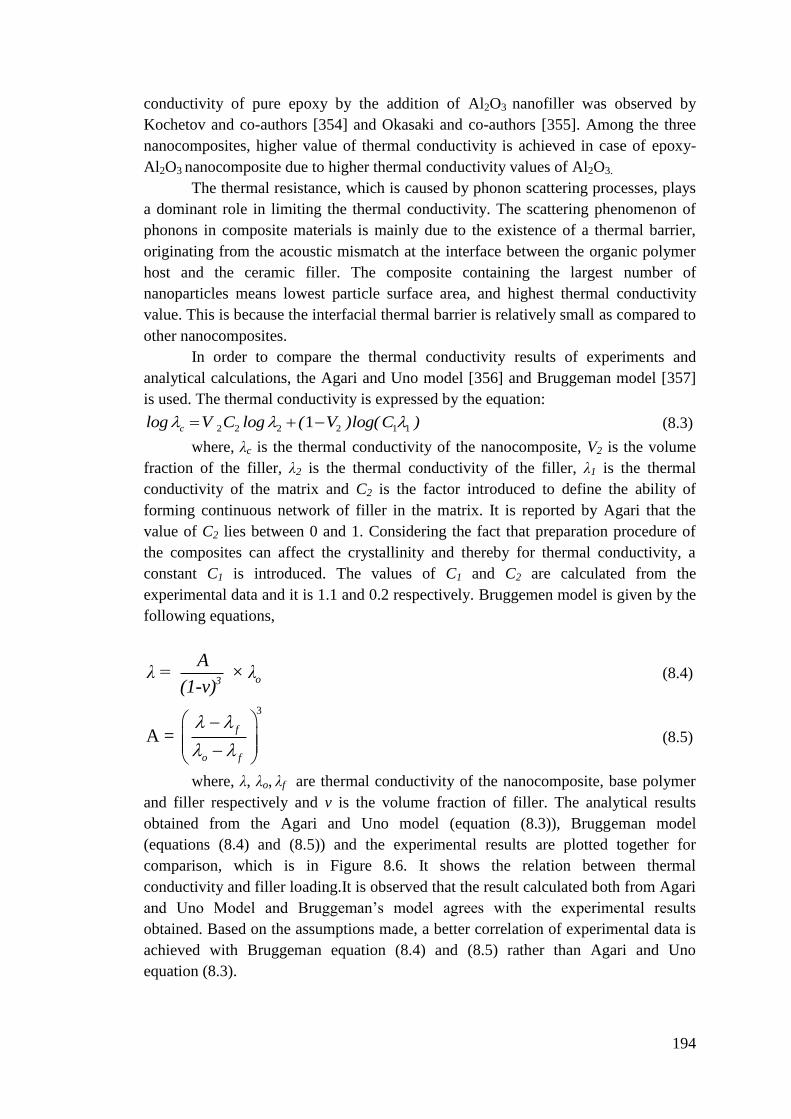
In order to compare the thermal conductivity results of experiments and
analytical calculations, the Agari and Uno model [356] and Bruggeman model [357]
is used. The thermal conductivity is expressed by the equation:
2 2 2 2 1 11 clog V C log ( V )log(C ) (8.3)
where, λc is the thermal conductivity of the nanocomposite, V2 is the volume
fraction of the filler, λ2 is the thermal conductivity of the filler, λ1 is the thermal
conductivity of the matrix and C2 is the factor introduced to define the ability of
forming continuous network of filler in the matrix. It is reported by Agari that the
value of C2 lies between 0 and 1. Considering the fact that preparation procedure of
the composites can affect the crystallinity and thereby for thermal conductivity, a
constant C1 is introduced. The values of C1 and C2 are calculated from the
experimental data and it is 1.1 and 0.2 respectively. Bruggemen model is given by the
following equations,
o3
Aλ = × λ
(1-v) (8.4)
3
A = f
o f
(8.5)
where, λ, λo, λf are thermal conductivity of the nanocomposite, base polymer
and filler respectively and v is the volume fraction of filler. The analytical results
obtained from the Agari and Uno model (equation (8.3)), Bruggeman model
(equations (8.4) and (8.5)) and the experimental results are plotted together for
comparison, which is in Figure 8.6. It shows the relation between thermal
conductivity and filler loading.It is observed that the result calculated both from Agari
and Uno Model and Bruggeman’s model agrees with the experimental results
obtained. Based on the assumptions made, a better correlation of experimental data is
achieved with Bruggeman equation (8.4) and (8.5) rather than Agari and Uno
equation (8.3).
195
Figure 8.6. Comparison of thermal conductivities between experimental data and
theoretical curves
196
8.2.3.1 Establishing correlation between breakdown strength and thermal
conductivity
The base board of IGBT (Insulated Gate Bipolar Transistor) is usually made of
ceramics. However, the ceramics are brittle, expensive and hard to manufacture.
Therefore a new material is needed in place of conventional materials. Epoxy matrix
is thought to be a good choice except its low thermal conductivity. To increase the
thermal conductivity of epoxy resin, the filling of nanoinorganic particles with high
thermal conductivity seems to be good approach [186, 358]. However, it is also
observed that epoxy nanocomposite usually has much lower breakdown voltage
strength.
The insulation breakdown voltage strength of epoxy resin decreases as
temperature increases and in particular if Tg increases, the breakdown voltage strength
decreases drastically. The heat generated in the device arises mainly from increase in
operating current and temperature which occur at the junction between the dielectric
layer and semiconducting layer. Heat flows to the junction by means of conduction
from the dielectric layer and semi conducting layer, which is the heat generation
point. The heat is then transferred into the surrounding air by radiation from the
junction. The thermal conductivity of insulating materials has an impact on the
temperature increase; the higher the thermal conductivity, the less will be the
temperature rise. Therefore, increasing thermal conductivity can effectively increase
the insulation breakdown voltage strength.
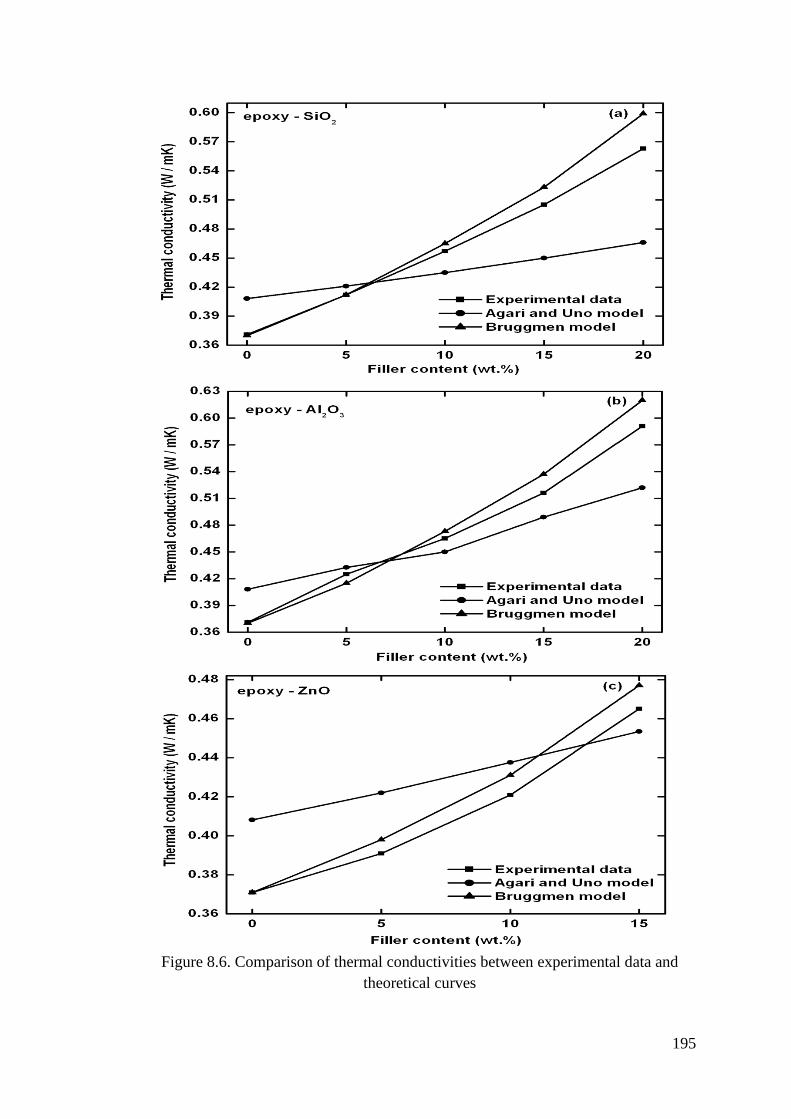
From the Figure 8.7, it is observed that thermal conductivity increases with
increase in filler loading up to 20wt.% where as the breakdown voltage strength
increases up to 15wt.% and thereafter decreases. It shows that both dielectric strength
and thermal conductivity increase proportionately. At 20wt.% of filler loading, it is
observed that agglomeration of SiO2 particles takes place. So, it can be expected that
at this loading, the thermal stability will be low as compared to lower filler loading
because of agglomeration, filler-filler interaction and less filler-epoxy matrix
interaction.
Figure 8.7. Relationship between thermal conductivity and dielectric strength
197
Hence the thermal performance starts deteriorating. Thus breakdown voltage
strength of the nanocomposite decreases as temperature increases in particular, if the
temperature is above Tg, the breakdown voltage strength starts decreasing drastically.
However, increase in thermal conductivity depends on the metal oxide filler
loading. It is also clarified that tighter interface between filler and epoxy matrix leads
to not only higher thermal conductivity but also higher breakdown strength due to the
nanoSiO2 filler surface modification. In the present case, it is observed that the epoxy-
SiO2 nanocomposite with improved thermal conductivity and acceptable dielectric
break down strength are achieved. This relationship gives important information on
engineering of electrical insulation and thermal conductivity of epoxy nanocomposite
to the desirable levels in industrial applications.
In order to optimize the epoxy nanocomposite with low dielectric constant,
low dissipation factor, high thermal conductivity and higher breakdown voltage
strength, the following equation (8.6) is used.
λBreak down voltage = 253
f ε tanδ α kV (8.6)
where, is the thermal conductivity, f is the frequency, is the dielectric constant and
is the thermal co-efficient expansion. The analytical results obtained from the
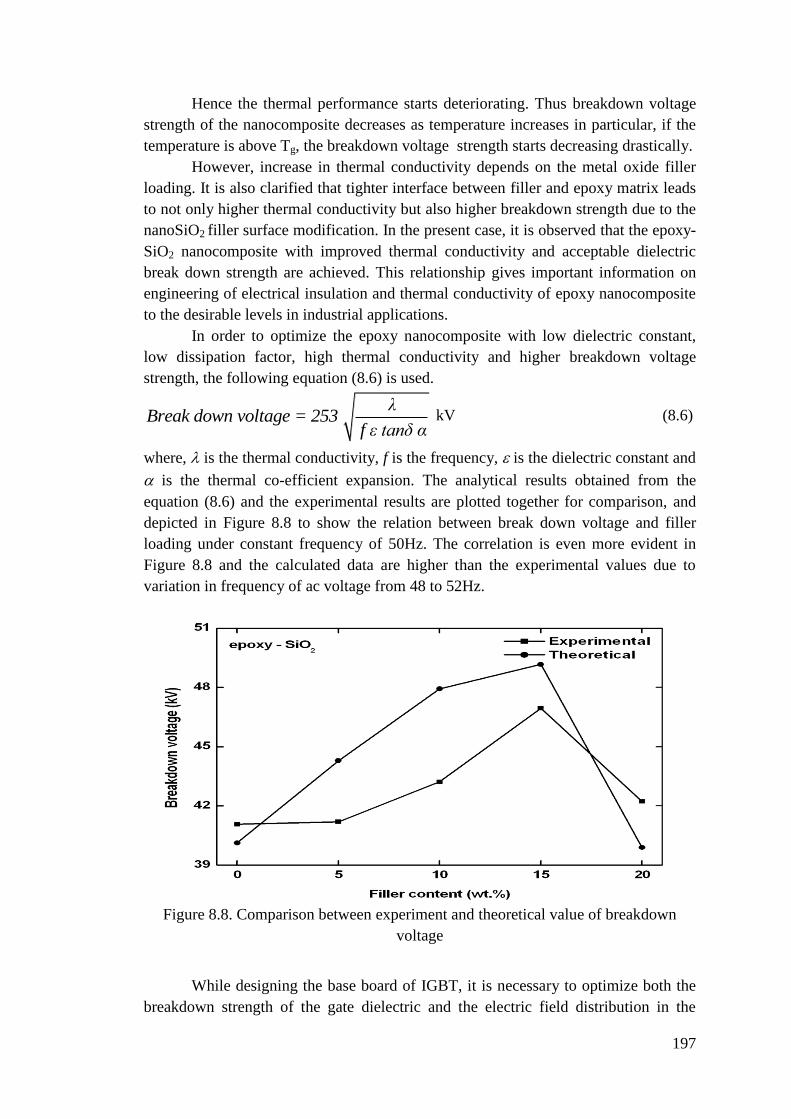
equation (8.6) and the experimental results are plotted together for comparison, and
depicted in Figure 8.8 to show the relation between break down voltage and filler
loading under constant frequency of 50Hz. The correlation is even more evident in
Figure 8.8 and the calculated data are higher than the experimental values due to
variation in frequency of ac voltage from 48 to 52Hz.
Figure 8.8. Comparison between experiment and theoretical value of breakdown
voltage
While designing the base board of IGBT, it is necessary to optimize both the
breakdown strength of the gate dielectric and the electric field distribution in the
198
device. In the field of more conventional electrical insulation, it seems possible to
generate nanocomposites exhibiting a dielectric constant and tanδ that are lower than
that of either of the constituent components. It has been suggested that this
counterintuitive result is due to polymer chain immobilization at the interfaces.
8.2.4 Co-efficient of thermal expansion
The co-efficient of thermal expansion (CTE) is a material property that is indicative
of the extent to which a material expands upon heating. Different substances expand
by different amounts of heating range. Over small temperature range the thermal
expansion is uniform and linearly changes with temperature. Thermal expansion finds
useful application in bi-metallic strips for the construction of thermometers but can
generate detrimental internal stresses when a structural part is heated and kept at
constant length.
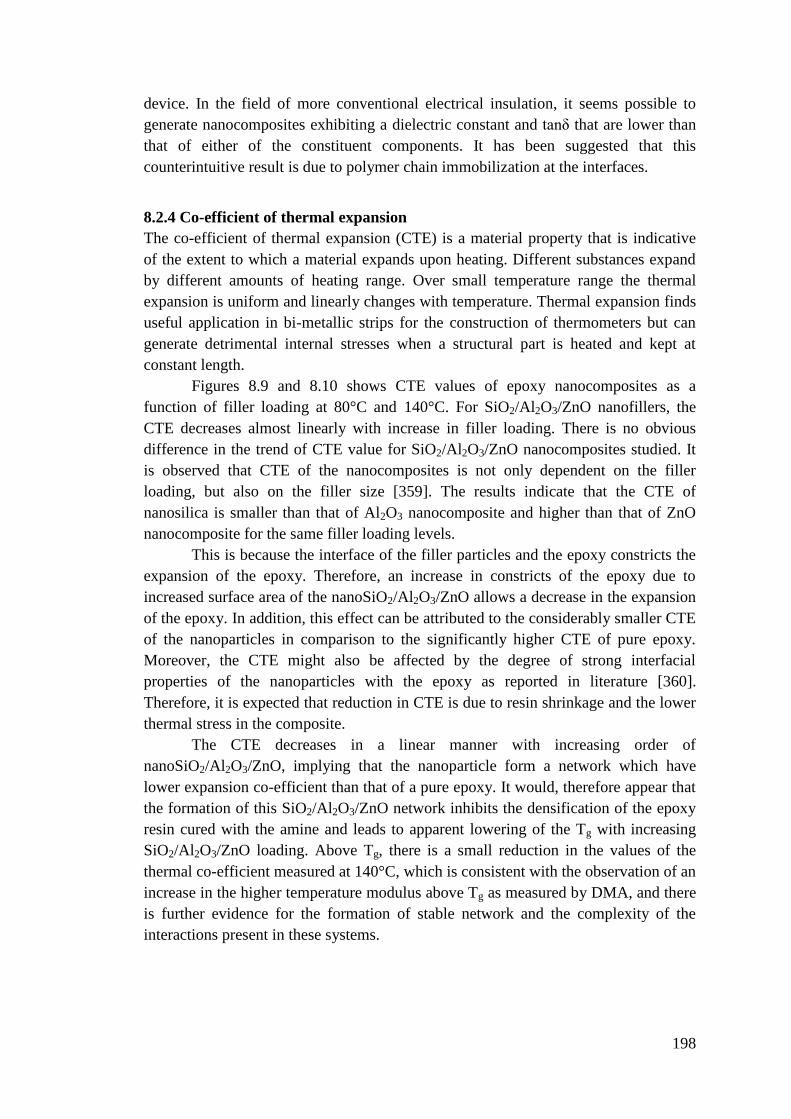
Figures 8.9 and 8.10 shows CTE values of epoxy nanocomposites as a
function of filler loading at 80°C and 140°C. For SiO2/Al2O3/ZnO nanofillers, the
CTE decreases almost linearly with increase in filler loading. There is no obvious
difference in the trend of CTE value for SiO2/Al2O3/ZnO nanocomposites studied. It
is observed that CTE of the nanocomposites is not only dependent on the filler
loading, but also on the filler size [359]. The results indicate that the CTE of
nanosilica is smaller than that of Al2O3 nanocomposite and higher than that of ZnO
nanocomposite for the same filler loading levels.
This is because the interface of the filler particles and the epoxy constricts the
expansion of the epoxy. Therefore, an increase in constricts of the epoxy due to
increased surface area of the nanoSiO2/Al2O3/ZnO allows a decrease in the expansion
of the epoxy. In addition, this effect can be attributed to the considerably smaller CTE
of the nanoparticles in comparison to the significantly higher CTE of pure epoxy.
Moreover, the CTE might also be affected by the degree of strong interfacial
properties of the nanoparticles with the epoxy as reported in literature [360].
Therefore, it is expected that reduction in CTE is due to resin shrinkage and the lower
thermal stress in the composite.
The CTE decreases in a linear manner with increasing order of
nanoSiO2/Al2O3/ZnO, implying that the nanoparticle form a network which have
lower expansion co-efficient than that of a pure epoxy. It would, therefore appear that
the formation of this SiO2/Al2O3/ZnO network inhibits the densification of the epoxy
resin cured with the amine and leads to apparent lowering of the Tg with increasing
SiO2/Al2O3/ZnO loading. Above Tg, there is a small reduction in the values of the
thermal co-efficient measured at 140°C, which is consistent with the observation of an
increase in the higher temperature modulus above Tg as measured by DMA, and there
is further evidence for the formation of stable network and the complexity of the
interactions present in these systems.
199
Figure 8.9. Variation of CTE with filler loading at 80°C
Figure 8.10. Variation of CTE with filler loading at 140°C
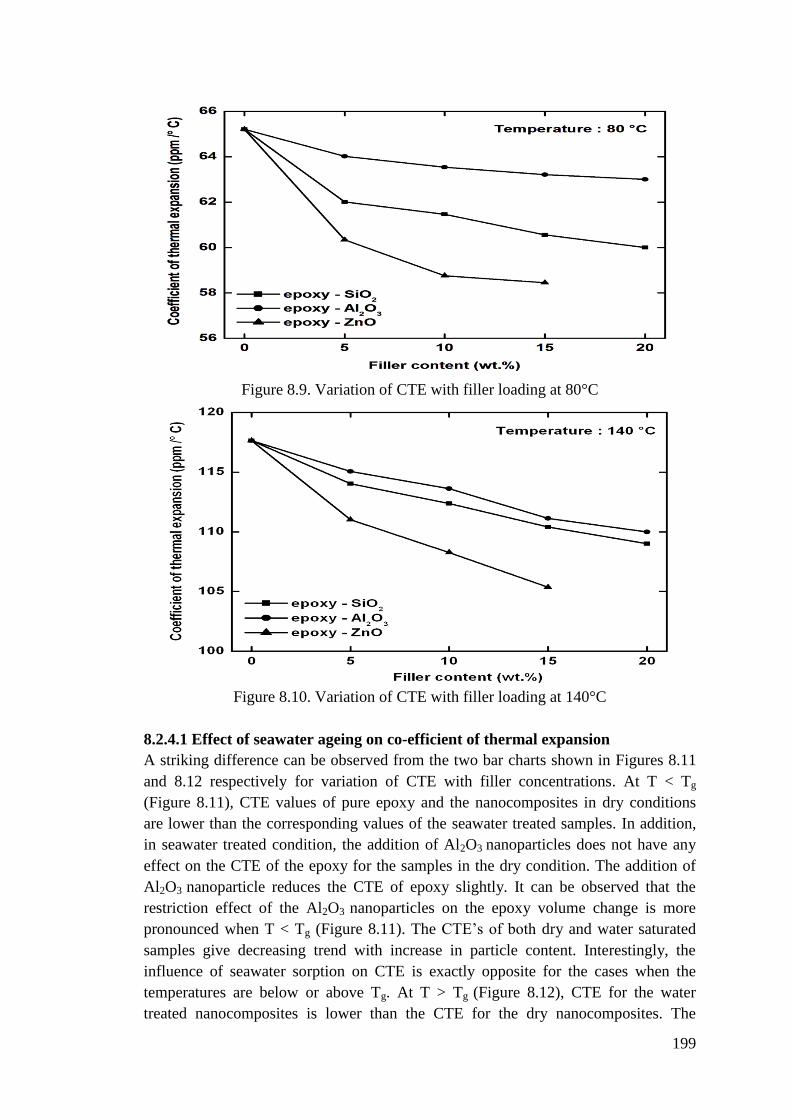
8.2.4.1 Effect of seawater ageing on co-efficient of thermal expansion
A striking difference can be observed from the two bar charts shown in Figures 8.11
and 8.12 respectively for variation of CTE with filler concentrations. At T < Tg
(Figure 8.11), CTE values of pure epoxy and the nanocomposites in dry conditions
are lower than the corresponding values of the seawater treated samples. In addition,
in seawater treated condition, the addition of Al2O3 nanoparticles does not have any
effect on the CTE of the epoxy for the samples in the dry condition. The addition of
Al2O3 nanoparticle reduces the CTE of epoxy slightly. It can be observed that the
restriction effect of the Al2O3 nanoparticles on the epoxy volume change is more
pronounced when T < Tg (Figure 8.11). The CTE’s of both dry and water saturated
samples give decreasing trend with increase in particle content. Interestingly, the
influence of seawater sorption on CTE is exactly opposite for the cases when the
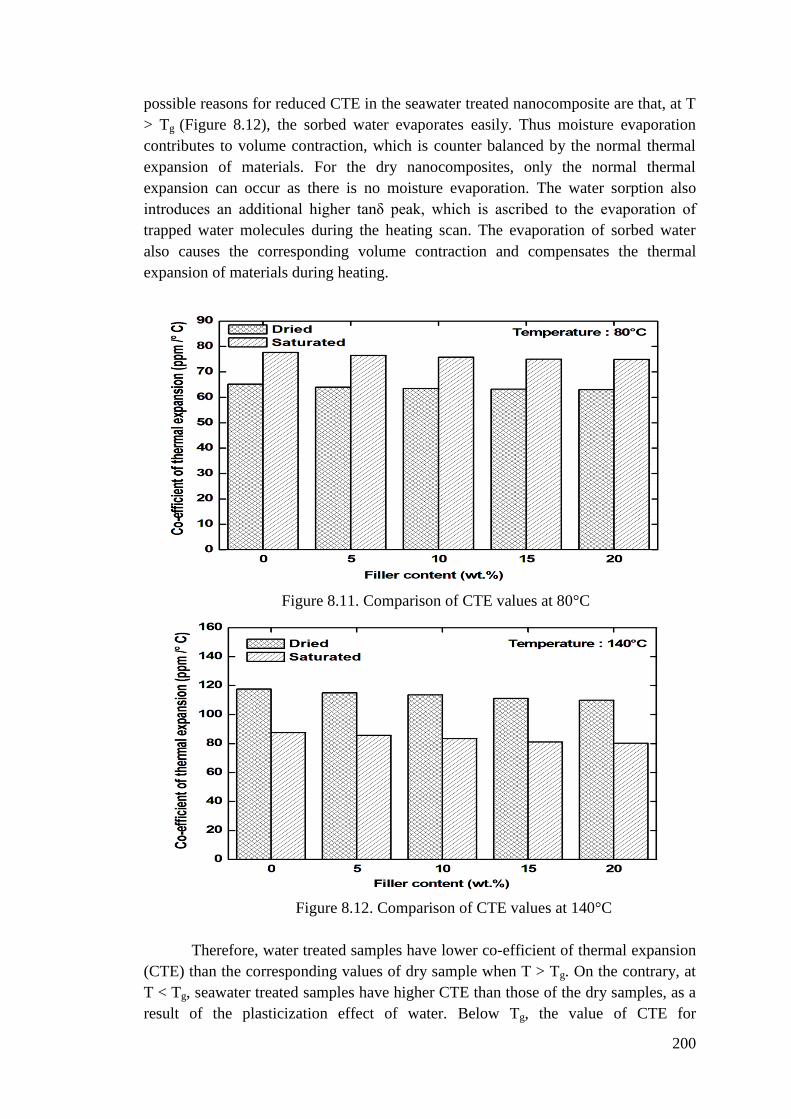
temperatures are below or above Tg. At T > Tg (Figure 8.12), CTE for the water
treated nanocomposites is lower than the CTE for the dry nanocomposites. The
200
possible reasons for reduced CTE in the seawater treated nanocomposite are that, at T
> Tg (Figure 8.12), the sorbed water evaporates easily. Thus moisture evaporation
contributes to volume contraction, which is counter balanced by the normal thermal
expansion of materials. For the dry nanocomposites, only the normal thermal
expansion can occur as there is no moisture evaporation. The water sorption also
introduces an additional higher tanδ peak, which is ascribed to the evaporation of
trapped water molecules during the heating scan. The evaporation of sorbed water
also causes the corresponding volume contraction and compensates the thermal
expansion of materials during heating.
Figure 8.11. Comparison of CTE values at 80°C
Figure 8.12. Comparison of CTE values at 140°C
Therefore, water treated samples have lower co-efficient of thermal expansion
(CTE) than the corresponding values of dry sample when T > Tg. On the contrary, at
T < Tg, seawater treated samples have higher CTE than those of the dry samples, as a
result of the plasticization effect of water. Below Tg, the value of CTE for
201
nanocomposite is, 64.02ppm/°C for dry sample. As the filler content is increased, the
CTE reduce marginally. The CTE of water treated sample is 77.02ppm/°C and the
variations are negligible with respect to filler loading. For temperature above Tg value,
of CTE is 117.06ppm/°C for dry sample. As the filler content is increased, the CTE
shows decreasing trend. The CTE for water treated sample is 87.26ppm/°C and with
respect to filler loading, CTE shows decreasing trends.
8.3 Conclusions
From the above results the following conclusions can be drawn:
i) It is observed that the storage modulus of epoxy-SiO2 nanocomposites
increases monotonically with the percentage weight of nanosilica. A reduction
in glass transition temperature by 6°C as compared to pure epoxy (cured) at
20wt.% is observed. The room temperature-damping factor remains nearly
constant with the nanosilica loading, while the peak-damping factor increases
with the nanosilica loading to a maximum of 15% for 20wt.% of nanosilica
content. The modulus value obtained from experiment and analytical results,
show excellent agreement for 12.6wt.% of nanosilica.
ii) The addition of 10 and 20wt.% of SiO2 into epoxy increases the HDT by 43
and 13C and this temperature rise is a benchmark for many engineering
applications.
iii) With the addition of SiO2/Al2O3/ZnO materials, there are benefits to be gained
from the enhanced thermal conductivity which is imparted to the composite as
a consequence of the inclusion of the fillers. Comparing the three
nanocomposite systems, the epoxy-Al2O3 nanocomposite shows the highest
thermal conductivity due to higher value of thermal conductivity of Al2O3
nanoparticles.
iv) Based on the assumptions made, better correlation of experimental data of
thermal conductivity is achieved with Bruggeman equation rather than Agari
and Uno equation.
v) Combining the evidence from DMA, DSC and TMA, it is proposed that the
functionalized SiO2/Al2O3/ZnO particles are effective in forming the network
which results in a reduction in CTE, but at molecular levels, leaves the epoxy
slightly more open in the absence of network. The network formed by the
nanoparticles inhibits the densification of the epoxy which is achieved by post
curing and leads to the lowing of Tg with increased SiO2/Al2O3/ZnO loading.
vi) The CTE values of pure epoxy and epoxy nanocomposites are higher after
seawater saturation as compared to dry samples. Further, below Tg, the CTE
value for nanocomposites increase by 16%, whereas above Tg, CTE value
decreases by 25%.
A summary of the work carried out and possible applications of the materials
developed along with important conclusions and scope for further work in the area of
the nanocomposite are presented in Chapter 9.