Embed Size (px)
Citation preview
Old Dominion University Old Dominion University
ODU Digital Commons ODU Digital Commons
Mechanical & Aerospace Engineering Theses & Dissertations Mechanical & Aerospace Engineering
Winter 1998
Thermodynamic Modeling and Analysis of Human Stress Thermodynamic Modeling and Analysis of Human Stress
Responses Responses
Satish C. Boregowda Old Dominion University, [email protected]
Follow this and additional works at: https://digitalcommons.odu.edu/mae_etds
Part of the Biomedical Commons, Mechanical Engineering Commons, and the Psychology Commons
Recommended Citation Recommended Citation Boregowda, Satish C.. "Thermodynamic Modeling and Analysis of Human Stress Responses" (1998). Doctor of Philosophy (PhD), Dissertation, Mechanical & Aerospace Engineering, Old Dominion University, DOI: 10.25777/vbmn-vc59 https://digitalcommons.odu.edu/mae_etds/109
This Dissertation is brought to you for free and open access by the Mechanical & Aerospace Engineering at ODU Digital Commons. It has been accepted for inclusion in Mechanical & Aerospace Engineering Theses & Dissertations by an authorized administrator of ODU Digital Commons. For more information, please contact [email protected].
THERMODYNAMIC MODELING AND ANALYSIS OF HUMAN STRESS RESPONSES
by
Satish C. Boregowda M.E., December 1993, Old Dominion University
B.E., January 1990, University o f Mysore
A Dissertation Submitted to the Faculty o f Old Dominion University in Partial Fulfillment o f the Requirement for the Degree o f
DOCTOR OF PHILOSOPHY MECHANICAL ENGINEERING
Old Dominion University December 1998
Dr. Surendra N. Tiwari (Director)
Dr. Sushil K. Chaturvedi
Dr. Alan T. Pope
Dr. Gregory V. Selby
Dr. Gene J.-W. Hou
R eproduced with perm ission of the copyright owner. Further reproduction prohibited without perm ission.
ABSTRACT
THERMODYNAMIC MODELING AND ANALYSIS OF HUMAN STRESS RESPONSES
Satish C. Boregowda Old Dominion University, 1998
Director: Dr. Surendra N. Tiwari
A novel approach based on the second law o f thermodynamics is developed to investi
gate the psychophysiology and quantify human stress level. Two types o f stresses (ther
mal and mental) are examined. A Unified Stress Response Theory (USRT) is developed
under the new proposed field of study called Engineering Psychophysiology. The USRT is
used to investigate both thermal and mental stresses from a holistic (human body as a
whole) and thermodynamic viewpoint. The original concepts and definitions are estab
lished as postulates which form the basis for thermodynamic approach to quantify human
stress level. An Objective Thermal Stress Index (OTSI) is developed by applying the sec
ond law o f thermodynamics to the human thermal system to quantify thermal stress or dis
comfort in the human body. The human thermal model based on finite element method is
implemented. It is utilized as a "Computational Environmental Chamber" to conduct
series o f simulations to examine the human thermal stress responses under different envi
ronmental conditions. An innovative hybrid technique is developed to analyze human ther
mal behavior based on series o f human-environment interaction simulations. Continuous
R e p ro d u c e d with perm ission o f the copyright owner. Further reproduction prohibited without perm ission.
monitoring of thermal stress is demonstrated with the help of OTSI. It is well established
that the human thermal system obeys the second law of thermodynamics. Further, the
OTSI is validated against the experimental data. Regarding mental stress, an Objective
Mental Stress Index (OMSI) is developed by applying the Maxwell relations of thermody
namics to the combined thermal and cardiovascular system in the human body. The OMSI
is utilized to demonstrate the technique of monitoring mental stress continuously and is
validated with the help o f series o f experimental studies. Although the OMSI indicates the
level o f mental stress, it provides a strong thermodynamic and mathematical relationship
between activities o f thermal and cardiovascular systems o f the human body.
R eproduced with perm ission o f the copyright owner. Further reproduction prohibited without perm ission.
ACKNOWLEDGEMENTS
I express my gratitude to the faculty and staff members of Mechanical Engineering
Department at Old Dominion University for their encouragement, guidance, and support
during the course of my graduate studies. I am grateful to the members of Crew Hazardous
and Error Management (CHEM) Group for sharing their ideas and making me feel like
part of their family while I was at NASA Langley Research Center (LaRC).
I would like to express my gratitude and appreciation to my director and advisor Dr.
Surendra N. Tiwari, Eminent Professor of Mechanical Engineering for his cooperation,
patience, understanding, guidance, and support throughout my graduate studies. I express
my thanks to Dr. Sushil K. Chaturvedi, Professor and Chair of Mechanical Engineering for
his technical guidance and assistance during the course of my research activity. Special
thanks are extended to Dr. Byron W. Jones of Kansas State University whose work in the
area of human thermal simulation sparked my interest to do my doctoral work in the
related area. I would also like to thank Dr. Byron W. Jones for providing me with the basic
human thermal computer model and for all valuable suggestions. I would like to thank Dr.
Gregory V. Selby and Dr. Gene J.-W. Hou o f Mechanical Engineering Department for
their valuable suggestions and help.
I would like to express my gratitude and deep appreciation to Dr. Alan T. Pope, Senior
Research Scientist at NASA LaRC, for all the help, technical assistance, and providing me
iv
R eproduced with perm ission of the copyright owner. Further reproduction prohibited without perm ission.
a unique opportunity to make contributions to the field of Human Factors Engineering. I
express my highest regards to Dr. Olafur S. Palsson o f Eastern Virginia Medical School
for supporting my theories with experimental and clinical studies, and for all the wonder
ful intellectually stimulating discussions that led to the creation o f a new field o f study
called Engineering Psychophysiology.
I express my deep regards to my father Prof. C. L. Boregowda and mother Par-
vathamma for the life, love, nurturing, and support to pursue my educational endeavors. I
am ever grateful to my sisters Shashi, Raji, Usha, and Shyla who played a major role in
being an inspiration to my academic pursuits. I am thankful to my brother Shivaraj for his
support and guidance at every stage in my early education. I convey my deep regards and
special thanks to my brother-in-law, Mr. B. T. Lakshman, for all the support, timely guid
ance, and direction during my graduate studies. I would like to appreciate my little niece
Apoorva whose smile cheered up life from time to time. I express my deep appreciation to
the family of Mridhubashini, Mohan, Shilpa, and Shreya for their timely help and support.
I express my highest regards to Rev. Lee Pope for moral and inspirational support dur
ing the most crucial times of my dissertation writing. I convey my highest respect to my
best friend, Jerry Lazarus, who listened to my worries with deep compassion and support
during the most difficult times o f my dissertation work. I would like to thank Diane Mitch
ell o f Mechanical Engineering Department for formatting and organizing this manuscript.
I thank my friends Arun and Srikanth for all their help during the course o f my graduate
studies. I deeply express my thanks and appreciation to my dear beloved Keri whose lov
ing and caring support finally helped me finish the dissertation.
v
R eproduced with perm ission o f the copyright owner. Further reproduction prohibited without perm ission.
This work in part was supported by NASA Langley Research Center through Cooper
ative Agreement NCC1-254. The Cooperative Agreement was monitored by Dr. Alan T.
Pope o f the Crew Vehicle Integration Branch, Flight Dynamics and Control Divsion.
R eproduced with perm ission of the copyright owner. Further reproduction prohibited without perm ission.
TABLE OF CONTENTS
Page
ACKNOWLEDGEMENTS ..............................................................................................iv
LIST OF TA BLES......................................................................................................................xi
LIST OF FIG U R ES.................................................................................................................. xii
LIST OF SY M BOLS................................................................................................................ xv
CHAPTER
I. INTRODUCTION......................................................................................................1
1.1 M otivation............................................................................................................ 1
1.2 Literature R e v ie w ...............................................................................................4
1.21 Thermal Stress .......................................................................................... 4
1.22 Mental Stress ...........................................................................................12
1.3 O bjectives.......................................................................................................... 14
II. APPLICATIONS...................................................................................................... 19
2.1 Environmental Ergonomics..............................................................................19
2.2 Aviation S a fe ty ................................................................................................. 20
2.3 Psychophysiology and Behavioral Medicine ............................................... 22
III. THERMODYNAMICS OF HUMAN STRESS RESPONSES......................... 24
3.1 The Nervous S y stem ........................................................................................ 24
3.2 Homeostasis ......................................................................................................26
3.21 Thermal H om eostasis............................................................................26
vii
R eproduced with perm ission o f the copyright owner. Further reproduction prohibited without perm ission.
3.22 Cardiovascular Homeostasis.................................................................. 27
3.3 Engineering Psychophysiology...................................................................... 28
3.31 Thermal Environmental Psychophysiology........................................ 29
3.32 Cognitive Psychophysiology ................................................................ 30
3.4 Unified Stress Response Theory (U SR T)..................................................... 31
3.41 Thermal Stress ........................................................................................ 33
3.42 Mental Stress .......................................................................................... 34
IV. HUMAN THERMAL M O D E L ............................................................................. 37
4.1 Physical Model .................................................................................................37 '
4.11 Passive S y s te m ........................................................................................ 37
4.12 Control S y s tem ........................................................................................ 42
4.13 Clothing S y s te m ......................................................................................46
4.2 Governing Equations.......................................................................................47
4.21 Passive System Governing Equations ................................................. 48
4.22 Control System Governing Equations ................................................. 52
4.23 Clothing System Governing Equations ............................................... 56
4.3 Method o f S o lu tio n ......................................................................................... 57
4.31 Numerical Solution Method for the Passive System ......................... 58
4.32 Numerical Solution Method for the Clothing System ....................... 62
4.33 Initial and Boundary Conditions............................................................ 63
4.34 Overall Solution Scheme .......................................................................65
V. OBJECTIVE MEASURES OF HUMAN STRESS L E V E L ............................ 68
5.1 Thermal S tress................................................................................................. 69
viii
R eproduced with perm ission o f the copyright owner. Further reproduction prohibited without perm ission.
5.2 Development o f Objective Thermal Stress Index (OTSI) ......................... 71
5.3 Mental S tress ..................................................................................................... 75
5.4 Formulation o f Objective Mental Stress Index (O M S I)..............................76
VI. RESULTS AND DISCUSSION ........................................................................ 79
6.1 Experimental Validation o f the Human Thermal Model ..........................80
6.2 Effect o f Physical Variables on Human Thermal Responses ...................81
6.21 Environmental Conditions .....................................................................89
6.22 Physical A ctivity...................................................................................... 94
6.23 Clothing ................................................................................................... 98
6.3 Hybrid Technique for Analysis o f Human Thermal B ehavior................. 102
6.4 Thermal Stress Level Monitoring Using an Objective ThermalStress Index (O T S I) .......................................................................................118
6.41 Effects o f Relative Humidity and Clothing on Thermal StressL e v e l...................................................................................................... 119
6.42 Thermal Stress Monitoring in Comfort C onditions..........................122
6.43 Thermal Stress Monitoring in Extreme Hot and Cold Environments .........................................................................................124
6.44 Validation of Objective Thermal Stress Index (O TSI)..................... 124
6.45 Objective Thermal Sensation Scale (O TSS)...................................... 130
6.5 Mental Stress Level Monitoring Using an Objective Mental StressIndex (O M S I)..................................................................................................134
6.51 Effect o f Mentally Stressful Tasks on PhysiologicalR esponses............................................................................................... 135
6.52 Mental Stress Monitoring during Vigilance T asks............................140
6.53 Validation o f Objective Mental Stress Index (OMSI) ......................147
6.6 Link Between Thermal and Cardiovascular System s................................ 149
ix
R eproduced with perm ission of the copyright owner. Further reproduction prohibited without perm ission.
VII. CONCLUSIONS ............................................................................................... 152
REFERENCES ...................................................................................................................... 156
APPENDICES
A. DERIVATION OF OBJECTIVE THERMAL STRESS INDEX(OTSI) ..................................................................................................................163
B. DERIVATION OF OBJECTIVE MENTAL STRESS INDEX(O M SI)..................................................................................................................168
C. STRESS-RELATED PHYSICAL SYMPTOMS INVENTORY(SPSI)....................................................................................................................173
BIOGRAPHY ........................................................................................................................ 175
x
R eproduced with perm ission of the copyright owner. Further reproduction prohibited without perm ission.
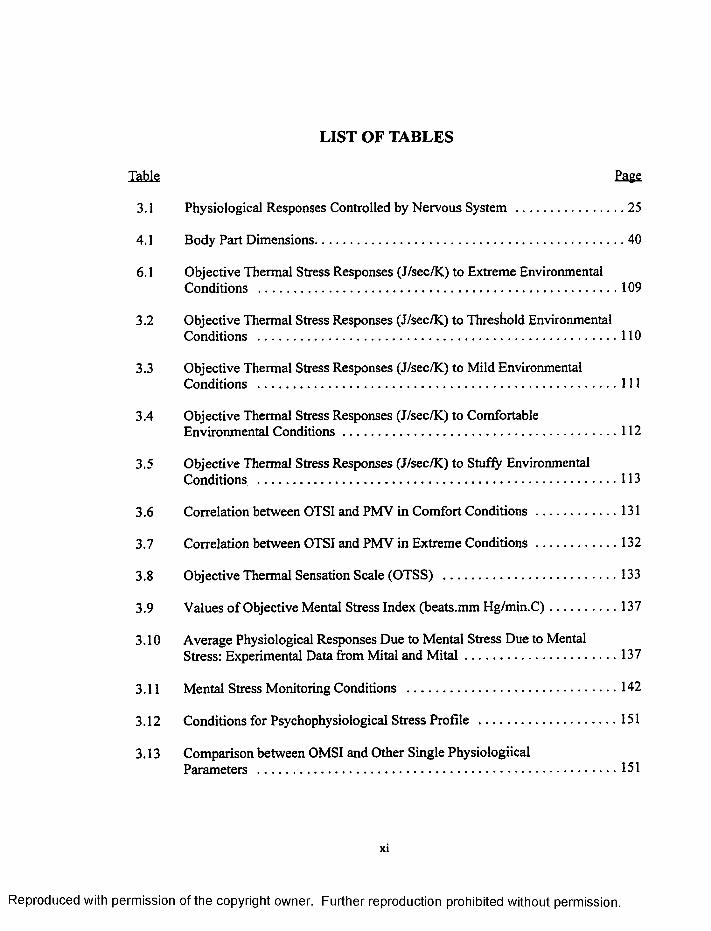
LIST OF TABLES
Table Eags
3.1 Physiological Responses Controlled by Nervous System .................................. 25
4.1 Body Part Dimensions...............................................................................................40
6.1 Objective Thermal Stress Responses (J/sec/K) to Extreme EnvironmentalConditions .............................................................................................................109
3.2 Objective Thermal Stress Responses (J/sec/K) to Threshold EnvironmentalConditions .............................................................................................................110
3.3 Objective Thermal Stress Responses (J/sec/K) to Mild EnvironmentalConditions ............................................................................................................. I l l
3.4 Objective Thermal Stress Responses (J/sec/K) to ComfortableEnvironmental C onditions....................................................................................112
3.5 Objective Thermal Stress Responses (J/sec/K) to Stuffy EnvironmentalConditions ............................................................................................................. 113
3.6 Correlation between OTSI and PMV in Comfort C onditions..........................131
3.7 Correlation between OTSI and PMV in Extreme C onditions..........................132
3.8 Objective Thermal Sensation Scale (OTSS) ......................................................133
3.9 Values o f Objective Mental Stress Index (beats.mm Hg/m in.C)......................137
3.10 Average Physiological Responses Due to Mental Stress Due to MentalStress: Experimental Data from Mital and M ita l ...............................................137
3.11 Mental Stress Monitoring Conditions .................................................................142
3.12 Conditions for Psychophysiological Stress Profile ........................................... 151
3.13 Comparison between OMSI and Other Single PhysiologiicalParameters ............................................................................................................. 151
xi
R eproduced with perm ission of the copyright owner. Further reproduction prohibited without perm ission.
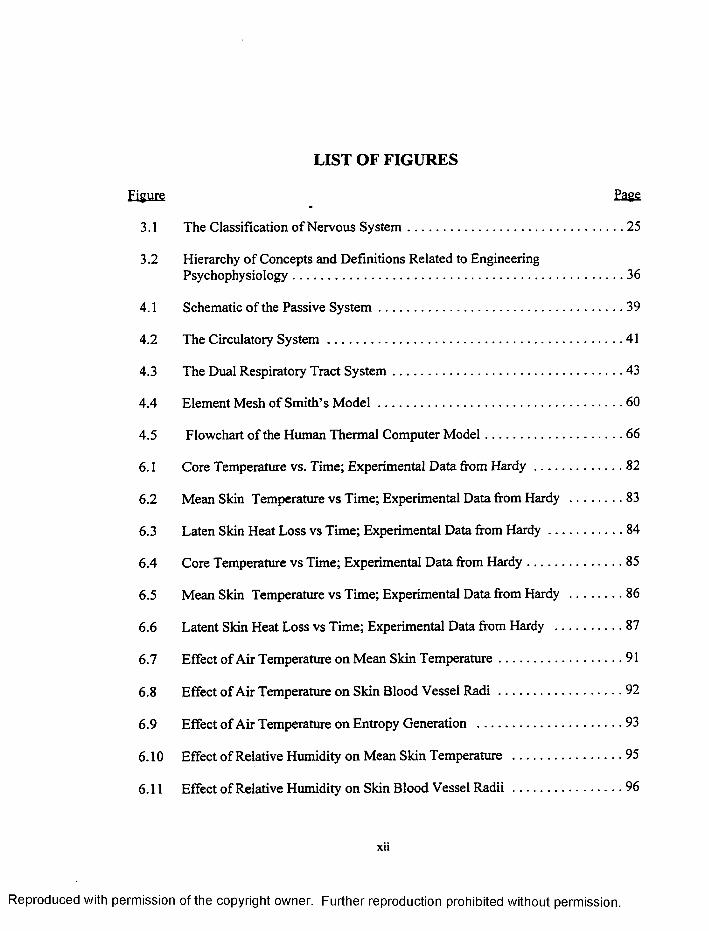
LIST OF FIGURES
Eigurs. Eags
3.1 The Classification o f Nervous System ................................................................... 25
3.2 Hierarchy o f Concepts and Definitions Related to EngineeringPsychophysiology.................................................................................................... 36
4.1 Schematic o f the Passive S y stem ............................................................................39
4.2 The Circulatory S y stem ...........................................................................................41
4.3 The Dual Respiratory Tract System ....................................................................... 43
4.4 Element Mesh o f Smith’s M o d e l........................................................................... 60
4.5 Flowchart o f the Human Thermal Computer M odel..........................................66
6.1 Core Temperature vs. Time; Experimental Data from H a rd y ............................ 82
6.2 Mean Skin Temperature vs Time; Experimental Data from Hardy ..................83
6.3 Laten Skin Heat Loss vs Time; Experimental Data from H a rd y ........................ 84
6.4 Core Temperature vs Time; Experimental Data from H ardy...............................85
6.5 Mean Skin Temperature vs Time; Experimental Data from Hardy ..................86
6.6 Latent Skin Heat Loss vs Time; Experimental Data from Hardy ...................... 87
6.7 Effect of Air Temperature on Mean Skin Tem perature.......................................91
6.8 Effect o f Air Temperature on Skin Blood Vessel R a d i .......................................92
6.9 Effect o f Air Temperature on Entropy Generation ............................................. 93
6.10 Effect of Relative Humidity on Mean Skin Temperature ...................................95
6.11 Effect of Relative Humidity on Skin Blood Vessel R a d ii ...................................96
xii
R eproduced with perm ission of the copyright owner. Further reproduction prohibited without perm ission.
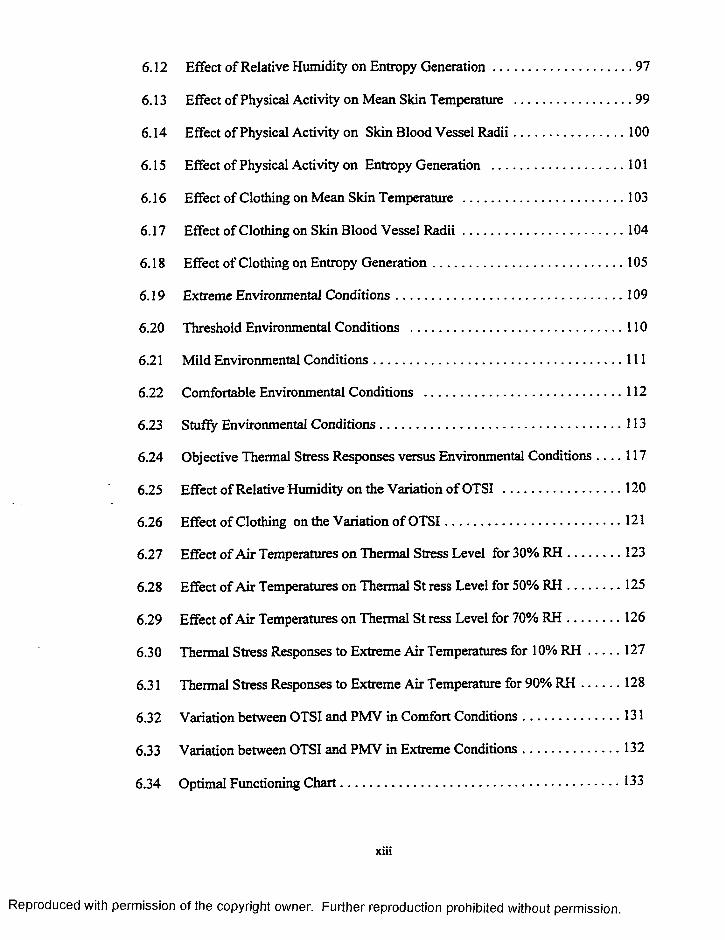
6.12 Effect o f Relative Humidity on Entropy G eneration ............................................ 97
6.13 Effect o f Physical Activity on Mean Skin Temperature ......................................99
6.14 Effect o f Physical Activity on Skin Blood Vessel R ad ii....................................100
6.15 Effect of Physical Activity on Entropy Generation .......................................... 101
6.16 Effect o f Clothing on Mean Skin Temperature .................................................103
6.17 Effect of Clothing on Skin Blood Vessel R a d ii ...................................................104
6.18 Effect o f Clothing on Entropy G eneration........................................................... 105
6.19 Extreme Environmental C onditions..................................................................... 109
6.20 Threshold Environmental Conditions ..................................................................110
6.21 Mild Environmental Conditions............................................................................. I l l
6.22 Comfortable Environmental Conditions .............................................................. 112
6.23 Stuffy Environmental Conditions........................................................................... 113
6.24 Objective Thermal Stress Responses versus Environmental Conditions . . . . 117
6.25 Effect o f Relative Humidity on the Variation o f OTSI ......................................120
6.26 Effect o f Clothing on the Variation o f O T S I....................................................... 121
6.27 Effect o f A ir Temperatures on Thermal Stress Level for 30% R H ..................123
6.28 Effect o f Air Temperatures on Thermal St ress Level for 50% R H ..................125
6.29 Effect o f Air Temperatures on Thermal St ress Level for 70% R H ................. 126
6.30 Thermal Stress Responses to Extreme Air Temperatures for 10% R H 127
6.31 Thermal Stress Responses to Extreme Air Temperature for 90% R H ............. 128
6.32 Variation between OTSI and PMV in Comfort Conditions............................... 131
6.33 Variation between OTSI and PMV in Extreme Conditions............................... 132
6.34 Optimal Functioning C hart......................................................................................133
with perm ission of the copyright owner. Further reproduction prohibited without perm ission.
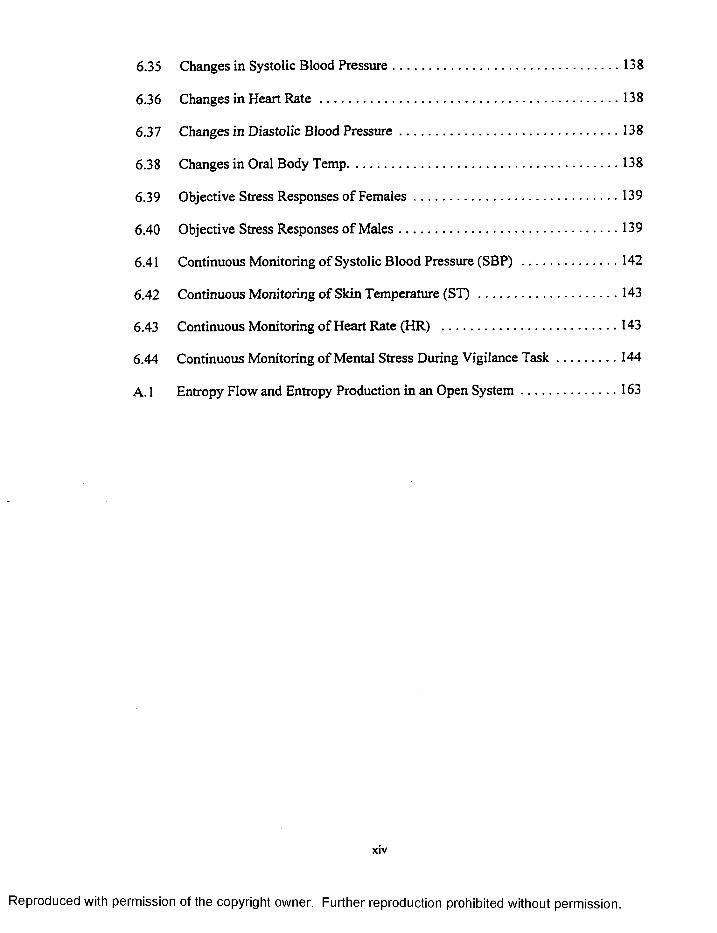
6.35 Changes in Systolic Blood Pressure....................................................................... 138
6.36 Changes in Heart R a te .............................................................................................138
6.37 Changes in Diastolic Blood P ressu re .....................................................................138
6.38 Changes in Oral Body Temp.................................................................................... 138
6.39 Objective Stress Responses o f F em ales................................................................ 139
6.40 Objective Stress Responses o f M ales.....................................................................139
6.41 Continuous Monitoring o f Systolic Blood Pressure (SBP) ............................... 142
6.42 Continuous Monitoring o f Skin Temperature (ST) ............................................ 143
6.43 Continuous Monitoring o f Heart Rate (HR) .......................................................143
6.44 Continuous Monitoring o f Mental Stress During Vigilance T a s k .................... 144
A. 1 Entropy Flow and Entropy Production in an Open S ystem ............................. 163
xiv
R eproduced with perm ission of the copyright owner. Further reproduction prohibited without perm ission.
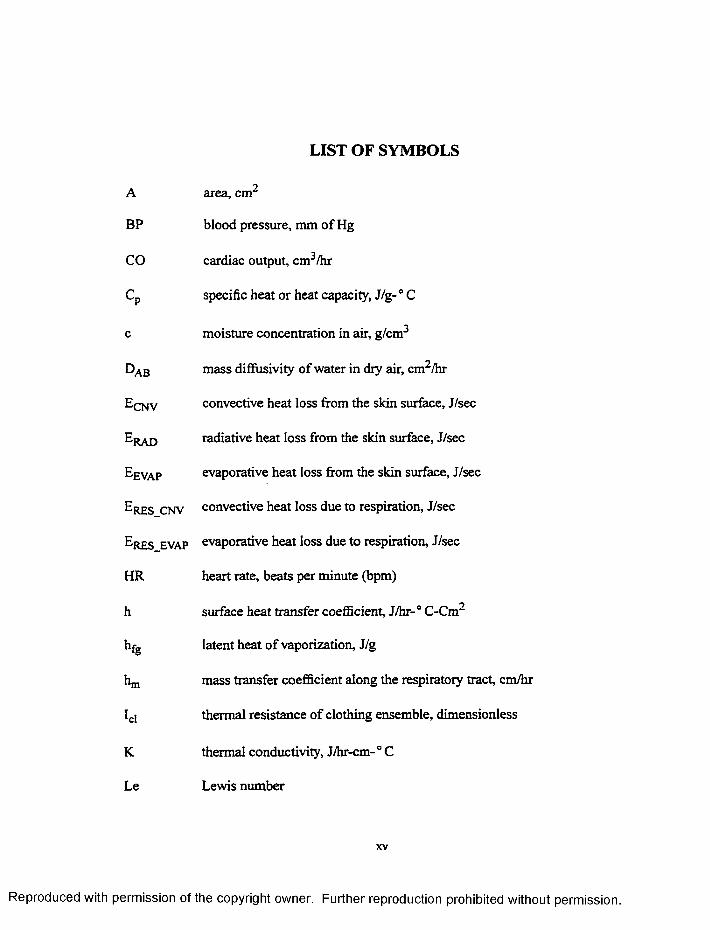
LIST OF SYMBOLS
A area, cm2
BP blood pressure, mm of Hg
CO cardiac output, cm3/hr
CP specific heat or heat capacity, J/g-° C
c moisture concentration in air, g/cm3
Dab mass diffusivity of water in dry air, cm2/hr
e cn v convective heat loss from the skin surface, J/sec
e r a d radiative heat loss from the skin surface, J/sec
e evap evaporative heat loss from the skin surface, J/sec
e res_cn v convective heat loss due to respiration, J/sec
e res_evap evaporative heat loss due to respiration, J/sec
HR heart rate, beats per minute (bpm)
h surface heat transfer coefficient, J/hr-° C-Cm2
hfg latent heat o f vaporization, J/g
mass transfer coefficient along the respiratory tract, cm/hr
Id thermal resistance o f clothing ensemble, dimensionless
K thermal conductivity, J/hr-cm-° C
Le Lewis number
R eproduced with perm ission of the copyright owner. Further reproduction prohibited without perm ission.
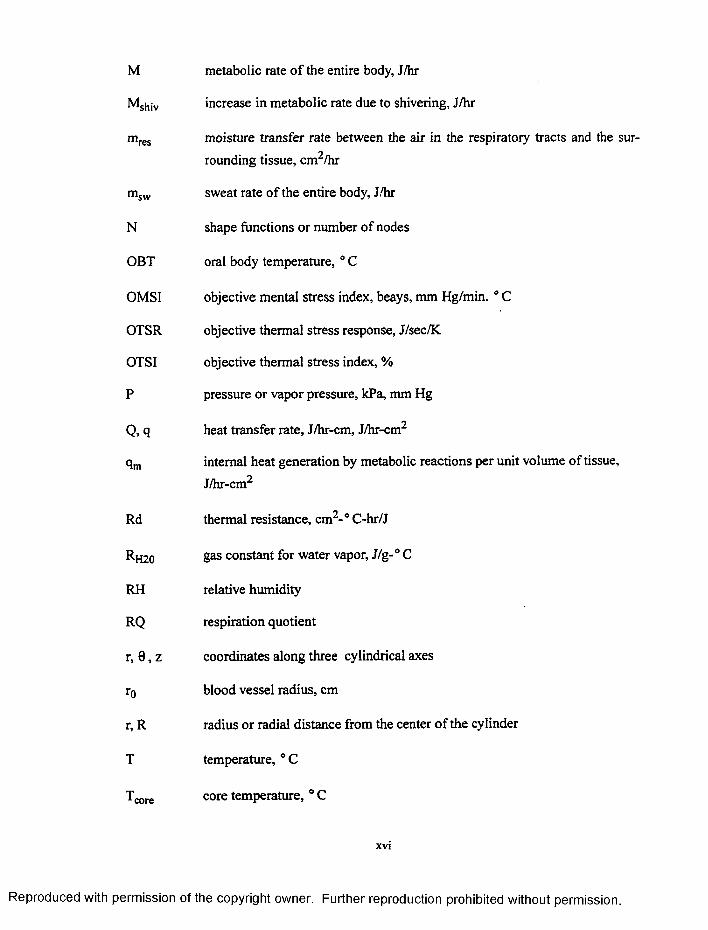
M metabolic rate o f the entire body, J/hr
Mshiv increase in metabolic rate due to shivering, J/hr
mres moisture transfer rate between the air in the respiratory tracts and the sur
rounding tissue, cm2/hr
msvv sweat rate of the entire body, J/hr
N shape functions or number of nodes
OBT oral body temperature, ° C
OMSI objective mental stress index, beays, mm Hg/min. ° C
OTSR objective thermal stress response, J/sec/K
OTSI objective thermal stress index, %
P pressure or vapor pressure, kPa, mm Hg
Q, q heat transfer rate, J/hr-cm, J/hr-cm2
qm internal heat generation by metabolic reactions per unit volume of tissue,
J/hr-cm2
Rd thermal resistance, cm2-° C-hr/J
Rh20 gas constant for water vapor, J/g- 0 C
RH relative humidity
RQ respiration quotient
r, 0 , z coordinates along three cylindrical axes
r0 blood vessel radius, cm
r, R radius or radial distance from the center o f the cylinder
T temperature, ° C
Tcore core temperature, ° C
xvi
R eproduced with perm ission of the copyright owner. Further reproduction prohibited without perm ission.
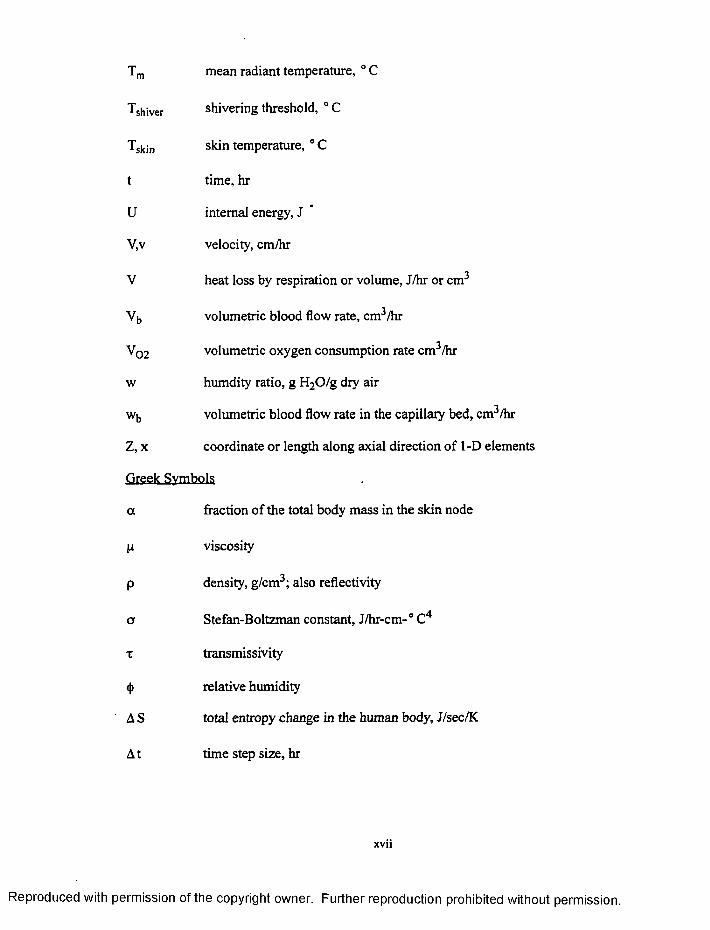
Tm mean radiant temperature, ° C
^shiver shivering threshold, °C
Tskin skin temperature, 0 C
t time, hr
U internal energy, J
V,v velocity, cm/hr
V heat loss by respiration or volume, J/hr or cm3
Vb volumetric blood flow rate, cm3/hr
V0 2 volumetric oxygen consumption rate cm3/hr
w humdity ratio, g H20 /g dry air
wb volumetric blood flow rate in the capillary bed, cm3/hr
Z, x coordinate or length along axial direction of 1-D elements
Greek Symbols
a fraction o f the total body mass in the skin node
p viscosity
p density, g/cm3; also reflectivity
a Stefan-Boltzman constant, J/hr-cm-° C4
x transmissivity
(j) relative humidity
A S total entropy change in the human body, J/sec/K
At time step size, hr
xvii
R eproduced with perm ission of the copyright owner. Further reproduction prohibited without perm ission.
I
CHAPTER I
INTRODUCTION
The present chapter provides an introduction to the thermodynamic study of human
body. In Sec. 1.1, the motivation behind the research activity is presented. A detailed
review o f the literature is outlined in Sec. 1.2. Finally, objectives o f the study are presented
in Sec. 1.3.
1.1 Motivation
During the past several years, various studies have been conducted to examine the
stress level in aircrew and other system operators. The Crew Hazardous and Error Man
agement (CHEM) group at NASA Langley Research Center examines various aspects of
aerospace flight that involves the development o f human response measurement technolo
gies to assess the mental loading, attention, and vigilance capabilities o f the crew. Several
studies have shown the deleterious effects o f stress on human attention and vigilance capa
bilities thus creating a need for design and development o f stress-proof systems for opti
mal safety and performance.
Stress has long been the subject of psychological and physiological interpretation. In
fact, more often than not, the word itself is not well-defined and has been overused, mean
ing different things to different people. In human factors engineering, stress is considered
as a reaction to what is perceived to be a threat to either the individual’s security or his/her
R eproduced with perm ission of the copyright owner. Further reproduction prohibited without perm ission.
accomplishment o f the assigned task [1]*. Stress may also be a response to a physical
condition, like excessive heat or cold, that challenges the body’s protective mechanisms.
Stressors arise from several sources such as environmental conditions, risk o f physical
harm, and heavy mental workload or information overload. Thermal stress, for example,
is a property of the physical environment which is a result o f exposure to extreme hot or
cold conditions. Whereas, mental stress can come about as a result o f a stressful cognitive
task. If the individual is using a machine, then mental stress becomes a property o f the
machine. In the context o f the present study, stress is expressed as a function of the phys
iological output produced by the individual in response to a stressor. The type of stress
experienced by the human being depends on the nature of the stressor. If the stressor is
thermal environment, then the resulting physiological changes in an individual indicate a
thermal stress. While, the changes in physiological responses to information processing
or mental workload will indicate mental stress. The individual is assumed to be interact
ing with both environment and machine simultaneously.
There is a growing interest in the thermal aspects o f the environmental condition and
its effects o f human thermal stress. With regard to academic interest, it poses some chal
lenging problems that require the expertise o f researchers from different fields such as
Engineering, Psychology, Physiology, and Medicine. In many cases, one specialist does
not know what the other specialist is doing. The need to bridge this gap between the aca
demic disciplines is one o f the motivating factors behind the present work.
•The numbers in brackets indicate references; the format used is a combination of the AIAA and ASME Journal format.
R eproduced with perm ission of the copyright owner. Further reproduction prohibited without perm ission.
3
Human attention, vigilance, and perceptual capabilities will be at its peak during the
state o f thermal comfort. Human thermal comfort is a strong function o f both psychologi
cal and physiological factors. Thermal comfort is influenced by environmental and physi
cal factors such as air temperature, humidity, air movement, physical activity, and
clothing. According to ASHRAE standard 55-66 [2], human thermal comfort is defined as
“that condition o f mind which expresses satisfaction with the thermal environment.”
However, there is no accurate method to quantitatively determine the effect o f thermal
environmental condition on comfort feeling in a human being. Therefore, there is a strong
need to develop objective measure o f thermal stress that would quantitatively provide an
indication o f thermal comfort in the form of a single summative number.
Due to rapid increase in the degree o f automation o f human-machine systems, human
operators spend less time actively controlling such systems and more time passively mon
itoring system functioning. As a result o f this high level of automation, the manual work
is replaced by prolonged static work, which requires usage o f only a small group of mus
cles, often in a fixed position at an intense working rate. This causes mental tension
requiring a high degree o f accuracy, a stress situation the human being is not ideally
equipped to endure or to cope with [2]. According to Rodahl [3], the metabolic events and
the organic stress at the cellular level are extremely different in the two situations: manual
labor and mental work. Thus, it is established by Hockey [4] that energetical factors play
an extremely important role in the regulation o f information processing. The information
processing is traditionally characterized as non-physical in nature and is called either men
tal workload or mental effort as mentioned earlier. But there are completely reliable yard
sticks against which individual response to stressor may be measured. Several theoretical
R eproduced with perm ission of the copyright owner. Further reproduction prohibited without perm ission.
4
and experimental studies have demonstrated the relationship between physiological
responses and mental workload [5,6]. However, there is a need to combine these different
physiological responses using a closed form deterministic equation based on a fundamen
tal scientific theory to quantify mental stress.
Further, the effects of both thermal and mental stresss have been recognized to cause
degradation o f human performance. However, currently there is no unified theory that
provides a quantitative approach to determine the effects o f different forms of stress such
as thermal and mental stress on the performance capability o f system operators to enhance
the safety o f human-machine-environment systems.
1.2 Literature Review
Numerous studies have been conducted to investigate the effects o f thermal environ
ment and mental workload on human physiological responses. In this section, studies per
taining to thermal stress and mental stress have been reviewed separately for the sake o f
convenience. The literature review is mainly focused on the studies related to the develop
ment o f stress indices to quantitatively indicate the level o f thermal stress or mental stress
1.2.1 Thermal Stress
A thermal stress index is traditionally defined as one which combines two or more
parameters, such as air temperature, mean radiant temperature, humidity, or air velocity
into a single variable [7]. Thermal or environmental stress indices may be classified
according to how they are developed. Rational indices are based on the theoretical con
cepts presented earlier. Empirical indices are based on measurements with subjects or on
simplified relationships that do not necessarily follow any theory. Indices may also be
R eproduced with perm ission of the copyright owner. Further reproduction prohibited without perm ission.
classified according to their application, generally either heat stress or cold stress.
Although many stress indices have been developed, none of them have been found satis
factory [8]. In developing the criteria for a thermal stress index, it is important that the fol
lowing factors be considered [8]:
1. The index should be quantitative and yield scalar values relating to thermal stress and physiological strain.
2. The index should be calculated from available data concerning the conditions that are present in the thermal environment.
3. The index should be tested and proved applicable through use.
4. All important factors should be in the index.
5. The method should be simple to use and not lead to rigorous calculation or difficult measurements.
6. All factors should be related to physiological strain in a weighted manner.
7. The method should be applicable and feasible for determining regulatory limits or threshold values for exposure to heat or cold stress.
In addition to these seven factors, the index should be a rational one based on funda
mental scientific theory [9]. Some of the widely used thermal stress indices are discussed
below:
(1) Effective Temperature
There are two indices of effective temperature, both of which were developed under
the sponsorship o f the American Society o f Heating, Refrigerating, and Air-Conditioning
(ASHRAE). The original effective temperature (ET) scale was developed in 1920s as an
empirical sensory index, combining into a single value the effect of temperature and
humidity on thermal sensations, with an adjustment for the effects of air movement [10].
It was developed through a series of experimental studies on human subjects. The test
R eproduced with perm ission of the copyright owner. Further reproduction prohibited without perm ission.
6
subjects were placed in a climatic chamber in still air, at a given temperature, and with
100% relative humidity. They were required to note their impressions o f the temperature
and to remember them. Then the relative humidity was reduced and temperature varied
until the test subjects felt the same sensation o f warmth as before [11]. This original ET
scale has been demonstrated to overemphasize the effects o f humidity in cool and neutral
conditions and to underemphasize its effects in warm conditions. Also, it does not fully
account for air movement in hot-humid conditions. Therefore, under the sponsorship of
ASHRAE, a new effective temperature (ET*) scale was developed [7]. It is mathemati
cally defined as follows:
ET* = T0 + wim LR (Pa - 0.5 PET*>S) (1.1)
where,
T0 = operative temperature, average o f the mean radiant and ambient temperatures
weighted by their respective heat transfer coefficients,
w = skin wettedness,
im = moisture permeability index,
LR = Lewis Ratio = evaporative heat transfer coeff./convective heat transfer coeff,
Pa = ambient partial vapor pressure.
The ET* is the temperature o f an environment at 50% relative humidity (RH) that
results in the same total skin heat loss as in the actual environment The human body is in
a state o f thermal neutrality with respect to regulatory (sensible) heat loss when the dry
bulb temperature is about 77° F (25 °C ) and RH is 50% [10]. Holding RH constant at
R eproduced with perm ission of the copyright owner. Further reproduction prohibited without perm ission.
7
50%, higher or lower air temperatures would alter the evaporative process, thus affecting
the levels o f skin wettedness at various temperatures. The ET* scale is essentially based
on the resulting levels o f wettedness. However, any given level o f skin wettedness can be
produced by different combinations o f dry-bulb temperature and RH, and those combina
tions that produce the same level o f wettedness then have the same ET* value. Since ET*
is defined in terms o f operative temperature (T0), it combines the effect o f three parame
ters, mean radiant temperature (Tmrt), dry-bulb or air temperature (TJ, and ambient partial
vapor pressure (P J into a single index. At the upper limit of regulation, w approaches 1.0
and at lower limit, w approaches 0.06; skin wettedness equals one o f these values when
the body is outside the zone o f evaporative regulation. Since, ET* is a function o f skin
wettedness and clothing moisture permeability, the effective temperature for a given tem
perature and humidity depends on physical activity and clothing. This makes it impossi
ble to generate a universal ET* chart. One o f the other limitations o f the effective
temperature index is its empirical nature. Also, it is developed on the basis o f subjective
assessment o f the human/thermal environment interaction. Although it is partially based
on the principle o f energy balance between the human body and the environment, it lacks
the basis o f a sound scientific theory. Further, calculation of ET* is quite tedious, requir
ing the solution o f multiple coupled equations to determine skin wettedness.
(2) Heat Stress Index (HSI)
The Heat Stress Index was originally developed by Belding and Hatch [12], and it has
been modified by Hatch [13] and Hertig and Belding [14]. This rational index is the ratio
o f the total evaporative heat loss (Es^in) from the skin surface required for thermal equilib
R eproduced with perm ission of the copyright owner. Further reproduction prohibited without perm ission.
8
rium (the sum o f metabolism and dry heat load) to the maximum evaporative heat loss
( E m a x ) possible for the environment, multiplied by 100, for steady-state conditions, and
with skin temperature held at 35 ° C. The index is mathematically defined as follows:
HSI = (Eslc;n / Emax) x 100 (1.2)
When HSI is greater than 100, body heating occurs; when HSI is less than zero, body
cooling occurs. Two important physiological criteria in the HSI concept are (i) in order to
limit rise of body temperature, average skin temperature should not exceed 95 ° F, and (ii)
in order to limit the loss o f body fluids, the sweat rate should not exceed one liter per hour
(2400 Btu/hr). HSI is very restricted in its applicability because it can be used only for
steady-state conditions. Also, due to emphasis on sweating aspect, it gives only the mea
sure o f heat stress. Further, it is an empirical index and excludes all the physical factors
like air temperature, RH, physical activity, and clothing.
(3) Wet-Bulb Globe Temperature (WBGT)
The WBGT is an environmental heat stress index that combines dry-bulb or air tem
perature (T J, a naturally ventilated (not aspirated) wet-bulb temperature (Tnwb)5 and black
globe temperature (Tg). According to the relationship developed by Dukes-Dobas and
Henschel [7], it is expressed as
WBGT = 0.7 Tnwb + 0.2 Tg + 0.1 Ta (1.3a)
This form of equation is usually used where solar radiation is present. The naturally ven
tilated wet-bulb thermometer is left exposed to the sunlight, but air temperature sensor is
shaded. In enclosed environments, Eq. (1.3a) is simplified as follows:
R eproduced with perm ission o f the copyright owner. Further reproduction prohibited without perm ission.
9
WBGT = 0.7 Tnwb + 0.3 Tg (1,3b)
The black globe thermometer is responsive to air temperature to air temperature, mean
radiant temperature, and air movement, while the naturally ventilated wet-bulb thermome
ter responds to air humidity, air movement, radiant temperature, and air temperature.
Thus, WBGT is a function o f all four environmental factors affecting human thermal
stress. Although WBGT is a better index of heat stress than the old ET, but it does not
relate to any physiological responses or strain. Further, it is an empirical index developed
from subjective analysis o f thermal environment.
(4) Wind Chill Index (WCI)
The wind chill index (WCI) is an empirical index developed from cooling measure
ments obtained in Antarctica on a cylindrical flask partly filled with water [7]. The index
describes the rate o f heat loss from the cylinder by radiation and convection for a surface
temperature o f 33 ° C, as a function o f ambient temperature and wind velocity. The equa
tion is proposed as follows [5]:
WCI = (10.45 + 10 v0-5 - v) (33 -T*) (1.4)
where v and Ta are in m/s and ° C respectively. The 330 C surface temperature was chosen
to be the representative o f the mean skin temperature o f a resting human. This index has
severe limitations due to the fact that measurements were taken on a 57 mm diameter plas
tic cylinder. This makes it unlikely that WCI would be an accurate measure o f heat loss
from the human body.
R eproduced with perm ission o f the copyright owner. Further reproduction prohibited without perm ission.
10
(5) Predicted M ean Vote (PMV)
Traditionally, thermal comfort has been considered as a “condition of mind,” which
requires empirical equations to relate the perception of comfort to specific responses [7].
In addition to the primary environmental and personal factors influencing thermal
response and comfort, factors like nonuniformity o f the environment, visual stimuli, age,
outdoor climate, etc. may also have some effect, but are generally considered to be sec
ondary factors.
Large scale studies conducted by Rohles and Nevins [16] and Rohles [17] on 1600 col-
lege-age students revealed statistical correlations between comfort level, temperature,
humidity, sex, and length o f exposure. A regression equation from these studies for pre
dicting thermal sensations from air temperature and vapor pressure for both men and
women combined for one-hour exposure is selected from the set o f equations provided [7].
The equation is as follows:
PMV = 0.245 Ta + 0.248 Pa - 6.475 ) (1.5a)
where, Ta = dry-bulb or air temperature (° C), Pa = ambient vapor pressure (kPa). Vapor
pressure is used rather than conventional relative humidity. This equation is valid for
young adult subjects with sedentary activity and wearing clothing with a thermal resis
tance o f approximately 0.5 clo, mean radiant temperature equals air temperature, and air
velocities are less than 0.2 m/s.
The thermal sensation scale used in this equation is referred to as the ASHRAE ther
mal sensation scale or PMV scale. This scale is as follows:
R eproduced with perm ission of the copyright owner. Further reproduction prohibited without perm ission.
11
+ 3 Hot + 2 Warm + 1 Slightly Warm
0 Neutral - 1 Slightly Cool - 2 Cool -3 Cold
The PMV index predicts the mean response o f large group o f people according to the
ASHRAE thermal sensation scale. Fanger [2] related PMV to imbalance between the
actual heat flow from the body in a given environment and the heat flow required for opti
mum comfort at the specified activity by the following equation:
PMV = [0.303 exp(-0.036 M) + 0.028] L (1.5b)
where L is the thermal load on the body defined as the difference between the internal heat
production and heat loss to the actual environment for a person hypothetically kept at
comfort values of skin temperature and sweat rate at the actual activity level.
In developing this index, the comfort data has been related to physiological variables,
which leads to the fact that index is semi-empirical and statistically based. At a given
level o f metabolic activity M, and when the body is not far from thermal neutrality, mean
skin temperature and sweat rate are the only physiological parameters influencing the heat
balance. The heat balance technique alone is not sufficient to establish thermal comfort
[7]. On the wide range o f environmental conditions where heat balance can be obtained,
only a narrow range provides thermal comfort. Thus, PMV is limited in its application to
a narrow range o f environmental conditions and to only steady-state analysis o f thermal
comfort.
R eproduced with perm ission of the copyright owner. Further reproduction prohibited without perm ission.
12
It can be concluded that all o f the previous studies that have led to the development of
thermal stress indices were either statistically based or at most used the energy balance
principle from first law o f thermodynamics. However, Aoki [18, 19] was the first to intro
duce the concept o f entropy in human thermal physiology. In these studies, he calculated
the entropy production in the human body under basal conditions and during exercise.
The limitation o f this study lies in the fact that only static experimental data is used to ver
ify the second law o f thermodynamics and the issue o f thermal comfort or stress is not at
all addressed. So far, there has been only one study conducted by Boregowda et al. [9]
dedicated to the development o f an Objective Thermal Stress Index (OTSI), a global mea
sure o f thermal stress from a thermodynamic standpoint based on the second law of ther
modynamics applied to the human thermal system.
1.2.2 M ental Stress
Several studies have been conducted to examine the relationship between psychologi
cal and physiological processes [20]. Among these investigations, the ones relevant to the
field of human factors engineering research include the studies that demonstrate the effects
of information processing or mental workload on physiological responses to assess the
human performance and efficiency in human-machine systems.Thus, the present literature
review is mainly focussed on studies related to physiological responses to mental work
load.
Mental stresses cause a wide range o f effects. As discussed by Hancock et al.[5] and
Mital and Mital [6], these could be physiological (elevated heart rates, blood pressure,
etc.) or psychological (lack o f attention, boredom, anxiety, etc.). Increases in heart rate
[21 - 23], changes in blood pressure [24], body temperature [25,26], and skin temperature
R eproduced with perm ission of the copyright owner. Further reproduction prohibited without perm ission.
13
[27, 28] are some o f the physiological responses to mental workload. There is no doubt
that blood pressure is one of the responses which increases with most types of mental and
physical activities. Questions that investigators are interested in, concern the amount of
change, moderating effects o f various kinds o f mental activities, emotional and stress
effects, environmental effects, and personality factors. The relationship between a number
o f physiological variables and mental workload was investigated by Ettema and Zielhus
[29]. The physiological measures included blood pressure, heart rate, and respiration rate.
The researchers manipulated the mental workload by varying the amount of information
processed by subjects in a given period o f time. The systolic and diastolic blood pressure
showed systematic increases as information-processing load increased. The same was
true for heart rate and respiration rate. It was concluded in this study [29] that increased
cardiovascular and respiratory functions are useful indices giving the measure o f mental
workload which may be important in assessing different aspects o f cognitive tasks. The
effects o f solving difficult problems on blood pressure and other cardiovascular measures
was studied by McCubbin et al. [30].
Several different methods have been used to quantify mental stress. These may be
classified as physiological and psychological. The efforts to quantify mental stress range
from measuring the cause o f stress to measuring the individual’s reaction to stress [31].
Physiological methods o f measuring mental stress include measurement of heart rate,
blood pressure, and oral body temperature [6, 32]. Questionnaires and interviews (psy
chological methods) have also been used to measure the individual’s reaction to different
kinds o f stresses [33, 34]. Measurement o f the concentration of attention has also been
used as a measure o f mental stress [35]. Despite all these efforts, an accurate method to
R eproduced with perm ission of the copyright owner. Further reproduction prohibited without perm ission.
14
quantify mental stress has not been developed. One o f the major drawbacks in all these
studies is that only one physiological variable is used an indicator o f mental stress. Since,
human body comprises o f many interconnected physiological processes controlled by a
complex nervous system, these single physiological indicators o f stress provide a very nar
row representation o f the human response. There has been no effort made to combine
these physiological responses such as blood pressure, heart rate, and body or skin temper
ature in the form of sin equation to form an index that provides an overall objective mea
sure o f mental stress. However, the studies conducted by Boregowda et al. [36 - 39] are
quite unique in which an objective stress index to quantify mental stress has been devel
oped on the basis o f Maxwell relations and second law o f thermodynamics as applied to
the human body. Further, this objective stress index is validated in a clinical study by
Palsson et al. [40].
1.3 Objectives
After reviewing the literature relevant to thermal stress, it is apparent that the search
for a universal thermal stress index has been vigorously pursued for the past half century.
The people who have been part o f this search include Engineers, Psychologists, Physiolo
gists, and Physicians. Each one o f them have their own objective, unique to their profes
sional and research interests. Engineers began their search in 1920s by developing
methods to predict the thermal stress response o f occupants to temperature and humidity
in building enclosures with the newly developed central heating and air conditioning sys
tems. Psychologists emphasize in knowing about thermal sensations o f warmth and cold
that relate to the thermal environment. On the other hand, Physiologists deal with the
R eproduced with perm ission of the copyright owner. Further reproduction prohibited without perm ission.
15
effects o f thermal environment on the body temperature regulation. They are mainly inter
ested in examining the effector processes necessary for thermoregulation (i.e., sweating,
vascular changes, shivering, and behavioral changes) which affect human judgements of
heat and cold [41]. Finally, the Physician is interested in the impact o f extreme heat and
cold on the health and well-being o f human beings.
All o f these professional groups have at one time or another developed indices o f ther
mal stress or comfort, of heat and cold tolerance, and o f performance to meet their own
professional and research needs. As a result o f this division among the disciplines, earlier
indices developed on the basis o f subjective assessment o f thermal sensations to the ther
mal environment are acceptable to Engineers and Psychologist, but not fully acceptable to
Physiologists. This is because Physiologists have recognized that thermal sensation is
associated with thermoregulatory responses like sweating, vascular changes, and shiver
ing. Thus, there is a lot o f confusion and disagreement among these different research
groups which is hindering their progress in research activity to develop a universal index
mainly due to lack o f a unified approach. One o f the major objectives o f the present study
is to overcome this problem by introducing a unified approach to develop an Objective
T herm al Stress Index (OTSI) based on the second law analysis o f human thermal sys
tem. In this regard, a unified field of study called Therm al Environm ental Psychophys
iology is defined which would be acceptable to researchers in different fields like
engineering, psychology, physiology, and medicine to clearly examine hum an-therm al
environm ent interaction.
The literature review concerning mental stress reveals the fact that there is no accurate
method to quantify mental stress. There is a situation similar to that in thermal stress, with
R eproduced with perm ission of the copyright owner. Further reproduction prohibited without perm ission.
16
regard to search for a universal index to quantify mental stress. The search has been going
: for last fifty years since Selye [42] introduced the concept o f stress to the scientific com
munity. Numerous approaches have been devised by Engineers, Psychologists, Physiolo
gists, and Physicians to quantify mental stress depending on their needs. For instance,
Engineers are mainly interested in the effects o f stress on human performance and eventu
ally safety o f the system. Psychologists focus on behavioral and cognitive aspects, show
ing little interest in physiology and performance. On the other hand, Physiologists
emphasize on effects o f exercise and physical stress on regulatory mechanisms, thus
showing less interest in engineering and psychological aspects o f stress. However, a new
breed o f professionals called Engineering Psychologists (sometimes called Human Fac
tors Engineers or Ergonomists) combine different aspects o f engineering and psychology
to understand better the effects o f mental work load on both behavioral and performance
capability o f human beings. This group o f Engineering Psychologists underemphasize the
impact o f stress on physiological responses. Finally, Physicians and Clinical Psycholo
gists who work in the primary care are mainly interested in the deleterious effects o f stress
on health and diseases.
This division in the stress research community has resulted in the lack o f a unified
approach to come up with a universal index to quantify mental stress. Although numerous
studies have been conducted in the past to assess the impact o f mental workload or infor
mation processing by different researchers, there has been no accurate method to quantify
mental stress. The second objective o f the present study is to develop an Objective Men
ta l Stress Index (OMSI) to bridge the gap by applying the Maxwell relations and second
law o f thermodynamics to the human psychophysiological system. In order to create a
R eproduced with perm ission of the copyright owner. Further reproduction prohibited without perm ission.
17
common platform for different researchers, a new unified field o f study called Cognitive
Psychophysiology is introduced to understand better the hum an-m achine interaction.
The two fields o f Thermal Environmental and Cognitive Psychophysiology are com
bined together to form an academic discipline called Engineering Psychophysiology.
This field is expected to investigate different aspects o f human-machine-environment
interaction using three-legged approach. Later, by combining the methods to quantify
thermal stress and mental stress, a Unified Stress Response Theory (USRT) is devel
oped. The USRT provides a universal approach to quantify human stress level based on a
strong scientific theory. The second law o f thermodynamics, being the basis o f USRT,
forms the underlying principles for the formulation o f OTSI and OMSI.
In order to validate OTSI and OMSI, the human thermal responses and other measures
like blood pressure, and heart rate have to be obtained by simulation or experimental
methods. A human thermal model based on finite element method [43, 44] is imple
mented to obtain human thermal responses to different environmental conditions, physical
activity, and clothing. The human thermal model is validated against the experimental
data for conducting further simulations. Thus, human thermal model is utilized as a
“Com putational Environm ental C ham ber” to conduct a series o f simulations to exam
ine the human thermal behavior under different conditions. In order to develop an effi
cient method for conducting human thermal experiments, a hybrid technique combining
the theory o f experimental design [45, 46] and entropy approach is implemented. The
transient analysis o f human thermal system provides moment-to-moment values o f OTSI.
The OTSI is validated against the regression equation for Predicted Mean Vote (PMV)
obtained from a large scale experimental study [7]. Physiological data from an existing
R eproduced with perm ission of the copyright owner. Further reproduction prohibited without perm ission.
18
experimental study is used to test the concept o f OMSI. Also, a pilot study at NASA Lan
gley Research Center is conducted to demonstrate the technique o f mental stress level
monitoring and some important psychophysiological concepts. Finally, a clinical study is
conducted in the Division o f Behavioral Medicine o f Eastern Virginia Medical School to
validate OMSI for clinical use.
The present study is organized in the following manner. Different areas of application
are discussed in Chap. 2. Chapter 3 discusses thermodynamic theory behind the objective
stress indices and psychophysiology o f human stress responses. The formulation of
human thermal model which includes the description o f physical model, governing equa
tions, and method o f solution are presented in Chap. 4. In Chap. 5, detailed formulation of
OTSI and OMSI are provided. The results are presented and discussed in Chap. 6.
Finally, concluding remarks on thermodynamic modeling and analysis o f human stress
responses are provided in Chap. 7.
R eproduced with perm ission of the copyright owner. Further reproduction prohibited without perm ission.
19
CHAPTER II
APPLICATIONS
In this chapter, some practical human factors engineering and medical applications for
the implementation o f objective measures o f stress level are presented. In Sec. 2.1, the
feasibility o f using Objective Thermal Stress Index (OTSI) in the area o f Environmental
Ergonomics is discussed. The use o f objective stress indices in transportation and aero
space applications for enhancing safety and performance is presented is Sec. 2.2. Finally,
some medical applications related to the emerging fields o f Psychophysiology and Behav
ioral medicine are outlined in Sec. 2.3.
2.1 Environmental Ergonomics
Ergonomics is the application o f scientific principles, methods, and data drawn from a
variety o f disciplines to the development o f engineering systems in which human beings
play a significant role [47]. The field o f ergonomics which specializes in the study of
interaction between humans and physical environment is called Environm ental Ergo
nomics. The present study pertains to the study o f impact o f thermal environment on
human thermal responses which determine the performance capability.
The innate nature o f human beings to maintain homeothermic state makes them
unique with ability to “bioengineer” the environment to protect from the thermal
extremes. Despite the human ability to engineer comfort over a wide range o f ambient
R eproduced with perm ission of the copyright owner. Further reproduction prohibited without perm ission.
20
conditions, human being still faces the challenge to quantify the range o f deviations from
thermal equilibrium. This limitation is overcome with the use of Objective Thermal Stress
Index (OTSI) which quantitatively represents the processes taking place in psychological
and physiological domains o f human being in response to changes in thermal environ
ment. The OTSI has the potential to become a “product” and could be sold to the HVAC
industry that is responsible for maintaining indoor climate in aerospace and civilian envi
ronmental control systems. OTSI would provide a measurement standard that takes into
account both environmental variables and human thermal responses. Also, it could be
used in performing the transient analysis o f cabins in high speed mass transit vehicles
where there is a rapid turnover o f passengers in very short time intervals.
2.2 Aviation Safety
During the recent years, with growth o f demand for air travel, there has been a lot of
research emphasis to achieve maximum aviation safety. The field o f aviation safety
includes all kinds o f aerospace vehicles and a wide spectrum of technologies. Human fac
tors issues are important because individuals must interact with the large, complex auto
mated systems o f modem forms o f aviation systems. Air accidents receive wide publicity
due to loss o f lives, high insurance and other related costs. Investigations of aviation mis
haps typically invoke contributory human factors issues, thus enhancing research opportu
nities [48].
Human error accounts for more than 70% of all aviation accidents. Thus, the Crew
Hazardous and Error Management (CHEM) group at NASA Langley Research Center is
working an “error proof’ flight deck. There is a strong need to build “human-centered”
R eproduced with perm ission of the copyright owner. Further reproduction prohibited without perm ission.
21
flight decks for superior flight management and maximum safety. In order to achieve this
goal, the quantitative measures o f excessive information processing or mental overload are
important to assess their effects on physiological responses and thus human behavior. In
this regard, Pope et al [49] conducted a study to examine the impact of information pro
cessing on brain activity. In this study, an Engagement Index (El) which combines differ
ent kinds o f brain waves like alpha, beta, and theta was developed. The El is based on a
valid equation and it provides a quantitative measure o f human attention and vigilance
capability. In contrast to this approach, the present study employs Objective Mental Stress
Index (OMSI) to provide a quantitative measure of mental stress in terms o f physiological
responses like blood pressure, heart rate, and skin or core temperatures. The OMSI indi
cates the impact of information processing on human performance; thus, it would play a
key role in the design o f human-machine systems, ultimately leading to the “human-cen
tered error-proof and stress-proof’ flight decks.
Finally, several studies by Hancock [50] establish the fact that uncomfortable thermal
environmental conditions degrade human performance. Hancock and Pierce [51] have
related attention and vigilance to changes in ambient environment. It has been shown that
sustained attention is disturbed by conditions sufficient to induce a change in human ther
mal equilibrium. At this point o f perturbation to thermal equilibrium, resulting state
drains attentional resources and thus reduces vigilance capability. The OTSI could be uti
lized as an objective measure o f deviation from thermal equilibrium to quantify the drain
in attentional resources and reduction in vigilance capability. Also, OTSI could be
employed in a rapid descent scenario o f a High Speed Civil Transport (HSCT) plane to
quantify the effects o f rapidly changing thermal environment on physiological responses
R eproduced with perm ission of the copyright owner. Further reproduction prohibited without perm ission.
22
of aircrew and passengers. This methodology would lead to the development of a safety
standard for designing a robust environmental control system.
2.3 Psychophysiology and Behavioral Medicine
Psychophysiology is the study o f relations between psychological manipulations and
resulting physiological responses, measured in the living organism, to promote under
standing o f the relation between mental and bodily processes [20], In other words, the
field o f psychophysiology is concerned with the measurement o f physiological responses
as they relate to the behavior. In this regard, Wickramasekara [52] defines Behavioral
Medicine as the interfacing o f behavioral and biomedical sciences in the areas of research,
diagnosis, prevention, and therapy o f physical diseases and dysfunctions. While the field
o f Psychophysiology focuses mostly on basic research and some applications, Behavioral
medicine emphasizes on actual treatment o f physical diseases or disorders caused due to
psychological stresses.
The behavioral medicine revolution originates from various changes that have taken
place in the health care during the past centuiy. In the past, most o f the deaths and dis
eases occurred due to biochemical and microbial agents (eg., plague, small pox, polio,
etc.). The development o f vaccines, antibiotics, and immunzation procedures, the public
health treatment o f water and sewage, and the sterile surgical procedures have eradicated
these diseases. In contrast to the past, today’s diseases and deaths are caused by chronic-
stress-related disorders such as heart attacks, strokes, cancer, pulmonary diseases, diabe
tes, automobile accidents, and alcoholism [52]. With regard to these stress-related modem
day diseases, the sources o f stress and their impact on the human physiology need to iden
R eproduced with perm ission o f the copyright owner. Further reproduction prohibited without perm ission.
23
tified and quantified. This is one o f the major challenges facing the behavioral medicine
and the field o f psychophysiology. A psychophysiological profile to detect the vulnerabil
ity o f different kinds o f individuals to different stimuli is being well established by Wick-
ramasekara [52]. In this profile, it has been shown that the different human beings show
their vulnerabilities in different subsystems o f their body. For example, one may show
high cardiovascular reactivity during the stressor test indicating proneness to heart dis
eases, while someone else may show reactivity in skin temperature showing proneness to
peripheral vascular diseases such as Raynaud’s syndrome. Thus there is a strong need to
identify these vulnerabilities or “window o f vulnerability” to diagnose the psychological
basis o f a physiological disorder caused due to acute or chronic stress.
At the present time, there are no objective measures other than single physiological
parameters to diagnose these diseases as stress-related ones. The present study fills the
gap by developing an Objective Mental Stress Index (OMSI) to link psychological and
physiological properties o f the human body. The OMSI is regarded as a parameter that
quantifies the mind-body interaction. A study by Boregowda and Tlwari [53] have shown
the utility o f both OTSI and OMSI in understanding the peripheral diseases such as dia
betic neuropathy in a microgravity environment. Diabetic neuropathy, like Raynaud’s dis
ease is caused mainly due to lack o f blood flow and heat transfer to the peripheral parts of
limbs. In another clinical study conducted by Palsson et al. [40], it has been shown that
OMSI has a great potential to become a valid index to quantify clinical stress and a mea
sure of stress-related symptoms. In summary, OMSI would become a valid tool to quan
tify, detect, and diagnose the onset or cause o f stress-related disorders, thus providing a
global measurement standard in the area o f preventive health.
R eproduced with perm ission of the copyright owner. Further reproduction prohibited without perm ission.
24
CHAPTER III
THERMODYNAMICS OF HUMAN STRESS RESPONSES
Thermodynamics is the study o f energy interactions in systems and surroundings in
the universe. A system could be any system in the universe. In the scope o f the present
study, two subsystems in the human body which include thermal system and cardiovascu
lar system are considered.
3.1 The Nervous System
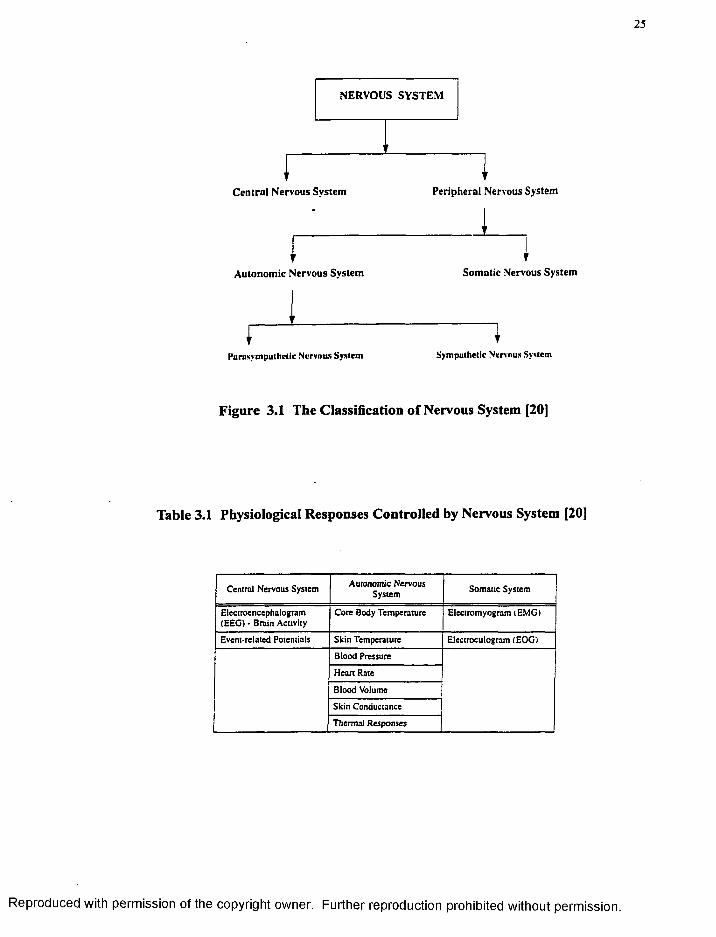
The nervous system is highly complex and integrated as shown in Fig. 3.1, but for the
sake o f convenience, the various physiological measures which are considered to be con
trolled by different subsystems o f the nervous system are listed in Table 3.1 [20]. The two
main branches o f nervous system include central nervous system (CNS) and peripheral
nervous system. The CNS includes the brain and spinal cord. The peripheral nervous sys
tem refers to nervous tissue outside the brain and spinal cord, including the cranial and
spinal nerves. The peripheral nervous system is further divided into the somatic system,
concerned with muscular activities, and the autonomic nervous system (ANS), which con
trols visceral structures (glands and organs o f the body).
The ANS is subdivided into the parasympathetic nervous system (PNS), which plays a
major role when the individual is at rest, and the sympathetic nervous system (SNS),
which is dominant in situations requiring mobilization o f energy. The PNS can be thought
R eproduced with perm ission of the copyright owner. Further reproduction prohibited without perm ission.
25
NERVOUS SYSTEM
1Central Nervous System Peripheral Nervous System
Autonomic Nervous System Somatic Nervous System
PuruNymputhclic Nervous System Sympathetic Nervous System
Figure 3.1 The Classification o f Nervous System [20]
Table 3.1 Physiological Responses Controlled by Nervous System [20]
Central Nervous System Autonomic Nervous System Somatic System
Electroencephalogram (EEG) - Brain Activity
Core Body Temperature Electromyogram (EMC)
Event-related Potentials Skin Temperature Electroculogram (EOG't
Blood Pressure
Heart Rate
Blood Volume
Skin Conductance
Thermal Responses
R eproduced with perm ission of the copyright owner. Further reproduction prohibited without perm ission.
26
of as a system o f rest and repair, whereas the SNS is a system of energy mobilization and
work. Figure 3.1 does not provide the exact classification because some of the measures
controlled by ANS are also under the control of CNS. For example, the hypothalamus and
medulla of the brain are important in the control o f ANS functions such as temperature
regulation. Many o f the physiological responses o f interest are controlled by the ANS,
and thus it is a very important system for the field o f psychophysiology.
3.2 Homeostasis
The autonomic nervous system (ANS) is the regulator and coordinator o f important
bodily activities, including body and skin temperatures, blood pressure, and heart rate.
These activities have traditionally been regarded to be automatic or taking place without
conscious control. However, research in the area o f self-regulation o f physiological
responses through biofeedback and other psychophysiological techniques suggests that it
might be possible to alter one’s own level o f ANS activity [52]. In general, the main func
tion o f the ANS is to keep a constant internal body environment in the face o f internal or
external changes that could upset the balance. The term for the concept that describes the
maintenance o f a stable internal environment is homeostasis, coined by the physiologist
Claude Bernard [20].
3.2.1 Therm al Homeostasis
With regard to human thermal system, it is well established that human beings contin
uously exchange heat with their environment to maintain a constant internal body temper
ature. This ability to compensate for disturbances, to maintain internal thermal
equilibrium is called therm al homeostasis. The state o f constant internal body tempera-
R eproduced with perm ission of the copyright owner. Further reproduction prohibited without perm ission.
27
ture is called homeothermic state. Thus, all the human beings who possess this ability
are called homeotherms. For a healthy, sedentary human, core temperature is typically
around 3 7 °C (98.6° F). Deviations o f 2°C in core temperatures from its normal level
may cause discomfort. As the core temperature rises above this narrow range, body func
tions begin to deteriorate, which lead to a condition called hypertherm ia. When the body
temperature falls below the normal range, it results in a condition called hypothermia.
The maintenance of a homeothermic state is very important for the existence and support
o f life. The study o f thermal responses o f homeotherms, especially human beings occu
pies an important position in the fields o f life sciences and human engineering.
The thermoregulatory or control system is a psychophysiological system responsible
for maintaining the core temperature at a normal level by enhancing or inhibiting heat pro
duction and heat loss. Therm oreceptors, located in the skin, brain, spinal cord, and other
sites o f the body respond to both local temperature and its changes [43]. Signals from the
thermoreceptors are transmitted by the central nervous system to the hypothalamus where
they are integrated in a manner which is not completely understood at this time. Regard
less o f the relative significance o f the temperature signals from the various thermoreceptor
locations, the hypothalamus determines the overall thermal state of the body from these
signals and issues commands that finally result in physiological responses. The details of
these responses and the control system are presented in Chap. 4 (Sec. 4.1.2).
3.2.2 Cardiovascular Homeostasis
The cardiovascular responses such as blood pressure and heart rate are controlled by
baroreceptors. The baroreceptors are pressure-sensing cells situated mainly around
blood vessels in the neck region. These receptors are important in regulating blood pres
R eproduced with perm ission o f the copyright owner. Further reproduction prohibited without perm ission.
28
sure just as a thermostat regulates in a central heating system [54]. If blood pressure falls
sharply, the baroreceptors will send nerve messages to quicken the heartbeat and cause
constriction o f blood vessels, thus leading to increase o f blood pressure. Conversely, if
blood pressure rises during exercise or anger, the baroreceptor will send different mes
sages; the result will be slowing o f the heart rate and vasodilation, both of which will tend
to lower the blood pressure. Thus, baroreceptors play a key role in maintaining cardio
vascular homeostasis, in a manner similar to thermoreceptors which are responsible for
thermal homeostasis.
3.3 Engineering Psychophysiology
Any disturbance to homeostasis causes specific changes in physiological responses
depending on the nature o f stressors. The disturbances might come from diverse sources.
For the present study, two major categories o f stressors are identified which include (1)
environmental factors that are external to the individual (outside-the-skin) and (2) internal
environmental factors [55], External events that occur outside o f the skin, include factors
such as environmental temperature, humidity, wind, and exposure to other weather-related
variables o f the physical environment. Internal events consist o f complex communication
network inside the skin. They are influenced by physiologic reactions to one’s own
thoughts, images, fantasies, and emotional states [56]. Internal events fluctuate continu
ally as both internal and external events are processed at conscious and unconscious lev
els. In the context o f the present study, the thermal environment and information-
processing machines are the sources that lead to external and internal events respectively.
R eproduced with perm ission of the copyright owner. Further reproduction prohibited without perm ission.
29
In order to address the issues related to the interaction o f human beings with both ther
mal environment and machines, a new field of study called Engineering Psychophysiology
is introduced. The field o f Engineering Psychophysiology is defined under Postulate I as
follows:
Postulate I. Engineering Psychophysiology is the field of study that examines the relation
ship between the human psychological and physical properties of the human-machine-
thermal environment composite system using the second law o f thermodynamics.
The engineering psychophysiology focuses on human-machine-environment interac
tion issues. This field is further subdivided into two groups namely: Thermal Environ
mental Psychophysiology and Cognitive Psychophysiology.
3.3.1 Thermal Environmental Psychophysiology
Traditionally, ecological science emphasizes the study o f biological bases o f energy
transactions between animals and their physical environments across cellular, organismic,
and population scales [57], However, the traditional emphasis lacks the psychological
emphasis and the basis o f second law of thermodynamics. Thus, the present study incor
porates the principles o f thermodynamics to investigate the human-thermal environment
interaction. The result is the creation of a new field o f study called Thermal Environmen
tal Psychophysiology which is defined under Postulate II as follows:
Postulate II. Thermal Environmental Psychophysiology is a science that involves the
development o f functionally dependent relationships between the psychological (thermal
stress) and physical (thermal responses and environmental factors) properties o f the
human-thermal environment system.
R eproduced with perm ission of the copyright owner. Further reproduction prohibited without perm ission.
30
One of the major objectives of creating this field o f Thermal Environmental Psycho
physiology is to develop parameters that would indicate human-thermal environment
interaction quantitatively and provide a measure of thermal stress or discomfort experi
enced by humans.
3.3.2 Cognitive Psychophysiology
The main purpose of developing the field o f Cognitive Psychophysiology is to dis
cover the natural metrics o f human behavior, not to uncritically import metrics from other
domains of physics. In this regard, Cognitive Psychophysiology examines the impact of
information-processing or mental load on the human physiology leading to the develop
ment o f stress indices to indicate mental stress level. It is defined under Postulate III as
follows:
Postulate III. Cognitive Psychophysiology is a study that involves the development of
functionally dependent relationships between the psychological (mental stress) and physi
ological (blood pressure, heart rate, skin, and skin or body temperature) properties o f the
human-machine system.
Cognitive Psychophysiology would lead to the development of indices that would
quantify the mind-body interaction in human-machine systems design. Thus, it would
play a key role in the effective design o f systems that will result in the improvement of
safety and performance.
R eproduced with perm ission of the copyright owner. Further reproduction prohibited without perm ission.
31
3.4 Unified Stress Response Theory (USRT)
When a human being is exposed to an environmental or cognitive stressor, a number of
physiological changes are observed. Some of the significant changes include thermal
responses, blood pressure, and heart rate. Usually, there is very little or no correlation
between these various physiological measures [58]. As a result of these diverse responses,
the response to stress cannot be considered as a simple response of a single system [59].
Rather, the response to a stress comprises a number o f different variables and appears as a
complex pattern o f responses in different systems. Although numerous views about the
multidimensional nature o f human thermal behavior has been put forward, at present there
is no unified theory that provides an approach to predict the effects of different forms o f
stress on human performance capability [60]. The present study fulfills this need through
the development o f a Unified Stress Response Theory (USRT). The USRT combines the
two human subsystems (thermal system and cardiovascular system) and their correspond
ing stressors. It is defined under Postulate IV as follows:
Postulate IV. Human Stress is a mathematical function o f both physiological strain and
stressor. The stress is defined by its terminology depending on the nature of stressor,
although the similar physiological reactions may be caused by different stressors or stim
uli.
For example, a person may sweat due to either ambient conditions or emotional stress.
The USRT is defined according to the following logic:
Human Stress = f (Physiological Strain, Stressor)
IF Stressor = Thermal Environmental Properties (Taip RH)
R eproduced with perm ission o f the copyright owner. Further reproduction prohibited without perm ission.
32
THEN Human Stress = Thermal Stress
IF Stressor = Mental Workload or Cognitive Task
THEN Human Stress = Mental Stress
A unified theory is formulated by combining the concepts o f thermal stress and mental
stress. The USRT utilizes the second law of thermodynamics to analyze human thermal
system and cardiovascular system to formulate Objective Thermal Stress Index (OTSI)
and Objective Mental Stress Index (OMSI) which is described in Chap. 5. Both these
indices are based on the second law of thermodynamics [61] which is restated under Pos
tulate V as follows:
Postulate V. The Second Law o f Thermodynamics
L. S. Carnot (1824): In any system, some loss of energy is inevitable. Complete conver
sion o f input energy to output work is impossible. (A forecast for the existence of entropy.)
R. Clausius (1887): The amount o f energy in the universe is fixed; its distribution is
uneven. Conversion o f a energy to work in a system produces an inevitable loss o f energy
to a lower energy area o f the universe (entropy). Entropy increases as the energy o f the
universe seeks uniform distribution. The drive to attain this uniformity is the fundamental
force o f the universe.
All systems in the universe obey second law of thermodynamics. The two human sub
systems that are being analyzed include thermal and cardiovascular systems to develop
indices for quantifying thermal and mental stresses respectively. Entropy is a measure of
disorder or chaos in any system in the universe [62]. The present study considers the
R eproduced with perm ission of the copyright owner. Further reproduction prohibited without perm ission.
33
human body as a system o f interest. In this regard, human stress of the whole body is gen
erally defined under Postulate VI as follows:
Postulate VI. Human Stress is equivalent to entropy generation and is a measure of disor
der or chaos or activeness in the human psychophysiological system in response to stres
sors from thermodynamic and holistic (whole body) viewpoints.
3.4.1 Thermal Stress
The entropy production provides a global measure o f violent motions and reactions
occurring in nature. Hence, the entropy production or generation in the human thermal
system shows the extent o f activeness of (1) heat flows and (2) motions and reactions of
substances within the body as a whole [18, 19]. Therefore, the entropy generation is a sig
nificant psychophysiological quantity which characterizes the human thermal system from
thermodynamic and holistic (i.e., considering a human body as a whole) viewpoints.
Thermal stress is equated to entropy generation in the human thermal system in accor
dance with the philosophy o f Nicolis and Prigogine [63] and defined under Postulate VI as
follows:
Postulate VII. Thermal Stress is defined as the measure o f disorder or chaos or activeness
in psychological domain as a result o f physiological changes in human thermal system in
response to thermal environmental stressors from a thermodynamic and holistic (whole
body) viewpoints.
Thus, thermal stress is mathematically defined using a thermodynamic function in the fol
lowing manner.
Thermal Stress = f (Physiological Strain, Thermal Environmental Properties)
R eproduced with perm ission of the copyright owner. Further reproduction prohibited without perm ission.
34
3.4.2 Mental Stress
If the mental workload or information processing causes changes in physiological
responses that can be measured, then using thermodynamic Maxwell relations, entropy
change in the absence o f flow entropy indicates the level o f mental stress. Also, it repre
sents disorder in the non-physical or psychological domain of the human body. In other
words, entropy change provides a quantitative measure of psychological process in terms
of physiological responses to mental workload or information processing. The mental
stress is defined under Postulate VIII as follows:
Postulate VIII. Mental Stress is defined as the measure o f disorder or chaos or activeness
in psychological domain as a result o f physiological changes in both human thermal and
cardiovascular systems in response to mental workload or information processing from a
thermodynamic and holistic (whole body) viewpoints.
Thus, the mental stress is mathematically defined using a thermodynamic function in the
following manner.
Mental Stress = f (Physiological Strain, Mental Workload)
For the sake o f convenience, the postulates and definitions related to objective mea
sures of stress level are described in Fig. 3.2. The details pertaining to the formulation of
stress indices corresponding to thermal stress (OTSI) and mental stress (OMSI) are pre
sented in Chap. 5. In order to validate OTSI, thermal stress responses are obtained by
implementing a human thermal model which is described in Chap. 4. A series o f com
puter simulations are conducted using this model to obtain thermal responses to different
R eproduced with perm ission of the copyright owner. Further reproduction prohibited without perm ission.
35
environmental conditions. The OMSI is validated using experimental data described in
Chap. 6.
R eproduced with perm ission of the copyright owner. Further reproduction prohibited without perm ission.
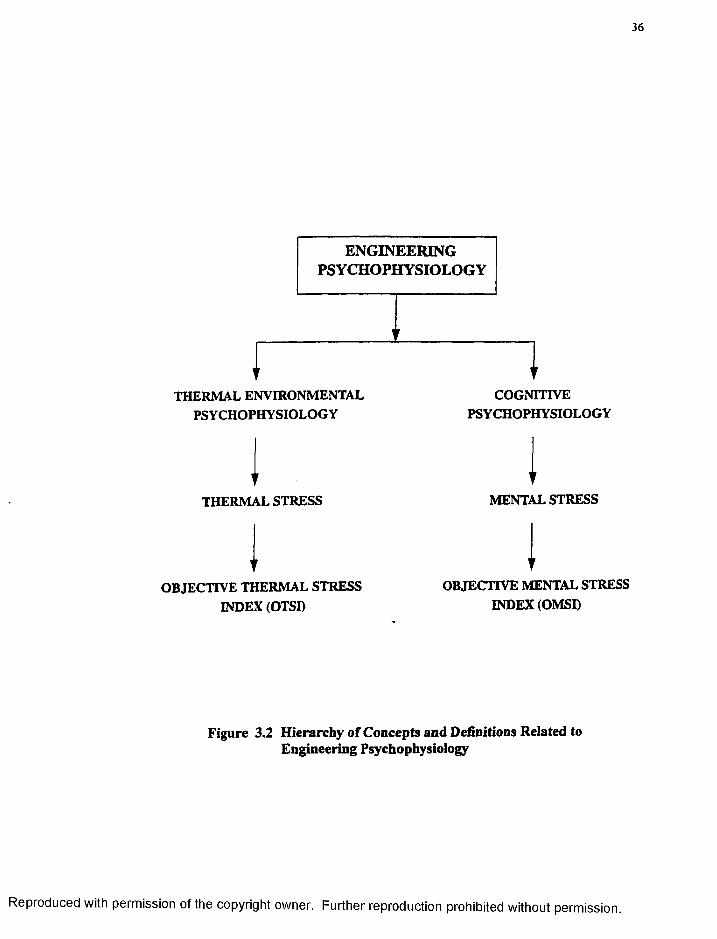
36
ENGINEERING PSYCHOPHYSIOLOGY
I
_________ 3!___________
THERMAL ENVIRONMENTAL PSYCHOPHYSIOLOGY
COGNITIVEPSYCHOPHYSIOLOGY
THERMAL STRESS MENTAL STRESS
OBJECTIVE THERMAL STRESS INDEX (OTSI)
OBJECTIVE MENTAL STRESS INDEX (OMSI)
Figure 3.2 Hierarchy of Concepts and Definitions Related to Engineering Psychophysiology
R eproduced with perm ission of the copyright owner. Further reproduction prohibited without perm ission.
37
CHAPTER IV
HUMAN THERMAL MODEL
In this chapter, different physical systems for the human thermal model are identified,
and pertinent governing equations for each system are presented. Also, essential condi
tions for each system are specified, and appropriate solution procedure for the system is
described.
4.1 Physical Model
The human thermal system consists o f three important interactive systems and these
are categorized as follows:
(1) Passive System
(i) Tissues and Internal Organs(ii) Circulatory System(iii) Respiratory System
(2) Control System
(i) Vasomotor Response(ii) Sudomotor Response(iii) Metabolic Response(iv) Cardiac Output Response
(3) Clothing System
4.1.1 Passive System
The passive system includes the body tissues, internal organs, circulatory, and respira
tory systems. It represents the heat transfer mechanisms within the body parts such as
R eproduced with perm ission of the copyright owner. Further reproduction prohibited without perm ission.
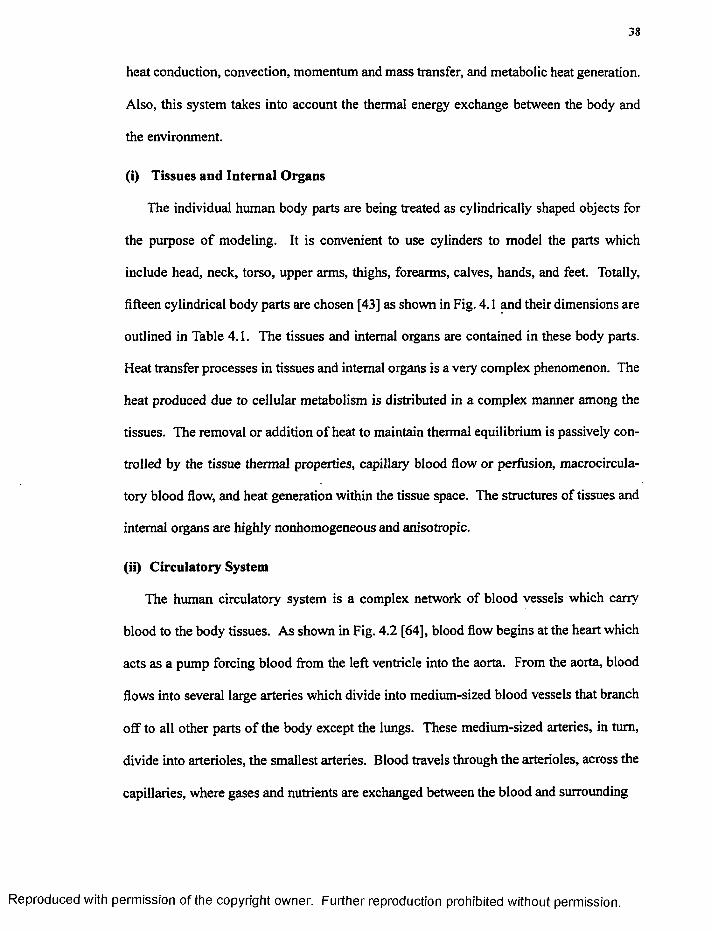
38
heat conduction, convection, momentum and mass transfer, and metabolic heat generation.
Also, this system takes into account the thermal energy exchange between the body and
the environment.
(i) Tissues and Internal Organs
The individual human body parts are being treated as cylindrically shaped objects for
the purpose o f modeling. It is convenient to use cylinders to model the parts which
include head, neck, torso, upper arms, thighs, forearms, calves, hands, and feet. Totally,
fifteen cylindrical body parts are chosen [43] as shown in Fig. 4.1 and their dimensions are
outlined in Table 4.1. The tissues and internal organs are contained in these body parts.
Heat transfer processes in tissues and internal organs is a very complex phenomenon. The
heat produced due to cellular metabolism is distributed in a complex manner among the
tissues. The removal or addition o f heat to maintain thermal equilibrium is passively con
trolled by the tissue thermal properties, capillary blood flow or perfusion, macrocircula-
tory blood flow, and heat generation within the tissue space. The structures of tissues and
internal organs are highly nonhomogeneous and anisotropic.
(ii) Circulatory System
The human circulatory system is a complex network of blood vessels which carry
blood to the body tissues. As shown in Fig. 4.2 [64], blood flow begins at the heart which
acts as a pump forcing blood from the left ventricle into the aorta. From the aorta, blood
flows into several large arteries which divide into medium-sized blood vessels that branch
off to all other parts o f the body except the lungs. These medium-sized arteries, in turn,
divide into arterioles, the smallest arteries. Blood travels through the arterioles, across the
capillaries, where gases and nutrients are exchanged between the blood and surrounding
R eproduced with perm ission o f the copyright owner. Further reproduction prohibited without perm ission.
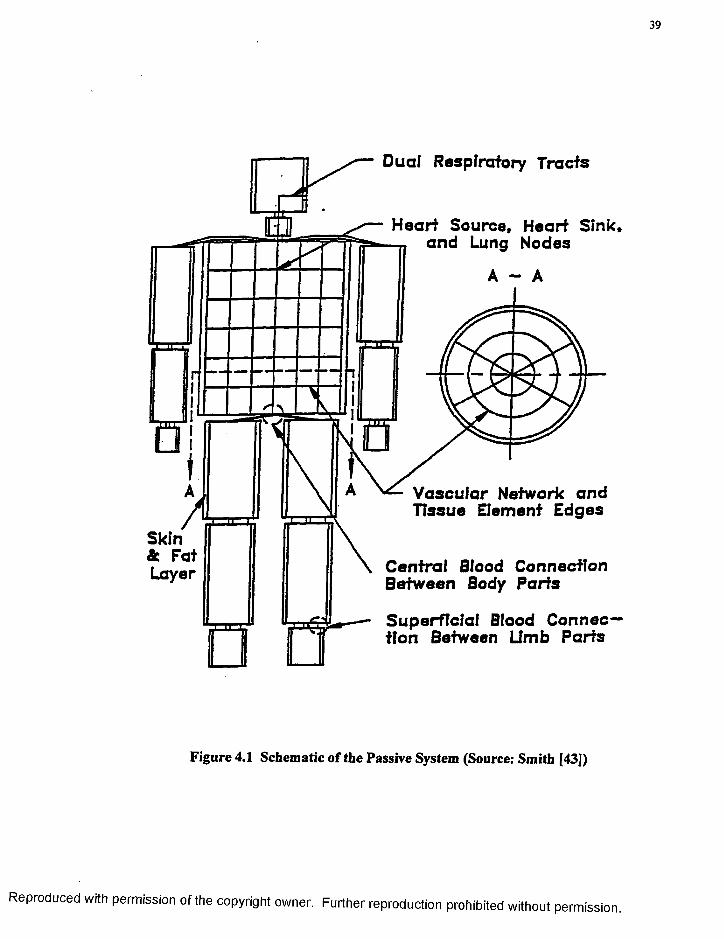
39
0
8 5 ^ .
— — ------- ------
■ r * V -
Dual Respfratory Tracts
and Lung Nodes
A - A
& Fat
□
Vascular Network and Tissue Element Edges
Central Blood Connection Between Body Parts
Superficial Blood Connection Between Umb Parts
Figure 4.1 Schematic of the Passive System (Source: Smith [43])
R eproduced with perm ission o f the copyright owner. Further reproduction prohibited without perm ission.
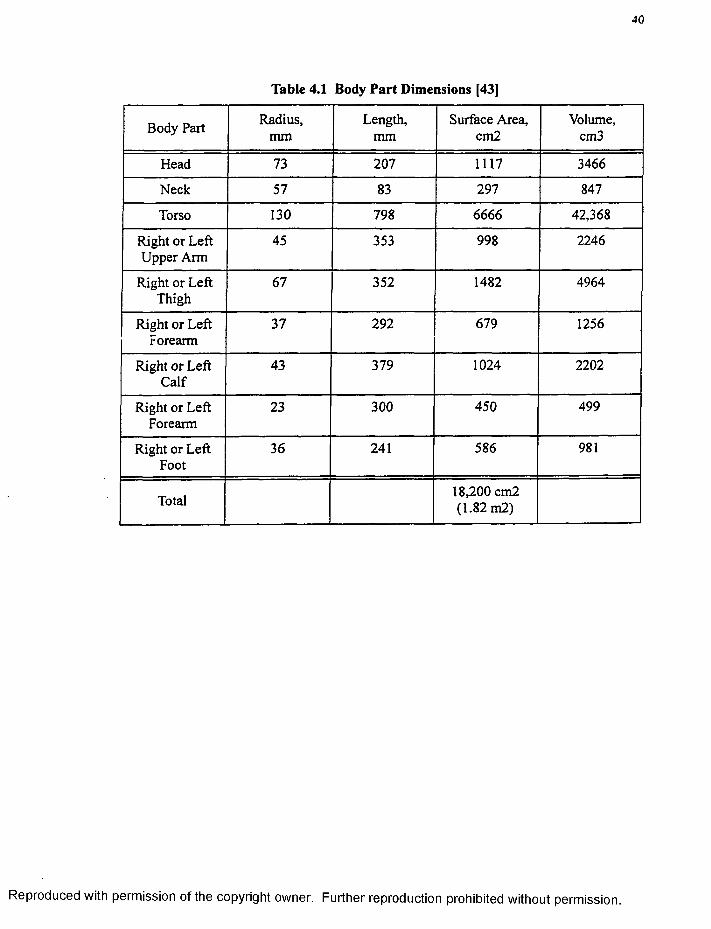
40
Table 4.1 Body Part Dimensions [43]
Body Part Radius,mm
Length,mm
Surface Area, cm2
Volume,cm3
Head 73 207 1117 3466
Neck 57 83 297 847
Torso 130 798 6666 42,368
Right or Left Upper Arm
45 353 998 2246
Right or Left Thigh
67 352 1482 4964
Right or Left Forearm
37 292 679 1256
Right or Left Calf
43 379 1024 2202
Right or Left Forearm
23 300 450 499
Right or Left Foot
36 241 586 981
Total18,200 cm2 (1.82 m2)
R eproduced with perm ission of the copyright owner. Further reproduction prohibited without perm ission.

41
PulmonaryA rtary
is mm Hg/ /
Pulm onary Vain
Left Atrium 8 mmHg
Cap! I la r i .aa mm Hg
A t r i u mRight Vantrlela0 mm Hg Vantrlela W.-n
Arterial System
go mmHgVenoua System omm Hg
5 W miC “C ap illa rie s25 mm Hg J S >
Figure 4.2 The Circulatory System (Source: Cooney [641)
R eproduced with perm ission of the copyright owner. Further reproduction prohibited without perm ission.
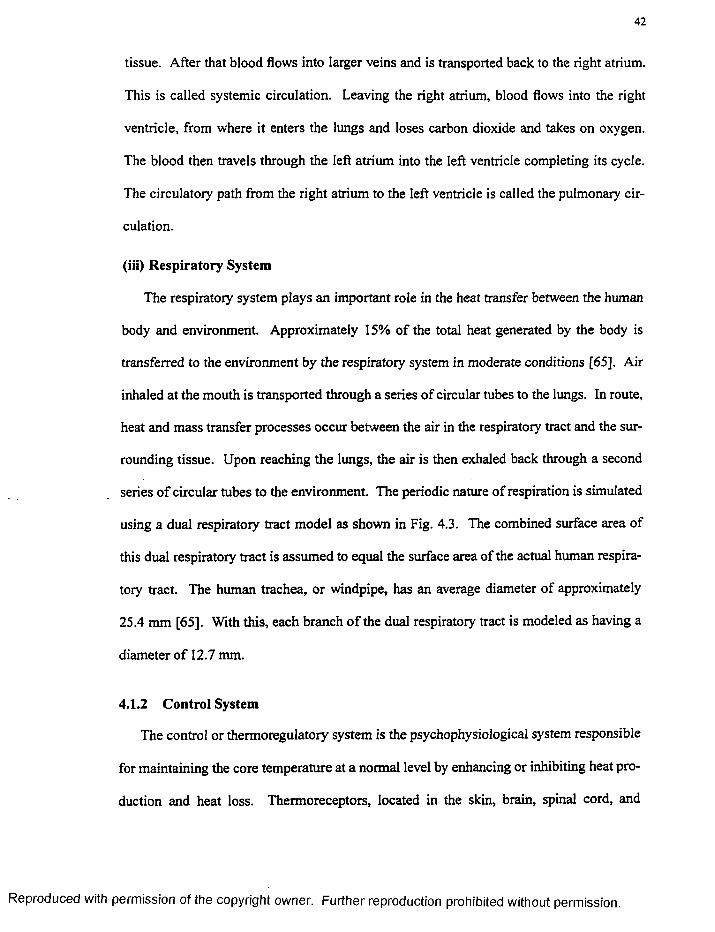
42
tissue. After that blood flows into larger veins and is transported back to the right atrium.
This is called systemic circulation. Leaving the right atrium, blood flows into the right
ventricle, from where it enters the lungs and loses carbon dioxide and takes on oxygen.
The blood then travels through the left atrium into the left ventricle completing its cycle.
The circulatory path from the right atrium to the left ventricle is called the pulmonary cir
culation.
(iii) Respiratory System
The respiratory system plays an important role in the heat transfer between the human
body and environment. Approximately 15% of the total heat generated by the body is
transferred to the environment by the respiratory system in moderate conditions [65]. Air
inhaled at the mouth is transported through a series of circular tubes to the lungs. In route,
heat and mass transfer processes occur between the air in the respiratory tract and the sur
rounding tissue. Upon reaching the lungs, the air is then exhaled back through a second
series o f circular tubes to the environment. The periodic nature o f respiration is simulated
using a dual respiratory tract model as shown in Fig. 4.3. The combined surface area of
this dual respiratory tract is assumed to equal the surface area of the actual human respira
tory tract. The human trachea, or windpipe, has an average diameter of approximately
25.4 mm [65]. With this, each branch o f the dual respiratory tract is modeled as having a
diameter o f 12.7 mm.
4.1.2 Control System
The control or thermoregulatory system is the psychophysiological system responsible
for maintaining the core temperature at a normal level by enhancing or inhibiting heat pro
duction and heat loss. Thermoreceptors, located in the skin, brain, spinal cord, and
R eproduced with perm ission o f the copyright owner. Further reproduction prohibited without perm ission.
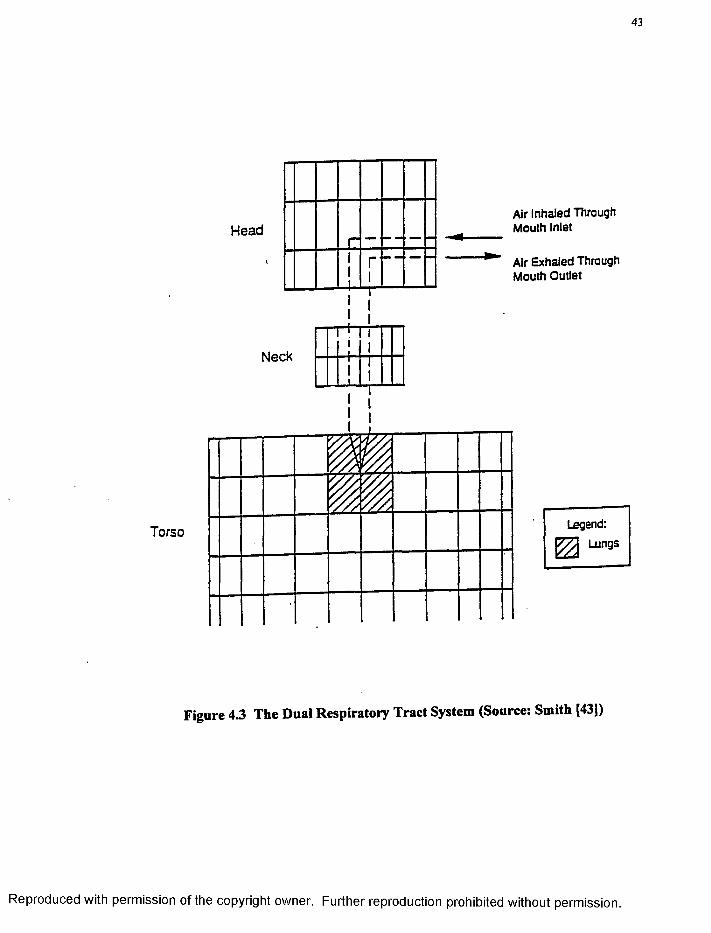
43
Air Inhaled Through Mouth inletHead
Air Exhaled Through Mouth Outlet
I-------
Neck
Legend:
Z ] Lungs
Figure 4.3 The Dual Respiratory Tract System (Source: Smith [43])
R eproduced with perm ission of the copyright owner. Further reproduction prohibited without perm ission.
other sites in the body respond to both local temperature and its changes [43]. Signals
from the thermoreceptors are transmitted by the central nervous system to the hypothala
mus where they are integrated in a manner which is not clearly understood at this time.
Regardless of the relative significance o f the temperature signals from the various ther
moreceptor locations, the hypothalamus determines the overall thermal state of the body
from these signals and issues the appropriate commands. The three major types o f ther
moregulatory functions which either inhibit or enhance heat production and heat loss are
vasomotor, sudomotor, and metabolic responses.
(i) Vasomotor Response
The body's response to dilate or constrict skin blood vessels is a vasomotor response
where dilation o f blood vessels is referred to as vasodilation and constriction o f those
same blood vessels is called vasoconstriction. When the core temperature rises above the
normal level, in most parts o f the body the skin blood vessel start dilating to increase the
blood flow rates which in turn helps in transferring heat to the skin surface. During
vasodilation, much o f the blood that passes near the skin surface where it gets cooled
before it returns to the body core. The skin temperature closely reflects minor changes in
the deep body temperature. Depending on the ambient temperatures, the body will either
lose or gain heat to or from the environment respectively. If the ambient temperature is
higher than the skin temperature, then the heat transfer takes place from the environment
to the body. In other words, vasodilation becomes undesirable allowing more heat from
the environment to enter the body and thus increasing the temperature of the body core
and affecting the human comfort.
R eproduced with perm ission o f the copyright owner. Further reproduction prohibited without perm ission.
45
When the core temperature begins to drop below the normal level, the posterior hypo
thalamus sympathetic centers in the thermoregulatory system cause the blood vessels of
the skin to constrict [44]. This reduces the flow of warm blood from the arteries to the
veins near the skin surface, thereby decreasing the rate of heat transfer. During vasocon
striction, the skin temperature falls to near the temperature of the surroundings which
reduces the heat loss from the body and thus allows the body core to retain heat and main
tain its normal temperature level. Further, due to constriction of skin blood vessels, the
blood will flow through deeper veins back to the heart. The blood returning to the heart
via deeper veins will be heated to some degree by the nearby arteries. In this manner, the
blood that is supplied to the extremity could be 10 to 20 degrees cooler than the body core,
yet the blood that returns to the core may only be cooled 1 or 2 degrees. Therefore, the
temperature of the trunk is maintained while the extremities are allowed to cool.
(ii) Sudomotor Response (Sweating)
When the vasodilation is not sufficient to bring the core temperature back to normal,
the anterior hypothalamus in the thermoregulatory system initiates the sweating process
by sending signals to all o f the sweat glands of the body through the sympathetic nerves
[44]. Sweating is a powerful and sensitive thermoregulatory mechanism. Increase of core
temperature by 1°C can produce an increase in sweat rate by a factor o f 10-20 times.
Under extreme conditions, as much as 1.5 liters o f sweat can be secreted onto the surface
of the skin in an hour, and under favorable conditions a large proportion o f this will evap
orate. The evaporation o f sweat on the skin surface allows large amounts of heat (up to
1300W, which is about 12 times the basal level of heat production) to be dissipated in hot
environments. In fact, when the environmental temperature is higher than skin tempera
R eproduced with perm ission of the copyright owner. Further reproduction prohibited without perm ission.
46
ture, the only way that the body can rid itself o f heat is by the evaporation of sweat.
Therefore, any factor that prevents the evaporation o f sweat (such as clothing or the con
genital absence of sweat glands) will cause the core temperature to rise when the sur
rounding temperature is higher than the skin temperature.
(iii) Metabolic Response
The total metabolic heat production arises from three sources: basal metabolism, vol
untary physical activity, and shivering or involuntary metabolism for thermoregulation.
The basal metabolism corresponds to heat generation during the resting condition and
remains almost constant. The voluntary physical activities produce heat depending on the
level o f activity. The shivering is controlled by the thermoregulatory system. When other
means, such as the vasoconstriction, the basal and voluntary metabolism are not sufficient
to return the core temperature to its normal level, shivering (involuntary muscle contrac
tions) begins to generate heat in muscle tissue. This muscular activity caused by the shiv
ering increases the rate o f heat generation in the body to counter the extreme cold
environment [44].
4.1.3 Clothing System
The clothing plays a vital role in affecting the transient responses as humans wear
clothes under normal conditions. The transfer o f heat and mass (moisture) from the skin
through the clothing to the environment is an important factor in thermal comfort.
Removal o f body heat is accomplished primarily by convection and radiation at low activ
ity levels. Evaporation of perspiration is employed as the most effective thermoregulatory
mechanism at intermediate and high metabolic rates and in environments which pose high
heat stresses.
R eproduced with perm ission of the copyright owner. Further reproduction prohibited without perm ission.
47
The development o f the thermal model for the clothed human includes governing
energy equations o f the these three systems (passive, control, and clothing systems). The
human thermoregulatory responses are obtained by solving these system of energy equa
tions. Auxiliary equations, such as the blood pressure governing equation o f the macrocir-
culatory system, the humidity ratio equation o f the respiratory system, mass transfer
equation o f the clothing system, etc., form the complete system of governing equations.
4.2 Governing Equations
The governing equations for the three systems are categorized as follows:
1. Passive System Governing Equations
(i) Blood Pressure(ii) Humidity Ratio(iii) Thermal Energy
(a) Tissue Energy(b) Blood Energy(c) Air Energy
3. Control System Governing Equations
(i) Vasomotor Response(ii) Sudomotor Response(iii) Metabolic Response(iv) Cardiac Output
3. Clothing System Governing Equations
4.2.1 Passive System Governing Equations
(i) Blood Pressure Equation
The Navier-Stokes equations are applied to blood flow in the macrocirculatory system
to determine the pressure distribution. The basic assumptions include: blood is a Newto
nian fluid flowing in the axial direction, 1-D, incompressible, steady, constant viscosity,
R eproduced with perm ission of the copyright owner. Further reproduction prohibited without perm ission.
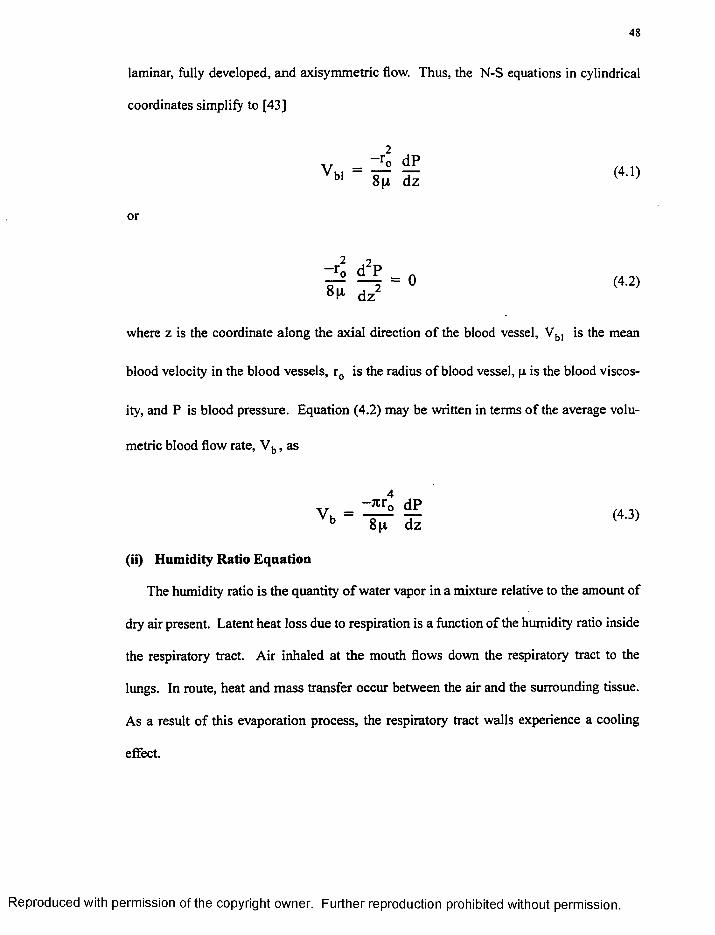
48
laminar, fully developed, and axisymmetric flow. Thus, the N-S equations in cylindrical
coordinates simplify to [43]
where z is the coordinate along the axial direction o f the blood vessel, Vb, is the mean
blood velocity in the blood vessels, r0 is the radius o f blood vessel, p is the blood viscos
ity, and P is blood pressure. Equation (4.2) may be written in terms o f the average volu
metric blood flow rate, Vb, as
(ii) Humidity Ratio Equation
The humidity ratio is the quantity o f water vapor in a mixture relative to the amount of
dry air present. Latent heat loss due to respiration is a function o f the humidity ratio inside
the respiratory tract. Air inhaled at the mouth flows down the respiratory tract to the
lungs. In route, heat and mass transfer occur between the air and the surrounding tissue.
As a result o f this evaporation process, the respiratory tract walls experience a cooling
effect.
(4.1)
or
(4.2)
(4.3)
R eproduced with perm ission of the copyright owner. Further reproduction prohibited without perm ission.
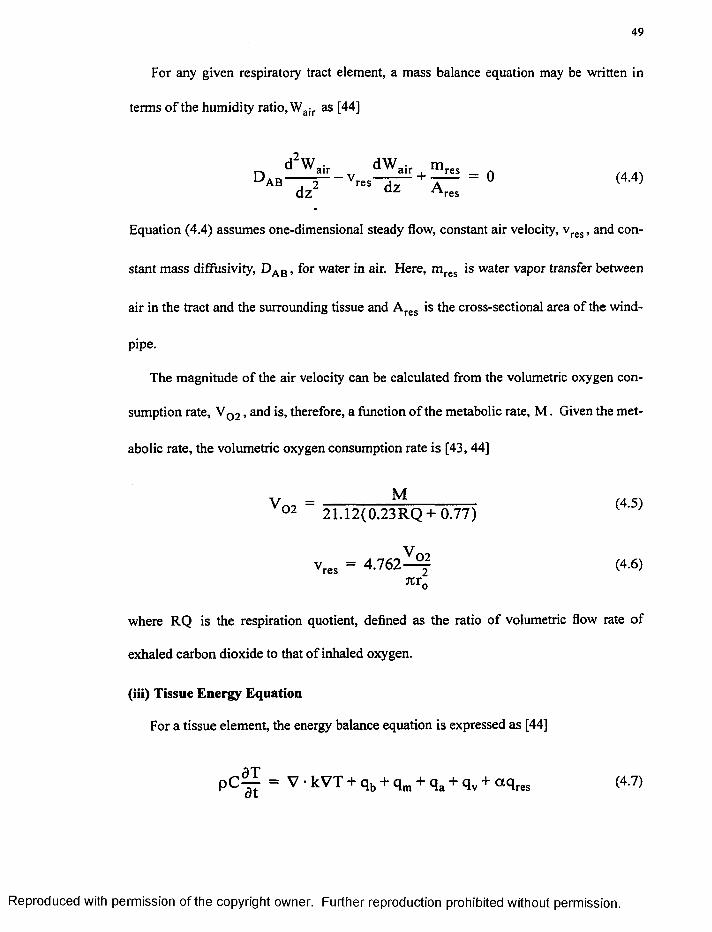
49
For any given respiratory tract element, a mass balance equation may be written in
terms o f the humidity ratio, Wair as [44]
d2Wair dWair mt—v air a ir , res _ a / a a \
D“ i r - ^ i r X “ 0 <4'4)
Equation (4.4) assumes one-dimensional steady flow, constant air velocity, vres, and con
stant mass diffusivity, DAB, for water in air. Here, m res is water vapor transfer between
air in the tract and the surrounding tissue and Ares is the cross-sectional area of the wind
pipe.
The magnitude of the air velocity can be calculated from the volumetric oxygen con
sumption rate, V0 2 , and is, therefore, a function of the metabolic rate, M . Given the met
abolic rate, the volumetric oxygen consumption rate is [43,44]
v _ _________M_________02 21.12(0.23RQ + 0.77)
V 0 2vres = 4 . 7 6 2 - f (4.6)K T 0
where RQ is the respiration quotient, defined as the ratio o f volumetric flow rate of
exhaled carbon dioxide to that of inhaled oxygen.
(iii) Tissue Energy Equation
For a tissue element, the energy balance equation is expressed as [44]
p C — = V • kVT + qb + qm + qa + qv + a q res (4.7)
R eproduced with perm ission o f the copyright owner. Further reproduction prohibited without perm ission.
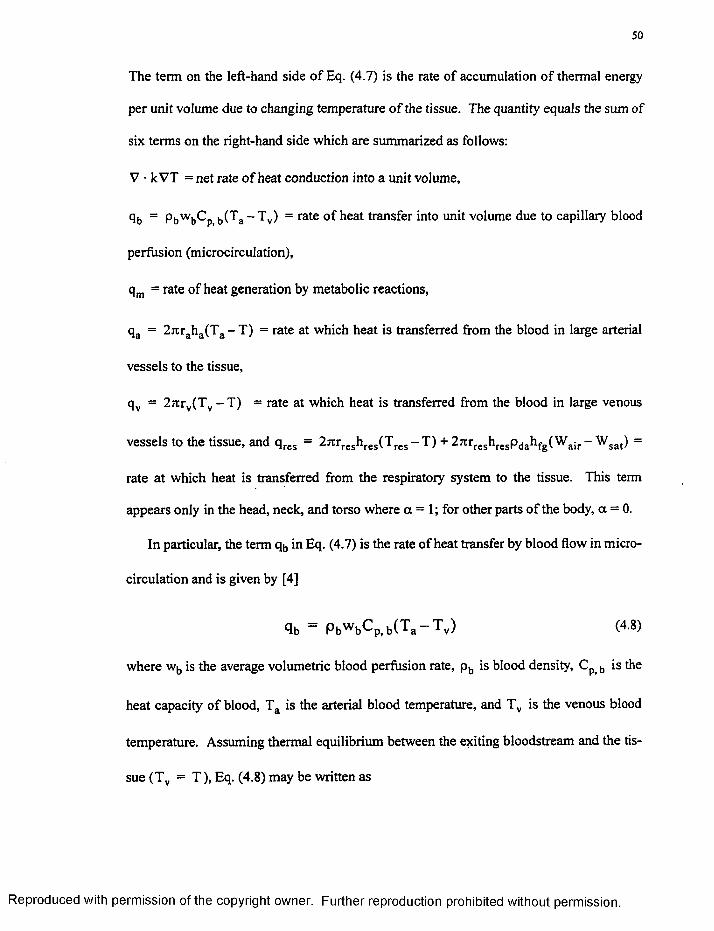
50
The term on the left-hand side o f Eq. (4.7) is the rate of accumulation o f thermal energy
per unit volume due to changing temperature o f the tissue. The quantity equals the sum of
six terms on the right-hand side which are summarized as follows:
V • kVT = net rate o f heat conduction into a unit volume,
qb = pbwt,Cp b(Ta - T v) = rate o f heat transfer into unit volume due to capillary blood
perfusion (microcirculation),
qm = rate of heat generation by metabolic reactions,
qa = 2jrraha(Ta - T ) = rate at which heat is transferred from the blood in large arterial
vessels to the tissue,
qv = 2 :trv(T v- T ) = rate at which heat is transferred from the blood in large venous
vessels to the tissue, and q res = 2jtrreshres(Tres- T ) + 2 jtrreshrespdah fg(W air- Wsat) =
rate at which heat is transferred from the respiratory system to the tissue. This term
appears only in the head, neck, and torso where a = 1; for other parts o f the body, a = 0.
In particular, the term qb in Eq. (4.7) is the rate of heat transfer by blood flow in micro
circulation and is given by [4]
qb = Pbw bc P,b(Ta - Tv) (4-8)
where wb is the average volumetric blood perfusion rate, pb is blood density, Cp< b is the
heat capacity o f blood, Ta is the arterial blood temperature, and T v is the venous blood
temperature. Assuming thermal equilibrium between the exiting bloodstream and the tis
sue (T v = T ), Eq. (4.8) may be written as
R eproduced with perm ission of the copyright owner. Further reproduction prohibited without perm ission.
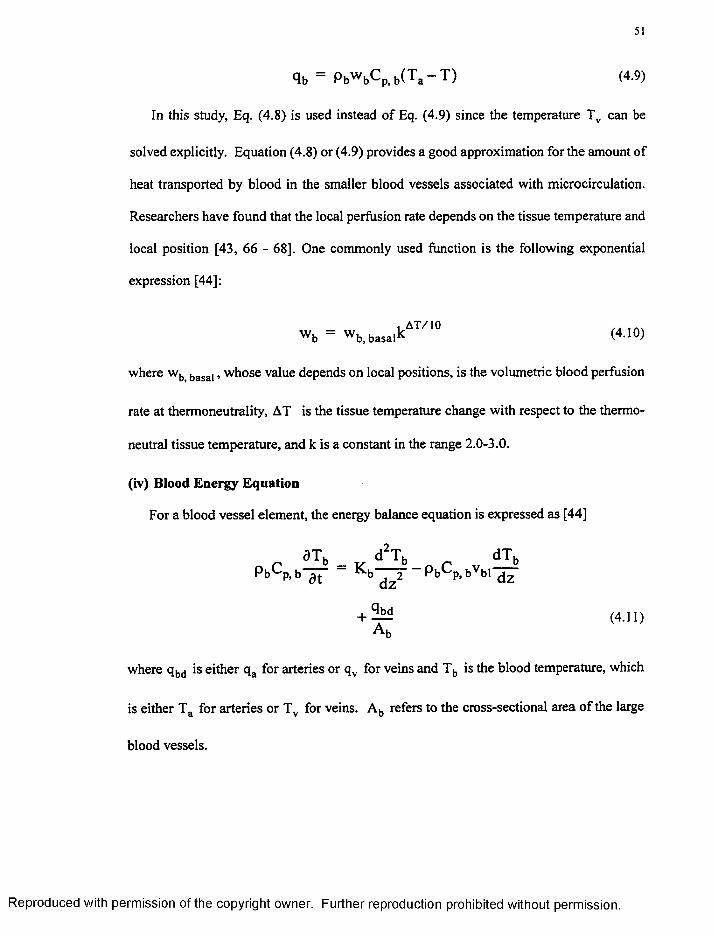
51
qb = Pbw b C p>b( T a - T ) (4.9)
In this study, Eq. (4.8) is used instead o f Eq. (4.9) since the temperature Tv can be
solved explicitly. Equation (4.8) or (4.9) provides a good approximation for the amount of
heat transported by blood in the smaller blood vessels associated with microcirculation.
Researchers have found that the local perfusion rate depends on the tissue temperature and
local position [43, 66 - 68]. One commonly used function is the following exponential
expression [44]:
where wb basal, whose value depends on local positions, is the volumetric blood perfusion
rate at thermoneutrality, AT is the tissue temperature change with respect to the thermo
neutral tissue temperature, and k is a constant in the range 2.0-3.0.
(iv) Blood Energy Equation
For a blood vessel element, the energy balance equation is expressed as [44]
where qbd is either qa for arteries or qv for veins and T b is the blood temperature, which
is either Ta for arteries or Tv for veins. Ab refers to the cross-sectional area o f the large
blood vessels.
w b = w b>basalkA T /10 (4.10)
(4.11)
R eproduced with perm ission of the copyright owner. Further reproduction prohibited without perm ission.
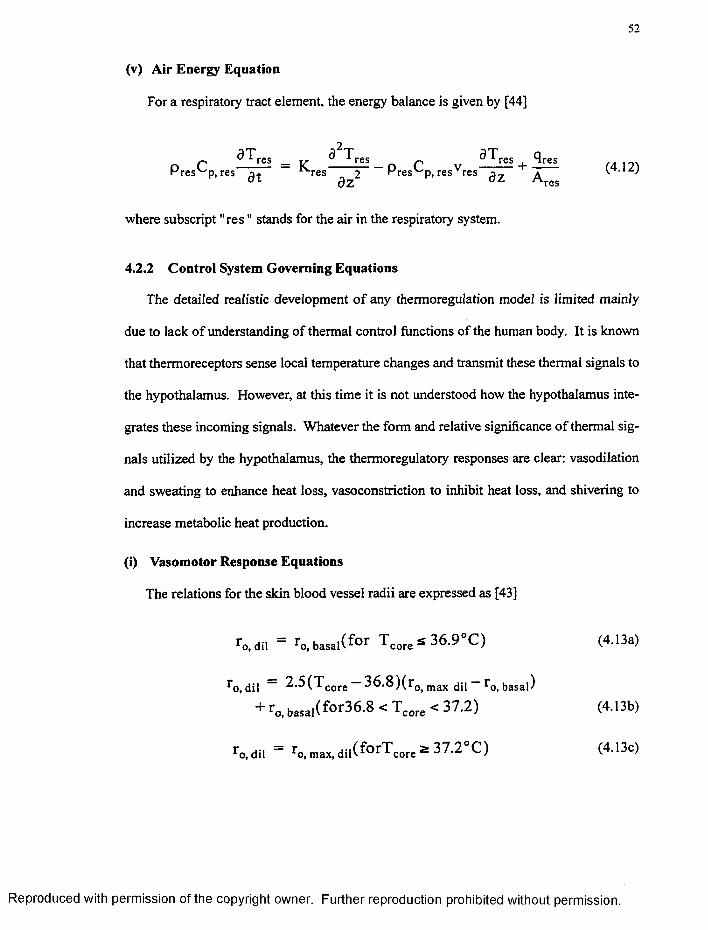
52
(v) Air Energy Equation
For a respiratory tract element, the energy balance is given by [44]
dTre. d2T dl" qresy-i res__ | r res _ p res . ” resP res^ p , res “ ^ r e s 2 Pres'-'p, resv res n7_ T
01 qz ^-res
where subscript " re s " stands for the air in the respiratory system.
4.2.2 Control System Governing Equations
The detailed realistic development o f any thermoregulation model is limited mainly
due to lack o f understanding of thermal control functions of the human body. It is known
that thermoreceptors sense local temperature changes and transmit these thermal signals to
the hypothalamus. However, at this time it is not understood how the hypothalamus inte
grates these incoming signals. Whatever the form and relative significance o f thermal sig
nals utilized by the hypothalamus, the thermoregulatory responses are clear: vasodilation
and sweating to enhance heat loss, vasoconstriction to inhibit heat loss, and shivering to
increase metabolic heat production.
(i) Vasomotor Response Equations
The relations for the skin blood vessel radii are expressed as [43]
ro, dil = ro,basal(f o r T COre * 3 6 .9 °C ) (4.13a)
*"o,dil — ^•^('^'core — 3 6 .8 ) ( r 0] max dil ~ ^o, basal)+ ro,basai(for36.8 < Tcore < 37.2) (4.13b)
r o, dil = r0itnaX)dil(fo rT corea37.2°C) (4.13c)
R eproduced with perm ission of the copyright owner. Further reproduction prohibited without perm ission.
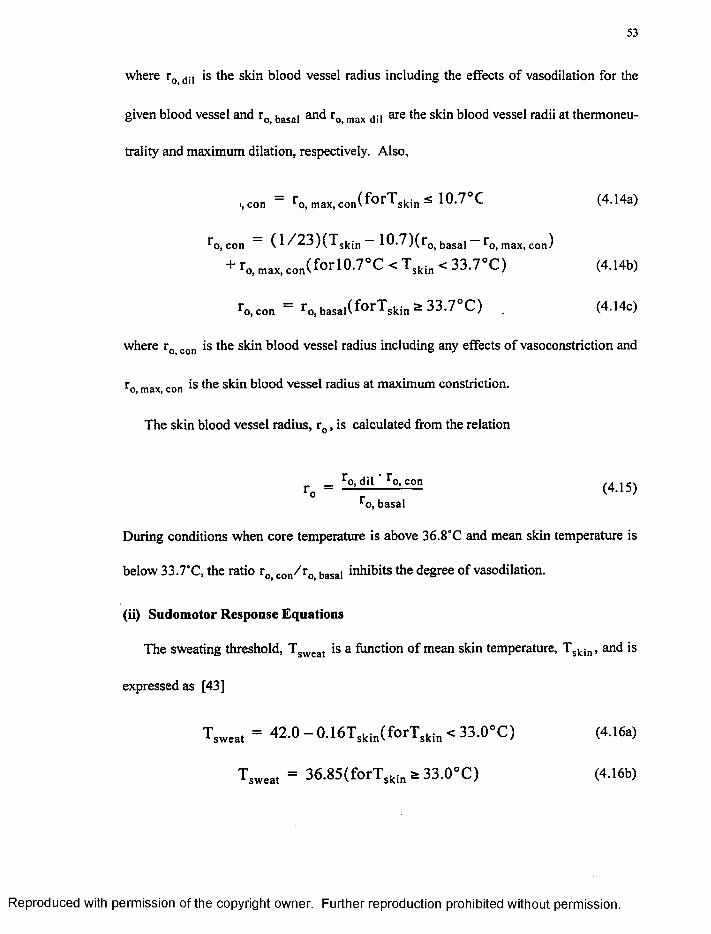
53
where r0> dll is the skin blood vessel radius including the effects of vasodilation for the
given blood vessel and r0 basal and r0 max dj| are the skin blood vessel radii at thermoneu
trality and maximum dilation, respectively. Also,
s con = ro,max,con(f o r T skinsS 10-7 °C (4.14a)
*"o, con ( ̂ /^ ^ -^ )("^ 'sk in 1 0 . 7 ) ( r o> basal ^o, max, co n )
+ ro,max,con(forl0.7°C < Tskin < 33.7°C) (4.14b)
r o , c o n = r0ibasai(forTskins33 .7°C ) . (4.14c)
where r0 con is the skin blood vessel radius including any effects o f vasoconstriction and
r0 max con is the skin blood vessel radius at maximum constriction.
The skin blood vessel radius, r0 , is calculated from the relation
= r°-diL' r °-con (4.15)‘ o, basal
During conditions when core temperature is above 36.8°C and mean skin temperature is
below 33.7'C, the ratio r0> con/ r 0 basal inhibits the degree of vasodilation.
(ii) Sudomotor Response Equations
The sweating threshold, T sweat is a function of mean skin temperature, Tskin, and is
expressed as [43]
= 4 2 .0 -0 .1 6 T sk,„(forTski„< 3 3 .0 “C) (4.16a)
Tswea, = 36.85(forTskI„ a 33.0”C) (4.16b)
R eproduced with perm ission of the copyright owner. Further reproduction prohibited without perm ission.
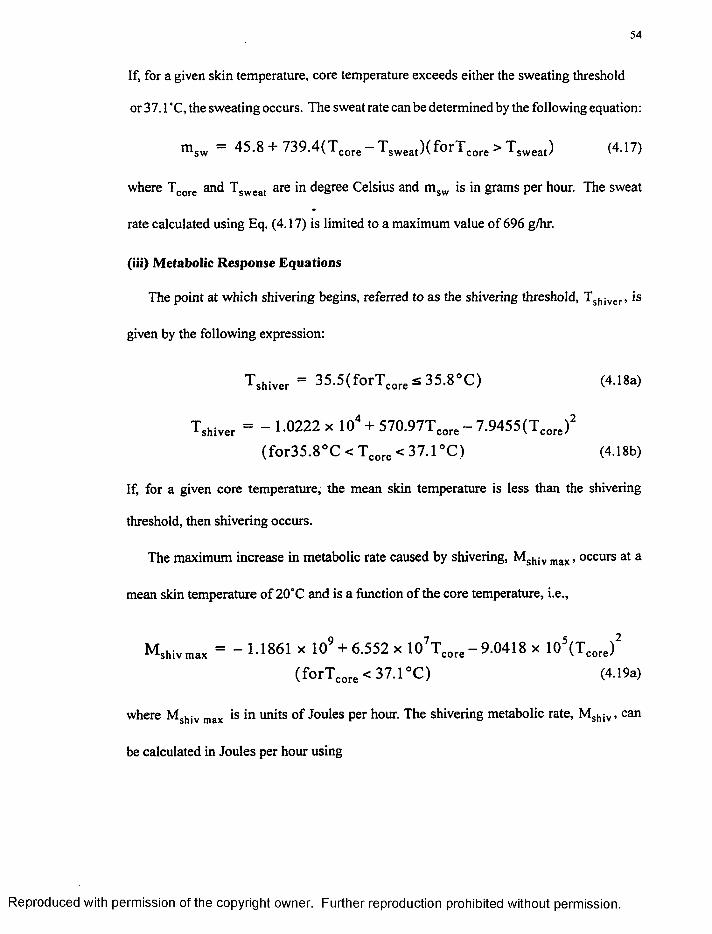
54
If, for a given skin temperature, core temperature exceeds either the sweating threshold
or 37.1“C, the sweating occurs. The sweat rate can be determined by the following equation:
msw = 45.8 + 739.4(Tcore - Tsweat)(forTcore > Tsweat) (4.17)
where Tcore and Tsweat are in degree Celsius and msw is in grams per hour. The sweat
rate calculated using Eq. (4.17) is limited to a maximum value of 696 g/hr.
(iii) Metabolic Response Equations
The point at which shivering begins, referred to as the shivering threshold, Tshiver, is
given by the following expression:
T shiver = 35.5(forTcore s 35.8°C) (4.18a)
Tshiver = - 1.0222 x 10⁴ + 570.97Tcore-7 .9455(T core)2(for35.8°C < Tcore < 37.1 °C) (4.18b)
If, for a given core temperature, the mean skin temperature is less than the shivering
threshold, then shivering occurs.
The maximum increase in metabolic rate caused by shivering, Mshiv max, occurs at a
mean skin temperature of 20°C and is a function o f the core temperature, i.e.,
Mshiv max = ~ 1-1861 * 109 + 6.552 x 10⁷Tcore-9 .0 4 I8 x 10S(Teore)2(forTcore < 37.1°C) (4.19a)
where Mshiv max is in units of Joules per hour. The shivering metabolic rate, Mshiv, can
be calculated in Joules per hour using
R eproduced with perm ission of the copyright owner. Further reproduction prohibited without perm ission.
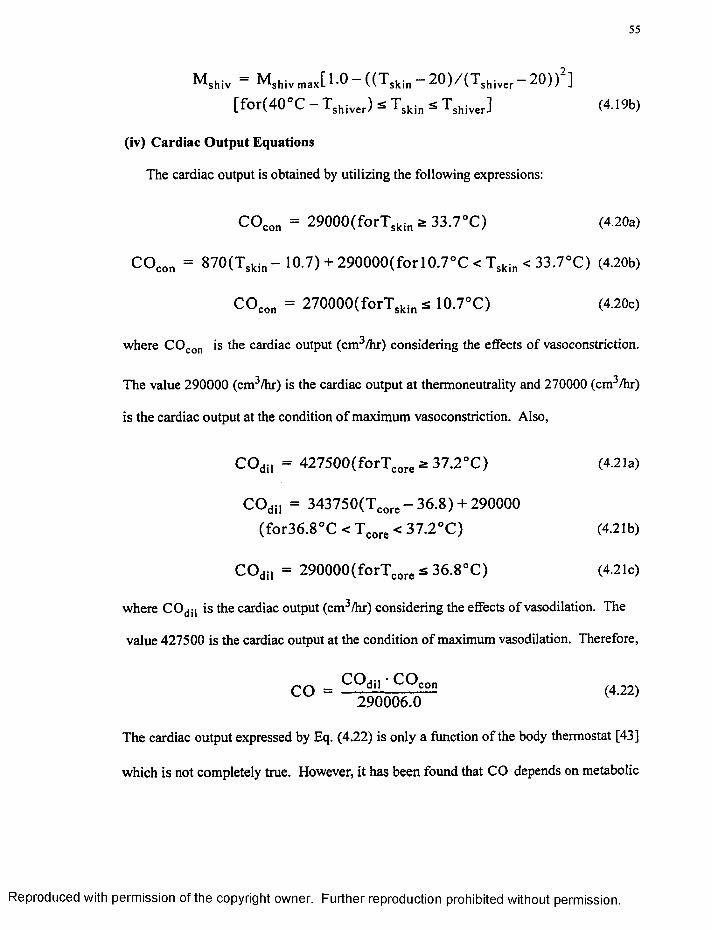
55
Mshiv = M shivm, * [ 1 . 0 - ( ( T ski„ - 2 0 ) / ( T shiv„ - 2 0 ) ) 2]
[for(40°C - Tshjver) s Tskin <; Tshiver] (4.19b)
(iv) Cardiac Output Equations
The cardiac output is obtained by utilizing the following expressions:
COcon = 29000(forTskin s 33.7°C) (4.20a)
COcon = 870(Tskin - 10.7) + 290000(forl0.7°C < Tskjn < 33.7°C) (4.20b)
COcon = 270000(forTskin s 10.7°C) (4.20c)
where COcon is the cardiac output (cm3/hr) considering the effects o f vasoconstriction.
The value 290000 (cm3/hr) is the cardiac output at thermoneutrality and 270000 (cm3/hr)
is the cardiac output at the condition o f maximum vasoconstriction. Also,
COdil = 427500(forTcore a 37.2°C) (4.21a)
COdil = 343750(Tcore- 36.8)+ 290000 (for36.8°C < T core < 37.2°C) (4.21b)
COdil = 290000(forTcore =£ 36.8°C) (4.21c)
where COdil is the cardiac output (cm3/hr) considering the effects of vasodilation. The
value 427500 is the cardiac output at the condition o f maximum vasodilation. Therefore,
CO dil • CO conC O = ----- —-------- — (4.22)
290006.0
The cardiac output expressed by Eq. (4.22) is only a function o f the body thermostat [43]
which is not completely true. However, it has been found that CO depends on metabolic
R eproduced with perm ission of the copyright owner. Further reproduction prohibited without perm ission.
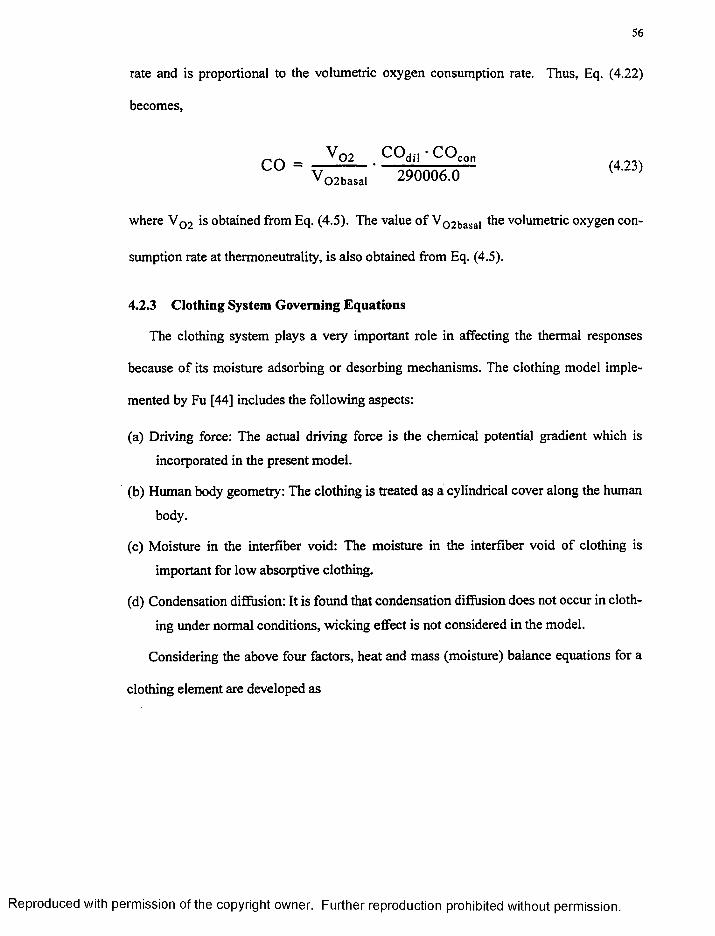
56
rate and is proportional to the volumetric oxygen consumption rate. Thus, Eq. (4.22)
becomes,
V 0 2 C O dn • C O conCO = -----—________ £22 (4 23)V 02basal 290006.0 ( ' }
where V02 is obtained from Eq. (4.5). The value o f V02basai the volumetric oxygen con
sumption rate at thermoneutrality, is also obtained from Eq. (4.5).
4.2.3 Clothing System Governing Equations
The clothing system plays a very important role in affecting the thermal responses
because o f its moisture adsorbing or desorbing mechanisms. The clothing model imple
mented by Fu [44] includes the following aspects:
(a) Driving force: The actual driving force is the chemical potential gradient which is
incorporated in the present model.
(b) Human body geometry: The clothing is treated as a cylindrical cover along the human
body.
(c) Moisture in the interfiber void: The moisture in the interfiber void o f clothing is
important for low absorptive clothing.
(d) Condensation diffusion: It is found that condensation diffusion does not occur in cloth
ing under normal conditions, wicking effect is not considered in the model.
Considering the above four factors, heat and mass (moisture) balance equations for a
clothing element are developed as
R eproduced with perm ission of the copyright owner. Further reproduction prohibited without perm ission.
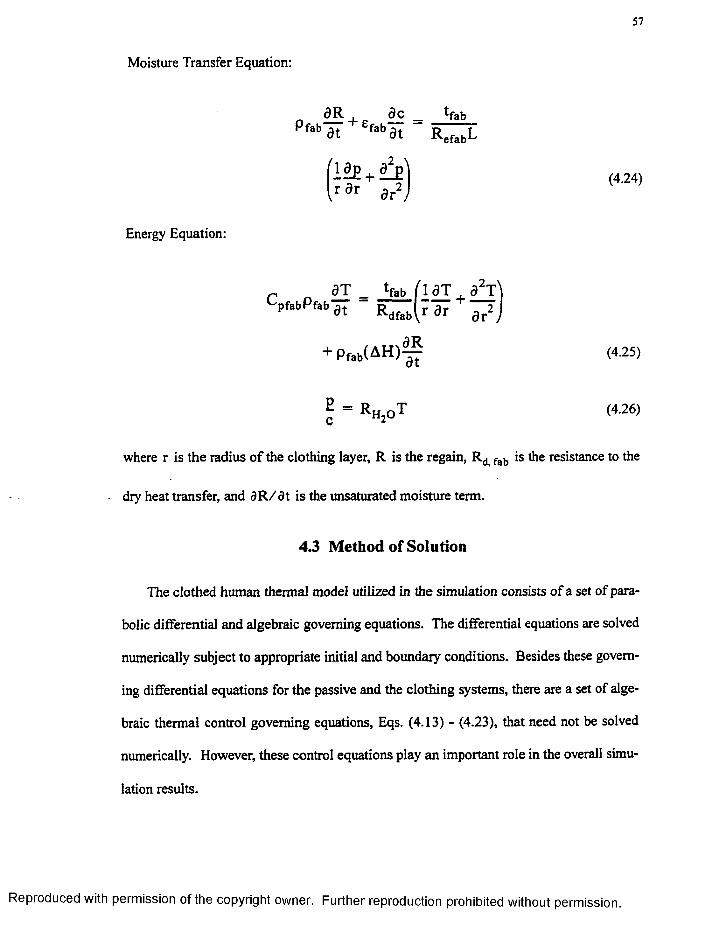
57
Moisture Transfer Equation:
d R d c _ tfabPfab"aT e fab’a7 ”a t Ia° d t R efabL
+ ,4.24,r a r S r2 J
Energy Equation:
d T _ t fab ( i d T a
S f a b P f a b d t R . . . r d r a2l l
dfabV1 OI ar2 J
+ p fab( A H ) ^ (4.25)
2 = R Hz0T (4.26)
where r is the radius o f the clothing layer, R is the regain, fab is the resistance to the
dry heat transfer, and d R /d t is the unsaturated moisture term.
4.3 Method of Solution
The clothed human thermal model utilized in the simulation consists o f a set of para
bolic differential and algebraic governing equations. The differential equations are solved
numerically subject to appropriate initial and boundary conditions. Besides these govern
ing differential equations for the passive and the clothing systems, there are a set of alge
braic thermal control governing equations, Eqs. (4.13) - (4.23), that need not be solved
numerically. However, these control equations play an important role in the overall simu
lation results.
R eproduced with perm ission of the copyright owner. Further reproduction prohibited without perm ission.
58
4.3.1 Numerical Solution Method for the Passive System
In the past, most o f the models have been developed based on either a lumped parame
ter approach or finite difference techniques. In this study, the finite element method, as
described by Segerlind [69], is used to develop a solution procedure for solving the pas
sive system governing Eqs. (4.1) - (4.12). There are two main advantages for choosing the
finite element approach. First, it is easier to develop a general solution procedure for a
large problem like this. Second, finite element techniques are well suited for irregularly
shaped objects like human body. Although cylinders are used to represent the individual
body parts, it may become necessary at some later time to include body parts such as fin
gers and toes. It will be much easier at that time to modify a finite element model.
The solution domain for the passive system is discretized into a number o f small ele
ments. Each element represents a tissue section, blood vessel, respiratory tract, or portion
o f an internal organ. After the element mesh is generated, the passive system thermal gov
erning equations along with the clothing thermal model and the environmental conditions
are integrated for each element in terms o f its parameters and unknown variables, yielding
a system of simultaneous equations which can then be solved for the unknown variables of
interest.
The shape functions are derived for each different element shape [43]. According to
Segerlind [69], the solution o f time-dependent field problems using quadratic shape func
tions is often accompanied by spatial oscillations that violate the physical reality of the
problem. The difficulty arises because the quadratic elements do not satisfy the sign crite
ria, such as positive diagonal and negative off-diagonal rule for the stiffness matrix.
Therefore, the quadratic shape functions are not used to solve time-dependent field prob
R eproduced with perm ission of the copyright owner. Further reproduction prohibited without perm ission.
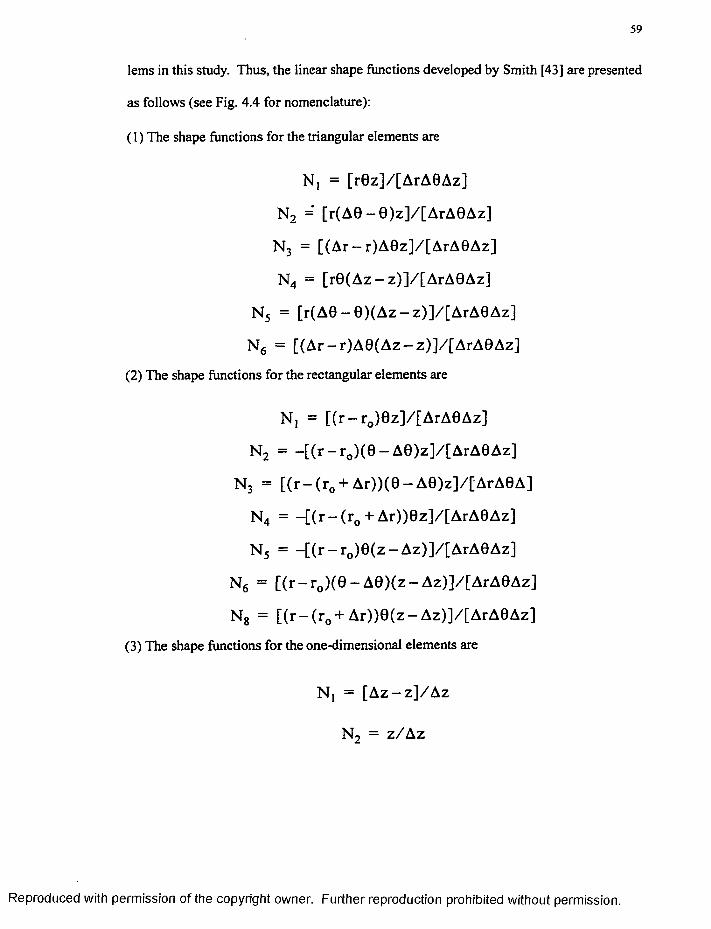
59
lems in this study. Thus, the linear shape functions developed by Smith [43] are presented
as follows (see Fig. 4.4 for nomenclature):
(1) The shape functions for the triangular elements are
N, = [r0z]/[A rA 0A z]
N 2 = [r(A0 -0 )z ] / [A rA 0 A z ]
N 3 = [ (A r-r )A 0 z]/[A rA 0 A z]
N4 = [ r0 (A z -z )] / [A rA 0 A z ]
N 5 = [r(A0 —0 )(A z -z ) ] / [A rA 0 A z ]
N 6 = [ (A r- r )A 0 (A z -z ) ] / [A rA 0 A z ]
(2) The shape functions for the rectangular elements are
N, = [ ( r - r o)0z]/[A rA 0A z]
N 2 = - [ ( r - r o) (0 -A 0 )z ] / [A rA 0 A z ]
N 3 = [ ( r - ( r 0 + A r)) (0 -A 0 )z ] /[A rA 0 A ]
N 4 = - [ ( r - ( r 0 + Ar))0z]/[A rA 0A z]
N 5 = - [ ( r - r o)0 (z -A z )] / [A rA 0 A z ]
N6 = [ ( r - r o)(0 - A 0 ) ( z - Az)]/[ArA0Az]
N 8 = [ ( r - ( r 0 + A r) )0 (z -A z ) ] / [A rA 0 A z ]
(3) The shape functions for the one-dimensional elements are
Nj = [ A z - z ] / A z
N2 = z /A z
R eproduced with perm ission o f the copyright owner. Further reproduction prohibited without perm ission.
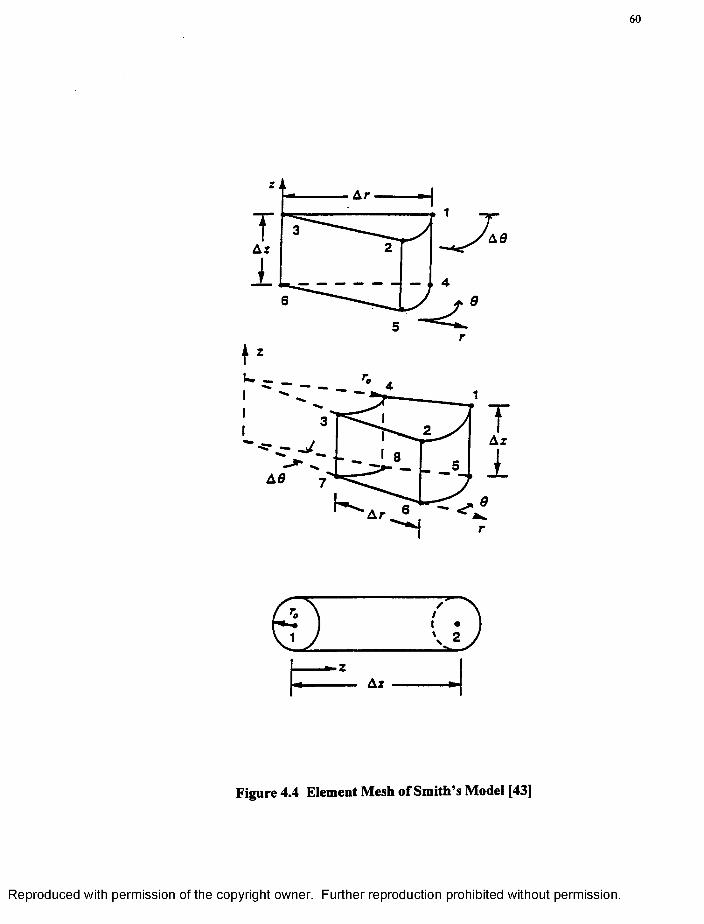
60
TA z
i
rz
UI
Az
AS
Ar
zAz
Figure 4.4 Element Mesh of Smith’s Model [43]
R eproduced with perm ission of the copyright owner. Further reproduction prohibited without perm ission.
61
The Galerkin's method of weighted residuals [69] is a commonly used method of dis
cretizing governing equations which have first order derivatives. In this study, Galerkin's
residual integral on the differential equations is evaluated with respect to the spatial coor
dinate^) for each o f the elements. The shape functions are used as weighting functions in
the integral. In this regard, Galerkin's formulation is applied to all the passive system dif
ferential equations. Among these governing equations are the macrocirculatoiy blood
pressure governing equation, Eq. (4.2), the respiratory air humidity ratio governing equa
tion, Eq. (4.4), tissue energy governing equation, Eq. (4.7), the macrocirculatory blood
energy governing equation, Eq. (4.11), and the respiratory air energy governing equation,
Eq. (4.12). The details of the Galerkin's formulation and the implementation o f boundary
conditions are described by Smith [43], Fu [44], and Segerlind [69]. The convective trans
fer coefficients are determined using the appropriate empirical relationships before solving
the governing equations [43,44].
The assembly o f the resulting Galerkin's formulations are used to solve for the thermal
responses o f the passive system. Assembling these element equations by the direct stiff
ness method [69], a system o f N linear first order differential equations in terms o f N
unknown temperature and their rates o f change is expressed as
[C ][T ']T + [K ][T ]T = [F]t (4.27)
Twhere [C] is the capacitance matrix, [K ] is the stiffness matrix, [T] is the temperature
T*vector, and [F] is the forcing vector. By applying the central difference method [69] to
Eq. (4.27), the following equation is obtained [43]:
R eproduced with perm ission of the copyright owner. Further reproduction prohibited without perm ission.
62
([C] + y[K])[T],T. 4t = ( [C ] - ^ [K ] ) [ T f
+ y ( [ F f + [F f* 41) (4.28)
Equation (4.28) can be rewritten in the simplified form as
[A][T]tT, 4t = [P ][T f ■+[F«] (4.29)
where At is the time step size. Equation (4.29) is a system of linear simultaneous equa
tions which is solved by the computer for the nodal temperatures at time t + A t.
4.3.2 Numerical Solution Method for the Clothing System
The Clothing system is represented as several cylindrical clothing layers covering the
cylindrical body parts. The air layers in the clothing system can be treated as insulation
with no thermal capacitance and the following lumped equations are treated as the thermal
governing equations for a small air layer element in the clothing system [44]:
where Qd and Qe are dry and evaporative heat transfer respectively, A is area, T is tem
perature, P is moisture vapor pressure, Rd is thermal resistance o f an air layer and Re is
evaporative resistance o f an air layer. Subscripts i and i + 1 denote two clothing layers
surrounding air layers. Combining Eqs. (4.30) and (4.31) for the air layer elements and
Eqs. (4.24) - (4.26) for the clothing layer elements, the complete thermal model for the
(4.30)
(4.31)
R eproduced with perm ission of the copyright owner. Further reproduction prohibited without perm ission.
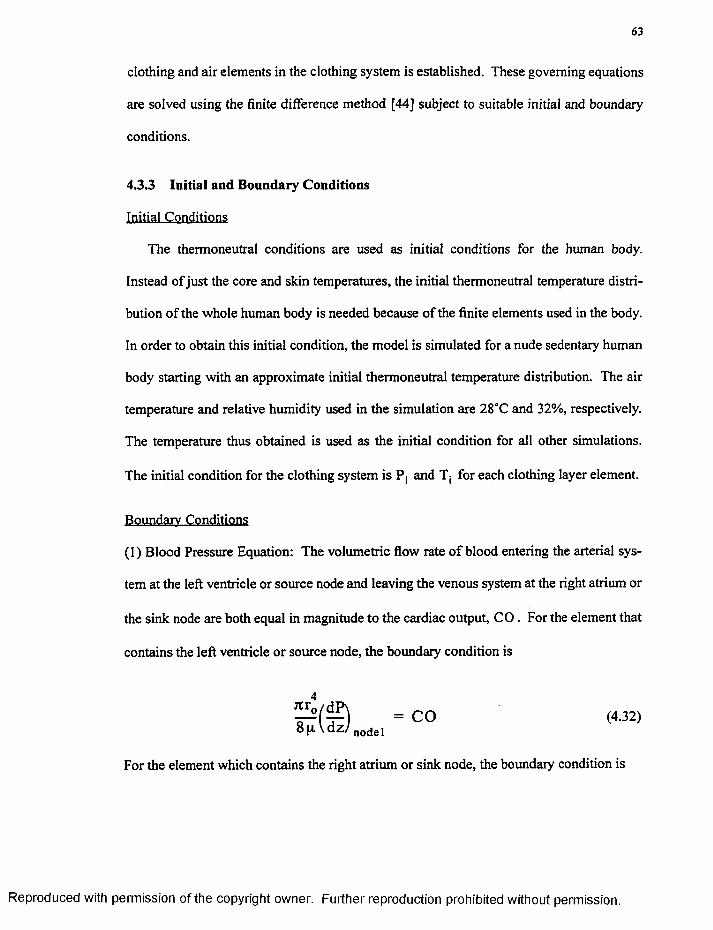
63
clothing and air elements in the clothing system is established. These governing equations
conditions.
4.3.3 Initial and Boundary Conditions
Initial Conditions
The thermoneutral conditions are used as initial conditions for the human body.
Instead of just the core and skin temperatures, the initial thermoneutral temperature distri
bution of the whole human body is needed because of the finite elements used in the body.
In order to obtain this initial condition, the model is simulated for a nude sedentary human
body starting with an approximate initial thermoneutral temperature distribution. The air
temperature and relative humidity used in the simulation are 28°C and 32%, respectively.
The temperature thus obtained is used as the initial condition for all other simulations.
The initial condition for the clothing system is Pj and Tj for each clothing layer element.
Boundary Conditions
(1) Blood Pressure Equation: The volumetric flow rate o f blood entering the arterial sys
tem at the left ventricle or source node and leaving the venous system at the right atrium or
the sink node are both equal in magnitude to the cardiac output, C O . For the element that
contains the left ventricle or source node, the boundary condition is
4
For the element which contains the right atrium or sink node, the boundary condition is
are solved using the finite difference method [44] subject to suitable initial and boundary
nodel(4.32)
R eproduced with perm ission o f the copyright owner. Further reproduction prohibited without perm ission.
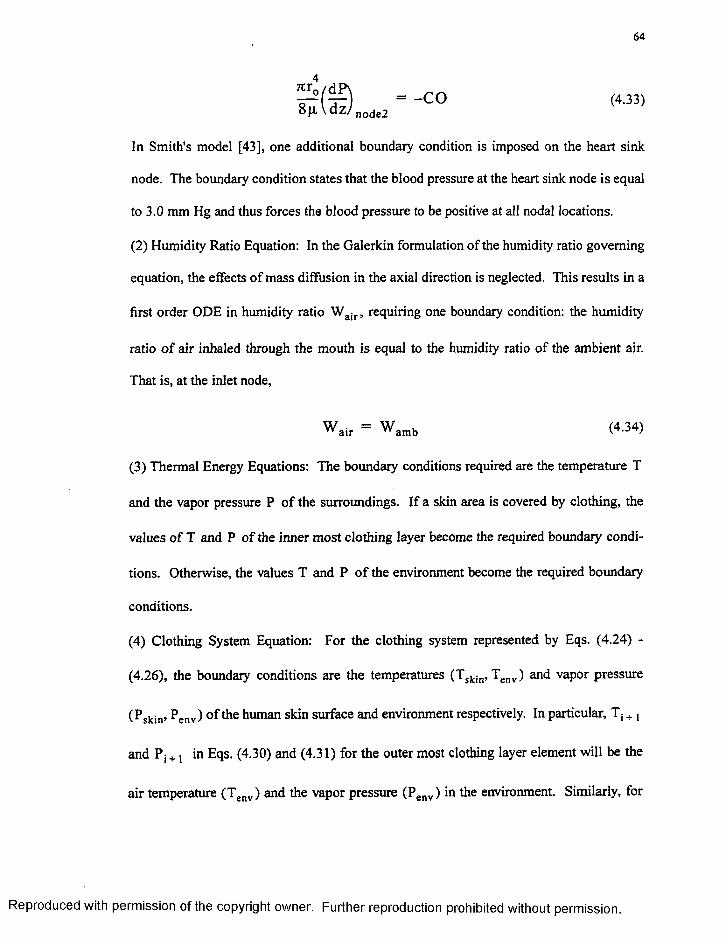
64
4
node2(4.33)
In Smith's model [43], one additional boundary condition is imposed on the heart sink
node. The boundary condition states that the blood pressure at the heart sink node is equal
to 3.0 mm Hg and thus forces the blood pressure to be positive at all nodal locations.
(2) Humidity Ratio Equation: In the Galerkin formulation of the humidity ratio governing
equation, the effects o f mass diffusion in the axial direction is neglected. This results in a
first order ODE in humidity ratio Wajr, requiring one boundary condition: the humidity
ratio o f air inhaled through the mouth is equal to the humidity ratio of the ambient air.
That is, at the inlet node,
(3) Thermal Energy Equations: The boundary conditions required are the temperature T
and the vapor pressure P o f the surroundings. If a skin area is covered by clothing, the
values o f T and P o f the inner most clothing layer become the required boundary condi
tions. Otherwise, the values T and P o f the environment become the required boundary
conditions.
(4) Clothing System Equation: For the clothing system represented by Eqs. (4.24) -
(4.26), the boundary conditions are the temperatures (Tskin, Tenv) and vapor pressure
(P skin, Penv) o f the human skin surface and environment respectively. In particular, Tj + t
and P i + , in Eqs. (4.30) and (4.31) for the outer most clothing layer element will be the
air temperature (T env) and the vapor pressure (Penv) in the environment. Similarly, for
W • = W uYV air TT amb (4.34)
R eproduced with perm ission of the copyright owner. Further reproduction prohibited without perm ission.
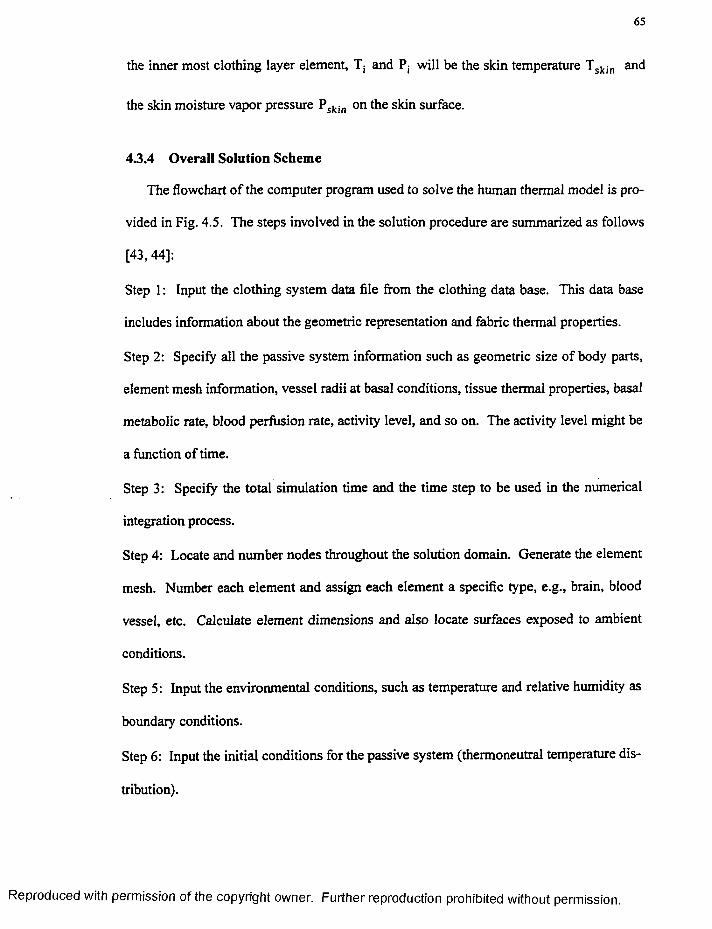
65
the inner most clothing layer element, T; and P; will be the skin temperature Tskin and
the skin moisture vapor pressure Pskin on the skin surface.
4.3.4 Overall Solution Scheme
The flowchart o f the computer program used to solve the human thermal model is pro
vided in Fig. 4.5. The steps involved in the solution procedure are summarized as follows
[43, 44]:
Step 1: Input the clothing system data file from the clothing data base. This data base
includes information about the geometric representation and fabric thermal properties.
Step 2: Specify all the passive system information such as geometric size of body parts,
element mesh information, vessel radii at basal conditions, tissue thermal properties, basal
metabolic rate, blood perfusion rate, activity level, and so on. The activity level might be
a function o f time.
Step 3: Specify the total simulation time and the time step to be used in the numerical
integration process.
Step 4: Locate and number nodes throughout the solution domain. Generate the element
mesh. Number each element and assign each element a specific type, e.g., brain, blood
vessel, etc. Calculate element dimensions and also locate surfaces exposed to ambient
conditions.
Step 5: Input the environmental conditions, such as temperature and relative humidity as
boundary conditions.
Step 6: Input the initial conditions for the passive system (thermoneutral temperature dis
tribution).
R eproduced with perm ission o f the copyright owner. Further reproduction prohibited without perm ission.
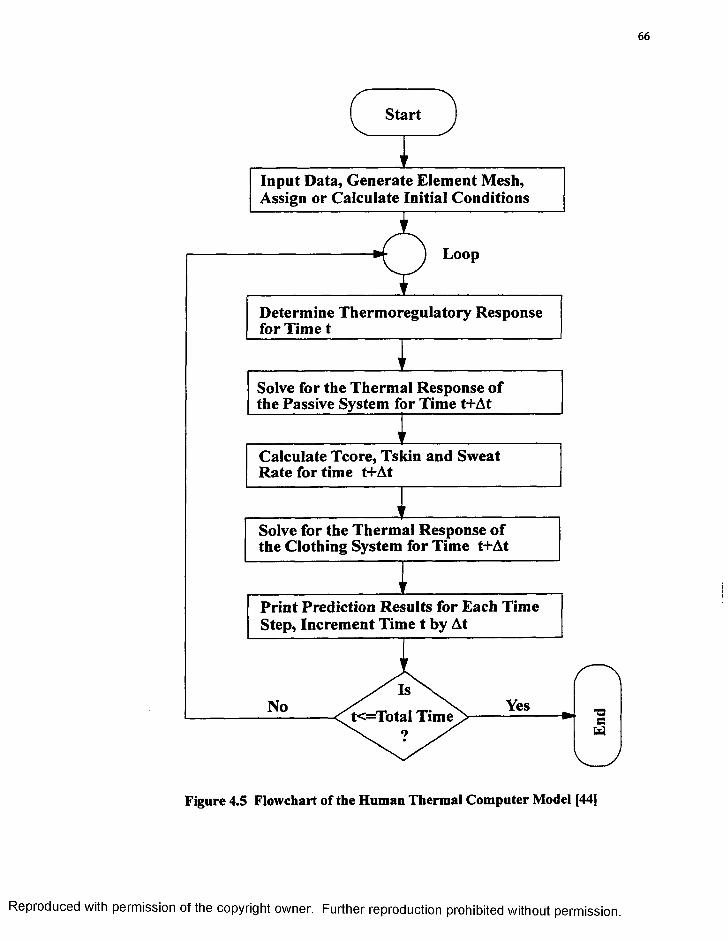
66
Start
Loop
YesNo t<=TotaI Time
Calculate Tcore, Tskin and Sweat Rate for time t+At
Solve for the Thermal Response of the Passive System for Time t+At
Determine Thermoregulatory Response for Time t
Input Data, Generate Element Mesh, Assign or Calculate Initial Conditions
Solve for the Thermal Response of the Clothing System for Time t+At
Print Prediction Results for Each Time Step, Increment Time t by At
Figure 4.5 Flowchart of the Human Thermal Computer Model [44]
R eproduced with perm ission of the copyright owner. Further reproduction prohibited without perm ission.
End
67
Step 7: Calculate the initial core and skin temperatures using the initial temperature distri
bution information o f the passive system.
Step 8: Calculate the initial sweating rate o f each skin element according to the values of
the initial core and skin temperatures obtained in the Step 7.
Step 9: Calculate the initial conditions for each clothing element and input them.
Step 10: Determine the thermoregulatory responses, such as vasomotor, shivering, etc., as
functions o f time t using the core and mean skin temperatures and the thermal control gov
erning equations.
Step 11: Solve for the thermal responses, such as temperature distribution, thermal load,
etc., o f the passive system as functions o f time.
Step 12: Calculate the core and mean skin temperature as functions o f time using the
updated temperature distribution o f the passive system obtained in Step 11.
Step 13: Calculate the sweating rate o f each skin element as a function o f time according
to the values o f the core and skin temperatures obtained in Step 12.
Step 14: Solve for the thermal responses, such as temperature, vapor pressure, regain,
thermal load, etc., o f the clothing system as a function o f time.
Step 15: Print any information o f interest, such as temperature distribution, core and mean
skin temperatures, the thermal load o f the clothed human, etc., as functions o f time.
Step 16: If time t is less than the length of the simulation time, specified in Step 3, then
return to Step 10. Otherwise, the computer simulation has ended.
R eproduced with perm ission o f the copyright owner. Further reproduction prohibited without perm ission.
68
CHAPTER V
OBJECTIVE MEASURES OF HUMAN STRESS LEVEL
The present chapter deals with the development o f objective measures o f stress level
experienced by the humans in an environment. The stress could be experienced by
humans either due to changes in thermal environment or due to cognitive or mental load
ing. In either cases, it is very important to know the quantitative measure of stress level in
order to evaluate the human comfort and performance for optimum safety in the operation
of flight management tasks. It is well established that the autonomic nervous system
(ANS) controls both thermal (body and skin temperatures, skin heat loss, etc.) and cardio
vascular (BP, HR, etc.) responses. In Sec. 5.1, a brief introduction to the concept o f ther
mal stress is provided, followed by the development of Objective Thermal Stress Index
(OTSI) in Sec. 5.2. The development o f OTSI is justified mainly due to the evidence pre
sented in a study by Hancock and Pierce [51] relating attention and vigilance to the
changes in ambient environment. They have shown that sustained attention is disturbed
by conditions sufficient to induce a change in human thermal responses. At this point of
perturbation to thermal equilibrium, resulting homeostatic action drains attentional
resources and thus reduces vigilance capability. In this regard, OTSI provides an objective
measure o f deviation from thermal equilibrium and thus quantifies the drain in attentional
resources and reduction in vigilance capability.
R e p ro d u c e d with perm ission o f the copyright owner. Further reproduction prohibited without perm ission.
69
Due to interaction between nervous system and physiological responses, a brief intro
duction is provided in Sec. 5.3 about the concept o f mental stress. It is well established
that the autonomic nervous system (ANS) controls both thermal (body and skin tempera
tures, skin heat loss, etc.) and cardiovascular (BP, HR, etc.) responses. In this regard, a
psychophysical index that links human thermal activity to the cardiovascular functioning
is developed and is discussed in Sec. 5.4. The Objective Mental Stress Index (OMSI) pro
vides a thermodynamic representation of the autonomic nervous system (ANS) function
ing.
5.1 Thermal Stress
It is established that an excessive thermal stress results in both psychological and
physiological strain on the exposed individual [8]. The amount of thermal stress that is
present in a work environment is a function o f certain environmental measures such as air
temperature, humidity, radiant heat load, and air movement. In addition, stress is a func
tion o f human thermal responses. The amount o f acclimatization to which the human has
been exposed affects the stress to which a specific individual is being subjected. The met
abolic rate and work rate are also important. In addition, the body surface area-to-weight
ratio can affect the human stress level.
Some of the other important factors include clothing, age, sex, and physical condi
tions. It has been shown that older individuals are more subject to strain resulting from
thermal stress than younger individuals. The sex is also a factor since experiments have
shown that tolerance to heat is higher among males than females. The individual's general
health and physical condition are also important factors that affect the stress that is
R eproduced with perm ission of the copyright owner. Further reproduction prohibited without perm ission.
70
imposed on an individual human. Since each person represents a different mixture of var
ious factors, there are individual variations in the ability to withstand heat stress. This
alone presents some difficulties when attempting to determine how much warmth should
be maintained in an environment to provide the optimum comfort and satisfy a given
group of occupants.
On the other hand, the physiological strain that results from thermal stress is a function
of the circulatory capacity of the individual, capacity for sweating, and tolerance to ele
vated body temperature. In addition, the exposure time is an important factor in determin
ing the strain that is felt by an individual. The human body can withstand high
temperatures for short periods of time without causing harmful effects to the health o f the
exposed individual. In order to determine the amount of thermal stress above which the
occupants in an environment should not be exposed, it is desirable to develop an Objective
Thermal Stress Index (OTSI) that combines both stressors and physiological strain to pro
vide a quantitative measure o f thermal stress.
Several attempts have been made in the past to develop such a universal thermal index
to quantify thermal stress level. Although many indices have been developed, none are
entirely satisfactory [8]. In developing criteria for a thermal stress index, it is important
that the following factors be considered:
1. The index that is developed should be quantitative and yield scalar values relating to stress and strain.
2. The index should be calculated from available data concerning the conditions that are present in the environment.
3. The index should be tested and proved applicable through use.
4. All important factors should be included in the index.
R eproduced with perm ission o f the copyright owner. Further reproduction prohibited without perm ission.
7!
5. The method should be simple to use and not lead to rigorous calculation or difficult measurements.
6. All factors should be related to physiological strain in a weighted manner.
7. The method should be applicable and feasible for determining regulatory limits or threshold limit values for exposure to heat stress.
Some of the widely used thermal stress indices are described in Sec. 1.2 and none of
these indices meet all the criteria for universal index. At best, they provide an estimate of
the relationship between thermal stress and physiological strain. The OTSI has been
developed to overcome most o f the limitations o f earlier indices. However, OTSI with its
simplified mathematical expression and based on second law of thermodynamics meets all
the above seven requirements to be considered a universal thermal stress index. Also, the
OTSI provides a direct measure o f human thermal sensations and is based on the second
law o f thermodynamics and laws o f psychophysics [70] as applied to the human thermal
system.
5.2 Development o f Objective Thermal Stress Index (OTSI)
The most important environmental variables that are responsible for maintaining the
condition o f thermal comfort are:
1. Thermal resistance o f the clothing (Icl)
2. Air temperature (T air)
3. Relative humidity (R H )
4. Activity level or metabolic heat generation (M )
R eproduced with perm ission of the copyright owner. Further reproduction prohibited without perm ission.
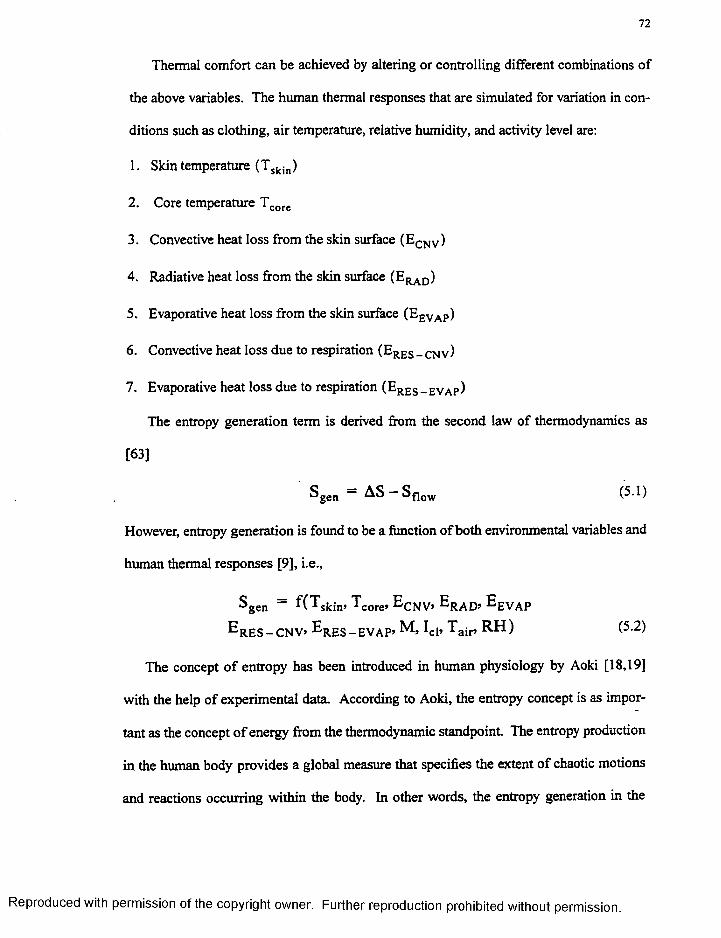
72
Thermal comfort can be achieved by altering or controlling different combinations of
the above variables. The human thermal responses that are simulated for variation in con
ditions such as clothing, air temperature, relative humidity, and activity level are:
1. Skin temperature (T skjn)
2. Core temperature Tcore
3. Convective heat loss from the skin surface (ECNV)
4. Radiative heat loss from the skin surface (ERAD)
5. Evaporative heat loss from the skin surface (E evap )
6. Convective heat loss due to respiration (Er e s _ CNV)
7. Evaporative heat loss due to respiration (E res _ Evap)
The entropy generation term is derived from the second law of thermodynamics as
However, entropy generation is found to be a function o f both environmental variables and
human thermal responses [9], i.e.,
The concept o f entropy has been introduced in human physiology by Aoki [18,19]
with the help o f experimental data. According to Aoki, the entropy concept is as impor
tant as the concept o f energy from the thermodynamic standpoint. The entropy production
in the human body provides a global measure that specifies the extent o f chaotic motions
and reactions occurring within the body. In other words, the entropy generation in the
[63]
(5.1)
^gen ■^(' '̂skin> ^core* ^CNV» ^RAD» ^EVAP
E r e s - c n v > E r e s - e v a p > M , Ic1, Tair, R H ) (5.2)
R eproduced with perm ission of the copyright owner. Further reproduction prohibited without perm ission.
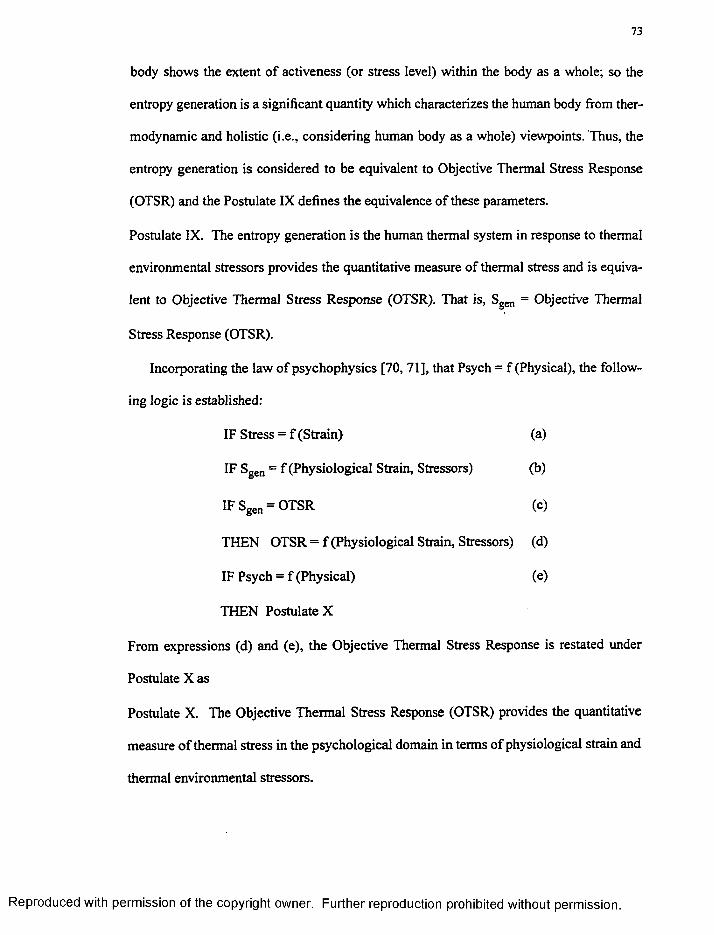
73
body shows the extent of activeness (or stress level) within the body as a whole; so the
entropy generation is a significant quantity which characterizes the human body from ther
modynamic and holistic (i.e., considering human body as a whole) viewpoints. Thus, the
entropy generation is considered to be equivalent to Objective Thermal Stress Response
(OTSR) and the Postulate IX defines the equivalence of these parameters.
Postulate IX. The entropy generation is the human thermal system in response to thermal
environmental stressors provides the quantitative measure of thermal stress and is equiva
lent to Objective Thermal Stress Response (OTSR). That is, Sgen = Objective Thermal
Stress Response (OTSR).
Incorporating the law of psychophysics [70, 71], that Psych = f (Physical), the follow
ing logic is established:
IF Stress = f (Strain) (a)
IF Sgen = f (Physiological Strain, Stressors) (b)
IF Sgen = OTSR (c)
THEN OTSR = f (Physiological Strain, Stressors) (d)
IF Psych = f (Physical) (e)
THEN Postulate X
From expressions (d) and (e), the Objective Thermal Stress Response is restated under
Postulate X as
Postulate X. The Objective Thermal Stress Response (OTSR) provides the quantitative
measure o f thermal stress in the psychological domain in terms of physiological strain and
thermal environmental stressors.
R eproduced with perm ission of the copyright owner. Further reproduction prohibited without perm ission.
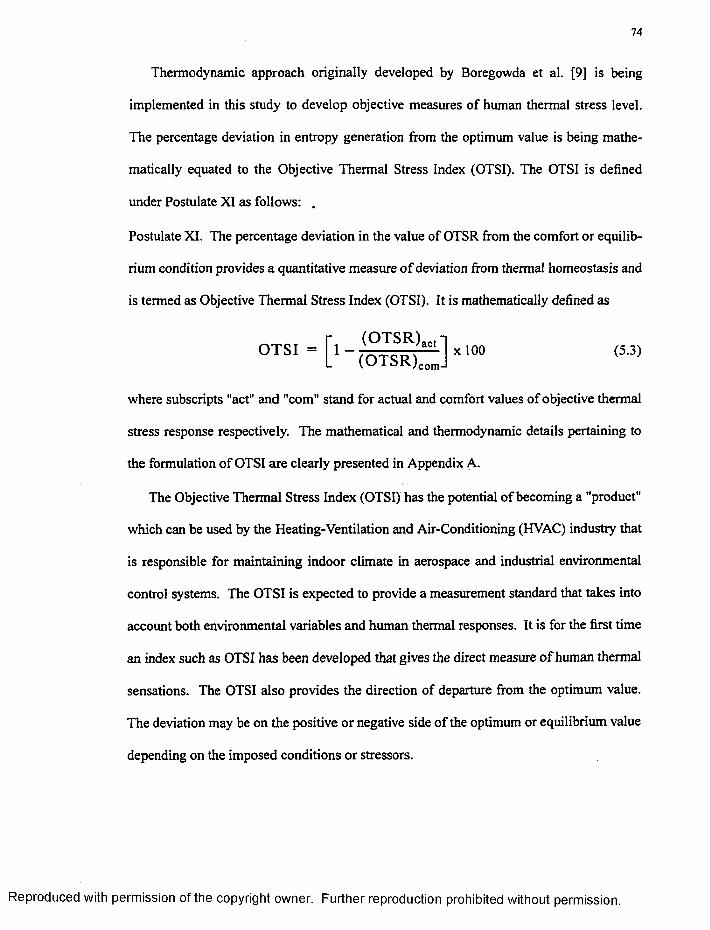
74
Thermodynamic approach originally developed by Boregowda et al. [9] is being
implemented in this study to develop objective measures of human thermal stress level.
The percentage deviation in entropy generation from the optimum value is being mathe
matically equated to the Objective Thermal Stress Index (OTSI). The OTSI is defined
under Postulate XI as follows: .
Postulate XI. The percentage deviation in the value of OTSR from the comfort or equilib
rium condition provides a quantitative measure o f deviation from thermal homeostasis and
is termed as Objective Thermal Stress Index (OTSI). It is mathematically defined as
stress response respectively. The mathematical and thermodynamic details pertaining to
the formulation o f OTSI are clearly presented in Appendix A.
The Objective Thermal Stress Index (OTSI) has the potential o f becoming a "product"
which can be used by the Heating-Ventilation and Air-Conditioning (HVAC) industry that
is responsible for maintaining indoor climate in aerospace and industrial environmental
control systems. The OTSI is expected to provide a measurement standard that takes into
account both environmental variables and human thermal responses. It is for the first time
an index such as OTSI has been developed that gives the direct measure o f human thermal
sensations. The OTSI also provides the direction of departure from the optimum value.
The deviation may be on the positive or negative side o f the optimum or equilibrium value
depending on the imposed conditions or stressors.
OTSI(OTSR)(OTSR) com
(5.3)
where subscripts "act" and "com" stand for actual and comfort values of objective thermal
R eproduced with perm ission of the copyright owner. Further reproduction prohibited without perm ission.
75
5.3 Mental Stress
Several studies have shown that any form of human-machine interaction requires some
combination o f activities such as sensory, perceptual, mental, and physical in nature. The
performance of these activities is accompanied by related psychophysiological changes in
nature. In a human-machine system, the effectiveness o f the system is dependent on the
well-being o f a human to a great extent. All kinds of stresses are bound to affect the
human capabilities and health. Thus, it is very important to have quantitative information
to analyze both physical and mental stresses. The concept of entropy using Maxwell rela
tions has been treated for the first time in human psychophysiology by Boregowda et al.
[36 - 39], Mental stresses cause a wide range of effects. As discussed by Mital et al. [6],
these could be physiological (elevated heart rates, blood pressure, etc.), performance
related (decreased output, increased errors, etc.), or behavioral (lack of attention, anxiety,
etc.). The literature survey in Sec. 1.2 establishes the fact that several investigators have
studied the effects o f mental/physical stresses and devised methods to quantify stress.
Despite all these efforts, an accurate method to quantify mental stress has not been devel
oped. However, there has been a strong need to develop a technique or methodology to
measure and monitor stress level during cognitive tasks. The present study aims at fulfill
ing this need and demonstrates the validity of the innovative technique to measure and
monitor human stress level through the development of an Objective Mental Stress Index
(OMSI).
R eproduced with perm ission o f the copyright owner. Further reproduction prohibited without perm ission.
76
5.4 Formulation of Objective Mental Stress Index (OMSI)
A thermodynamic approach has been developed to quantify the stress level based on
the physiological responses using an Objective Mental Stress Index (OMSI). The OMSI is
derived from the entropy concept and the principles o f second law of thermodynamics as
applied to a human body considered as a system. The first law of thermodynamics is con
cerned with the concept o f energy, while the second law with entropy. Entropy has been a
hazy concept whose physical meaning is difficult to comprehend. However, using the def
inition o f Maxwell relations, change in entropy can be expressed in terms of measurable
quantities like changes in pressure, volume, and temperature. One of the important ele
ments o f this study is to relate the change in entropy to human mental stress level. In qual
itative terms, entropy is defined as "measure o f disorder or chaos" in any system in the
universe. Could this concept be related to the human-machine system? I f so, how? The
answer is yes, and the change in entropy corresponds to the "measure o f disorder" which
in turn can be equated to the human stress level. This is done with the help o f Maxwell
relations of thermodynamics as applied to human psychophysiological system. It has been
shown by Boregowda et al. [36-39] that the change in entropy is expressed in terms of
physiological responses that can be measured experimentally like changes in blood pres
sure, heart rate, skin temperature, and oral body temperature. The concept of entropy and
Maxwell relations from thermodynamics are clearly explained in Appendix B. However,
for detailed treatment on entropy and second law, the reader should refer to Callen [62].
The changes in physiological variables such as blood pressure, heart rate, and skin
temperature (or oral body temperature) are mathematically related to change in entropy
which is being interpreted as Objective Mental Stress Index (OMSI). The OMSI indicates
R eproduced with perm ission of the copyright owner. Further reproduction prohibited without perm ission.
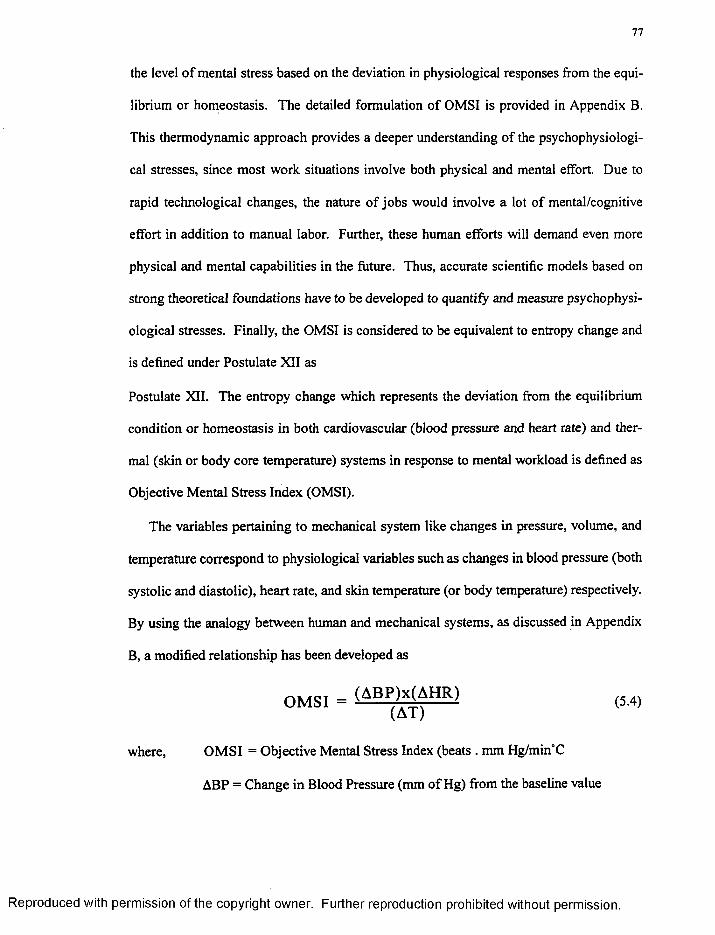
the level o f mental stress based on the deviation in physiological responses from the equi
librium or homeostasis. The detailed formulation of OMSI is provided in Appendix B.
This thermodynamic approach provides a deeper understanding o f the psychophysiologi-
cal stresses, since most work situations involve both physical and mental effort. Due to
rapid technological changes, the nature of jobs would involve a lot of mental/cognitive
effort in addition to manual labor. Further, these human efforts will demand even more
physical and mental capabilities in the future. Thus, accurate scientific models based on
strong theoretical foundations have to be developed to quantify and measure psychophysi-
ological stresses. Finally, the OMSI is considered to be equivalent to entropy change and
is defined under Postulate XII as
Postulate XII. The entropy change which represents the deviation from the equilibrium
condition or homeostasis in both cardiovascular (blood pressure and heart rate) and ther
mal (skin or body core temperature) systems in response to mental workload is defined as
Objective Mental Stress Index (OMSI).
The variables pertaining to mechanical system like changes in pressure, volume, and
temperature correspond to physiological variables such as changes in blood pressure (both
systolic and diastolic), heart rate, and skin temperature (or body temperature) respectively.
By using the analogy between human and mechanical systems, as discussed in Appendix
B, a modified relationship has been developed as
OM SI = (5.4)(AT)
where, OM SI = Objective Mental Stress Index (beats . mm Hg/min°C
ABP = Change in Blood Pressure (mm of Hg) from the baseline value
R eproduced with perm ission of the copyright owner. Further reproduction prohibited without perm ission.
78
AHR = Change in Heart Rate (bpm) from the baseline value
AT = Change in Body or Skin Temperature ('C) from the baseline value.
If the information processing or mental workload causes changes in physiological
responses, then according to Maxwell relations, change in entropy or OMSI indicates the
measure of a non-physical factor which is mental stress in terms o f physiological changes
that can be measured. In this regard, information flow is considered to be equivalent to
energy flow that impinges on the individual to cause certain physiological changes. These
measures o f physiology are combined using Maxwell relation to quantify mental stress in
the form of a single summative number.
The Literature review in Sec. 1.2 indicates that several earlier studies conducted by
investigators have been focusing on one parameter at a time as an indicator o f stress. For
example, blood pressure has been used as a good indicator o f a long term mental/life
stress. However, there have been no studies conducted to combine three different physio
logical variables to formulate a single index that gives the measure o f stress level. This is
the first time, a study like this has been under taken to quantify the mind-body interaction.
In other words, besides quantifying stress level, OMSI acts as a parameter that quantifies
the mind-body interaction from a thermodynamic viewpoint. Further, this model will pro
vide an excellent basis for future research in different areas of human factors engineering,
health care, and medicine. This approach has been validated with experimental data
(Chap. 6) and has strong potential to become a diagnostic tool in the treatment o f stress
related disorders.
R eproduced with perm ission of the copyright owner. Further reproduction prohibited without perm ission.
79
CHAPTER VI
RESULTS AND DISCUSSION
Human stress responses include both thermal and cardiovascular responses. Thermal
stress responses are simulated using a computer model [43,44]. However, cardiovascular
responses (blood pressure and heart rate) are obtained from experimental studies such as
those conducted by Boregowda et al. [36 - 39], Palsson et al. [40] and Mital et al.[6]. First,
the computer model for simulating human thermal behavior is validated by comparing the
model predictions with one o f the independent sources such as experimental data. The
experimental validation o f the model is presented in Sec. 6.1. The effects o f varying envi
ronmental conditions, physical activity, and clothing on mean skin temperature, blood ves
sel radii, and entropy generation are examined in Sec. 6.2. In Sec. 6.3, analysis of human
thermal behavior is performed using a hybrid technique. This technique is based on the
theory o f experimental design [45,46] to observe the interaction among physical variables
such as air temperature, relative humdity, physical activity, and clothing which affect the
overall human thermal comfort. In this regard, a natural variable, entropy generation
(Sgc). which is a function of all human thermal stress responses, environmental condi
tions, physical activity, and clothing, is implemented. This is a novel approach and it pro
vides a basis to design and conduct effective human experiments. In Sec. 6.4, thermal
stress level monitoring technique is demonstrated with the help o f an Objective Thermal
Stress Index (OTSI). The OTSI is validated through a series o f computer simulations
R eproduced with perm ission of the copyright owner. Further reproduction prohibited without perm ission.
80
condcuted for both comfortable and extreme environmental conditions. However, a rela
tionship between thermal and cardiovascular activity is established in Sec. 6.5 through
demonstration o f mental stress level monitoring technique using an Objective Mental
Stress Index (OMSI).
6.1 Experimental Validation of the Human Thermal Model
The accuracy o f the human thermal model is established through a validation process.
This process involves comparison of model predictions with those obtained from an inde
pendent experimental data source. Besides establishing the accuracy o f the model, the
validation process helps in defining the range o f conditions for which the model is applica
ble. The model is validated for variation o f the core and skin temperatures, and latent skin
heat loss by comparing with the experimental data of Hardy [72]. Hardy measured and
recorded at five minute intervals the ambient temperature, vapor pressure, oxygen con
sumption rate, weight loss, tympanic temperature, rectal temperature, and local skin tem
peratures at ten locations for sedentary male subjects exposed to a variety of
environmental conditions. Prior to each test period, the subjects, dressed only in shorts,
sat quietly in a room at 18°C for one hour, after which time the subjects were quickly
transferred to the test chamber. During each test period, the subjects were seated quietly
on chairs mounted on scales used to measure weight loss. This weight loss was used to
calculate the rate o f latent skin heat loss from the skin surface. Air movement about the
subject was almost entirely due to natural convection and the subject’s own body tempera
ture. Thermocouples used to measure local skin temperatures were located as follows:
forehead, left pectoral region, right scapular area, right upper abdominal quadrant, right
R eproduced with perm ission of the copyright owner. Further reproduction prohibited without perm ission.
81
thigh anterior, left thigh lateral, right calf, left foot dorsum, right biceps, and dorsum of the
left hand. The first computer simulation was conducted for a period o f 65 minutes at
286.15K air temperature and 45% relative humidity. The core and skin temperatures and
latent skin heat loss as shown in Figs. 6.1 - 6.3 were simulated for the nude body. The sec
ond simulation was conducted for two hours at two different conditions o f 31% and 30%
relative humidities for the first and second hours respectively. In a manner similar to the
first simulation, body core temperature, mean skin temperature, and latent skin heat loss
were simulated for the nude body as shown in Figs. 6.4 - 6.6. Figures 6.1 - 6.6 show that
model predictions approach and closely follow the experimental data. With this, it is con
cluded that model could be used for future extensive simulation studies for a wide range o f
environmental conditions. Also, earlier studies by Smith [43] and Fu [44] have estab
lished the accuarcy and robustness o f this computer model through extensive experimental
validation.
6.2 Effect of Physical Variables on Human Thermal Responses
The physical variables which affect overall human thermal comfort include both envi
ronmental and personal [73]. There are four environmental variables affecting human
thermal comfort: air temperature, mean radiant temperature, relative humidity, and air
velocity. The personal variables are the activity level and the clothing ensembles. For
example, an active person requires a lower air temperature for comfort, while thick cloth
ing allows a lower air temperature. Computer simulations were performed for a variety o f
environmental conditions, physical activities, and clothing ensembles. Some of the ther
mal responses simulated by the computer include mean skin temperature, blood vessel
R eproduced with perm ission of the copyright owner. Further reproduction prohibited without perm ission.
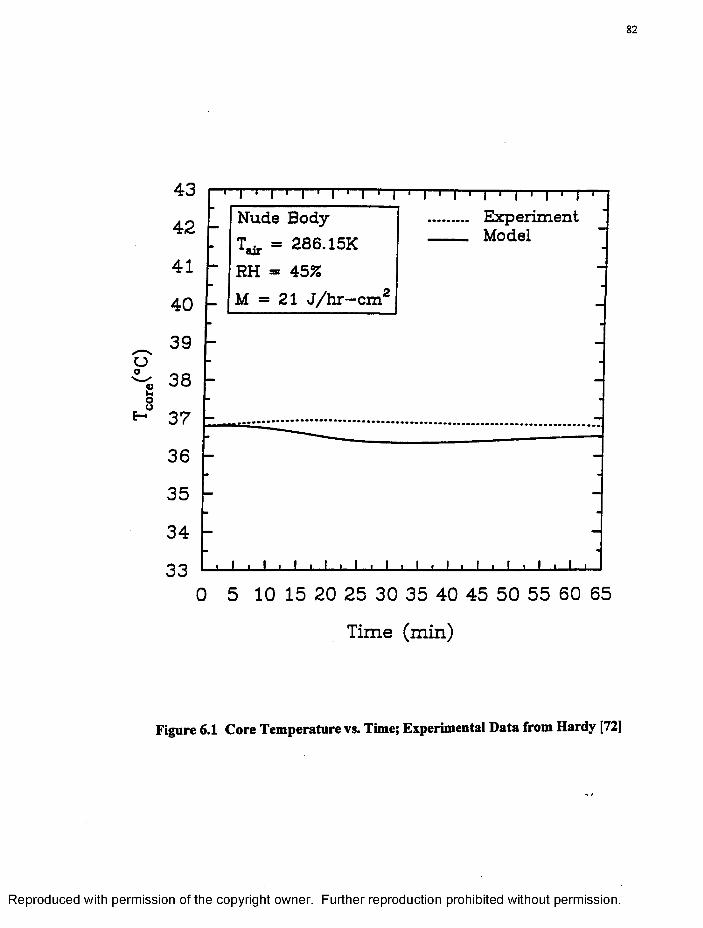
82
43 —r | ' | . | . | i | . |-T-| 1 | 1 | 1 | 1 | 1 | •
AO Nude Body ........ Experiment- T.*. = 286.15K(UF
____ Model
41 — RH = 45% -
40 — M * 21 J /h r—cm2 _
^ 39 _ __
c? - -^ 38 -
MOf \ - -£-• 37 _
36 -
35 -
34 -
33 _ l _ i . i , i . i . i . i ................ . i . i t—i—i—
0 5 10 15 20 25 30 35 40 45 50 55 60 65
T im e (m in )
Figure 6.1 Core Temperature vs. Time; Experimental Data from Hardy [72]
R eproduced with perm ission of the copyright owner. Further reproduction prohibited without perm ission.
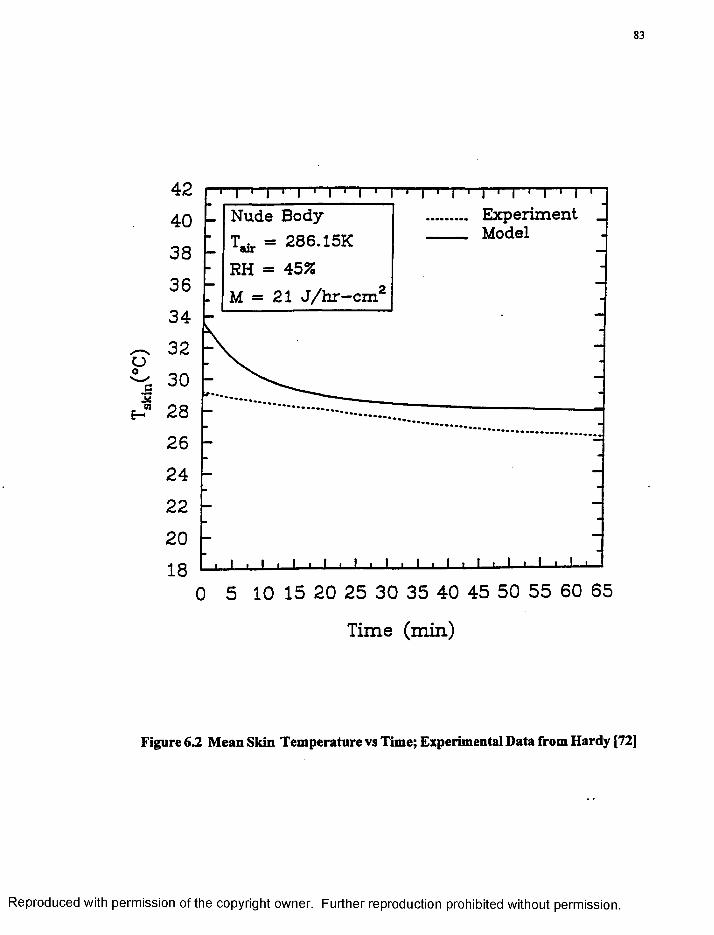
skin
83
42
40
38
36
34
^ 32 o^ 30
e-c 28
26
24
22
20
180 5 10 15 20 25 30 35 40 45 50 55 60 65
T im e (m in )
Figure 6.2 Mean Skin Temperature vs Time; Experimental Data from Hardy [72]
R eproduced with perm ission of the copyright owner. Further reproduction prohibited without perm ission.
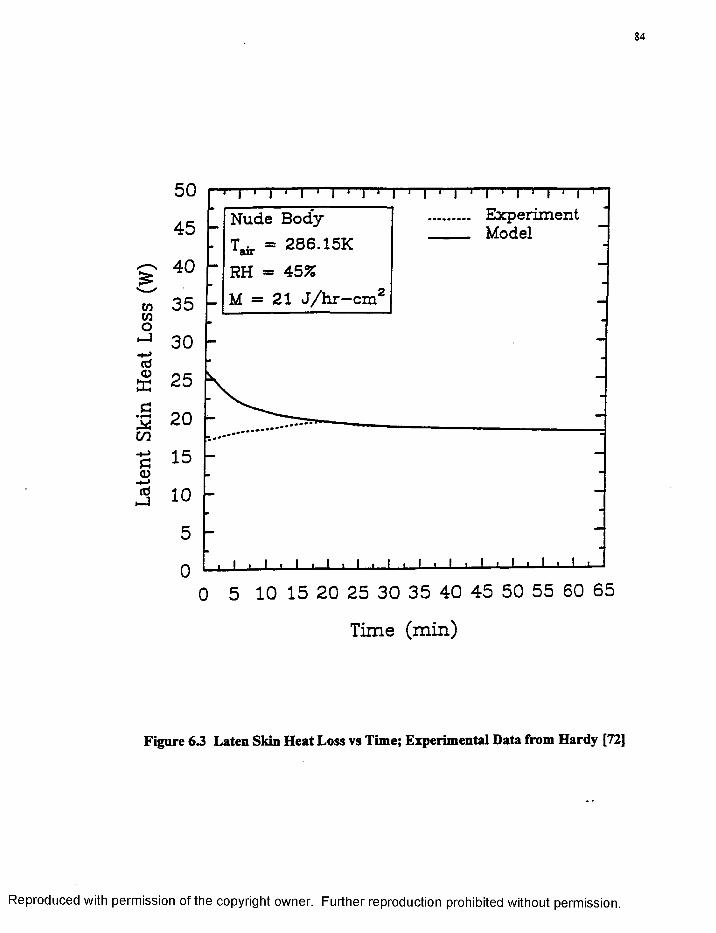
84
50ExperimentModel
Nude Body = 286.15K
RH = 45%M = 21 J /h r —cm'
45
g 40w 35COo
- 1 30
25
M 20 m
<utti
0 5 10 15 20 25 30 35 40 45 50 55 60 65
T im e (m in )
Figure 63 Laten Skin Heat Loss vs Time; Experimental Data from Hardy [72]
R eproduced with perm ission of the copyright owner. Further reproduction prohibited without perm ission.
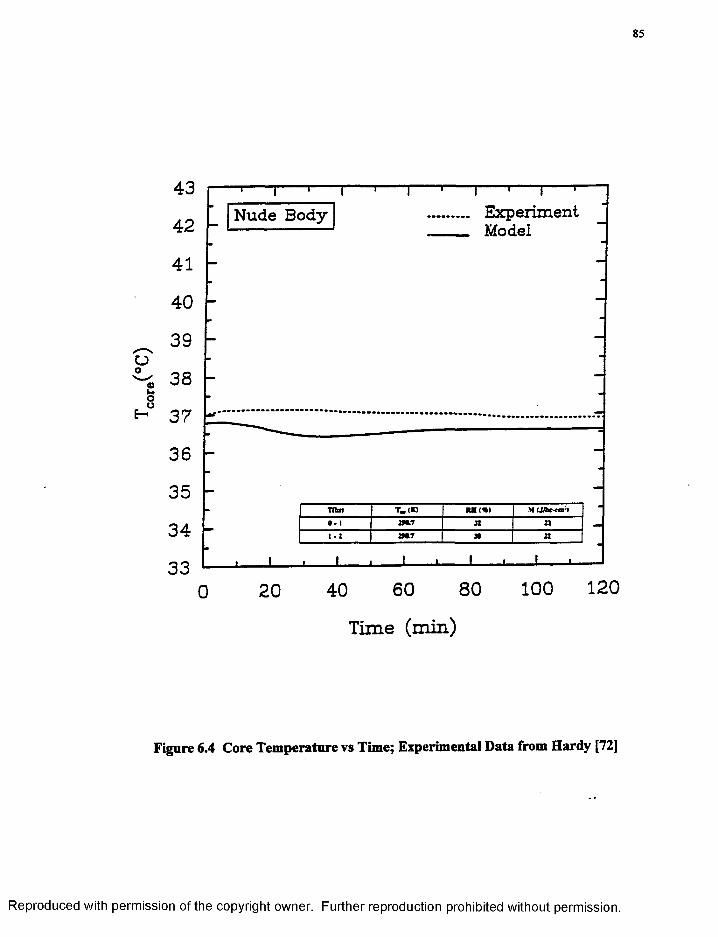
85
43ExperimentModel
Nude Body42
41
40
^ 3 9 u^ 38Wou^ 37
36
35Tfhrt
34
33100 12080604020
T im e (m in )
Figure 6.4 Core Temperature vs Time; Experimental Data from Hardy [72]
R eproduced with perm ission of the copyright owner. Further reproduction prohibited without perm ission.
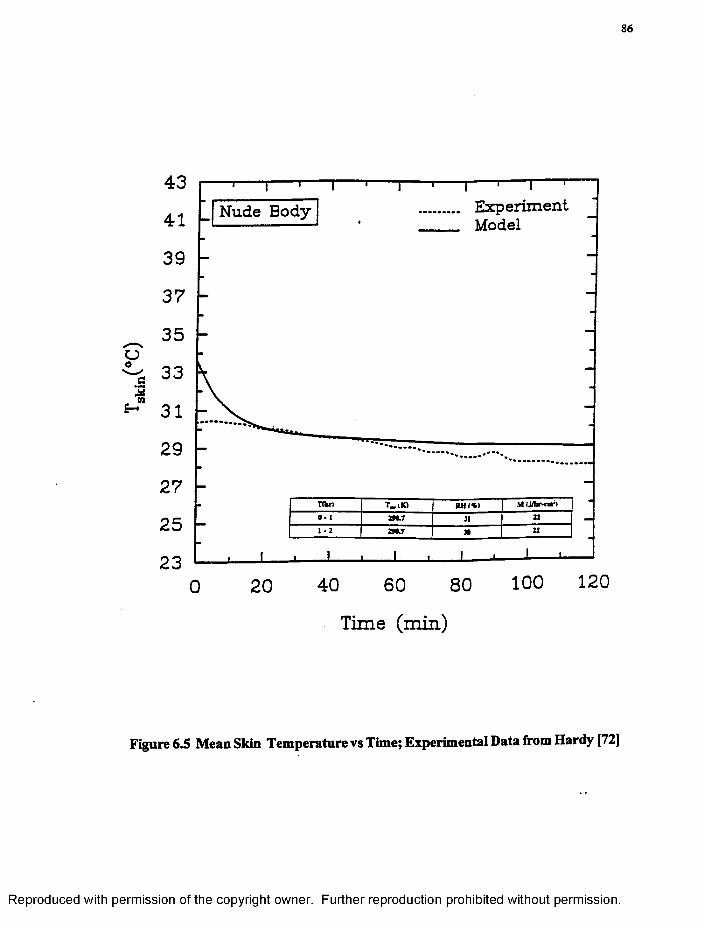
skin
86
43
41
39
37
^ 35 a^ 33
^ 31
29
27
25
230 20 40 60 80 100 120
T im e (m in )
Figure 6.5 Mean Skin Temperature vs Time; Experimental Data from Hardy [72]
E x p e r im e n tModel
Nude Body
R eproduced with perm ission of the copyright owner. Further reproduction prohibited without perm ission.
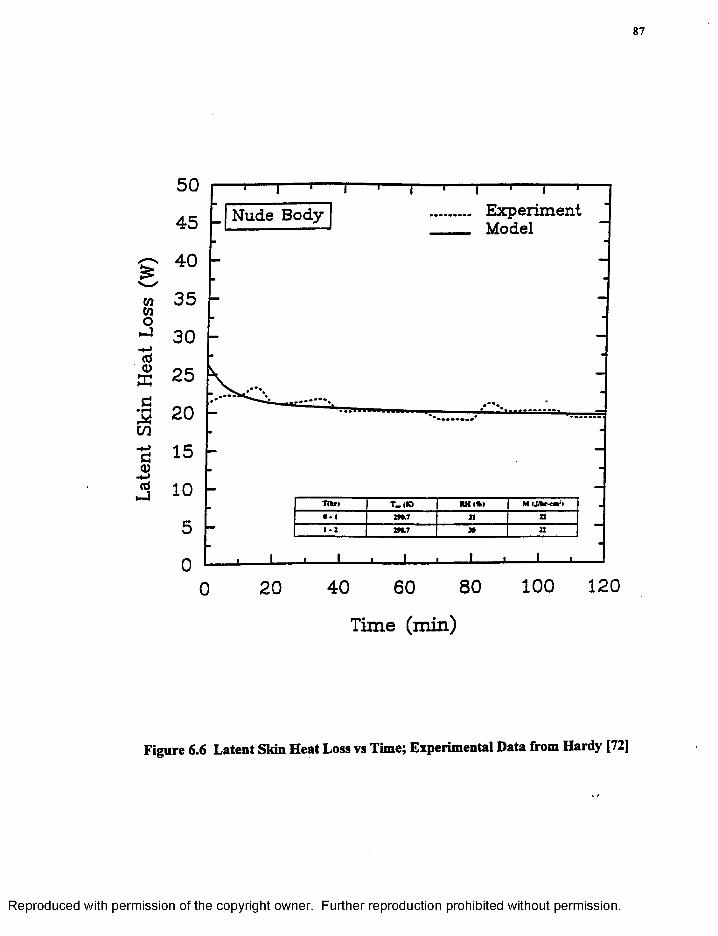
87
50ExperimentModel
Nude Body45
g 40m 35cooJ 30
25
cCD
2M .T
100 1208040 6020
T im e (m in )
Figure 6.6 Latent Skin Heat Loss vs Time; Experimental Data from Hardy [72]
R eproduced with perm ission of the copyright owner. Further reproduction prohibited without perm ission.
88
radii (or vasomotor responses), and entropy generation. The main reason for choosing to
simulate mean skin temperature and skin blood vessel radii lies in the fact that skin tem
perature (ST) has been well established by Shusterman et al. [27] as an indicator of
peripheral stress response. Skin temperature is an indirect measure o f sympathetic ner
vous system. It has been found that skin temperature is related to peripheral blood flow as
measured by plethysmography [20]. Thus, increases or decreases in skin temperature
which is related to vasodilation or vasoconstriction o f skin blood vessels respectively is
demonstrated through computer simulation results. According to Cabanac [74], mean
skin temperature is controlled by behavioral means in humans, and it has been considered
as the basis for comfort. In a neutral thermal environment for a human being at rest, 33°C
constant skin temperature is the result o f a thermal equilibrium. It is thus quite remarkable
that the skin temperature is not only a source o f information, but also an interface between
the environment and the thermal core temperatures resulting in thermal neutrality. Thus,
simulation o f both skin temperature and skin blood vessel radii (vasomotor response)
would demonstrate quantitatively the relationship between behavioral and autonomic
responses. Further, entropy generation, which is used as one o f the responses, provides a
global measure o f chaos or thermal discomfort in the human body [9]. Thus, entropy gen
eration in the human body provides a global measure that specifies the extent of chaotic
motions and reactions occuring within the body [9]. Therefore, entropy generation is cho
sen as a global Objective T herm al Stress Response (OTSR) o f the human body to the
changes in environmental conditions, physical activity, and clothing types.
R eproduced with perm ission of the copyright owner. Further reproduction prohibited without perm ission.
89
6.2.1 Environm ental Conditions
The most important environmental variables which influence the condition o f human
thermal comfort are:
(i) Air temperature(ii) Mean radiant temperature(iii) Relative humidity(iv) Air velocity
In this simulation to observe the effects o f environmental variables on peripheral ther
mal stress responses, the environmental air temperatures ranged from 7’C to 37°C and the
humidity conditions from 30% to 70%. The mean radiant temperature is approximated to
be the same as the environmental air temperature [43, 44]. The air velocity is accounted
for through the selection of values for convection heat transfer coefficient which are esti
mated to be 1.12 J/hr-cm2- ° C and 2.24 J/hr-cm2-° C for 1.0 and 2.0 MET (1 MET = 58.2
W/m2 o f metabolic activity) respectively. However, the radiation heat transfer coefficient
is approximated to be 1.7 J/hr-cm2- 0 C [7]. As a result o f approximation, the number of
environmental variables are reduced from four to two which include air temperature and
relative humidity.
(i) Air Temperature
Several physiological studies have established the fact that blood flow is one of the
major fluid flow phenomena in the human body responsible for heat transfer from the
body core to the peripheral skin [75]. O f the total amount o f blood (the circulating blood
volume) pumped by the heart, about 5 percent flows through the skin blood vessels. When
the air temperature decreases from 3 10K to 280K, the temperature difference between the
skin and the environment is increased; this causes an increased heat loss through conduc
R eproduced with perm ission of the copyright owner. Further reproduction prohibited without perm ission.
90
tion and radiation. A reduced heat flow to the skin results in a gradual lowering o f the skin
temperature as shown in Fig. 6.7. This results in a temperature gradient between the skin
and the environment which eventually leads to vasoconstriction o f the skin blood vessels
causing a reduction in skin blood vessel radii and blood flow as demonstrated in Fig. 6.8.
On the hotter side, when the air temperature increases from 280K to 31 OK, there is vasodi
lation o f skin blood vessel radii as indicated in Fig. 6.8 causing an increased heat transfer
from the core to the peripheral skin. This causes gradual increase in skin temperature as
shown in Fig. 6.7. Thus, both Figs. 6.7 and 6.8 demonstrate the human peripheral stress
response to changes in air temperature for a light clothing of thermal resistance (Ic, = 0.69
clo), relative humidity o f 30% and physical activity corresponding to resting condition (M
= 21 J/hr-cm2-°C). Figure 6.9 shows the variation of entropy generation which indicates
a lower value for higher air temperature (Tair=310K) and higher value for lower air tem
perature (Tair=280K) indicating an increase o f heat production in the human body to bal
ance the cooler environment. Further, it is observed that variation o f entropy generation
level is inversely proportional to that o f skin temperature and blood vessel radii.
(ii) Relative Humidity
Some studies [76,77] have shown that after a prolonged stay in an enclosure, the influ
ence o f temperature is not affected by the humidity o f the air. The following combinations
o f air temperature and relative humidity produce the same level o f thermal comfort in
humans [18]:
70% RH and 20° C 50% RH and 20.50 C 30% R H and21°C
R eproduced with perm ission of the copyright owner. Further reproduction prohibited without perm ission.
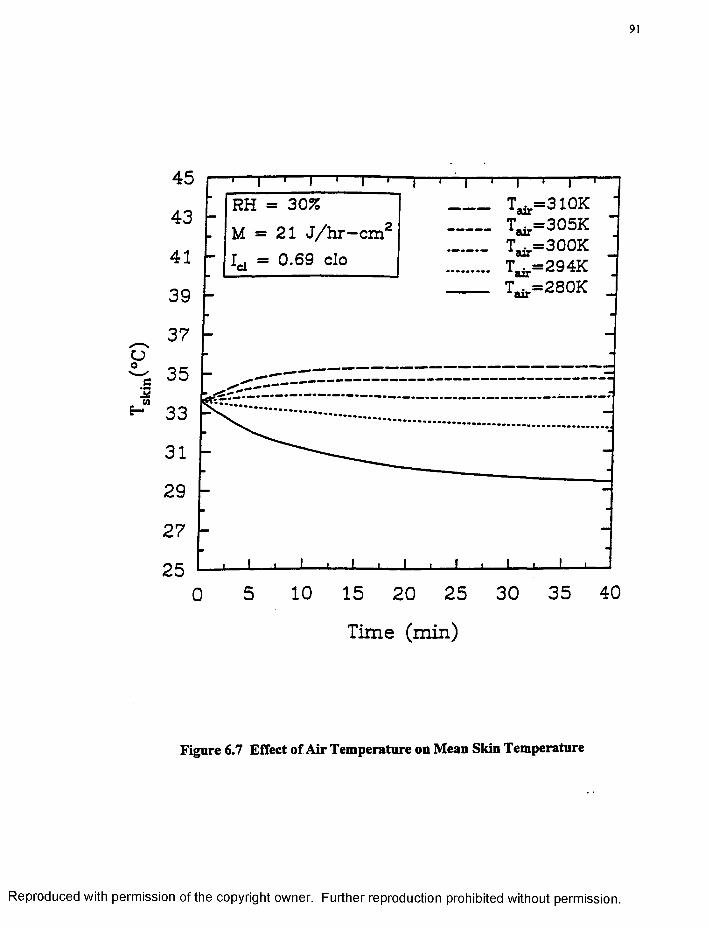
91
45RH = 30%M = 21 J / h r - c m :
43
41
39
x -s 3 7c ?
3 5
J* * 33
31
29
27
255 10 15 20 25 30 35 40
T im e (m in )
Figure 6.7 Effect of Air Temperature on Mean Skin Temperature
R eproduced with perm ission of the copyright owner. Further reproduction prohibited without perm ission.
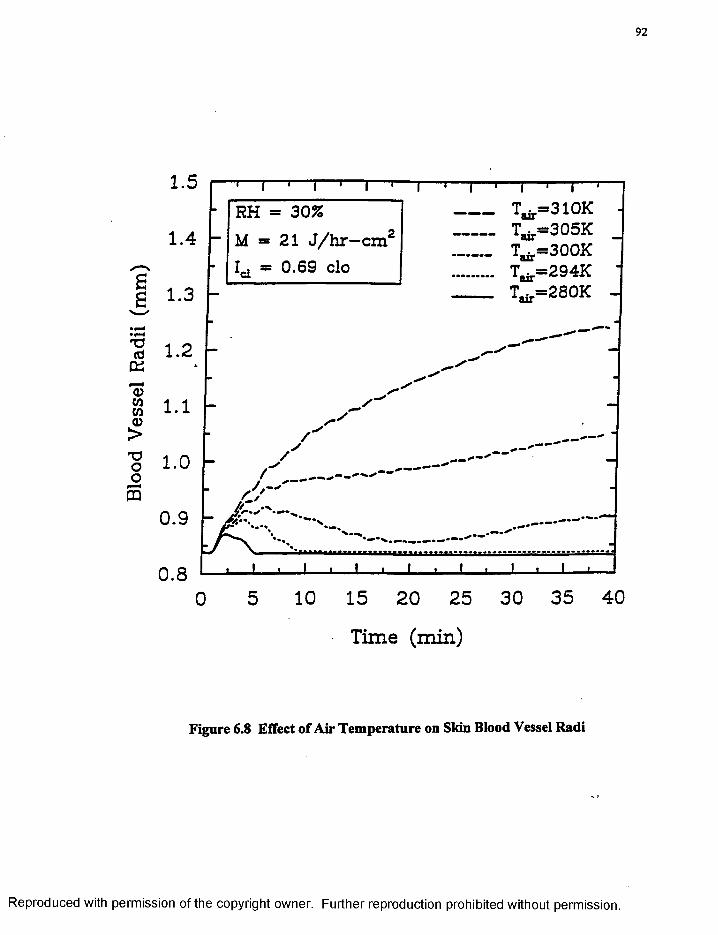
Blo
od
Ves
sel
Rad
ii (m
m)
92
1.5RH = 30%M = 21 J / h r —cm'1.4
1.3
1.2
.1
1.0
0.9 N
0.830 35 4010 15
T im e ( m in )
Figure 6.8 Effect of Air Temperature on Skin Blood Vessel Radi
R eproduced with perm ission of the copyright owner. Further reproduction prohibited without perm ission.
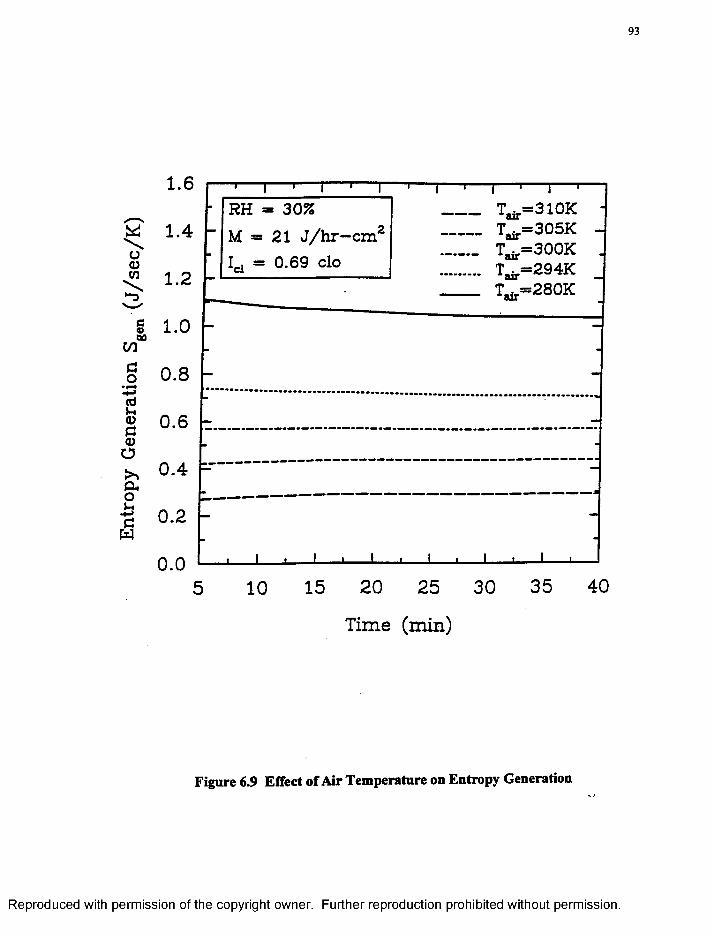
Ent
ropy
G
ener
atio
n S
gen
(J/s
ec
/K)
93
1.6RH = 30%M = 21 J /h r —cm'1.4
1.2
1.0
0.8
0.6
0 .4
0.2
0.020 25 30 35 40
T im e (m in )
Figure 6.9 Effect of Air Temperature on Entropy Generation
R eproduced with perm ission of the copyright owner. Further reproduction prohibited without perm ission.
Therefore, it is clear that within the range o f 30-70%, the relative humidity has little influ
ence on peripheral stress responses. As we observe from Figs. 6.10 and 6.11, there is not
much significant deviation in mean skin temperature and skin blood vessel radii for vary
ing relative humidity values ran from 30% to 70%. The other fixed conditions include
light clothing o f thermal resistance (Ic, = 0.69), air temperature of294K. and a resting con
dition which corresponds to a metabolic rate (M = 21 J/hr-cm2). A sudden increase in the
radii o f skin blood vessels is observed during the intial ten-minute period which is attrib
uted to the "fight-or-flight" autonomic thermal peripheral stress response. After this initial
period o f adjustment, the human thermal system attains the thermal neutrality. As men
tioned in [11], it can be assumed that between 18 - 24° C the relative humidity can fluctu
ate between 30-70% without creating thermal discomfort. This is clearly demonstrated in
Fig. 6.12 that the effect o f changing relative humidity in the range o f 30% to 70% on
entropy generation is insignificant. However, the variation o f entropy generation is pro
portional to that o f skin temperature and blood vessel radii.
6.2.2 Physical Activity
The activity level o f a human being is described quantitatively as the metabolic free
energy production 'M1 expressed per unit body surface area. Some of this energy may be
used to perform external work, but most is lost as heat from the body. The metabolic rate
is estimated by measuring the rate o f oxygen consumption. A great deal o f information is
available in the literature on the metabolic rate associated with different physical activities
[73]. Thermal comfort largely depends on the type and intensity o f work performed [47].
Physical work in the cold may lead to increased heat production and hence to decreased
R eproduced with perm ission of the copyright owner. Further reproduction prohibited without perm ission.
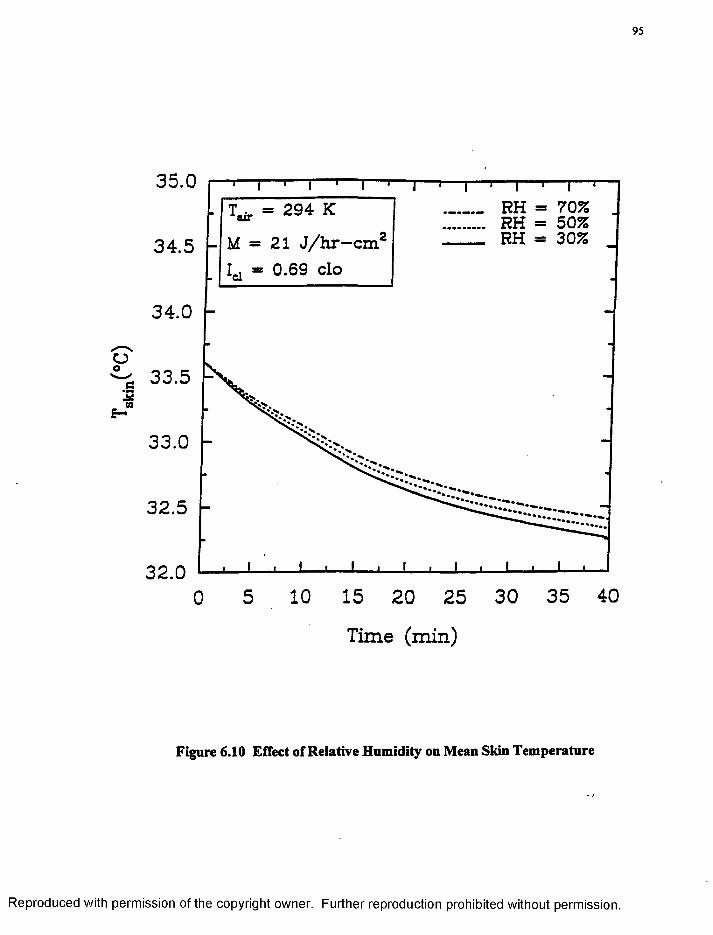
skin
95
35.0RH = 70% RH = 50% RH = 30%
= 294 K
U - 21 J /h r - c m :34 .5
34 .0
oo 33.5
33 .0
32.5
32.030 35 4010 15
T im e ( m in )
Figure 6.10 Effect of Relative Humidity on Mean Skin Temperature
R eproduced with perm ission of the copyright owner. Further reproduction prohibited without perm ission.
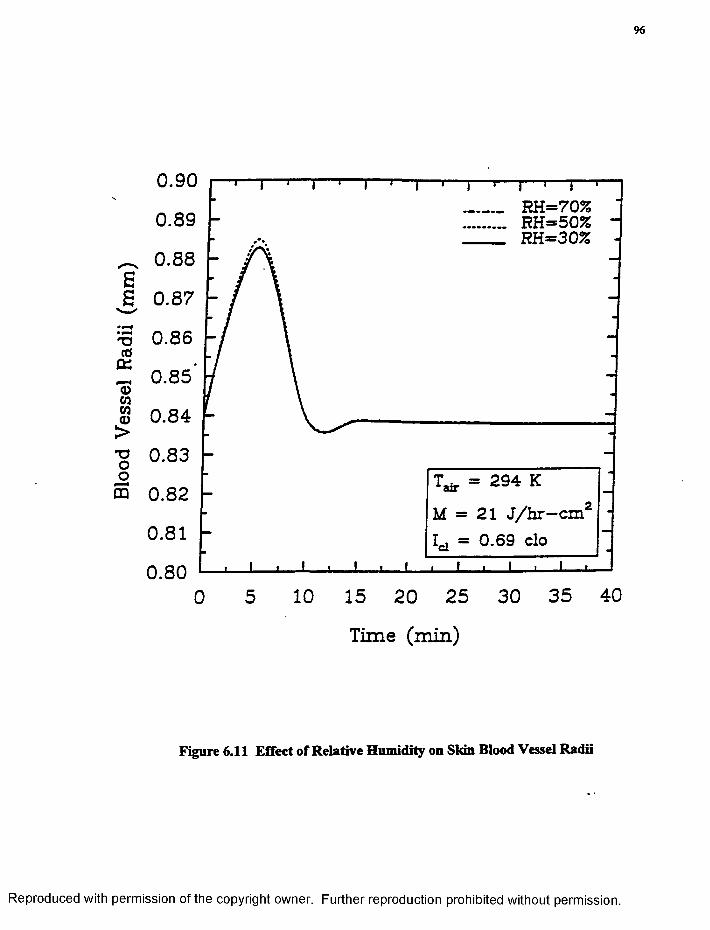
Blo
od
Ves
sel
Rad
ii (m
m)
96
0 .90RH=70%RH=50%RH=30%
0.89
0.88
0 .87
0.86
0.85
0 .84
0.83T a i r = 294 K M = 21 J /h r -c m
0.82
0.81
0.8035 4010
T im e ( m in )
Figure 6.11 Effect of Relative Humidity on Skin Blood Vessel Radii
R eproduced with perm ission of the copyright owner. Further reproduction prohibited without perm ission.
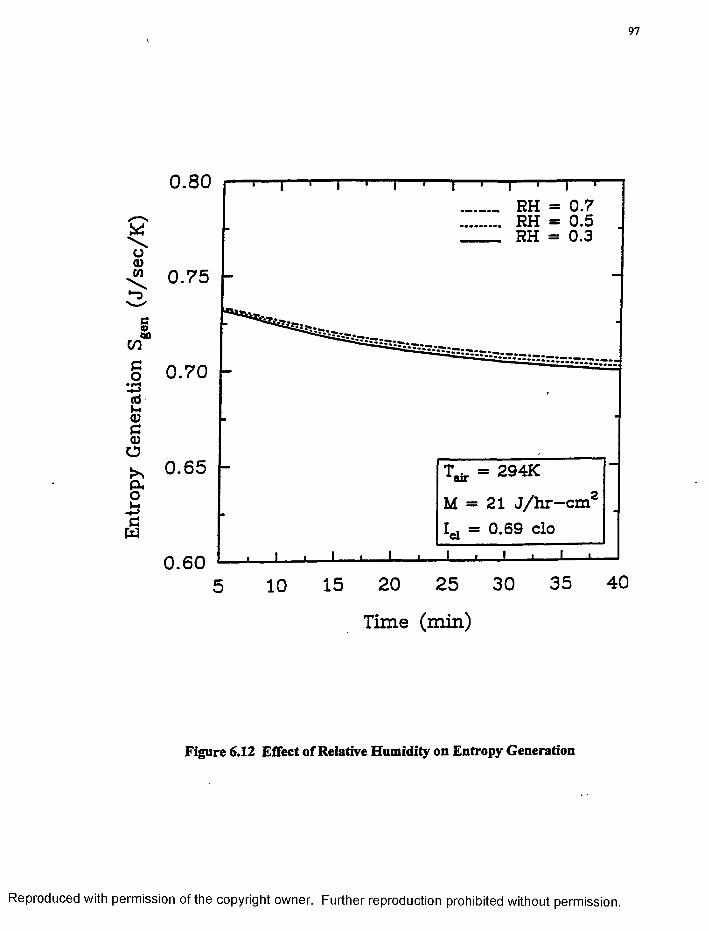
Ent
ropy
G
ener
atio
n Sg
en (J
/se
c/K
)
\97
0 .8 0RH = 0.7 RH = 0.5 RH = 0.3
0 .75
0 .7 0
0 .6 5 = 294K
M = 21 J / h r —crn L, = 0.69 clo
0 .6015 20 25 30 35 40
T im e (m in )
Figure 6.12 Effect of Relative Humidity on Entropy Generation
R eproduced with perm ission of the copyright owner. Further reproduction prohibited without perm ission.
98
sensitivity to the cold environment, while in the heat, hard physical work could be highly
detrimental to the attainment o f energy balance which could lead to hyperthemia.
It has been stated in [78] that the average skin temperature in the relative steady state is
a linear function o f the ambient air temperature and is relatively independent o f the level
o f exercise. The two major independent variables in evaluating the effect o f exercise on
temperature regulation are the air temperature and the level o f metabolic rate. Thus, keep
ing the air temperature fixed at 294K, RH at 30% for light clothing with thermal resistance
o f IC| = 0.69, it is observed from the Figs. 6.13 and 6.14 that there is not much significant
effect on peripheral skin temperature and skin blood vessel radii. Also, in Fig. 6.14, the
initial rapid increase in blood vessel radii is attributed to behavioral stress response due to
exercise. It is concluded that for a given environmental condition and clothing type, the
effect o f physical activity on peripheral thermal stress responses is not significant. How
ever, change in levels o f physical activity has significant effect on the sensitivity of
entropy generation as shown in Fig. 6.15. As metabolic rate increases from basal value,
the relationship between mean skin temperature and entropy generation variation becomes
inversely proportional.
6.2.3 Clothing
Humans wear clothes under normal conditions. The transfer o f heat and mass (mois
ture) from the skin through the clothing to the environment is an important factor in ther
mal comfort. Clothing insulation is usually described as a single equivalent uniform layer
over the whole body. Its insulating value is expressed in terms o f "clo" units, defined as 1
clo = 0.155 m2. ° C/W [79]. The effect o f clothing on thermal responses is investigated
R eproduced with perm ission of the copyright owner. Further reproduction prohibited without perm ission.
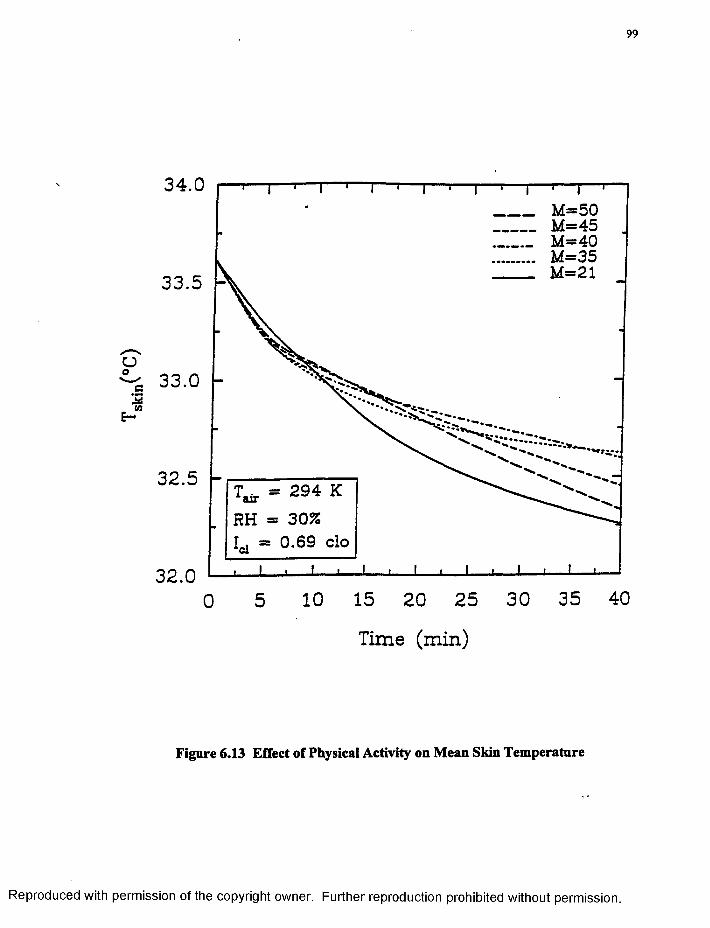
99
34.0
33 .5 J
ooc
201
E—
33.0 -
32 .5 -T •Aaor « 294 KRH = 30%Id = 0.69 clo
1— 1— 1— I— 1 M=50 M=45 M=40 M=35 M=21
32.0 I ' I L
0 5 10 15 20 25 30 35 40
T im e ( m in )
Figure 6.13 Effect of Physical Activity on Mean Skin Temperature
R eproduced with perm ission of the copyright owner. Further reproduction prohibited without perm ission.
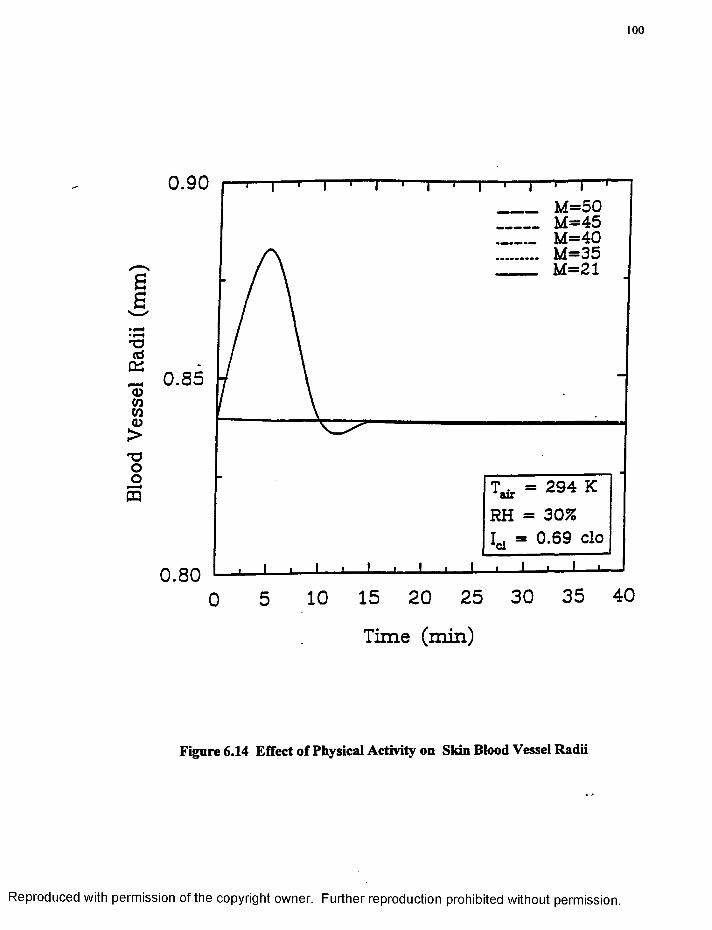
Blo
od
Ves
sel
Rad
ii (m
m)
100
0 .90M=50M=45M=40M=35M=21
0.85
= 294 K RH = 30%
0.8025 30 35 40
T im e (m in )
Figure 6.14 Effect of Physical Activity on Skin Blood Vessel Radii
R eproduced with perm ission of the copyright owner. Further reproduction prohibited without perm ission.
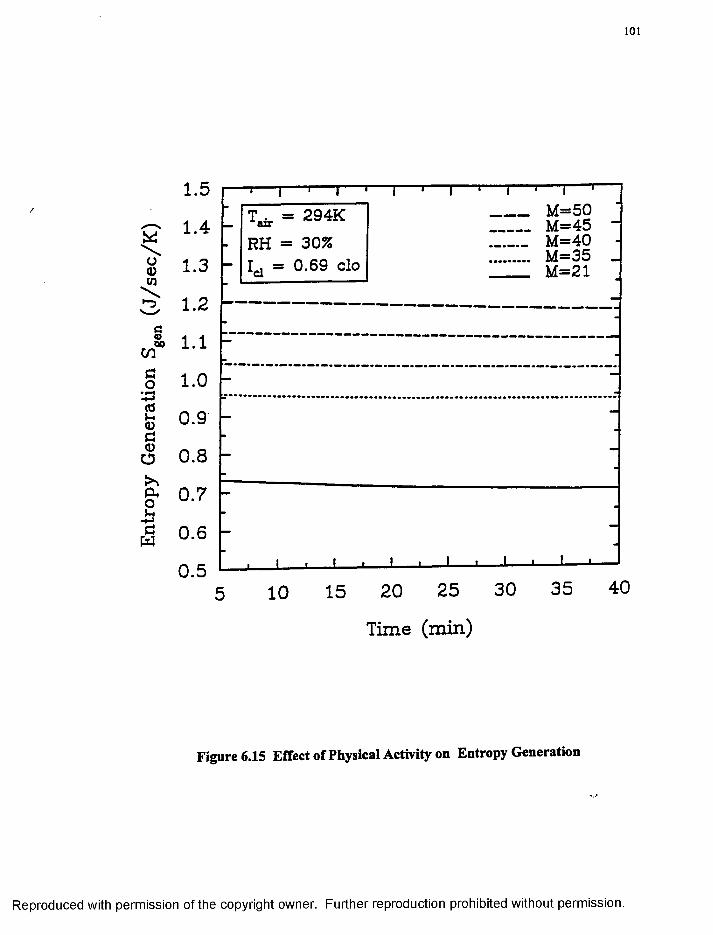
Ent
ropy
G
ener
atio
n Sg
en (J
/se
c/K
)
101
1.5M=50M=45M=40M=35M=21
= 294K RH = 30%
1.4
1.3
1.2
0.9
0.7
15 20 25 30 35 40
T im e (m in )
Figure 6.15 Effect of Physical Activity on Entropy Generation
R eproduced with perm ission of the copyright owner. Further reproduction prohibited without perm ission.
102
using three kinds o f clothing which include light clothing with a thermal resistance value
o f IC| = 0.21 clo; medium clothing with IC| = 0.69 clo; and heavy clothing with Ic| = 1.72
clo. The purpose o f this simulation is to obtain quantitative data describing the dynamic
nature o f heat and moisture humans dissipate to their surroundings and to investigate the
human comfort level for various types o f clothing. The simulation was conducted for a
period o f forty minutes for constant environmental conditions of 294K. air temperature,
30% relative humidity and a physical activity level corresponding to a resting condition
(M = 21 J/hr-cm2). It is observed from Figs. 6.16 and 6.17 that as the thermal resistance
(clo value) increases from light (Ic| = 0.21) to heavy clothing (Ic| = 1.72), both mean skin
temperature and skin blood vessel radii increase and remain at a relatively higher value
throughout the 40-minute simulation period. It is concluded that for a given environmen
tal condition and a level o f physical activity, the impact o f clothing types is quite signifi
cant on the peripheral thermal stress responses and thus affects the overall thermal
comfort. Further, it is observed from Fig. 6.18 that entropy generation increases and its
variation is directly proportional to that o f skin temperature and blood vessel radii.
6.3 Hybrid Technique for Analysis of Human Thermal Behavior
The most important physical variables which influence the human thermal comfort
level are air temperature (Tajr) and relative humidity (RH) for a given clothing and physi
cal activity. As this study is focussed mainly on the analysis o f human behavior during
coginitive tasks in aerospace or any industrial enclosures, the physical activity is assumed
to be sedentary correspondng to the resting condition (Metabolic rate, M = 21 J/hr-cm2).
Also, clothing worn by humans during the performance o f cognitive tasks is expected to
R eproduced with perm ission of the copyright owner. Further reproduction prohibited without perm ission.
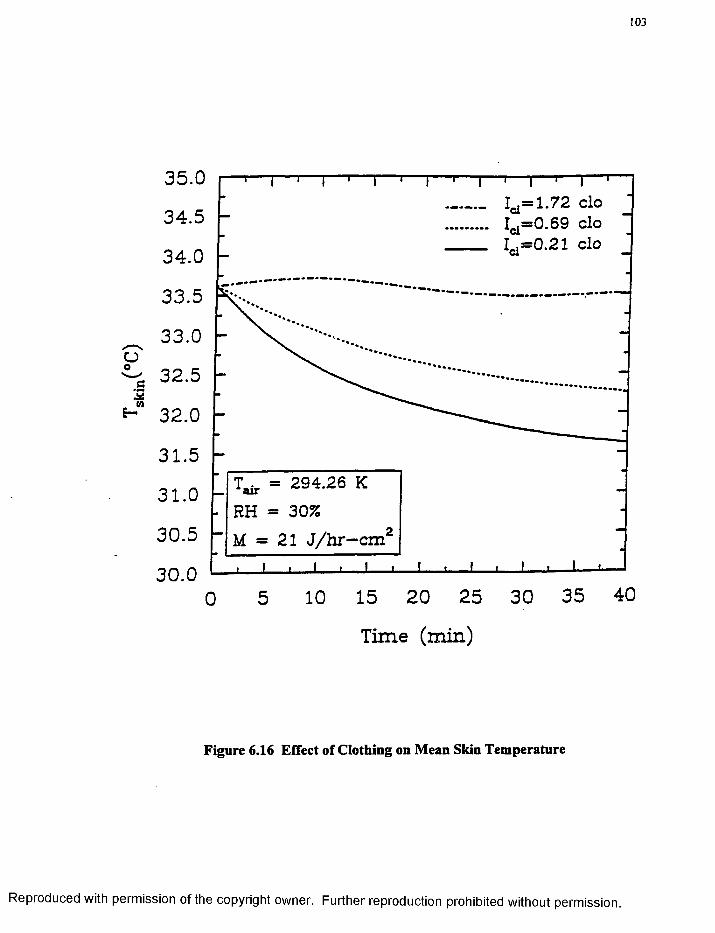
103
35 .0I** 1.72 clo 1^=0.69 clo I , =0.21 clo
34 .5
34 .0
33 .5
33.0
32 .5
^ 32 .0
31 .5T v = 294.26 Kair
RH = 30%M = 21 J /h r -c m '
31 .0
30 .5
30 .020 25 30 35 40
T im e ( m in )
Figure 6.16 Effect of Clothing on Mean Skin Temperature
R eproduced with perm ission of the copyright owner. Further reproduction prohibited without perm ission.
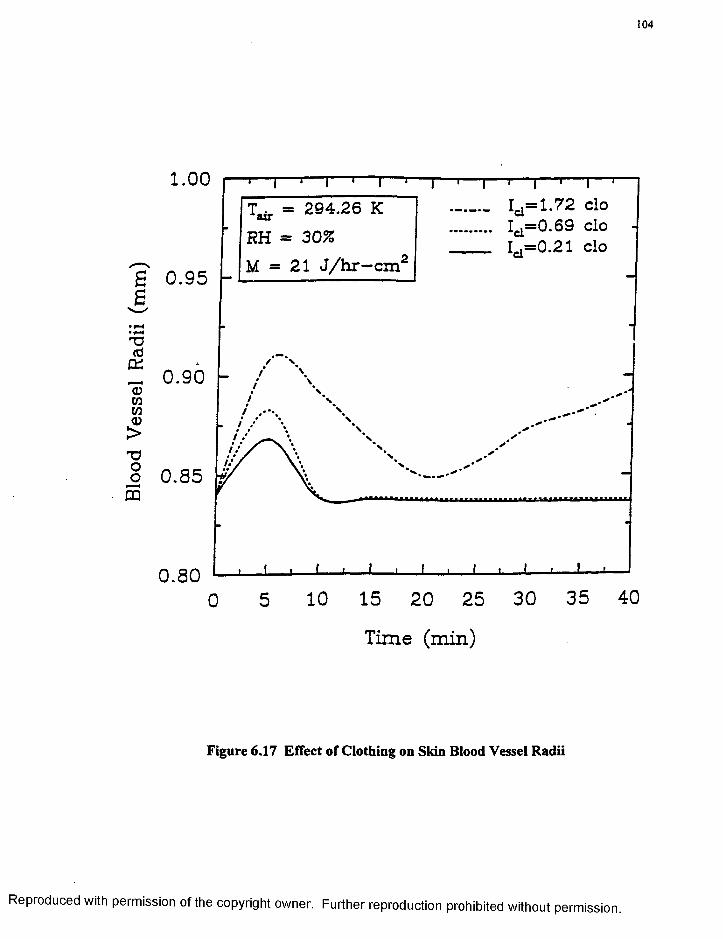
Blo
od
Ves
sel
Rad
ii (m
m)
104
1.00TV * 294.26 K
B IT
RH * 30%M = 21 J /h r - c m '
1^=0.69 clo I ,=0.21 clo
0 .9 5
0 .9 0
0 .8 5
0 .8 015 20 25 30 35 40
T im e (m in )
Figure 6.17 Effect of Clothing on Skin Blood Vessel Radii
R eproduced with perm ission of the copyright owner. Further reproduction prohibited without perm ission.
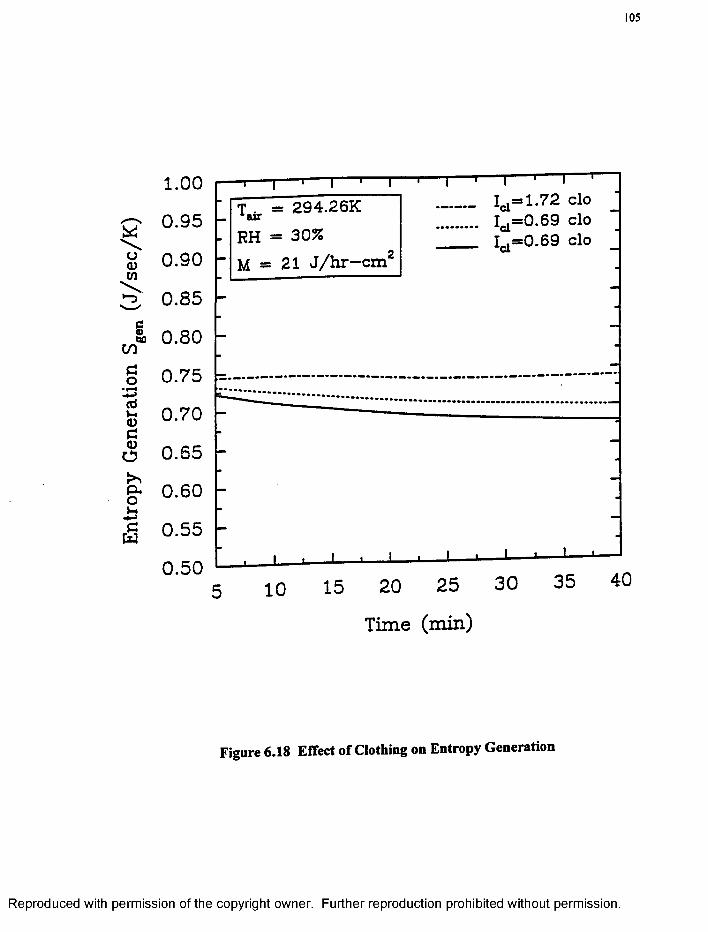
Ent
ropy
G
ener
atio
n S
gen
(J/s
ec
/K)
105
1.00
0 .95
0 .90
0 .85
0 .80
0 .75
0 .70
0 .65
0 .60
0 .55
° - 5 0 o c a n5 10 15 20 25 30 35 40
T im e (m in )
Figure 6.18 Effect of Clothing on Entropy Generation
1^=1.72 clo 1^=0.69 clo I .= 0 .6 9 clo
T . = 294.26K •‘airRH = 30%
U - 21 J /h r —cm :
R eproduced with perm ission of the copyright owner. Further reproduction prohibited without perm ission.
106
be o f medium thermal resistance which corresponds to a value of IC| = 0.69 clo. Thus,
only two environmental variables that will be affecting the human attention and vigilance
capabilities during cognitive tasks are air temperature and relative humidity. The question
is, what kind o f human physiological response is most appropriate for analyzing the
human behavior? Following the global approach, entropy generation is chosen as the
response o f the whole human body to the changes in environment. This is mainly due to
the fact that entropy generation provides a global measure o f activeness or chaos or stress
level in the body as shown in a study by Boregowda et al. [9] and in the previous Sec. 6.2.
Therefore, from now onwards in this chapter, entropy generation will be used as a param
eter that quantifies thermal stress level and thus would be known as Objective Therm al
Stress Response (OTSR, J/sec/K) according to Postulates IX and X.
Thermal comfort can be achieved by many different combinations o f the environmen
tal variables in technical systems. In any case, thermal comfort is the "product" which is
produced and sold to the customers by the heating and air- conditioning industry. There
fore, it is very important to define and standardize the quality o f this "product" called ther
mal comfort. In order to define and standardize this very subjective "product", there has to
be an objective measure o f human thermal stress that indicates the level o f comfort or dis
comfort. At this point, the entropy generation in the human body is introduced as an
objective measure o f thermal stress based on the Unified Stress Response Theory (USRT)
stated in Sec. 3.6. The entropy generation is a response o f the whole human body to the
environmental stimuli from a thermodynamic standpoint. With this approach, the ambigu
ity and uncertainty o f the subjective analysis o f thermal comfort is overcome. However, it
is crucial to prove quantitatively that entropy generation is a valuable parameter that quan
R eproduced with perm ission of the copyright owner. Further reproduction prohibited without perm ission.
107
tifies the level of thermal comfort which is presented in the next section, Sec. 6.4. Before
the validation process, it is interesting to observe the cross effects of ambient temperature
and humidity on the "objective" human thermal response which is entropy generation.
The technique o f defining and investigating all possible conditions in an experiment
involving multiple factors is known as the design of experiments [46]. This section is
primarily devoted to demonstrate the integration of design o f experiments approach devel
oped by Fischer [45] and the entropy theory. The result o f this integration is the synthesis
o f a Hybrid Technique to analyze human thermal behavior using the results o f human
thermal simulation. The hybrid technique is illustrated through five different cases o f
human thermal simulations conducted for different combinations of air temperature and
relative humidity for the given conditions o f physical activity and clothing.
Consider an Environmental Control Industry planning to design an optimal internal
environment. The designers have standardized all other variables except the air tempera
ture and relative humidity. The other fixed variables include moderate physical activity
(M = 21 J/hr-cm2) and clothing (Icl = 0.69) for a human being performing a cognitive task.
Two levels of air temperature, ^airl and Tair2 and two levels of relative humidity, RHj and
RH2 are selected. (Subscripts 1 and 2, respectively refer to the low and high levels o f each
factor). Traditionally, in order to select the best combination of these factors or variables
that meet the comfort level o f most o f the occupants in an enclosure, an experimental sur
vey involving human subjects need to be conducted. This approach is statistically based
and it takes into account the subjective sensations o f the human subjects contrary to the
objective analysis. In this regard, there is lot of ambiguity and uncertainty in the responses
R eproduced with perm ission of the copyright owner. Further reproduction prohibited without perm ission.
108
of the human subjects who would express their feelings o f "warmth"or "cool" on a subjec
tive scale. In order to overcome this fuzziness, a global measure o f human response to
environmental stimuli is constructed using the second law of thermodynamics as already
explained in Sec. 5.2. In this context, entropy generation is the natural variable that gives
the quantitative measure o f thermal stress for each individual. It is this quantity which is
used in the hybrid technique in the place o f subjective responses.
Each one of the five different cases presented here is one o f the simplest cases of
design of experiments [46]. It involves two factors (air temperature and relative humidity)
at two different levels (high and low) that affect the overall human thermal comfort level.
Such an experiment is described as a 2x2 factorial experiment There are four (22) possi
ble treatments or combinations. For each one o f these combinations of air temperature
and relative humidity, a computer simulation is conducted, thus resulting in four simula
tions for each case and twenty simulations for the entire demonstration of hybrid tech
nique. Each simulation was conducted for one hour for a moderate physical activity (M =
21 J/hr-cm2) and clothing (Ici = 0.69). The steady-state response at the end of the simula
tion period (60th minute) were chosen for the calculation o f entropy generation that pro
vides the measure o f thermal stress response. The steady-state responses include core and
skin temperatures, heat losses, and heat production in the body. The thermal stress
responses to two factors (RH and Tair) are given in Tables 6.1 - 6.5 and Figs. 6.19 - 6.23.
Case (i): Extreme Environmental Conditions
Examination o f individual’s thermal stress response (Sgen) shows a decrease in its
value for the relative humidity level o f 90% at the lower level o f air temperature (260K).
R eproduced with perm ission of the copyright owner. Further reproduction prohibited without perm ission.
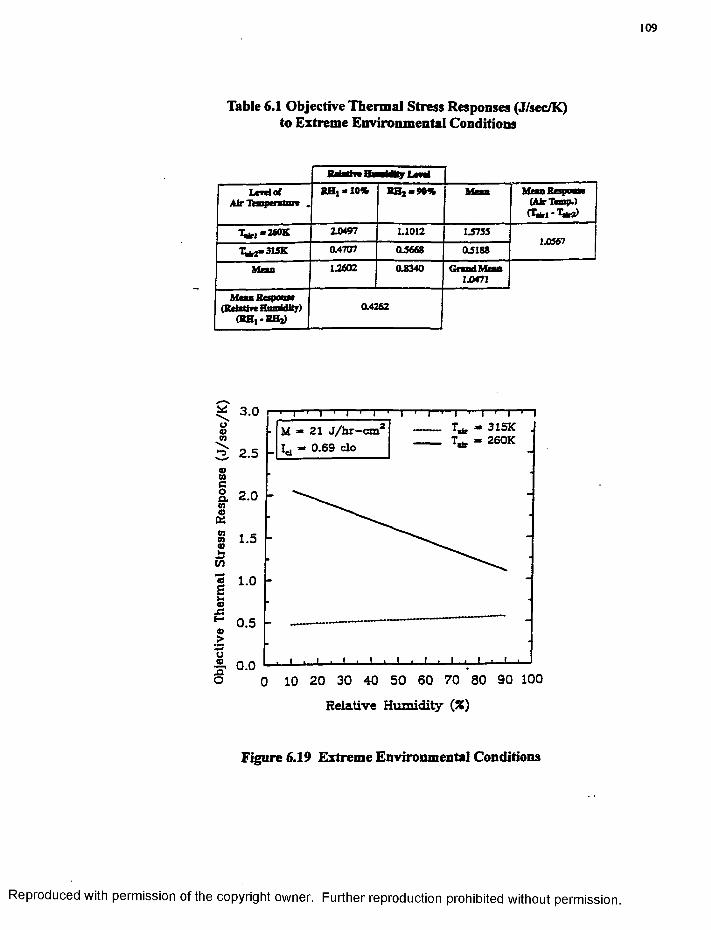
109
Table 6.1 Objective Thermal Stress Responses (J/sec/K)to Extreme Environmental Conditions
U a t n S W % ML m j of
Air Temperature ,RHt -10% ■Bx-90% Mem Mean Response
(Air Temp.) CtWl*t«*r3)
T«irl “ 260K 20497 L1012 L5755
T ^ - S I S K 04707 03668 03188
Mean 1.2602 08340 G nadM eaa10471
MamKeaponm (Rdatfre Hmniditr)
{B H fB St)04262
3.0315K .260K
M - 21 J/hr- L, - 0.69 clo
strw
S. 2 .0
1.5
1.0
JS0.5
0.020 30 40 50 60 70 80 90 100
Relative Hum idity (%)
Figure 6.19 Extreme Environmental Conditions
R eproduced with perm ission of the copyright owner. Further reproduction prohibited without perm ission.
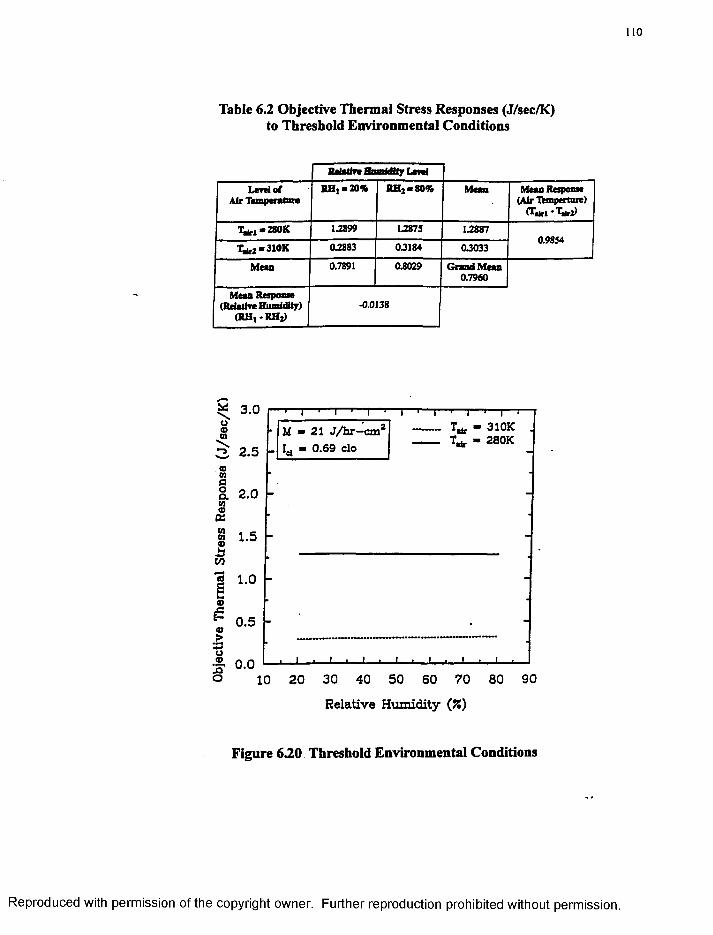
110
Table 6.2 Objective Thermal Stress Responses (J/sec/K)to Threshold Environmental Conditions
| KtUtirwBnm iUtT L m l
Lard of Air Temperature
1 RHt .2 0 « R H j.80% Mean Mean Response (Air Ikmpertnre)
( T ^ r t • T * * )
1 ^ ,,-a O K 13X99 1.2875 132X7
“ 310K 0.2883 0 J 1 8 4 0JO 33
Mean 0.7891 0.8029 Grand Mean0 .7960
Mean Response (Relative Humidity)
(RH| -RH j)-0.0138
* 3.0o©03
3 2.5 -©03coo.03©0£0303©isCO
©
iS©>ao•1 0.0
->— i— 1— i— 1— i— 1— r
U - 21 J /h r —cms Id - 0.69 clo
- i — i— i— |— r
- 310K T ,̂. - 280K
2.0 h
1.5
1.0
0.5 -
_L _L _L.
10 20 30 40 50 60 70 80 90
Relative Humidity (%)
Figure 6.20 Threshold Environmental Conditions
R eproduced with perm ission of the copyright owner. Further reproduction prohibited without perm ission.
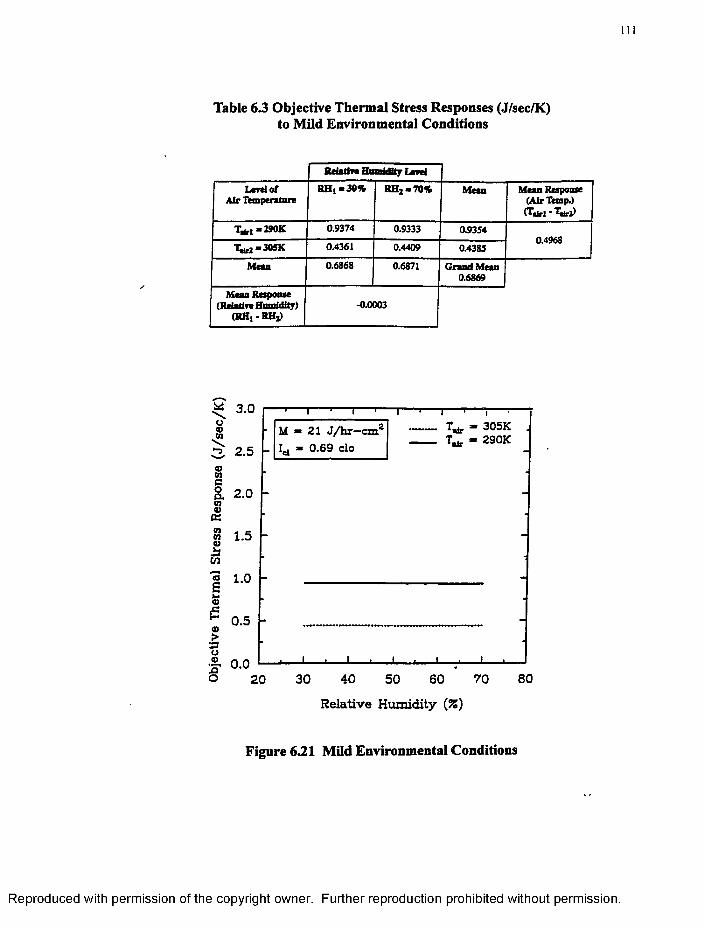
Ill
Table 6.3 Objective Thermal Stress Responses (J/sec/K)to Mild Environmental Conditions
Relative Hnmidlty Level
Level of Air Temperature
R H ,-30% RH2-70% Mean Mean Response (Air Hemp.)(T«irl • T«iri)
T.M -290K 0.9374 0.9333 0.93540.4361 0.4409 0.4383
Mean 0.6868 0.6871 Grand Mean0.6869 j
Mean Response (Relative Humidity)
(RH| • RHi)-0.0003
305K290K
M - 21 J / h r —cm' L, - 0.69 clo
■ir
3 2.5
8. 2.0
1.5
1.0
0.5
0.08040 50
Relative Humidity (%)
30 60 7020
Figure 621 Mild Environmental Conditions
R eproduced with perm ission of the copyright owner. Further reproduction prohibited without perm ission.
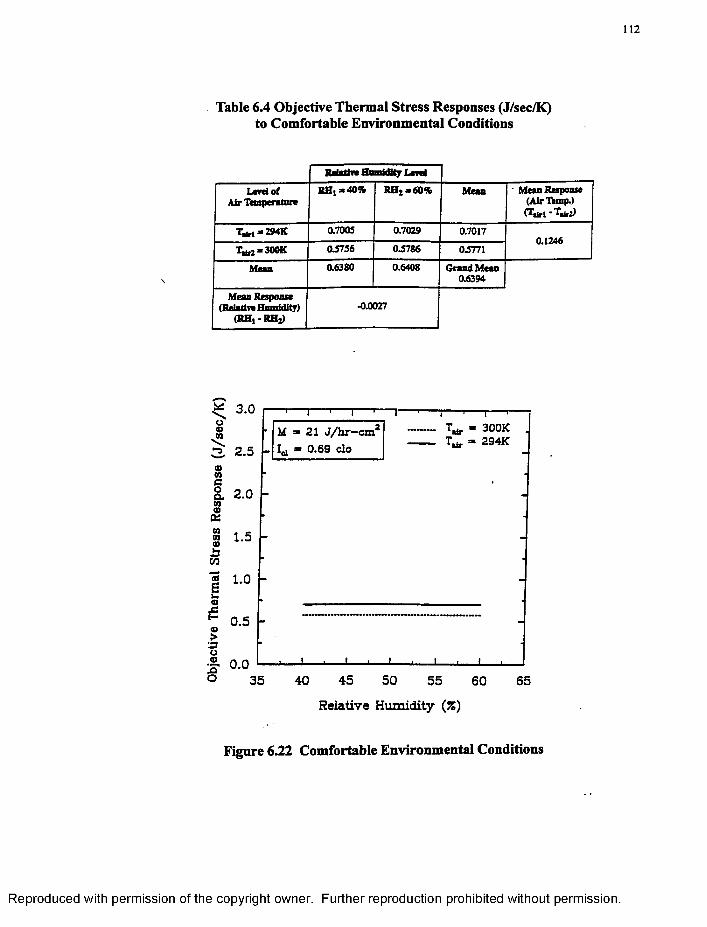
112
Table 6.4 Objective Thermal Stress Responses (J/sec/K)to Comfortable Environmental Conditions
Relative Homlrilty Level
Level of Air Temperature
RH,*40% RHj *60% Mean ' Mean Response (Air Hemp.) (Tiiri
T^rl *294K a700S 0.7029 0.7017
- 300K 0J756 05786 05771
Mean 06380 0.6408 Grand Mean0.6394
Mean Response (Relative Humidity) •00027
300KM =» 21 J/hr-cm
40 45 50 55 60
Relative Hum idity (%)
Figure 6.22 Comfortable Environmental Conditions
R eproduced with perm ission of the copyright owner. Further reproduction prohibited without perm ission.
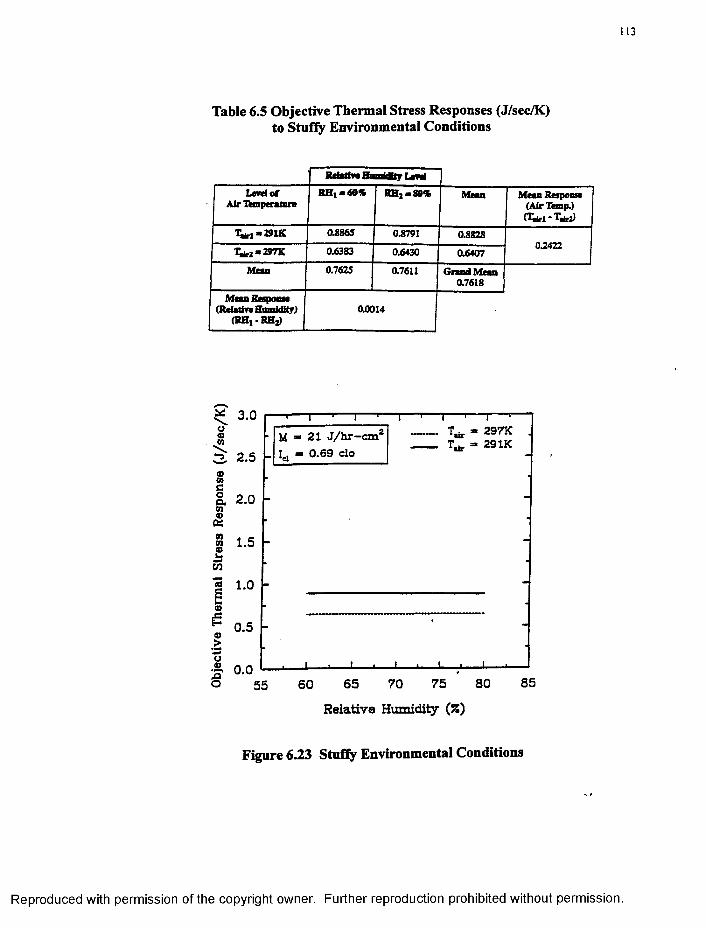
113
Table 6.5 Objective Thermal Stress Responses (J/sec/K)to Stuffy Environmental Conditions
Bdatfra Humidity LentLevel of
A irlbnperatnreR H t-6 0 * RH j-80% Mean Mean Response
(AirTfcmp.) OWa - T*ri)
Tjfc., » 29 IK 0.886S 0.8791 0.8828
1^2 m ZV71C 0.6383 0.6430 0.64070.2422
Mean 0.7625 0.7611 Grand Mean0.7618
Mean Response (Reladve Humidity)
(RHj -RHj )0.0014
297K 29 IKM * 21 J /h r - c m '
L, - 0.69 clo■irw
3 2.5
a. 2.0
1.5
1.0
0.5
0.08565 70
Relative Humidity (%)
75 8060
Figure 6.23 Stuffy Environmental Conditions
R eproduced with perm ission of the copyright owner. Further reproduction prohibited without perm ission.
But the stress level increases when a higher level o f air temperature (315K) is introduced.
These increases are called the simple effect o f relative humidity. On the other hand, for
the higher air temperature, the stress level decreased from 2.0497 to 0.4707 J/sec/K at rel
ative humidity level o f 10% and it decreased from 1.1012 to a value of 0.5668 J/sec/K with
the higher relative humidity of.90%. The mean response, i.e., the difference between the
average effects at two levels of relative humidity (0.4262 J/sec/K), is called the main effect
of relative humidity. Similarly, the main effect for air temperature is 1.0567 J/sec/K. The
grand mean response which is average o f all four stress responses is 1.0471 J/sec/K for
extreme environmental conditions outside o f comfort zone (see Table 6.1). The degree of
interaction between two factors (air temperature and relative humidity) that affect the
overall thermal stress responses is shown in Fig. 6.19. Figure 6.19 graphs the thermal
stress response against one factor (relative humidity) for two levels of the second factor
(air temperature). Nonparallel or skewed or intersecting lines would indicate some inter
action between the two factors. Figure 6.19 indicates that there is interaction between air
temperature and relative humidity that affects the thermal behavior or stress response in
this case o f extreme ambient conditions. However, the straight lines represent the relation
ship between the pairs o f points and cannot be interpolated to obtain the OTSR.
Case (ii): Threshold Environmental Conditions
Table 6.2 shows the thermal stress response to threshold environmental conditions
which lie within the comfort zone o f the ASHRAE comfort chart [7]. A closer examina
tion reveals that there is no change in stress response when relative humidity increases
from 20% to 80% for an air temperature of280K. While, there is a slight increase in stress
response from 0.2883 to 0.3184 J/sec/K for an air temperature of 31 OK. On the other
R eproduced with perm ission of the copyright owner. Further reproduction prohibited without perm ission.
115
hand, for a relative humidity of 20%, the stress response decreases for increase in air tem
perature to 3 10K. The same trend is observed for a relative humidity of 80%. Regarding
the main effects, the relative humidity has very little influence on individual stress
response (-0.0138 J/sec/K) in the comfort zone. However, air temperature does show a
significant effect on thermal stress response (0.9854 J/sec/K). The grand mean thermal
stress response, which is the average o f all four stress responses, decreases from 1.0471 in
Case (i) to 0.7960 J/sec/K for this case. It is observed from Fig. 6.20 that the lines are
almost parallel which indicates that there is not much interaction between the two factors
(RH and Ta;r). Lack o f interaction is attributed to the fact that the imposed environmental
conditions are within the comfort zone.
Case (iii): Mild Environmental Conditions
When mild environmental conditions (30% and 290K; 70% and 305K) are introduced,
the level o f grand mean thermal stress response decreases from 0.7960 in Case (i) to
0.6869 J/sec/K for this case. Once again, it is observed that the main effect of the relative
humidity is negligible (-0.0003 J/sec/K). However, air temperature still maintains its sig
nificant main effect with a value o f 0.4968 J/sec/K, but lesser than those in Cases (i) and
(ii). Table 6.3 and Fig. 6.21 show the human thermal response behavior. The interaction
between the air temperature and relative humidity is found to be insignificant as shown by
parallel lines in Fig. 6.21.
Case (iv): Comfortable Environmental Conditions
In the comfort zone, environmental conditions range from 40% to 60% RH and 294K
to 300K air temperature. The grand mean thermal stress response reduces from 0.6869 in
Case (iii) to 0.6394 J/sec/K for this case. The main effect o f relative humidity is negligi
R eproduced with perm ission of the copyright owner. Further reproduction prohibited without perm ission.
116
ble, while that of air temperature decreases from 0.4968 in Case (iii) to 0.1246 J/sec/K.
The thermal stress responses are shown in Table 6.4 and Fig. 6.22. From Fig. 6.22, it is
clear that there is no interaction between the two environmental factors.
Case (v): Stuffy Environmental Conditions
According to Grandjean [18], the threshold at which the room begins to feel stuffy lies
between the pairs o f environmental factors, such as 80% RH at 29IK and 60% RH at
297K. The simulations were conducted for these pairs of conditions. The results are
shown in Table 6.5 and Fig. 6.23. The grand mean stress response increases from comfort
value of 0.6394 in Case (iv) to 0.7618 J/sec/K for this case. The main effect of relative
humidity is still insignificant, while that o f air temperature shows a marked increase in its
value from 0.1246 in Case (iv) to 0.2422 J/sec/K. From Fig. 6.23, slightly nonparallel
lines indicate very little interaction between the environmental factors.
In order to observe the main effects o f environmental factors and grand mean thermal
stress responses, Fig. 6.24 is constructed for five different cases showing the overall trend
in human thermal behavior for five different cases. On abscissa, five cases are numbered
from one to five. The objective thermal stress responses to the main effects o f environ
mental factors and grand mean response are marked on the ordinate. It is clear from Fig.
6.24, that the grand mean thermal stress response decreases in its value as the environmen
tal factors (RH and Ta;r) gradually shift to the comfort zone as defined in ASHRAE com
fort chart [7]. This gradual decrease occurs upto Case (iv), numbered 4 on abscissa.
Then, there is slight increase in grand mean thermal stress response value for Case (v),
number 5 on abscissa. The main effect o f air temperature shows a clear trend with envi
ronmental conditions upto Case (iv) and increases slightly for Case (v), which represents
R eproduced with perm ission of the copyright owner. Further reproduction prohibited without perm ission.
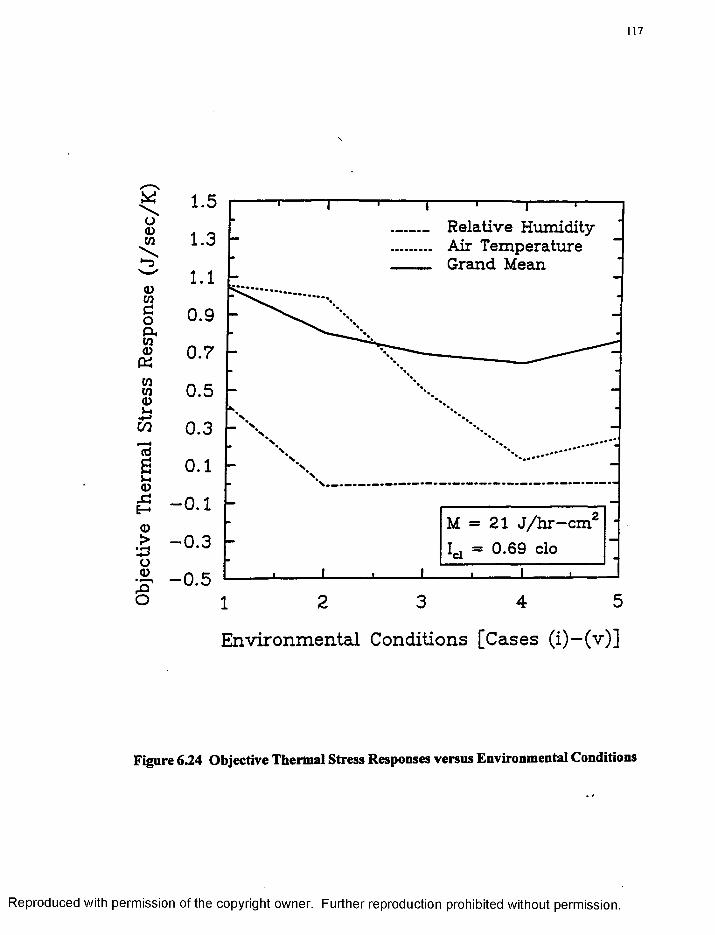
Obj
ecti
ve
The
rmal
St
ress
R
espo
nse
(J/s
ec/
K)
117
1.5Relative Humidity- Air Temperature Grand Mean
1.3
0.9
0.7
0.5
0.3
- 0.1M = 21 J /h r—cm'
532 41
E n v ir o n m e n ta l C o n d it io n s [C a s e s ( i ) - ( v ) ]
Figure 6.24 Objective Thermal Stress Responses versus Environmental Conditions
R eproduced with perm ission of the copyright owner. Further reproduction prohibited without perm ission.
118
stuffy conditions. However, the relative humidity shows its significance in Case (i) which
is an extreme environmental condition. Later, relative humidity becomes almost insignifi
cant upto Case (v), indicating gradual transition to comfort zone.
So far, it has been observed that the thermal stress response value is quite sensitive to
changes in environmental conditions. It provides a global measure o f activeness or ther
mal discomfort in the body. Thus, it is a valuable parameter that could be used to obtain
human thermal stress in the form o f a single summative number. Now, the biggest chal
lenge is to establish the value o f thermal stress response for an optimum comfortable envi
ronmental condition. Once an optimum value o f thermal stress corresponding to comfort
level is established, then it becomes easier to demonstrate the deviation in comfort level
from the equilibrium condition. This is demonstrated in Sec. 6.4 through the thermal
stress level monitoring technique using an Objective Thermal Stress Index (OTSI)
which is derived from Objective Thermal Stress Responses as illustrated in Sec. 5.2.
6.4 Thermal Stress Level Monitoring Using an Objective Thermal Stress Index (OTSI)
In this section, three different computer simulation studies are conducted to examine
the pattern o f human thermoregulatory behavior under different conditions. All three sim
ulation studies cover the entire spectrum o f environmental conditions ranging from most
comfortable to extreme hot and cold. The feasibility o f incorporating the concept o f OTSI
in human-machine systems for optimal human performance and safety is closely exam
ined through the validation o f Objective Thermal Stress Index. In order to establish the
optimum comfort level or equilibrium condition, one-hour simulation is performed for a
R eproduced with perm ission o f the copyright owner. Further reproduction prohibited without perm ission.
119
nude body at 50% RH and 75 ° F air temperature which corresponds to standard ASHRAE
operating conditions [15]. In this comfort simulation, the steady-state response at the end
of simulation is chosen as the Objective Thermal Stress Response (0.731841 J/sec/K) that
corresponds to the thermal equilibrium or homeostasis in the human body. Further, all
transient objective thermal stress responses obtained for other conditions are expressed as
percentage deviations from this comfort or equilibrium value. The results from three dif
ferent simulation studies are described in detail.
6.4.1 Effects of Relative Humidity and Clothing on Thermal Stress Level
In this study, all simulations conducted were of forty-minute period for a clothed
human in comfortable conditions. The purpose o f these simulations is to examine the
effects of changing relative humidity and clothing on thermal stress. Figure 6.25 shows
the influence o f different relative humdities on variation o f the OTSI which is a measure of
thermal stress level. It has been observed that the relative humidity does not have signifi
cant effect on the human thermal stress response for a given air temperature of 294.26K,
sedentary activity, and medium clothing of thermal resistance value 0.69 clo. It is con
cluded that the range of 30-70% RH lies in the comfort zone o f ASHRAE comfort chart
[15]. Thus, it is noted from Fig. 6.25 that there is negligible thermal discomfort in this
range which is indicated by OTSI quantitatively approximately ranging from -1% to +7%.
Figure 6.26 shows the effect of different clothing types on variation of the OTSI for a
given air temperature o f 294.26K, 30% RH, and sedentary activity level o f 21 J/hr-cm2.
The OTSI does indicate a small deviation from comfort level which is well within 10%
for light (Ici = 0.21 clo), medium (Ici = 0.69 clo), and heavy (Ic[ = 1.72 clo) clothing types.
R eproduced with perm ission of the copyright owner. Further reproduction prohibited without perm ission.
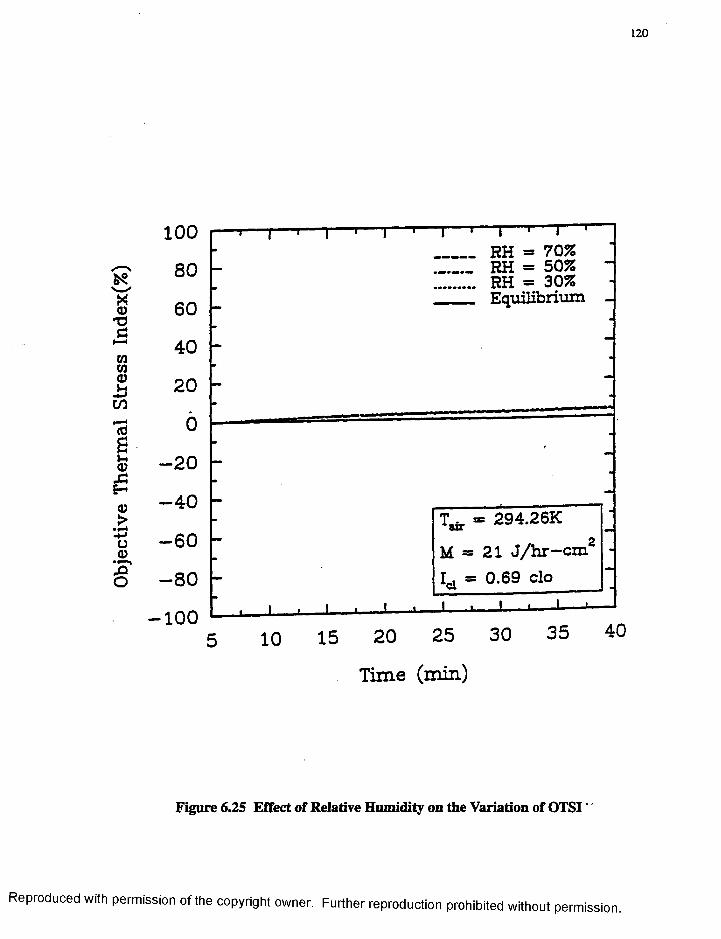
Obj
ecti
ve
The
rmal
St
ress
In
dex
(%)
100
80
60
40
20
0
-2 0
- 4 0
- 6 0
- 8 0
■ io°5 10 15 20 25 30 35 40
T im e (m in )
Figure 6.25 Effect of Relative Humidity on the Variation of OTSI''
T 1----- 1----- 1----- 1----- 1----- »----- 1----- 1----- 1 1 ! 1 RH = 70% RH = 50% * RH = 30% Equilibrium _
, i ■ i ■ i ■ i i 1 — i----- 1------1
T-i- - 294.26KBu
M = 21 J /h r -c m 2 1 ̂ * 0.69 clo
R eproduced with perm ission o f the copyright owner. Further reproduction prohibited without perm ission.
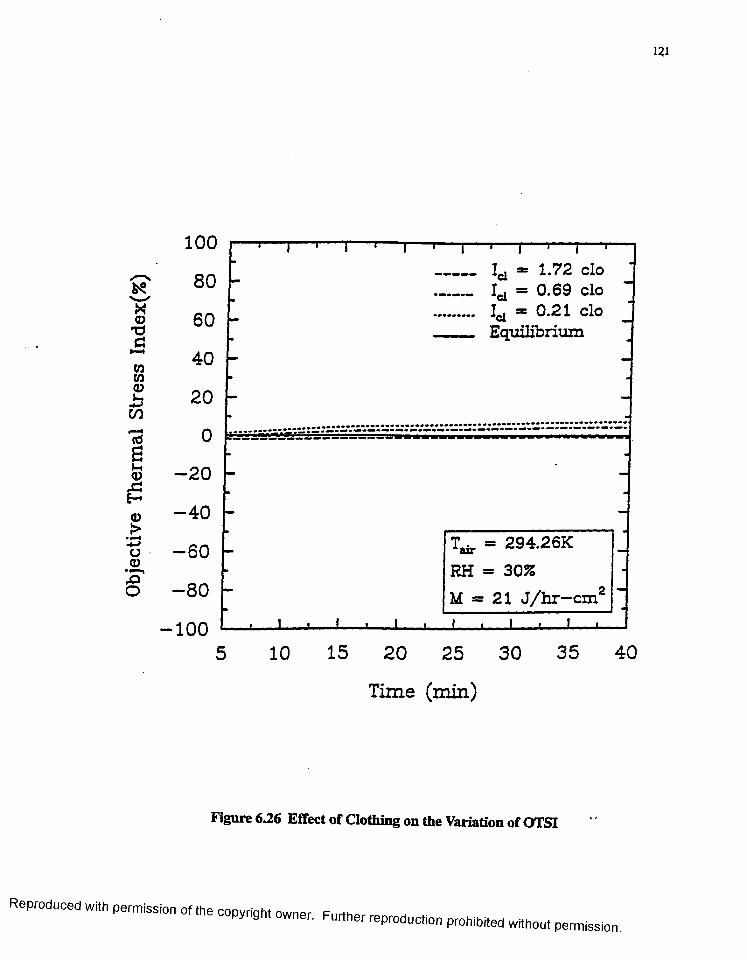
121
R eproduced with
Vo
T3dt—t030303
-bC/3
*r3f i)-l03
XJE-*(13> •t—i -*-> C3 03
"fO1O
100
80
60
40
20
0
- 2 0
- 4 0
- 6 0
- 8 0
-100
I* = 1.72 clo 1 ̂ = 0.69 clo 1 ̂ = 0.21 clo
Equilibrium
* 294.26K RH = 30%M = 21 J /h r - c m 2
10 15 20 25 30 35
T im e (m in )
40
Figure 6.26 Effect of Clothing on the Variation of OTSI
perm ission o „ he copyrfcn, „w nei, Flll1her ^
122
It is concluded that for the given physical conditions (Tair = 294.26K, RH = 30%, and M =
21 J/hr-cm2), the clothing does not cause any significant change in the value of OTSI and
thus in thermal discomfort.
6.4.2 Thermal Stress Monitoring in Comfort Conditions
The computer simulations were conducted for a period of one hour for a clothed
human in comfortable environmental conditions. The effects of varying air temperatures
for different relative humidities 'on human thermal stress level are examined. Figure 6.27
shows the human thermal response in terms o f OTSI to different air temperatures ranging
from 286K to 308K for a given relative humidity of 30%, sedentary activty (M = 21 J/hr-
cm2), and medium clothing ensemble (Ic| = 0.69 clo). It is observed that there is signifi
cant deviation in human thermal stress response from the equilibrium or homeostasis con
dition. Cool air temperature (286K) produces deviation in the negative direction, starting
from approximately - 30% to about -47% towards the end of the 60th minute.
As the air temperature is increased to 29IK, the deviation from the equilibrium condi
tion reduces starting from about -10% to -18%. As the air temperature continues to
increase, thermal discomfort shifts from the equilibrium in the positive direction. It is
concluded that warmer air temperatures produce deviations in positive direction, while the
cooler air temperatures produce shifts in the negative direction from the thermal equilib
rium of the body. Also, it is noticed that OTSI indicates a sudden change in thermal stress
level at 25th and 45th minutes for air temperatures 286K and 29IK, respectively. This is
mainly attributed to the onset o f heat production due to shivering which contributes to the
increase o f entropy generation.
R eproduced with perm ission of the copyright owner. Further reproduction prohibited without perm ission.
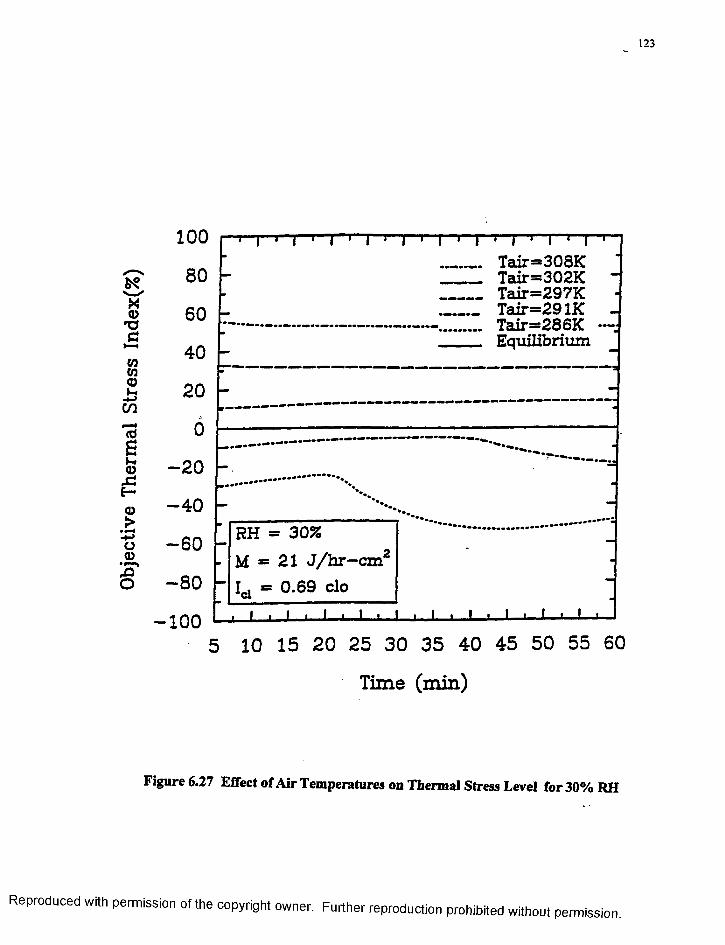
Obj
ecti
ve
The
rmal
St
ress
In
dex(
%)
123
100
80
60
40
20
0
-2 0
- 4 0
- 6 0
- 8 0
-1 0 05 10 15 20 25 30 35 40 45 50 55 60
T im e ( m in )
Figure 6.27 Effect of Air Temperatures on Thermal Stress Level for 30% RH
1 ! i i 1 *i 1 i 1 i r r ~»~ r t ~ i »• i'"1 ) 1 Tair=308K ' Tair=302K “ Tair=297K - Tair=291K -
-------------------------------- ------- Tair=286K —: Equilibrium
* RH = 30%- M = 21 J /h r -c m 2 -
1 ̂ = 0.69 clo• I » 1 . ! » I . I . I ■ I » l - i l..i.
R eproduced with perm ission of the copyright owner. Further reproduction prohibited without perm ission.
124
Figures 6.28 and 6.29 show a similar pattern of human thermoregulatory behavior for
50% and 70% relative humidities respectively. Thus, in the range of 30 to 70% relative
humdity, it is established that the human body responds to environmental stressors in a
regular pattern as demonstrated in Figs. 6.27 through 6.29. However, with regard to the
effect o f air temperature, the deviations represented by OTSI are quite significant. Thus,
air temperature is a very important factor that influences the thermal stress or comfort.
6.4.3 Thermal Stress Monitoring in Extreme Hot and Cold Environments
Simulations were conducted for a period of one hour for a sedentary clothed human in
extreme ambient conditions. The effects o f cold (273.15K) and hot (316.48K) air temper
atures for 10% and 90% relative humidities are examined. It is observed from Fig. 6.30
that for a 10% RH, the deviations from the thermal equilibrium are quite significant indi
cating cold and heat stress for 273.15K and 316.48K air temperature respectively. Figure
6.31 indicates a similar thermal response pattern for 90% RH, although there is a small
change in the magnitude o f deviation for heat stress. Further, it is noticed that there is an
onset o f shivering at the 10th minute which is seen in both Figs. 6.30 and 6.31 for 273.15K
air temperature. Thus, OTSI can be used to quantify the effects of extreme heat and cold
on mental workload.
6.4.4 Validation of Objective Thermal Stress Index (OTSI)
The Objective Thermal Stress Index (OTSI) is validated by comparing with subjective
responses of the human subjects who were exposed to the similar environmental condi
tions. Large scale experimental studies conducted by Rohles and Nevins [16] and Rohles
[17] on 1600 college-age students have revealed statistical correlations between comfort
R eproduced with perm ission o f the copyright owner. Further reproduction prohibited without perm ission.
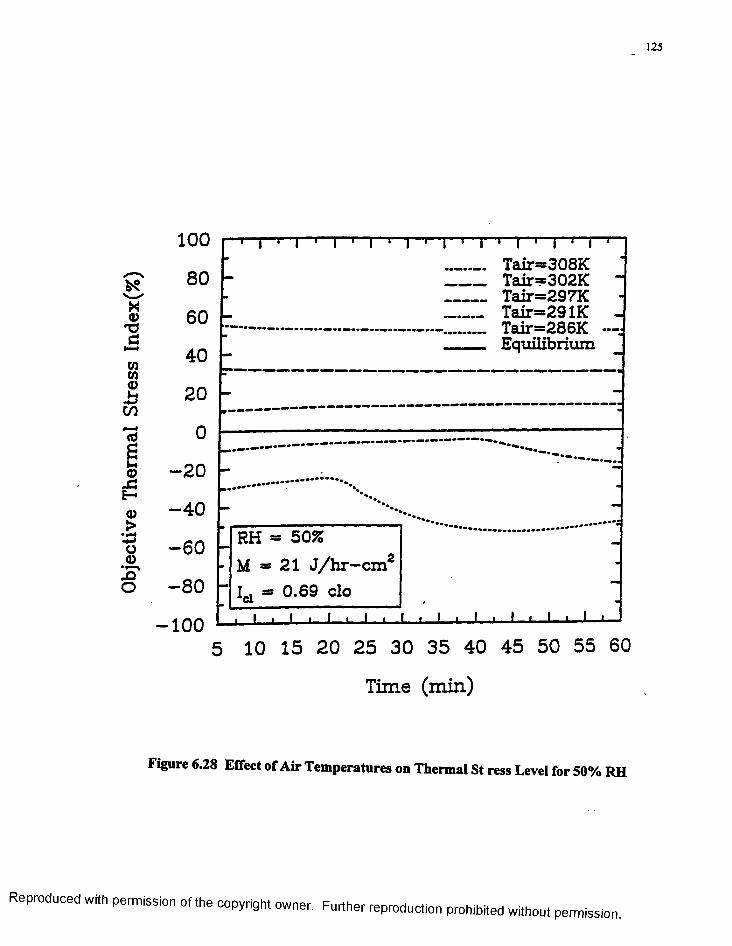
Obj
ecti
ve
The
rmal
St
ress
In
dex(
%)
125
100
80
60
40
20
0
-2 0
- 4 0
- 6 0
- 8 0
-1 0 05 10 15 20 25 30 35 40 45 50 55 60
T im e (m in )
Figure 6.28 Effect of Air Temperatures on Thermal St ress Level for 50% RH
1 J 1 I 1 ! 1 I 1 1 ' I 1 1 1 1 1 1 1 I 1 Tair=308K ' Tair=302K - Tair=297K ■ Tair=291K -
---------------------------------------- Tair—286K — Equilibrium
RH = 50%- M - 21 J /h r - c m 2 •
ici ® ci° # m■ i > I i i U . 1 . 1 I 1 I 1 I .1 I— ■— I— i— I— l
R eproduced with perm ission o f the copyright owner. Further reproduction prohibited without perm ission
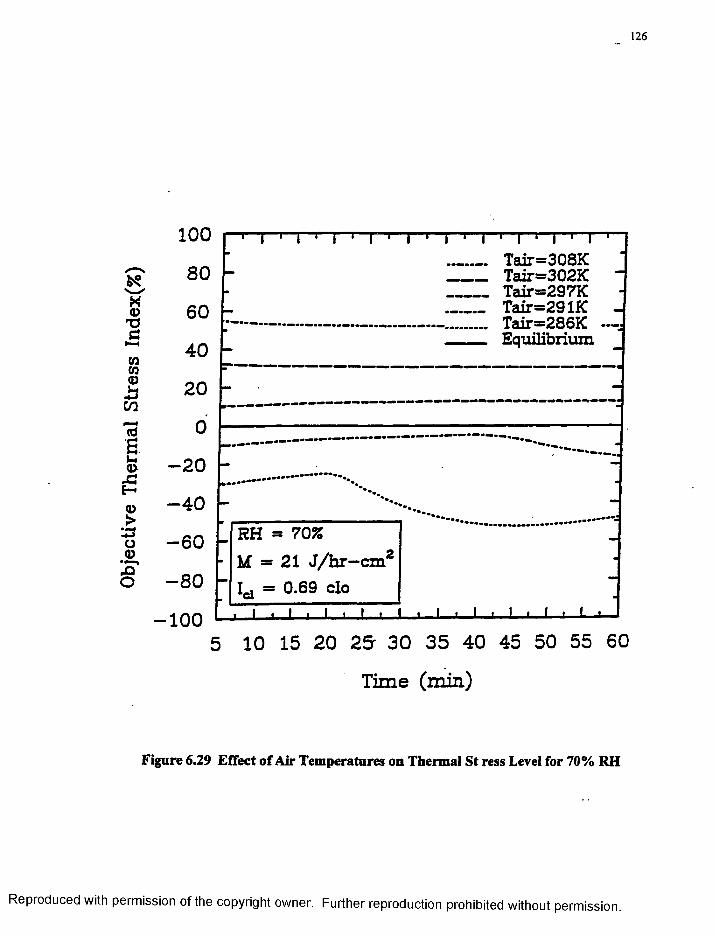
Obj
ecti
ve
The
rmal
St
ress
In
dex(
%)
126
100
80
60
40
20
0
-20
- 4 0
- 6 0
- 8 0
-1 0 05 10 15 20 2& 30 35 40 45 50 55 60
T im e ( m in )
Figure 6.29 Effect o f Air Temperatures on Thermal St ress Level for 70% RH
l ’ T ^ T 1 I ' l 1 Tair=308K Tair=302K Tair=297K Tair=291K
____ Tair=286K - Equilibrium
I i I i. I -i—L
RH = 70%M = 21 J /h r —cm' 1^ = 0.69 clo' > « i ■ i i i t
R eproduced with perm ission of the copyright owner. Further reproduction prohibited without perm ission.
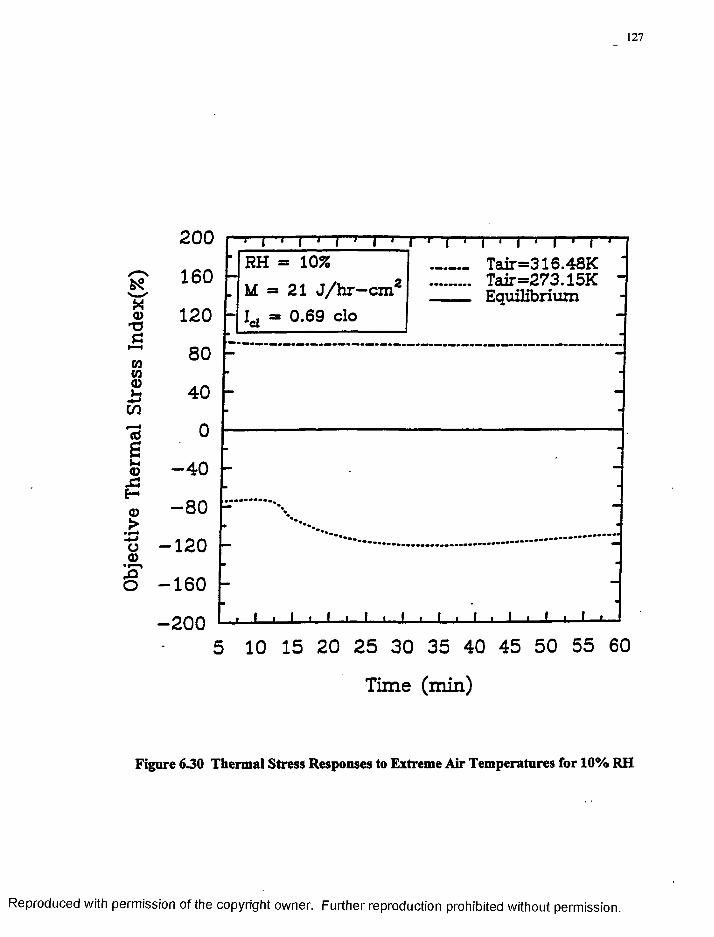
127
200RH = 10%M = 21 J /h r —cm' L, = 0.69 clo
Tair=316.48K ‘Tair=273.15K “ Equilibrium
160
120
80
40to
- 4 0
- 8 0
o - 1 2 0
o -1 6 0
20 25 30 35 40 45 50 55 60
T im e (m in )
Figure 6.30 Thermal Stress Responses to Extreme Air Temperatures for 10% RH
R eproduced with perm ission o f the copyright owner. Further reproduction prohibited without perm ission.
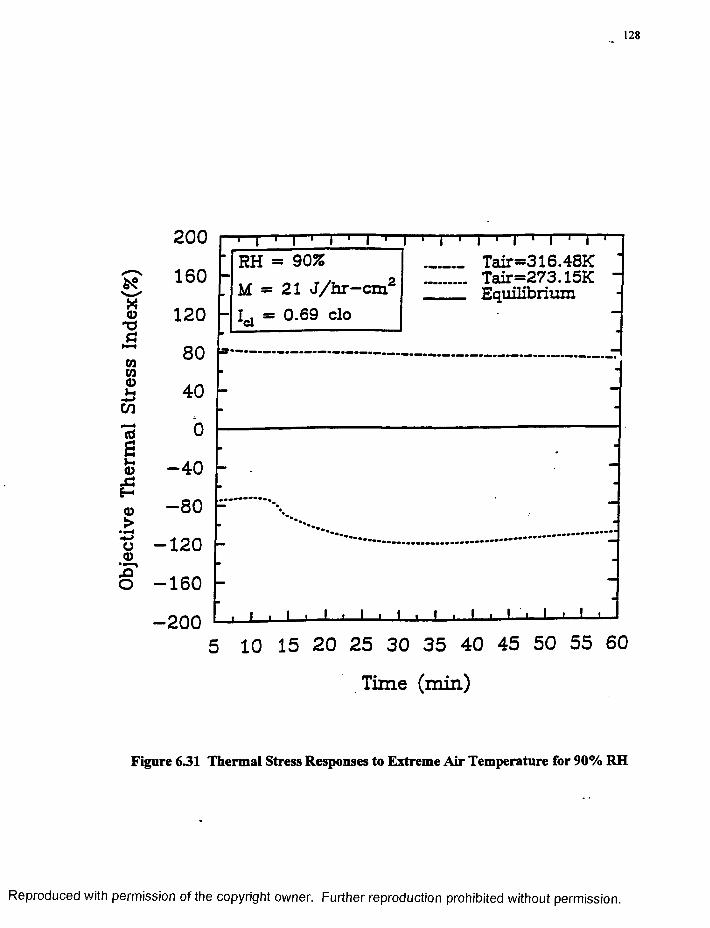
128
200Tair—316.48K ' Tair=273.15K - Equilibrium
RH = 90%U - 21 J /h r - c m 1160
120
80
40
- 4 0E-
- 8 0
-1 2 0
O - 1 6 0
-2 0 020 25 30 35 40 45 50 55 60
T im e ( m in )
Figure 631 Thermal Stress Responses to Extreme Air Temperature for 90% RH
R eproduced with perm ission o f the copyright owner. Further reproduction prohibited without perm ission.
129
level, temperature humidity, sex, and length o f exposure. The regression equation used in
this validation is obtained from [7]. This equation is as follows:
PMV = 0.245 (Tair) + 0.248 (Pvap) - 6.475
Where, PMV = Predicted Mean Vote (on Thermal Sensation)Ta;r = Air Temperature (° C) = Mean Radiant Temperature (Tmrt)Pvap - Vapor Pressure (kPa)
This equation is valid for both adult men and women subjects with sedentary activity
(M = 21 J/hr-cm2) and wearing medium clothing (approximately Ic| = 0.50 clo), and
exposed for one hour to air velocities less than 0.2 m/sec. The thermal sensation scale
used in this equation is referred to as the ASHRAE thermal sensation scale and is the same
as the PMV scale developed by Fanger [2]. This scale is as follows:
+ 3 Hot + 2 Warm + 1 Slightly Warm
0 Neutral -1 Slightly Cool - 2 Cool -3 Cold
In the actual experiments [7,16, & 17], the subjects were asked to vote at every thirty-
minute interval on their thermal sensation or comfort level and their mean votes were con
sidered for assessing the thermal environment. In order to be consistent with the experi-
menatal studies, OTSI values at 30th and 60th minutes were chosen and their mean value
was taken for comparison with the PMV obtained from the regression equation. Table 6.6
shows that there is a significant correlation between OTSI and PMV which is expressed
quantitatively with the help o f coefficient o f correlation (or Pearson Correlation Coeffi
cient). The values o f coefficient o f correlation were found to be equal to 0.9913, 0.9906,
R eproduced with perm ission o f the copyright owner. Further reproduction prohibited without perm ission.
130
and 0.9900 for 30%, 50%, and 70% relative humditites respectively for air temperatures
ranging from 286K to 308K. The value o f correlation coefficient closer to +1 indicates
that there is a linear variation between OTSI and PMV which is shown in Fig. 6.32 for
comfort conditions. Further, Table 6.7 shows that the value of correlation coefficient
equals +1.0 for both 10% and 90% relative humdities for 273.15K. and 316.48K. air tem
peratures respectively. The linear variation between OTSI and PMV for extreme environ
mental conditions is shown in Fig. 6.33. It is well established that there is a strong
correlation between the OTSI and PMV which demonstrates that OTSI can be used as a
valid parameter to quantify thermal stress or discomfort in the optimal design o f human-
environment systems. Finally, OTSI acts as an ecological parameter that quantifies the
human-environment interaction.
6.4.5 Objective Thermal Sensation Scale (OTSS)
The OTSI combines the human thermal responses and environmental factors to
express thermal stress in terms o f a single summative number. Thus, by measuring the
thermal stress, OTSI provides an objective measure o f drain in attentional resources and
reduction in vigilance capability, thus providing a quantitative methodology to prove the
attentional theory o f performance under stress developed by Hancock [51].
As a result o f series o f simulations that were conducted and shown in Figs. 6.25
through 6.31, an optimal functioning chart as shown in Fig. 6.34 is developed correspond
ing to the values o f Objective Thermal Sensation Scale (OTSS) presented in Table 6.8.
Figure 6.34 is developed on the basis o f excellent correlation between objective and sub
jective scales demonstrated in the previous Sec. 6.4.4. This optimal functioning chart is
R eproduced with perm ission of the copyright owner. Further reproduction prohibited without perm ission.
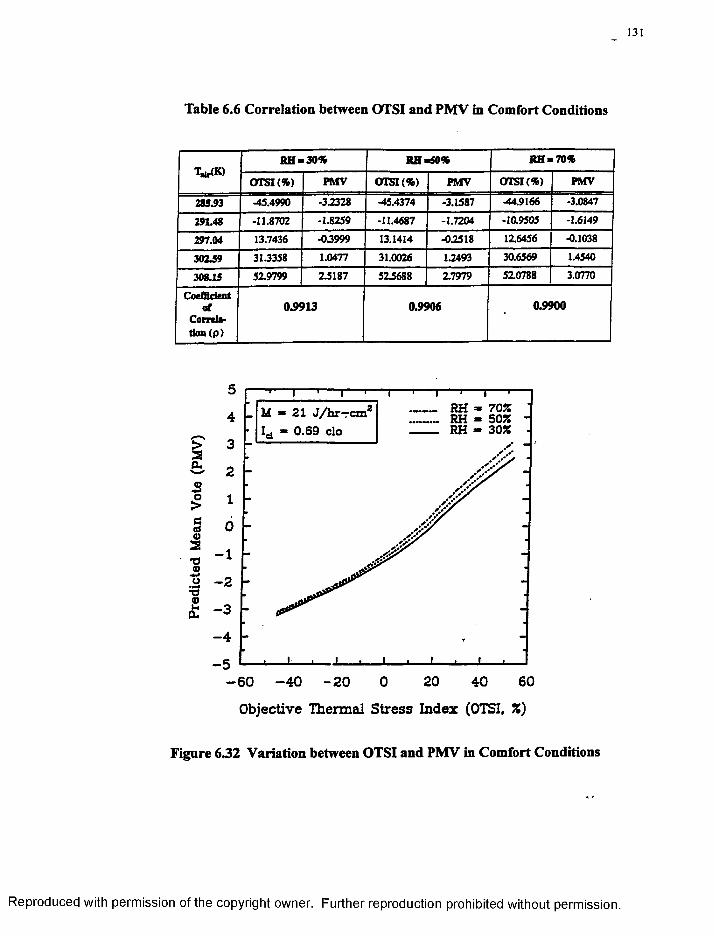
131
Table 6.6 Correlation between OTSI and PMV in Comfort Conditions
TW<K)R H -309ft 8H -509ft R H -709ft
OTSI (96) PMV OTSI (96) PMV OTSI(%) PMV
285.93 -45.4990 -32328 -45.4374 -3.1587 -44.9166 -3.0847
291.48 -11.8702 -1.8259 -11.4687 -1.7204 -10.9505 -1.6149
297.04 13.7436 -03999 13.1414 -02518 126456 -0.1038
30259 31.3358 1.0477 31.0026 12493 30.6569 1.4540
308.15 52.9799 25187 525688 27979 520788 3.0770
Coefficientof
Correia*tfam(p)
0.9913 0.9906 0.9900
RH - 70 % RH - 50% RH - 30%
M — 21 J / h r —cm" Id ” 0 .69 clo
O.
3
§v2■a®o•34)b.
CL
- 4
- 6 0 - 4 0 - 2 0 0 20 40 60
Objective Thermal Stress Index (OTSI, %)
Figure 632 Variation between OTSI and PMV in Comfort Conditions
R eproduced with perm ission of the copyright owner. Further reproduction prohibited without perm ission.
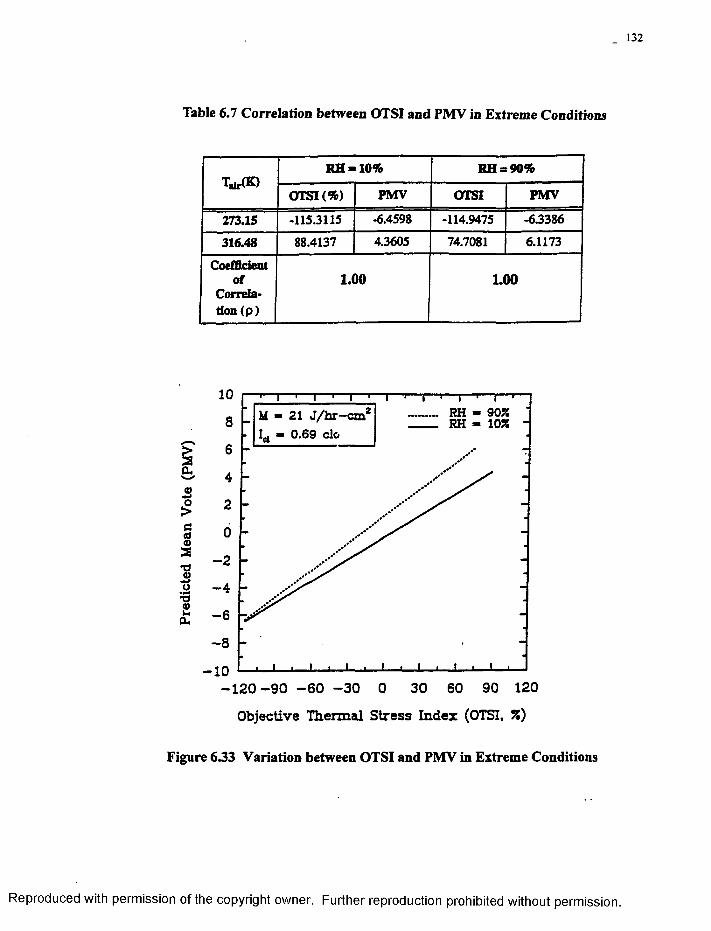
132
Table 6.7 Correlation between OTSI and PMV in Extreme Conditions
TafrfK)RH = 10% RH = 90%
OTSI(%) PMV OTSI PMV
273.15 -115.3115 -6.4598 -114.9475 -63386
316.48 88.4137 4.3605 74.7081 6.1173
Coefficient of
Correlation (p)
1.00 1.00
RH - 90J5 RH - 10%M » 21 J /h r -c m '
L, - 0.69 clo
O.
5£§(U2 - 2
- 8
-1 0- 1 2 0 - 9 0 - 6 0 - 3 0 0 30 60 90 120
Objective Thermal S tress Index (OTSI, %)
Figure 633 Variation between OTSI and PMV in Extreme Conditions
R eproduced with perm ission of the copyright owner. Further reproduction prohibited without perm ission.
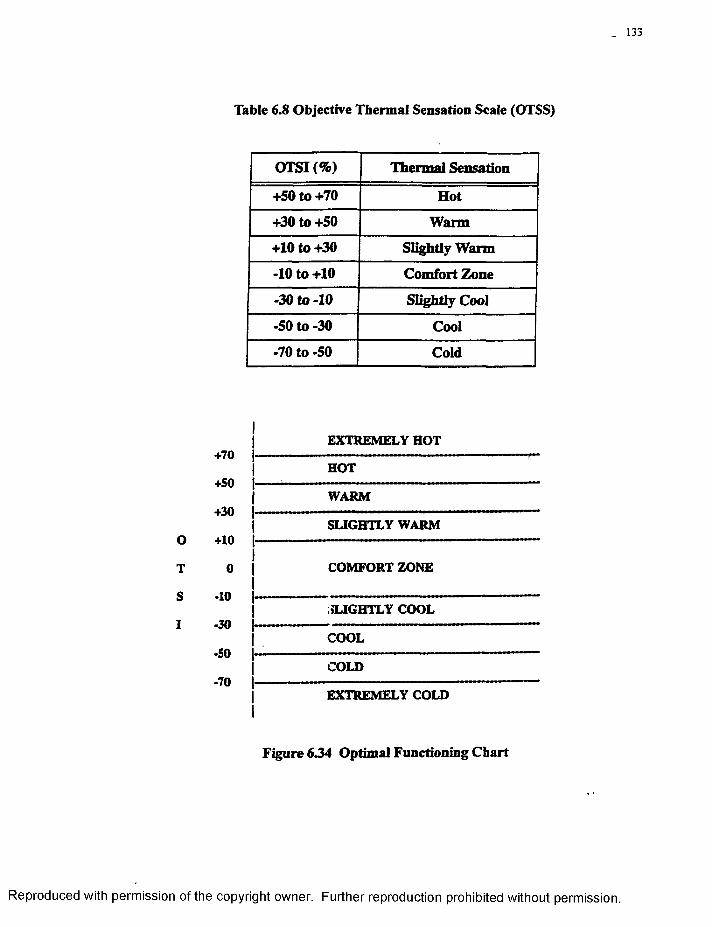
Table 6.8 Objective Thermal Sensation Scale (OTSS)
OTSI (%) Thermal Sensation
+50 to +70 Hot
+30 to +50 Warm
+10 to +30 Slightly Warm
-10 to +10 Comfort Zone
-30 to -10 Slightly Cool
-50 to -30 Cool
-70 to -50 Cold
+70
+50
+30
0 +10
T 0
S -10
1 <30
•50
-70
Figure 634 Optimal Functioning Chart
EXTREMELY HOT
HOT
WARM
SLIGHTLY WARM
COMFORT ZONE
;>LIGHTLY COOL
COOL
COLD
EXTREMELY COLD
R eproduced with perm ission of the copyright owner. Further reproduction prohibited without perm ission.
134
valid for a sedentary (M = 21 J/hr-cm2) clothed (Ic| = 0.5 to 0.69 clo) human for relative
humdities ranging from 10% to 90% and air temperatures from 273.15K. to 316.48K. The
OTSS is symmetrical around the zero point, so that a positive value corresponds to the
warm side and a negative value to the cold side. However, any value beyond +70% or -
70% means that the individual is experiencing severe discomfort due to extreme hot or
cold environmental conditions and this zone must be avoided at all cost for human safety.
The optimal functioning chart provides the region o f operation in the environmental
control systems to keep the thermal stress in the comfort zone for optimal human perfor
mance and safety. This would facilitate to improve the attentional and vigilance capabili
ties o f the human operators and thus contribute to the design and development o f "human"
centered environmental systems.
6.5 Mental Stress Level Monitoring Using an Objective Mental Stress Index (OMSI)
This section is mainly dedicated to examine the effects o f mentally stressful and infor
mation processing vigilance tasks on physiological responses. In this regard, an Objective
Mental Stress Index (OMSI) is derived from the Maxwell relations o f thermodynamics
which is discussed in detail in Sec. 5.4. This objective measure is used to indicate the
level o f mental stress as a function of physiological responses controlled by autonomic
nervous system (ANS) such as blood pressure, heart rate, oral body temperature, and skin
temperature. Further, the OMSI provides a thermodynamic and mathematical relationship
between thermal responses (body and skin temperature) and cardiovascular responses
(blood pressure and heart rate). In Sec 6.5.1, effects o f a mentally stressful situation such
R eproduced with perm ission of the copyright owner. Further reproduction prohibited without perm ission.
135
as an examination on physiological responses o f a group of students is investigated. Later,
in Sec. 6.5.2, a moment-to-moment stress level monitoring technique during vigilance
tasks is demonstrated. Finally, the OMSI is validated for its utility as a measure o f clinical
stress in Sec. 6.5.3.
6.5.1 Effect of Mentally Stressful Tasks on Physiological Responses
The effect of a mentally stressful situation such as a final examination on the physio
logical responses (blood pressure, heart rate, and oral body temperature) is examined. The
Objective Mental Stress Index (OMSI) represented by Eq. (5.4) is used to indicate the
objective measure of stress level experienced by individuals as a result of mental stress in
terms o f physiological responses. The purpose of this study is to investigate the pattern of
these physiological responses and interrelationship using OMSI.
The data for verifying this biothermodynamic approach was obtained from an existing
experimental study conducted by Mital and Mital [6]. In this study, fourteen male stu
dents o f 18-21 years o f age and 59-114 kg o f body weight, and nine female students o f 18-
20 years o f age and 50-68 kg o f body weight voluntarily participated. All students were in
one class under one instructor. The blood pressure, heart rate, and oral body temperature
were measured three times. The first set o f measurements were taken around midway in
the semester (Condition 1 - Normal Condition). The second set o f measurements were
taken just prior to the final examination (Condition 2), and finally third set was taken
immediately after the final examination (Condition 3). All measurements were made at
approximately the same time o f the day in an air-conditioned room under the same condi
tions. The air temperature and relative humidity were approximately 25 °C and 50%,
R eproduced with perm ission of the copyright owner. Further reproduction prohibited without perm ission.
136
respectively [80]. The subjects were allowed to relax in a chair for about fifteen minutes
before any measurements were recorded.
The data were normalized by adjusting the physiological measurements under Condi
tion 2 and Condition 3 by the amount recorded under Condition 1. The data collected
under each condition were analyzed separately by performing an analysis o f variance and
multiple range test on the means. The data from the experimental study are summarized in
Table 6.9. The numerical values o f changes in physiological responses shown in Table 6.9
are used in Eq. (5.4) to obtain the value o f OMSI under conditions 2 and 3. These OMSI
values corresponding to systolic (OMSIsbp) and diastolic (OMSIdbp) f° r both males and
females are provided in the Table 6.10. The changes in each o f the physiological
responses (systolic and diastolic blood pressure, heart rate, and oral body temperature) are
also show in Figs. 6.35-6.38. It is only in Fig. 6.36 for changes in diastolic blood pressure,
a significant difference between the response of males and females is observed. The vari
ation in OMSI for both males and females is shown in Figs. 6.39 and 6.40 respectively. In
both these figures, the shift from equilibrium condition is in the negative direction and this
is attributed to decrease in oral body temperature from the normal as shown in Fig. 6.38.
However, OMSI quantitatively indicates that the stress level has considerably decreased in
reaching Condition 3 from 2. From Figs. 6.39 and 6.40, it is clear that female subjects
experienced greater stress level than the male counterparts, but females were able to return
much closer to the equilibrium than males with regard to both diastolic and systolic blood
pressures. Also, residual stress was lower in females than males.
It is demonstrated that the amount o f disorder or chaos in a human being reduces over
a period o f time after reaching a peak value depending on the nature o f mental or physical
R eproduced with perm ission of the copyright owner. Further reproduction prohibited without perm ission.
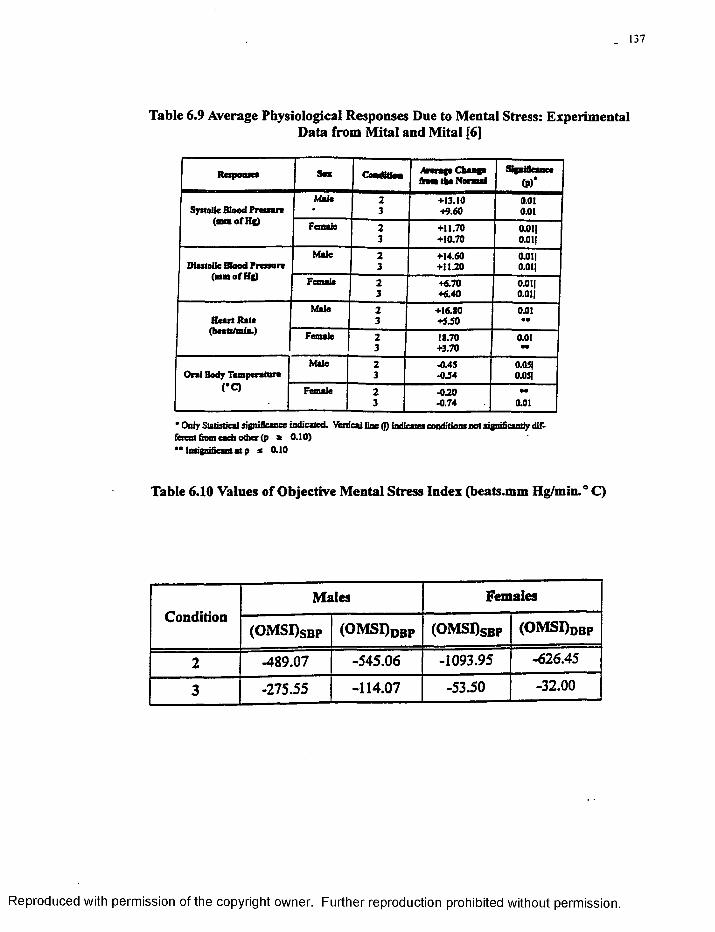
. 137
Table 6.9 Average Physiological Responses Due to Mental Stress: ExperimentalData from Mital and Mital [6]
Responses Sox Condition Arango Change (Van the Normal ft»)‘
Male 2 +13.10 0.01Systolic Blood Pressan • 3 +9.60 0.01
(nun ofHg) Female 2 +11.70 aoii3 +10.70 0.01|
Male 2 +14.60 0.0I|Diastolic Blood Pressors 3 +11.20 02)1|
(mm of Hg) Female 2 +6.70 0.01|3 +6.40 0.011
Male 2 +16.80 0.01Heart Rate 3 +5J0 «•(beats/rain.) Female 2 18.70 0.01
3 +3.70 ••
Male 2 -0.4 5 0.03]Oral Body Tempers tors 3 ■0J4 aosi
CO Female 2 -0.20 ••3 -0.74 0.01
* Only Statistical significance indicated. Vertical line 0 indicates conditions not sigmficamiy different ftom e«ch other (p a 0.10)•• Insignificant at p * 0.10
Table 6.10 Values of Objective Mental Stress Index (beats.mm Hg/min.° C)
ConditionMales Females
(OMSI)sbp (OMSI)dbp (OMSI)§bp (OMSI)DBP
2 -489.07 -545.06 -1093.95 -626.45
3 -275.55 -114.07 -53.50 -32.00
R eproduced with perm ission of the copyright owner. Further reproduction prohibited without perm ission.
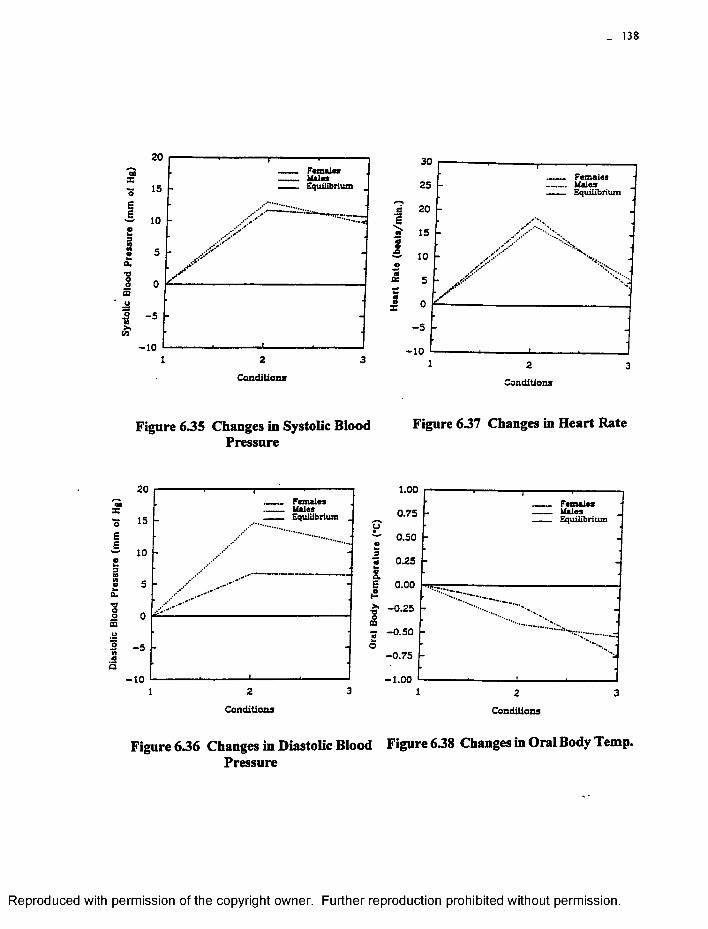
Dia
stolic
Bl
ood
Pres
sure
(m
m of
Hg)
, 138
2000zoSs
ea.•ooos01nW
1 2 3
s
l£50as
Conditions
MalesEquilibrium
onditions
Figure 635 Changes in Systolic Blood Pressure
Figure 637 Changes in Heart Rate
MalesEquilibrium
Conditions
1.00
0.75u~ 0.50
o.B£
0.25
0.00
-3 -0 .50bmo-0 .75
- 1.00
FemalesMalesEquilibrium
Conditions
Figure 636 Changes in Diastolic Blood Figure 638 Changes in Oral Body Temp. Pressure
R eproduced with perm ission of the copyright owner. Further reproduction prohibited without perm ission.
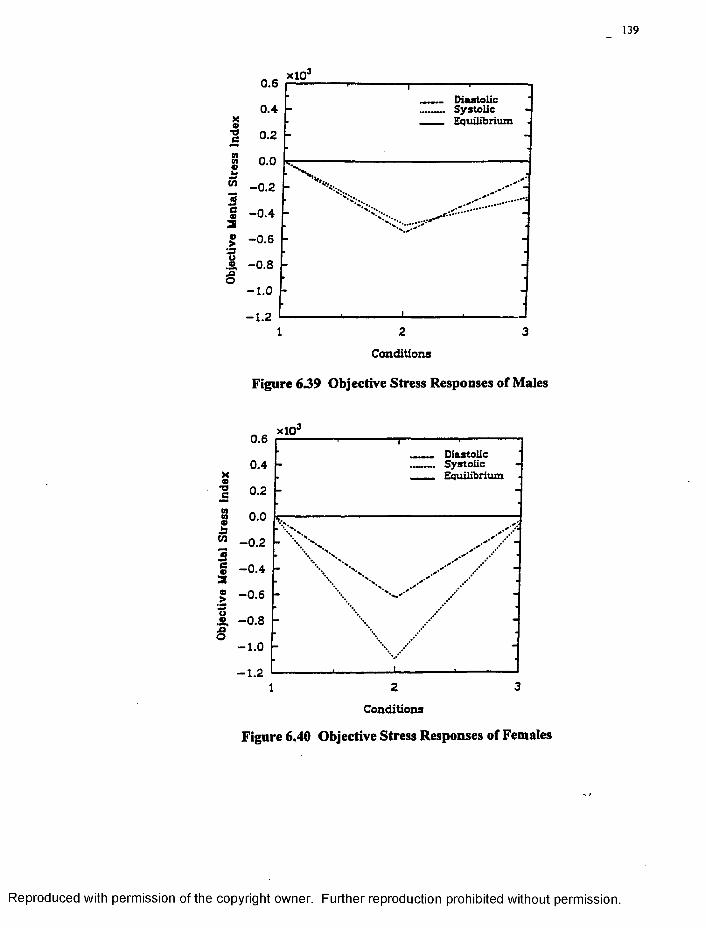
139
Xa■actoto«
aC/1
ea2a>au
•2,
0.6
0.4
0.2
0.0
- 0.2
-0.4
- 0.6
- 0.8
- 1.0
- 1.2
xlO
" N' V .
Diastolic Systolic Equilibrium
Conditions
Figure 639 Objective Stress Responses of Males
xa73e
a33tn
Gaaa>o
O
0.6
0.4
0.2
0.0
- 0.2
-0 .4
- 0.6
- 0.8
- 1.0
- 1.2
xlO
DiastolicSystolicEquilibrium
2Conditions
Figure 6.40 Objective Stress Responses of Females
R eproduced with perm ission of the copyright owner. Further reproduction prohibited without perm ission.
140
task. According to the laws o f thermodynamics, whenever a system is perturbed from its
equilibrium position, it returns to equilibrium over a period of time. In a similar manner,
human system regains its organic stability when it is perturbed from its normal state which
is nothing but the phenomenon of homeostasis. In summary, Figs. 6.39 and 6.40 accu
rately demonstrate the phenomena o f therm al and cardiovascular homeostasis.
6.5.2 M ental Stress M onitoring during Vigilance Tasks
The main purpose o f this study was to demonstrate the technique o f continuous
moment-to-moment measurement and monitoring o f mental stress during vigilance tasks.
The data is obtained from a pilot study which was conducted at the simulation laboratory
o f NASA Langley Research Center. In this study, five male and three female subjects of
18-35 years of age participated. All subjects were students who were recruited from the
local universities and colleges.
In this classic psychophysiological experiment, six measures such as Electroencepha
logram (EEG), Electromyogram (EMG), Skin Conductance, Systolic Blood Pressure,
Heart Rate, and Skin Temperature were recorded continuously using the LabVIEW data
acquisition system. The sensors for measuring the physiological responses were mounted
on the body surface o f the subjects in a systematic manner. A sensor cap was placed on
the head to permit recording o f brain wave or EEG activity. Facial muscle activity or
Frontalis EMG was measured from three sensors attached to the forehead. Skin conduc
tance was measured from sensors attached to the pads o f two fingers on the left hand.
Heart rate was recorded from pulse sensors attached to the wrist and ankle. Skin tempera
ture was measured from a small sensor taped to the back o f the middle finger o f the left
hand. The Systolic blood pressure was measured continuously from the Pulse Wave
R eproduced with perm ission of the copyright owner. Further reproduction prohibited without perm ission.
141
Velocity (PWV) technique. The PWV is the rate o f travel o f pressure pulse waves through
the arterial system [20]. This measure does not use a cuff, but obtains a reading o f time for
the pulse to occur at two points along an artery. The resulting transit time (TT) is used as
an indirect measure o f blood pressure. However, it has been found that transit time is
related to systolic but not to diastolic blood pressure. Also, other problems such as diffi
culty in calibration and sensitivity to movement artifacts limit the usefulness of this TT
technique [20]. As a result o f this difficulty in continuously measuring blood pressure,
only the blood pressure data in three out o f eight subjects in this study calibrated accu
rately against the standard cuff measurement data. Thus, the data from three subjects is
chosen to demonstrate mental stress measurement and monitoring technique.
Besides all other laboratory procedures, the actual stress monitoring session lasted for
75 minutes. During this period, subjects were allowed to relax for first fifteen minutes
while listening to a relaxation audio tape. Later, they were given a vigilance task on com
puter for 60 minutes with the interruption o f a mental arithmetic task twice for 5 minutes
each. The details o f the stress monitoring under different conditions are provided in Table
6.11. In this section, some very important psychophysiological concepts (stimulus
response specificity, individual response specificity, and autonomic balance) are demon
strated in Figs. 6.41 through 6.44.
The concept o f stim ulus response (SR) specificity refers to a patterning o f physiolog
ical responses according to the particular stimulus situation [20], The concept states that
an individual’s pattern o f physiological response will be similar in a given situation, and
that the pattern may vary when the situation is different. It is observed from Figs. 6.41-
6.43 that during the relaxation period o f first fifteen minutes, there are lot of changes that
R eproduced with perm ission o f the copyright owner. Further reproduction prohibited without perm ission.
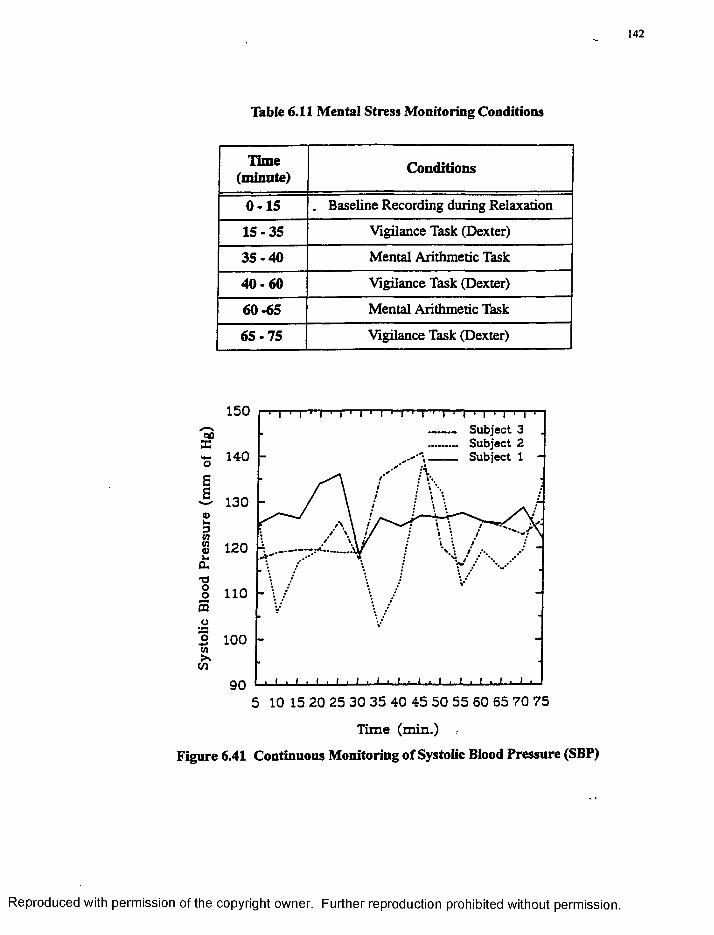
142
Table 6.11 Mental Stress Monitoring Conditions
Time(minute) Conditions
0 - 1 5 . Baseline Recording during Relaxation
15-35 Vigilance Task (Dexter)
3 5 -4 0 Mental Arithmetic Task
4 0 -6 0 Vigilance Task (Dexter)
60-65 Mental Arithmetic Task
65-7 5 Vigilance Task (Dexter)
150Subject 3 Subject 2 Subject 1
oo
140
130
120
o 110
3 100
905 10 15 20 25 30 35 40 45 50 55 60 65 70 75
Time (m in.)
Figure 6.41 Continuous Monitoring of Systolic Blood Pressure (SBP)
R eproduced with perm ission of the copyright owner. Further reproduction prohibited without perm ission.
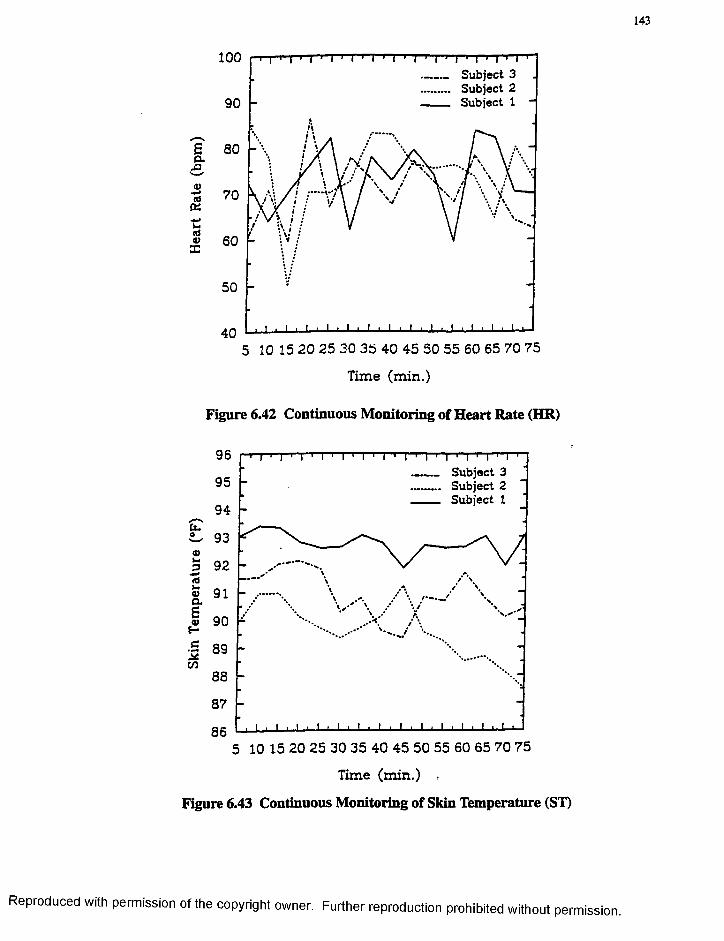
143
100Subject 3 Subject 2 Subject 190
405 10 15 20 25 30 35 40 45 50 55 60 65 70 75
Time (m in .)
Figure 6.42 Continuous Monitoring of Heart Rate (HR)
96Subject 3 Subject 2 Subject 1
95
94
<Bp 92 la| 91
I 90
•S 89 cn
88
87
865 10 15 20 25 30 35 40 45 50 55 60 65 70 75
Time (m in .)
Figure 6.43 Continuous Monitoring of Skin Temperature (ST)
R eproduced with perm ission o f the copyright owner. Further reproduction prohibited without perm ission.
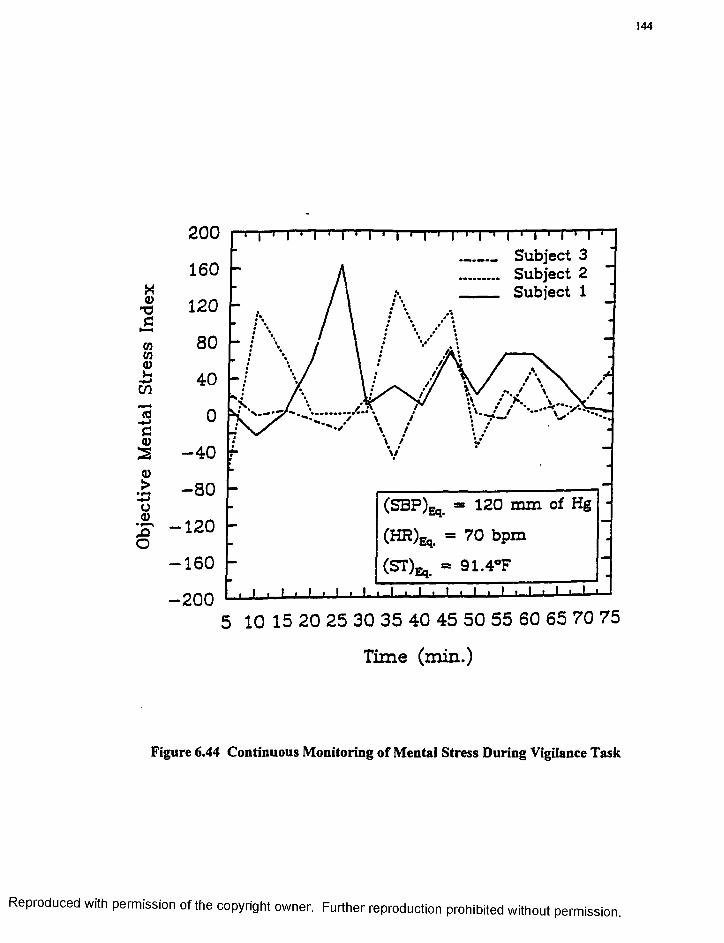
Obj
ectiv
e M
enta
l St
ress
In
dex
144
200
160
120
80
40
0
-4 0
-8 0
-120
-160
-200
< | n "1 T r ' F T -T-| r-j-1 1 i - 1 -1 1 i 1 1 1 I ~ r
____ Subject 3_____ Subject 2
A S u b j e c t 1
/ \ •* \ at a a a a• • f t • * • / 1•* \ / \
a % a • * * * »\ / •a \ \
a \ / 1( V , :
A • ----* *• t \ • ' A * / s .
v V / \, 7 \ / 4 \
• / ' \LX / \ *yr
/ / A / A \VV / / V v / / \ \
/ N s / / / v ' • \ /
i/
%y• \ / " • /■*a■
• » » / \ /* a • a
\ t Va • a • \ /
- (SBP)^. =■ 120 m m of Hg -
m ( H H ) e , . = 7 0 b p m -
— (ST)^ = 9 1 . 4 - F
. 1 . t . t . 1 . 1 . t . 1 • -I—J
5 10 15 20 25 30 35 40 45 50 55 60 65 70 75
Time (m in.)
Figure 6.44 Continuous Monitoring of Mental Stress During Vigilance Task
R eproduced with perm ission o f the copyright owner. Further reproduction prohibited without perm ission.
145
take place in three different subjects. In Fig. 6.41, systolic blood pressure for subject #1
decreases towards the end of relaxation. For subject #2, the blood pressure decreases rap
idly upto I Oth minute and increases moderately towards the end o f the 15th minute.
Finally, for subject #3, blood pressure remains uniform during the relaxation period. In
Fig. 6.42, there is a marked increase in heart rate for subjects # 2 and #3 during relaxation,
while subject #1 shows a decrease upto 10th minute and a small increase at the 15th
minute. With regard to skin temperature in Fig. 6.43, a steady increase is observed in all
three subjects during the relaxation period indicating a relaxed state. During the rest of the
monitoring session, the systolic blood pressure and heart rate fluctuate quite differently for
different subjects. Also, in Fig. 6.43, it is very clear that all three subjects show different
levels o f skin temperature variation. This clearly demonstrates the individual response
(IR) specificity. The concept of individual response specificity refers to the fact that each
subject has characteristic responses to most stimuli. In other words, it involves consis
tency o f an individual’s response hierarchy in a variety o f stimulus reactions.
It is known that the blood pressure and heart rate are controlled by parasympathetic
nervous system (PNS) while the skin temperature is under the control o f sympathetic ner
vous system (SNS). Both, PNS and SNS are subsystems of autonomic nervous system
(ANS), the details o f which are outlined in Chap. 3. The concept of autonom ic balance
examines human performance and behavior in the context o f autonomic nervous system
imbalance, that is, the extent to which SNS or PNS is dominant in an individual [20].
Wenger [81] proposed that, in a given individual, either SNS or the PNS may be dominant.
An empirically determined weighted score called A (autonomic balance) was introduced
[20]. The individual’s A score is determined statistically from a number o f autonomic
R eproduced with perm ission o f the copyright owner. Further reproduction prohibited without perm ission.
responses. High A score means PNS dominance, whereas low A scores reflect relative
SNS dominance. However, this is a statistical approach that is based on the data models.
In this study, the Objective Mental Stress Index (OMSI) which is a deterministically
developed model from the second law o f thermodynamics provides the fundamental rela
tionship between PNS (blood pressure and heart rate) and SNS (skin temperature) con
trolled autonomic responses. In other words, it is a better way to quantitatively represent
the concept o f autonomic balance. The universality o f OMSI is clearly demonstrated in
Fig. 6.44. It combines the three autonomic responses (blood pressure, heart rate, and skin
temperature) to express the stress level in terms o f a single summative number. This
approach overcomes the ambiquity that arises between the concepts such as stimulus and
individual response specificity. From Fig. 6.44, it is clear that subjects #1 and #3 reduced
their stress level, while subject #2 responded in a reverse manner showing an increase in
stress level. Subject #3 showed a steady and optimal stress level (between -49.45 and
+49.06 beats-mm o f Hg/min.° F) throughout the session. While subject #1 showed a rapid
increase in stress level upto 162.81 beats-mm o f Hg/min.° F at 25th minute and after that
maintained a steady level o f stress throughout the session. Finally, subject #2 reached the
peak value o f 135.19 beats-mm o f Hg/min.° F a t 35th minute and settles down after this.
The equilibrium values corresponding to systolic blood pressure (SBP), heart rate (HR),
and skin temperature (ST) were chosen to be equal to 120 mm o f Hg, 70 bpm, and 91.4° F
[20, 74]. The numerical change in responses from these equilibrium values were used in
the OMSI equation, Eq. (5.4), to obtain the mental stress level. All three subjects tend to
reach equilibrium condition after 45th minute as shown in Fig. 6.44. This is a clear repre
sentation o f both therm al and cardiovacular homeostasis. Since, OMSI represents the
R eproduced with perm ission of the copyright owner. Further reproduction prohibited without perm ission.
147
processes controlled by the autonomic nervous system (ANS), it is concluded that OMSI
quantitatively represents the phenomenon of Autonomic Homeostasis.
6.5.3 Validation of Objective M ental Stress Index (OMSI)
The objective o f this study is to evaluate the feasibility of using OMSI as a measure to
quantify the proneness o f human beings to stress-related disorders. In order for the OMSI
to be considered valid as a measure o f stress and to be of any clinical significance, the
index has to indicate a strong relationship with common physical stress symptoms. This
study examined whether or not individual differences in the OMSI are related to the
amount of physical stress symptoms. Also, it was investigated if OMSI provides a better
reflection or measure of clinical stress compared to the most common single physiological
parameters.
The data was obtained from a clinical study conducted by Palsson et al. [40] on a
group o f students. Thirty senior medical students and family medicine resident physicians
(16 females and 14 males; mean age = 29.2 years) participated in the study. All of them
completed a standard psychophysiological stress profile procedure routinely used for clin
ical assessment in the Behavioral Medicine Clinic at Eastern Virginia Medical School
[40]. The participants were all healthy without any major health problems.
The physiological data was collected using a ProComp+ biofeedback system inter
faced with Dell 166 MHz PC computer running a MultiTrace biofeedback software for
data processing and analysis. In addition, a stand-alone Dinamap 1846 Vital Signs Moni
tor (Critikon Inc., Tampa, FL). Also, subjects completed the Stress-Related Physical
Symptoms Inventory (SPSI).
R eproduced with perm ission o f the copyright owner. Further reproduction prohibited without perm ission.
148
The Psychophysiological Stress Profile is a 16-minute standard testing sequence, dur
ing which skin conductance, frontalis EMG, heart rate, blood volume pulse, and tempera
ture from the palmar surface o f the left hand little finger is collected continuously during
five conditions for the subject listed clearly in Table 6.12. The blood pressure and heart
rate were measured separately using Dinamap Vital Signs Monitor, with the help of
mechanically inflated pressure cuff around the subject’s right arm. These recordings are
made three times: After Condition 2 (relaxing with eyes closed for 3 minutes), after Con
dition 3 (the stressor period), and following Condition 5 (that is, after the second post
stressor relaxation period).
The Stress-Related Physical Symptoms fSPSD provided in Appendix C, is a paper-
and-pencil self-report inventory where subjects are asked to indicate whether they have
experienced each o f 32 symptoms during the past one month. The symptoms listed are all
bodily symptoms which are considered by many health professionals to be common phys
ical manifestations o f stress. The symptoms listed include stiff muscles, excessive sweat
ing, dry mouth, chest pain, shortness of breath, and cold hands or feet. The instructions
ask the subjects not to endorse any o f the listed symptoms which are known to be related
to a diagnosed organic illness or medications the person may be taking. The instructions
on the SPSI also ask subjects to indicate how frequently they have experienced the
endorsed symptoms, but the data from those frquency ratings were not used in the study.
The first two of three Dinamap blood pressure and heart rate measurements collected
on each subject (first at the end o f six minutes o f relaxation and just before the 4-minute
cognitive stress task, and then immediately following stress task) were used in conjunction
R eproduced with perm ission of the copyright owner. Further reproduction prohibited without perm ission.
149
with finger skin temperature recordings for the same time periods to calculate the Objec
tive Mental Stress Index using Eq. (5.4) provided in Sec. 5.4.
Table 6.13 clearly shows that a significant Pearson correlation o f 0.51 (p = 0.004) is
between the OMSI and the number o f stress-related symptoms on the SPSI. The three
physiological parameters (diastolic blood pressure, heart rate, and finger skin temperature)
used in the OMSI formula, as well as other physiological stress measures such as frontalis
EMG, and Skin Conductance, were correlated with the SPSI. No statistically significant
Pearson correlation coefficients were found between these five single physiological
modalities and the amount o f stress symptoms on the SPSI. The absence of significant cor
relations between any single parameter o f stress reactivity and the amount o f stress-related
symptoms is in clear contrast with the above finding of a significant relationship between
OMSI and SPSI. This leads to the conclusion that the OMSI is a better measure of clinical
stress.
6 .6 Link B etw een T herm al and Cardiovascular System s
The previous sections, Sec. 6.4 and Sec. 6.5, addressed different aspects of thermal
and mental stress separately. In this section, the dichotomy in the mathematical expres
sions for both thermal and mental stress is qualitatively explained. Although, Eq. (5.4) has
been used to indicate the level of mental stress, it could also be used to examine the impact
of environmental stressors on both thermal (core and skin temperatures) and cardiovascu
lar (blood pressure and heart rate) responses. Due to limited resources, the Eqs. (5.3) and
(5.4) are used under two different circumstances to address thermal and mental stresses
separately. In any case, Eq. (5.4) takes into account the responses of both thermal and car
R eproduced with perm ission o f the copyright owner. Further reproduction prohibited without perm ission.
diovascular systems. Further, the Eq. (5.4) is quite profound and provides an interesting
link between thermal and cardiovascular activities of the human body. In this regard, a
large scale study needs to be designed to examine the simultaneous effects o f both envi
ronmental and psychological stressors on physiological responses to gain maximum bene
fit from the use of objective measures o f thermal and mental stress.
R eproduced with perm ission of the copyright owner. Further reproduction prohibited without perm ission.
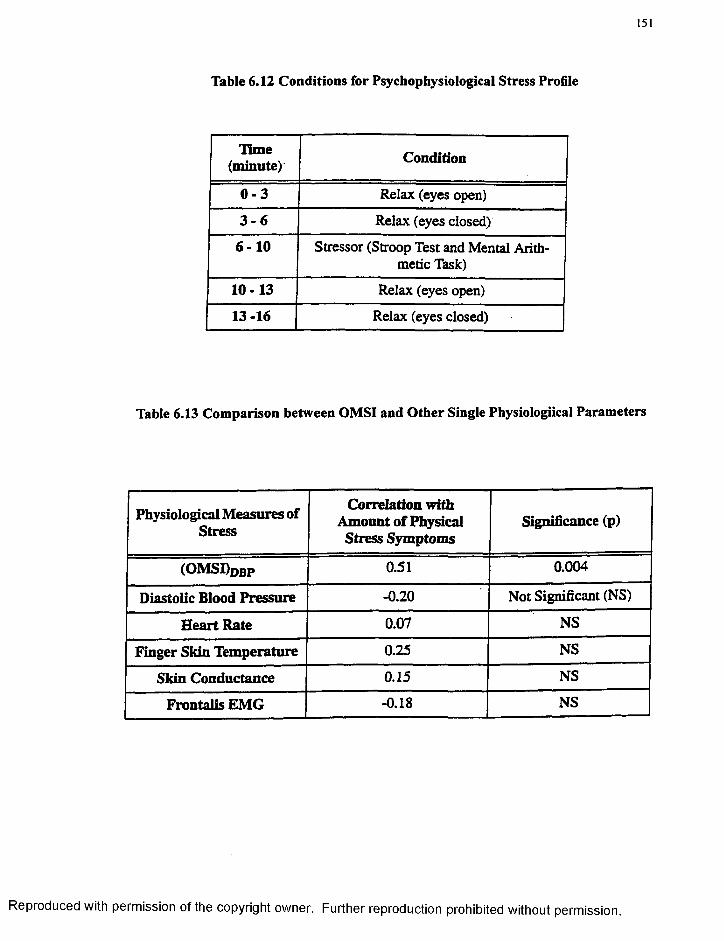
151
Table 6.12 Conditions for Psychophysiological Stress Profile
Time(minute)' Condition
0 - 3 Relax (eyes open)
3 - 6 Relax (eyes closed)
6 - 1 0 Stressor (Stroop Test and Mental Arithmetic Task)
10 -13 Relax (eyes open)
13 -16 Relax (eyes closed)
Table 6.13 Comparison between OMSI and Other Single Physiologiical Parameters
Physiological Measures of Stress
Correlation with Amount o f Physical
Stress SymptomsSignificance (p)
(OMSDdbp 0.51 0.004
Diastolic Blood Pressure -0.20 Not Significant (NS)
Heart Rate 0.07 NS
Finger Skin Temperature 0.25 NS
Skin Conductance 0.15 NS
Frontalis EMG -0.18 NS
R eproduced with perm ission of the copyright owner. Further reproduction prohibited without perm ission.
152
CHAPTER V n
CONCLUSIONS
A novel thermodynamic approach is developed to quantify human stress level in terms
of a single summative number objectively. The two types of stress indices are developed.
They are Objective Thermal Stress Index (OTSI) and Objective Mental Stress Index
(OMSI). The OTSI quantifies thermal stress by determining the percentage deviation in
entropy generation (Sgen) or Objective Thermal Stress Response (OTSR) from the equilib
rium condition or homeostasis in human thermal system. It is based on the second law of
thermodynamics as applied to analyze the human thermal system. The OMSI indicates
the level o f mental stress experienced by the individual as a result of mental workload or
information processing. It provides a link between cardiovascular and thermal system as
it involves blood pressure, heart rate, and skin or body temperature in its mathematical
expression. The equation for OMSI is derived from the Maxwell relations of thermody
namics.
Thermal responses required to validate OTSI are obtained through computer simula
tion. The computer simulation is performed with the help of a human thermal model
which is developed using finite element method. The model is validated against the exper
imental data and it is found that model accurately simulates several human thermal func
tions. A series o f simulations are conducted to examine the human thermal behavior in
different environmental conditions. The effects o f varying air temperature, relative
R eproduced with perm ission of the copyright owner. Further reproduction prohibited without perm ission.
humidity, level of physical activity, and clothing on human thermal stress responses are
examined. The human thermal behavior is quite accurately simulated and it conforms to
the physiological and anatomical facts. A design of experiments philosophy is imple
mented to develop a hybrid technique to assess human thermal behavior. A hybrid tech
nique is developed to analyze the interaction o f two different levels o f air temperature and
relative humidity on human thermal stress responses. The thermal stress responses used in
this situation are entropy generation or Objective Thermal Stress Response (OTSR). The
synergy between the design o f experiment approach and idea o f using Objective Thermal
Stress Responses in place o f subjective responses provides a window o f opportunities to
design efficient human thermal experiments. The OTSI is validated against the values of
Predicted Mean Vote (PMV) obtained from a regression equation which is developed
using a large scale experimental data. It shows an excellent agreement with the experi
mental data and subjective responses with a Pearson coefficient value close to one. Also, a
OTSI has been used to monitor thermal stress continuously; thus, showing the deviation in
human thermal comfort on a moment-to-moment basis. This monitoring technique leads
to the development a standard called Objective Thermal Sensation Scale (OTSS) and an
Optimal Functioning Chart which draw parallel to PMV or ASHRAE Thermal Sensation
Scale and ASHRAE Comfort Chart. The main advantage o f using OTSI lies in its sim
plicity and objectivity backed by the strong basis o f second law o f thermodynamics.
The OTSI could be used in aerospace applications to enhance aviation safety. In this
regard, it has been well established that attention and vigilance are related to changes in
thermal environment. Based on these theories, the OTSI could be used to monitor the
R eproduced with perm ission of the copyright owner. Further reproduction prohibited without perm ission.
154
drain in attentional resource capacity and thus quantify reduction in vigilance capabilities.
The other applications could be in HVAC industry and in the fields o f medicine.
The human physiological data in response to a stressful cognitive or mental task is
obtained from experimental studies which were conducted in both aerospace and medical
settings. Initially, in order to test the OMSI, an existing data from an experimental study
was taken. The OMSI clearly indicates the phenomena o f homeostasis in both thermal
and cardiovascular systems. This analysis established the potential to use OMSI in avia
tion and medical experiments. The continuous moment-to-moment monitoring o f mental
stress level is demonstrated. This technique quantitatively demonstrates some of the most
important psychophysiological concepts such as autonomic balance, individual response
specificity, and stimulus response specificity. Also, it could be used to examine the effects
o f information overloading on system operators, thus leading to the design o f a “Human-
Centered” flight deck for maximum safety and optimum performance. Finally, the OMSI
is validated for potential clinical use as it shows a high correlation with stress related phys
ical symptoms reported by normal subjects. Thus, large scale experimental studies are
recommended to exploit the utility o f OMSI for further use in aerospace or clinical or any
other human factors applications.
The two indices (OTSI and OMSI) have been identified to have their roots in a com
mon theory. This lead to the development o f a Unified Stress Response Theory (USRT)
which combines both thermal stress and mental stress depending on the nature o f stres
sors. Further, the USRT finds its place in a new field o f study called Engineering Psycho
physiology which gets subdivided into two branches, Thermal Environmental
Psychophysiology and Cognitive Psychophysiology. The new concepts and definitions
R eproduced with perm ission of the copyright owner. Further reproduction prohibited without perm ission.
155
are all summarized under twelve Postulates which constitute this new field of Engineering
Psychophysiology and Unified Stress Response Theory (USRT).
R eproduced with perm ission of the copyright owner. Further reproduction prohibited without perm ission.
156
REFERENCES
1. Anon., American Institute o f Aeronautics and Astronautics (AIAA), Guide to Human Performance Measurements. American National Standard, ANSI/AIAA G- 035-1992, AIAA, Washington, DC, July 1993.
2. Fanger, P. O., Thermal Comfort. 2nd Edition, McGraw-Hill Book Company, New York, September 1970.
3. Rodahl, K., The Physiology o f Work. Taylor & Francis Ltd., London, 1989.
4. Hockey, G. R. J., Gaillard, A. W. K., and Coles, M. G. H., Energetics and Human Information Processing. Martinus Nijhoff Publishers, Dordrecht, Netherlands, 1986.
5. Hancock, P. A., Meshkati, N., and Robertson, M. M., “Physiological Reflections of Mental Workload,” Aviation. Space, and Environmental Medicine. Vol. 56, No. 11, November 1985, pp. 1110-1114.
6. Mital, A., and Mital, C., “Mental Stress and Physiological Responses,” In Mital, A. (Ed.), Trends in Ergonomics / Human Factors I. Elsevier Science Publishers Inc., New York, 1984, pp. 353-358.
7. Anon., ASHRAE, ASHRAE Handbook of Fundamentals. Chapter 8, Atlanta, American Society o f Heating, Refrigerating, and Air Conditioning Engineers, Inc., 1993.
8. Talty, J. T., Industrial Hvgiene Engineering. Second Edition, Noyes Data Corporation, New Jersey, 1988, pp. 326-369.
9. Boregowda, S. C., Tiwari, S. N., Chaturvedi, S. K., and Hou, G. J-W., “Thermodynamic Analysis o f an Unsteady 3D Human Thermal Model,” AIAA Paper No. 98- 0841: Presented at the 36th A IA A Aerospace Sciences Meeting & Exhibit, Reno, NV, January 12-15,1998.
10. McCormick, E. J., and Sanders, M. S., Human Factors in Engineering and Design. McGraw-Hill Book Company, 5th Edition, New York, 1982, pp. 398-401.
11. Grandjean, E., Fitting the Task to the Man. Taylor & Francis Ltd., London, 1981, pp. 334-335.
R eproduced with perm ission o f the copyright owner. Further reproduction prohibited without perm ission.
157
12. Belding, H. S., and Hatch, T. F., 1955, “Index for Evaluating Heat Stress in Terms o f Resulting Physiological Strains,” Heating. Piping, and Air Conditioning. Vol. 207, August 1955, pp. 129-136.
13. Hatch, T. F., “Assessment o f Heat Stress,” In J. D. Hardy (Ed.), Temperature - Its Measurement and Control in Science and Industry. Vol. 3, Part 3, Reinhold, New York, 1963, pp. 307-318.
14. Hertig, B. A., and Belding, H. S., “Evaluation and Control of Heat Hazards,” In J. D. Hardy (Ed.), Temperature - Its Measurement and Control in Science and Industry. Vol. 3, Part 3, Reinhold, New York, 1963, pp. 347-355.
15. Threlkeld, J. L., Thermal Environmental Engineering. 2nd Edition, Prentice-Hall Inc., New Jersey, 1970, pp. 370-373.
16. Rohles, F. H., Jr., and Nevins, R. G., “The Nature o f Thermal Comfort for Sedentary Man,” ASHRAE Transactions. Vol. 77, No. 1,1971, pp. 239-251.
17. Rohles, F. H., Jr., “The Revised Modal Comfort Envelope,” ASHRAE Transactions, Vol. 79, No. 2, 1973, pp. 52-60.
18. Aoki, I., “Entropy Flow and Production in the Human Body in Basal Conditions,” Journal o f Theoretical Biology. Vol. 141, June 1989, pp. 11-21.
19. Aoki, I., “Effects o f Exercise and Chills on Entropy Production in Human Body,” Journal o f Theoretical Biology. Vol. 145, January 1990, pp. 421-428.
20. Andreassi, J. L., Psvchophvsiologv: Human Behavior and Physiological Responses. Lawrence Erlbaum Associates Publishers, Hillsdale, NJ, 1989.
21. Barnard, R. J., and Duncan, H. W., “Heart Rate and ECG Responses of Fire Fighters,” Journal o f Occupational Medicine. Vol. 17, No. 1, 1985, pp. 247-250.
22. Zwaga, H. J. C., “Psychophysiological Reactions to Neural Tasks: Effort or Stress,” Ergonomics. Vol. 16, No. 1, January 1973, pp. 61-67.
23. Grandjean, E. P., Wotzka, G., Schaad, R., and Gilgen, A., “Fatigue and Stress in Air Traffic Controllers,” Ergonomics. Vol. 14, No. 1, January 1971, pp. 159-165.
24. Kasl, S. V., and Cobb, S., “Blood Pressure Changes in Men Undergoing Job Loss,” A Preliminary Report, Psychosomatic Medicine. Vol. 32, No. 1, Jan.-Feb. 1970, pp. 19-38.
25. Renboum, E. T., “Psycho-Physiological Stress and the Soldier, with a Review o f the Literature,” Clothing and Equipment Physiological Research Establishment, Report No. 118, May 1961.
R eproduced with perm ission of the copyright owner. Further reproduction prohibited without perm ission.
158
26. Hampton, I. F. G., and Lewis, H. E., “Psychological and Physiological Responses to Raised Body Temperature,” Journal o f Applied Physiology. Vol. 19, No. 2, March 1964, pp. 287-291.
27. Shusterman, V., and Bamea, O., “Spectral Characteristics o f Skin Temperature Indicate Peripheral Stress-Response,” Biofeedback and Self-Regulation. Vol. 20, No. 4, 1995, pp. 357-367.
28. Freedman, R. R., “Physiological Mechanisms o f Temperature Biofeedback,” Biofeedback and Self-Regulation. Vol. 16, No. 2,1991, pp. 95-115.
29. Ettema, J. H., and Zielhus, R. L., “Physiological Parameters o f Mental Load,” Ergonomics. Vol. 14, No. 1, January 1971, pp. 137-144.
30. McCubbin, J. A., Richardson, J. E., Langaer, A. W., Kizer, J. S., and Obrist, P. A., “Sympathetic Neuron Function and Left Ventricular Performance during Behavioral Stress in Humans: The Relationship between Plasma Catecholamines and Systolic Time Intervals,” Psychophysiology. Vol. 20, No. 1, January 1983, pp. 102-110.
31. Levi, L., Stress: Sources. Management, and Prevention. Liveright Publishing Corporation, New York, 1967.
32. McLean, A., Occupational Stress. Charles C. Thomas Publishers, Springfield, IL, 1974.
33. Eaton, M. T., “Detective Executive Stress in Time,” Industrial Medicine and Surgery. Vol. 35; No. 1, 1967, pp. 115-118.
34. Horowitz, M., Schaefer, C., Hirotu, D., Wilner, N., and Levin, B., “Life Event Questionnaires for Measuring Presumptive Stress,” Psychosomatic Medicine. Vol. 39, No. 6, Nov.-Dee. 1977, pp. 413-431.
35. Takakuwa, E., “Maintaining Concentration (TAF) as a Measure o f Mental Stress,” Ergonomics. Vol. 14, No. 1, January 1971, pp. 145-158.
36. Boregowda, S. C., Palsson, O. S., Hwari, S. N., and Bartolome-Rull, D. S., “Thermodynamic Approach to Quantify and Measure Human Stress Level,” Proceedings o f 29th Annual Association for Applied Psvchophvsiologv and Biofeedback (AAPB) Conference. Orlando, Florida, April 1-5,1998, pp. 20-23.
37. Boregowda, S. C., Tiwari, S. N., Chaturvedi, S. K., and Palsson, O. S., “An Innovative Approach to Measure and Monitor Human Stress Level in Man/Machine Interactions,” Proceedings o f 18th Annual American Society of Engineering Management f ASF.Mi National Conference. Virginia Beach, Virginia, October 1997, pp. 5-13.
R eproduced with perm ission o f the copyright owner. Further reproduction prohibited without perm ission.
159
38. Boregowda, S. C., and Tiwari, S. N., “Human Stress Level Measurement Using a Engineering Approach,” In Eanes, I. A., Boregowda, S. C., and Tiwari, S. N. (Eds.), ISET Review o f NASA/ODU/EVMS Symposium on Technology for the Treatment o f ADHD. Technical Report No. NAS 1-19858-68, NASA CR-198068, July 1997.
39. Boregowda, S. C., Tiwari, S. N., Chaturvedi, S. K., and Redondo, D. R., “Analysis and Quantification o f Mental Stress and Fatigue Using Maxwell Relations from Thermodynamics,” Journal o f Human Ergologv. Vol. 26, No. 1, Center for Academic Publications, University of Tokyo, Tokyo, Japan, June 1997 (In Press).
40. Palsson, O. S., Boregowda, S. C., and Downing, B. K., “The Relationship between an Objective Stress Index (OSI) and Stress-Related Physical Symptoms,” Proceedings o f 29th Annual AAPB Conference. Orlando, Florida, April 1-5,1998, pp. 70-72.
41. Gagge, A. P., “Rational Temperature Indices o f Thermal Comfort,” In Cena, K., and Clark, J. A. (Eds.), Bioengineering. Thermal Physiology and Comfort. Elsevier Scientific Publishing Company, Amsterdam, 1981, pp. 79-98.
42. Selye, H., The Stress o f Life. Revised Edition, The McGraw-Hill Companies, Inc., 1956.
43. Smith, C. E., “A Transient Three-Dimensional Model o f the Human Thermal System,” Ph.D. Thesis, Kansas State University, Manhattan, Kansas, May 1991.
44. Fu, G., “A Transient, Three-Dimensional Mathematical Thermal Model for Clothed Human,” Ph.D. Thesis, Kansas State University, Manhattan, Kansas, May 1995.
45. Fisher, R. A., Design o f Experiments. Oliver & Boyd, Edinburgh, 1951.
46. Roy, R., A Primer on the Taguchi Method. Von Nostrand Reinhold, New York, 1990.
47. Kroemer, K. H. E, Kroemer, H. B., and Kroemer-Elbert, K. E., Ergonomics: How to Design for Ease and Efficiency. Prentice-Hall, Inc., Englewood Cliffs, NJ, 1994.
48. Leibowitz, H. W., Owens, D. A., and Helmreich, R. L., “Transportation,” In Nickerson, R. S. (Ed.), Emerging Needs and Opportunities for Human Factors Research. National Academy Press, Washington, DC, 1995, pp. 241-261.
49. Pope, A. T., Bogart, E. H., and Bartolome, D. S., “Biocybemetic System Evaluates Indices of Operator Engagement in Automated Task,” Biological Psychology. Vol. 40, No. 1,1995, pp. 187-195.
50. Hancock, P. A., “Sustained Attention Under Thermal Stress,” Psychological Bulletin. Vol. 99, No. 2, March 1986, pp. 263-281.
R eproduced with perm ission of the copyright owner. Further reproduction prohibited without perm ission.
160
51. Hancock, P. A., and Pierce, J. 0 ., “Toward an Attentional Theory of Performance Under Stress: Evidence from Studies o f Vigilance in Heat and Cold,” In Mital, A., (Ed.), Trends in Ergonomics/Human Factors I. Elsevier Science Publishers, Inc., New York, 1984, pp. 353-358.
52. Wickramasekara, I. E., Clinical Behavioral Medicine. Plenum Press, New York, 1988.
53. Boregowda, S. C., and Tiwari, S. N., “A Test Plan for the Investigation o f Human Thermoregulation in Microgravity Environment,” AIAA Paper No. 98-0460: Presented at the 36th AIAA Aerospace Sciences Meeting and Exhibit, Reno, NV, January 1998.
54. Lehrer, P. M., and Woolfolk, R. L., Principles and Practice of Stress Management Second Edition, The Guilford Press, New York, 1993.
55. Green, E., and Green, A., Beyond Biofeedback. Delacorte Press Seymour Lawrence, 1977.
56. Parks, P., “Psychophysiologic Self-Awareness Training: Integration of Scientific and Humanistic Principles,” Journal o f Humanistic Psychology. Vol. 37, No. 2, 1997, pp. 67-113.
57. Flach, J., Hancock, P., Caird, J„ and Vicente, K., Global Perspectives on the Ecology o f Human-Machine Systems. Vol. 1, Lawrence Erlbaum Associates, Publishers, Hillsdale, NJ, 1995.
58. Lacey, J. I., “Somatic Response Patterning and Stress: Some Revisions o f Activation Theory,” In Coles, M. G. H., Jennings, J. R., and Stem, J. A., (Eds.), Psvchophvsio- logical Perspectives. Van Nostrand Reinhold Company, New York, 1984, pp. 42-70.
59. Burchfield, S. R., Stress: Psychological and Physiological Interactions. Hemisphere Publishing Corporation, New York, 1985.
60. Hancock, P. A., and Warm, J. S., “A Dynamic Model of Stress and Sustained Attention,” Human Factors. Vol. 31, No. 5, October 1989, pp. 519-537.
61. Swan, H., Thermoregulation and Bioenergetics. American Elsevier Publishing Company, Inc., New York, 1974.
62. Callen, H. B., Thermodynamics and An Introduction to Thermostatics. Second Edition, John Wiley & Sons, New York, 1985.
63. Nicolis, G., and Prigogine, I., Self-Organization in Nonequilibrium Systems. John Wiley & Sons, New York, 1977.
R eproduced with perm ission of the copyright owner. Further reproduction prohibited without perm ission.
161
64. Cooney, D. O., Biomedical Engineering Principles. Marcel Dekker, Inc., New York, 1976.
65. Guyton, A. C., Textbook of Medical Physiology. 6th Edition, W. B. Saunders Company, Philadelphia, 1981.
66. Gordon, R. G., “The Response o f a Human Temperature Regulatory System Model in the Cold,” Ph.D. Thesis, University o f California, Santa Barbara, California, May 1974.
67. Shitzer, A., and Eberhart, R. C., Heat Transfer in Medicine and Biology: Analysis and Applications. Vol. 2, Plenum Press, New York, 1985.
68. Wissler, E. H., “The Use of Finite Difference Techniques in Simulating the Human Thermal System,” In Hardy, J. D., Gagge, A. P., and Stolwijk, J. A. J. (Eds.), Physiological and Temperature Regulation. Charles C. Thomas Publishing Company, Springfield, pp. 367-388.
69. Segerlind, L. J., Applied Finite Element Analysis. 2nd Edition, John Wiley & Sons, New York, 1984.
70. Flach, J. M., and Warren, R., “Active Psychophysics: The Relation Between Mind and What Matters,” In Flach, J. M., Hancock, P. A., Caird, J., and Vicente, K.. J. (Eds.), Global Perspectives on the Ecology of Human-Machine Systems. Vol. 1, Lawrence Erlbaum Associates, Publishers, Hillsdale, NJ, 1995, pp. 189-209.
71. Fechner, G., Elements o f Psvchophvsics. Holt, Rinehart, and Winston, New York, 1966.
72. Hardy, J. D., and Stolwijk, J. A. J., “Partitional Calorimetric Studies o f Man During Exposures to Thermal Transients,” Journal o f Applied Physiology. Vol. 31, No. 6, April 1966, pp. 1799-1806.
73. McIntyre, D. A., “Design Requirements for a Comfortable Environment,” In Cena, K., and Clark, J. A. (Eds.), Bioengineering. Thermal Physiology and Comfort Elsevier Scientific Publishing Company, New York, 1981, pp. 195-220.
74. Cabanac, M., “Physiological Signals for Thermal Comfort,” In Cena, K., and Clark, J. A. (Eds.), Bioengineering. Thermal Physiology and Comfort. Elsevier Scientific Publishing Company, New York, 1981, pp. 181-192.
75. Astrand, P., and Rodahl, K., Textbook of Work Physiology. McGraw-Hill Book Company, New York, 1970.
R eproduced with perm ission of the copyright owner. Further reproduction prohibited without perm ission.
162
76. Koch, K. W., Jennings, B. H., and Humphreys, C. H., “Is Humidity Important in the Temperature Comfort Range?,” ASHRAE Transactions Vol. 66, No. 1,1960, pp. 63- 68.
77. Nevins, R. G., Rohles, F. H., Springer, W., and Feyerherm, A. M., “A Temperature Humidity Chart o f Thermal Comfort o f Seated Person,” ASHRAE Journal. Vol. 8, No. 4, April 1966, pp. 55-61.
78. Hardy, J. D., Stolwijk, J. A. J., and Gagge, A. P., “Man,” In Whittow, G. C. (Ed.), Comparitive Physiology o f Thermoregulation. Academic Press, New York, 1971, pp. 327-380.
79. Gagge, A. P., Burton, A. C., and Bazett, H. D., “A Practical System of Units for the Description o f Heat Exchange o f Man with his Environment,” Science. Vol. 5, No. 94, 1941, pp. 428-430.
80. McQuiston, F. C., and Parker, J. D., Heating. Ventilation, and Air-Conditioning. John Wiley & Sons, New York, 1984.
81. Wenger, M. A., “Studies o f Autonomic Balance: A Summary,” Psychophysiology. Vol. 3, No. 2, 1966, pp. 173-176.
R eproduced with perm ission of the copyright owner. Further reproduction prohibited without perm ission.
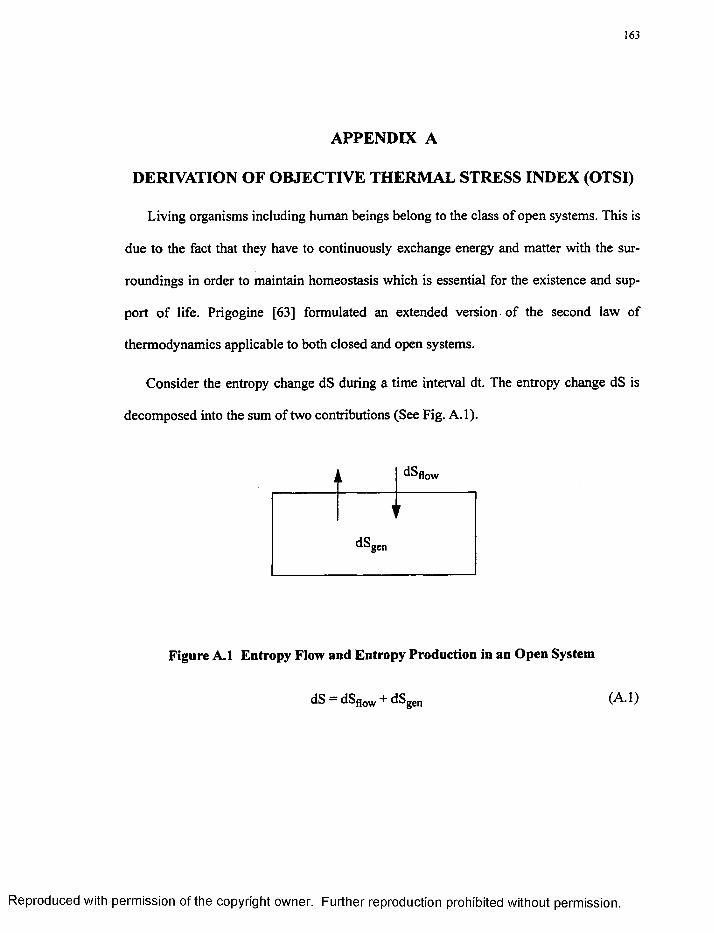
163
APPENDIX A
DERIVATION OF OBJECTIVE THERMAL STRESS INDEX (OTSI)
Living organisms including human beings belong to the class of open systems. This is
due to the fact that they have to continuously exchange energy and matter with the sur
roundings in order to maintain homeostasis which is essential for the existence and sup
port o f life. Prigogine [63] formulated an extended version of the second law of
thermodynamics applicable to both closed and open systems.
Consider the entropy change dS during a time interval dt. The entropy change dS is
decomposed into the sum of two contributions (See Fig. A .l).
i 1 d S f l o w
d S g e n
Figure A.1 Entropy Flow and Entropy Production in an Open System
dS = dSfl0W + dSgen (A. 1)
R eproduced with perm ission o f the copyright owner. Further reproduction prohibited without perm ission.
164
where dSfl0W = entropy flow or flux due to heat exchanges with the environment. dSgen =
entropy generation due to the irreversible processes inside the system, such as diffusion,
heat conduction, and chemical reactions
The second law implies:
dSgen s 0 (= 0 at equilibrium) (A.2)
For an isolated system, dSfl0W = 0, and Eq. (A .l) yields,
dS = dSgen a 0 (A.3)
In summary, open systems differ from isolated systems by the presence of flow terms,
dSflowj 'n the entropy change. Contrary to dSgen which can never be negative, these terms
do not have a definite sign. As a result, one may imagine evolutions where the system
attains a state o f lower entropy than the initial one, i.e.,
A S = f dS < 0 (A.4)path
This state, which from the point o f view of the equilibrium would be highly improbable,
and be maintained indefinitely provided the system is allowed to attain a steady state such
that dS = 0 or
dSfl0W = 'dSgen (A.5)
In principle, if the system is given a sufficient amount o f negative entropy flow to
enable it to maintain an ordered configuration. As Eq. (A.5) shows, this supply must occur
under nonequilibrium conditions, otherwise both dSgen and dSfl0W would vanish. This
R eproduced with perm ission of the copyright owner. Further reproduction prohibited without perm ission.
165
leads to the possibility o f a new nonequilibrium order principle. More precisely, nonequi
librium may be a source o f order. This is of obvious interest for living systems; the bio
sphere as a whole is a nonequilibrium system, as it is subject to the flow o f solar energy. It
is enough to establish that the second law (dSgen a 0) is compatible with a decrease of
overall entropy (dS < 0), but also to indicate the mechanisms responsible for the emer
gence and maintenance o f coherent states.
There are systems which exhibit two types of behavior: (a) a tendency to a disordered
state under certain conditions; (b) a tendency to a coherent behavior under certain condi
tions. The destruction o f order prevails in the neighborhood of thermodynamic equilib
rium. Creation o f order may occur far from equilibrium provided the system obeys
nonlinear laws o f some type. In this case, the spontaneous appearance o f order is accom
panied by an instability o f the states showing the usual thermodynamic (i.e., disordered)
behavior. Traditionally, classical thermodynamics is limited to equilibrium or near equilib
rium and could only treat the first type of behavior which is the emphasis o f present study.
In the present study, Eq. (A .l) is modified as shown by Aoki [18, 19] as
AS — Sflow + Sgen (A.6)
where
A S = total entropy change
SfloW = net entropy flow
Sgen = entropy generation
From Eq. (A.6), the entropy generation in the human body is given by
R eproduced with perm ission of the copyright owner. Further reproduction prohibited without perm ission.
166
S g e n — A S - Sflow (A. 7)
where A S = A Q / Tcore
S f l o w = S i n * { S o u t + ScNV + SeVAP + S raD + ScNV_RES + SevAP_REs} (A -8)
The terms S;n and Sout on the right hand side of Eq. (A.8) are given as follows [18, 19]:
Sjn = 2-05 ct (Tair)3 (A.9a)
Sout = 2.05. a (TsIdn)3 (A.9b)
where a = Stefan-Boltzmann constant = 5.67 x 10'8 J. m '2 sec'1 K."4 .The other terms in
Eq. (A.8) related to heat losses are given as follows:
ScNV = ECNV ! T s k i n ( A‘1 ®a)
S raD = E r a d / T s k i n (A. 10b)
SeVAP = EEVAP ! T c o r e (A ‘10c)
SCNV_RES = ECNV_RES 1 T c o r e ( A ‘ 1 0 d )
SeVAP_RES = EEVAP_RES ! T c o r e (A- ̂ ®e)
According to Postulate IX, the Eq. (A.7) is rewritten as
OTSR = A S - Sflow (A.11)
where OTSR = Objective Thermal Stress Response (J/sec/K).
R eproduced with perm ission of the copyright owner. Further reproduction prohibited without perm ission.
167
The Objective Thermal Stress Response (OTSR) is calculated at the equilibrium or
comfort condition at 50% RH and 75 ° F air temperature for nude body. Thus, any percent
age deviation from the equilibrium or comfort OTSR value indicates the amount of stress
or disorder. In other words, it is the deviation from thermal homeostasis. Thus, OTSI is
defined as
OTSI = {1.0- (OTSR)act / (OTSRJcon,} x 100 (A. 12)
where subscripts “act” and “com” refer to actual and comfort or equilibrium conditions.
Equation (A. 12) is the primary equation used in the monitoring o f thermal stress level.
R eproduced with perm ission o f the copyright owner. Further reproduction prohibited without perm ission.
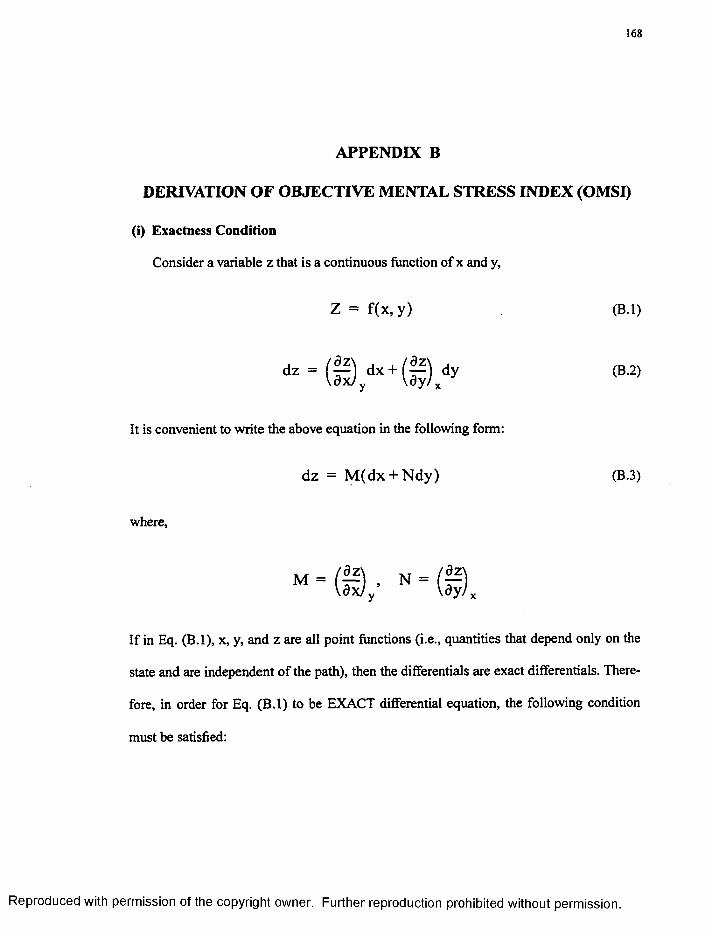
168
APPENDIX B
DERIVATION OF OBJECTIVE MENTAL STRESS INDEX (OMSI)
(i) Exactness Condition
Consider a variable z that is a continuous function of x and y,
Z = f(x, y) (B.l)
dz = (fi)ydx+(|),dy (B2)It is convenient to write the above equation in the following form:
dz = M (dx + Ndy) (B.3)
where,
» - © , ■ » - © ,
If in Eq. (B.l), x, y, and z are all point functions (i.e., quantities that depend only on the
state and are independent o f the path), then the differentials are exact differentials. There
fore, in order for Eq. (B .l) to be EXACT differential equation, the following condition
must be satisfied:
R eproduced with perm ission of the copyright owner. Further reproduction prohibited without perm ission.
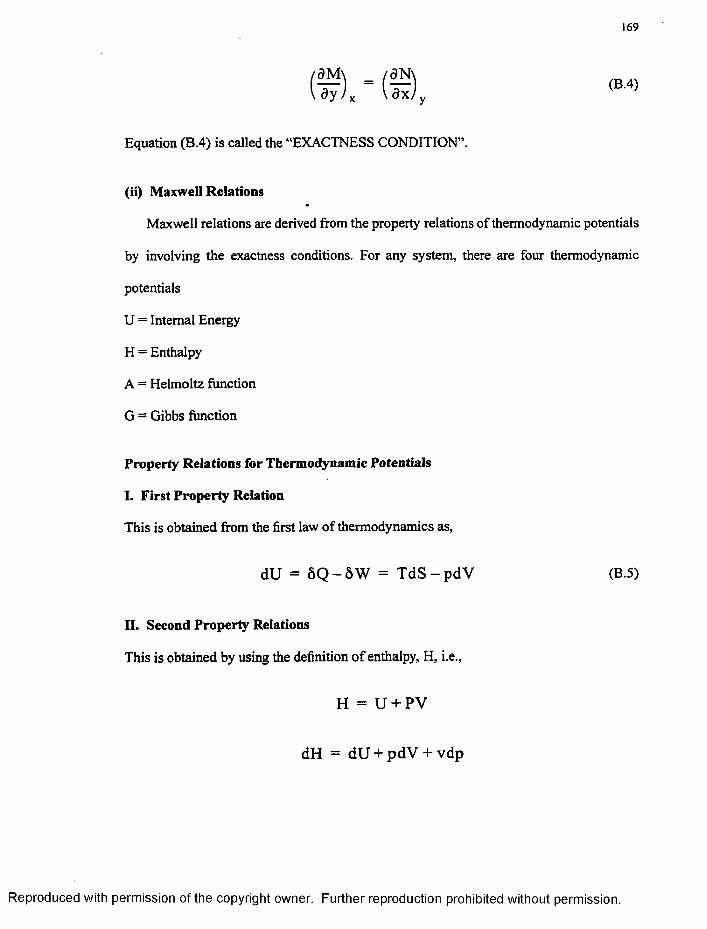
169
Equation (B.4) is called the “EXACTNESS CONDITION”.
(ii) Maxwell Relations
Maxwell relations are derived from the property relations of thermodynamic potentials
by involving the exactness conditions. For any system, there are four thermodynamic
potentials
U = Internal Energy
H = Enthalpy
A = Helmoltz function
G = Gibbs function
Property Relations for Thermodynamic Potentials
I. First Property Relation
This is obtained from the first law of thermodynamics as,
dU = 5 Q - 5 W = T d S - p d V (B.5)
II. Second Property Relations
This is obtained by using the definition o f enthalpy, H, i.e.,
H = U + PV
dH = dU + pdV + vdp
R eproduced with perm ission of the copyright owner. Further reproduction prohibited without perm ission.
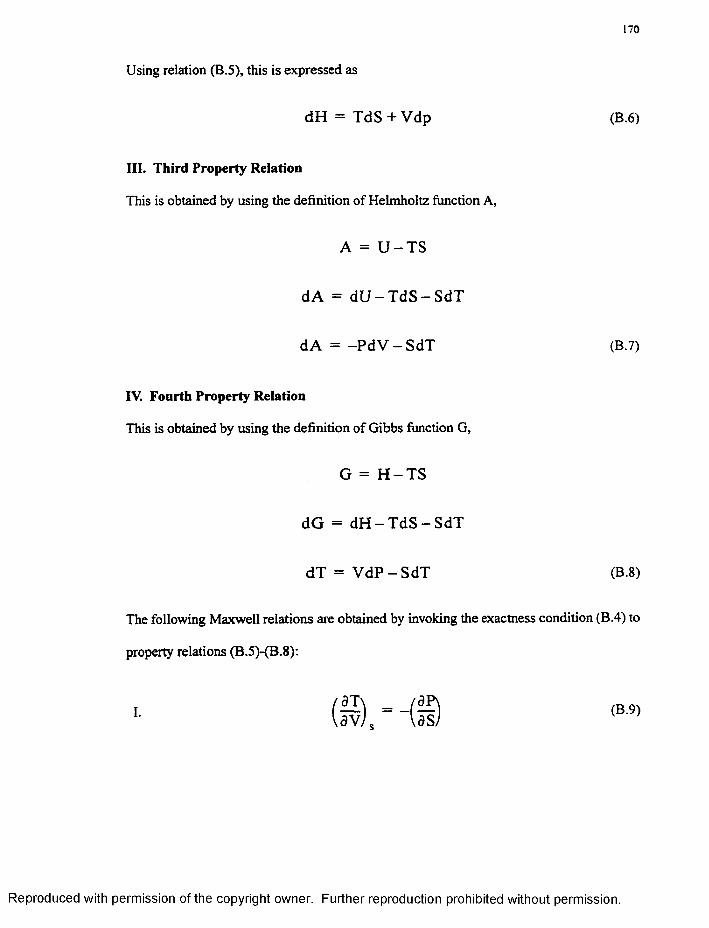
170
Using relation (B.5), this is expressed as
dH = TdS + Vdp (B.6)
III. Third Property Relation
This is obtained by using the definition of Helmholtz function A,
A = U - T S
dA = d U - T d S - S d T
dA = -P d V - SdT (B.7)
IV. Fourth Property Relation
This is obtained by using the definition of Gibbs function G,
G = H - T S
dG = d H - T d S - S d T
dT = V d P - S d T (B.8)
The following Maxwell relations are obtained by invoking the exactness condition (B.4) to
property relations (B.5XB.8):
R eproduced with perm ission of the copyright owner. Further reproduction prohibited without perm ission.
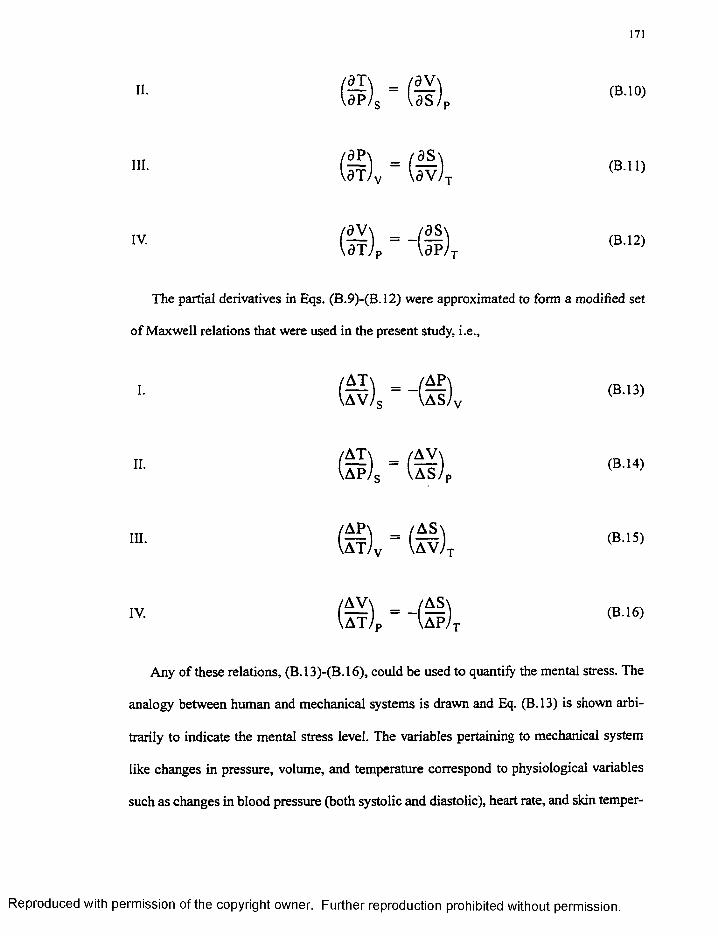
171
IV.
III.
II.
(B.12)
(B.l 1)
(B .10)
The partial derivatives in Eqs. (B.9)-(B.12) were approximated to form a modified set
of Maxwell relations that were used in the present study, i.e.,
Any of these relations, (B.13)-(B.16), could be used to quantify the mental stress. The
analogy between human and mechanical systems is drawn and Eq. (B.13) is shown arbi
trarily to indicate the mental stress level. The variables pertaining to mechanical system
like changes in pressure, volume, and temperature correspond to physiological variables
such as changes in blood pressure (both systolic and diastolic), heart rate, and skin temper-
I. (B.13)
II. (B.14)
III. (B.l 5)
IV. (B.l 6)
R eproduced with perm ission of the copyright owner. Further reproduction prohibited without perm ission.
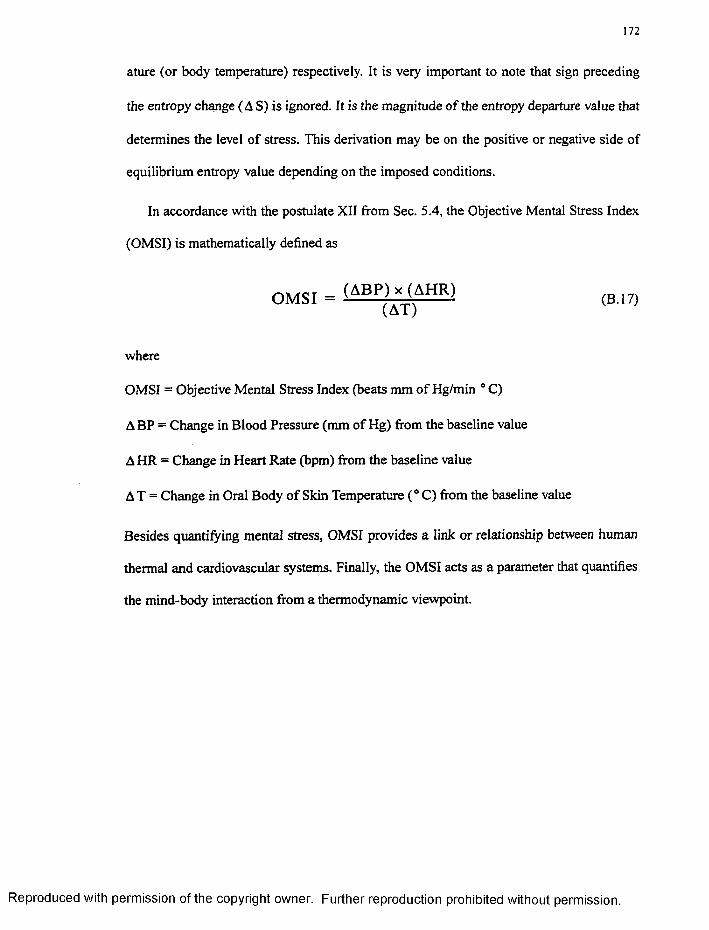
172
ature (or body temperature) respectively. It is very important to note that sign preceding
the entropy change ( A S) is ignored. It is the magnitude of the entropy departure value that
determines the level o f stress. This derivation may be on the positive or negative side of
equilibrium entropy value depending on the imposed conditions.
In accordance with the postulate XII from Sec. 5.4, the Objective Mental Stress Index
(OMSI) is mathematically defined as
OM SI = (ABP(a t )A H R ' (BI7)
where
OMSI = Objective Mental Stress Index (beats mm of Hg/min ° C)
A BP = Change in Blood Pressure (mm of Hg) from the baseline value
A HR = Change in Heart Rate (bpm) from the baseline value
AT = Change in Oral Body o f Skin Temperature (°C ) from the baseline value
Besides quantifying mental stress, OMSI provides a link or relationship between human
thermal and cardiovascular systems. Finally, the OMSI acts as a parameter that quantifies
the mind-body interaction from a thermodynamic viewpoint.
R eproduced with perm ission of the copyright owner. Further reproduction prohibited without perm ission.
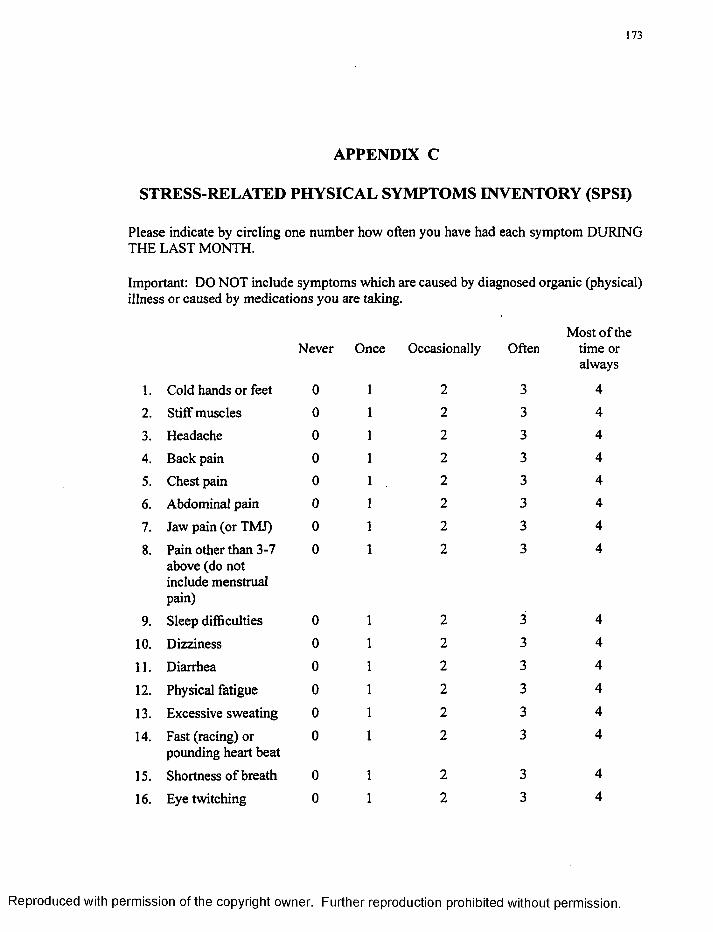
173
A PPE N D IX C
STRESS-R ELA TED PH Y SIC A L SYM PTO M S IN V EN TO R Y (SPSI)
Please indicate by circling one number how often you have had each symptom DURING THE LAST MONTH.
Important: DO NOT include symptoms which are caused by diagnosed organic (physical) illness or caused by medications you are taking.
Most o f theNever Once Occasionally Often time
alwa
1. Cold hands or feet 0 1 2 3 4
2. Stiff muscles 0 1 2 3 4
3. Headache 0 1 2 3 4
4. Back pain 0 1 2 3 4
5. Chest pain 0 1 2 3 4
6. Abdominal pain 0 1 2 3 4
7. Jaw pain (or TMJ) 0 1 2 3 4
8. Pain other than 3-7 above (do not include menstrual pain)
0 1 2 3 4
9. Sleep difficulties 0 1 2 3 4
10. Dizziness 0 1 2 3 4
11. Diarrhea 0 1 2 3 4
12. Physical fatigue 0 1 2 3 4
13. Excessive sweating 0 1 2 3 4
14. Fast (racing) or pounding heart beat
0 1 2 3 4
15. Shortness o f breath 0 1 2 3 4
16. Eye twitching 0 1 2 3 4
R eproduced with perm ission of the copyright owner. Further reproduction prohibited without perm ission.
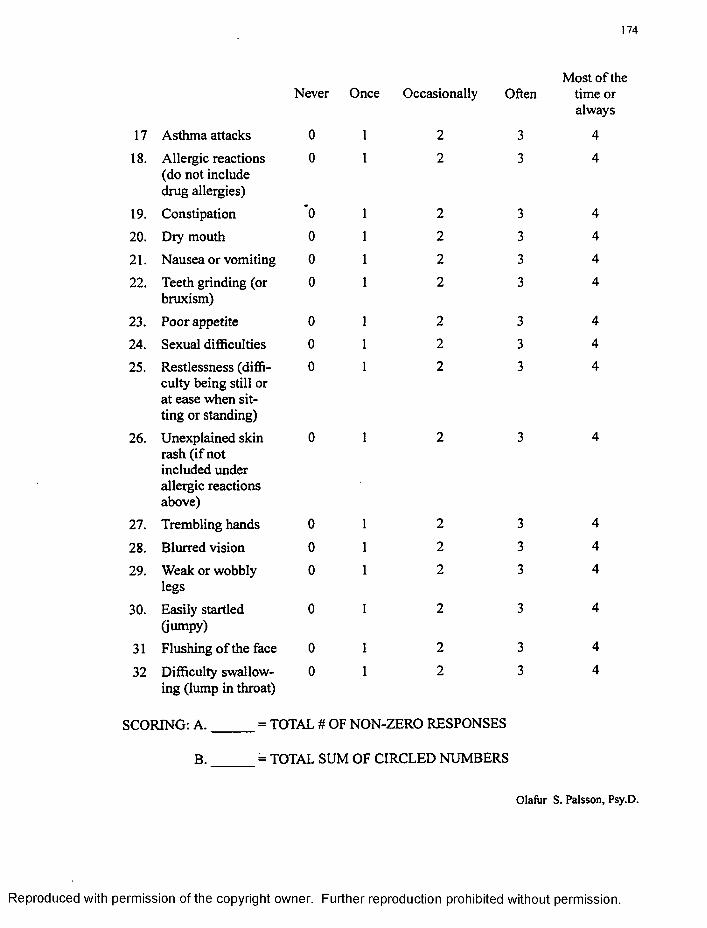
174
Most of theNever Once Occasionally Often time or
always
17 Asthma attacks 0 1 2 3 4
18. Allergic reactions (do not include drug allergies)
0 1 2 3 4
19. Constipation *0 1 2 3 4
20. Dry mouth 0 1 2 3 4
21. Nausea or vomiting 0 1 2 3 4
22. Teeth grinding (or bruxism)
0 1 2 3 4
23. Poor appetite 0 1 2 3 4
24. Sexual difficulties 0 1 2 3 4
25. Restlessness (difficulty being still or at ease when sitting or standing)
0 1 2 3 4
26. Unexplained skin rash (if not included under allergic reactions above)
0 1 2 3 4
27. Trembling hands 0 1 2 3 4
28. Blurred vision 0 1 2 3 4
29. Weak or wobbly legs
0 1 2 3 4
30. Easily startled (jumpy)
0 1 2 3 4
31 Flushing o f the face 0 1 2 3 4
32 Difficulty swallowing (lump in throat)
0 1 2 3 4
SCORING: A ._______= TOTAL # OF NON-ZERO RESPONSES
B . = TOTAL SUM OF CIRCLED NUMBERS
Olafiir S. Palsson, Psy.D.
R eproduced with perm ission of the copyright owner. Further reproduction prohibited without perm ission.
175
BIO G R A PH Y
Satish Boregowda was bom on August 21, 1967, in Mysore, Karnataka, India. He
lived in Mysore during the first twenty-three years o f his life. He received his Bachelor of
Engineering in Mechanical Engineering in January 1990 from National Institute of Engi
neering, University o f Mysore. Later, he moved to the United States to pursue his graduate
studies. In December 1993, he obtained his Master of Engineering in Mechanical Engi
neering from Old Dominion University. In January 1994, he started his doctoral work at
Old Dominion University and earned the degree in December 1998.
His research interests include Engineering Psychophysiology, Human Thermal Engi
neering, Biothermodynamics, Ergonomics, Modeling o f Human Stress Responses, Proba
bility, and Statistical Methods. His hobbies include tennis, hiking, reading, classical
music, theater, and art.
R eproduced with perm ission of the copyright owner. Further reproduction prohibited without perm ission.
IMAGE EVALUATIONTEST TARGET (Q A -3 )
1.0
l.l
us 1 1 1 1 % I I I I
1 3.6
2.5
2.2
20
1.8
1.25 1.6
150mm
6 "
IIW 1G E . In c1653 East Main Street Rochester. NY 14609 USA Phone: 716/482-0300 Fax: 716/288-5989
ID ' 993, Applied Image. Inc.. All Rights Reserved
R eproduced with perm ission of the copyright owner. Further reproduction prohibited without perm ission.