Embed Size (px)
Citation preview
1
Thermodynamic Properties of Organic Substances:
Experiment, Modeling, and Technological Applications
Gennady J. Kaboa, Andrey V. Blokhina, Eugene Paulechkab*, Gennady N. Roganovc, Michael
Frenkelb,**, Iosif A. Yurshad†, Vladimir Dikyb, Dzmitry Zaitsaue, Ala Bazylevab, Vladimir V.
Simirskyf, Larisa S. Karpushenkavaa, Viktor M. Sevruka
aChemistry Department, Belarusian State University, 14 Leningradskaya Street, 220030 Minsk,
Belarus
bThermodynamics Research Center, Applied Chemicals and Materials Division, National
Institute of Standards and Technology, 325 Broadway, Boulder, Colorado 80305-3337, USA
cDepartment of Chemical Engineering, Mogilev State University of Food Technologies, 3
Shmidt Prospekt, 212027 Mogilev, Belarus
dJSC Grodno Azot, 100 Prospekt Kosmonavtov, 230013 Grodno, Belarus
eDepartment of Physical Chemistry, University of Rostock, Dr.-Lorenz-Weg 2, D-18059
Rostock, Germany
fPilot Production, Institute of Bioorganic Chemistry, National Academy of Sciences, 5/3
Academician V. F. Kuprevich Street, 220144 Minsk, Belarus
*Corresponding author, e-mail address: [email protected]
**Retired. Current address: 4055 Victory Drive, Frisco TX 75034, USA
†Deceased

2
Abstract
In this review, results of the studies of thermodynamic properties of organic substances conducted
at the Chemistry Department of the Belarusian State University (Minsk, Belarus) over a period of
more than 50 years are summarized. Emphasis is made on precise measurements (both calorimetry
and equilibria) and prediction methods, including group-contribution, quantum chemical, and
statistical mechanical, for a broad range of thermodynamic properties of various classes of
chemical substances. The principal purposes of these studies were to establish relationships
between thermodynamic properties of organic substances and their molecular structure, develop
methods of extrapolation and prediction of the properties of substances lacking experimental data,
and provide thermodynamic background for innovative energy- and resource-saving technologies.

3
1. Introduction
Over a period of more than 50 years, a large number of studies of thermodynamic properties of
organic substances were conducted at the Chemistry Department of the Belarusian State University
(Minsk, Belarus). Our cross-generational team, united by enthusiasm for the subject matter and
mutual trust, gained strength from the breadth of interests and technical skills present in its
members. Our research was inspired by the scientific traditions established by Frederick D. Rossini
[1], Kenneth S. Pitzer [2], Edgar F. Westrum, Jr. and John P. McCullough [3], Sergey M. Skuratov
and Viktor P. Kolesov [4], and Vladimir M. Tatevsky [5]. Our studies were designed to generate
high-precision experimental measurements of the thermodynamic properties of organic
compounds, elucidate relationships between thermodynamic properties of organic substances and
their molecular structure, create methods of extrapolation and prediction of the properties of
substances lacking experimental data, and provide a thermodynamic background for innovative
energy- and resource-saving technologies.
2. Experimental methods
Original apparatuses for high-precision experimental measurements of a wide variety of
fundamental thermodynamic parameters were designed, built, or improved [6], including for:
enthalpies of chemical reactions; enthalpies of phase transitions such as crystal-to-crystal, crystal-
to-liquid, crystal-to-gas, and liquid-to-gas; and heat capacities of and vapor pressure over various
phases. These parameters are of critical importance for thermodynamic characterization of
individual substances and chemical reactions and for relating molecular structures and properties,
as expressed in correlations and group contributions. These are also valuable data for innovative

4
industrial developments such as energy-saving chemical engineering technologies, methods of fuel
production from plant biomass, and processes in gas-generating and thermostabilizing systems.
2.1. Chemical equilibria
One of the most important problems in chemical thermodynamics is determining equilibrium
compositions in chemical reactions based on their standard enthalpies r𝐻𝑇 and entropies r𝑆𝑇
o.
Our research has clearly demonstrated that solving the reverse problem is a powerful method for
obtaining these quantities. Based on temperature dependences of equilibrium constants K, we use
the equations:
𝑅𝑇2 (𝜕ln𝐾
𝜕𝑇)𝑝= ∆r𝐻𝑇
° ,
𝑅 (𝜕(𝑇ln𝐾)
𝜕𝑇)𝑝= ∆r𝑆𝑇
° . (1)
Experimental studies of chemical equilibria to determine the thermodynamic parameters of the
reactions were initiated by Prof. D. N. Andreevsky. At the beginning of these efforts, the most
significant drawback was the absence of a universal experimental technique for achieving and
quantifying equilibria of reactions involving various classes of chemical compounds.
To address this challenge, we developed various experimental techniques applying appropriate
external conditions, using efficient catalysts to assure desired selectivity and rates of the reactions,
and choosing temperature ranges suitable for high-precision determination of the reaction
enthalpies and entropies. Essential to these experiments, is confidence that chemical equilibrium
has been achieved, and so experimental design included various compositions of initial reactants
or their solutions as well as varying initial contact time between the reactants or their contact time
with a catalyst [7, 8].

5
We have shown that the best precision in determination of reaction enthalpies and entropies can
be achieved by using gas-liquid chromatography for analysis of equilibrium compositions. The
equilibria were studied with experimental apparatuses of three types: a static thermostated reactor
with periodic sample analysis, a dynamic flow reactor equipped with a dosing pump (figure 1),
and a pulse chromatographic apparatus (figure 2).
14
15
7 8 9
432
113
11
21
20
19
181716
121110
5
6
FIGURE 1. Apparatus for studying chemical equilibria in a dynamic flow system: 1, counterpoise
flask, 2, electric motor, 3, controller, 4, control panel, 5, thyristor relay, 6, dosing pump, 7,
electrolytic cell, 8, outlet capillary, 9, stirrer, 10, controlling thermometer, 11, thermometers, 12,
inlet capillary, 13, gas collector, 14, Dewar bottle, 15, condensate collector, 16, crushed glass filler,
17, thermostat jacket, 18, oil, 19, reactor, 20, heater, 21, catalyst area [7].

6
2
2
11 12
66543 7 8 2 9
10
1
FIGURE 2. Pulse chromatographic apparatus for studying chemical equilibria: 1, gas carrier
vessel, 2, liquid sample vaporizer, 3, packed chromatographic column, 4, thermal conductivity
detector, 5, preparation section, 6, potentiometric recorders, 7, flame ionization detector, 8,
capillary chromatographic column, 9, analytical section, 10, gas flow switch, 11, microreactor, 12,
microreactor section [7].
Chemical equilibria for the following reaction types and compound classes were systematically
studied: dehydrogenation of cyclohexanol [9], cyclopentanol [10], and methylcyclohexanols [9];
dehydrohalogenation of 2-chloropropane [11], chlorocyclohexane [12], and chlorocyclopentane;
and isomerization of alkanes C6H14 to C8H18 [13, 14], cyclohexane = methylcyclopentane [15],
alkenes C5H10 to C7H14 [16, 17, 18, 19, 20], methylcyclopentenes C6H10 [21], methylcyclohexenes
C7H12 [22], hexadienes C6H10 [23, 24], chloroalkanes C3H7Cl to C10H21Cl [20, 25, 26, 27, 28, 29],
diastereomers of alcohols including methylcyclohexanols, menthol, borneol [30], etc.
The results of the isomerization studies together with similar results available in the literature are
summarized in a reference book published originally in 1988 [31] and translated into English in
1992 [32].

7
2.2. Static bomb combustion calorimeters
Two static bomb combustion calorimeters were used by our group for studying substances of
general formula CnHmOkNl.
Bomb calorimeter V-08E [6]
This calorimeter was a customized version of the commercially manufactured V-08 calorimeter
with a bomb volume of about 330 cm3 and an energy equivalent close to 14700 JK-1. We added
an electronic temperature controller, an ignition control system, and a temperature data acquisition
unit. The relative standard uncertainty of the instrument was estimated from the standard deviation
of the mean in the experiments with benzoic acid to be 1.010-4 [33].
Bomb calorimeter KS-95 [34]
This calorimeter was designed and built to measure energies of combustion for small samples,
with a useful range of (0.05 to 0.5) g in mass. Its calorimetric bomb had a small volume (95 cm3)
and a constant-temperature air bath. Schematic representation of this calorimeter is shown in figure
3. The calorimetric bomb was suspended from a metal rod used in the ignition system. A Dewar
bottle of about 2500 cm3 volume was used as a calorimetric vessel. The bath temperature was
controlled with a proportional-integral-differential algorithm assuring temperature control with a
tolerance of ±0.01 K. The calorimeter constant was close to 9830 J·K-1, and the relative standard
uncertainty of the instrument was found to be 2.510-4 [34].

8
FIGURE 3. Schematic representation of the static bomb calorimeter of combustion KS-95: 1,
constant-temperature air bath, 2, compartment for the electronic control system, 3, thermostatted
compartment for the analog-digital converter, 4, calorimetric vessel, 5, cover of the constant-
temperature air bath, 6, calorimetric bomb, 7, platinum resistance thermometer, 8, screws securing
calorimetric vessel, 9, electric motor of calorimetric vessel stirrer, 10, electric motor of stirrer of
air bath, 11, control panel, 12, rod suspending the calorimetric bomb and used in the ignition
system, 13, second electrode used in the ignition system, 14, calorimetric vessel cover, 15, power
supply transformer [34].

9
2.3. Calorimeters to measure heat capacities and enthalpies of phase transitions
Four calorimeters used by our group (TAU-1, TAU-10, TM-2, and SK-1) for high precision
measurements of heat capacities and enthalpies of phase transitions provided a unique opportunity
to conduct these measurements over a temperature range from (5 to 700) K.
Adiabatic calorimeters TAU-1 and TAU-10 (BKT-3)
Two small volume calorimeters [35], TAU-1 and TAU-10, were commercially sourced from
VNIIFTRI (Russia) and were used to measure heat capacities and enthalpies of phase transitions
in the temperature range of (5 to 320) K and (5 to 370) K, respectively. We developed software to
support experimental data analysis including heat capacity polynomial interpolation, calculation
of enthalpies of phase transitions, purity determination with the fractional-melting technique, and
calculation of smoothed heat capacities and derived functions. At T > 40 K, the expanded
uncertainty was found to be 410–3Cp [6, 36].
Scanning calorimeter of a heat-bridge type TM-2 [6]
This calorimeter (figure 4) was designed and built in our laboratory by engineer Evgeny N.
Kozyrsky. The use of two measuring cells, one with a studied sample and the other with a reference
sample, made it possible to conduct heat-capacity measurements in the temperature range of (250
to 650) K based on the equation:
CP = A(T)(Ux / Us) - B(T) (2)
where Ux and Us are voltages of thermocouples used in the sample cell x and in the reference cell
s, A(T) and B(T) are calibration parameters. We showed that the reduction in heat-adsorbing
surfaces and stronger thermocouple signals results in higher repeatability of the heat-capacity
measurements for the two-cell calorimeter in comparison with the triple heat bridge apparatus [37].

10
Also, we demonstrated that reflective properties of the cell surface should be kept as constant as
possible to obtain the best results.
To vacuum
1 2
3
4
56
78
3
S X
USUX
Common
FIGURE 4. Differential scanning calorimeter of a heat-bridge type: 1, reference cell,
2, sample cell, 3, Constantan rods, 4, heater, 5, cover, 6, stainless steel shield,
7, thermocouples, 8, copper heater block [6].
Single-cell scanning calorimeter SK-1
This instrument was designed and built to measure heat capacities and enthalpies of phase
transitions in the temperature range of (300 to 700) K (figure 5) for samples of a (0.1 to 0.5) g
mass. The control system and software, developed in-house, allowed for heating rates of (0.1 to 4)
K·min-1, as well as on-going testing, automated corrections for baseline drift, and smoothing
experimental results.

11
FIGURE 5. Single-cell scanning calorimeter SK-1: 1, pin and socket connector, 2, calorimeter
base, 3, vacuumed jacket, 4, platinum resistance thermometer, 5, jacket heater, 6, calorimetric
jacket, 7, ampoule with a sample, 8, sample holder made of Chromel, 9, thermocouple wire
(Copel).

12
2.4. Calvet-type differential heat flux microcalorimeter
A commercial solution microcalorimeter MID-200 was redesigned to measure enthalpies of
vaporization and sublimation [38]. Special calorimetric cells were designed and built by Viktor M.
Sevruk (figure 6).
I II III
1
2
11
62 2
4
17
18 19
33
7
5
16
15
14
12
13
8
109
To the diffusionoil pump
FIGURE 6. Calorimetric cell for a differential heat flux calorimeter: 1, the lower lid, 2,
evaporation chamber, 3, effusion cell with a sample, 4, metal rod, 5, spring, 6, directing channel,

13
7, subsidiary rod, 8, bellows, 9, fixing screw, 10, limiting strap, 11, metal shields, 12, Teflon
tube, 13, segmental shields, 14, thermoinsulating coats, 15 and 16, metal contacts for
thermostating, 17, glass cell, 18, metal rod with a seal band, 19, metal rod with a spire, I,
evaporation chamber with crushed ampoule, II, evaporation chamber with an effusion cell closed
by a metal rod, III, evaporation chamber with an effusion cell obtained by piercing the
membrane [38].
The enthalpies of vaporization (sublimation), Δvap(sub)H, were determined as follows:
∆vap(sub)𝐻 = 𝐾 ∫ ∆𝐸(𝜏)d𝑇𝜏
0 (3)
where ΔE is the voltage corresponding to the temperature difference between the calorimetric cell
and the heat-conductive thermostatted shell, and K is the coefficient determined during a
calibration using reference materials such as water, naphthalene, or benzoic acid. The relative
standard uncertainty for the enthalpies of vaporization or sublimation was close to 510-3.
2.5. Determination of vapor pressure by the Knudsen effusion method [6]
The vapor pressure of a variety of substances was measured by the Knudsen effusion method with
the use of two apparatuses designed and built in our laboratory. These instruments, similar in
overall design, had different thermostats. The low-temperature apparatus (figure 7) used a liquid
thermostat and allowed the measurements to be conducted in the range T = (243 to 358) K. In the
high-temperature apparatus, the effusion cell was inserted into a thermostatting block made of
copper, yielding a working range of T = (308 to 530) K. The vapor pressure was calculated with
the equation:
𝑝s =∆𝑚
𝐾𝑆𝜏√2𝜋𝑅𝑇
𝑀, (4)

14
where Δm is the sample mass loss during exposure time τ, S is the orifice surface area, M is the
molar mass of a vapor, and K is the Clausing coefficient. For crystalline samples, the condensation
coefficient was also considered. We introduced corrections associated with the sample mass loss
Δmn and time Δτn under non-stationary conditions. Anisotropy of a gas in the Knudsen cell was
considered [39, 40], which made it possible to extend an upper limit of the measurable vapor
pressure to 70 Pa. To measure the vapor pressure over crystals, we used special cells with the
enlarged contact surface area, maximizing heat transfer with the sample.
FIGURE 7. Apparatus for vapor pressure determination by the integral effusion Knudsen method:
1, measuring unit (effusion cell with a sample, system connecting to vacuum, liquid nitrogen trap),
2, oil diffusion pump, 3, vacuum meter with thermocouple vacuum metering lamp, 4, liquid
thermostat, 5, rotary vane vacuum pump, 6, helium vessel, 7, bellows vacuum switches [6].

15
A combination of the experimental apparatuses described in sections 2.1 to 2.5 provided the unique
capabilities of determining heat capacities, vapor pressures, enthalpies of formation, and derived
properties in the crystal, liquid (glass), and gas phases.
3. Thermodynamic properties and molecular structure
3.1. Modeling and prediction of thermodynamic properties based upon classical theory of
molecular structure
We discovered great benefit from exploring the relationship between thermodynamic properties
and molecular structure. In particular, leveraging the classical theory of molecular structure and
the principles suggested by Tatevsky [5], we developed efficient methods for property prediction.
In these methods, property P can be presented as a sum:
−
− ++=
ji
ji
ji
ji
i
i
aa
aa
aa
aa
a
a PPPP (5)
where iaP ,
ji aaP − and ji aaP are partial properties associated with effective atom ai, effective
bond ai-aj, and interaction of chemically non-bonded atoms ai↔aj. Tatevsky distinguished
effective atoms by their chemical nature, valence state, and environment. We suggested adding
“cyclicity” as an identifying factor for effective atoms [41] and demonstrated [7, 8, 41] that six
types of effective carbon atoms can be identified by considering their cyclicity (Table 1).
Superscripted indexes (CI, CII, CIII, CIV, S-CI, CII ≥ 2) characterize the size of the ring containing
the carbon atom. For example, CI = 2 corresponds to a double bond while CI = 2, CII = 2
corresponds to a triple bond.

16
TABLE 1
Types of effective atoms considering their cyclicity
Type Abbreviation Structure
Acyclic C
C
Monocyclic ICC
Bicyclic III ,CCC
Tricyclic IIIIII ,, CCCC
Tetracyclic IVIIIIII ,,, CCCCC
Spiro III ,CCSC −
Addition of the cyclicity parameter allowed for uniform classification of atom types in cyclic
compounds. This significantly expanded possibilities of additivity-based (group-contribution)
methods for property prediction. Grikina and Tatevsky independently made a similar conclusion
[42]. Applying such modeling methods to physical and chemical properties yielded a foundation
for addressing a wide range of challenges based upon classical theory [7]. Example applications

17
include planning experiments, evaluating self-consistency testing of experimental data, predicting
properties of substances lacking in experimental data, and detecting compounds that display
anomalous behaviors.
For polyfunctional compounds, we developed prediction schemes that reduced the number of
parameters without compromising the fidelity of the model. One particularly powerful approach
[7, 43, 44, 45, 46] is based on incremental substitutions RH → RX, where X represents, for
example, CH3, halogens, or OH. Normal alkanes were selected as the reference series for acyclic
saturated compounds. The substitutional groups were subdivided into primary, secondary, tertiary,
and quaternary. In addition, interactions between the substituent (X) and other non-hydrogen
atoms located in positions 1 and 4 relative to each other were taken into account. Thus, the enthalpy
of formation of the compound RX can be predicted as follows:
fH(RX) = fH(n-CnH2n+2) + ∑ 𝑙𝑖∆∆f𝐻(X)𝑖 + ∑ ∑ 𝑚𝑗𝑘𝛽1↔4(X𝑗 ↔ X𝑘)𝑘≥𝑗𝑗 (6)
The results from this methodology are independent of the order of substitutions. Moreover, when
comparing this approach to one based on classification of effective bonds, reliability in prediction
of enthalpies of formation in the gas and liquid phases is comparable even while the number of
required parameters is halved [42, 44].
In many instances, physical justification of the additivity-based (group-contribution) methods is
not straightforward. Indeed, it was shown [46] that the partition function
−
=i
kTieQ/
(7)
and, correspondingly, thermodynamic properties that depend on it (Cp, S, etc.) are not additive.
However, the fact that these properties do tend to exhibit additive behavior results from mutual
cancellation of non-additivity effects for transitional, rotational, and vibrational contributions. We

18
demonstrated a possibility to deploy group-contribution methods for prediction of enthalpies of
formation, heat capacities, and entropies for solid substances [44, 46, 47] in homologous series of
alcohols, ketones, and alkyl-substituted ureas of the general formula
C N
O
N
R3
R4
R1
R2 ,
where R1, R2, R3, R4 are alkyl moieties. Intermolecular interactions in condensed systems,
particularly in crystals, are by far more significant than those in the gas. However, the effectiveness
of additivity-based schemes even in these configurations speaks to the capability of such
formulations to incorporate additional, non-linear effects into the existing terms.
3.2. Thermodynamics of isomerization [7, 8, 31]
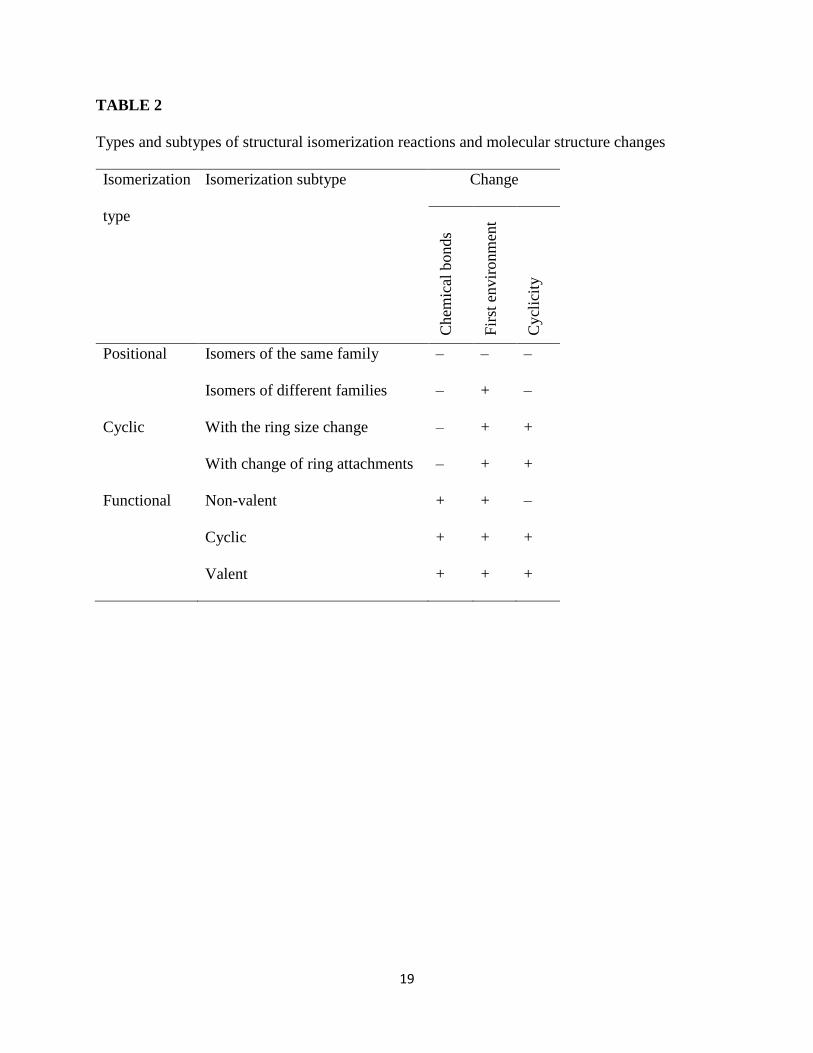
We proposed classifying isomerization reactions by their types and subtypes (Table 2). For all
three isomerization types, we provided detailed analysis of trends associated with enthalpies ΔrH
and entropies ΔrS of isomerization reactions. A majority of the isomerization reactions have ΔrG
< 10 kJ·mol-1, and so an absence of “isomeric chaos” or tautomerism is determined by kinetic
factors. We suggested considering a Gibbs energy of activation ΔG≠ ≈ 100 kJ·mol-1 as a reasonable
division between structural isomers and tautomers. Such a boundary corresponds to a half-life of
about 24 h at T = 300 K (figure 8).
19
TABLE 2
Types and subtypes of structural isomerization reactions and molecular structure changes
Isomerization
type
Isomerization subtype Change
Chem
ical
bonds
Fir
st e
nvir
onm
ent
Cycl
icit
y
Positional Isomers of the same family – – –
Isomers of different families – + –
Cyclic With the ring size change – + +
With change of ring attachments – + +
Functional Non-valent + + –
Cyclic + + +
Valent + + +

20
FIGURE 8. Activation scale of conformational transformations at T = 298 K. k is a reaction rate
constant, calculated as k = (kBT/h)exp(-G/RT), is an average lifetime, = 1/k. Reproduced from
Ref. [48] with permission from the Royal Society of Chemistry.
Following van der Waals’ principles of defining a “pure substance” from a thermodynamic
standpoint [49], one can distinguish:
1) Pure substances, for which melting and normal boiling temperatures are constant, although their
equation of state might be complex. Such systems will have a logarithmic contribution caused by
the mixing of different molecules:
mixS = –R∑ 𝑥𝑖ln𝑥𝑖𝑖 (8)
2) “Thermodynamic individuals” for which the entropy does not have a mixing contribution.
0 25 50 75 100 125 150
G / kJ.mol-1
k / s-1
/ s
6 .1012 3 .108 1 .104 0.45 2 .10-5 8 .10-10 3 .10-14
2 .10-13 4 .10-9 9 .10-5 2.2 5 .104 1 .109 3 .1013
Not separable conformersSeparable conformers

21
3) “Molecular individuals” characterized by a unique molecular structure.
This system can be further expanded to take advantage of a detailed understanding of molecular
structure, allowing us to distinguish five categories of substances [8]:
1) isomerically pure substances consisting of molecules with the same atomic composition;
2) structurally pure substances consisting of molecules of the same structure but having a variety
of conformational and configurational species.
3) configurationally pure substances consisting of either achiral or chiral but configurationally
identical molecules;
4) conformationally pure substances consisting of molecules of the same conformation due to
structural, thermodynamic, or kinetic limits to form conformational mixtures;
5) individual substances consisting of molecules with a single possible configuration.
Ideal-gas thermodynamic properties of conformational mixtures can be represented as [50]:
𝑆o = ∑ 𝑥𝑖𝑆𝑖o𝑛
𝑖=1 + 𝑆confo = ∑ 𝑥𝑖𝑆𝑖
o𝑛𝑖=1 − 𝑅∑ 𝑥𝑖ln𝑥𝑖
𝑛𝑖=1 , (9)
𝐶𝑝o = ∑ 𝑥𝑖𝐶𝑝,𝑖
o𝑛𝑖=1 + 𝐶𝑝,conf
o = ∑ 𝑥𝑖𝐶𝑝,𝑖o𝑛
𝑖=1 +1
𝑅𝑇2∑ 𝑥𝑖𝑛𝑖=1 ∑ 𝑥𝑗(∆𝐻𝑖𝑗
o)2𝑛
𝑗>1 , (10)
𝐻o(𝑇)−𝐻o(0)
𝑇= ∑ 𝑥𝑖
𝐻𝑖o(𝑇)−𝐻𝑖
o(0)
𝑇
𝑛𝑖=1 + ∆𝐻conf
o = ∑ 𝑥𝑖𝐻𝑖o(𝑇)−𝐻𝑖
o(0)
𝑇
𝑛𝑖=1 + ∑ 𝑥𝑖
∆𝐻1𝑖o
𝑇
𝑛𝑖=2 , (11)
where xi is the equilibrium mole fraction of the ith conformer and ∆𝐻𝑖𝑗o is the enthalpy difference
between the ith and jth conformers. Conformational contributions to entropy and heat capacity as
a function of temperature and the enthalpy difference for mixtures containing three and six
conformers are shown in figure 9.

22
FIGURE 9. Conformational contribution to heat capacity and entropy for the systems: (a) and (c),
one most stable conformer and two conformers of relative enthalpy H; (b) and (d), one most
stable conformer and five conformers of relative enthalpy H. Reproduced from Ref. [48] with
permission from the Royal Society of Chemistry.
0 10 20 30 40 50
H / kJ.mol-1
0
2
4
6
Cco
nf /
J. K
-1. m
ol-1
100 K
1000 K
800 K
500 K
300 K
0 10 20 30 40 50
H / kJ.mol-1
0
4
8
12
Cco
nf /
J. K
-1. m
ol-1 1000 K
800 K
500 K
300 K
100 K
0 10 20 30 40 50
H / kJ.mol-1
0
2
4
6
8
10
Sco
nf /
J. K
-1. m
ol-1
1000 K
800 K
500 K
100 K
300 K
0 10 20 30 40 50
H / kJ.mol-1
0
4
8
12
16S
con
f / J
. K-1
. mo
l-1
100 K300 K
500 K 1000 K800 K
a b
c d

23
3.3. Calculation of thermodynamic properties with statistical thermodynamics
Statistical thermodynamics makes it possible to extrapolate thermodynamic properties over a
broad range of temperatures and to establish a relationship between molecular structure and
macroscopic thermodynamic properties. For an ideal gas, the entropy is presented as a sum of
contributions corresponding to various degrees of molecular freedom (translation, overall rotation,
vibration, internal rotation, and electronic) [51]:
𝑆(𝑇, 𝑃) = 𝑆tr (𝑇, 𝑃) + 𝑆rot(𝑇) + 𝑆vib(𝑇) + 𝑆int.rot(𝑇) + 𝑆e(𝑇) (12)
These contributions, in turn, depend on molecular parameters such as the molar mass, M, the
product of moments of inertia, IAIBIC, the symmetry number, σ, the frequencies of normal modes,
νi; potential functions, V(φ), and reduced moments of inertia, Ir, of internal rotation, and energies
of electronic levels of a molecule. To determine the entropy and other thermodynamic properties
of gases, one requires detailed information about the structure and energy states of the molecule.
We demonstrated [52] that calculations of thermodynamic properties using methods of statistical
thermodynamics can be performed reliably even in the situations when there was no reliable
experimental data related to molecular structure parameters. Such situations are rather common
because either the targeted substances cannot be synthesized, or the synthesized samples cannot
be purified enough for reliable experimental measurements. Under those circumstances we
performed calculations of thermodynamic properties using algorithms illustrated in figures 10 and
11. These algorithms include the use of quantum chemical procedures for determination of the
geometric parameters, the normal vibration frequencies, the potential barriers of internal rotation
and of ring inversion, and the energy states of the molecule of interest.

24
FIGURE 10. Principal algorithm of statistical thermodynamics calculations of ideal-gas entropy.
M IAIBIC σ
vi
normal vibrations
Molecular
geometry
Str(T, P) Srot(T)
Svib(T)
S(T, P)
Quantum-chemical
calculations
Parameters of internal
rotation V(), Ir
Sconf(T)

25
FIGURE 11. Principal algorithm of the fH calculation using quantum-chemical methods and the
isodesmic reactions concept.
We used these algorithms in a systematic study of the thermodynamic properties of polyhedranes,
CnHn [53], including Platonic polyhedron structures such as tetrahedrane, C4H4, cubane, C8H8, and
dodecahedrane, C20H20; truncated Platonic polyhedron structures including truncated tetrahedrane,
C12H12, truncated octahedrane, C24H24, truncated cubane, C24H24, truncated icosahedrane, C60H60,
and prismanes, C10H10, C12H12, C14H14, and C16H16. The results of our experimental measurements
of the thermodynamic properties of cage hydrocarbons confirmed the above statistical mechanical
procedures in the combined temperature range of (5 to 530) K including adamantane, C10H16 [54,
Quantum-chemical calculations for
all participants of an isodesmic
reaction
H(T) – H(0) ZPVE
vi Mol. geometry
Experimental ∆fH for all participants
of an isodesmic reaction except
a target compound
Etot
∆rH298
∆fH of a target compound
V, Ir

26
55], 1,1-diadamantane C20H30 [56]; heptacyclotetradecane C14H16 [57], and pentacycloundecane
C11H14 [58]. For calculations of the enthalpies of formation of hydrocarbons CnHn, we used the
following isodesmic reaction:
. (13)
Having identified limits for the use of classical approaches for determining the internal rotation
contributions as a function of a potential barrier and a statistical sum of a free rotor [51, 59, 60],
we developed new procedures for statistical calculations of the ideal-gas thermodynamic
properties for such molecules. We proposed a new method for estimation of the reduced moment
of inertia for pseudorotation in a cyclopentane ring [61]. We established that one can use equations
(9) to (11) to calculate contributions of intramolecular transformations based on energy differences
of conformers ΔHij and their equilibrium compositions xi [50].
3.4. Determination of structural parameters of molecules using methods of statistical
thermodynamics
Pitzer [2] first demonstrated the power of statistical thermodynamics in determining structural
parameters of molecules based on enforcing consistency between the calculated and
experimentally derived values of entropy, S°, and heat capacity, Ср, in an ideal gas. As a part of
this development, the concept of hindered internal rotation was established, and the value of the
potential barrier of internal rotation in ethane was determined. The presence of free pseudorotation
in cyclopentane and ring inversion in cyclohexane derivatives was also demonstrated [2].
Following this approach, we estimated conformational and tautomeric (isomeric) compositions for
substituted derivatives of cyclohexane and cyclopentane [62, 63, 64], tetrazole [65, 66], parabanic

27
and barbituric acids [67, 68], fullerene hydrides (C60Hn, n = 2, 4, 8, 18, and 36) [52, 53] as well as
had determined the parameters of molecular models. These results allowed us to reach excellent
consistency in entropy for other compounds [34, 55, 69, 70, 71, 72, 73].
4. Thermodynamic properties, phase states, and their structures
4.1. Discreteness of thermodynamic properties of substances at phase transitions and at a glass
transition
Thermodynamic properties change discretely at the transitions crystal (glass) → liquid → gas
(figure 12), following these trends:
1. Normally, heat capacities of organic liquids are greater than those of the crystal and gas phases
for the same substance at the same temperature T, although for the entropies, 𝑆cr° (𝑇) <
𝑆l°(𝑇) < 𝑆g
°(𝑇).
2. Heat capacity of a liquid is higher than that of a glass even though the structures and entropies
of a glass and a supercooled liquid at T → Tg are identical.
3. Coefficients of thermal expansion αp for liquids are significantly higher than those for crystals.
We used a type of lattice model called a hole model to describe the heat capacity changes at the
glass transition and fusion. In this model, the liquid volume V is divided into cells of equal volume
v0. Then,
𝑉 = 𝑣0(𝑁0 + 𝑁1𝑟) (14)
where N0 and N1 are the numbers of empty cells (holes) and molecules, respectively, and r is the
number of cells occupied by a molecule. Thermal expansion of a liquid is assumed to be caused
by increasing v0 due to anharmonicity of vibrations and N0. The latter explains the higher thermal
expansion coefficients and heat capacity of the liquid relative to the glass or crystal.

28
FIGURE 12. Heat capacity (a) and entropy (b) for different phases of cyclohexyl formate.
Reproduced from Ref. [48] with permission from the Royal Society of Chemistry.
Following DiMarzio and Dowell [74], we assumed that
∆gll 𝐶𝑝 = ∆𝐶conf + ∆𝐶vib + 𝐶h (15)
where Cconf is the conformational contribution to the liquid heat capacity, Ch is the hole
contribution caused by the change in the number of empty cells in the liquid with temperature, and
Сvib is a contribution related to changes in temperature dependences of vibrational frequencies
while transforming from glass to liquid. The conformational contribution appears because the
conformational transformations, frozen in the glass, are allowed in the liquid phase. This
contribution was found from the equation:
𝐶conf =1
𝑅𝑇2∑ 𝑥𝑖𝑛𝑖=1 ∑ 𝑥𝑗
𝑛𝑗>1 ∆𝑖𝑗𝐻
2 (16)
The contribution Сvib was estimated using heat capacity of the glass and the difference
(αp(l) - αp(gl)). To find the hole contribution, the enthalpies of vaporization and (αp(l) - αp(gl)) were
0 100 200 300T / K
0
50
100
150
200
Cp
o /
J·K
-1·m
ol-1
Tg Tfus
liquid
glass
crystal
gas
0 100 200 300T / K
0
100
200
300
400
So /
J·K
-1·m
ol-1
Tg Tfus
liquid
glass
crystal
gas
a b

29
needed. We identified hole contributions greater than 0.80∆gll 𝐶𝑝 [48]. Similar results were
obtained for the heat-capacity change at fusion.
4.2. Thermodynamic properties of plastic crystals of organic compounds
Plastic crystals can be defined as molecular crystalline phases in which there is a possibility of
molecular rotation without changes of the positions of the centers of mass of the molecules (figure
13). These rotations are reflected in their thermodynamic, mechanical, dielectric, and spectral
properties [75, 76].
Our studies of phase transitions of cyclic alcohols, halogen-substituted cycloalkanes, cage
hydrocarbons, and adamantanes made it possible to establish the following trends [54, 77, 78, 79,
80, 81, 82, 83, 84, 85]:
1. It is impossible to predict the ability of substances to form plastic crystals based solely on their
molecular structure.
2. The temperature ranges of stability of the plastic crystal phase can vary from a fraction of a
kelvin to > 100 K (figure 14).
3. For a majority of substances that form plastic crystals, ΔS ≥ 2R for transitions into the plastic
phase, ΔS ≤ R for fusion.
4. Transitions of the type rigid crystal → plastic crystal are accompanied by a sharp increase in
heat capacity (figure 15), where Cp varies from about zero to 100 J·mol-1·K-1.
5. IR-spectroscopic studies of organic compounds at various temperatures proved that, in the
plastic phase, substances exist as mixtures of conformers similar to liquids. In the rigid crystal
phase, all molecules in the lattice have a single conformation.

30
Êðèñòàëë
Èçî òðî ï í àÿæèäêî ñòü
Æèäêèéêðèñòàëë
Ï ëàñòè÷åñêèéêðèñòàëë
Êðèñòàëë Êðèñòàëë
Èçî òðî ï í àÿæèäêî ñòü
Èçî òðî ï í àÿæèäêî ñòü
Isotropic liquid
Isotropic liquid
Isotropic liquid
Plastic crystal
Liquid crystal
Crystal Crystal Crystal
FIGURE 13. Possible transition pathways from rigid crystal to isotropic liquid.

31
FIGURE 14. Temperature ranges of plastic crystal phase existence for adamantane and its
derivatives. Adapted from [76].
FIGURE 15. Temperature dependence of heat capacity of 1-adamantanol in the condensed state
at the saturation line: ◦, adiabatic calorimetry; solid line, differential scanning calorimetry. Adapted
from [76].
32
The entropy and heat capacity changes at the phase transitions from rigid crystal to plastic crystal
were presented as follows:
∆trS = ∆Sv + ∆Sconf + ∆Sor (17)
∆trСр = ∆Ср,v + ∆Ср,conf + ∆Ср,or (18)
where ΔSv and ΔCp,v were contributions caused by volume changes; ΔSconf and ΔCp,conf were
conformational contributions; and ΔSor and ΔCp,or were orientational contributions. We showed
[54] that ∆Sv ≈ 0.4∆trS and ∆Ср,v ≈ 0. Conformational contributions were calculated using eqs. (8)
and (16). Direct experimental measurements only enable confirmation of discrete orientational
changes for molecules in plastic crystals. Unfortunately, these measurements do not provide any
information about the distribution of energy states resulting from non-equivalent orientations of
molecules, nor, nor about differences in energy, ΔorE, between them. In Ref. [86], we considered
various physical models for estimation of ΔSor and ΔCp,or in plastic crystals of organic substances.
These models were based on the following principles:
1. In a plastic crystal, there are a number of energetically non-equivalent rotational orientations.
2. There is a single lowest energy level.
3. The entropy of each ensemble consisting of only molecules in one of rotational orientation is
postulated to be the same as all others.
4. The distribution of molecules between energy states does not depend on molecular
conformations.
Our analysis consisted of finding a number of non-equivalent orientations, nor, and energy
differences between these orientations, ΔorE. Solutions for nor and ΔorE had to be consistent with
the target values of both ΔSor and ΔCp,or. In turn, the values of ΔSor and ΔCp,or were determined on
the basis of experimentally measured heat capacity as well as temperature and enthalpy of

33
transition. These solutions were found as intersections of iso-entropic curves,
ΔSor(nor, ΔorE) = const, and curves of constant heat capacity, ΔCp,or(nor, ΔorE) = const, plotted for
the temperature of the phase transition (figure 16).
FIGURE 16. Typical iso-entropic Sor = const and iso-heat-capacity Cor = const curves in
coordinates nor - orE for the “rigid crystal → plastic crystal” phase transition. Adapted from Ref.
[48] with permission from the Royal Society of Chemistry.
It was shown that the best agreement with the values of ΔSor and ΔCp,or for various plastic crystals
of organic substances was reached with models of orientational energy states formulated as (figure
17),
∆𝑖𝑗𝐻 ≈ ∆𝑖𝑗𝐸 = ∑ 𝑓(𝑘)∆or𝐸𝑗−1𝑘=𝑖 (19)
==
1if,0
1if,1)(
k
kkfa , or
kb kf −= 12)( , or
1)( −= kkfc (20)

34
where f(k) was an energy distribution function for various molecular orientations.
As demonstrated for a number of plastic crystals [86], the results obtained with the use of the three
models presented by eqs. (19) and (20) agreed reasonably well. The proposed methods are now
the only ones available for estimation of numbers of non-equivalent orientations and their energy
states in plastic crystals of organic substances.
FIGURE 17. Various cases of energy levels distribution in a plastic crystal. Reproduced from Ref.
[48] with permission from the Royal Society of Chemistry.
4.3. Thermodynamic properties of ionic liquids
Room-temperature ionic liquids (ILs) are formed by bulky, often asymmetric, organic cations and
organic or inorganic anions (figure 18).

35
FIGURE 18. Typical cations and anions of ILs
A wide liquid range (~270 to 500 K), very low vapor pressure (ps(298 K) < 10-8 Pa), high electrical
conductivity, and capability to dissolve broad classes of materials are characteristic for these
substances. ILs have demonstrated their potential in various applications and technologies: as
catalytic systems, selective extracting agents, electrolytes for batteries, supercapacitors,
components of electrolytic systems, heat transfer fluids, and solvents for polymers and
biopolymers. To justify conditions for industrial IL synthesis and their efficient technical use, a
thermodynamic analysis of the corresponding processes is required. As a result, over the last two
decades, thermodynamic properties of ILs have been actively studied [87, 88].
In 2001, following the suggestion by Dr. Joseph W. Magee (NIST, USA), we started a unique
program of systematically measuring the thermodynamic properties of these substances. So far,
over 20 ILs have been studied by adiabatic calorimetry, which included measurements of heat
capacities, temperatures and enthalpies of phase transitions, as well as parameters of glass
transitions in the temperature range (5 to 370) K. Most of the studied compounds are 1-alkyl-3-
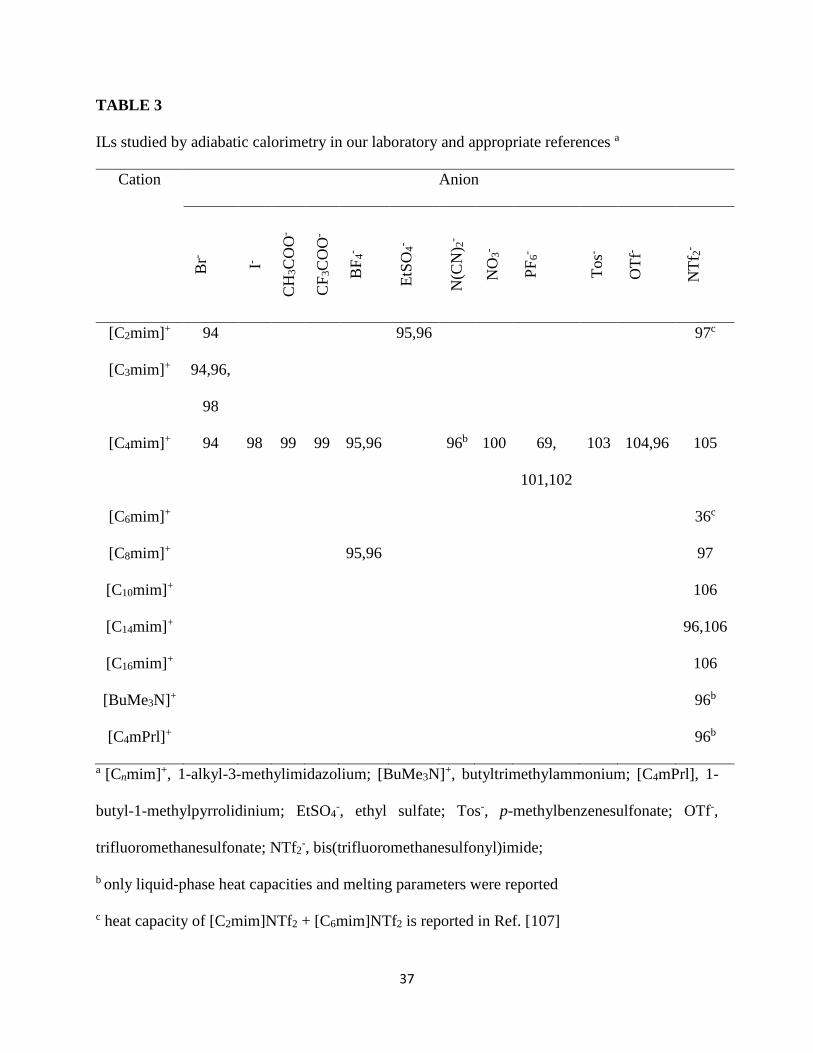
methylimidazolium ILs with various anions (Table 3).
36
Heat capacities of ILs in the liquid state available in the literature were analyzed [89] and a set of
mutually consistent uncertainties for these results was obtained. Recommended heat capacities
over a wide range of temperatures were derived for 23 ILs [89]. These recommendations were
recently extended to a larger number of ILs [90].
The vapor pressure of ILs was first measured in our laboratory [91, 92]. Using these results, we
determined thermodynamic parameters of vaporization for [Cnmim]NTf2 ILs, n = 2, 4, 6, and 8.
Molecular geometries, frequencies, and parameters of internal rotation necessary to calculate ideal-
gas thermodynamic properties of ILs were found with the use of quantum-chemical methods. The
calculated entropies agreed well with the values determined from the experimental data [70]. It
was demonstrated that, in the temperature range considered, ILs exist in the form of ionic pairs in
the gas phase.
Complex polymorphism was found in the [Cnmim]NTf2 family. Multiple melting points as well as
solid-to-solid phase transitions were identified [97, 106, 36]. The polymorphs were studied by IR
spectroscopy and X-ray diffraction at different temperatures [93]. Characteristic conformations of
the cations and anions in the various phases were determined.
Based on the thermodynamic properties obtained, the following predictive procedures were
developed.
37
TABLE 3
ILs studied by adiabatic calorimetry in our laboratory and appropriate references a
Cation Anion
Br-
I-
CH
3C
OO
-
CF
3C
OO
-
BF
4-
EtS
O4
-
N(C
N) 2
-
NO
3-
PF
6-
Tos-
OT
f-
NT
f 2-
[C2mim]+ 94 95,96 97c
[C3mim]+ 94,96,
98
[C4mim]+ 94 98 99 99 95,96 96b 100 69,
101,102
103 104,96 105
[C6mim]+ 36c
[C8mim]+ 95,96 97
[C10mim]+ 106
[C14mim]+ 96,106
[C16mim]+ 106
[BuMe3N]+ 96b
[C4mPrl]+ 96b
a [Cnmim]+, 1-alkyl-3-methylimidazolium; [BuMe3N]+, butyltrimethylammonium; [C4mPrl], 1-
butyl-1-methylpyrrolidinium; EtSO4-, ethyl sulfate; Tos-, p-methylbenzenesulfonate; OTf-,
trifluoromethanesulfonate; NTf2-, bis(trifluoromethanesulfonyl)imide;
b only liquid-phase heat capacities and melting parameters were reported
c heat capacity of [C2mim]NTf2 + [C6mim]NTf2 is reported in Ref. [107]

38
1. Heat capacity per unit volume (Cp/V) was 1.95 J·K-1·cm-3 for many ILs at T = 298.15 K and p
= 0.1 MPa [95], and the deviations did not exceed ±10 % of this value for the set considered. This
quotient weakly changed with temperature:
(Cp/V) / (J·K-1·cm-3) = 1.951 +8.33·10-4·((Т / K) - 298.15) (21)
The liquid-phase heat capacities of ILs in the range from Tg to 370 K were correlated with the
vibrational and conformational contributions of the ions [99, 108]. Deviations of the calculated
values were within ±0.03Cp of their experimental counterparts [108].
2. Additivity of IL heat capacities was demonstrated [89]. A substitution scheme based on the
anion increments Cp(NTf2 → X) was proposed. The temperature-dependent increments were
described with the equation:
Cp(NTf2 → X) / (JK-1mol-1) = b1 + 10-2c1(T / K) + 10-4d1(T / K)2, (22)
whose coefficients are listed in Table 4 [109].
TABLE 4
Coefficients of Eq. (22)
Х b1 c1 d1 T range / K
Br -189.0 -26.913 1.5539 230 to 370
BF4 -170.0 -3.431 -1.4332 250 to 370
CF3SO3 -49.2 -27.871 1.5539 315 to 425
EtSO4 304.5 -81.118 13.762 200 to 370
PF6 -157.8 -4.945 1.5539 200 to 330
CH3COO -62.9 -76.776 12.172 210 to 370
CF3CO2 -117.0 -18.736 1.5539 190 to 370

39
Tos -73.5 1.909 1.5539 350 to 370
NO3 -145.6 -27.324 1.5539 310 to 370
An incremental scheme using the equation
Cp([CnCat]An) = Cp([C6mim]NTf2) + (n - 6)Cp(H → CH3) + Cp(NTf2 → An) +
Cp([C6mim] → [C6Cat]) (23)
was developed [108]. A similar approach was proposed for the IL entropy in the liquid phase.
3. The solid-phase enthalpies of formation fH of potassium salts at T = 298.15 K were correlated
with fH of imidazolium ILs [110] using the equations:
fH([C4mim]An) = fH([C4mim]Br) + fH(KBr → KAn) (24)
fH([C4mim]An) = fH([C4mim]NO3) + fH(KNO3 → KAn). (25)
The increments were estimated for the anions NO3-, F-, Cl-, MnO4
-, HS-, CNO-, CN-, ClO4-,
ClO3-, and BF4
-.
4. The enthalpies of vaporization vapH for ILs known for their low vapor pressure can hardly be
directly measured in calorimeters working at T < 550 K. Therefore, development of empirical
predictive procedures is of high priority. Initially, we proposed a correlation based on the Stefan
equation [92], which predicted vapH at T = 298.15 K based on the surface tension and molar
volume Vm:
vapH = A(Vm2/3NA
1/3) + B, (26)
where NA is the Avogadro’s number and A and B are the empirical coefficients.
Several empirical correlations based on the molar mass, M, molar volume, Vm, or density, , and
surface tension, ,
vapH = f(M, Vm(or ), ) (27)

40
were obtained with symbolic regression approaches [111]. These correlations describe the
experimental enthalpies of vaporization for 19 ILs at T = 450 K quite well. For example, a four-
parameter correlation described the experimental data within ±6 kJmol-1. Additionally, a
procedure for estimation of vapH at T = 450 K using the increments for substitution of the cation
base as well as substituents and the anions in the reference substance [C1mim]NTf2 was developed
[111].
4.4. Thermodynamic properties of carbon allotropes: fullerenes C60 and C70 and multi-walled
carbon nanotubes
It is well-known that carbon allotropes (graphite, diamond, fullerenes, and nanotubes) have distinct
physical properties and have a range of uses in technical materials and devices. To better
understand conditions for the synthesis and use of fullerenes, their hydrides, and carbon nanotubes,
we carried out thermodynamic studies and expert evaluation of the available thermodynamic and
structural data.
Based on detailed analysis of multiple experimental studies of the thermodynamic properties of
fullerenes C60 and C70, recommended values for Cp(T), subH(T), and ps were derived. The most
reliable spectroscopic results were selected for statistical thermodynamics calculations for C60 and
C70. The suggested set of frequencies of intramolecular vibrations provided good agreement with
the experimental and calculated heat capacities of crystalline C60 and C70 in the temperature range
(300 to 550) K [112]. Analysis of heat capacity data let us conclude that the hindered rotation of
C60 molecules occurs above the solid-to-solid phase transition at Ttr = 260.7 K [113]. The effective
potential barrier was estimated to be 5 kJmol-1. A similar barrier for crystalline C70 was about 3
kJmol-1. Unlike most organic compounds, crystalline C60 and C70 have two inflection points in

41
their heat capacity curves. This behavior results from the low Debye temperatures equal to 46 K
and 40 K, respectively, and low frequencies of librations. Ideal-gas thermodynamic properties for
fullerenes were calculated in the temperature range (100 to 5000) K using statistical
thermodynamics. The resulting entropies, Sº(C60, 860 K) = 1464 J·K-1·mol-1 and Sº(C70, 843.5 K)
= 1669 J·K-1·mol-1, deviated from the experimental values by (1.0 to 1.5) %, which did not exceed
the experimental uncertainties.
Heat capacities of the stacked-cup multi-walled carbon nanotubes (MWCNT) were measured in
an adiabatic calorimeter in the range (5 to 370) K. The energy of combustion cu(298.15 K) = -
(32809 ± 73) J·g-1 for the carbon-only material was found by correcting the experimental value
determined in an isoperibol combustion calorimeter for elemental composition of the dried sample.
The solid residue after the combustion experiments corresponded to NiO oxide formed from a
6.910-3 mass fraction of nickel. This metal could not be removed from the material by magnetic
separation [114].
The apparent density of MWCNT [115], ρ = (2.21 ± 0.02) g·cm-3 at T = 293 K, was found from
experimental densities of the suspensions with water, toluene, and [C4mim]PF6. Densities for the
IL-containing systems could be determined for both the liquid-filled and hollow MWCNT. These
results made it possible to estimate geometrical characteristics of the material.
The heat capacity of MWCNT exceeded that of graphite by (3.3 to 3.6)∙10-2cp in the temperature
range (300 to 370) K [114]. This similarity was used to estimate thermodynamic properties of
MWCNT at T > 370 K. The enthalpies of formation, heat capacities, and entropies of MWCNT
are close to those of graphite above T = 200 K (Table 5). This is physically justified since the
distances between the carbon layers in MWCNT ( 0.36 nm) and in graphite (0.3355 nm [116])
are close and the density of MWCNT is comparable with that of graphite (ρ = 2.265 g∙cm-3 [116]).

42
Crystalline fullerenes are less stable than graphite due to the higher enthalpies of formation. It was
demonstrated [117] that the thermodynamic instability of crystalline C60 and C70 relative to
graphite holds to a temperature of 3000 K and a pressure of 20 GPa. However, in the gas phase,
the equilibrium radically shifts towards the fullerenes due to significantly lower enthalpies of
sublimation for C60 and C70. Thus, the successful synthesis of the fullerenes was realized through
high-temperature sublimation of carbon [118].
TABLE 5
Thermodynamic properties of different forms of carbon a,b
Carbon form T / K
ΔfH°(T) /
kJ∙mol-1
Cp°(T) /
J∙K-1∙mol-1
So(T)-So(0) /
J∙K-1∙mol-1
ΔfG°(T) /
kJ∙mol-1
Graphite
[119,120]
298.15 0 8.517 0.009 5.74 0.10 0
1000 0 21.610 0.022 24.46 0.10 0
MWCNT [114] 298.15 0.6 0.9 8.842 ± 0.035 6.225 ± 0.025 0.5 0.9
1000 1.0 0.9 22.3 25.5 -(0.1 0.9)
Fullerene C60 (cr)
[112]
298.15 39.1 0.2 8.760 0.044 7.118 0.036 38.7 0.2
1000 37.6 0.2 21.35 0.21 25.87 0.26 36.2 0.4
Fullerene C70 (cr)
[112]
298.15 36.5 0.3 8.937 0.045 6.467 0.032 36.3 0.3
1000 36.6 0.3 21.46 0.21 25.41 0.25 35.6 0.4
a expanded uncertainties for 0.95 confidence interval are given in the table
b per mole of carbon atoms

43
5. Thermodynamic properties of substances and technological applications
5.1. Chemical exergy of organic substances and a thermochemical model of the environment
Exergy of a system Е = Н – Т0S is defined as the maximum work performed in a reversible process
of devaluation with the environment. Exergy is a universal indicator of the thermodynamic value
of raw materials and the degree of thermodynamic perfection of technological processes. The part
of exergy associated with chemical transformations is called chemical exergy Ech. For calculation
of chemical exergies, parameters of the environment are of crucial significance. Since the real
environment is a non-equilibrium system, a commonly accepted set of its parameters does not
exist.
5.1.1. Thermochemical model of the reference environment
The thermochemical model of the environment we developed [121, 122] was based on the
following principles:
1. The final products of element transformations in combustion calorimetry were selected as the
reference substances:
CaHbOcNdSe + (a + 0.25b + 0.5c + 1.5e)O2 + (116e – 0.5b)H2O → aCO2 + 0.5dN2 +
e(H2SO4115H2O) (28)
2. Concentrations of the gaseous reference substances N2, O2, CO2 were assumed to be equal to
their atmospheric concentrations at a humidity of 100 %.
3. The concentration components of exergy for solid reference substances and liquid water were
taken equal to zero.
4. The devaluation reaction was an ideal reaction of combustion in a calorimetric bomb. The
auxiliary materials and by-products were not considered.
44
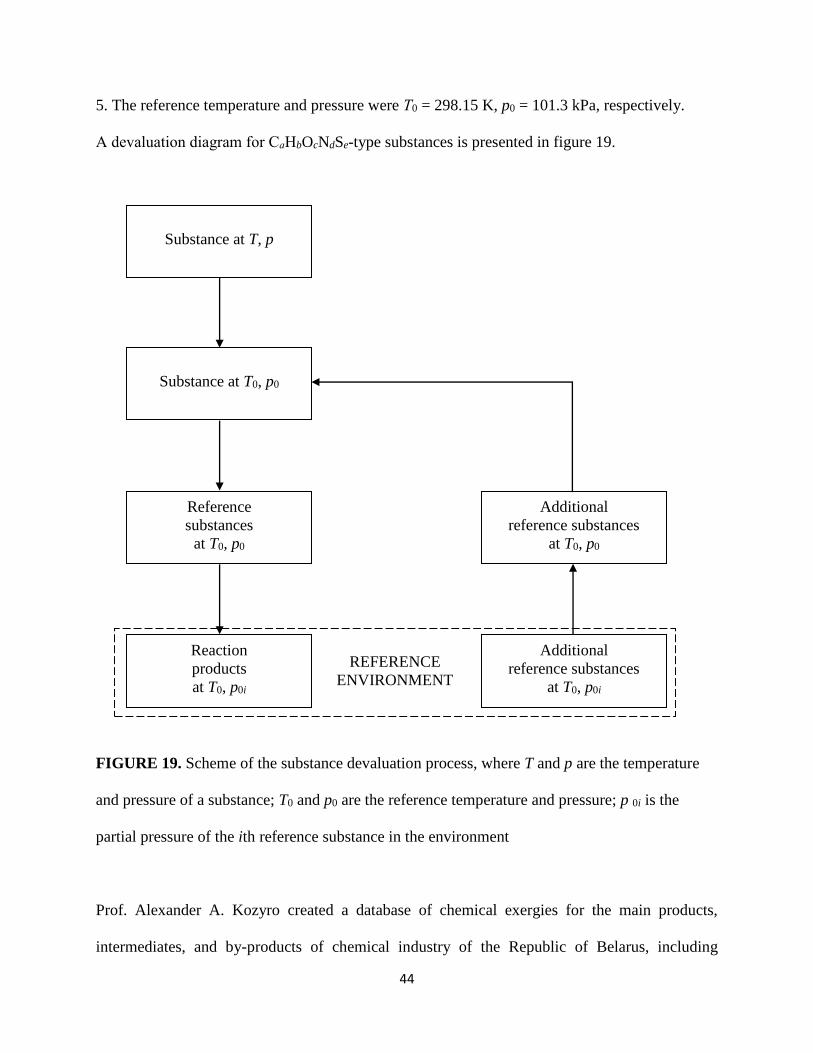
5. The reference temperature and pressure were Т0 = 298.15 K, p0 = 101.3 kPa, respectively.
A devaluation diagram for СаНbOcNdSe-type substances is presented in figure 19.
FIGURE 19. Scheme of the substance devaluation process, where T and p are the temperature
and pressure of a substance; T0 and p0 are the reference temperature and pressure; p 0i is the
partial pressure of the ith reference substance in the environment
Prof. Alexander A. Kozyro created a database of chemical exergies for the main products,
intermediates, and by-products of chemical industry of the Republic of Belarus, including
REFERENCE
ENVIRONMENT
Substance at T, p
Substance at T0, p0
Reference
substances
at T0, p0
Reaction
products
at T0, p0i
Additional
reference substances
at T0, p0i
Additional
reference substances
at T0, p0

45
production of ammonia, nitric and sulfuric acids, -caprolactam, hydroxyammonium sulfate, urea,
and dimethyl terephthalate. This database contains about 500 numerical values of standard
enthalpies, ΔdevHº, entropies, ΔdevSº, Gibbs energies, ΔdevGº, of devaluation reactions and chemical
exergies, Ech, calculated mainly from the values of thermodynamic properties determined in the
Laboratory of Thermodynamics of Organic Compounds of the Belarusian State University.
5.1.2. Additivity of chemical exergies
Property predictions using a group-contribution approach are of significant practical importance.
They make it possible to estimate exergies, avoiding expensive calorimetric measurements of
combustion energies, heat capacities, and enthalpies of phase transitions as well as determination
of vapor pressures. It was demonstrated [122, 123] that chemical exergies could be accurately
predicted using group-contribution methods though the exergies included ΔdevHº and ΔdevSº, which
are non-additive by physical nature. We justified the use of group-contribution methods in this
case and determined numerical values of the temperature-dependent increments for large-scale
calculations of chemical exergies for liquid and gaseous alkanes, alkenes, alkyl substituted
benzenes, cyclohexanes, and cyclopentanes in the range T = (298 to 1000) K.
5.1.3. Chemical exergy of mixtures and fuels
Chemical exergy of mixtures and fuels can be calculated, if the detailed composition and
thermodynamic properties of all components are known. This is often unattainable, thus,
alternative methods for determining exergy of materials are needed. We demonstrated [124] that
chemical exergies could be estimated with the use of experimental thermodynamic properties of
the material, cH(T) and S(T) – S(0). A ten-component model mixture of hydrocarbons of

46
composition С7.367Н14.124 was prepared. The differences between exergies found from the
properties of individual components and from experimental data for the mixture were 0.07 % at T
= 298.15 K.
The enthalpy of combustion cH is a principal property of interest for fuels, and relatively easily
determined. It was shown that the contributions to chemical exergy due to non-ideality and entropy
of mixing were significantly smaller than cH itself. Therefore, it was reasonable to use
correlation equations of a general type Ech = f(cH) to predict chemical exergies for fuels. Using
the thermodynamic data values for 1179 individual liquids of a general formula CaHbOcNdSe, we
obtained the correlation:
Ech = –cH(1.02034 - 0.01381(b’/a’) + 0.03374(c’/a’) + 0.02593(d’/a’) + 0.08408(e’/a’)) (29)
This estimates chemical exergy for a fuel with the overall composition Ca’Hb’Oc’Nd’Se’. For the
model mixture, the predicted value deviated by 0.2 % from the experimental one.
5.2. Thermodynamic justification of energy- and resource-saving technologies in -caprolactam
and urea production [64, 125, 126, 127, 128, 129, 130, 131, 132]
A detailed evaluation of the process flows for -caprolactam and urea production at the Grodno
Azot company (Belarus) was performed. We determined the locations of the maximum exergy
loss and proposed measures for improvement of the technologies. At Grodno Azot, -caprolactam
is produced as illustrated in figure 20.

47
.
FIGURE 20. Scheme of -caprolactam production
A mathematical model considering both thermodynamics and kinetics of the reaction as well as
heat transfer was developed for a shell-and-tube reactor used at the benzene hydrogenation stage.
Using this model, a tube filling with catalyst and inert material was proposed, which provided the
optimal temperature field with no maximum inside the tubes. The implementation of this fill
significantly increased duration of a turnaround interval for the hydrogenation reactor while
keeping the conversion high and selective.
The by-products formed at the oxidation stage can potentially be processed to recycle
cyclohexanone and cyclohexanol. Thermodynamic characteristics of decondensation of 2-(1’-
hydroxycyclohexyl)cyclohexanone [133]
as well as thermodynamics and kinetics of hydrolysis of cyclohexyl acetate [134]

48
were studied. The optimal conditions for conversion of the oxygenated waste containing these
products into the target products, cyclohexanone and cyclohexanol, were determined.
Based on the exergy analysis and mathematical modeling of the cyclohexanol dehydrogenation
stage, we proposed to change the heat exchange regime in the shell-and-tube reactor from
concurrent to countercurrent flow (figure 21). This improvement resulted in the increased
temperature and equilibrium yield of cyclohexanone and the decreased energy consumption at the
rectification stage.
FIGURE 21. Temperature profiles of the dehydrogenation reactor (l is a reactor length): 1, heating
gas; 2, reaction mixture; ––––, concurrent; – – –, countercurrent [127].

49
Component activities in (cyclohexanone oxime (CHO) + water) were experimentally determined
[127]. Based on these results, a dehydration regime at reduced pressure was proposed, which
reduced the residual wetness of CHO from w(H2O) = 0.05 to 0.005. This improvement made it
possible to decrease the consumption of oleum at the CHO isomerization step by ~25 %.
We studied the possibility of cyclohexanone oxime isomerization into -caprolactam if oleum is
replaced with acetic acid and if the isomerization is conducted in an IL solvent. Also, we
considered various ways of product extraction from the reaction mixture. All these studies could
potentially decrease irreversible consumption of oleum and ammonia used for its neutralization.
The solubility of cyclohexanone oxime and -caprolactam in 1-alkyl-3-methylimidazolium ILs
was determined [103, 135, 136]. It was found that the low solubility of cyclohexanone oxime does
not permit Beckmann rearrangement in these solvents. At the same time, the -caprolactam
solubility in the protic IL -caprolactamium trifluoroacetate was high enough to carry out this
reaction. In our experiments with -caprolactamium trifluoroacetate + CF3COOH as a solvent and
P2O5 as a catalyst, a degree of the cyclohexanone oxime → -caprolactam conversion near 90 %
was reached even at 300 K. It seems reasonable to look for potential catalysts for industrial
implementation of this process.
At Grodno Azot, urea is synthesized from CO2 and NH3. Analysis of its production [137, 138]
demonstrated that the largest exergy losses occur at the following three units: CO2 purification
from sulfur-containing and combustible gases, urea synthesis, and removal of unreacted NH3 and
CO2 from the urea melt. It was found that the losses of exergy can be decreased subject to the
following changes in the technology:
(i) The energy of impurity combustion is used to heat СО2.

50
(ii) Two reactors are used for the urea synthesis. “Fresh” CO2 and NH3 are supplied to the first
one. The solution of ammonium carbonates and additional NH3 enter the second reactor.
(iii) At the ammonia removal unit, the working pressure should be decreased from ~1.7 MPa to ~1
MPa. This will result in the temperature decrease and lower amount of the biuret by-product.
5.3. Thermodynamics and kinetics of ionic liquid synthesis [108, 139,140, 141]
Heat capacities and enthalpies of phase transitions were measured in an adiabatic calorimeter for
key compounds used in IL synthesis: 1-methylimidazole (mim), 1-bromobutane (BuBr),
[Cnmim]Br, and [C4mim]I. The entropy changes for the IL synthesis reactions were calculated. An
isoperibol reaction calorimeter designed and built in our laboratory was used to determine the
enthalpies of quaternization reactions in the liquid phase:
mim + 1RHal = [Rmim]Hal (30)
where R = ethyl, butyl, and hexyl, and Hal = Br, I. The enthalpies of reaction were in the range -
(92 to 104) kJmol-1 at T = 298.15 K. Kinetics of reaction (30) with various bromo- and
iodoalkanes were studied in cyclopentanone and acetonitrile media. The Scatchard-Hildebrand
equation and COSMO-SAC model were found to quantitatively describe the experimental
kinetic curves over a wide range of concentrations. With the use of these thermodynamic and
kinetic results, a process scheme for IL synthesis including sequential perfect-mixing and plug-
flow reactors was developed. Optimal volumes of the reactors and heat-transfer surfaces, and the
required flow of cooling water were evaluated for a production unit yielding 100 kg of IL per
day.

51
5.4. Thermodynamic parameters of MWCNT synthesis [114]
MWCNT are more thermodynamically stable than the crystalline fullerenes C60 and C70.
Therefore, their synthesis is possible at T < 1000 K from carbon-containing precursors. However,
the similarity in thermodynamic stability between graphite and MWCNT requires the use of a
catalyst to increase the yield of nanotubes. The main products of propane pyrolysis at P = 0.1 MPa
were found to be graphite and/or MWCNT (figure 22) accompanied by gaseous H2 at T = 1200 K
or, at lower temperatures, methane. The relative amounts of various solid products in a real process
will depend on kinetic factors, which are largely determined by the catalyst selection.
T / K
600 800 1000 1200
n /
mol
kg-1
0
20
40
60
80
100
FIGURE 22. Calculated equilibrium composition of the pyrolysis products of propane at a
pressure of 0.1 MPa: black circles, MWCNT; red circles, H2; cyan circles, CH4. Adapted with
permission from Ref. [114]. © 2016 American Chemical Society.

52
The equilibrium of the carbon monoxide disproportionation reaction
2CO(g) CO2(g) + C(MWCNT) (31)
is shifted to the right-hand side below T = 900 K. This reaction is exothermic, and the enthalpy
factor defines its direction at low temperatures despite a significant decrease in entropy. A high
yield of MWCNT in this reaction is possible at relatively low temperatures and the reaction is
limited only by kinetic constraints.
5.5. Thermodynamics of fullerene hydrogenation, С60 + nH2 = C60H2n [142, 143, 144]
The thermodynamic parameters of the reactions of hydrogenation of crystalline and gaseous
fullerene C60 to form crystalline and gaseous C60H2, C60H18, C60H36, and C60H60 were determined
and analyzed. A typical plot demonstrating temperature dependence of the partial equilibrium
pressure of hydrogen peq(H2) for the heterophase reaction is presented in figure 23. Equilibrium
mole fractions of hydrogenated fullerenes x(C60Н2n) at various total pressures and temperatures for
the gas-phase reaction are given in figure 24.

53
FIGURE 23. Decomposition pressures of C60H36 in the crystalline state. Adapted by permission
from Springer [52], © 2010.
FIGURE 24. Dependence of equilibrium mole fraction of C60H36 (x) on total pressure and
temperature in the reaction of gas-phase decomposition. Adapted by permission from Springer
[52], © 2010.
54
The crystalline hydrogenated fullerenes C60H2 and C60H36 were found to be thermodynamically
stable at T < 500 K and C60H18 at T < 650 K. This finding can be used to improve the yield of the
target hydride under the synthesis conditions. It was theoretically concluded that the experimental
synthesis of perhydrofullerene C60H60 was hardly possible because of thermodynamic limitations.
The potential of the system
С60 + 18 Н2 = С60Н36 (32)
for use as a hydrogen accumulator was identified.
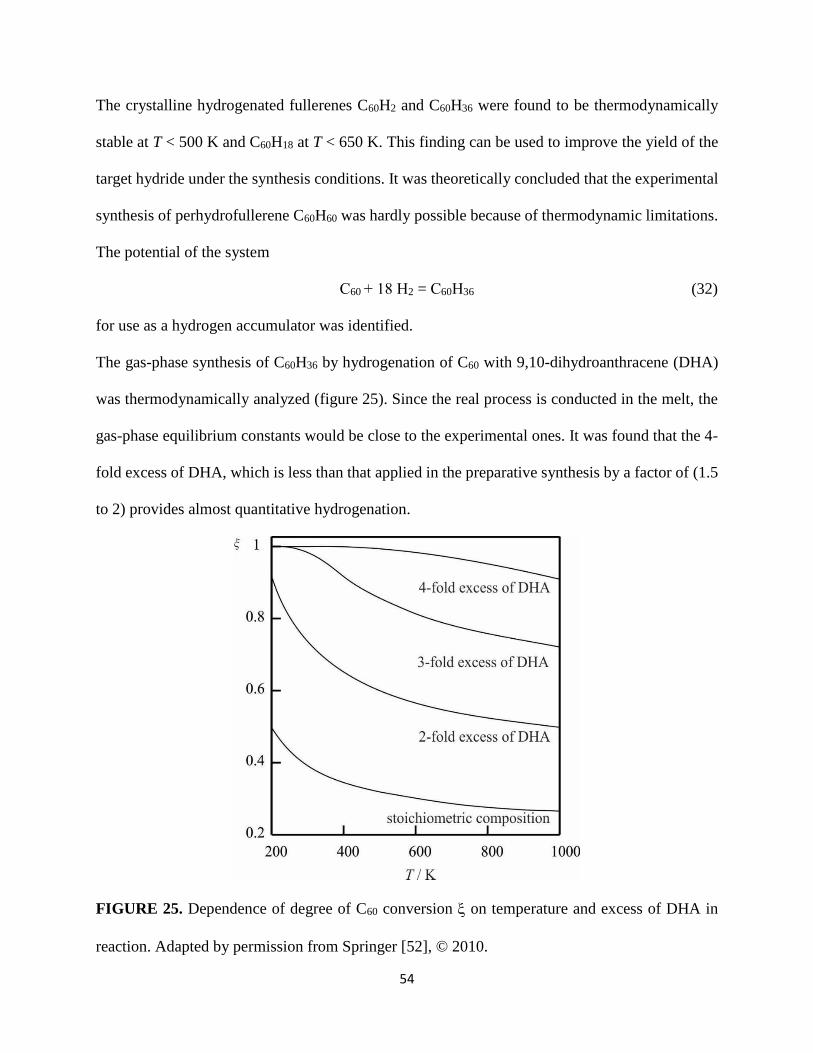
The gas-phase synthesis of C60H36 by hydrogenation of C60 with 9,10-dihydroanthracene (DHA)
was thermodynamically analyzed (figure 25). Since the real process is conducted in the melt, the
gas-phase equilibrium constants would be close to the experimental ones. It was found that the 4-
fold excess of DHA, which is less than that applied in the preparative synthesis by a factor of (1.5
to 2) provides almost quantitative hydrogenation.
FIGURE 25. Dependence of degree of C60 conversion on temperature and excess of DHA in
reaction. Adapted by permission from Springer [52], © 2010.

55
5.6. Thermodynamics of processes in gas-generating systems [145, 146, 147]
Gas generators using a fuel’s combustion energy to decompose a coolant are deployed for creating
controlled atmospheres as well as working bodies in pneumatic devices and rocket technology.
We carried out a multiphase, multicomponent thermodynamic analysis of the potential increase of
gas production in such gas generators due to catalytical ammonia dissociation and water vapor
conversion under isothermal-isobaric conditions. Also, we developed a method for estimation of
the fuel/coolant ratios in adiabatic conditions for the following coolants: NH4HCO3, (NH4)2CO3.
(COO)2(NH4)2, and CH3OH. Due to kinetic limitations, a catalytic conversion is possible at T >
700 K. Therefore, a stepwise cooling concept was proposed:
Gas production rates i were calculated at different coolant/fuel mass ratios (m1/m2) (figure 26).
The theoretical gas production rate 3 reached a maximum at a certain m1/m2 ratio. Conversion of
fuel gases without the coolant increased the gas production rates by 15 %.
Coolant Fuel +
oxidizer Catalyst Coolant
T1, 1 T2, 2 T3, 3 T4, 4

56
FIGURE 26. Plot of the gas-production rate as a function of the coolant/propellant mass ratio for
the following coolants: A – (NH4)2C2O4; B – NH4HCO3; and C – (NH4)2CO3. Adapted from [146].
A cooling system for a Venus descent module was developed with participation of
Dr. Isaac I. Kantorovich. It was demonstrated that an assembly of concentric spherical jackets,
either evacuated or filled with the decomposing coolants, could keep the module temperature
below 373 K for at least 24 h.
5.7. Vaporization and diffusion of pheromones [148]
Physicochemical parameters of vaporization and diffusion of pheromones were studied to inform
design of devices with the optimized use of expensive biologically active substances that act
through the gas phase. For two pheromones, 2-methyl-3-buten-2-ol and α-pinene, diffusion
coefficients in the air, permeability of polyethylene films of different thickness for gas-phase
pheromones, and entrainment rates from various carriers were determined. A mathematical model
was developed for the propagation of the pheromone of i.typographus in the atmosphere and the
isoconcentration lines were determined. The model considered the wind speeds and distribution in

57
the Republic of Belarus. Together, these data provided a foundation for how to more effectively
deploy pheromones by keeping the required concentration of the pheromone within the optimal
limits.
5.8. Substantiation of rational ways of biomass conversion into fuel [149, 150, 151, 152]
5.8.1. Thermodynamic properties of macro components of crops [153, 154, 155]
Energies of combustion and heat capacities were measured for the samples of microcrystalline,
wood sulfite, straw, and wood amorphous celluloses, cuproammonium and sulfuric lignins, starch,
D-glucose, and levoglucosan. The obtained values of thermodynamic properties of cellulose and
lignin were used for analysis of the thermodynamically controlled processes of pyrolysis and
thermal gasification over the range T = (300 to 1700) K (figures 27, 28, 29, and 30). It was found
that hydrothermal gasification of these materials into the CO + H2 mixture led to approximately
15 % loss of the lower energy value compared to direct combustion.

58
FIGURE 27. Equilibrium compositions for cellulose pyrolysis: •, H2O; ◊, CO2; ▲, CH4; ×, C;
■, CO; ∆, H2. P = 0.1 MPa. Adapted with permission from Ref. [153]. © 2011 American
Chemical Society.
FIGURE 28. Equilibrium compositions of pyrolysis for sulfuric lignin at P = 0.1 MPa: •, H2O;
◊, CO2; ▲, CH4; ×, C; ■, CO; ∆, H2. Adapted with permission from Ref. [154]. © 2012
American Chemical Society.

59
FIGURE 29. Equilibrium composition of reaction mixture for the initial composition
(cellulose:H2O = 1:1): •, H2O; ◊, CO2; ▲, CH4; ×, C; ■, CO; ∆, H2. P = 0.1 MPa. Adapted with
permission from Ref. [153]. © 2011 American Chemical Society.
FIGURE 30. Equilibrium composition of reaction mixture for the initial composition sulfuric
lignin:H2O = 1:6 at P = 0.1 MPa: •, H2O; ◊, CO2; ▲, CH4; ×, C; ■, CO; ∆, H2. Adapted with
permission from Ref. [154]. © 2012 American Chemical Society.

60
5.8.2. Strategy of plant biomass conversion into fuel [151, 152, 156, 157]
Boyles concluded [158] that strategies for converting biomass of agricultural plants into fuels
should be based on an analysis of their composition, combustion energies, processing methods,
and economic and social aspects of the products obtained. The energy density of hydrocarbon fuels
is higher than the corresponding values for dry plant biomass, but the cost of 1 GJ obtained from
the biomass may be lower than that of the hydrocarbon fuels. Energy density is critical for the
operation of vehicular energy units. Therefore, in the foreseeable future, preference will be given
to the more expensive fuels with a high energy density. Stationary power plants can use renewable
energy supplies that are significantly less expensive. Although it is possible to produce energy-
rich liquid and gaseous fuels from renewable biomass, it should be borne in mind that energy
degradation occurs during its chemical and biochemical processing (Table 6). The lowest
degradation of energy occurs when fuels of natural consistency are produced. This primarily
applies to solid fuels in the form of pellets or briquettes.
TABLE 6
Enthalpy of combustion cH at T = 298.15 K for fuels, plant raw materials, and energy loss in the
production of fuels from plant crops
Dry fuel ΔсH of fuel /
MJ∙kg-1
Raw
material
ΔсH of
dry raw
material
/ MJ∙kg-1
ΔсH for material
of natural
wetness 1 /
MJ∙kg-1
Mass m of
dry material
/ kg per 1 kg
of fuel
Energy loss
factor
3
Fuel ethanol 29.5 potato 16 4 (0.75) 12 1.6
rye 16 2 13.8 (0.14) 5 2.3

61
corn seeds 16 2 13.8 (0.14) 4 1.9
wood 20 17 (0.15) 7 4.0
Rapeseed oil 39.6 rape seeds 29.4 25.3 (0.14) 3.5 2.2
Fuel pellets
and
briquettes
18 straw 18 15.7 (0.13) 1.2 1.05
1 Mass fraction of water is given in the parentheses.
2 Values estimated from energies of combustion for the samples with natural wetness
3 Calculated as m∙ΔсH(material of natural wetness) / ΔсH(fuel).
The technical and economic analysis of the ways for processing agricultural plant biomass leads
to the following economically and socially justified conclusions [152]:
- Food and feed components of agricultural crops should be processed into food and feed, but not
fuels.
- Non-food and non-feed parts of biomass (straw, stem residues, threshed cobs, etc.) are a valuable
raw material to produce good-quality fuels.
The resources of straw, stalk and other non-food and non-feed parts of biomass in the Republic of
Belarus can be as large as (7.5 to 15)109 kilograms per year [152]. This, in principle, supports
production of solid fuels in the amount of (3.2 to 6.5)109 kilograms of oil equivalent per year,
which is (18 to 36) % of the current annual fuel consumption [159] in Belarus.

62
5.8.3. Solid fuels from energy-rich crops
One of the promising directions for the development of renewable energy is the search for and
introduction of energy-rich plant crops with a yield of dry biomass above 106 kgkm-2 (10 metric
tons per hectare) per year. We demonstrated that this approach can be extremely effective for the
agricultural economy in some regions of Belarus. Per the cadastral appraisal, the fertility of almost
24 % of arable land in Belarus (~ 11103 km2) is below 25 points on a 100-point scale [160]. On
these soils, the yield of cereal crops does not exceed 104 kgpoint–1km-2, or less than (2.0 to
2.5)105 kgkm–2. The use of these lands for agricultural crop production is economically
unprofitable.
One of the cost-efficient ways of using low-fertility lands in Belarus could be cultivation of energy-
rich plant crops to produce solid fuels. The Central Botanical Garden of the National Academy of
Sciences of Belarus has successfully tested the technologies of growing energy-rich crops. These
technologies provided a high yield of dry biomass, were undemanding to soil fertility and
fertilizers, easy to grow, and could provide a high yield of biomass without replanting for (5 to 30)
years and a potential return of the land to agricultural production with an increased fertility.
Jerusalem artichoke (Helianthus tuberosus L.), cup plant (Silphium perfoliatum L.), Weyrich's
knotweed (Aconogonon weyrichii), and giant miscanthus (Miscanthus giganteus) were found to
be the most promising species. We estimated the energy efficiency for these crops using the results
obtained in our laboratory (Table 7).
Cultivation of energy-rich crops on low-fertility lands with subsequent processing of dry biomass
into fuel pellets is economically efficient [161]. The potential resource of this type of solid fuel in
the Republic of Belarus is at least (5 to 7)109 kg per year.

63
TABLE 7
Energy efficiency of stem biomass for energy-rich crops
Crop Yield of dry
biomass /
10 kgm-2 a,b
ΔсH /
MJ∙kg-1 c
ΔсH / 10
MJ∙m-2 d
Mass of oil
equivalent /
10 kgm-2 a
Jerusalem artichoke 15 17.3 260 6.2
Cup plant 14 16.5 231 5.5
Weyrich's knotweed 12 17.4 209 5.0
Giant miscanthus 16 16.0 256 6.1
a unit equivalent to 1 metric ton per hectare
b [162]
c at T = 298.15 K and P = 0.1 MPa
d unit equivalent to 1 GJ per hectare
6. Notes
The authors declare no competing financial interest.
Acknowledgments
We appreciate the administrative support provided to us for many years by the former Head of
Department of Chemistry Prof. Gennady A. Branitsky and by the late Director of the Institute of
Physical and Chemical Research Academician Vadim V. Sviridov. We acknowledge enormous
loss we felt with the tragic passing of Prof. Alexander A. Kozyro. It was very hard for us to keep

64
our research going after that. We also remember with great appreciation contributions of P. A.
Poleschuk and E. N. Kozyrsky.
It was enjoyable to work with our many colleagues, and we want to express our appreciations to
the late Prof. Kenneth N. Marsh (University of Canterbury, Christchurch, New Zealand), Dr.
Joseph W. Magee (National Institute of Standards and Technology, Boulder, USA), Profs. Andreas
Heinz and Sergey Verevkin (University of Rostock, Germany), the late Prof. Viktor P. Kolesov
(Moscow State University, Russia), Prof. Alexey K. Baev (Belarusian State Technological
University, Minsk, Belarus), Drs. E. A. Sorkin (VNIIFTRI, Moscow, Russia), E. A.
Miroshnichenko (Institute of Chemical Physics of Russian Academy of Sciences, Moscow,
Russia), Prof. Ya. S. Vygodsky (Institute of Organoelement Compounds of Russian Academy of
Sciences, Moscow, Russia), Drs. A. S. Shaplov (Luxembourg Institute of Science and Technology,
Hautcharage, Luxembourg), S. E. Dem’yanov (SSPA “Scientific – Practical Materials Research
Center of Academy of Sciences of Belarus”), and Isaac I. Kantorovich (Intel Corp., Boston, USA).
This article is, in part, a contribution of NIST, and is not subject to copyright in the United States.
Trade names are provided only to specify procedures adequately and do not imply endorsement
by the National Institute of Standards and Technology. Similar products by other manufacturers
may be found to work as well or better.

65
References
1. F. D. Rossini, K. S. Pitzer, R. L. Arnett, R. M. Braun, G. C. Pimentel, Selected Values of
Physical and Thermodynamic Properties of Hydrocarbons and Related Compounds, Carnegie
Press, Pittsburgh, PA, 1953.
2. Molecular Structure and Statistical Thermodynamics: Selected Papers of Kenneth S. Pitzer, K.
S. Pitzer (Ed.), World Scientific, Singapore, 1993.
3. E. F. Westrum, Jr., J. P. McCullough, Physics of Crystals, in: D. Fox, M. M. Labes, A.
Weissberger (Eds.), Physics and Chemistry of the Organic Solid State, Interscience, New York,
1963, Vol. 1, pp. 1–178.
4. S. M. Skuratov, V. P. Kolesov, А. F. Vorobyov, Thermochemistry, Vols. 1 and 2, Moscow
State University, Moscow, 1964.
5. V. M. Tatevsky, Classical Theory of Molecular Structure and Quantum Mechanics, Khimiya,
Moscow, 1973.
6. G. J. Kabo, A. V. Blokhin, A. G. Kabo, Investigation of Thermodynamic Properties of
Organic Substances, in: O. A. Ivashkevich (Ed.), Chemical Problems of the Development of
New Materials and Technologies, Vol. 1, Belarusian State University, Minsk, 2003, pp. 176–
192.
7. G. J. Kabo, G. N. Roganov, M. L. Frenkel, Thermodynamics and Equilibria of Isomers,
Universitetskoye, Minsk, 1986.
8. G. J. Kabo, G. N. Roganov, M. L. Frenkel, Thermodynamics and Equilibria of Isomers, in:
M. Frenkel (Ed.), Thermochemistry and Equilibria of Organic Compounds, VCH, New York,
1993.
9. V. I. Fedoseenko, I. A. Yursha, G. J. Kabo, Dokl. Akad. Nauk BSSR 27 (1983) 926-929.
66
10. V. I. Fedoseenko, I. A. Yursha, G. J. Kabo, Dokl. Akad. Nauk BSSR 28 (1984) 1109-1112.
11. G. J. Kabo, D. N. Andreevsky, Neftekhimiya 3 (1963) 764-770.
12. M. M. Brazhnikov, G. J. Kabo, D. N. Andreevsky, I. A. Yursha, Izvestiya Vyssh. Ucheb.
Zaved., Khim. Khim. Tekhnol. 14 (1971) 510-514.
13. G. N. Roganov, G. J. Kabo, D. N. Andreevsky, Neftekhimiya 12 (1972) 495-500.
14. G. N. Roganov, G. J. Kabo, D. N. Andreevsky, K. B. Nikulin, Neftekhimiya 10 (1970) 16-
21.
15. G. J. Kabo, D. N. Andreevsky, Zh. Fiz. Khim. 47 (1973) 272-273.
16. Z. A. Radyuk, G. J. Kabo, D. N. Andreevsky, Neftekhimiya 13 (1973) 356-360.
17. I. A. Yursha, G. J. Kabo, Zh. Fiz. Khim. 50 (1976) 558-559.
18. Z. A. Radyuk, G. J. Kabo, D. N. Andreevsky, Neftekhimiya 12 (1972) 679-686.
19. G. J. Kabo, D. N. Andreevsky, Z. A. Radyuk, Neftekhimiya 10 (1970) 330-334.
20. G. J. Kabo, D. N. Andreevsky, G. A. Savinetskaya, Neftekhimiya 7 (1967) 364-368.
21. I. A. Yursha, G. J. Kabo, Zh. Fiz. Khim. 49 (1975) 1302-1303.
22. I. A. Yursha, G. J. Kabo, D. N. Andreevsky, 14 (1974) 688-693.
23. S. V. Petrova-Kuminskaya, G. N. Roganov, G. J. Kabo, Neftekhimiya 23 (1983) 489-494.
24. S. V. Petrova-Kuminskaya, G. N. Roganov, G. J. Kabo, Neftekhimiya 24 (1984) 485-490.
25. G. J. Kabo, D. N. Andreevsky, Neftekhimiya 5 (1965) 132-135.
26. G. N. Roganov, G. J. Kabo, D. N. Andreevsky, Zh. Org. Khim. 5 (1969) 2097-2102.
27. G. E. Esipenok, G. J. Kabo, D. N. Andreevsky, Zh. Fiz. Khim. 47 (1973) 739.
28. D. N. Andreevsky, G. J. Kabo, G. E. Esipenok, Zh. Fiz. Khim. 48 (1974) 1614.
29. G. E. Esipenok, G. J. Kabo, D. N. Andreevsky, Zh. Fiz. Khim. 49 (1975) 3008.
30. G. J. Kabo, M. L. Frenkel, J. Chem. Thermodyn.15 (1983) 377-381.

67
31. M. L. Frenkel, G. J. Kabo, G. N. Roganov, Thermodynamic Characteristics of Isomerization
Reactions, Universitetskoye, Minsk, 1988.
32. M. L. Frenkel, G. J. Kabo, G. N. Roganov Thermodynamic Properties of Isomerization
Reactions, Hemisphere, New York, 1992.
33. D. H. Zaitsau, Y. U. Paulechka, A. V. Blokhin, A. V. Yermalayeu, A. G. Kabo, M. R.
Ivanets, J. Chem. Eng. Data 54 (2009) 3026-3033.
34. A. B. Bazyleva, A. V. Blokhin, A. G. Kabo, G. J. Kabo, V. N. Emel’yanenko,
S. P. Verevkin, J. Chem. Thermodyn. 40 (2008) 509-522.
35. F. Pavese, V. M. Malyshev, Adv. Cryog. Eng. 40 (1994) 119-124.
36. A. V. Blokhin, Y. U. Paulechka, G. J. Kabo, J. Chem. Eng. Data 51 (2006) 1377-1388.
37. A. G. Kabo, V. V. Diky, Thermochim. Acta 347 (2000) 79-84.
38. D. Zaitsau, G. J. Kabo, A. A. Kozyro, V. M. Sevruk, Thermochim. Acta 406 (2003) 17-28.
39. D. H. Zaitsau, Y. U. Paulechka, G. J. Kabo, V. M. Sevruk, Influence of the Anisotropy of the
Gas Pressure in the Knudsen Cell on the Values of Saturated Vapor Pressures and the Enthalpy
of Evaporation, in: O. A. Ivashkevich (Ed.), Chemical Problems of the Development of New
Materials and Technologies, Vol. 2, Belarusian State University, Minsk, 2003, pp. 251–263.
40. D. H. Zaitsau, S. P. Verevkin, Y. U. Paulechka, G. J. Kabo, V. M. Sevruk, J. Chem. Eng.
Data 48 (2003) 1393-1400.
41. G. J. Kabo, G. N. Roganov, Dokl. Akad. Nauk BSSR 30 (1986) 832-835.
42. O. E. Grikina, V. M. Tatevsky, Vestn. Moskovsk. Univ. Ser. 2, 29 (1988) 22-26.
43. G. N. Roganov, G. J. Kabo, Vestn. Beloruss. Gos. Univ. Ser. 2, (1978) 3-6.
44. G. J. Kabo, A. A. Kozyro, V. V. Diky, V. V. Simirsky, J. Chem. Eng. Data 40 (1995) 371-
393.

68
45. V. V. Simirsky, G. J. Kabo, M. L. Frenkel, J. Chem. Thermodyn. 19 (1987) 1121-1127.
46. G. J. Kabo, A. A. Kozyro, V. V. Diky, J. Chem. Eng. Data 40 (1995) 160-166.
47. V. N. Emel'yanenko, G. J. Kabo, S. P. Verevkin, J. Chem. Eng. Data 51 (2006) 79-87.
48. G. Kabo, E. Paulechka, M. Frenkel, Heat Capacities and Phase Transitions for the Dynamic
Chemical Systems: Conformers, Tautomers, Plastic Crystals, and Ionic Liquids, in: E. Wilhelm,
T. M. Letcher (Eds.), Heat Capacities: Liquids, Solutions and Vapours, RSC, London, 2010, pp.
390-420.
49. J. D. van der Waals, Ph. Kohnstamm, Lehrbuch der Thermostatik, Verlag von J. A. Barth,
Leipzig, 1927.
50. P. A. Poleschuk, G. J. Kabo, M. L. Frenkel, Zh. Fiz. Khim. 62 (1968) 1105-1109.
51. M. L. Frenkel, G. J. Kabo, K. N. Marsh, G. N. Roganov, R. C. Wilhoit, Thermodynamics of
Organic Compounds in the Gas State, Vols. 1 and 2, TRC, College Station, 1994.
52. G. J. Kabo, L. S. Karpushenkava, Y. U. Paulechka, Thermodynamic Properties of Fullerene
Hydrides C60H2n and Equilibria of Their Reactions, in: F. Cataldo, S. Iglesias-Groth (Eds.),
Carbon Materials: Chemistry and Physics, Vol. 2, Springer, New York, 2010, pp. 55–83.
53. L. S. Karpushenkava, G. J. Kabo, A. B. Bazyleva, J. Mol. Struct.: Theochem 913 (2009) 43-
49.
54. G. J. Kabo, A. V. Blokhin, M. B. Charapennikau, A. G. Kabo, V. M. Sevruk, Thermochim.
Acta, 345 (2000) 125-133.
55. A. B. Bazyleva, A. V. Blokhin, G. J. Kabo, M. B. Charapennikau, V. N. Emel’yanenko, S. P.
Verevkin, V. Diky, J. Phys. Chem. B 115 (2011) 10064-10072.
56. L. S. Karpushenkava, G. J. Kabo, A. B. Bazyleva, A. V. Blokhin, A. G. Kabo, Thermochim.
Acta, 459 (2007) 104-110.

69
57. G. J. Kabo, A. A. Kozyro, A. P. Marchand, V. V. Diky, V. V. Simirsky, L. S. Ivashkevich,
A. P. Krasulin, V. M. Sevruk, M. L. Frenkel, J. Chem. Thermodyn., 26 (1994) 129-142.
58. G. J. Kabo, A. A. Kozyro, V. V. Diky, V. V. Simirsky, L. S. Ivashkevich, A. Р. Krasulin,
V. M. Sevruk, A. P. Marchand, M. L. Frenkel, J. Chem. Thermodyn., 27 (1995) 707-720.
59. V. V. Diky, G. J. Kabo, Vestn. Beloruss. Gos. Univ. Ser. 2. (1992) 37.
60. G. J. Kabo, D. N. Andreevsky, S. Ya. Karaseva, Theor. Eksp. Khim. 4 (1968) 843-847.
61. V. V. Diky, N. V. Martsinovich, G. J. Kabo, J. Phys. Chem. A, 105 (2001) 4969-4973.
62. G. J. Kabo, V. V. Diky, A. A. Kozyro, A. P. Krasulin, V. M. Sevruk, J. Chem. Thermodyn.
27 (1995) 953-967.
63. V. V. Diky, G. J. Kabo, A. A. Kozyro, A. P. Krasulin, V. M. Sevruk, J. Chem. Thermodyn.
25 (1993) 1169-1181.
64. G. J. Kabo, I. A. Yursha, M. L. Frenkel, P. A. Poleshchuk, V. I. Fedoseenko, J. Chem.
Thermodyn. 20 (1988) 429-437.
65. G. J. Kabo, A. A. Kozyro, A. P. Krasulin, V. M. Sevruk, L. S. Ivashkevich, J. Chem.
Thermodyn. 25 (1993) 485-493.
66. E. N. Stepurko, Y. U. Paulechka, A. V. Blokhin, G. J. Kabo, S. V. Voitekhovich, A. S.
Lyakhov, S. V. Kohut, T. E. Kazarovets, Thermochim. Acta 592 (2014) 10-17.
67. T. V. Soldatova, G. J. Kabo, A. A. Kozyro, M. L. Frenkel, Zh. Fiz. Khim. 64 (1990) 336-
343.
68. A. A. Kozyro, G. J. Kabo, T. V. Soldatova, V. V. Simirsky V. I. Gogolinsky, A. P. Krasulin,
M. M. Dudarevich, Zh. Fiz. Khim. 66 (1992) 2583-2590.
69. Y. U. Paulechka, G. J. Kabo, A. V. Blokhin, O. A. Vydrov, J. W. Magee, M. Frenkel, J.
Chem. Eng. Data 48 (2003) 457-462.

70
70. Y. U. Paulechka, G. J. Kabo, V. N. Emel’yanenko, J. Phys. Chem. B 112 (2008) 15708-
15717.
71. A. B. Bazyleva, G. J. Kabo, Y. U. Paulechka, D. H. Zaitsau, A. V. Blokhin, Thermochim.
Acta 436 (2005) 56-67.
72. G. J. Kabo, A. V. Blokhin, A. A. Kozyro, V. V. Diky, Thermochim. Acta 290 (1997) 13-30.
73. A. A. Kozyro, G. J. Kabo, A. P. Krasulin, V. M. Sevruk, V. V. Simirsky, M. S. Sheiman, M.
Frenkel, J. Chem. Thermodyn. 25 (1993) 1409-1417.
74. E. A. DiMarzio, F. Dowell, J. Appl. Phys., 1979, 50, 6061-6066.
75. A. V. Blokhin, Energy States of Molecules in Plastic Crystals of Organic Substances, in:
O. A. Ivashkevich (Ed.), Chemical Problems of the Development of New Materials and
Technologies, Vol. 2, Belarusian State University, Minsk, 2003, pp. 200–229.
76. A. V. Blokhin, M. B. Charapennikau, G. J. Kabo, Energy States of Molecules in Plastic
Crystals of Cage Hydrocarbons and their Hydroxy Derivatives, in: V. V. Sviridov (Ed.), Selected
Publications, Vol. 5, Belarusian State University, Minsk, 2001, pp. 429-445.
77. G. J. Kabo, A. A. Kozyro, M. Frenkel, A. V. Blokhin, Mol. Cryst. Liq. Cryst. 326 (1999)
333-355.
78. A. B. Bazyleva, A. V. Blokhin, G. J. Kabo, A. G. Kabo, Y. U. Paulechka, J. Chem.
Thermodyn. 37 (2005) 643-657.
79. G. J. Kabo, A. V. Blokhin, A. A. Kozyro, V. V. Diky, L S. Ivashkevich, A. P. Krasulin,
V. M. Sevruk, M. Frenkel, Thermochim. Acta 313 (1998) 111-124.
80. M. B. Charapennikau, A. V. Blokhin, G. J. Kabo, A. G. Kabo, V. V. Diky, A. G. Gusakov,
Thermochim. Acta, 382 (2002) 109-118.

71
81. M. B. Charapennikau, A. V. Blokhin, G. J. Kabo, V. M. Sevruk, A. P. Krasulin,
Thermochim. Аcta 405 (2003) 85-91.
82. M. B. Charapennikau, A. V. Blokhin, G. J. Kabo, A. G. Kabo, A. G. Gusakov, Vesti
Nats. Akad. Nauk Belarusi, Ser. Khim., Issue 2 (2001) 43-46.
83. M. B. Charapennikau, G. J. Kabo, A. V. Blokhin, A. G. Gusakov, Russ. J. Phys. Chem. 77
(2003) 368-373.
84. M. B. Charapennikau, A. V. Blokhin, A. G. Kabo, G. J. Kabo, J. Chem. Thermodyn. 35
(2003) 145-157.
85. A. B. Bazyleva, A. V. Blokhin, G. J. Kabo, A. G. Kabo, V. M. Sevruk, Thermochim. Acta
451 (2006) 65-72.
86. A. B. Bazyleva, G. J. Kabo, A. V. Blokhin, Physica B: Condensed Matter. 383 (2006) 243-
252.
87. A. Kazakov, J. W. Magee, R. D. Chirico, E. Paulechka, V. Diky, C. D. Muzny, K. Kroenlein,
M. Frenkel, NIST Standard Reference Database 147: NIST Ionic Liquids Database -
(ILThermo), Version 2.0, National Institute of Standards and Technology, Gaithersburg MD,
20899, http://ilthermo.boulder.nist.gov. (Retrieved September 11, 2018).
88. J. Magee, G. Kabo, M. Frenkel, Physical Property Measurements and Comprehensive Data
Retrieval System for Ionic Liquids, in: R. D. Rogers, K. R. Seddon (Eds.), ACS Symposium
Series, Ionic Liquids III: Fundamentals, Progress, Challenges and Opportunities, Amer. Chem.
Soc., Washington DC, 2004, pp. 160–174.
89. Y. U. Paulechka, J. Phys. Chem. Ref. Data 39 (2010) 033108.
90. E. Paulechka, C. Muzny. Ionic liquids, in: J. R. Rumble (Ed.), CRC Handbook on Chemistry
and Physics, 98th Ed., 2017.

72
91. Y. U. Paulechka, D. H. Zaitsau, G. J. Kabo, A. A. Strechan. Thermochim. Acta 439 (2005)
158-160.
92. D. H. Zaitsau, G. J. Kabo, A. A. Strechan, Y. U. Paulechka, A. Tschersich, S. P. Verevkin,
A. Heintz, J. Phys. Chem. A 110 (2006) 7303-7306.
93. Y. U. Paulechka, G. J. Kabo, A. V. Blokhin, A. S. Shaplov, E. I. Lozinskaya,
D. G. Golovanov, K. A Lyssenko, A. A. Korlyukov, Ya. S Vygodskii, J. Phys. Chem. B 113
(2009) 9538-9546.
94. Y. U. Paulechka, G. J. Kabo, A. V. Blokhin, A. S. Shaplov, E. I. Lozinskaya, Ya. S.
Vygodskii, J. Chem. Thermodyn. 39 (2007) 158-166.
95. Y. U. Paulechka, A. V. Blokhin, G. J. Kabo, Thermochim. Acta 604 (2015) 122-128.
96. Y. U. Paulechka, A. G. Kabo, A. V. Blokhin, G. J. Kabo, M. P. Shevelyova, J. Chem. Eng.
Data 55 (2010) 2719-2724.
97. Y. U. Paulechka, A. V. Blokhin, G. J. Kabo, A. A. Strechan, J. Chem. Thermodyn. 39 (2007)
866-877.
98. Y. U. Paulechka, A. V. Blokhin. J. Chem. Thermodyn. 79 (2014) 94-99.
99. A. A. Strechan, Y. U. Paulechka, A. V. Blokhin, G. J. Kabo, J. Chem. Thermodyn. 40 (2008)
632-639.
100. A. A. Strechan, A. G. Kabo, Y. U. Paulechka, A. V. Blokhin, G. J. Kabo, A. S. Shaplov,
E. I. Lozinskaya, Thermochim. Acta 474 (2008) 25-31.
101. G. J. Kabo, A. V. Blokhin, Y. U. Paulechka, A. G. Kabo, M. P. Shymanovich, J. W. Magee,
J. Chem. Eng. Data 49 (2004) 453-461.
102. E. Paulechka, T. Liavitskaya, A. V Blokhin, J. Chem. Thermodyn. 102 (2016) 211-218.

73
103. A. A. Strechan, Y. U. Paulechka, A. G. Kabo, A. V. Blokhin, G. J. Kabo, J. Chem. Eng.
Data 52 (2007) 1791-1799.
104. Y. U. Paulechka, S. V. Kohut, A. V. Blokhin, G. J. Kabo, Thermochim. Acta 511 (2010)
119-123.
105. A. V. Blokhin, Y. U. Paulechka, A. A. Strechan, G. J. Kabo, J. Phys. Chem. B 112 (2008)
4357-4364.
106. E. Paulechka, A. V. Blokhin, A. S. M. C. Rodrigues, M. A. A. Rocha, L. M. N. B. F.
Santos. J. Chem. Thermodyn. 97 (2016) 331-340.
107. Y. U. Paulechka, G. J. Kabo, Russ. J. Phys. Chem. A 82 (2008) 1412-1414.
108. Y. U. Paulechka, Thermodynamics of Imidazolium-based Ionic Liquids, D.Sci. Thesis
(Phys. Chem.), Belarusian State University, Minsk, 2013.
109. Y. U. Paulechka, Experimental Investigation and Prediction of Physicochemical Properties
for Room-Temperature Ionic Liquids, in: O. A. Ivashkevich (Ed.), Chemical Problems of the
Development of New Materials and Technologies, Vol. 3, Belarusian State University, Minsk,
2008, pp. 447–466.
110. Y. U. Paulechka, A. G. Kabo, A. V. Blokhin, G. J. Kabo. Thermochemical Similarity of 1-
Alkyl-3-Methylmidazolium Ionic Liquids and Salts of Alkaline Metals, in: O. A. Ivashkevich
(Ed.), Sviridov Readings, Issue 6, Belarusian State University, Minsk, 2010, pp. 184-188.
111. G. J. Kabo, Y. U. Paulechka, D. H. Zaitsau, A. S. Firaha, Thermochim. Acta 609 (2015) 7-
19.
112. V. V. Diky, G. J. Kabo, Russ. Chem. Rev. 69 (2000) 95-104.
113. V. V. Diky, L. S. Zhura, A. G. Kabo, V. Y. Markov, G. J. Kabo, Fullerene Sci. Тech. 9
(2001) 543-551.

74
114. G. J. Kabo, Y. U. Paulechka, A. V. Blokhin, O. V. Voitkevich, T. N. Liavitskaya,
A. G. Kabo, J. Chem. Eng. Data, 61 (2016) 3849-3857.
115. M. P. Shevelyova, Y. U. Paulechka, G. J. Kabo, A. V. Blokhin, A. G. Kabo, T. M.
Gubarevich, J. Phys. Chem. C 117 (2013) 4782-4790.
116. J. Y. Howe, C. J. Rawn, L. E. Jones, H. Ow, Powder Diffraction 18 (2003) 150-154.
117. L. N. Sidorov, M. A. Yurovskaya, A. Y. Borschevskiy, I. V. Trushkov, I. N. Ioffe,
Fullerenes, Ekzamen, Moscow, 2005.
118. W. Krätschmer, L. D. Lamb, K. Fostiropoulos, D. R. Huffman, Nature 347 (1990) 354-358.
119. J. D. Cox, D. D. Wagman, V. A. Medvedev, CODATA Key Values for Thermodynamics,
Hemisphere Pub. Corp.: New York, 1989.
120. M. W. J. Chase, NIST-JANAF Thermochemical Tables, 4th Edition. J. Phys. Chem. Ref.
Data, Monograph 9 (1998) 1-1951.
121. G. J. Kabo, O. V. Govin, A. A. Kozyro, Dokl. Nats. Akad. Nauk Belarusi 40(6) (1996) 67-
71.
122. G. J. Kabo, O. V. Govin, A. A. Kozyro, Energy 23 (1998) 383-391.
123. O. V. Govin, G. J. Kabo, Zh. Fiz. Khim. 72 (1998) 1964-1966.
124. O. V. Govin, V. V. Diky, G. J. Kabo, A. V. Blokhin, J. Therm. Anal. Calorim. 62 (2000)
123-133.
125. M. L. Frenkel, I. A. Yursha, G. J. Kabo, V. I. Fedoseenko, Zh. Prikl. Khim. 62 (1989) 1173-
1176.
126. A. A. Kozyro, L. I. Marachuk, A. P. Krasulin, I. A. Yursha, G. J. Kabo, Zh. Prikl. Khim. 62
(1989) 595-599.

75
127. M. L. Frenkel, I. A. Yursha, I. I. Kantorivich, Le Tung An, G. J. Kabo, E. M. Golovako,
Khim. Prom. (1988) 707-710.
128. V. S. Krouk, Z. A. Antonova, G. J. Kabo, I. A. Yursha, V. V. Simirsky, Khim. Prom. (1999)
578-582.
129. I. A. Yursha, Z. A. Antonova, V. V. Simirsky, G. J. Kabo, A. A. Kozyro, V. S. Krouk,
Khim. Prom. (1997) 726-733.
130. A. A. Kozyro, G. J. Kabo, V. S. Krouk, M. S. Sheiman, I. A. Yursha, V. V. Simirsky,
A. P. Krasulin, V. M. Sevruk, V. I. Gogolinsky, J. Chem. Thermodyn. 24 (1992) 883-895.
131. G. J. Kabo, A. A. Kozyro, V. S. Krouk, V. M. Sevruk, I. A. Yursha, V. V. Simirsky,
V. I. Gogolinsky, J. Chem. Thermodyn. 24 (1992) 1-13.
132. L. I. Marachuk, A. A. Kozyro, V. V. Simirsky, G. J. Kabo, I. A. Yursha, A. P. Krasulin,
V. M. Sevruk, Zh. Prikl. Khim. 65 (1992) 875-880.
133. M. P. Shevelyova, G. J. Kabo, A. V. Blokhin, A. G. Kabo, J. A. Yursha, A. A. Rajko, J.
Chem. Eng. Data 51 (2006) 40-45.
134. V. V. Simirsky, A. A. Kozyro, G. J. Kabo, I. A. Yursha, L. I. Marachuk, Zh. Prikl. Khim.
65 (1992) 1638-1645.
135. M. P. Shevelyova, D. H. Zaitsau, Y. U. Paulechka, A. V. Blokhin, G. J. Kabo,
S. P. Verevkin, A. Heintz, J. Chem. Eng. Data 52 (2007) 1360-1365.
136. M. P. Shevelyova, Y. U. Paulechka, G. J. Kabo, A. S. Halauko, J. Chem. Eng. Data 56
(2011) 185-189.
137. M. L. Frenkel, E. A. Gusev, G. J. Kabo, Zh. Prikl. Khim. 17 (1983) 212-214.

76
138. A. A. Kozyro, Thermodynamic Properties of Products of Industrial Synthesis of Urea,
Caprolactam, Dimethyl Terephthalate, and Related Compounds, Dr. Sci. Thesis (Phys. Chem.),
Belarusian State University, Minsk, 1997.
139. Y. U. Paulechka, A. G. Kabo, A. V. Blokhin, J. Phys. Chem. B 113 (2009) 14742-14746.
140. Y. U. Paulechka, G. J. Kabo, A. V. Blokhin, Dz. S. Firaha, J. Chem. Eng. Data 56 (2011)
4891-4899.
141. G. J. Kabo, Y. U. Paulechka, A. G. Kabo, A. V. Blokhin, J. Chem. Thermodyn. 42 (2010)
1292-1297.
142. L. S. Karpushenkava, Thermodynamic Properties of Cage Hydrocarbons and
Hydrofullerenes, Ph.D. Thesis (Phys. Chem.), Belarusian State University, Minsk, 2007.
143. L. S. Karpushenkava, G. J. Kabo, V. V. Diky, Fullerenes, Nanotubes, and Carbon
Nanostructures, 15 (2007) 227-247.
144. G. J. Kabo, L. S. Karpushenkava, Y. U. Paulechka. Thermodynamic Properties of Fullerene
Hydrides C60H2n and Equilibria of Their Reactions, in: F. Cataldo, S. Iglesias-Groth (Eds.),
Carbon Materials: Chemistry and Physics. Vol. 2. Fulleranes. The Hydrogenated Fullerenes.
Springer, 2010, pp. 55-83.
145. M. L. Frenkel, G. J. Kabo, I. I. Kantorovich, E. A. Gusev, A. A. Vecher, V. A. Shandakov,
Dokl. Akad. Nauk BSSR 29 (1985) 434-437.
146. G. J. Kabo, M. L. Frenkel, E. A. Gusev, M. A. Kazantseva, I. I. Kantorovich, Teor. Osnovy
Khim. Tekhnol. 19 (1985) 533-537.
147. M. A. Kazantseva, M. L. Frenkel, G. J. Kabo, E. A. Gusev, A. A. Vecher, Zh. Prikl. Khim.
18 (1984) 2444-2447.

77
148. Dz. H. Zaitsau, Y. V. Baranov, G. J. Kabo, Vesti Nats. Akad. Nauk Belarusi, Ser. Khim.,
Issue 3 (2007) 28-32.
149. G. J. Kabo, A. V. Blokhin, V. V. Simirsky, O. A. Ivashkevich, Application of Biomasses
for a Production of Various Types of Fuels, in: O. A. Ivashkevich (Ed.), Chemical Problems of
the Development of New Materials and Technologies, Vol. 3, Belarusian State University,
Minsk, 2008, pp. 165-179.
150. O. A. Ivashkevich, G. J. Kabo, A. V. Blokhin, V. V. Simirsky, Y. N. Lugovik, Vest.
Beloruss. Gos. Univ., Ser. 2 (2009) 4-13.
151. O. A. Ivashkevich, G. J. Kabo, A. V. Blokhin,V. V. Domasevich, V. V. Simirsky,
M. P. Shevelyova, Dokl. Nats. Akad. Nauk Belarusi 51(6) (2007) 48-50.
152. G. J. Kabo, A. V. Blokhin, Biomass of Agricultural Crops in Belarus - Food or Fuel?, 2012.
https://agrobelarus.by/articles/nauka/biomassa_selskokhozyaystvennykh_kultur_belarusi_provol
stvie_ili_toplivo/ (accessed September 12, 2018).
153. A. V. Blokhin, O. V. Voitkevich, G. J. Kabo, Y. U. Paulechka, M. V. Shishonok,
A. G. Kabo, V. V. Simirsky, J. Chem. Eng. Data 56 (2011) 3523-3531.
154. O. V. Voitkevich, G. J. Kabo, A. V. Blokhin, Y. U. Paulechka, M. V. Shishonok, J. Chem.
Eng. Data 57 (2012) 1903-1909.
155. G. J. Kabo, O. V. Voitkevich, A. V. Blokhin, S. V. Kohut, E. N. Stepurko, Y. U. Paulechka,
J. Chem. Thermodyn. 59 (2013) 87-93.
156. G. J. Kabo, A. V. Blokhin, V. V. Simirsky, O. A. Ivashkevich, Application of Biomasses
for a Production of Various Types of Fuels, in: O. A. Ivashkevich (Ed.), Chemical Problems of
the Development of New Materials and Technologies, Vol. 3, Belarusian State University,
Minsk, 2008, pp. 165-179.

78
157. O. A. Ivashkevich, G. J. Kabo, A. V. Blokhin, V. V. Simirsky, Y. N. Lugovik, Vest.
Beloruss. Gos. Univ., Ser. 2, Issue 1 (2009) 4-13.
158. D. T. Boyles. Bio-energy: Technology, Thermodynamics, and Costs, E. Horwood, New
York, 1984.
159. Energy balance of the Republic of Belarus, 2017. http://www.belstat.gov.by/ofitsialnaya-
statistika/publications/izdania/public_compilation/index_7863/ (accessed September 12, 2018).
160. http://www.gki.gov.by/uploads/files/Rezultaty-na-1-janvarja-2015-g.pdf (accessed
September 12, 2018).
161. G. J. Kabo, A. V. Blokhin, Justification of the strategy for the reasonable use of biomass of
agricultural crops of the Republic of Belarus in the production of fuels, in: Alternative sources of
raw materials and fuels, Vol. 1, Belaruskaya Navuka, Minsk, 2014, pp. 48-55.
162. M. I. Yaroshevich, V. I. Podobedov, T. V. Gil’, in: Fourth Scientific and Technical
Conference Alternative Sources of Raw Material and Fuel, Minsk, May 28–30, 2013. Book of
Abstracts, Belaruskaya Navuka, Minsk, 2013, p. 40.


![EXPERIMENT 4 THERMODYNAMIC FUNCTIONS of a ...mutuslab.cs.uwindsor.ca/Wang/59-241/experiment4.pdf37 [1] [2] EXPERIMENT 4 THERMODYNAMIC FUNCTIONS of a GALVANIC CELL Introduction Chemical](https://img.pdfslide.net/doc/110x75/5aa0466c7f8b9a62178ddcb0/pdfexperiment-4-thermodynamic-functions-of-a-1-2-experiment-4-thermodynamic.jpg)