Embed Size (px)
Citation preview
Arsović, M., et al.: Thermodynamical Research of Using Solar Energy for … THERMAL SCIENCE, Year 2015, Vol. 19, No. 5, pp. 1709-1721 1709
THERMODYNAMICAL RESEARCH OF USING SOLAR ENERGY FOR DESALINATION OF SEAWATER
by
Marjan R. ARSOVIĆ a*, Radivoje M. TOPIĆ
b, Mirko S. KOMATINA b,
and Milan GOJAK b
a Doosan Hydro Technology, Tampa, Fla., USA b Faculty of Mechanical Engineering, University of Belgrade, Belgrade, Serbia
Original scientific paper DOI:10.2298/TSCI141220074A
Many regions of the world face the problem of saline water. Water desalination processes, which require significant energy consumption, are a common solution to produce drinking water. This study evaluated the influence of the following process operational parameters on the energy consumption of seawater reverse osmosis systems: water salinity, permeate recovery ratio, membrane perfor-mance, and feed water temperature. Optimal operational conditions for the theo-retical minimum energy consumption were determined with experiments by vary-ing water qualities and operational parameters. In order to further reduce energy consumption a reverse osmosis system was integrated with a photovoltaic solar system and a pilot photovoltaic reverse osmosis system was built and tested. The results obtained from this study indicated that even though a solar photovoltaic system incurs a huge initial capital investment, it will yield significant benefits in the long run of the reverse osmosis operational period. Key words: reverse osmosis, desalination, solar photovoltaic, energy cost saving
Introduction
The availability of surface and ground water sources for agricultural, industrial, and personal use is becoming increasingly constrained. In response, reverse osmosis (RO) water desalination has been touted as a potential technology for increasing the available water re-sources in many parts of the world [1]. The RO has been chosen because it is the cheapest op-erational desalination technology and it is commercially available in a range of sizes. Utiliza-tion of renewable energy sources for water production in Florida, USA, has the potential of lowering costs while providing long term sustainability [2, 3]. However, the design and per-formance prediction of desalination plants running on solar energy is generally more compli-cated than desalination plants running on fossil fuels. Solar energy is, by nature, fluctuating, whereas existing RO systems are designed for continuous operation. This demonstrates the difficulty in integrating these two systems. Consequently, the operating condition of solar de-salination plants depends upon the prevailing meteorological conditions, such as solar radia-tion and ambient temperature. A pilot unit was built and tested and has demonstrated the technology’s capability to produce good-quality water, but process optimization and energy
–––––––––––––– * Corresponding author; e-mail: [email protected]

Arsović, M., et al.: Thermodynamical Research of Using Solar Energy for … 1710 THERMAL SCIENCE, Year 2015, Vol. 19, No. 5, pp. 1709-1721
consumption minimization were yet to be fully addressed and are the focus of this work. Three tasks that are addressed in this study are: – optimizing the RO process design for energy efficiency [4], – improving the integration between photovoltaic (PV) and RO, and – lowering cost of PV.
Traditionally, implementation of PV-powered desalination units is coupled with a battery and an inverter. This approach results in high cost of water production, reduced energy efficiency, and increased system complexity. Recent research has focused on increasing sys-tem efficiency with some success [5, 6]. However, for PVRO to be practical, it must be eco-nomically competitive with alternative, conventional methods [3].
It can be seen that the main issues are related to the development of a reliable theatri-cal model of energy consumption and further lowering the cost of water treatment by RO. This paper focuses on optimizing energy requirements of desalination with the integration with solar energy. This study confirms that using PV cells to power RO desalination systems is a promis-ing solution for many in remote coastal areas facing a shortage of fresh water.
Solar desalination technologies
There are various technological combinations for integrating solar energy with water purification processes. The possible combinations have been classified depending on the solar energy used with desalination technologies. Figure 1 describes a couple of the technological combinations.
Solar PV technology is more efficient as it directly converts solar energy into elec-triCity which is high grade energy, comparing to solar thermal technology. The latter converts it into thermal or heat energy, which is low grade energy and has to be directly used or again converted into electrical energy, incurring additional losses [4].
The components of PVRO system consist of a RO desalination unit, PV generator, inverter, charge regulator, and battery storage. The layout of the system is shown in fig. 2.
Figure 1. Technological combination of conjunction of solar energy with water purification technologies
Figure 2. Schematic drawing of PVRO system
Reverse osmosis
Water desalination has become a major component of the freshwater portfolio in nu-merous communities, with water desalting by RO technology being the dominant desalination technology. The RO is a process where external pressure is exerted on the saline water side of RO membrane, forcing low total dissolved solids (TDS) water through and retaining salts.
Arsović, M., et al.: Thermodynamical Research of Using Solar Energy for … THERMAL SCIENCE, Year 2015, Vol. 19, No. 5, pp. 1709-1721 1711
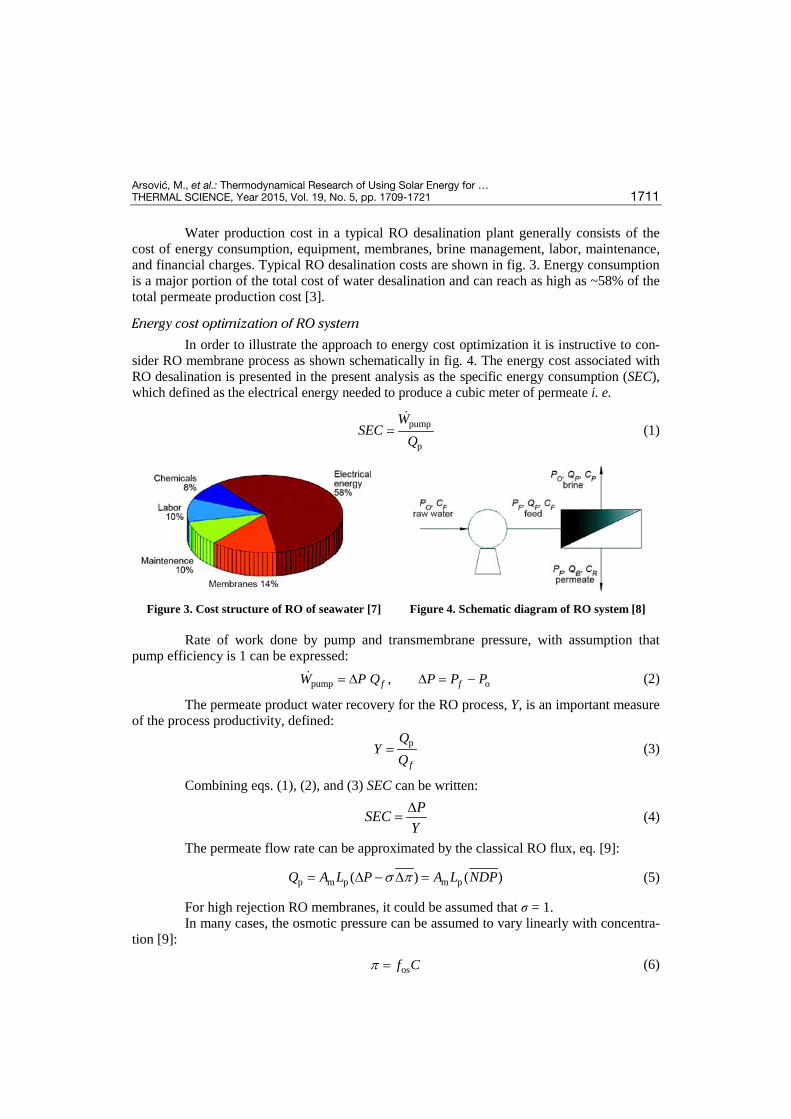
Water production cost in a typical RO desalination plant generally consists of the cost of energy consumption, equipment, membranes, brine management, labor, maintenance, and financial charges. Typical RO desalination costs are shown in fig. 3. Energy consumption is a major portion of the total cost of water desalination and can reach as high as ~58% of the total permeate production cost [3].
Energy cost optimization of RO system
In order to illustrate the approach to energy cost optimization it is instructive to con-sider RO membrane process as shown schematically in fig. 4. The energy cost associated with RO desalination is presented in the present analysis as the specific energy consumption (SEC), which defined as the electrical energy needed to produce a cubic meter of permeate i. e.
pump
p
WSEC
Q=
(1)
Figure 3. Cost structure of RO of seawater [7]
Figure 4. Schematic diagram of RO system [8]
Rate of work done by pump and transmembrane pressure, with assumption that pump efficiency is 1 can be expressed: pump o,f fW P Q P P P= ∆ ∆ = − (2)
The permeate product water recovery for the RO process, Y, is an important measure of the process productivity, defined:
p
f
QY
Q= (3)
Combining eqs. (1), (2), and (3) SEC can be written:
YPSEC ∆
= (4)
The permeate flow rate can be approximated by the classical RO flux, eq. [9]:
p m p m p( ) ( )Q A L P A L NDPσ p= ∆ − ∆ = (5)
For high rejection RO membranes, it could be assumed that σ = 1. In many cases, the osmotic pressure can be assumed to vary linearly with concentra-
tion [9]:
osf Cp = (6)
Arsović, M., et al.: Thermodynamical Research of Using Solar Energy for … 1712 THERMAL SCIENCE, Year 2015, Vol. 19, No. 5, pp. 1709-1721
The average osmotic pressure difference (up to the desired level of product water re-covery), along the membrane channel can be approximated as either an log-mean or arithme-tic average along the membrane [10]:
osos
1ln 11 , 12 1
ff
f CYf CY Y
p p −∆ = ∆ = + − (7)
The osmotic pressures at the entrance and the exit of the membrane module, relative to the permeate stream, are approximated by [10]:
entrance os p exit os p p os p, ,f rf C f C f Cp p p p p∆ = − ∆ = − = (8)
For sufficiently high rejection level, the osmotic pressure of the permeate stream can be taken to be negligible relative to the feed or concentrate streams and can be approximated by [10]:
Y
CC f
r −=
1 (9)
Combining eqs. (8) and (9) osmotic pressure difference between retentate and per-meate stream at the exit of the module can be expressed:
poexit o os, , 1
1 ff
CR f C RY Cp
p p∆ = = = −−
(10)
Equation (10) is a simple relationship that illustrates that the well-known inherent difficulty in reaching high recovery in RO desalting is due to the rapid rise in osmotic pres-sure with increased recovery. In the process of RO desalting, an external pressure is applied to overcome the osmotic pressure, and pure water is recovered from the feed solution through the use of a semipermeable membrane. Assuming that the permeate pressure is the same as the raw water pressure, Po, the applied pressure (ΔP) needed to obtain a water recovery of Y should be no less than the osmotic pressure difference at the exit region which is given by eq. (10) [11]. Therefore, in order to ensure permeate productivity along the entire RO module (or stage), the following lower bound is imposed on the applied pressure:
oexit 1
RPYp
p∆ ≥ ∆ =−
(11)
Equation (11) called thermodynamic restriction of cross-flow RO and herein re-ferred to as the “thermodynamic restriction” [12]. It is particularly important from a practical point of view when a highly-permeable membrane is used for water desalination at low pres-sures. It is emphasized that the constraint of eq. (10) arises when one wants to ensure that the entire membrane area is utilized for permeate production. The basic equations for the RO pro-cess presented in this section form the basis for deriving the basic relationship between the minimum SEC for a RO process with respect to the level of product water recovery.
The SEC in pressure units for the RO desalting process is derived by combining eqs. (1)-(3) and (11):
o
(1 )RSEC
Y Yp
≥−
(12)
Arsović, M., et al.: Thermodynamical Research of Using Solar Energy for … THERMAL SCIENCE, Year 2015, Vol. 19, No. 5, pp. 1709-1721 1713
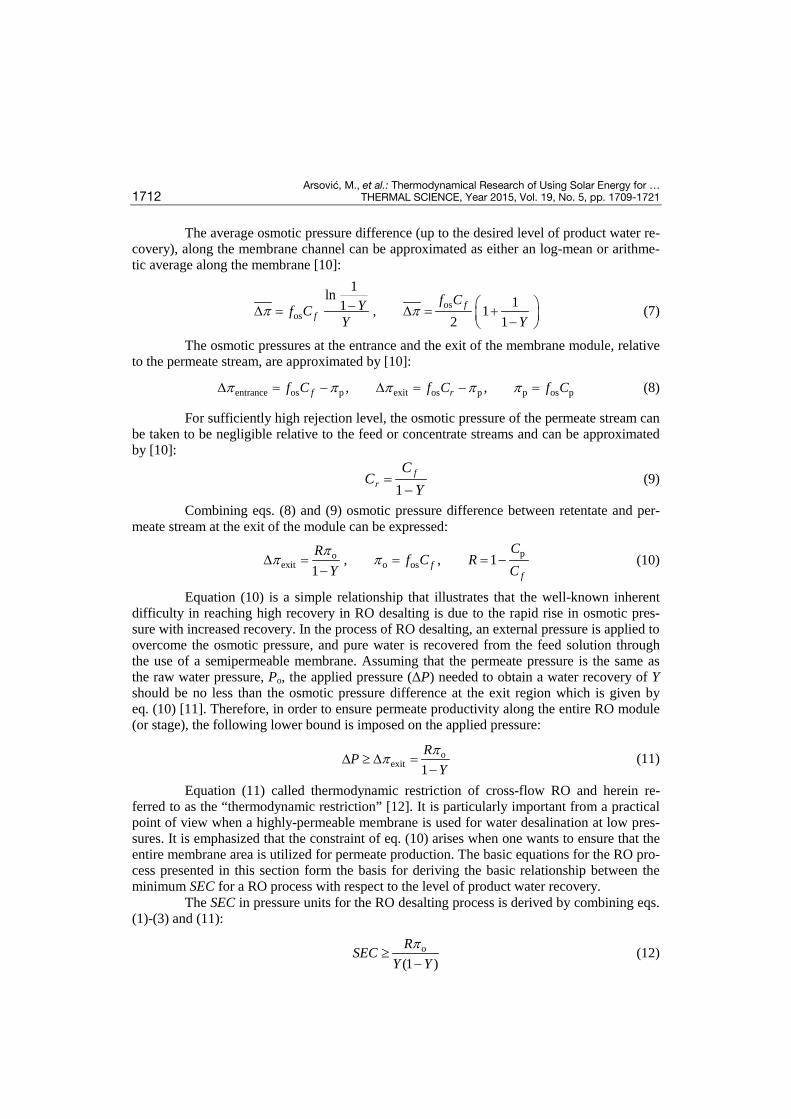
It is convenient to normalize the SEC, at the limit of thermodynamic restriction (i. e., operation up to the point in which the applied pressure equals the osmotic pressure difference between the concentrate and permeate at the exit of the membrane module), with respect to the feed osmotic pressure such that:
trtr, norm
o (1 )SEC RSEC
Y Yπ= =
− (13)
The graphic of SECtr,norm function is shown in fig. 5.
Analytical global minimum of with respect to the water recovery:
tr, normd0
dSEC
Y= (14)
Equation (14) shown that the minimum of SECtr,norm, occurs at a fractional recovery of Y = 0.5 where (SECtr,norm)min = 4
(obtain energy is four times bigger than the minimum en-
ergy required to overcome feed osmotic pressure). This condition represents the global mini-mum SEC (represented by the equality in eq. 13). In order to achieve this global minimum en-ergy consumption, the RO process should be operated at a water recovery of 50% with an ap-plied pressure equivalent to 2πo (i. e., double that the feed osmotic pressure).
For RO plant with feed water salinity of 10000 mg/l, πo = 8·105 Pa, and commercial-ly available membranes with permeability of Lp = 10–11 m3/m2sPa, global minimum energy cost is [10]: 3
o4 0.8 kWh/mSEC π= = (15)
Permeate production capacity of RO system
The average permeate flux for RO desalination at optimal conditions Yopt = 0.5 and (ΔP)opt = 2Rπo are:
( )p 2oflux p o popt
m opt opt
1(Permeate) ln 0.613 17.68 l/m h1
Q RL P LA Y Y
ππ
= = ∆ − = = −
(16)
Integration of solar PV system with RO desalination system
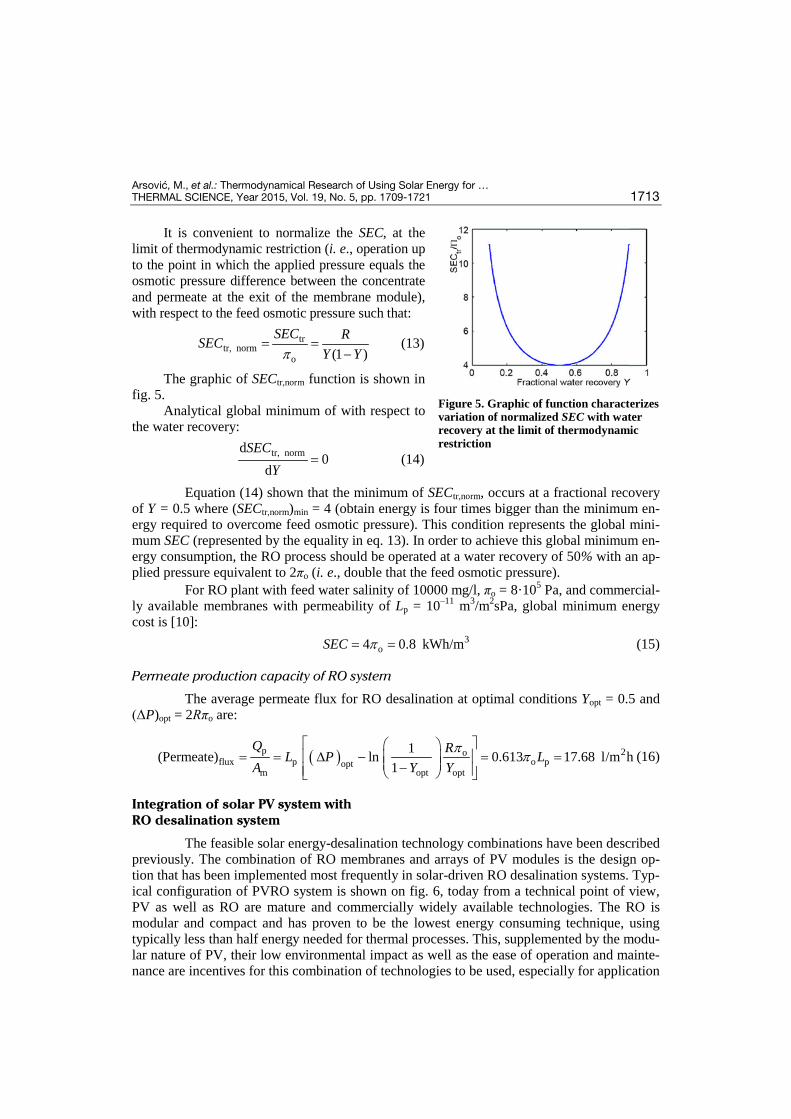
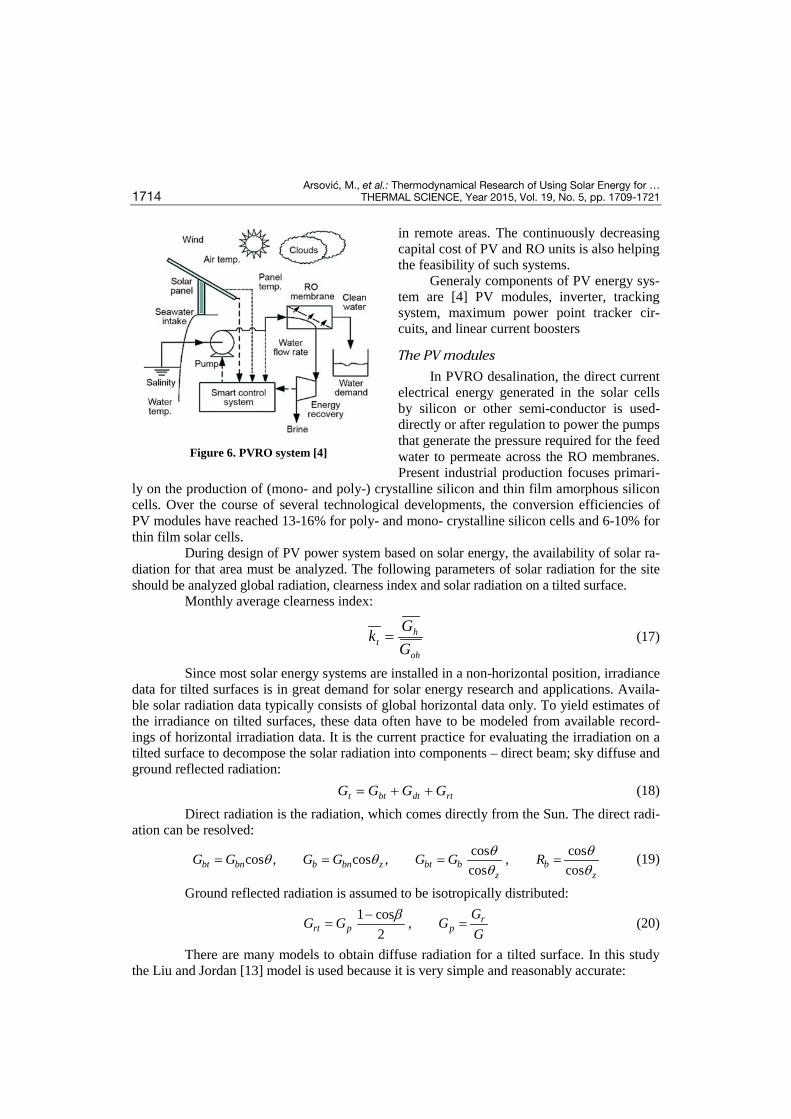
The feasible solar energy-desalination technology combinations have been described previously. The combination of RO membranes and arrays of PV modules is the design op-tion that has been implemented most frequently in solar-driven RO desalination systems. Typ-ical configuration of PVRO system is shown on fig. 6, today from a technical point of view, PV as well as RO are mature and commercially widely available technologies. The RO is modular and compact and has proven to be the lowest energy consuming technique, using typically less than half energy needed for thermal processes. This, supplemented by the modu-lar nature of PV, their low environmental impact as well as the ease of operation and mainte-nance are incentives for this combination of technologies to be used, especially for application
Figure 5. Graphic of function characterizes variation of normalized SEC with water recovery at the limit of thermodynamic restriction
Arsović, M., et al.: Thermodynamical Research of Using Solar Energy for … 1714 THERMAL SCIENCE, Year 2015, Vol. 19, No. 5, pp. 1709-1721
in remote areas. The continuously decreasing capital cost of PV and RO units is also helping the feasibility of such systems.
Generaly components of PV energy sys-tem are [4] PV modules, inverter, tracking system, maximum power point tracker cir-cuits, and linear current boosters
The PV modules
In PVRO desalination, the direct current electrical energy generated in the solar cells by silicon or other semi-conductor is used-directly or after regulation to power the pumps that generate the pressure required for the feed water to permeate across the RO membranes. Present industrial production focuses primari-
ly on the production of (mono- and poly-) crystalline silicon and thin film amorphous silicon cells. Over the course of several technological developments, the conversion efficiencies of PV modules have reached 13-16% for poly- and mono- crystalline silicon cells and 6-10% for thin film solar cells.
During design of PV power system based on solar energy, the availability of solar ra-diation for that area must be analyzed. The following parameters of solar radiation for the site should be analyzed global radiation, clearness index and solar radiation on a tilted surface.
Monthly average clearness index:
oh
ht G
Gk = (17)
Since most solar energy systems are installed in a non-horizontal position, irradiance data for tilted surfaces is in great demand for solar energy research and applications. Availa-ble solar radiation data typically consists of global horizontal data only. To yield estimates of the irradiance on tilted surfaces, these data often have to be modeled from available record-ings of horizontal irradiation data. It is the current practice for evaluating the irradiation on a tilted surface to decompose the solar radiation into components – direct beam; sky diffuse and ground reflected radiation: rtdtbtt GGGG ++= (18)
Direct radiation is the radiation, which comes directly from the Sun. The direct radi-ation can be resolved:
cos coscos , cos , ,cos cosbt bn b bn z bt b b
z zG G G G G G Rθ θθ θ
θ θ= = = = (19)
Ground reflected radiation is assumed to be isotropically distributed:
1 cos ,2
rrt p p
GG G GG
β−= = (20)
There are many models to obtain diffuse radiation for a tilted surface. In this study the Liu and Jordan [13] model is used because it is very simple and reasonably accurate:
Figure 6. PVRO system [4]
Arsović, M., et al.: Thermodynamical Research of Using Solar Energy for … THERMAL SCIENCE, Year 2015, Vol. 19, No. 5, pp. 1709-1721 1715
1 cos2dt dG G β−
= (21)
For the PV panel, each individual solar cell is represented using the classic two-diode model [14]:
cell scell 1 2
shph D D
V I RI I I IR+
= − − − (22)
The light-generated current is: 0 1 cell( )ph c tI A C C T G= + (23)
Experimental results in correlation with theoretical models
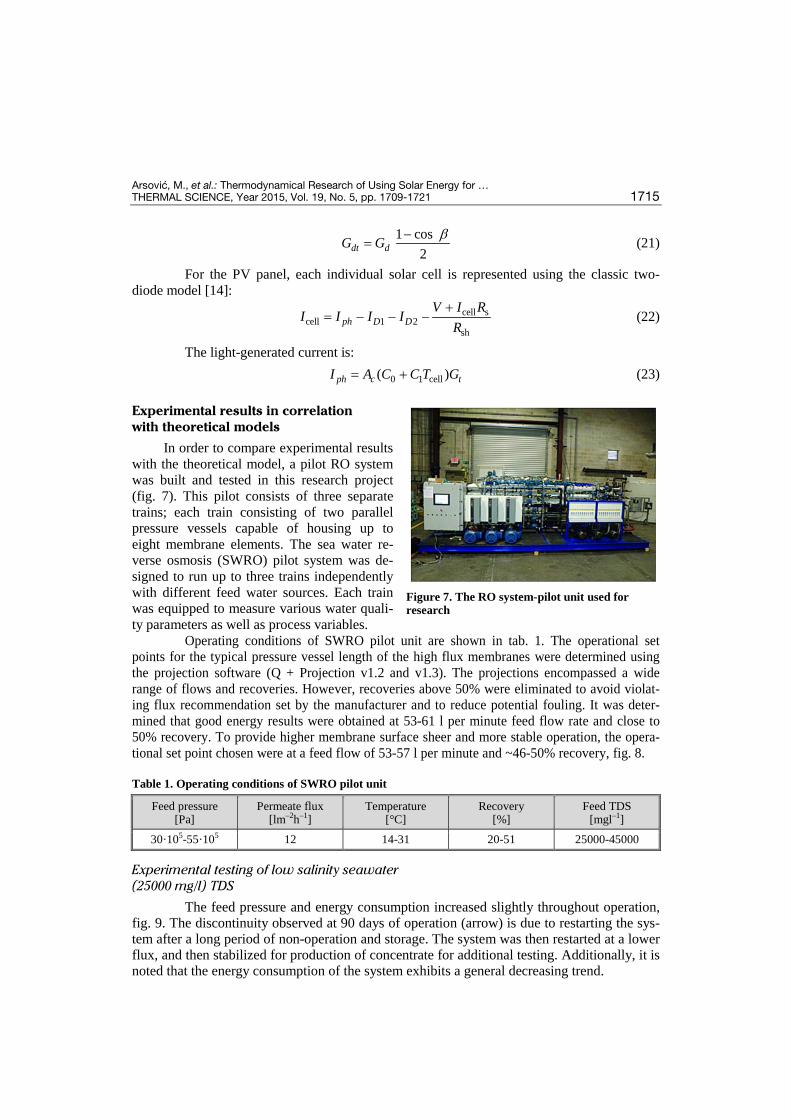
In order to compare experimental results with the theoretical model, a pilot RO system was built and tested in this research project (fig. 7). This pilot consists of three separate trains; each train consisting of two parallel pressure vessels capable of housing up to eight membrane elements. The sea water re-verse osmosis (SWRO) pilot system was de-signed to run up to three trains independently with different feed water sources. Each train was equipped to measure various water quali-ty parameters as well as process variables.
Operating conditions of SWRO pilot unit are shown in tab. 1. The operational set points for the typical pressure vessel length of the high flux membranes were determined using the projection software (Q + Projection v1.2 and v1.3). The projections encompassed a wide range of flows and recoveries. However, recoveries above 50% were eliminated to avoid violat-ing flux recommendation set by the manufacturer and to reduce potential fouling. It was deter-mined that good energy results were obtained at 53-61 l per minute feed flow rate and close to 50% recovery. To provide higher membrane surface sheer and more stable operation, the opera-tional set point chosen were at a feed flow of 53-57 l per minute and ~46-50% recovery, fig. 8.
Table 1. Operating conditions of SWRO pilot unit
Experimental testing of low salinity seawater (25000 mg/l) TDS
The feed pressure and energy consumption increased slightly throughout operation, fig. 9. The discontinuity observed at 90 days of operation (arrow) is due to restarting the sys-tem after a long period of non-operation and storage. The system was then restarted at a lower flux, and then stabilized for production of concentrate for additional testing. Additionally, it is noted that the energy consumption of the system exhibits a general decreasing trend.
Figure 7. The RO system-pilot unit used for research
Feed pressure [Pa]
Permeate flux [lm–2h–1]
Temperature [°C]
Recovery [%]
Feed TDS [mgl–1]
30·105-55·105 12 14-31 20-51 25000-45000
Arsović, M., et al.: Thermodynamical Research of Using Solar Energy for … 1716 THERMAL SCIENCE, Year 2015, Vol. 19, No. 5, pp. 1709-1721
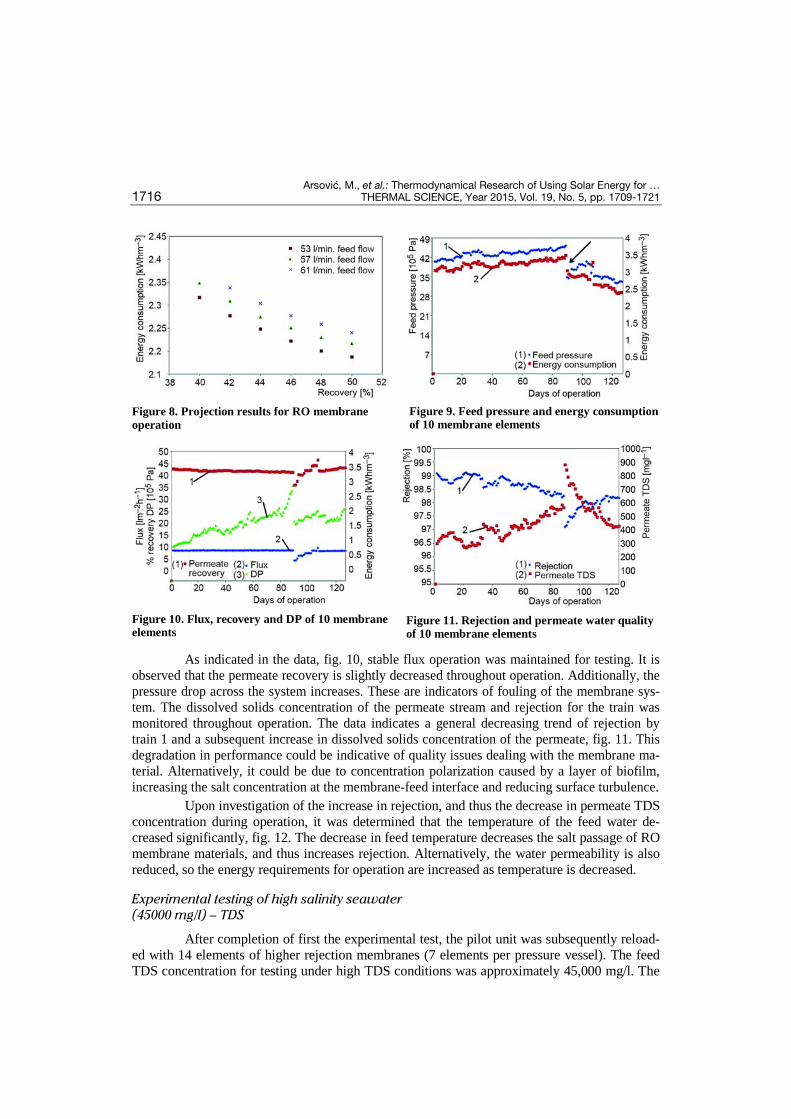
Figure 8. Projection results for RO membrane operation
Figure 9. Feed pressure and energy consumption of 10 membrane elements
Figure 10. Flux, recovery and DP of 10 membrane elements
Figure 11. Rejection and permeate water quality of 10 membrane elements
As indicated in the data, fig. 10, stable flux operation was maintained for testing. It is observed that the permeate recovery is slightly decreased throughout operation. Additionally, the pressure drop across the system increases. These are indicators of fouling of the membrane sys-tem. The dissolved solids concentration of the permeate stream and rejection for the train was monitored throughout operation. The data indicates a general decreasing trend of rejection by train 1 and a subsequent increase in dissolved solids concentration of the permeate, fig. 11. This degradation in performance could be indicative of quality issues dealing with the membrane ma-terial. Alternatively, it could be due to concentration polarization caused by a layer of biofilm, increasing the salt concentration at the membrane-feed interface and reducing surface turbulence.
Upon investigation of the increase in rejection, and thus the decrease in permeate TDS concentration during operation, it was determined that the temperature of the feed water de-creased significantly, fig. 12. The decrease in feed temperature decreases the salt passage of RO membrane materials, and thus increases rejection. Alternatively, the water permeability is also reduced, so the energy requirements for operation are increased as temperature is decreased.
Experimental testing of high salinity seawater (45000 mg/l) – TDS
After completion of first the experimental test, the pilot unit was subsequently reload-ed with 14 elements of higher rejection membranes (7 elements per pressure vessel). The feed TDS concentration for testing under high TDS conditions was approximately 45,000 mg/l. The
Arsović, M., et al.: Thermodynamical Research of Using Solar Energy for … THERMAL SCIENCE, Year 2015, Vol. 19, No. 5, pp. 1709-1721 1717
feed pressure and energy consumption gradually increased throughout operation, fig. 13. The gradual increase in feed pressure and energy consumption is caused by the onset of fouling on the membrane surface.
Figure 12. Rejection and permeate water quality of 10 membrane elements
Figure 13. Feed pressure and energy consumption of 14 membrane elements
Solar energy potential at location of Tampa City, Florida, USA
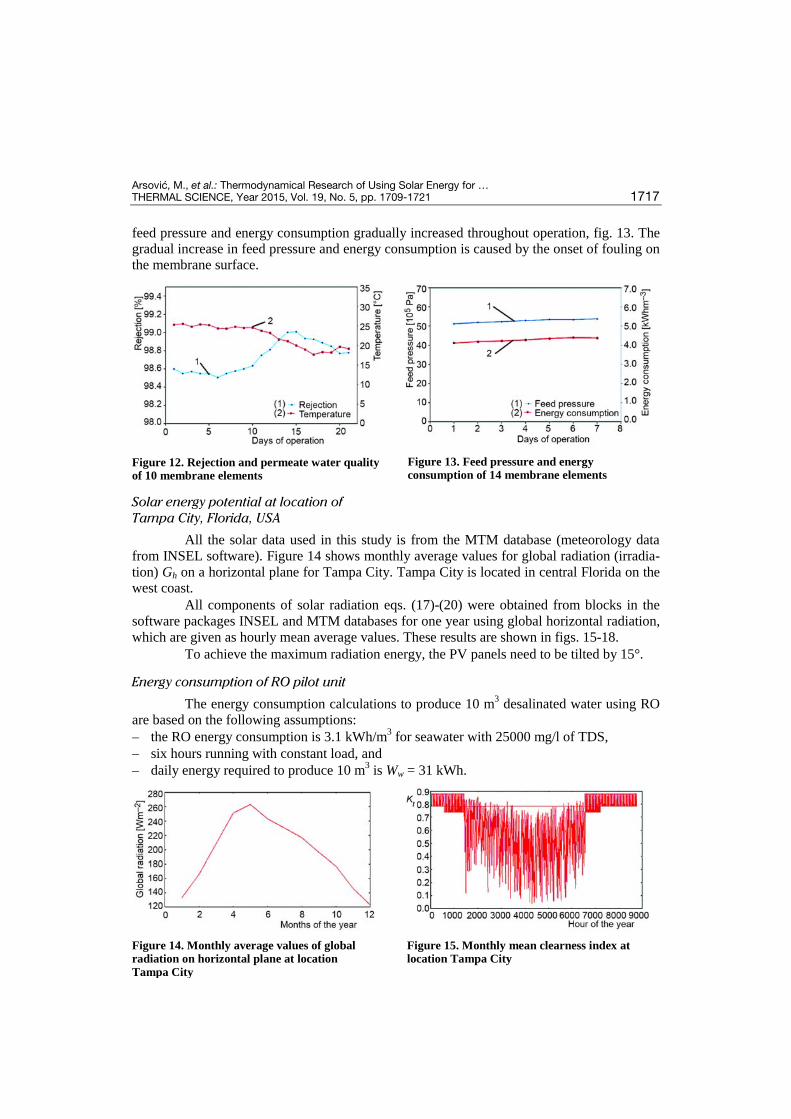
All the solar data used in this study is from the MTM database (meteorology data from INSEL software). Figure 14 shows monthly average values for global radiation (irradia-tion) Gh on a horizontal plane for Tampa City. Tampa City is located in central Florida on the west coast.
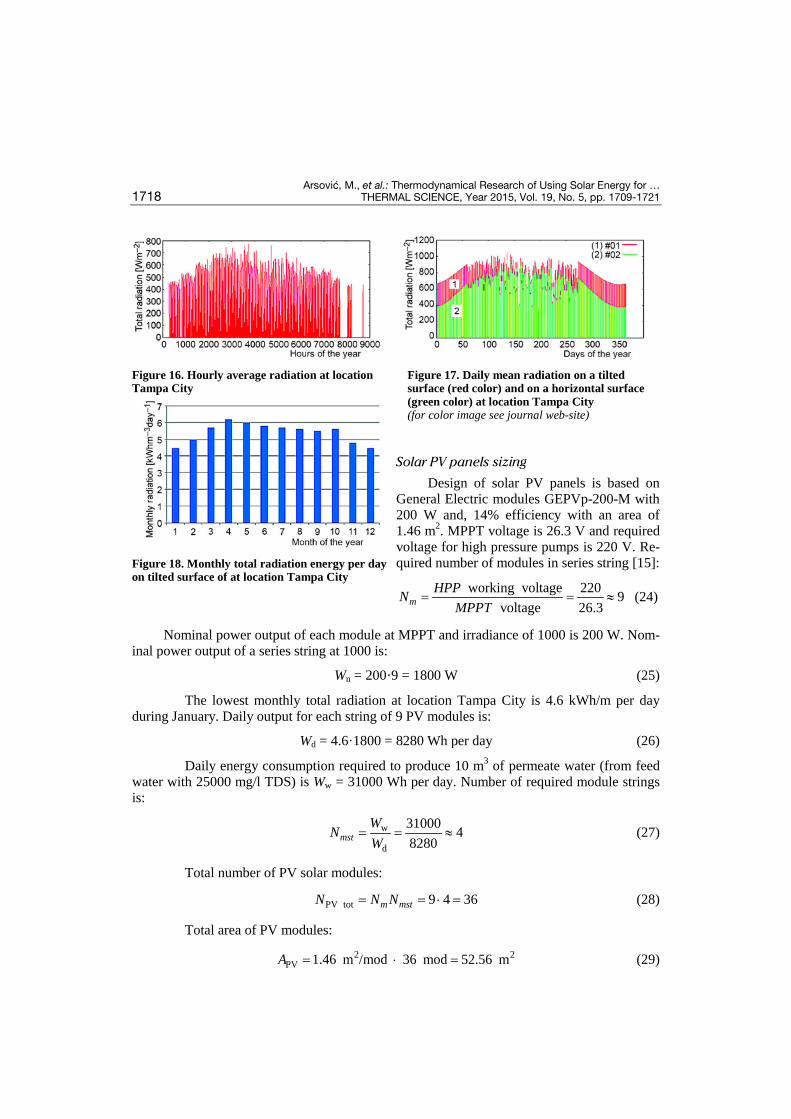
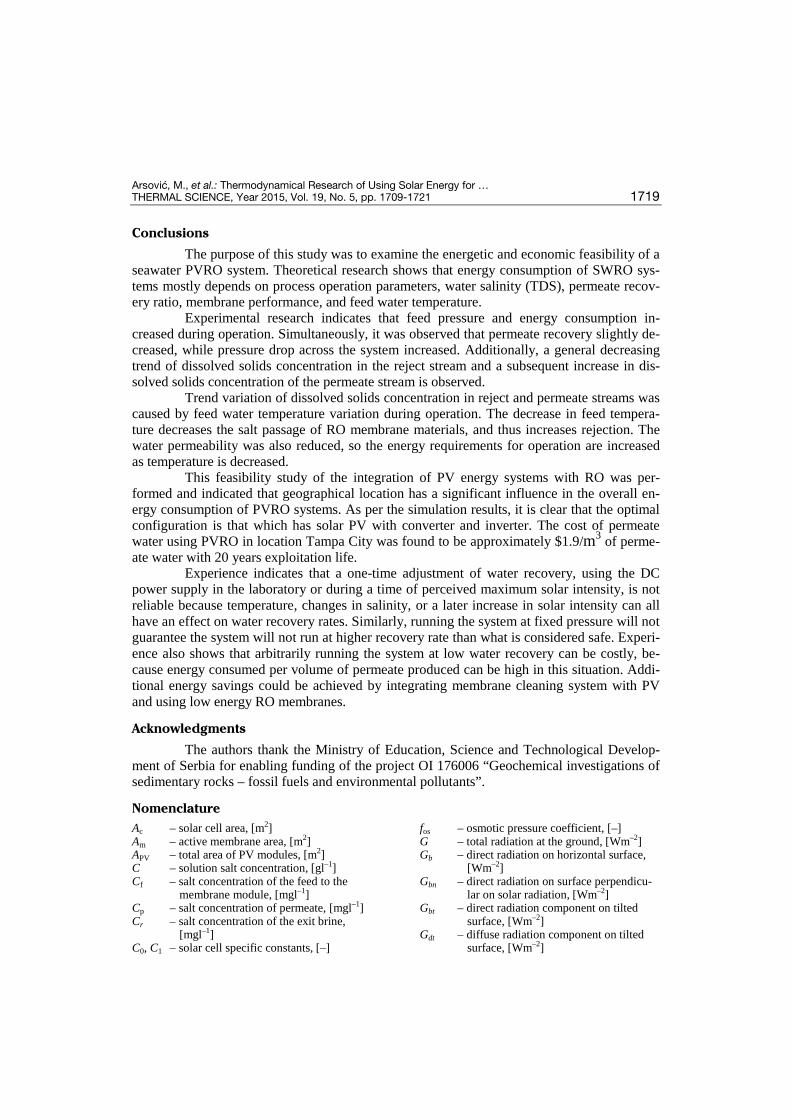
All components of solar radiation eqs. (17)-(20) were obtained from blocks in the software packages INSEL and MTM databases for one year using global horizontal radiation, which are given as hourly mean average values. These results are shown in figs. 15-18.
To achieve the maximum radiation energy, the PV panels need to be tilted by 15°.
Energy consumption of RO pilot unit
The energy consumption calculations to produce 10 m3 desalinated water using RO are based on the following assumptions: – the RO energy consumption is 3.1 kWh/m3 for seawater with 25000 mg/l of TDS, – six hours running with constant load, and – daily energy required to produce 10 m3 is Ww = 31 kWh.
Figure 14. Monthly average values of global radiation on horizontal plane at location Tampa City
Figure 15. Monthly mean clearness index at location Tampa City
Arsović, M., et al.: Thermodynamical Research of Using Solar Energy for … 1718 THERMAL SCIENCE, Year 2015, Vol. 19, No. 5, pp. 1709-1721
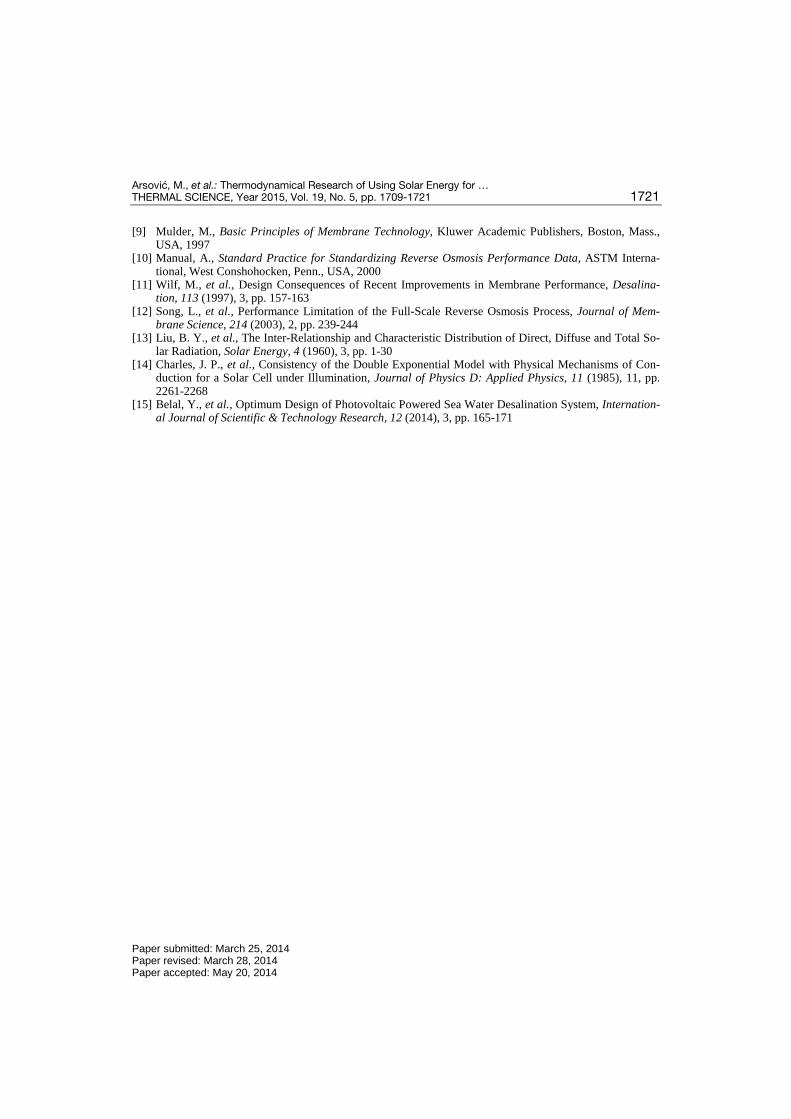
Nominal power output of each module at MPPT and irradiance of 1000 is 200 W. Nom-inal power output of a series string at 1000 is:
Wn = 200·9 = 1800 W (25)
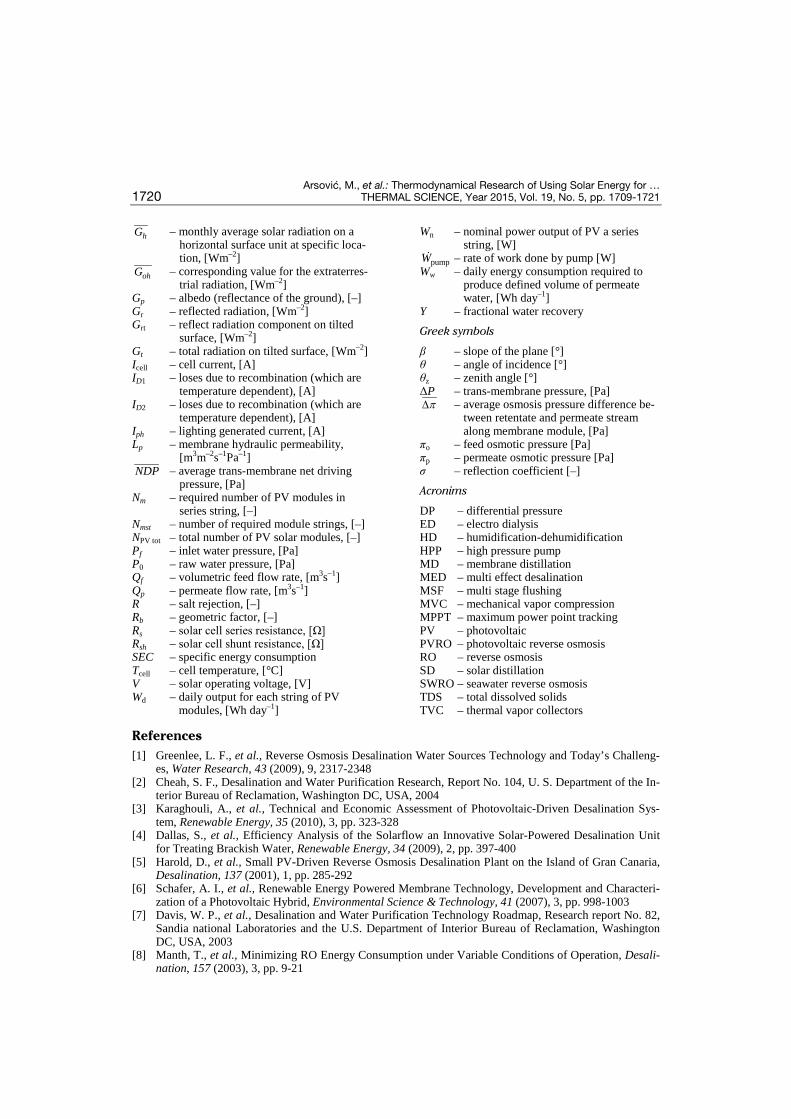
The lowest monthly total radiation at location Tampa City is 4.6 kWh/m per day during January. Daily output for each string of 9 PV modules is:
Wd = 4.6·1800 = 8280 Wh per day (26)
Daily energy consumption required to produce 10 m3 of permeate water (from feed water with 25000 mg/l TDS) is Ww = 31000 Wh per day. Number of required module strings is:
w
d
31000 48280mst
WNW
= = ≈ (27)
Total number of PV solar modules:
PV tot 9 4 36m mstN N N= = ⋅ = (28)
Total area of PV modules:
2 2PV 1.46 m /mod 36 mod 52.56 mA = ⋅ = (29)
Figure 16. Hourly average radiation at location Tampa City
Figure 18. Monthly total radiation energy per day on tilted surface of at location Tampa City
Figure 17. Daily mean radiation on a tilted surface (red color) and on a horizontal surface (green color) at location Tampa City (for color image see journal web-site)
Solar PV panels sizing
Design of solar PV panels is based on General Electric modules GEPVp-200-M with 200 W and, 14% efficiency with an area of 1.46 m2. MPPT voltage is 26.3 V and required voltage for high pressure pumps is 220 V. Re-quired number of modules in series string [15]:
working voltage 220 9voltage 26.3m
HPPNMPPT
= = ≈ (24)
Arsović, M., et al.: Thermodynamical Research of Using Solar Energy for … THERMAL SCIENCE, Year 2015, Vol. 19, No. 5, pp. 1709-1721 1719
Conclusions
The purpose of this study was to examine the energetic and economic feasibility of a seawater PVRO system. Theoretical research shows that energy consumption of SWRO sys-tems mostly depends on process operation parameters, water salinity (TDS), permeate recov-ery ratio, membrane performance, and feed water temperature.
Experimental research indicates that feed pressure and energy consumption in-creased during operation. Simultaneously, it was observed that permeate recovery slightly de-creased, while pressure drop across the system increased. Additionally, a general decreasing trend of dissolved solids concentration in the reject stream and a subsequent increase in dis-solved solids concentration of the permeate stream is observed.
Trend variation of dissolved solids concentration in reject and permeate streams was caused by feed water temperature variation during operation. The decrease in feed tempera-ture decreases the salt passage of RO membrane materials, and thus increases rejection. The water permeability was also reduced, so the energy requirements for operation are increased as temperature is decreased.
This feasibility study of the integration of PV energy systems with RO was per-formed and indicated that geographical location has a significant influence in the overall en-ergy consumption of PVRO systems. As per the simulation results, it is clear that the optimal configuration is that which has solar PV with converter and inverter. The cost of permeate water using PVRO in location Tampa City was found to be approximately $1.9/m3 of perme-ate water with 20 years exploitation life.
Experience indicates that a one-time adjustment of water recovery, using the DC power supply in the laboratory or during a time of perceived maximum solar intensity, is not reliable because temperature, changes in salinity, or a later increase in solar intensity can all have an effect on water recovery rates. Similarly, running the system at fixed pressure will not guarantee the system will not run at higher recovery rate than what is considered safe. Experi-ence also shows that arbitrarily running the system at low water recovery can be costly, be-cause energy consumed per volume of permeate produced can be high in this situation. Addi-tional energy savings could be achieved by integrating membrane cleaning system with PV and using low energy RO membranes.
Acknowledgments
The authors thank the Ministry of Education, Science and Technological Develop-ment of Serbia for enabling funding of the project OI 176006 “Geochemical investigations of sedimentary rocks – fossil fuels and environmental pollutants”.
Nomenclature Ac – solar cell area, [m2] Am – active membrane area, [m2] APV – total area of PV modules, [m2] C – solution salt concentration, [gl–1] Cf – salt concentration of the feed to the
membrane module, [mgl–1] Cp – salt concentration of permeate, [mgl–1] Cr – salt concentration of the exit brine,
[mgl–1] C0, C1 – solar cell specific constants, [–]
fos – osmotic pressure coefficient, [–] G – total radiation at the ground, [Wm–2] Gb – direct radiation on horizontal surface,
[Wm–2] Gbn – direct radiation on surface perpendicu-
lar on solar radiation, [Wm–2] Gbt – direct radiation component on tilted
surface, [Wm–2] Gdt – diffuse radiation component on tilted
surface, [Wm–2]
Arsović, M., et al.: Thermodynamical Research of Using Solar Energy for … 1720 THERMAL SCIENCE, Year 2015, Vol. 19, No. 5, pp. 1709-1721
hG – monthly average solar radiation on a horizontal surface unit at specific loca-tion, [Wm–2]
ohG – corresponding value for the extraterres-trial radiation, [Wm–2]
Gp – albedo (reflectance of the ground), [–] Gr – reflected radiation, [Wm–2] Grt – reflect radiation component on tilted
surface, [Wm–2] Gt – total radiation on tilted surface, [Wm–2] Icell – cell current, [A] ID1 – loses due to recombination (which are
temperature dependent), [A] ID2 – loses due to recombination (which are
temperature dependent), [A] Iph – lighting generated current, [A] Lp – membrane hydraulic permeability,
[m3m–2s–1Pa–1] NDP – average trans-membrane net driving
pressure, [Pa] Nm – required number of PV modules in
series string, [–] Nmst – number of required module strings, [–] NPV tot – total number of PV solar modules, [–] Pf – inlet water pressure, [Pa] P0 – raw water pressure, [Pa] Qf – volumetric feed flow rate, [m3s–1] Qp – permeate flow rate, [m3s–1] R – salt rejection, [–] Rb – geometric factor, [–] Rs – solar cell series resistance, [Ω] Rsh – solar cell shunt resistance, [Ω] SEC – specific energy consumption Tcell – cell temperature, [°C] V – solar operating voltage, [V] Wd – daily output for each string of PV
modules, [Wh day–1]
Wn – nominal power output of PV a series string, [W]
pumpW – rate of work done by pump [W] Ww – daily energy consumption required to
produce defined volume of permeate water, [Wh day–1]
Y – fractional water recovery Greek symbols
β – slope of the plane [°] θ – angle of incidence [°] θz – zenith angle [°] ΔP – trans-membrane pressure, [Pa] p∆ – average osmosis pressure difference be-
tween retentate and permeate stream along membrane module, [Pa]
πo – feed osmotic pressure [Pa] πp – permeate osmotic pressure [Pa] σ – reflection coefficient [–]
Acronims
DP – differential pressure ED – electro dialysis HD – humidification-dehumidification HPP – high pressure pump MD – membrane distillation MED – multi effect desalination MSF – multi stage flushing MVC – mechanical vapor compression MPPT – maximum power point tracking PV – photovoltaic PVRO – photovoltaic reverse osmosis RO – reverse osmosis SD – solar distillation SWRO – seawater reverse osmosis TDS – total dissolved solids TVC – thermal vapor collectors
References [1] Greenlee, L. F., et al., Reverse Osmosis Desalination Water Sources Technology and Today’s Challeng-
es, Water Research, 43 (2009), 9, 2317-2348 [2] Cheah, S. F., Desalination and Water Purification Research, Report No. 104, U. S. Department of the In-
terior Bureau of Reclamation, Washington DC, USA, 2004 [3] Karaghouli, A., et al., Technical and Economic Assessment of Photovoltaic-Driven Desalination Sys-
tem, Renewable Energy, 35 (2010), 3, pp. 323-328 [4] Dallas, S., et al., Efficiency Analysis of the Solarflow an Innovative Solar-Powered Desalination Unit
for Treating Brackish Water, Renewable Energy, 34 (2009), 2, pp. 397-400 [5] Harold, D., et al., Small PV-Driven Reverse Osmosis Desalination Plant on the Island of Gran Canaria,
Desalination, 137 (2001), 1, pp. 285-292 [6] Schafer, A. I., et al., Renewable Energy Powered Membrane Technology, Development and Characteri-
zation of a Photovoltaic Hybrid, Environmental Science & Technology, 41 (2007), 3, pp. 998-1003 [7] Davis, W. P., et al., Desalination and Water Purification Technology Roadmap, Research report No. 82,
Sandia national Laboratories and the U.S. Department of Interior Bureau of Reclamation, Washington DC, USA, 2003
[8] Manth, T., et al., Minimizing RO Energy Consumption under Variable Conditions of Operation, Desali-nation, 157 (2003), 3, pp. 9-21
Arsović, M., et al.: Thermodynamical Research of Using Solar Energy for … THERMAL SCIENCE, Year 2015, Vol. 19, No. 5, pp. 1709-1721 1721
[9] Mulder, M., Basic Principles of Membrane Technology, Kluwer Academic Publishers, Boston, Mass., USA, 1997
[10] Manual, A., Standard Practice for Standardizing Reverse Osmosis Performance Data, ASTM Interna-tional, West Conshohocken, Penn., USA, 2000
[11] Wilf, M., et al., Design Consequences of Recent Improvements in Membrane Performance, Desalina-tion, 113 (1997), 3, pp. 157-163
[12] Song, L., et al., Performance Limitation of the Full-Scale Reverse Osmosis Process, Journal of Mem-brane Science, 214 (2003), 2, pp. 239-244
[13] Liu, B. Y., et al., The Inter-Relationship and Characteristic Distribution of Direct, Diffuse and Total So-lar Radiation, Solar Energy, 4 (1960), 3, pp. 1-30
[14] Charles, J. P., et al., Consistency of the Double Exponential Model with Physical Mechanisms of Con-duction for a Solar Cell under Illumination, Journal of Physics D: Applied Physics, 11 (1985), 11, pp. 2261-2268
[15] Belal, Y., et al., Optimum Design of Photovoltaic Powered Sea Water Desalination System, Internation-al Journal of Scientific & Technology Research, 12 (2014), 3, pp. 165-171
Paper submitted: March 25, 2014 Paper revised: March 28, 2014 Paper accepted: May 20, 2014