Embed Size (px)
Citation preview
Macromolecules 1991,24, 5663-5669 5663
Thermodynamics and Phase Separation in Melt Blends of Polyethylene and Model Copolymers
Jangweon Rhee and Buckley Crist'
Department of Chemical Engineering, Northwestern University, Evanston, Illinois 60208 Received January 16, 1991; Revised Manuscript Received May 30, 1991
ABSTRACT Binary blends of linear polyethylene (PE) and hydrogenated polybutadiene (HPB) are employed to evaluate the interaction parameter x between chains containing different relative amounts of linear and ethyl-branched ClHa repeat units. Conditions for liquid-liquid phase separation in the melt are determined unambiguously from the appearance of quench-crystallized blends which have been etched to define HPB-rich domains. For polyethylene and random poly(ethy1ene-co-butene-1) at 150 "c, x = 0.022Ybp2, where Ybr is the fraction of branched CdH8 repeat units. Domain sizes range from 0.1 to 16 pm, increasing with x / x c and the time permitted for phase separation. Sizes observed for blends near the critical point compare favorably to those predicted by the linearized theory for spinodal decomposition.
Introduction
The recent discovery that olefin copolymers such as linear low-density polyethylene owe their interesting properties to the presence of chemically different chains' has spurred interest in the thermodynamics of systems containing random copolymers. Some studies have ad- dressed phase separation of homopolymer A from random AB copolymer^.^-^ In cases where the concentration of B repeats is small or where two AB copolymers of nearly the same composition are employed, miscible systems permit evaluation of the Flory-Huggins interaction parameter x. This has been done by small-angle neutron scattering (SANS) for copolymers of styrene and acrylonitrile8 and ethylene and butene-1.9 It has been recognized that the isotopic substitution required for SANS experiments can influence the measurement of small interaction param- eters.1° Only recently, however, was it found that isotope and chemical microstructure effects combine in a com- plicated mannerll which may obscure the significance of x measured by SANS.
Indeed, we have found such anomalous isotope effects in SANS studies of highly branched model copolymers of ethylene and butene-1; that is the subject of another report.12 We present here the determination of x by a variation of the cloud point method. Binary blends of linear polyethylene (PE) with a series of hydrogenated polybutadienes (HPB) are examined for phase separation in the melt state. HPB, formed by quantitative saturation of anionically polymerized polybutadiene, is a model for random ethylene-butene-1 copolymers which has the advantage of being nearly monodisperse.13 Because the linear and branched C4H8 repeat units are so similar, optical manifestation of phase separation is unreliable. The morphology of phase-separated melts is examined by scanning electron microscopy of quench-crystallized films. Beyond providing unequivocal evidence for the phase behavior of the molten blends, microscopy provides information on the phase separation process.
P E and HPB are here treated as copolymers of linear and ethyl-branched C4Hs units; HPB has a fraction Ybr of repeats which are branched, while PE has only linear units ( Y b r = 0). For this homopolymer/random copolymer system we can write14
x = c u b : (1) Ambiguity regarding the phase separation mechanism is avoided in systems having the critical composition 4 ~ ~ .
The single-phase state is stable for x < xc and unstable for x > xc, where xc and 4~~ define the critical point:
xc = (NA-lI2 + NB-'/2)2/2
(3)
Here, $JB is the volume fraction and N B is the degree of polymerization of HPB; the subscript A is for P E ho- mopolymer. In these experiments x is varied primarily through control of the branch concentration Ybr of the HPB component (eq 1). By determining the PE/HPB blend for which phase separation just occurs, eq 1 and 2 are combined to determine C. The constant C represents the interaction parameter between PE and atactic poly- butene-1, Le., HPB with Ybr = 1. This of course is amean- field result, but no assumption regarding the dependence of x on blend composition &B is involved; the interaction parameter is evaluated only at the critical volume fraction 4 ~ ~ . The time dependence of phase separation in the unstable region (x > xc) and reversibility were monitored to ensure that results are not subject to kinetic restrictions. The two-phase morphologies are interesting in their own right.
Experimental Section Polymers and Blends. Unbranched polyethylenes were
fractionated reference materials from NIST (SRM 1483 and SRM 1484); molecular weight and polydispersity were obtained from the supplier. The low and high molecular weight fractions are designated PE1 and PE2, respectively, in Table I. HPB's having various ethyl branch concentrations were prepared from anion- ically polymerized polybutadiene precursors by established meth~ds.*~J~ Characterization for molecular weight and fraction of 1,2 additions (equal to Ybr) was done on the polybutadienes by dilute-solution viscometry.16J7 and IR spectrophotometry,18 respectively. Polymers and chemical parameters are summarized in Table I, where the suffix on HPB,, indicates Y b r (multiplied by 100). The polydispersity index of all HPB's is -3.1 for anionic products such as these; this was confirmed by GPC on polymers prepared similarly to those used here.laJ8JQ Another important characteristic is that each HPB is largely or entirely amorphous at room temperature, while PE is about 70% crystalline. This difference is used to observe domains formed by phase separation in the melt.
Since the degree of polymerization N , is nearly the same for the HPB's (average NE, = 2100), binary blends with PE1 ( N A = 570) have the critical composition at HPB volume fraction &C = 0.34. Blends with #B = 0.35 were prepared in dilute xylene solution at 140 "C, precipitated in cold methanol, filtered, and
0024-9297/91/2224-5663$02.50/0 0 1991 American Chemical Society
5664 Rhee and Crist Macromolecules, Vol. 24, No. 20, 1991
more (Figure 4b). Such complete reversibility shows that thermodynamically controlled phase behavior is estab- lished without restrictions by kinetic effects. Furthermore, the 50 "K increase from 423 to 473 K decreases x by 11 % , assuming that x 0: T', whereas xc is unchanged. This permits us to bracket C between 0.0207 and 0.0233, which is entirely consistent with the evaluation from changing Ybr. A more precise definition of C is not feasible because the degree of polymerization N (and hence xc) is subject to absolute uncertainties of -5 % ,
Similar experiments were done with blends based on the high molecular weight PE2. Here xc is smaller (see Table 11) and phase separation is expected at a smaller value of Ybr for the HPB component. Indeed, the PE2/ HPB22 blend was two-phase at 150 "C and one-phase at 180 and 200 "C, leading to C = 0.021 f 0.001; this agreement with the result from the PEl/HPB31 blend shows that x, as embodied in eq 1, is independent of molecular weight of the unbranched component and independent of volume fraction over the modest range from c p ~ = 0.35 to m = 0.50.
These observations of miscibility or immiscibility in binary blends with different copolymers bear some sim- ilarity to the "miscibility map" approach suggested by Shi- omi et a1.21 One feature of the present method is reliance on what may be termed "macroscopic" phase separation, Le., liquid-liquid domains with dimensions of order 0.1 pm or greater. These sizes are, however, some 2 orders of magnitude smaller than those seen by optical microscopy of demixing l i q ~ i d s . ~ - ~ Some attempts were made to assess optical turbidity in coarsened two-phase blends such as those in Figure 3. No obvious effects were observed in films as thick as 1 mm. While this does not preclude cloud point or other scattering measurements, scattering power is no doubt small because of the similar physical properties of the blend components.
Discussion
are summarized by rewriting eq 1: Interaction Parameter. The foregoing experiments
x = 0.022 Yb: (4) Recall that this applies to PE/HPB blends at 150 "C and corresponds to interactions between linear and branched C4Hs repeat units. A recent SANS study of interactions between PE and various HPB's in the one-phase meltg yielded C = 0.014, which is 30 % smaller than the present finding. This difference is attributed to the difficulty of measuring small positive x by excess neutron scattering, particularly when compounded by interference from the hydrogen-deuterium isotope effect." There is no doubt that the present result is more correct. For example, the SANS evaluation predicts the PEl/HPB31 blend to be one-phase at 150 "C (calculated x/xc would be 0.68), whereas Figure 2 shows clearly that liquid-liquid phase separation has occurred. We are aware of no other experimental determinations of x in ethyl-branched or similar copolymer systems. The present results is in general accord with estimates based on solubility param- eters or heat of solution of low molecular weight alkanes, which predict C in the range from 0.012 to 0.041.9
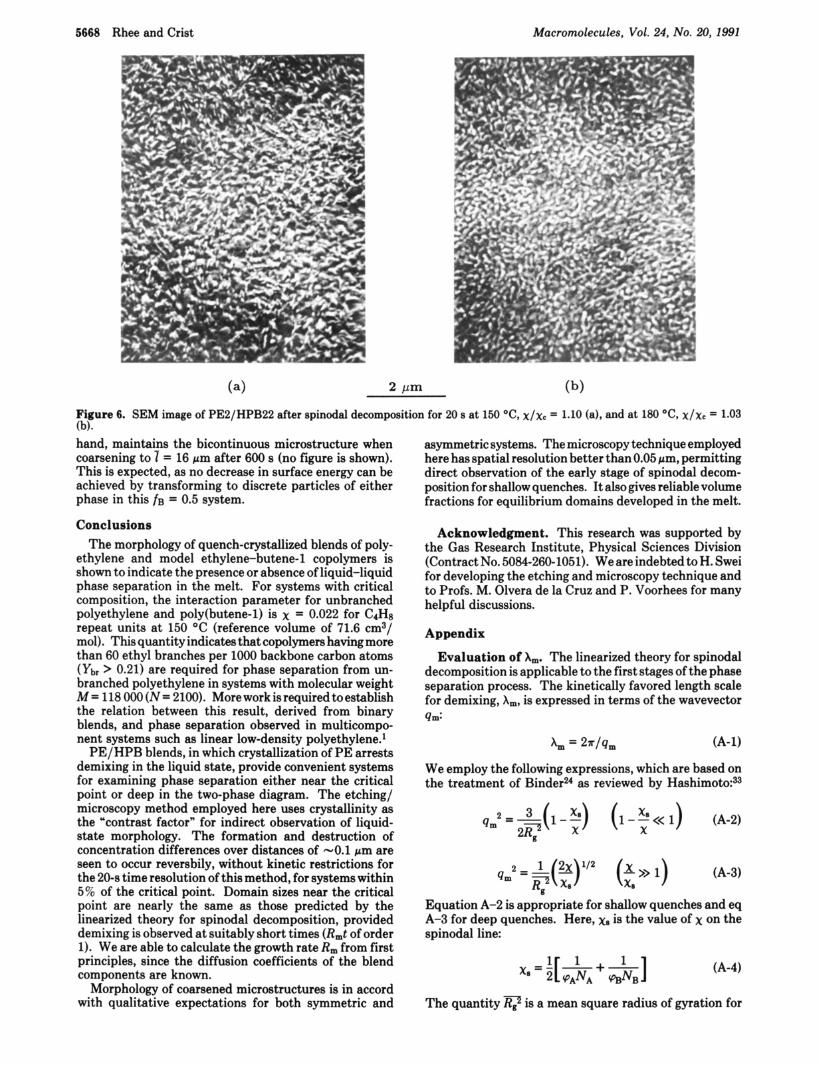
The phase diagram for PEl/HPB blends is presented in Figure 5. Here the spinodal and coexistence lines have been calculated for N A = 570 (PEl), N B = 2100 (HPB), and the interaction parameter x = xc = 2.03 X is assumed to be independent of volume fraction C#JB. Points for the blends have been located according to eq 4. Those for PEl/HPB31 through PEl/HPBGO correspond to
Table I Characterization of Polymers
PE1- PE2 HPB22 HPB29 HPB31 HPB34 HPB38 HPBGO
~~
0.00 0.00 0.22 0.29 0.31 0.34 0.38 0.60
570 2140 2000 2310 2220 1980 1850 2130
1.11 1.19
<1.1 <1.1 <1.1 <1.1 <1.1 <1.1
dried. Blends with $B = 0.50 were similarly prepared for the nearly symmetric system ( N A = NB) based on PE2.
Phase Separation and Morphology. Solution-blended powder in a small compression mold was placed in a 150 "C preheated press, held in the melt state for time t = 20 or 600 s and then removed and quenched in ice water. The times above are corrected for ca. 10 s required to melt the polymer. Chains are thus allowed to approach equilibrium from the initial state for time t , after which crystallization arrests any phase separation which occurred in the melt and preserves it for observation.3*4
Quench-crystallized films (thickness from 0.4 to 1.0 mm) were microtomed at -100 O C to expose features away from the molded surfaces. Less crystalline HPB-rich regions were preferentially etched for 2 h at room temperature with a permanganic acid solution.20 After suitable washing, the etched surface was sputter coated with Au and examined in a Hitachi S570 scanning electron microscope.
Results Representative SEM images of quenched and etched
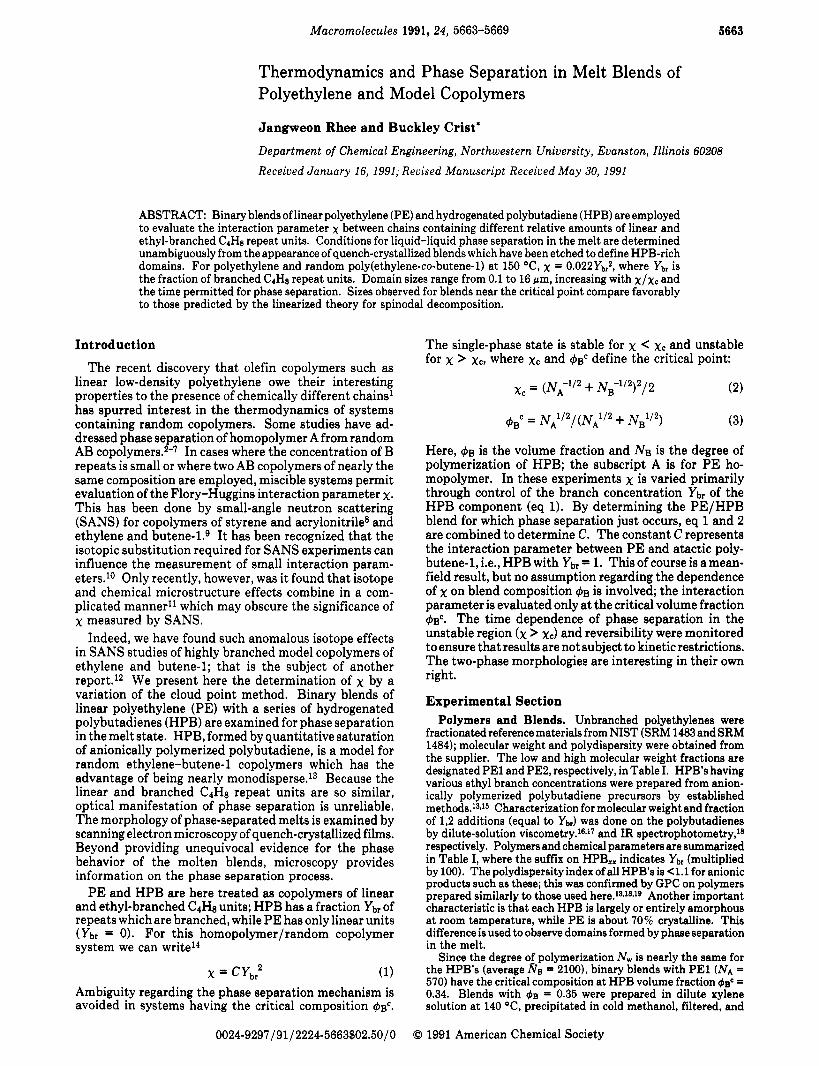
samples are shown in Figures 1-3. Conventional banded spherulites of PE1 are shown in Figure l a for reference; the unblended HPB components are noncrystalline and have no features visible by microscopy. The blend PE1/ HPB29 contains the least branched model copolymer and hence has the smallest x by eq 1. This system is one- phase in the melt, as indicated by the spherulitic texture in Figure lb. These unbanded spherulites appear some- what "open" because of dilution by 35% of noncrystal- lizable HPB29. The same blend, melted for only 20s before quenching, is identical in appearance with Figure l b (600 s in melt); there are no time effects.
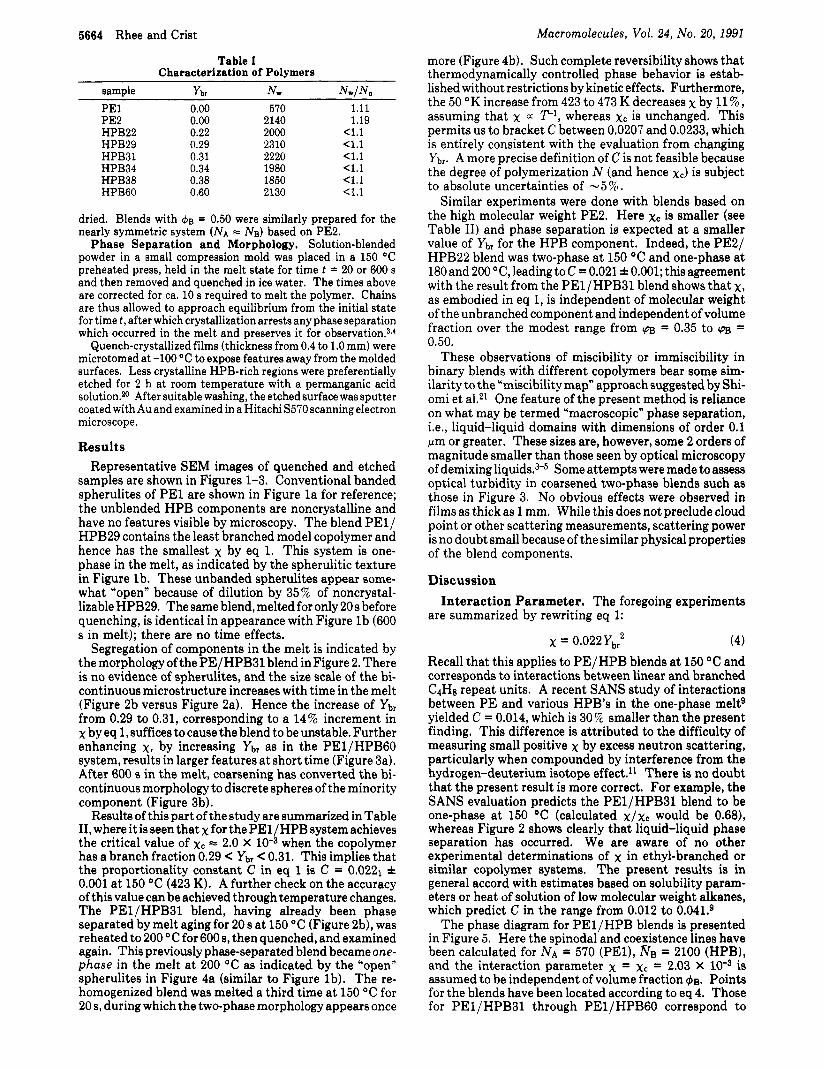
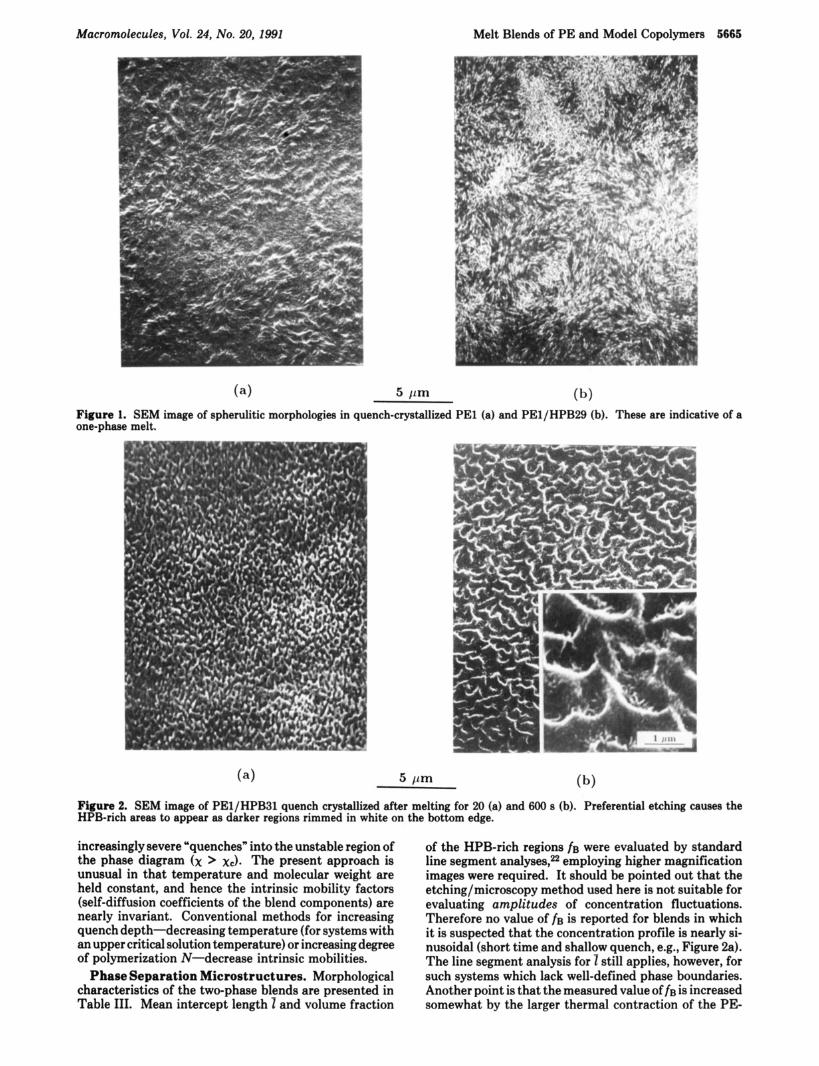
Segregation of components in the melt is indicated by the morphology of the PE/HPB31 blend in Figure 2. There is no evidence of spherulites, and the size scale of the bi- continuous microstructure increases with time in the melt (Figure 2b versus Figure 2a). Hence the increase of Ybr from 0.29 to 0.31, corresponding to a 14% increment in x by eq 1, suffices to cause the blend to be unstable. Further enhancing x, by increasing Ybr as in the PEl/HPBGO system, results in larger features at short time (Figure 3a). After 600 s in the melt, coarsening has converted the bi- continuous morphology to discrete spheres of the minority component (Figure 3b).
Results of this part of the study are summarized in Table 11, where it is seen that x for the PEl/HPB system achieves the critical value of xc - 2.0 X when the copolymer has a branch fraction 0.29 < Ybr < 0.31. This implies that the proportionality constant C in eq 1 is C = 0.0221 f 0.001 at 150 "C (423 K). A further check on the accuracy of this value can be achieved through temperature changes. The PEl/HPB31 blend, having already been phase separated by melt aging for 20 s at 150 "C (Figure 2b), was reheated to 200 "C for 600 s, then quenched, and examined again. This previously phase-separated blend became one- phase in the melt at 200 "C as indicated by the "open" spherulites in Figure 4a (similar to Figure lb). The re- homogenized blend was melted a third time at 150 "C for 20 s, during which the two-phase morphology appears once
Macromolecules, Vol. 24, No. 20, 1991 Melt Blends of PE and Model Copolymers 5665
5 pm
Figure 1. SEM image of spherulitic morphologies in quench-crystallized PE1 (a) and PEl/HPB29 (b). These are indicative of a one-phase melt.
5 Pm (b) (4 Figure 2. SEM image of PEl/HPB31 quench crystallized after melting for 20 (a) and 600 s (b). Preferential etching cauaes the HPB-rich areas to appear as darker regions rimmed in white on the bottom edge.
increasingly severe "quenches" into the unstable region of the phase diagram ( x > xc). The present approach is unusual in that temperature and molecular weight are held constant, and hence the intrinsic mobility factors (self-diffusion coefficients of the blend components) are nearly invariant. Conventional methods for increasing quench depth-decreasing temperature (for systems with an upper critical solution temperature) or increasing degree of polymerization N-decrease intrinsic mobilities.
Phase Separation Microstructures. Morphological characteristics of the two-phase blends are presented in Table 111. Mean intercept length 1 and volume fraction
of the HPB-rich regions f~ were evaluated by standard line segment analyses,22 employing higher magnification images were required. It should be pointed out that the etching/microscopy method used here is not suitable for evaluating amplitudes of concentration fluctuations. Therefore no value of f~ is reported for blends in which it is suspected that the concentration profile is nearly si- nusoidal (short time and shallow quench, e.g., Figure 2a). The line segment analysis for t still applies, however, for such systems which lack well-defined phase boundaries. Another point is that the measured value of f B is increased somewhat by the larger thermal contraction of the PE-
5666 Rhee and Crist Macromolecules, Vol. 24, No. 20,1991
Figure 3. SEM image of PEl/HPB60 quench crystallized after melting for 20 (a) and 600 B (b). Note the change in magnification compared to that in Figures 1, 2, and 4.
Table I1 Binary Blenda
concentration fluctuations as determined from scattered intensity.B*" The etching/microscopy technique em-
blend (p8 l@xe temP,OC phase ployed here does not permit measurement of concentration PEl/HPB29 0.35 1.97 150 one amplitudes, but we-can calculate the linearized growth PEl/HPB31 0.35 1.99 150 two factor R m a priori because the intrinsic diffusivities of the
200
PEl/HPB38 0.35 2.12 150 PEl/HPBGO 0.35 2.02 150 PE2/HPB22 0.50 0.97 150
180 200
PE2/HPB60 0.50 0.94 150
PEl/HPB34 0.35 2.07 150 one two two two two two one two
rich phase on cooling to room temperature; this small effect is ignored. Equilibrium volume fractions f ~ c Q were de- termined from the coexistence curve in Figure 5.
Since the phase-separated morphologies originated from spinodal decomposition, it is of interest to consider the kinetically favored wavelength Am. This is the charac- teristic size one expected at the first stage of demixing, where the linearized Cahn-Hilliard theoryB for spinodal decomposition is most applicable. Calculations based on Binder's24 analysis of phase separation in polymers are described in the Appendix and presented in Table 111. I t should be noted that the linearized Cahn-Hilliard wave- length Am decreases from 22& to 3R, as the driving force x / x c is increased from 1.06 to 8.4, the range of the current experiments. R, is a root mean square radius of gyration for the mixture of PE and HPB chains: see the Appendix. The growth rates R m for microstructures having Am are also calculated and presented in the Appendix.
Consider first the characteristic length ? for the PE1/ HPB system. This size scale for the phase-separated mi- crostructure increases with time for each blend (as seen in Figures 2 and 3), and, for t = 20 s, ? increases with x/xc . I t should be noted, however, that ? is nearly equal to the spinodal wavelength Am for the "shallowest quench" case (PEl/HPB31, x / x c = 1.06). Such equivalence between ? and Am is expected in the early stages of spinodal decomposition, for which the conventional signature is an exponential time dependence of the magnitude of the
chains are known. This calculation is presented in the Appendix as the exponent Rmt in the linearized growth expression for t = 20 s. For the shallow-quench PE1/ HPB3l blend in question, Rmt = 3.0, which is moderate and consistent with early stages. Scattering experiments on demixing polymers generally indicate that the linearized theory is applicable for Rmt I 1.1.6*25-n The range of exponents Rmt for which this approximation is valid depends of course on the composition dependencies of the interdiffusion coefficient and the second derivative of free energy for the particular blend being considered.= Re- turning to the present experiment, R m t > 50 for all other blends and times in the PEl/HPB system, so appreciable coarsening has occurred (1 > Am). It is interesting that 1 = 10 pm after 600 s for the three blends with 1.2 < x / x c < 4. This may be coincidental, but it may reflect an abrupt slowing of the coarsening rate at a characteristic size such as occurs in Ostwald ripening.
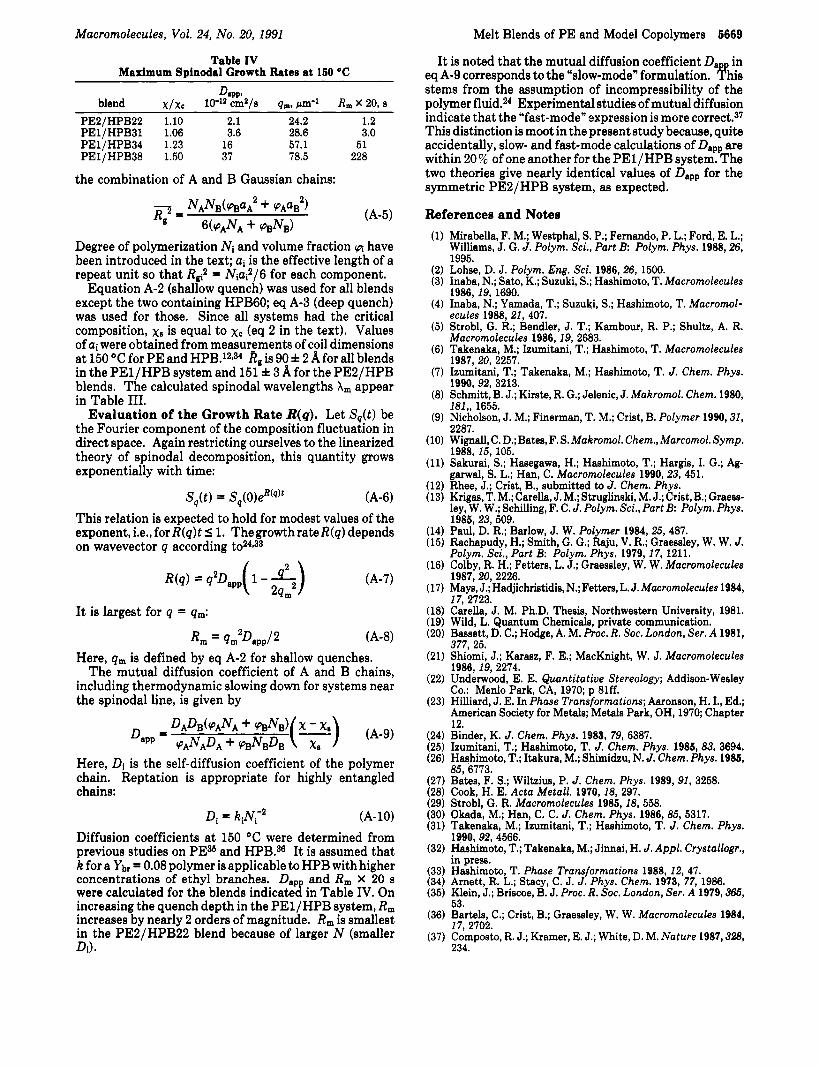
The high molecular weight blend PE2/HPB22 is also near the critical point at 150 OC ( x / x c = 1.10). Again we see that 1 = A, after 20 s, when agreement with linearized theory isexpected sinceRmt = 1.2 (-Table IV). A modest size increase due to nonlinear effects is evident after 600 s (1 2Am, R m t = 36). This system was used to examine demixing even closer to the critical point. The phase- separated blend was homogenized by heating above 200 "C (600 s) and quenching. Its microstructure a t this stage was "open" spherulites similar to that in Figure 4a. The blend was reheated for t = 20 s at T = 180 "C, a t which x / x c = 1.03, and then quenched for observation by SEM. Micrographs are shown in Figure 6 for the same blend demixed at 150 "C (Figure 6a) and at 180 "C (Figure 6b). Although the calculated wavelength Am has doubled to 0.50 pm, the observed size has decreased from 0.22 pm to 2 = 0.13 pm. For this shallow quench with large-N chains
Macromolecules, Vol. 24, No. 20, 1991 Melt Blends of PE and Model Copolymers 5667
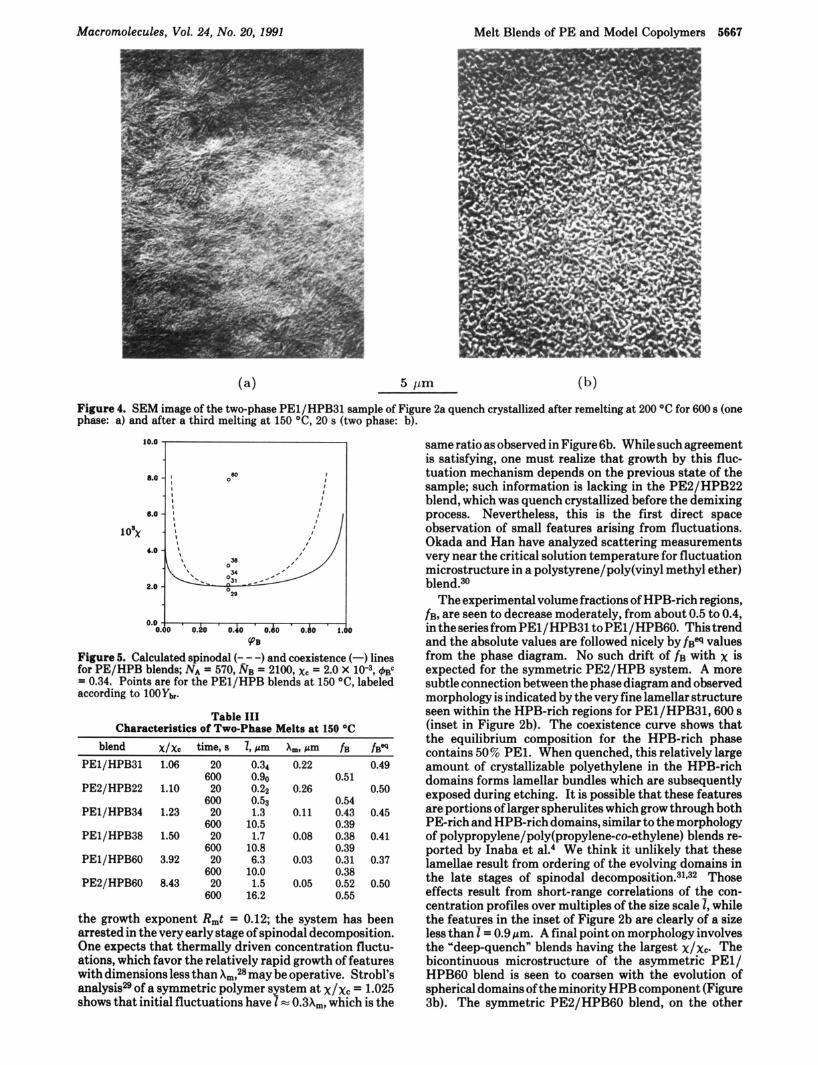
Figure 4. SEM image of the two-phase PEl/HPB31 sample of Figure 2a quench crystallized after remelting at 200 "C for 600 s (one phase: a) and after a third melting at 150 "C, 20 s (two phase: b).
1oax
8.0
8.0
4.0
2.0
0.0 ' . 0.60 0 . h o.& 0 . h 0.40 1.
QB Figure 5. Calculated spinodd(- - -) and coexistence (-) lines for PE/HPB blends; NA = 570, & = 2100, xC = 2.0 X lW3, 4~~ = 0.34. Points are for the PEl/HPB blends at 150 "C, labeled according to 1ooYbr.
Table I11 Characteristics of Two-Phase Melts at 150 O C
blend x / x c time, s PEl/HPB31 1.06 20
600 PE2/HPB22 1.10 20
600 PEl/HPB34 1.23 20
600 PEl/HPB38 1.50 20
600 PEl/HPBGO 3.92 20
600 PE2/HPB60 8.43 20
600
~ ~~~
b m hll,Ccm 0.34 0.22 0.90 0.22 0.26 0.53 1.3 0.11
1.7 0.08
6.3 0.03
1.5 0.05
10.5
10.8
10.0
16.2
f B fB"I
0.49 0.51
0.50 O S 4 0.43 0.45 0.39 0.38 0.41 0.39 0.31 0.37 0.38 0.52 0.50 0.55
the growth exponent R m t = 0.12; the system has been arrested in the very early stage of spinodal decomposition. One expects that thermally driven concentration fluctu- ations, which favor the relatively rapid growth of features with dimensions less than Am,% may be operative. Strobl's analysisB of a symmetric polymer system at x / x c = 1.025 shows that initial fluctuations have 1 = 0.3Am, which is the
same ratio as observed in Figure 6b. While such agreement is satisfying, one must realize that growth by this fluc- tuation mechanism depends on the previous state of the sample; such information is lacking in the PE2/HPB22 blend, which was quench crystallized before the demixing process. Nevertheless, this is the first direct space observation of small features arising from fluctuations. Okada and Han have analyzed scattering measurements very near the critical solution temperature for fluctuation microstructure in a polystyrene/poly(vinyl methyl ether) blend.30
The experimental volume fractions of HPB-rich regions, f ~ , are seen to decrease moderately, from about 0.5 to 0.4, in the series from PEl/HPB31 to PEl/HPB6O. This trend and the absolute values are followed nicely by ~ B " Q values from the phase diagram. No such drift of f~ with x is expected for the symmetric PE2IHPB system. A more subtle connection between the phase diagram and observed morphology is indicated by the very fine lamellar structure seen within the HPB-rich regions for PEl/HPB31,600 s (inset in Figure 2b). The coexistence curve shows that the equilibrium composition for the HPB-rich phase contains 50% PE1. When quenched, this relatively large amount of crystallizable polyethylene in the HPB-rich domains forms lamellar bundles which are subsequently exposed during etching. It is possible that these features are portions of larger spherulites which grow through both PE-rich and HPB-rich domains, similar to the morphology of polypropylene/ poly(propy1ene-co-ethylene) blends re- ported by Inaba et al.4 We think it unlikely that these lamellae result from ordering of the evolving domains in the late stages of spinodal d e c o m p ~ s i t i o n . ~ ~ ~ ~ ~ Those effects result from short-range correlations of the con- centration profiles over multiples of the size scale 1, while the features in the inset of Figure 2b are clearly of a size less than I = 0.9 pm. A final point on morphology involves the "deep-quench" blends having the largest x / x c . The bicontinuous microstructure of the asymmetric PE1/ HPB6O blend is seen to coarsen with the evolution of spherical domains of the minority HPB component (Figure 3b). The symmetric PE2/HPB60 blend, on the other
5668 Rhee and Crist Macromolecules, Vol. 24, No. 20,1991
Figure 6. SEM image of PE2/HPB22 after spinodal decomposition for 20 s at 150 "C, x / x C = 1.10 (a), and at 180 "c, x / x C = 1.03 (b). hand, maintains the bicontinuous microstructure when coarsening to 1 = 16 pm after 600 s (no figure is shown). This is expected, as no decrease in surface energy can be achieved by transforming to discrete particles of either phase in this f~ = 0.5 system.
Conclusions The morphology of quench-crystallized blends of poly-
ethylene and model ethylene-butene-1 copolymers is shown to indicate the presence or absence of liquid-liquid phase separation in the melt. For systems with critical composition, the interaction parameter for unbranched polyethylene and poly(butene-1) is x = 0.022 for CaH8 repeat units at 150 "C (reference volume of 71.6 cm3/ mol). This quantity indicates that copolymers having more than 60 ethyl branches per 1000 backbone carbon atoms (Ybr > 0.21) are required for phase separation from un- branched polyethylene in systems with molecular weight M = 118 000 (N = 2100). More work is required to establish the relation between this result, derived from binary blends, and phase separation observed in multicompo- nent systems such as linear low-density polyethylene.'
PE/HPB blends, in which crystallization of PE arrests demixing in the liquid state, provide convenient systems for examining phase separation either near the critical point or deep in the two-phase diagram. The etching/ microscopy method employed here uses crystallinity as the "contrast factor" for indirect observation of liquid- state morphology. The formation and destruction of concentration differences over distances of -0.1 pm are seen to occur reversbily, without kinetic restrictions for the 20-s time resolution of this method, for systems within 5 % of the critical point. Domain sizes near the critical point are nearly the same as those predicted by the linearized theory for spinodal decomposition, provided demixing is observed at suitably short times (Rmt of order 1). We are able to calculate the growth rate R m from first principles, since the diffusion coefficients of the blend components are known.
Morphology of coarsened microstructures is in accord with qualitative expectations for both symmetric and
asymmetric systems. The microscopy technique employed here has spatial resolution better than 0.05 pm, permitting direct observation of the early stage of spinodal decom- position for shallow quenches. It also gives reliable volume fractions for equilibrium domains developed in the melt.
Acknowledgment. This research was supported by the Gas Research Institute, Physical Sciences Division (Contract No. 5084-260-1051). We are indebted to H. Swei for developing the etching and microscopy technique and to Profs. M. Olvera de la Cruz and P. Voorhees for many helpful discussions.
Appendix
Evaluation of Am. The linearized theory for spinodal decomposition is applicable to the first stages of the phase separation process. The kinetically favored length scale for demixing, Am, is expressed in terms of the wavevector Qm:
We employ the following expressions, which are based on the treatment of Binder24 as reviewed by Hashimoto:=
q,'=3(1-:) 2T (l-:<<l) (A-2)
Equation A-2 is appropriate for shallow quenches and eq A-3 for deep quenches. Here, xs is the value of x on the spinodal line:
(A-4)
The quantity is a mean square radius of gyration for
Macromolecules, Vol. 24, No. 20, 1991
Table IV Maximum Spinodal Growth Rates at 150 O C
PE2/HPB22 1.10 2.1 24.2 1.2 PEl/HPB31 1.06 3.6 28.6 3.0 PEl/HPB34 1.23 16 57.1 51 PEI/HPB38 1.50 37 78.5 228
the combination of A and B Gaussian chains:
Degree of polymerization Ni and volume fraction cpi have been introduced in the text; ai is the effective length of a repeat unit so that R62 = Niai2/6 for each component.
Equation A-2 (shallow quench) was used for all blends except the two containing HPB6O; eq A-3 (deep quench) was used for those. Since all systems had the critical composition, xe is equal to xc (eq 2 in the text). Values of ai were obtained from measur_ementa of coil dimensions at 150 "C for PE and HPB.12p34 R, is 90 f 2 A for all blends in the PEl/HPB system and 151 f 3 A for the PE2/HPB blends. The calculated spinodal wavelengths A,,, appear in Table 111.
Evaluation of the Growth Rate R(q). Let S&) be the Fourier component of the composition fluctuation in direct space. Again restricting ourselves to the linearized theory of spinodal decomposition, this quantity grows exponentially with time:
s,(t) = Sq(0)eR(q)t ( A 4 This relation is expected to hold for modest values of the exponent, Le., for R(q)t I 1. Thegrowth rate R(q) depends on wavevector q according to24*33
It is largest for q = qm:
(A-7)
(A-8) Here, q m is defined by eq A-2 for shallow quenches.
The mutual diffusion coefficient of A and B chains, including thermodynamic slowing down for systems near the spinodal line, is given by
Here, Di is the self-diffusion coefficient of the polymer chain. Reptation is appropriate for highly entangled chains:
Di = kiNL2 (A-10) Diffusion coefficients at 150 "C were determined from previous studies on PE36 and HPB.3s I t is assumed that k for a Ybr = 0.08 polymer is applicable to HPB with higher concentrations of ethyl branches. D, and R , X 20 s were calculated for the blends indicatec! in Table IV. On increasing the quench depth in the PEl/HPB system, Rm increases by nearly 2 orders of magnitude. R, is smallest in the PE2/HPB22 blend because of larger N (smaller Di).
Melt Blends of PE and Model Copolymers 5669
It is noted that the mutual diffusion coefficient D, in eq A-9 corresponds to the Wow-mode" formulation. 'Ephis stems from the assumption of incompressibility of the polymer fluid.u Experimental studies of mutual diffusion indicate that the "fast-mode" expression is more correct.37 This distinction is moot in the present study because, quite accidentally, slow- and fast-mode calculations of Dapp are within 20% of one another for the PEl/HPB system. The two theories give nearly identical values of Dapp for the symmetric PE2/HPB system, as expected.
References and Notes Mirabella, F. M.; Westphal, S. P.; Fernando, P. L.; Ford, E. L.; Williams, J. G. J. Polym. Sci., Part E Polym. Phys. 1988,26, 1995. Lohse, D. J. Polym. Eng. Sci. 1986,26, 1500. Inaba, N.; Sato, K.; Suzuki, S.; Hashimoto, T. Macromolecules 1986,19,1690. Inaba. N.: Yamada. T.: Suzuki. S.: Hashimoto. T. Macromol- . . . eculed 1988,21, 40j. '
Strobl. G. R.: Bendler. J. T.: Kambour. R. P.: Shultz. A. R. Macromolecules 1986, .I 9, 2683. Takenaka, M.; Izumitani, T.; Hashimoto, T. Macromolecules 1987,20, 2257. Izumitani, T.; Takenaka, M.; Hashimoto, T. J. Chem. Phys. 1990,92, 3213. Schmitt, B. J.; Kirste, R. G.; Jelenic, J. Makromol. Chem. 1980, 181,, 1655. Nicholson, J. M.; Finerman, T. M.; Crist, B. Polymer 1990,31, 2281. Wignall, C. D.;Bates, F. S. Makromol. Chem., Marcomol. Symp. 1988, 15, 105. Sakurai, S.; Hasegawa, H.; Hashimoto, T.; Hargis, I. G.; Ag- garwal, S. L.; Han, C. Macromolecules 1990,23, 451. Rhee, J.; Crist, B., submitted to 3. Chem. Phys. Krigas,T.M.;Carella, J.M.;Struglinski,M. J.;Crist,B.;Graess- lev. W. W.: Schilling. F. C. J. Polvm. Sci.. Part B Polvm. Phvs. ". 158.5, 23, 509. Paul, D. R.; Barlow, J. W. Polymer 1984,25,487. Rachapudy, H.; Smith, G. G.; Raju, V. R.; Graessley, W. W. J. Polym. Sci., Part B: Polym. Phys. 1979, 17, 1211. Colby, R. H.; Fetters, L. J.; Graessley, W. W. Macromolecules 1987,20,2226. Mays, J.; Hadjichristidis, N.; Fetters, L. J. Macromolecules 1984, T V nrrna 1 1 , L l l i l .
Carella, J. M. Ph.D. Thesis, Northwestern University, 1981. Wild, L. Quantum Chemicals, private communication. Bassett, D. C.; Hodge, A. M. Proc. R. SOC. London, Ser. A 1981, 377, 25. Shiomi, J.; Karasz, F. E.; MacKnight, W. J. Macromolecules 1986,19,2274. Underwood, E. E. Quantitative Stereology; Addison-Wesley Co.: Menlo Park, CA, 1970; p 81ff. Hilliard, J. E. In Phase Transformations; Aaronson, H. I., Ed.; American Society for Metals; Metals Park, OH, 1970; Chapter 12. Binder, K. J. Chem. Phys. 1983, 79, 6381. Izumitani, T.; Hashimoto, T. J. Chem. Phys. 1985,83, 3694. Hashimoto, T.; Itakura, M.; Shimidzu, N. J. Chem. Phys. 1985, 85, 6713. Bates, F. S.; Wiltzius, P. J. Chem. Phys. 1989, 91, 3258. Cook, H. E. Acta Metall. 1970,18, 297. Strobl, G. R. Macromolecules 1985, 18, 558. Okada, M.; Han, C. C. J. Chem. Phys. 1986,85, 5317. Takenaka, M.; Izumitani, T.; Hashimoto, T. J. Chem. Phys. 1990,92,4566. Hashimoto, T.; Takenaka, M.; Jinnai, H. J. Appl. Crystallogr., in press. Hashimoto, T. Phase Transformations 1988, 12, 47. Arnett, R. L.; Stacy, C. J. J. Phys. Chem. 1973, 77, 1986. Klein, J.; Briscoe, B. J. Proc. R . SOC. London, Ser. A 1979,365, 53.
17, 2702.
234.
(36) Bartels, C.; Crist, B.; Graessley, W. W. Macromolecules 1984,
(37) Composto, R. J.; Kramer, E. J.; White, D. M. Nature 1987,328,