Embed Size (px)
Citation preview

Chapter 3: Objectives
• Introduce the concept of a pure substance.
• Discuss the physics of phase-change processes.
• Illustrate the P-v, T-v, and P-T property diagrams and P-v-T
surfaces of pure substances.
• Demonstrate the procedures for determining thermodynamic
properties of pure substances from tables of property data.
• Describe the hypothetical substance “ideal gas” and the
ideal-gas equation of state.
• Apply the ideal-gas equation of state in the solution of typical
problems.
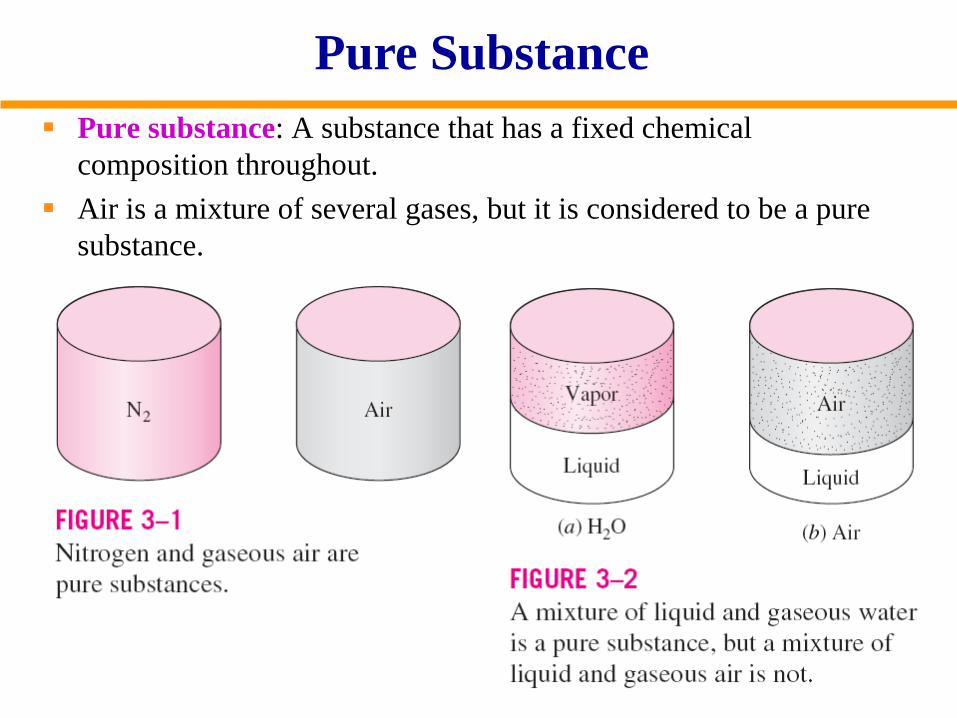
Pure Substance
3
Pure substance: A substance that has a fixed chemical
composition throughout.
Air is a mixture of several gases, but it is considered to be a pure
substance.

Phase of Pure Substance
The molecules in a solid are
kept at their positions by the
large springlike inter-
molecular forces.
In a solid, the
attractive and
repulsive
forces between
the molecules
tend to
maintain them
at relatively
constant
distances from
each other.

Compressed (Subcooled) vs Saturated Liquid
• Compressed liquid (subcooled liquid): A substance that it is not
about to vaporize.
• Saturated liquid: A liquid that is about to vaporize.
At 1 atm and 20°C,
water exists in the
liquid phase
(compressed liquid).
At 1 atm pressure
and 100°C, water
exists as a liquid
that is ready to
vaporize
(saturated liquid).

Saturated vs Superheated Vapor
• Saturated vapor: A vapor that is about to condense.
• Saturated liquid–vapor mixture: The state at which the liquid and vapor phases coexist in equilibrium.
• Superheated vapor: A vapor that is not about to condense (i.e., not a saturated vapor).
As more heat is transferred,
part of the saturated liquid
vaporizes (saturated liquid–
vapor mixture).
At 1 atm pressure, the
temperature remains
constant at 100°C until the
last drop of liquid is vaporized
(saturated vapor).
As more heat is
transferred, the
temperature of the
vapor starts to rise
(superheated vapor).

T-v diagram
T-v diagram for the
heating process of
water at constant
pressure.
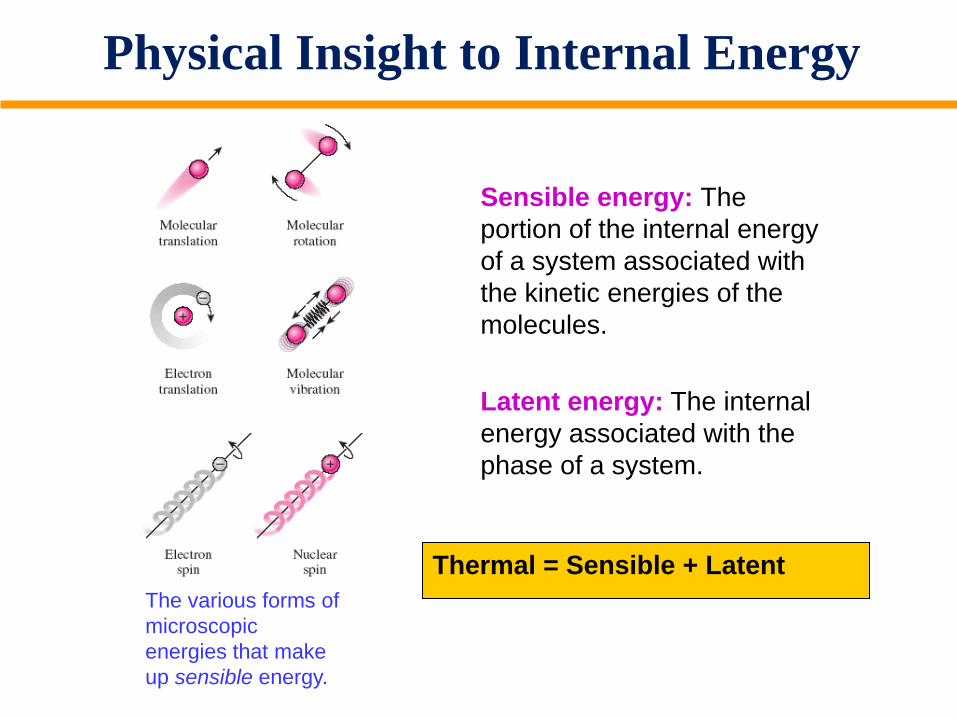
Physical Insight to Internal Energy
The various forms of
microscopic
energies that make
up sensible energy.
Sensible energy: The
portion of the internal energy
of a system associated with
the kinetic energies of the
molecules.
Latent energy: The internal
energy associated with the
phase of a system.
Thermal = Sensible + Latent

Saturation Temperature & Pressure
9
• The temperature at which water starts boiling depends on the pressure;
therefore, if the pressure is fixed, so is the boiling temperature.
• Water boils at 100C at 1 atm pressure.
• Saturation temperature Tsat: The temperature at which a pure substance
changes phase at a given pressure.
• Saturation pressure Psat: The pressure at which a pure substance changes
phase at a given temperature.
The liquid–vapor
saturation curve
of a pure
substance
(numerical
values are for
water).

Saturation Temperature & Pressure
• Latent heat: The amount of energy absorbed
or released during a phase-change process.
• Latent heat of fusion: The amount of energy
absorbed during melting. It is equivalent to the
amount of energy released during freezing.
• Latent heat of vaporization: The amount of
energy absorbed during vaporization and it is
equivalent to the energy released during
condensation.
• The magnitudes of the latent heats depend on
the temperature or pressure at which the phase
change occurs.
• At 1 atm pressure, the latent heat of fusion of
water is 333.7 kJ/kg and the latent heat of
vaporization is 2256.5 kJ/kg.
• The atmospheric pressure, and thus the boiling
temperature of water, decreases with elevation.

Liquid-Vapor Phase Change
One of the most efficient heat removal methods
(e.g., nuclear reactor cooling)
Normal operation
(Source:
Wikipedia)

Liquid-Vapor Phase Change
Cooling mode failure
@ fukushima plant
http://society.ezinemark.com/in-picture-fukushima-nuclear-
explosion-7736a65192ae.html

T-v Diagram
The variations of properties during phase-change processes are best studied and understood with the help of property diagrams such as the T-v, P-v, and P-T diagrams for pure substances.
T-v diagram of
constant-pressure
phase-change
processes of a pure
substance at various
pressures
(numerical values
are for water).

Saturated Liquid/Vapor Line
saturated liquid line
saturated vapor line
compressed liquid region
superheated vapor region
saturated liquid–vapor
mixture region (wet region)
At supercritical
pressures (P > Pcr),
there is no distinct
phase-change
(boiling) process.
Critical point: The point at
which the saturated liquid
and saturated vapor states
are identical.

Critical Properties of Various Solvents
http://www.youtube.com/watch?v=yBRdBrnIlTQ

P-v Diagram
Tsat at 1 MPa = 179.88 °C
Psat at 150°C = 0.476 MPa

P-T Diagram
Sublimation: Passing from the solid
phase directly into the vapor phase.
At low pressures
(below the triple-
point value), solids
evaporate without
melting first
(sublimation). P-T diagram of pure substances.
Phase Diagram

P-v-T Surface
The P-v-T surfaces present a great deal of information at once, but in a
thermodynamic analysis it is more convenient to work with two-dimensional
diagrams, such as the P-v and T-v diagrams.

Property Tables
For most substances, the relationships among thermodynamic properties are too
complex to be expressed by simple equations.
Some thermodynamic properties can be measured easily, but others cannot and
are calculated by using the relations between them and measurable properties.
• Table A–4: Saturation properties of water under temperature.
• Table A–5: Saturation properties of water under pressure.


Saturation temperature & Pressure
http://webbook.nist.gov/chemistry/fluid/

Examples
3-1: A rigid tank contains 50 kg of saturated liquid water at 90 °C. Determine
the pressure in the tank and the volume of the tank

Saturated Liquid–Vapor Mixture
Quality, x : The ratio of the mass of vapor to the total mass of the mixture.
Quality is between 0 and 1 0: sat. liquid, 1: sat. vapor.
The properties of the saturated liquid are the same whether it exists alone or in
a mixture with saturated vapor.
The relative
amounts of
liquid and
vapor phases
in a saturated
mixture are
specified by
the quality x.
A two-phase system can be
treated as a homogeneous
mixture for convenience.
Temperature and
pressure are dependent
properties for a mixture.

24
Saturated Liquid–Vapor Mixture

Examples
3-4: A rigid tank contains 10 kg of water at 90 °C. If 8 kg of the water is in the
liquid form and the rest is in the vapor form, determine (a) the pressure in
the tank and (b) the volume of the tank.

Ideal-Gas Equation of State
• Equation of state: Any equation that relates the pressure, temperature,
and specific volume of a substance
R: gas constant
M: molar mass (kg/kmol)
Ru: universal gas constant
Ideal gas equation
of state
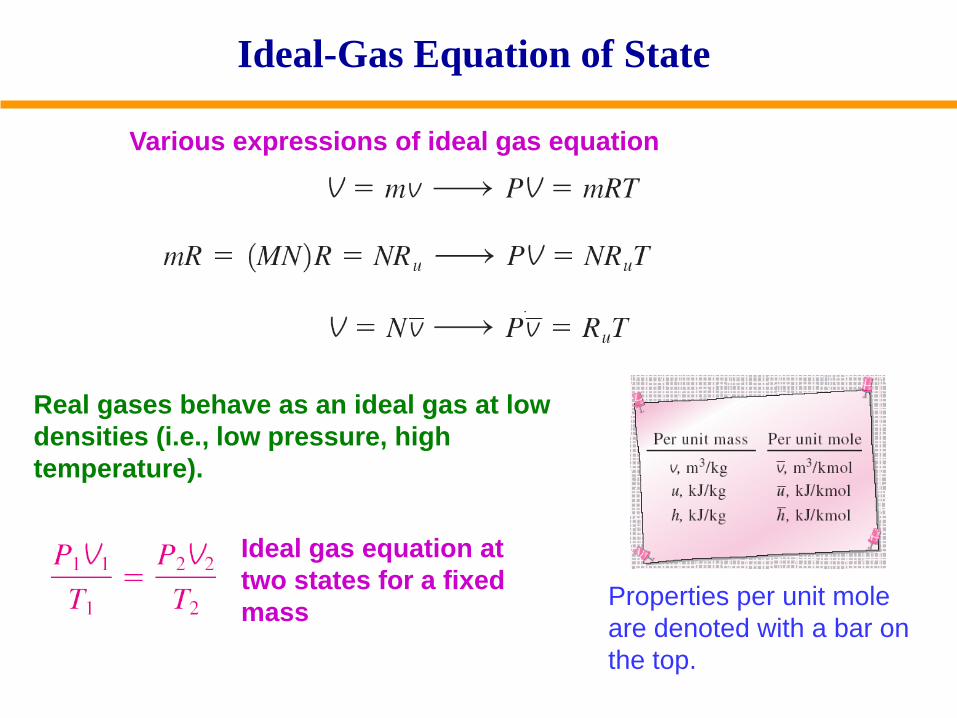
Ideal-Gas Equation of State
Properties per unit mole
are denoted with a bar on
the top.
Various expressions of ideal gas equation
Ideal gas equation at
two states for a fixed
mass
Real gases behave as an ideal gas at low
densities (i.e., low pressure, high
temperature).

Is Water Vapor an Idea Gas?
Percentage of error ([|vtable - videal|/vtable] 100) involved in
assuming steam to be an ideal gas, and the region where steam
can be treated as an ideal gas with less than 1 percent error.
At pressures below 10 kPa, water vapor can be treated as an ideal gas, regardless of its temperature, with negligible error (less than 0.1 percent). At higher pressures, however, the ideal gas assumption yields unacceptable errors.

Compressibility Factor Z
Compressibility factor Z A factor that accounts for the deviation of real
gases from ideal-gas behavior at a given temperature and pressure.

Compressibility Factor Z
Comparison of Z factors for various gases.
Reduced
temperature
Reduced
pressure

Other Equations of State
Van der Waals Equation of State
This model includes two effects not
considered in the ideal-gas model: the
intermolecular attraction forces and the
volume occupied by the molecules
themselves.
Beattie-Bridgeman Equation of State
The constants are given in
Table 3–4 for various
substances. It is known to be
reasonably accurate for
densities up to about 0.8cr.

Chapter 3: Summary
• Introduce the concept of a pure substance.
• Discuss the physics of phase-change processes.
• Illustrate the P-v, T-v, and P-T property diagrams and P-v-T
surfaces of pure substances.
• Demonstrate the procedures for determining thermodynamic
properties of pure substances from tables of property data.
• Describe the hypothetical substance “ideal gas” and the
ideal-gas equation of state.