Embed Size (px)
Citation preview
28 jan 15Åbo Akademi Univ - Thermal and Flow Engineering Piispankatu 8, 20500 Turku 1/82
Thermodynamics of separation processes
Ron ZevenhovenÅbo Akademi University
Thermal and Flow Engineering Laboratory / Värme- och strömningstekniktel. 3223 ; [email protected]
Process EngineeringThermodynamicscourse # 424304.0 v. 2015
ÅA 424304
28 jan 15Åbo Akademi Univ - Thermal and Flow Engineering Piispankatu 8, 20500 Turku 2/82
3.1 Separation and entropy
28 jan 15Åbo Akademi Univ - Thermal and Flow Engineering Piispankatu 8, 20500 Turku 3/82
Separation process and entropy /1
Separation processes involve de-mixing of species or phases, in thermodynamic sense resulting in a decrease of the total entropy of these
∑ Entropy of components or phases < Entropy of mix One way of acccomplishing a separation is to create more
phases; Gibbs’ phase rule gives for the degrees of freedom, f, for a system of p phases and n components: f = n + 2 – p. f↑ gives ΔS↑; f↓ gives ΔS↓.
A new phase can be created by 1) adding a new component(absorption/desorption, extraction), or 2) by adding or removingenergy (e.g. heat) (distillation, crystallisation)
Creating an ”un-equilibrium” gives rise to a separation (or a chemical reaction) if ΔG = ΔH-T·ΔS < 0, or ΔS >ΔH/T
28 jan 15 Åbo Akademi Univ - Thermal and Flow Engineering Piispankatu 8, 20500 Turku
4/82
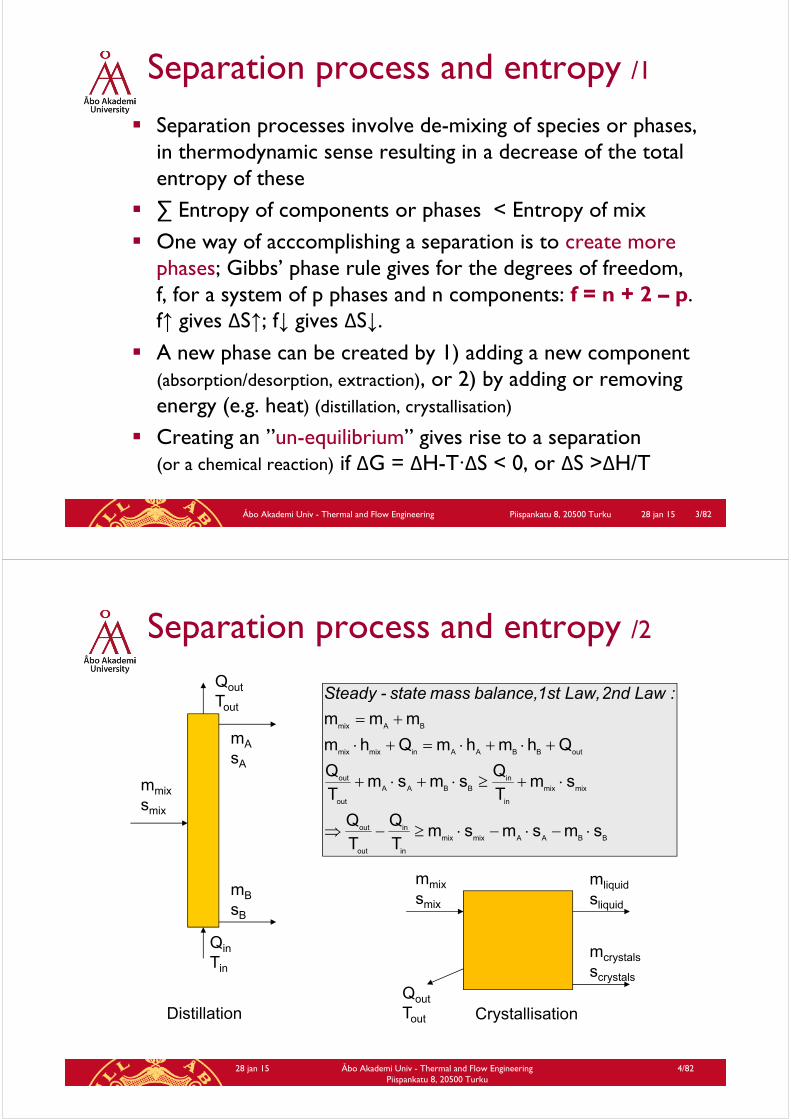
Separation process and entropy /2
mmix
smix
Qin
Tin
Qout
Tout
mA
sA
mB
sB
BBAAmixmix
in
in
out
out
mixmix
in
in
BBAA
out
out
outBBAAinmixmix
BAmix
smsmsmTQ
TQ
smTQ
smsmTQ
QhmhmQhm
mmm
:Law 2nd Law, 1st balance,mass state-Steady
Qout
Tout
mmix
smix
mliquid
sliquid
mcrystals
scrystals
Distillation Crystallisation
28 jan 15Åbo Akademi Univ - Thermal and Flow Engineering Piispankatu 8, 20500 Turku 5/82
Separation process and entropy /3
Clearly, some entropy must be produced to 1) compensate for ΔS < 0 resulting from the separation, and 2) create some driving force ΔG < 0, ΔS > ΔH/T.
Proper engineering requires minimisation of this entropyproduction ΔS and the exergy losses T°·ΔS, and balancingthis against economical considerations
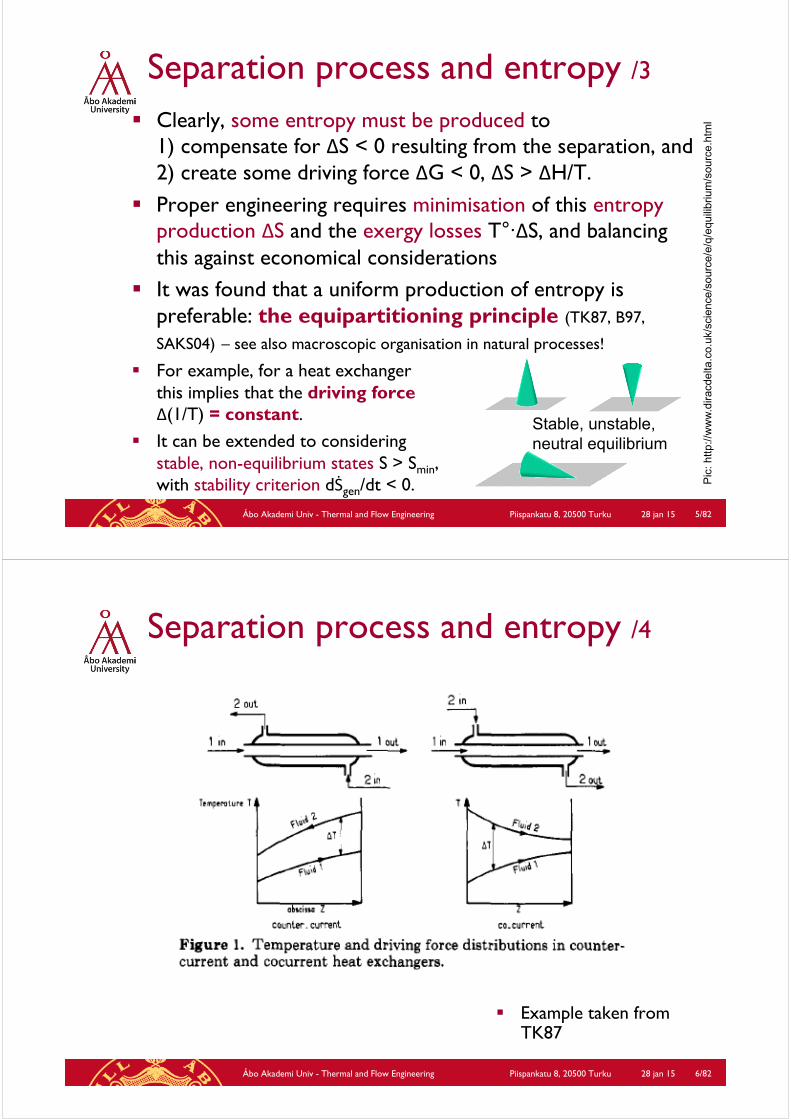
It was found that a uniform production of entropy is preferable: the equipartitioning principle (TK87, B97,
SAKS04) – see also macroscopic organisation in natural processes!
For example, for a heat exchangerthis implies that the driving forceΔ(1/T) = constant.
It can be extended to consideringstable, non-equilibrium states S > Smin, with stability criterion dṠgen/dt < 0.
Stable, unstable,neutral equilibrium
Pic
: ht
tp://
ww
w.d
iracd
elta
.co.
uk/s
cien
ce/s
ourc
e/e/
q/eq
uilib
rium
/sou
rce.
htm
l
28 jan 15Åbo Akademi Univ - Thermal and Flow Engineering Piispankatu 8, 20500 Turku 6/82
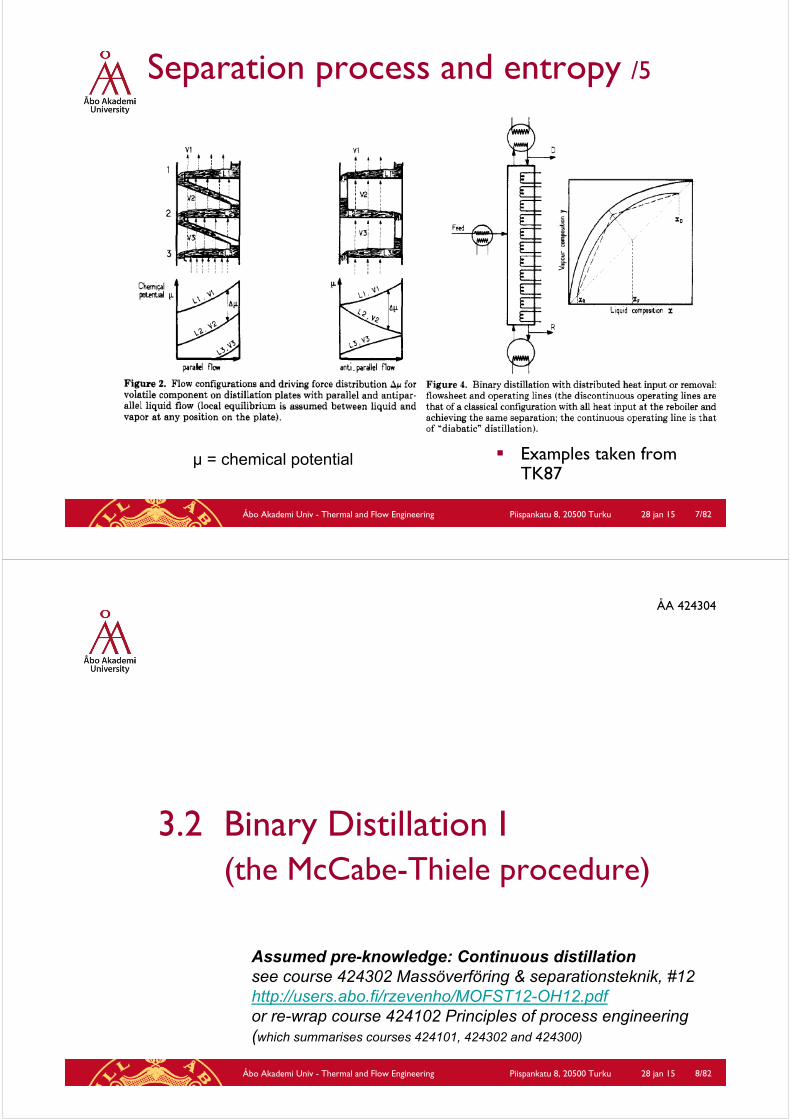
Example taken from TK87
Separation process and entropy /4
28 jan 15Åbo Akademi Univ - Thermal and Flow Engineering Piispankatu 8, 20500 Turku 7/82
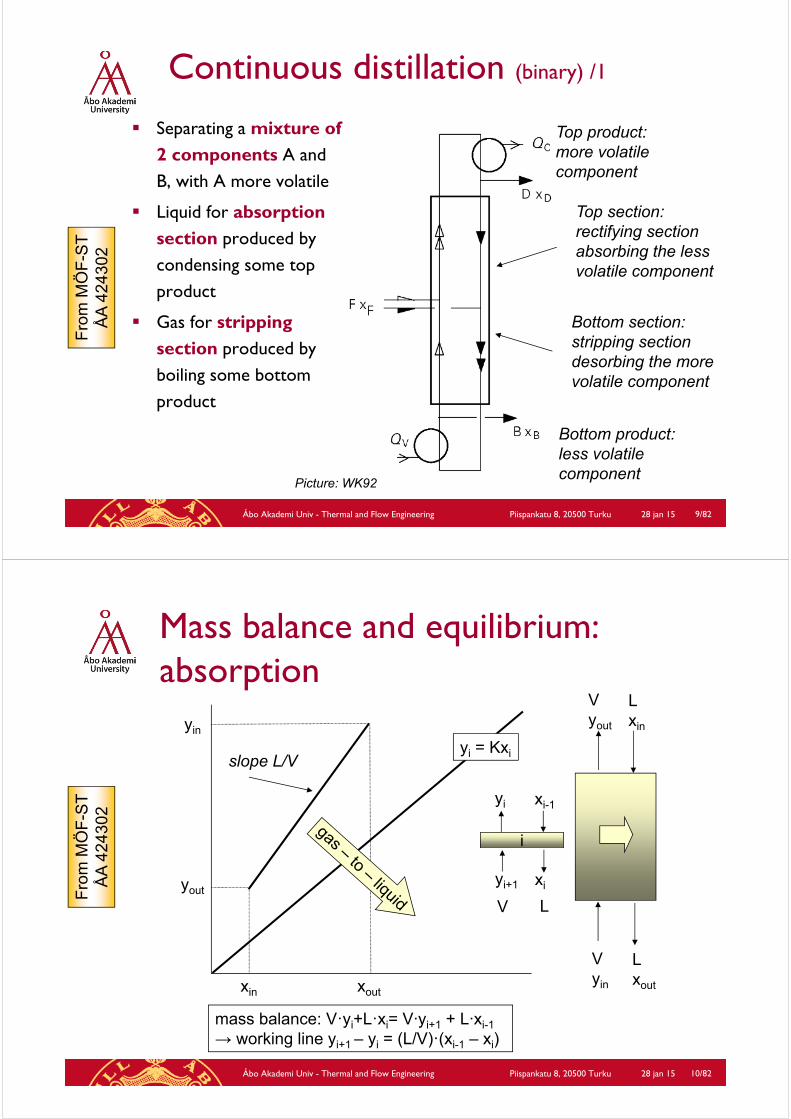
Examples taken from TK87
Separation process and entropy /5
µ = chemical potential
ÅA 424304
28 jan 15Åbo Akademi Univ - Thermal and Flow Engineering Piispankatu 8, 20500 Turku 8/82
3.2 Binary Distillation I(the McCabe-Thiele procedure)
Assumed pre-knowledge: Continuous distillationsee course 424302 Massöverföring & separationsteknik, #12http://users.abo.fi/rzevenho/MOFST12-OH12.pdfor re-wrap course 424102 Principles of process engineering(which summarises courses 424101, 424302 and 424300)
28 jan 15Åbo Akademi Univ - Thermal and Flow Engineering Piispankatu 8, 20500 Turku 9/82
Continuous distillation (binary) /1
Separating a mixture of 2 components A and B, with A more volatile
Liquid for absorption section produced by condensing some top product
Gas for stripping section produced by boiling some bottom product
Top section:rectifying sectionabsorbing the less volatile component
Bottom section:stripping sectiondesorbing the more volatile component
Bottom product:less volatile component
Top product: more volatile component
Picture: WK92
Fro
m M
ÖF
-ST
ÅA
424
302
28 jan 15Åbo Akademi Univ - Thermal and Flow Engineering Piispankatu 8, 20500 Turku 10/82
Mass balance and equilibrium: absorption
yi = Kxi
Lxin
Lxout
Vyout
Vyinxoutxin
yout
yin
i
yi+1
yi
xi
xi-1
LV
mass balance: V·yi+L·xi= V∙yi+1 + L∙xi-1
→ working line yi+1 – yi = (L/V)·(xi-1 – xi)
slope L/V
Fro
m M
ÖF
-ST
ÅA
424
302
28 jan 15Åbo Akademi Univ - Thermal and Flow Engineering Piispankatu 8, 20500 Turku 11/82
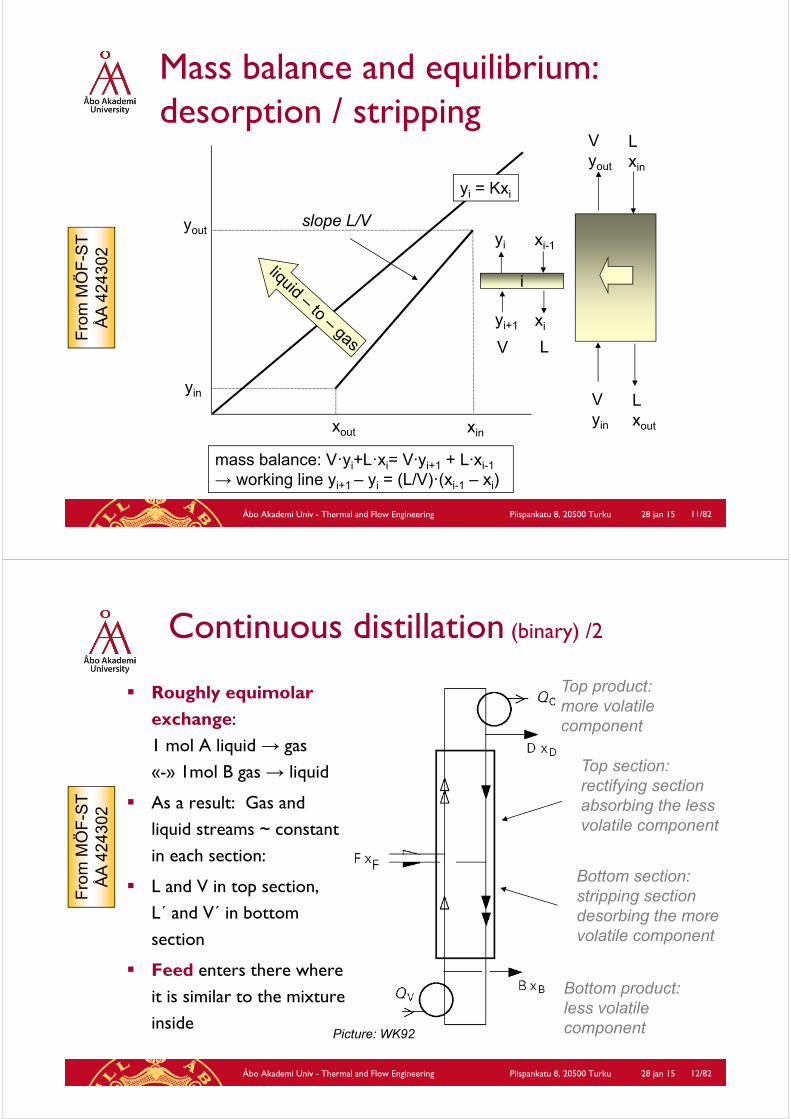
Mass balance and equilibrium: desorption / stripping
yi = Kxi
Lxin
Lxout
Vyout
Vyinxinxout
yin
yout
i
yi+1
yi
xi
xi-1
LV
mass balance: V·yi+L·xi= V∙yi+1 + L∙xi-1
→ working line yi+1 – yi = (L/V)·(xi-1 – xi)
slope L/V
Fro
m M
ÖF
-ST
ÅA
424
302
28 jan 15Åbo Akademi Univ - Thermal and Flow Engineering Piispankatu 8, 20500 Turku 12/82
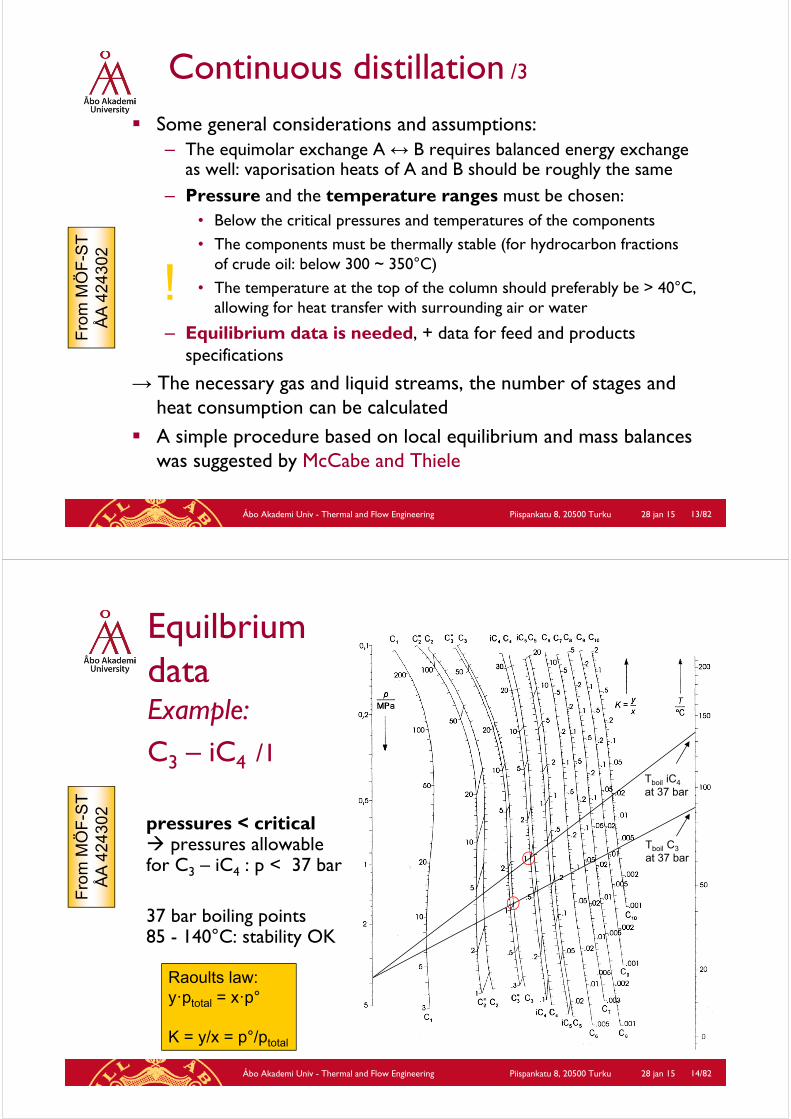
Continuous distillation (binary) /2
Roughly equimolarexchange: 1 mol A liquid → gas «-» 1mol B gas → liquid
As a result: Gas and liquid streams ~ constantin each section:
L and V in top section, L´ and V´ in bottom section
Feed enters there whereit is similar to the mixtureinside
Top section:rectifying sectionabsorbing the less volatile component
Bottom section:stripping sectiondesorbing the more volatile component
Bottom product:less volatile component
Top product: more volatile component
Picture: WK92
Fro
m M
ÖF
-ST
ÅA
424
302
28 jan 15Åbo Akademi Univ - Thermal and Flow Engineering Piispankatu 8, 20500 Turku 13/82
Continuous distillation /3
Some general considerations and assumptions:– The equimolar exchange A ↔ B requires balanced energy exchange
as well: vaporisation heats of A and B should be roughly the same– Pressure and the temperature ranges must be chosen:
• Below the critical pressures and temperatures of the components• The components must be thermally stable (for hydrocarbon fractions
of crude oil: below 300 ~ 350°C)• The temperature at the top of the column should preferably be > 40°C,
allowing for heat transfer with surrounding air or water
– Equilibrium data is needed, + data for feed and productsspecifications
→ The necessary gas and liquid streams, the number of stages and heat consumption can be calculated
A simple procedure based on local equilibrium and mass balanceswas suggested by McCabe and Thiele
!
Fro
m M
ÖF
-ST
ÅA
424
302
28 jan 15Åbo Akademi Univ - Thermal and Flow Engineering Piispankatu 8, 20500 Turku 14/82
EquilbriumdataExample:C3 – iC4 /1
pressures < critical pressures allowablefor C3 – iC4 : p < 37 bar
37 bar boiling points 85 - 140°C: stability OK
Tboil iC4
at 37 bar
Tboil C3
at 37 bar
Raoults law: y·ptotal = x·p°
K = y/x = p°/ptotal
Fro
m M
ÖF
-ST
ÅA
424
302

28 jan 15Åbo Akademi Univ - Thermal and Flow Engineering Piispankatu 8, 20500 Turku 15/82
Chose 40°C as the temperatur at the condensor.
At Tmin = 40°C, the vapour pressure of the more volatile component which is C3
= 14 bar → p ≥ 14 bar
Then Tboil ~ 81°C for iC4
Tboil C3
at 14 bar
p° C3
at 40°C
Tboil iC4
at 14 bar
EquilbriumdataExample:C3 – iC4 /2
Fro
m M
ÖF
-ST
ÅA
424
302
28 jan 15Åbo Akademi Univ - Thermal and Flow Engineering Piispankatu 8, 20500 Turku 16/82
Binary distillation, McCabe-Thiele /1
Pic: WK92
The McCabe-Thiele x,y diagram procedure for continuous binarydistillation is limited to cases where the vapour and liquid mass flows are ≈ constant in both the top and bottom section of the column.
This requires that the vaporisation / condensation heats for the twocomponents are ≈ the same, and that mixing heat effects are negligible.
For example EtOH/H2O: Δvaph(EtOH) ≈ Δvaph(H2O) ≈ 40 kJ/mol elementary courses (e.g. ÅA424302, Z12)

28 jan 15 Åbo Akademi Univ - Thermal and Flow Engineering Piispankatu 8, 20500 Turku
17/82
Binary distillation, McCabe-Thiele /2
q = fraction of feed that gives liquid on the feedingtray: L´= L + q· F,
F· q = ΔL and F· (1-q) = ΔV
q is related to the energyneeded to convert the feedcompletely into vapour. With enthalpies H for saturatedliquid and saturated gas it is found that
q >1q = 1
0 < q < 1q = 0q < 0
sat,Lsat,G
Fsat,G
HH
HHq
Picture: after T68
Fro
m M
ÖF
-ST
ÅA
424
302
28 jan 15Åbo Akademi Univ - Thermal and Flow Engineering Piispankatu 8, 20500 Turku 18/82
Binary distillation, McCabe-Thiele /3
The McCabe-Thiele x,ydiagram procedure is thusbased on mass balances(giving straight operating lines) and chemicalequilibrium data
If this method cannot be used, a graphical methodbased on enthalpy –composition (h,x or h,ξ) diagrams as given by Ponchon – de Savarit canbe used, based on localequilibrium, mass balancesand energy balances
Pic
: http
://co
mm
ons.
wik
imed
ia.o
rg/w
iki/F
ile:M
cCab
e-T
hiel
e_di
agra
m.p
ng
elementary courses(e.g. ÅA424302, Z12)
28 jan 15Åbo Akademi Univ - Thermal and Flow Engineering Piispankatu 8, 20500 Turku 19/82
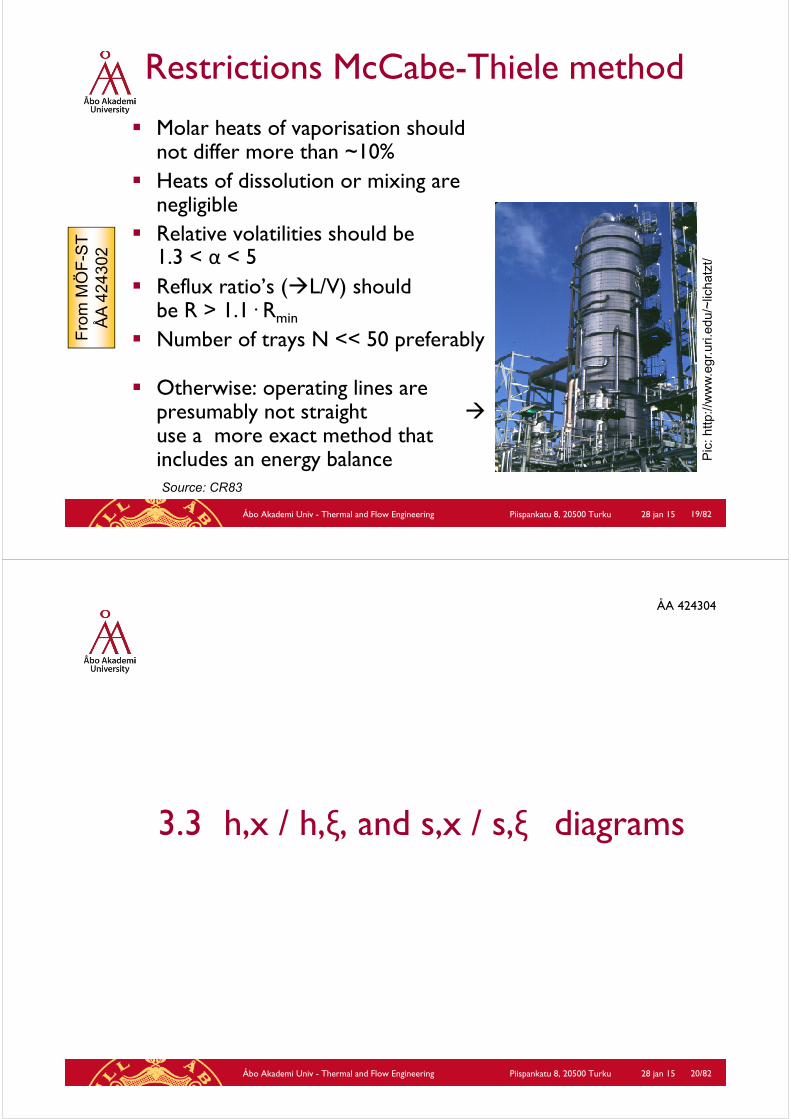
Restrictions McCabe-Thiele method
Molar heats of vaporisation shouldnot differ more than ~10%
Heats of dissolution or mixing are negligible
Relative volatilities should be 1.3 < α < 5
Reflux ratio’s (L/V) shouldbe R > 1.1· Rmin
Number of trays N << 50 preferably
Otherwise: operating lines are presumably not straight use a more exact method that includes an energy balanceSource: CR83
Fro
m M
ÖF
-ST
ÅA
424
302
Pic
: http
://w
ww
.egr
.uri.
edu/
~lic
hatz
t/
ÅA 424304
28 jan 15Åbo Akademi Univ - Thermal and Flow Engineering Piispankatu 8, 20500 Turku 20/82
3.3 h,x / h,ξ, and s,x / s,ξ diagrams

28 jan 15Åbo Akademi Univ - Thermal and Flow Engineering Piispankatu 8, 20500 Turku 21/82
Mixing heat for binary mixtures
For this mixing process: h = ξ·ha + (1-ξ)·hb + qmix
with mixing heat qmixto keep temperatureconstant
Mixing heat data can be used to produce h,x or h,ξdiagrams
ξ kg B
1-ξ kg A
1 kg mixξ = mass fraction for the most volatile compoundx = molar fraction for the most volatile compound
With molar masses Ma
and Mb :
b
a
a
b
MM
xx
ξ
;
MM
ξξ
x
28 jan 15Åbo Akademi Univ - Thermal and Flow Engineering Piispankatu 8, 20500 Turku 22/82
↑ Mixing heat data for NH3-H2O and for EtOH-H2O (liq)
Schematic h,x or h,ξ diagram → for three temperatures (t1, t2, t3)
EtOH-H2O
NH3-H2O
Pics: B01
Mixing heat, h,ξ diagram /1

28 jan 15Åbo Akademi Univ - Thermal and Flow Engineering Piispankatu 8, 20500 Turku 23/82
Mixing heat, h,ξ diagram /2
Determination of heat of mixing, qmix, versus composition, ξ: a boiling liquid mixture (mass m, composition ξf, enthalpy hf) is fedinto a calorimeter; a small amount of heat dq gives a small amount of vapour, dm (composition ξd, enthalpy hd)
Mass balance, heat balance:
gives (eliminate m) qmix= dq/dm =
Pic: B01
28 jan 15Åbo Akademi Univ - Thermal and Flow Engineering Piispankatu 8, 20500 Turku 24/82
Mixing heat, h,ξ diagram /3
Construction of condensation line from boiling line, heat of vaporisation and heat of mixing
For point P, which demixes into liquid F and gas D, the relative amounts are G/L = FP / PD (lever rule) Pics: B01
Schematic h,ξ diagram:- Condensation line c- Boiling line b- Isotherms i
qmix
liquidgas
c
b
i
i
28 jan 15Åbo Akademi Univ - Thermal and Flow Engineering Piispankatu 8, 20500 Turku 25/82
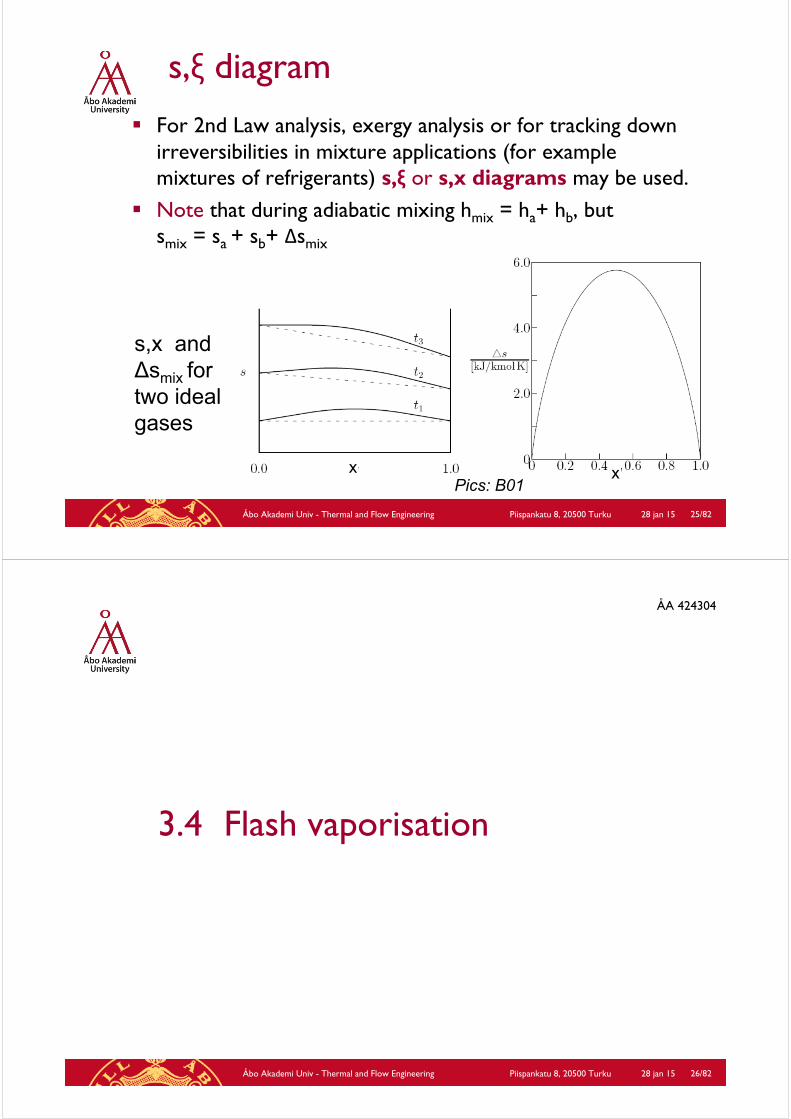
s,ξ diagram
For 2nd Law analysis, exergy analysis or for tracking downirreversibilities in mixture applications (for examplemixtures of refrigerants) s,ξ or s,x diagrams may be used.
Note that during adiabatic mixing hmix = ha+ hb, butsmix = sa + sb+ Δsmix
x
s,x andΔsmix for two ideal gases
xPics: B01
ÅA 424304
28 jan 15Åbo Akademi Univ - Thermal and Flow Engineering Piispankatu 8, 20500 Turku 26/82
3.4 Flash vaporisation

28 jan 15Åbo Akademi Univ - Thermal and Flow Engineering Piispankatu 8, 20500 Turku 27/82
Flash vaporisation, h,x diagram /1 Consider a flash vaporisation process, in which a binary
liquid at temperature T0, pressure p0 is brought to a lower pressure p1 using a throttling valve. Temperature drops to T1. Part of the liquid vaporises, giving a vapour that is more rich in the more volatile component.
Mass balance: F = G + L Mass balance volatile
component: xF·F = y·G + x· L
Heat balance: hF· F = hG· G + hL· L, with heat of vaporisation Δvaph = hG - hL at T0.
Pic: Z87
28 jan 15 Åbo Akademi Univ - Thermal and Flow Engineering Piispankatu 8, 20500 Turku
28/82
Flash vaporisation, h,x diagram /2
Initially, at p0 the feedpoint A with x = xF is in the liquid region of the h,x diagram
After the pressure reduction to p1, point A lies in the 2-phase region, giving liquid (L) C + gas (G) B
Amount ratio G/L equals = CA /AB, or
Pic: Z87FG
LF
F
F
hhhh
xyxx
LG
L
G
28 jan 15Åbo Akademi Univ - Thermal and Flow Engineering Piispankatu 8, 20500 Turku 29/82
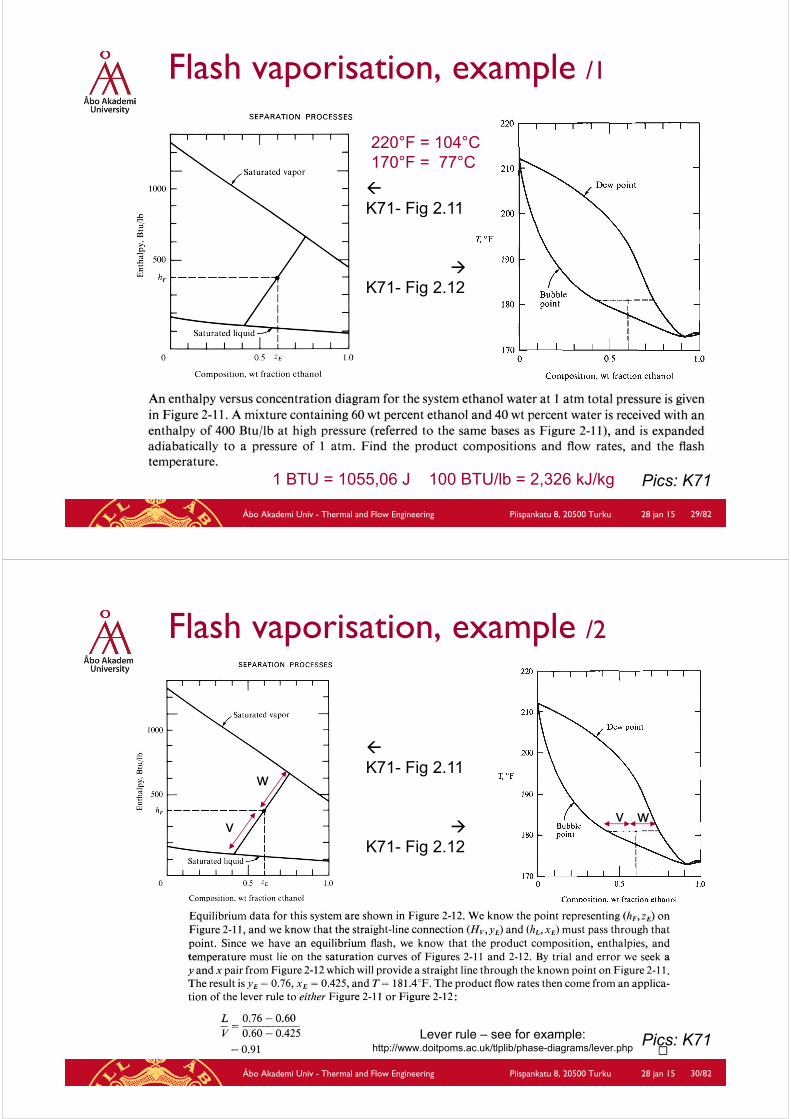
Flash vaporisation, example /1
K71- Fig 2.11
K71- Fig 2.12
Pics: K711 BTU = 1055,06 J 100 BTU/lb = 2,326 kJ/kg
220°F = 104°C170°F = 77°C
28 jan 15Åbo Akademi Univ - Thermal and Flow Engineering Piispankatu 8, 20500 Turku 30/82
K71- Fig 2.11
K71- Fig 2.12
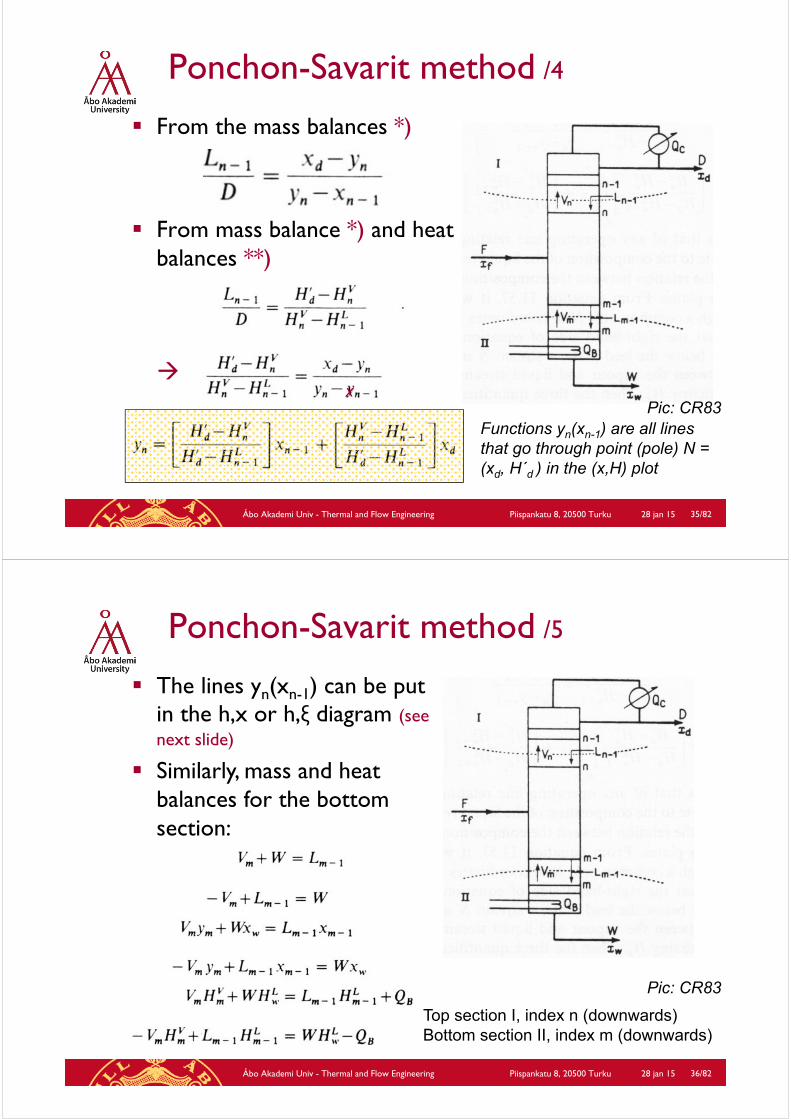
Flash vaporisation, example /2
Pics: K71
v
w
v w
Lever rule – see for example:http://www.doitpoms.ac.uk/tlplib/phase-diagrams/lever.php

ÅA 424304
28 jan 15Åbo Akademi Univ - Thermal and Flow Engineering Piispankatu 8, 20500 Turku 31/82
3.5 Binary Distillation II (the Ponchon-Savarit method)
28 jan 15Åbo Akademi Univ - Thermal and Flow Engineering Piispankatu 8, 20500 Turku 32/82
Ponchon-Savarit method /1
Continuous distillation Feed F(kg/s), xf (kg/kg) Top product D, xd
Bottom product W, xw
Upward vapour flows V (kg/s), downward liquidflows L (kg/s)
Liquid mass fractions x, vapour mass fractions y
Reboiler heat input QB(kW), condenser heat output QC (kW)
Top section I, index n (downwards)Bottom section II, index m (downwards)
Pic: CR83

28 jan 15Åbo Akademi Univ - Thermal and Flow Engineering Piispankatu 8, 20500 Turku 33/82
Ponchon-Savarit method /2
HL and HV are enthalpies of liquid and vapour streams(kJ/kg)
Mass balances top sectionstages (total, and for the mostvolatile species of the two)
*) Pic: CR83
28 jan 15Åbo Akademi Univ - Thermal and Flow Engineering Piispankatu 8, 20500 Turku 34/82
Ponchon-Savarit method /3
Heat balances (top section)
HLd = H of liquid D (x = xd)
Constant H´d = HLd + QC/D:
**)Pic: CR83
”leaving” system via top:D·HL
d + QC
28 jan 15Åbo Akademi Univ - Thermal and Flow Engineering Piispankatu 8, 20500 Turku 35/82
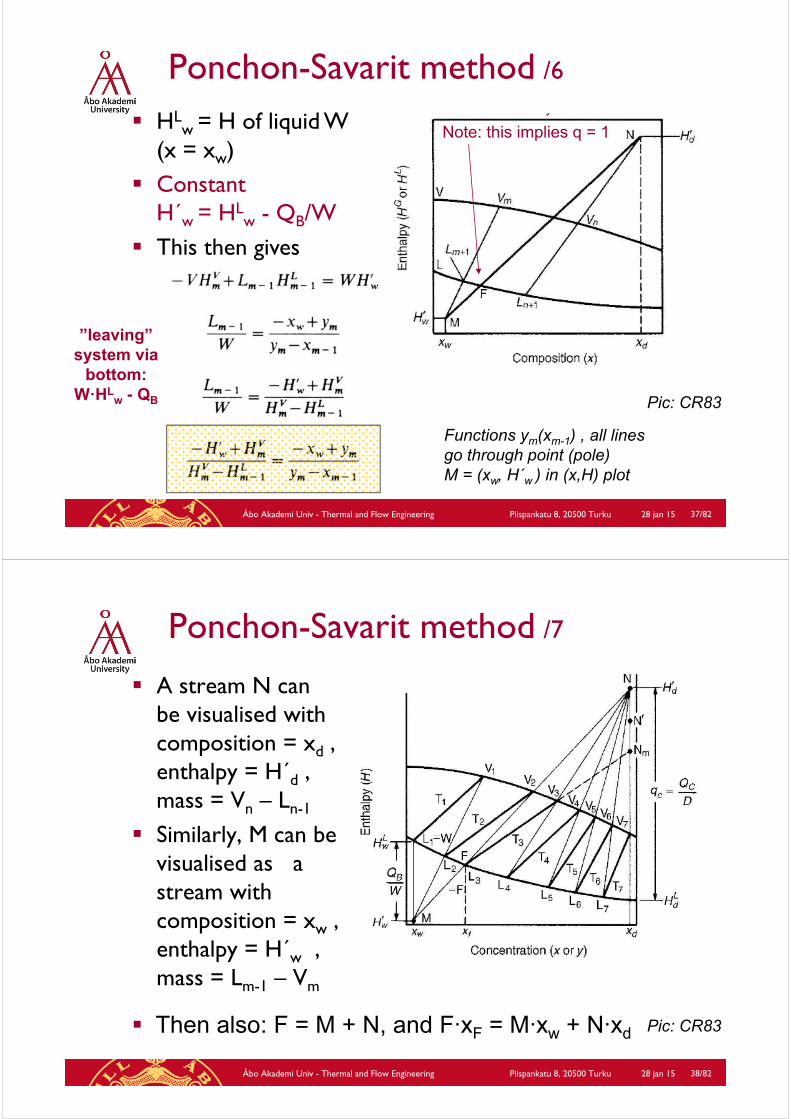
From the mass balances *)
From mass balance *) and heat balances **)
Ponchon-Savarit method /4
Functions yn(xn-1) are all linesthat go through point (pole) N = (xd, H´d ) in the (x,H) plot
Pic: CR83x
28 jan 15Åbo Akademi Univ - Thermal and Flow Engineering Piispankatu 8, 20500 Turku 36/82
Ponchon-Savarit method /5
The lines yn(xn-1) can be putin the h,x or h,ξ diagram (seenext slide)
Similarly, mass and heat balances for the bottom section:
Top section I, index n (downwards)Bottom section II, index m (downwards)
Pic: CR83
28 jan 15Åbo Akademi Univ - Thermal and Flow Engineering Piispankatu 8, 20500 Turku 37/82
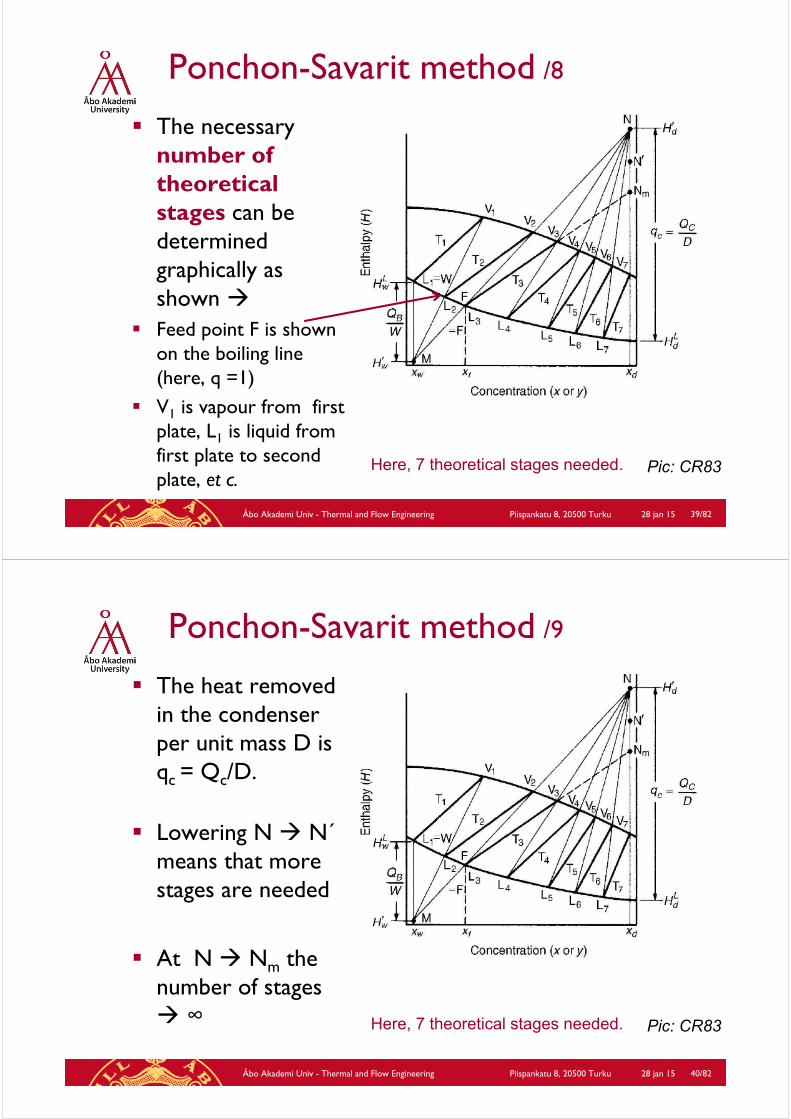
Ponchon-Savarit method /6
Functions ym(xm-1) , all linesgo through point (pole) M = (xw, H´w ) in (x,H) plot
HLw = H of liquid W
(x = xw) Constant
H´w = HLw - QB/W
This then gives
Pic: CR83
Note: this implies q = 1
”leaving” system via
bottom:W·HL
w - QB
28 jan 15Åbo Akademi Univ - Thermal and Flow Engineering Piispankatu 8, 20500 Turku 38/82
Ponchon-Savarit method /7
A stream N canbe visualised with composition = xd , enthalpy = H´d , mass = Vn – Ln-1
Similarly, M can be visualised as a stream with composition = xw , enthalpy = H´w , mass = Lm-1 – Vm
Pic: CR83 Then also: F = M + N, and F∙xF = M∙xw + N∙xd
28 jan 15Åbo Akademi Univ - Thermal and Flow Engineering Piispankatu 8, 20500 Turku 39/82
Ponchon-Savarit method /8
The necessarynumber of theoreticalstages can be determinedgraphically as shown
Feed point F is shownon the boiling line(here, q =1)
V1 is vapour from first plate, L1 is liquid from first plate to second plate, et c.
Pic: CR83Here, 7 theoretical stages needed.
28 jan 15Åbo Akademi Univ - Thermal and Flow Engineering Piispankatu 8, 20500 Turku 40/82
Ponchon-Savarit method /9
The heat removedin the condenserper unit mass D is qc = Qc/D.
Lowering N N´means that morestages are needed
At N Nm the number of stages ∞ Pic: CR83Here, 7 theoretical stages needed.
28 jan 15Åbo Akademi Univ - Thermal and Flow Engineering Piispankatu 8, 20500 Turku 41/82
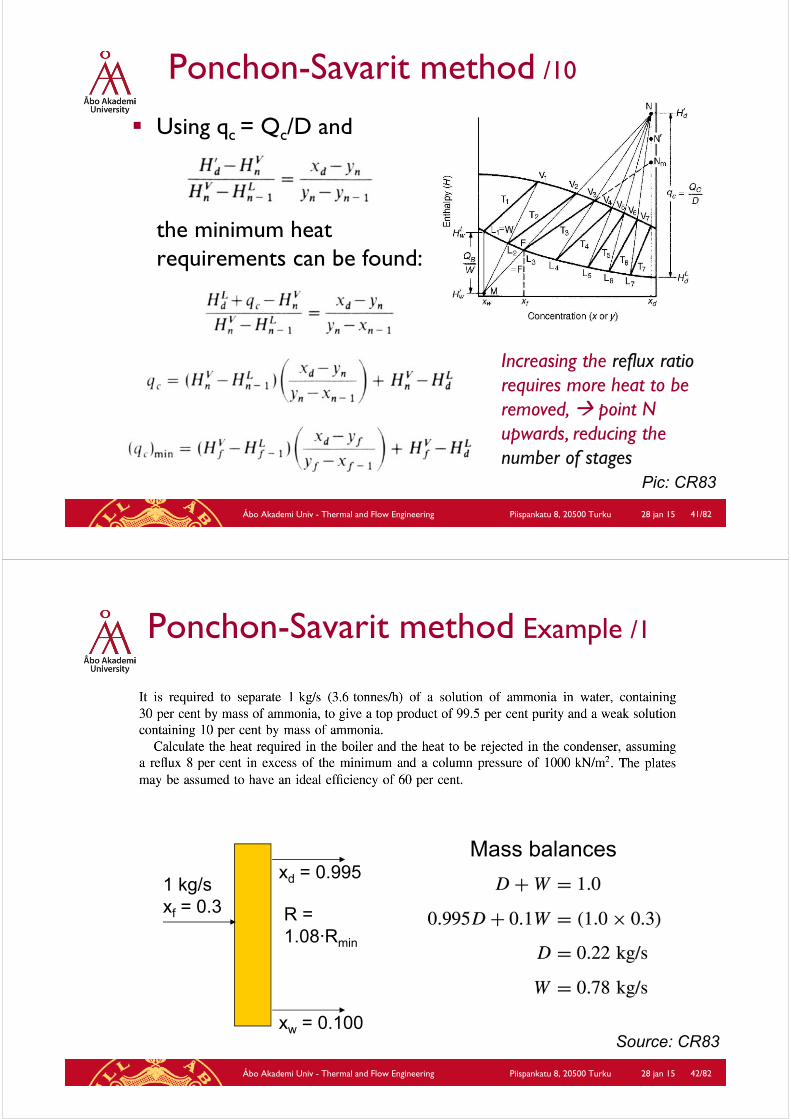
Using qc = Qc/D and
the minimum heat requirements can be found:
Pic: CR83
Increasing the reflux ratiorequires more heat to be removed, point N upwards, reducing the number of stages
Ponchon-Savarit method /10
28 jan 15Åbo Akademi Univ - Thermal and Flow Engineering Piispankatu 8, 20500 Turku 42/82
Ponchon-Savarit method Example /1
1 kg/sxf = 0.3
xd = 0.995
xw = 0.100
R = 1.08∙Rmin
Mass balances
Source: CR83

28 jan 15Åbo Akademi Univ - Thermal and Flow Engineering Piispankatu 8, 20500 Turku 43/82
Ponchon-Savarit methodExample /2
h, ξ diagramNH3-H2O1.013 MPa = 10 atm
Source: CR83
28 jan 15Åbo Akademi Univ - Thermal and Flow Engineering Piispankatu 8, 20500 Turku 44/82
Ponchon-Savarit method Example /3
Source: CR83

ÅA 424304
28 jan 15Åbo Akademi Univ - Thermal and Flow Engineering Piispankatu 8, 20500 Turku 45/82
3.6 Ideal distillation column analysis
28 jan 15 Åbo Akademi Univ - Thermal and Flow Engineering Piispankatu 8, 20500 Turku
46/82
Analysis of ideal column /1
Exergy analysis shows that the minimum work for separation of 1 mol of mixture equalswmin = Δex = T°·Δs
For distillation with reboiler heat Qin and condenser heat Qout, the exergy loss –ΔEx can be approximated as
(if HF ≈ HB + HD !)Pic: SAKS04
bottomtop
oin TT
TQEx11
Thus, the separation is accomplished by degrading Qin at Tin
to Qout (= Qin) at Tout < Tin
28 jan 15 Åbo Akademi Univ - Thermal and Flow Engineering Piispankatu 8, 20500 Turku
47/82
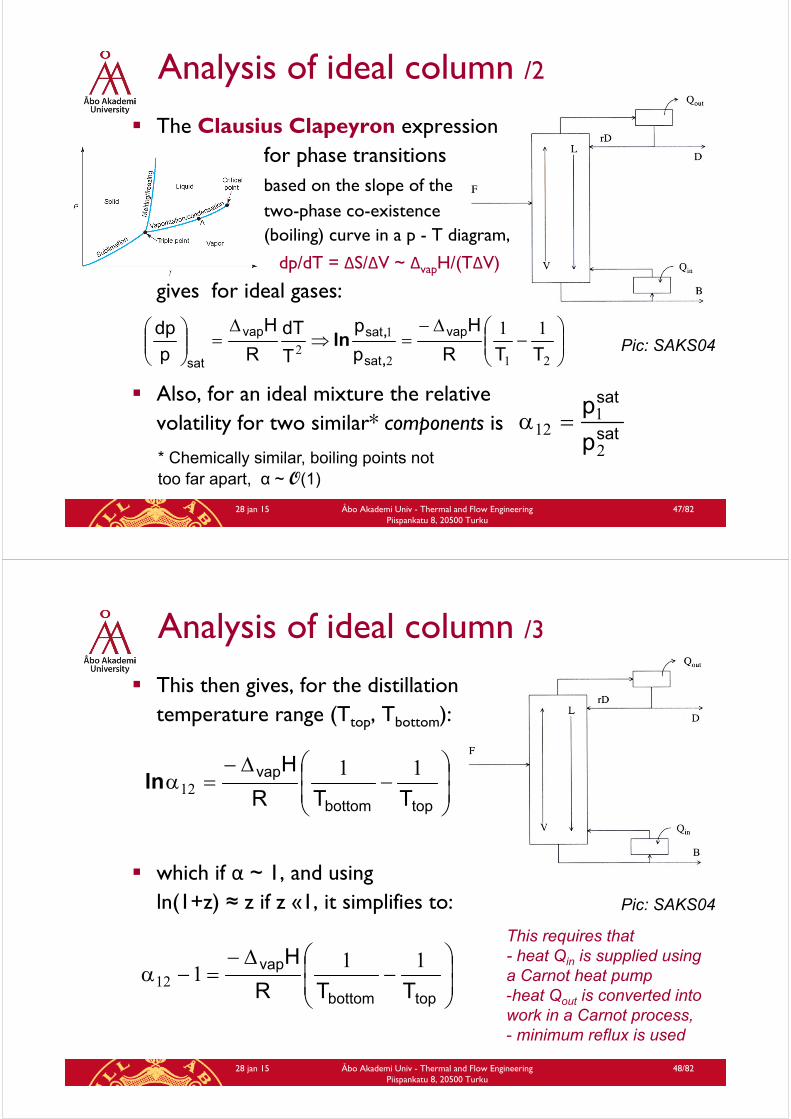
Analysis of ideal column /2
The Clausius Clapeyron expression for phase transitionsbased on the slope of the two-phase co-existence(boiling) curve in a p - T diagram,
dp/dT = ΔS/ΔV ~ ΔvapH/(TΔV)
gives for ideal gases:
Also, for an ideal mixture the relative volatility for two similar* components is
sat
sat
p
p
2
112
Pic: SAKS04
212
12
11
TTR
H
p
p
T
dT
R
H
p
dp vap
sat
satvap
sat ,
,ln
* Chemically similar, boiling points not too far apart, α ~ O(1)
28 jan 15 Åbo Akademi Univ - Thermal and Flow Engineering Piispankatu 8, 20500 Turku
48/82
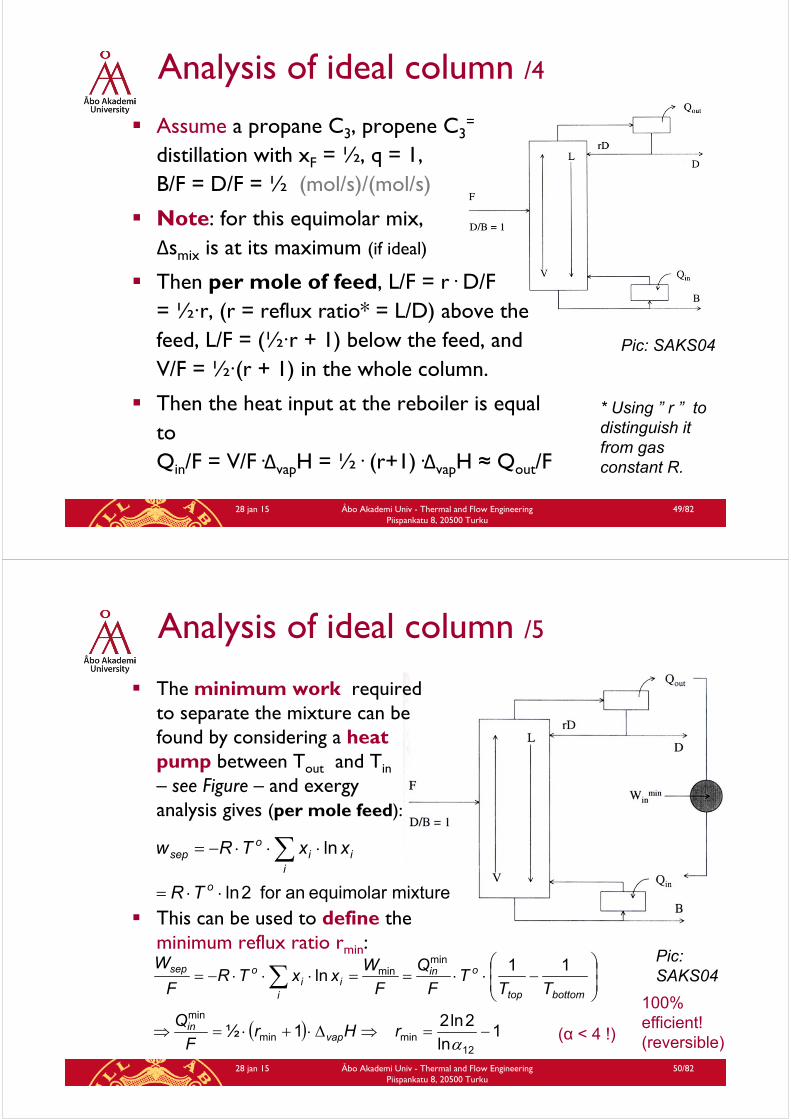
Analysis of ideal column /3
This then gives, for the distillationtemperature range (Ttop, Tbottom):
which if α ~ 1, and usingln(1+z) ≈ z if z «1, it simplifies to: Pic: SAKS04
topbottom
vap
TTR
H 1112ln
topbottom
vap
TTR
H 11112
This requires that- heat Qin is supplied usinga Carnot heat pump -heat Qout is converted intowork in a Carnot process, - minimum reflux is used
28 jan 15 Åbo Akademi Univ - Thermal and Flow Engineering Piispankatu 8, 20500 Turku
49/82
Analysis of ideal column /4
Assume a propane C3, propene C3=
distillation with xF = ½, q = 1, B/F = D/F = ½ (mol/s)/(mol/s)
Note: for this equimolar mix, Δsmix is at its maximum (if ideal)
Then per mole of feed, L/F = r· D/F = ½·r, (r = reflux ratio* = L/D) above the feed, L/F = (½·r + 1) below the feed, and V/F = ½·(r + 1) in the whole column.
Then the heat input at the reboiler is equalto Qin/F = V/F·ΔvapH = ½· (r+1)·ΔvapH ≈ Qout/F
Pic: SAKS04
* Using ” r ” to distinguish it from gas constant R.
28 jan 15 Åbo Akademi Univ - Thermal and Flow Engineering Piispankatu 8, 20500 Turku
50/82
Analysis of ideal column /5
The minimum work requiredto separate the mixture can be found by considering a heat pump between Tout and Tin– see Figure – and exergyanalysis gives (per mole feed):
This can be used to define the minimum reflux ratio rmin:
1ln
2ln2 1½
11ln
12minmin
min
minmin
rHr
F
Q
TTT
F
Q
F
WxxTR
F
W
vapin
bottomtop
oin
iii
osep
mixture equimolar an for 2ln
ln
o
iii
osep
TR
xxTRw
100% efficient!(reversible)
Pic: SAKS04
(α < 4 !)

ÅA 424304
28 jan 15Åbo Akademi Univ - Thermal and Flow Engineering Piispankatu 8, 20500 Turku 51/82
3.7 Real distillation column analysis I: efficiency
28 jan 15Åbo Akademi Univ - Thermal and Flow Engineering Piispankatu 8, 20500 Turku 52/82
Analysis of real column /1
What will be the efficiency of a real column for this case?
Heat transfer requirestemperature differences!
Qin is supplied at 377K, Qout goes out at 298K
The minimum heat input for the separation is
Qminin / F = ½·(rmin+1)·ΔvapH with
rmin = 9.64 (α12 ≈ 1.14), per mole feed
Deviations from ideal thermo-dynamics rreal = 15.9 (α12 ≈ 1.09)
Qrealin / F = ½ ·(rreal+1) · ΔvapH
rreal/rmin = 1.65 Pic: SAKS04

28 jan 15Åbo Akademi Univ - Thermal and Flow Engineering Piispankatu 8, 20500 Turku 53/82
Analysis of real column /2
Bottom section ΔT = 46 K, top section ΔT = 22 K
The total thermodyn. eff. of the column is calculated as:
which gives ηoverall = 0.093 = 9.3%
The main sources of the inefficiency are the driving forcesΔ(1/T) in reboiler and condenser
The ratio Qinmin/Qin
real = 0.63 reflectsexergy losses inside the column
Pic: SAKS04
1
1
real
min
r
r
28 jan 15Åbo Akademi Univ - Thermal and Flow Engineering Piispankatu 8, 20500 Turku 54/82
Analysis of real column /3
The amount of exergy (work) lost in the column + the exergy used for the separation = the difference between the exergies of the reboiler heat and the condenser heat
For the minimum work (exergy) needed it was shown that
so that the work (exergy) lostin the column is equal to
see Table on next slide
Pic: SAKS04
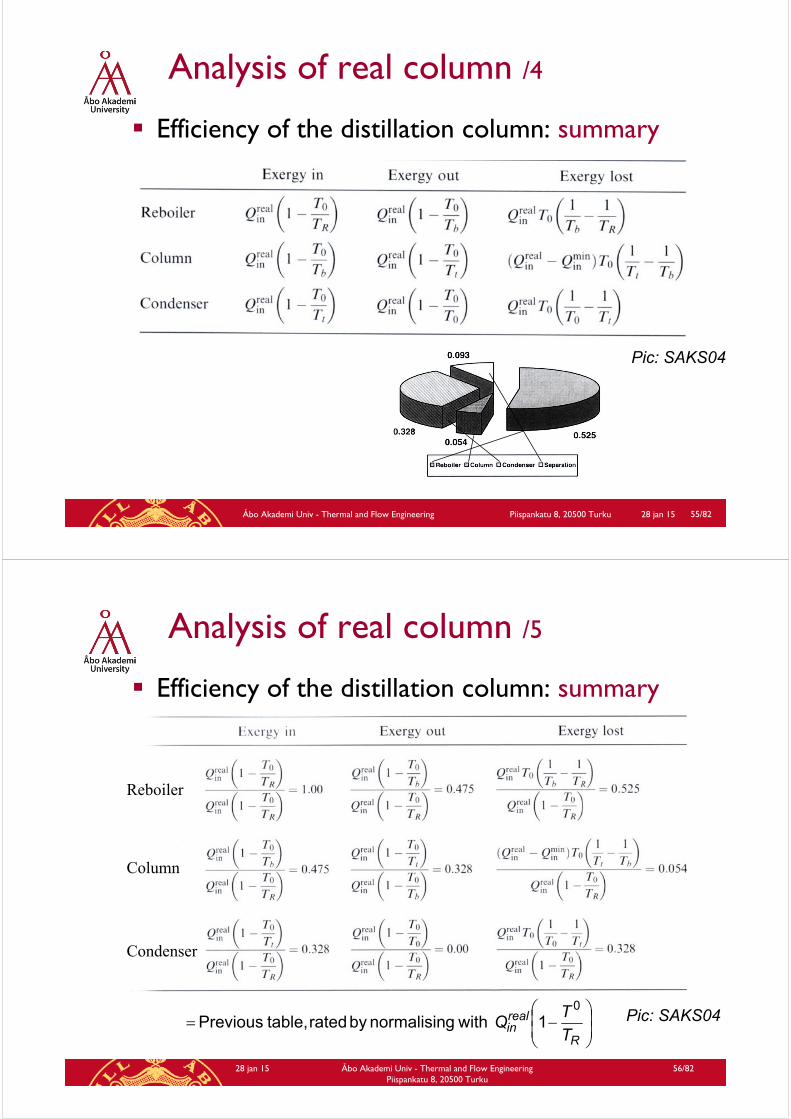
28 jan 15Åbo Akademi Univ - Thermal and Flow Engineering Piispankatu 8, 20500 Turku 55/82
Analysis of real column /4
Efficiency of the distillation column: summary
Pic: SAKS04
28 jan 15 Åbo Akademi Univ - Thermal and Flow Engineering Piispankatu 8, 20500 Turku
56/82
Analysis of real column /5
R
realin T
TQ
0
1 withgnormalisin by rated table, Previous
Efficiency of the distillation column: summary
Pic: SAKS04
Reboiler
Column
Condenser
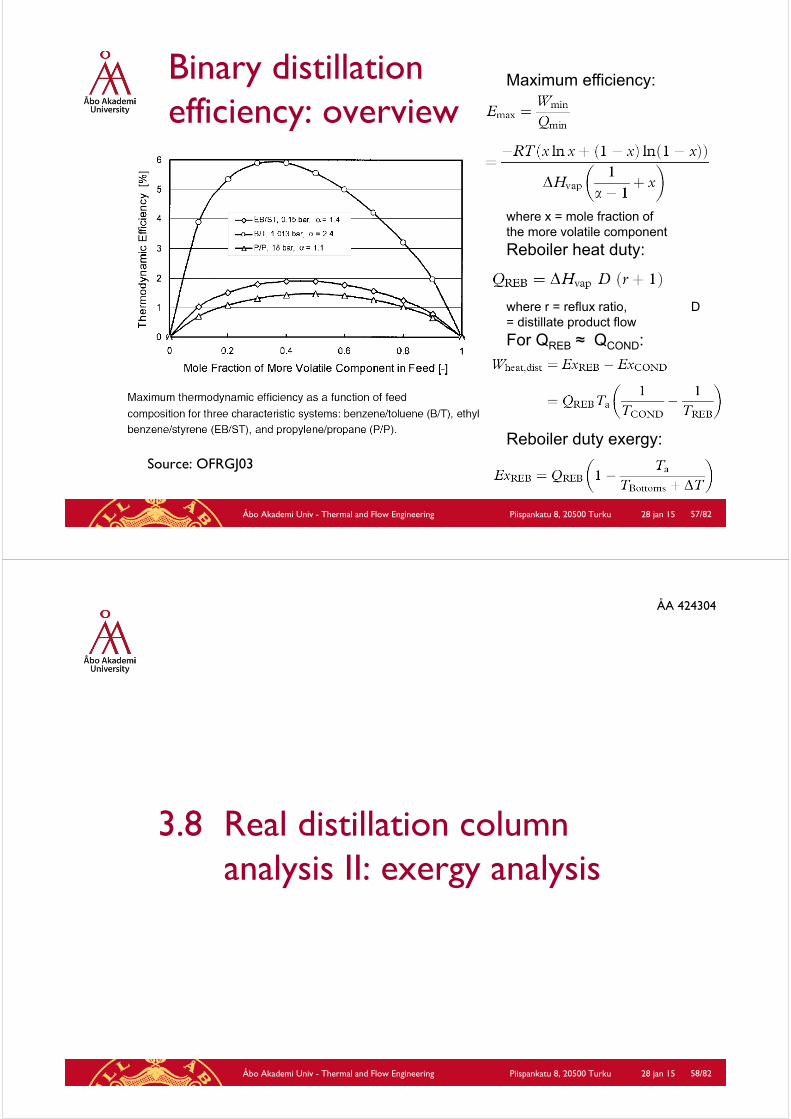
Binary distillationefficiency: overview
Source: OFRGJ03
28 jan 15Åbo Akademi Univ - Thermal and Flow Engineering Piispankatu 8, 20500 Turku 57/82
Maximum efficiency:
where x = mole fraction ofthe more volatile component
Reboiler heat duty:
where r = reflux ratio, D = distillate product flow
For QREB ≈ QCOND:
Reboiler duty exergy:
ÅA 424304
28 jan 15Åbo Akademi Univ - Thermal and Flow Engineering Piispankatu 8, 20500 Turku 58/82
3.8 Real distillation column analysis II: exergy analysis
28 jan 15Åbo Akademi Univ - Thermal and Flow Engineering Piispankatu 8, 20500 Turku 59/82
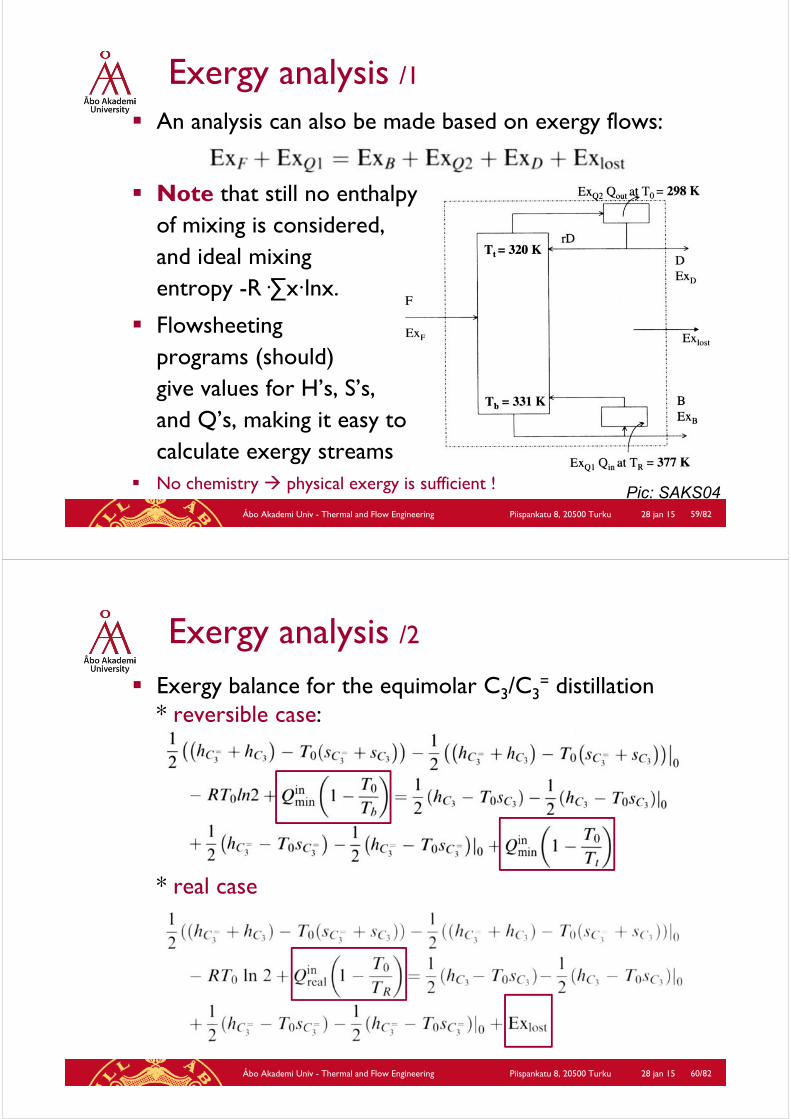
Exergy analysis /1
An analysis can also be made based on exergy flows:
Note that still no enthalpyof mixing is considered, and ideal mixingentropy -R·∑x·lnx.
Flowsheetingprograms (should) give values for H’s, S’s, and Q’s, making it easy to calculate exergy streams
No chemistry physical exergy is sufficient ! Pic: SAKS04
28 jan 15Åbo Akademi Univ - Thermal and Flow Engineering Piispankatu 8, 20500 Turku 60/82
Exergy analysis /2
Exergy balance for the equimolar C3/C3= distillation
* reversible case:
* real case

28 jan 15Åbo Akademi Univ - Thermal and Flow Engineering Piispankatu 8, 20500 Turku 61/82
Exergy analysis /3
Exergy streams for ideal and real case: summary
= 0
28 jan 15Åbo Akademi Univ - Thermal and Flow Engineering Piispankatu 8, 20500 Turku 62/82
Exergy analysis /4
The main difference between ideal and real performances are Ex(Q1) and Ex(Q2); note that Ex(Q2) = 0 in the real case.
The difference between the two cases as given on the previous two slides is
or, normalised per unit input exergy:
(gives again value 0.907 efficiency 0.093)Pic: SAKS04
+
28 jan 15Åbo Akademi Univ - Thermal and Flow Engineering Piispankatu 8, 20500 Turku 63/82
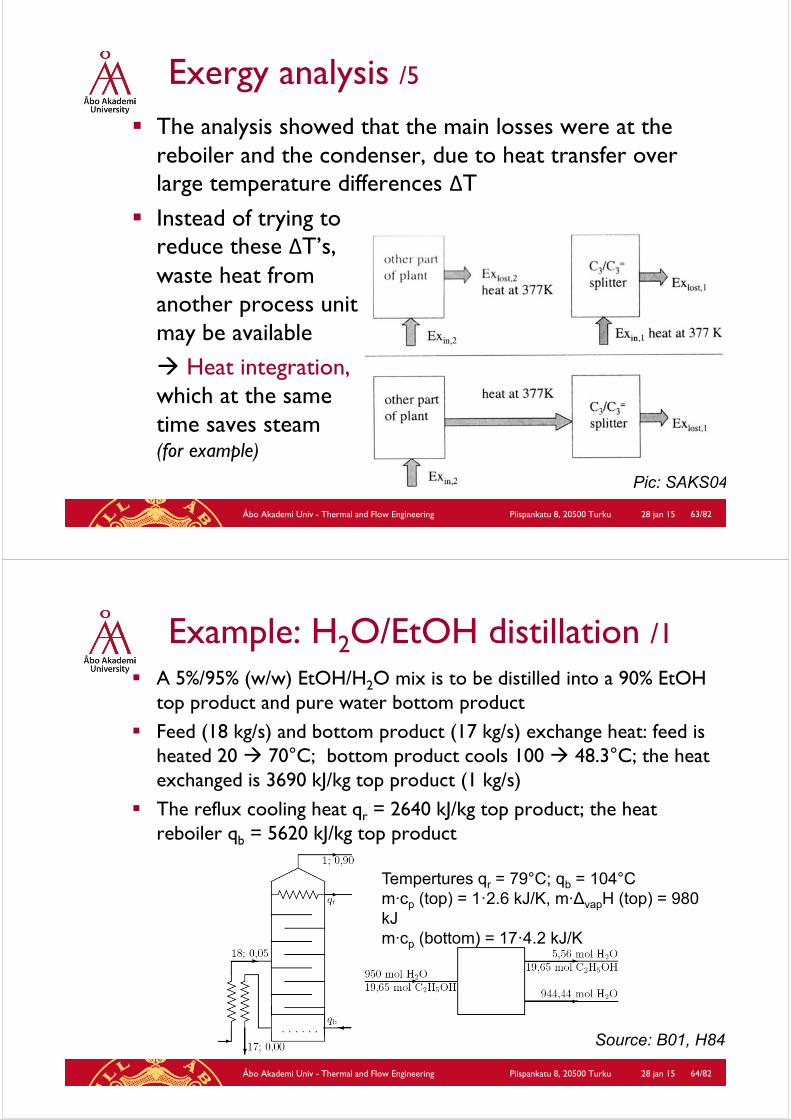
Exergy analysis /5 The analysis showed that the main losses were at the
reboiler and the condenser, due to heat transfer over large temperature differences ΔT
Instead of trying to reduce these ΔT’s, waste heat from another process unitmay be available Heat integration, which at the same time saves steam(for example)
Pic: SAKS04
28 jan 15Åbo Akademi Univ - Thermal and Flow Engineering Piispankatu 8, 20500 Turku 64/82
Example: H2O/EtOH distillation /1 A 5%/95% (w/w) EtOH/H2O mix is to be distilled into a 90% EtOH
top product and pure water bottom product Feed (18 kg/s) and bottom product (17 kg/s) exchange heat: feed is
heated 20 70°C; bottom product cools 100 48.3°C; the heat exchanged is 3690 kJ/kg top product (1 kg/s)
The reflux cooling heat qr = 2640 kJ/kg top product; the heat reboiler qb = 5620 kJ/kg top product
Tempertures qr = 79°C; qb = 104°Cm∙cp (top) = 1·2.6 kJ/K, m∙ΔvapH (top) = 980 kJm∙cp (bottom) = 17·4.2 kJ/K
Source: B01, H84
28 jan 15Åbo Akademi Univ - Thermal and Flow Engineering Piispankatu 8, 20500 Turku 65/82
Example: H2O/EtOH distillation /2
The minimum work needed for making a 90% EtOH mix from a 5% EtOH mix: see the mass balance in moles.
The mole fractions for water are 0.9798 for the feed, 0.2212 for the distillate and 1.00 for the bottom product; this then gives with the molar amounts as indicated:
for the minimum work per kg top product.
Source: B01, H84See section 1.6 ofExergy analysis
28 jan 15Åbo Akademi Univ - Thermal and Flow Engineering Piispankatu 8, 20500 Turku 66/82
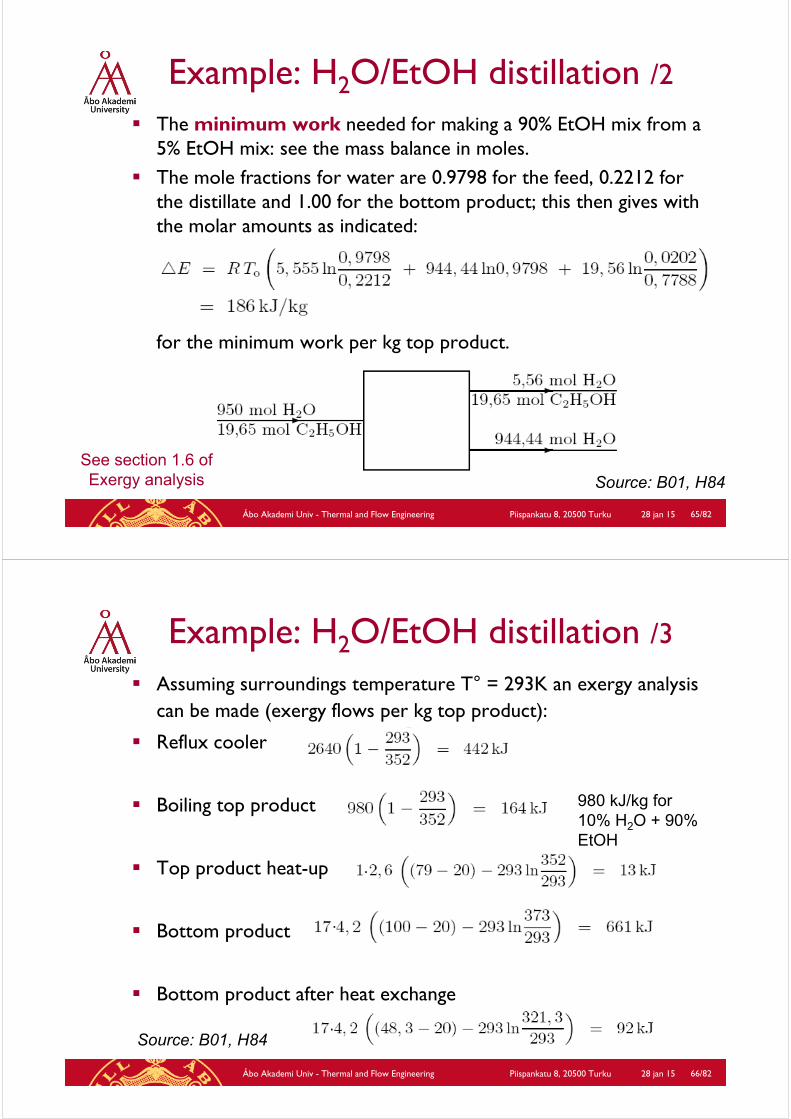
Example: H2O/EtOH distillation /3
Assuming surroundings temperature T° = 293K an exergy analysiscan be made (exergy flows per kg top product):
Reflux cooler
Boiling top product
Top product heat-up
Bottom product
Bottom product after heat exchange
Source: B01, H84
980 kJ/kg for 10% H2O + 90% EtOH
.
.
.
28 jan 15Åbo Akademi Univ - Thermal and Flow Engineering Piispankatu 8, 20500 Turku 67/82
Example: H2O/EtOH distillation /4
Assume that the bottom heat qb is delivered by an ideal (Carnot) heat pump: 5620· (1-293/377) = 1252 kJ/kg top product exergy(Note the difference 5620 1252!)
This goes to the cold bottom product (7%), top product (14%), reflux cooler (35%) and separation work (4%), total 60%.
Thus, 1252 - 896 = 356 kJ is lost as irreversibilities.
For the heat exchanger, the losses per kg top product are
which means that 70 kJ/kg top product is lost in the column itself; which is ~ 40% of the minimum separation work (186 kJ/kg top product.) Source: B01, H84
ÅA 424304
28 jan 15Åbo Akademi Univ - Thermal and Flow Engineering Piispankatu 8, 20500 Turku 68/82
3.9 Distillation + heat pump and other improvements
28 jan 15Åbo Akademi Univ - Thermal and Flow Engineering Piispankatu 8, 20500 Turku 69/82
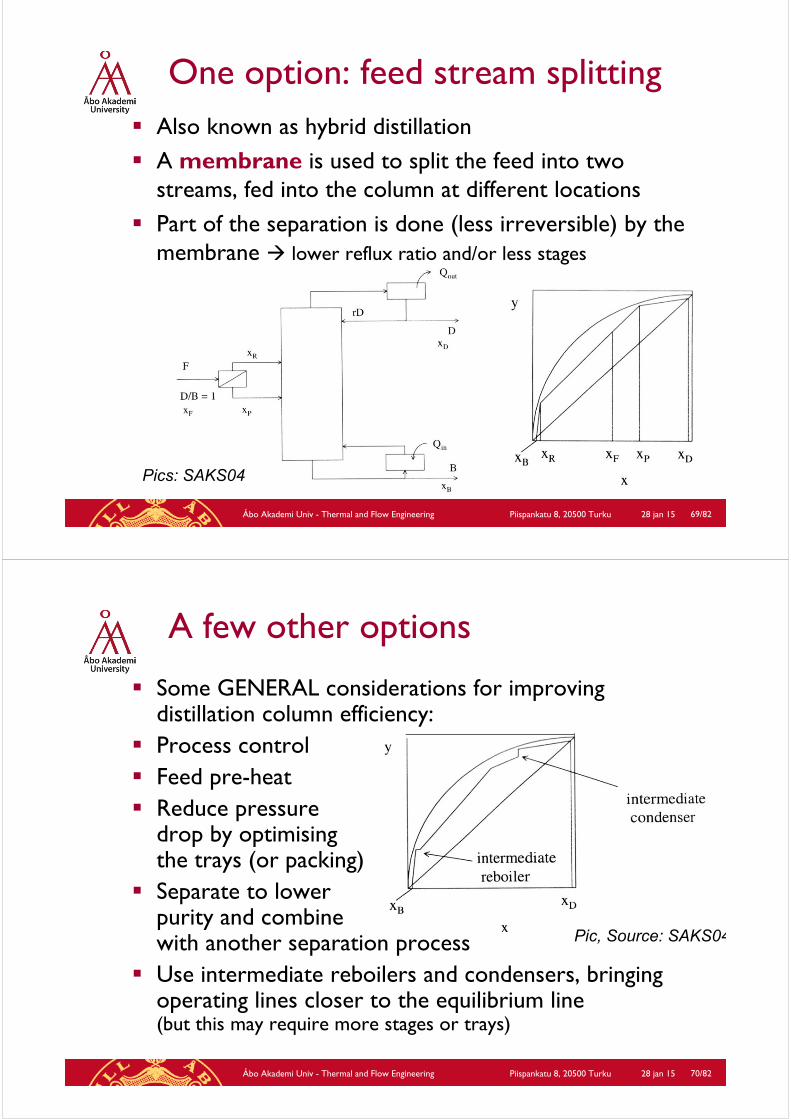
One option: feed stream splitting Also known as hybrid distillation A membrane is used to split the feed into two
streams, fed into the column at different locations Part of the separation is done (less irreversible) by the
membrane lower reflux ratio and/or less stages
Pics: SAKS04
28 jan 15Åbo Akademi Univ - Thermal and Flow Engineering Piispankatu 8, 20500 Turku 70/82
A few other options
Some GENERAL considerations for improvingdistillation column efficiency:
Process control Feed pre-heat Reduce pressure
drop by optimisingthe trays (or packing)
Separate to lowerpurity and combinewith another separation process
Use intermediate reboilers and condensers, bringingoperating lines closer to the equilibrium line(but this may require more stages or trays)
Pic, Source: SAKS04

28 jan 15Åbo Akademi Univ - Thermal and Flow Engineering Piispankatu 8, 20500 Turku 71/82
Double columns Paraffin /olefin separations are very energy intensive. One example is propane / propylene, or C3 (atm. b.p. - 42.1°C)
/ C3= (atm. b.p. - 47.7°C). For a single-column tray column
distillation process 150-200 trays would be needed, giving a veryhigh (> 100 m) column, with refluxcondensing using air or water
A double-column process is preferred, with smaller (shorter)
columns, using hot and coldwater for condensing (column 2) and reboiling (column 1). Note that reboiler for column 2 = condenser for column 1.
Pic, Source: SAKS0
28 jan 15Åbo Akademi Univ - Thermal and Flow Engineering Piispankatu 8, 20500 Turku 72/82
Distillation column + heat pump /1
Source: B01, H84
Improved efficiency can be obtained by using a heat pump: the condenser is removed and the reflux is obtained after heat exchange in the reboiler and with the feed, and throttling
Drawback: complexitycosts...
28 jan 15Åbo Akademi Univ - Thermal and Flow Engineering Piispankatu 8, 20500 Turku 73/82
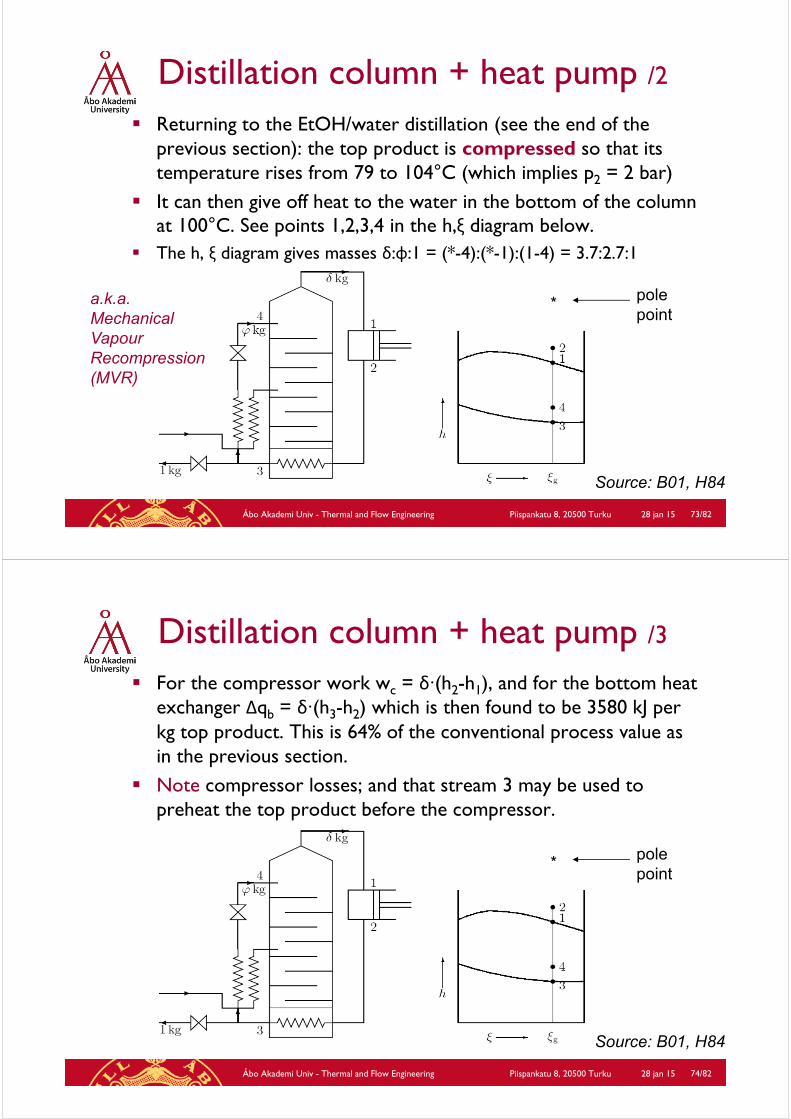
Distillation column + heat pump /2 Returning to the EtOH/water distillation (see the end of the
previous section): the top product is compressed so that itstemperature rises from 79 to 104°C (which implies p2 = 2 bar)
It can then give off heat to the water in the bottom of the columnat 100°C. See points 1,2,3,4 in the h,ξ diagram below.
The h, ξ diagram gives masses δ:φ:1 = (*-4):(*-1):(1-4) = 3.7:2.7:1
Source: B01, H84
* pole point
a.k.a.MechanicalVapourRecompression(MVR)
28 jan 15Åbo Akademi Univ - Thermal and Flow Engineering Piispankatu 8, 20500 Turku 74/82
Distillation column + heat pump /3 For the compressor work wc = δ·(h2-h1), and for the bottom heat
exchanger Δqb = δ·(h3-h2) which is then found to be 3580 kJ per kg top product. This is 64% of the conventional process value as in the previous section.
Note compressor losses; and that stream 3 may be used to preheat the top product before the compressor.
Source: B01, H84
* pole point
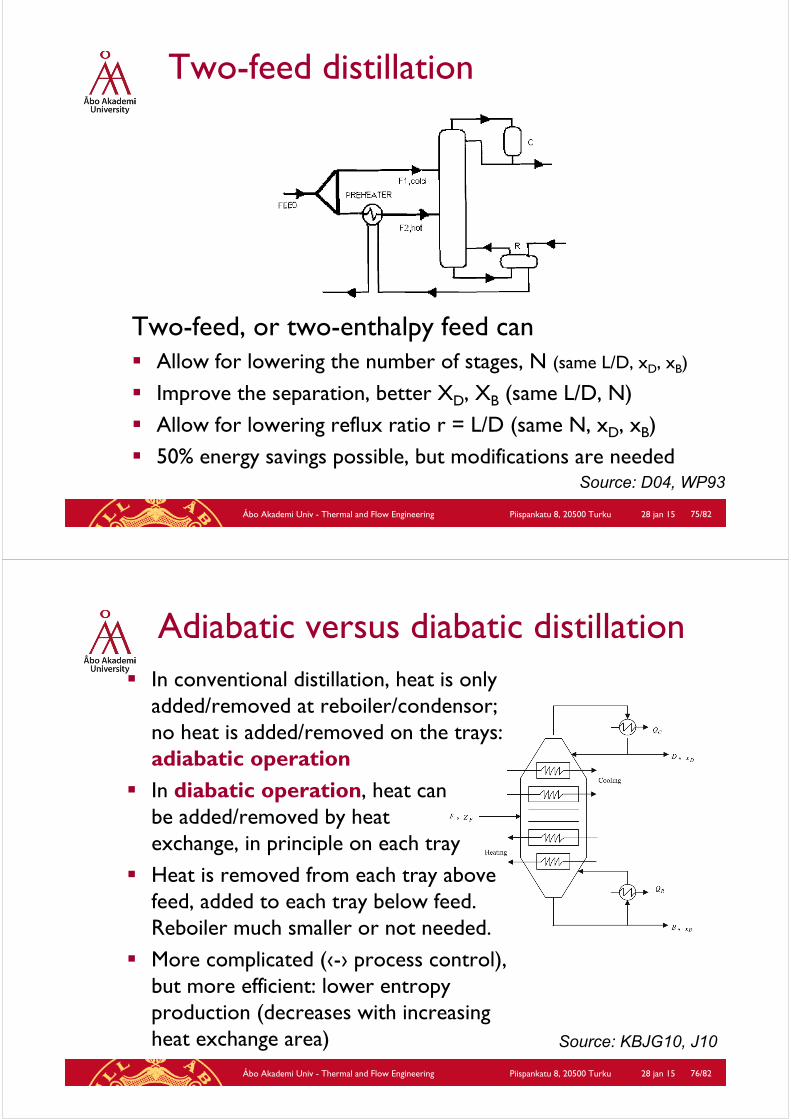
Two-feed distillation
Two-feed, or two-enthalpy feed can Allow for lowering the number of stages, N (same L/D, xD, xB)
Improve the separation, better XD, XB (same L/D, N) Allow for lowering reflux ratio r = L/D (same N, xD, xB) 50% energy savings possible, but modifications are needed
28 jan 15Åbo Akademi Univ - Thermal and Flow Engineering Piispankatu 8, 20500 Turku 75/82
Source: D04, WP93
Adiabatic versus diabatic distillation In conventional distillation, heat is only
added/removed at reboiler/condensor; no heat is added/removed on the trays: adiabatic operation
In diabatic operation, heat canbe added/removed by heat exchange, in principle on each tray
Heat is removed from each tray abovefeed, added to each tray below feed. Reboiler much smaller or not needed.
More complicated (‹-› process control), but more efficient: lower entropyproduction (decreases with increasingheat exchange area)
28 jan 15Åbo Akademi Univ - Thermal and Flow Engineering Piispankatu 8, 20500 Turku 76/82
Source: KBJG10, J10

HIDiC Heat integrated distillation column Rectification (”top”) section is operated at a higher
pressure (= pressure of conventional column) than the stripping (”bottom”) section
Heat is transferred from rectification to stripping sectionComparison for C3 / C3
= splitter
Source: J10, OFRGJ03
28 jan 15Åbo Akademi Univ - Thermal and Flow Engineering Piispankatu 8, 20500 Turku 77/82
Final remarks Distillation accounts for ~3% of world energy consumption Heat integration can give significant energy efficiency
improvements (but increased costs, more process control) Fully diabatic operation of a distillation column won’t be
practically, not all temperature levels will be available Most important are the heat exchanger at the lowest
and highest trays, these can be integrated using for example a heat pump.
Maybe integration with other columns is possible Further improvement can be obtained by
varying column cross sectional area: in a diabatic column rectifier section the vapour flow decreases upwards, in the stripper section it is the opposite
28 jan 15Åbo Akademi Univ - Thermal and Flow Engineering Piispankatu 8, 20500 Turku 78/82
Source: KBJG10, J10
28 jan 15Åbo Akademi Univ - Thermal and Flow Engineering Piispankatu 8, 20500 Turku 79/82
Sources 3 B01: Bart, G.C.J. Advanced thermodynamics (in Dutch) course compendium Delft Univ. of
Technol., Delft (2001) B97: Bejan, A. Advanced engineering thermodynamics John Wiley & Sons (1997) Chapter 3 CRBH83 J.M. Coulson, J.F. Richardson , J.R. Blackhurst, J.H. Harker ”Chemical engineering”,
vol. 2, 3rd ed. Pergamon Press (1983) Chapter 11 D04: Demirel, D. ”Thermodynamic analysis of separation systems” Separation Sci. &
Technol. 39 (16) 3897-3942 (2004) H84: Hoogendoorn, C.J. Advanced thermodynamics (in Dutch) course compendium Delft
Univ. of Technol., Delft (1984) HS92: Humphrey, J.L, Siebert, A.F. ”Separation technologies: an opportunity for energy
savings” Chem Eng Prog 88 (March 1992) 32-41 (1992) J10: Jana, A.K., ”Heat integrated distillation operation” Appl. Energy 87, 1477-1494 (2010) K71 King, C.J. ”Separation processes” McGraw-Hill (1971) KBJG10: Kjelstrup, S., Bedeaux, D., Johanessen, E., Gross, J. ”Non-equilibrium
thermodynamics for engineers”, World Scientific (2010) OFRGJ03: Olujic, Z, Fakhri, F., de Graauw, J., Jansens, P.J. ”Internal heat integration – the
key to an energy conserving distillation column” J. Chem Technol Biotechnol 78, 241-248 (2004)
28 jan 15Åbo Akademi Univ - Thermal and Flow Engineering Piispankatu 8, 20500 Turku 80/82
Sources 3 /cont’d
SAKS04: de Swaan Arons, J., van der Kooi, H., Sankaranarayanan, K. ”Efficiency and sustainability in the efficiency and chemical industries.” Marcel Dekker, New York (NY) 2004
SH06 J.D. Seader, E.J Henley ”Separation process principles” John Wiley, 2nd edition (2006) chapter 17
TK87: Tondeur, D., Kvaalen, E. ”Equipartition of entropy production. An optimalitycriterion for transfer and separation processes” Ind. Eng. Chem. Res. 87 (26) 50-56 (1987)
T68 R.E. Treybal ”Mass transfer operations” McGraw-Hill 2nd edition (1968) WK92 J.A. Wesselingh, H.H. Kleizen ”Separation processes” (in Dutch: Scheidingsprocessen)
Delft University Press (1992) WP93: Wankat, P.C., Kessler, D.P. ”Two-feed distillation: same composition feeds with
different enthalpies” Ind. Eng. Chem. Res. 32, 3061-3067 (1993) Z87 F. Zuiderweg ”Physical separation methods” (in Dutch: Fysische Scheidingsmethoden) TU
Delft (1987) (vol. 1) Z12: Zevenhoven, R. ”Massöverföring & separationsteknik” / ”Mass transfer & separation
technology” course material 424302 (in English !) Åbo Akademi Univ. (2012) Chapter 12 ÖS97 G. Öhman, H. Saxén ”Transportprocesser” (in Swedish) Åbo Akademi Värmeteknik
(1997) 3rd ed., Chapter 3

ÅA 424304
Appendix: h,ξ & x,ydiagram NH3 – H2O6.8 atm
28.1.2015Åbo Akademi Univ - Thermal and Flow Engineering Piispankatu 8, 20500 Turku 81
Sou
rce:
http
://w
ww
.chb
men
g.oh
io-s
tate
.edu
/~ko
ellin
g/52
3/A
ppen
dix_
d17.
100 PSIA = 6.8 atm
1 BTU/lbmole = 2.326 J/mol
ÅA 424304
Appendix: h,ξ diagram n-C6 / n-C8
28.1.2015Åbo Akademi Univ - Thermal and Flow Engineering Piispankatu 8, 20500 Turku 82
n-C6 - n-C8 101.3 kPa
0
10
20
30
40
50
60
70
80
0 0.1 0.2 0.3 0.4 0.5 0.6 0.7 0.8 0.9 1
x,y, -
HL, H
G
kJ
/mo
l
n-C6 - n-C8 101.3 kPa
-30
-20
-10
0
10
20
30
40
50
60
70
80
90
100
110
120
0 0.1 0.2 0.3 0.4 0.5 0.6 0.7 0.8 0.9 1
x,y, -
HL, H
G
kJ
/mo
l
T °C x - HL kJ/mol y - HG kJ/mol68.7 1 12.98 1 41.87
69.35 0.9772 13.22 0.9963 42.0370 0.9546 13.45 0.9923 42.1875 0.8017 15.19 0.9609 43.3980 0.6684 16.94 0.9237 44.785 0.5566 18.65 0.8788 46.1490 0.4566 20.36 0.8235 47.7495 0.3705 22.05 0.7572 49.53
100 0.2917 23.75 0.6756 51.57105 0.2221 25.44 0.5842 53.8110 0.1591 27.13 0.4754 56.33115 0.1035 28.8 0.3525 59.14120 0.0538 30.46 0.2088 62.33
122.9 0.0262 31.43 0.1096 64.46125.8 0 32.39 0 66.78