Embed Size (px)
Citation preview

1
Supplementary Information for:
Thermodynamics of the hybrid interaction of hydrogen with palladium nanoparticles
Ronald Griessen*#, Nikolai Strohfeldt+, and Harald Giessen+
#Faculty of Sciences, Division of Physics and Astronomy, VU University, De Boelelaan 1081, 1081 HV Amsterdam, The Netherlands
+4th Physics Institute and Research Center SCoPE, University of Stuttgart, Pfaffenwaldring 57, 70569 Stuttgart, Germany
*Corresponding author: [email protected]
KEYWORDS: hydrogen, palladium, nanocubes, nanoparticles, enthalpy of formation, entropy of formation,
enthalpy-entropy compensation, hysteresis, hybrid, thermodynamics, incoherent phase transformation,
coherent phase transformation, misfit dislocation, critical size, critical temperature
Thermodynamics of the hybrid interaction ofhydrogen with palladium nanoparticles
SUPPLEMENTARY INFORMATIONDOI: 10.1038/NMAT4480
NATURE MATERIALS | www.nature.com/naturematerials 1
© 2015 Macmillan Publishers Limited. All rights reserved

2
Table of Contents
Table of Contents .......................................................................................................................................... 2
1 Size and temperature ranges of the investigated nanoparticles .......................................................... 3
2 Spurious enthalpy-entropy correlations ............................................................................................... 4
3 Stability of the hysteresis definition in situations with sloping plateaus .............................................. 5
4 Hysteresis scaling law for a lattice gas .................................................................................................. 6
4.1 Lattice gas with linear attractive H-H interaction and blocking factor ......................................... 6
4.2 Lattice gas with non-linear effective H-H interaction ................................................................... 8
5 Spinodal hysteresis and non-linearity of Van ‘t Hoff plots .................................................................. 10
5.1 Non-linearity of Van ‘t Hoff plots of spinodal pressures ............................................................. 10
5.2 Determination of Tc with data collapse ....................................................................................... 11
6 Critical temperature ............................................................................................................................ 14
7 Robustness of the scaling law ............................................................................................................. 16
8 Quantitative mean-field model of the pressure-composition isotherms of bulk PdHx ...................... 17
9 Mean-field model for H in Pd nanoparticles ....................................................................................... 19
9.1 Size dependent input parameters ............................................................................................... 19
9.2 Elastic coupling between surface-shell and inner part of the nanoparticle ............................... 20
9.3 Pressure-composition isotherms ................................................................................................. 25
10 Fitting of the mean-field model to existing experimental data ...................................................... 26
10.1 Pressure-composition isotherms of nanocubes .......................................................................... 27
10.2 Plateau pressures of nanocubes at 246 K ................................................................................... 29
11 Local versus non-local model .......................................................................................................... 30
12 Pressure-composition isotherms of very small Pd clusters ............................................................. 31
13 Scenarios for hydrogen absorption-desorption cycles .................................................................... 32
13.1 Scenario I: Fully coherent absorption-desorption cycle .............................................................. 32
13.2 Scenario II: Incoherent abs.-des. cycle without misfit dislocation generation in the core ......... 34
13.3 Scenario III: Absorption-desorption cycle with misfit dislocation generation in the core .......... 35
14 Metal-organic framework coated Pd nanocubes ............................................................................ 39
15 Pressure-composition isotherms predicted by the Baldi et al. model ............................................ 40
References ................................................................................................................................................... 42
© 2015 Macmillan Publishers Limited. All rights reserved

3
1 Size and temperature ranges of the investigated
nanoparticles
Measurements on hydrogen in nanosized particles are intrinsically difficult. For standard volumetric or
gravimetric pressure-composition isotherms, large numbers of nanoparticles are required and the data
suffer from ensemble averaging effects. Less material is needed for optical measurements based on
luminescence (Bardhan et al.1) or plasmonics (Wadell2, Wadell et al.,3 Syrenova et al.4). Whenever laser
light is used heating effects may influence the measurements. For single nanocube measurements with
Electron Energy Loss Spectroscopy (EELS) there are severe technical constraints as the pressure in the
microscope must be kept below 1 mbar. In order to nevertheless be able to load Pd up to the -PdHx phase
one needs to work at sufficiently low temperatures. This follows directly from the isotherms in Fig. 5a of
the Main Text (MT) and is the reason why all the Baldi et al.5 data are taken at 246 K. These experimental
constraints lead to the patchy distribution in Supplementary Fig. 1 of size and temperature ranges of the
experimental data published so far.
Supplementary Figure 1. Size and temperature ranges of work published so far on hydrogen absorption in nanoparticles. The references are Yamauchi et al.,6 Züttel et al.,7 Sachs et al.,8 Wadell et
al.,3 Bardhan et al.,1 Baldi et al.,5 Wadell,2 Syrenova et al.,4 and Manchester.9 Note that Syrenova et al.4 measured only absorption isotherms except at 333 K where both hydrogen absorption and desorption were measured.
© 2015 Macmillan Publishers Limited. All rights reserved

4
2 Spurious enthalpy-entropy correlations
The enthalpy H and entropy S are determined by plotting plateau pressures at fixed concentration as
a function of the inverse absolute temperature. Bardhan et al.’s1 data do not have flat plateaus and the
hydrogen concentration is not measured absolutely. In addition there are non-closing hysteresis loops and
some of the isotherms are crossing. Consequently it is not easy to determine accurate values of pressure
at a constant concentration for various temperatures. This leads to statistical errors in Van ‘t Hoff plots
which translate into correlated errors in H and S . By correlated we mean that a decrease in slope
(which is proportional to H ) leads automatically to a decrease in the intercept at 1 0T (which is
proportional to S ). A direct implication is that the H and S correlation shown in Fig. 2 of the MT is
an indication that most of the variations in H and S are of statistical origin. As mentioned in the MT,
the fact that for essentially the same 65 nm nanocubes the data points of Wadell2 and Bardhan et al.1 are
laying far apart, but on the same line, is a clear indication that most of the discrepancy is of statistical
origin.
Supplementary Figure 2. Comparison of H S correlation calculated with our mean-field model (see Supplementary Sections 8 and 9) for the lower spinodal pressures (pls, black-blue squares), the upper spinodal pressures (pus, red-yellow squares) and the midpressures (pmid, violet-red squares) for nanocubes in the range 15 to 10000 nm with the experimental data of Fig. 2 of the MT. The numbers indicate the size of the calculated nanocubes. The symbols for the experimental data are the same as in Fig. 2 of the MT. Their labeling is omitted for clarity. The compensation temperatures for the calculated cubes are 722 K for desorption and 607 K for absorption.
© 2015 Macmillan Publishers Limited. All rights reserved

5
To quantitatively substantiate this conclusion we compare in Supplementary Fig. 2 enthalpies H and
entropies S determined from the Van ‘t Hoff plots calculated with our mean-field model (described in
the MT and in Supplementary Sections 8 and 9) for nanocubes of various sizes with experimental data.
There is indeed a H S correlation but on a much narrower range of entropy and enthalpy than the
reported values shown in Fig. 2 of the MT. As expected, the experimental values for bulk are close to the
calculated H and S for the midplateau pressures as the measured hysteresis is small. Remarkable is
that the Wadell2 data points (triangles in Supplementary Fig. 2, and W23, W34 and W66 (for L = 22.5, 34.1,
and 65.7 nm nanocubes) in Fig. 2 of the MT) and the Syrenova et al.4 new single nanocube data (green
squares in Supplementary Fig. 2 and Fig. 2 of the MT) are consistent with our model values, although they
were not used in the fitting of the parameters entering the model. The calculated compensation
temperatures Tcomp, 607 K and 722 K for absorption and desorption, respectively, are clearly different from
the spurious compensation temperatures in Fig. 2 of the MT.
3 Stability of the hysteresis definition in situations with
sloping plateaus
Supplementary Figure 3. Illustration of the fact that the hysteresis is better defined than the plateau pressure. The data are for a 32 nm nanocube ensemble measured by Bardhan et al.1 The arrows of a given colour all have the same length. The hysteresis, i.e., the difference ln pabs – ln pdes does not depend critically on concentration.
© 2015 Macmillan Publishers Limited. All rights reserved
6
The large size dependence of the enthalpy and the entropy found for 14, 32, 65, and 110 nm nanocubes1
is probably due to several factors: i) uncertainties in determination of the critical concentration at which
the plateau pressure must be evaluated for a Van ‘t Hoff analysis, ii) the use of the midpressure pmid as
representative of the intrinsic thermodynamic properties of PdHx nanocubes, and iii) a relatively narrow
temperature range.
As shown in Supplementary Fig. 3, the difficulties i) and ii) can be avoided by considering the hysteresis
(ln pabs – ln pdes). This implies that the y-axis in Fig. 4 of the MT is well determined and that the critical
temperature Tc can be obtained from a plot of the hysteresis as a function of temperature (see
Supplementary Section 5 and Supplementary Fig. 4). The usefulness of hysteresis versus temperature data
has also been discussed in detail by Pundt and Kirchheim.10
4 Hysteresis scaling law for a lattice gas
We consider two simple lattice gas models and calculate the spinodal upper and lower concentrations and
pressures, the critical temperature, and subsequently derive the corresponding hysteresis scaling law.
4.1 Lattice gas with linear attractive H-H interaction and blocking factor
In the simplest mean-field description of a lattice gas, for example H in Pd, the isotherms are given by
1 ln ln2
H Axx Sp
b x RT R
. (S1)
where x = H/Pd, H∞ is the enthalpy of hydrogen solution in Pd (i.e., H in the limit 0x ), b a blocking
factor, and A the magnitude of the long-range effective H-H interaction.
The spinodal concentrations xus and xls defined by the condition
ln 0T
p
x
(S2)
are
1 ; 12 2us ls
b bx z x z (S3)
with
© 2015 Macmillan Publishers Limited. All rights reserved

7
1 4 RTz
Ab . (S4)
The calculated curve between xus and xls is physically not allowed as the chemical potential (proportional
to ln p) decreases with increasing concentration. The maximum hydrogen absorption pressure is thus pus
and the minimum desorption pressure pls.
These upper and lower spinodal pressures are given by
11ln 2ln 2 2
1us
Ab zHz Sp
z RT RT R
(S5)
and
11ln 2ln 2 2
1ls
Ab zHz Sp
z RT RT R
. (S6)
The critical temperature, pressure, and concentration are determined by the three conditions
ln 0cT T
p
x, (S7)
2
2
ln 0cT T
p
x, (S8)
and
3
3
ln 0cT T
p
x. (S9)
Combining equations (S7), (S8) and (S9) we obtain
4c
AbT
R . (S10)
Then z can be rewritten as 1 cz T T .
The maximum hysteresis in an absorption-desorption cycle is ln (pus /pls), which is proportional to the
difference of the absorption and desorption chemical potentials.
© 2015 Macmillan Publishers Limited. All rights reserved

8
The full spinodal hysteresis given by
1ln 8 4ln1
us c
ls
p T zz
p T z
(S11)
only depends on the scaled temperature T / Tc (see equation (3) of the MT).
4.2 Lattice gas with non-linear effective H-H interaction
We demonstrate here that an analytically solvable lattice gas model with a linear attractive (elastic) H-H
interaction -Ax and a quadratic repulsive (electronic) H-H interaction Fx² leads to a very similar scaling law
as in equation (S11). In equilibrium with hydrogen gas at pressure p we have
21 ln ln
2 1H Ax Fxx S
px RT R
. (S12)
Both A and F are positive. The enthalpy H and the entropy S are expressed per molH. For
temperatures below the critical temperature Tc, the pressure-composition isotherms described by
equation (S12) exhibit a local maximum with pressure pus (the upper spinodal pressure) at concentration
xus and a local minimum with pressure pls (the lower spinodal pressure) at concentration xls (see Fig. 1 of
the MT).
Following the same procedure as in the linear case, we obtain from the conditions in equations (S7) and
(S8)
2 1c c c cRT A Fx x x (S13)
and
22( )2 1
1 2c
c c
c
xFx RT
x
. (S14)
Equations (S13) and (S14) lead to a critical concentration xc:
1 21 2 1 2 4
6c q qq
x q
(S15)
with
F
qA
. (S16)
© 2015 Macmillan Publishers Limited. All rights reserved

9
If the quadratic H-H interaction vanishes, i.e., when F = 0 then xc = 1/2 and the critical temperature is
4co
AT
R . (S17)
For the general case with q 0,
4 1-2 1-c co c c cT T qx x x . (S18)
An analytic expression for Tc can be obtained by inserting xc from equation (S15) into equation (S18). One
obtains
1 8 ² 4 2 4 ² 2 1 16 ³ 12 ² 6 2
27 ²c
co
Tq q q q q q q
T q . (S19)
This proves explicitly that Tc / Tco depends only on the ratio q = F/A.
We calculate now the upper and lower spinodal pressures pus and pls. By definition the spinodal
compositions xi with i = us or ls are determined by the condition
ln 0T
p
x. (S20)
Inserting ln p from equation (S12) into equation (S20) leads to
4(1 2 ) (1 )i i i
co
Tqx x x
T , (S21)
which implies that the spinodal concentrations depend only on q and Tc / Tco. For the spinodal hysteresis
we obtain:
1ln 2ln 8 1
1us lsus co
us ls us ls
ls ls us
x xp Tx x q x x
p x x T
. (S22)
Equations (S15), (S18) and (S21) imply that
ln ,us c
ls c co
p TTh
p T T
. (S23)
© 2015 Macmillan Publishers Limited. All rights reserved
10
The analytic expression for the function h turns out to be complicated. For the special case q = 0, i.e., when
Tc / Tco = 1 it is, however, simply (see equation (3) of the MT)
1,1 8 4ln1
cT zh z z
T z
(S24)
with 1 / cz T T . Numerically one can show that the following expression is a very good approximation
of the exact analytical result
1 1, 1 ,1 ,12 2
c cc
co co
T Th z h z x h z
T T
. (S25)
As xc is typically 0.3 the scaling law is within 20% the same as in equation (3) of the MT.
5 Spinodal hysteresis and non-linearity of Van ‘t Hoff plots
As the hysteresis vanishes at the critical temperature it is tempting to determine Tc from the crossing point
of the absorption and desorption Van ‘t Hoff plots. This works fine if experimental data are available for
temperatures close to Tc and if the Van ‘t Hoff plots are linear. Equivalently, if enthalpy and entropy data
are available for hydrogen absorption and desorption close to Tc one can use
abs desc
abs des
H HT
S S
. (S26)
5.1 Non-linearity of Van ‘t Hoff plots of spinodal pressures
We show here that the procedure described above is not valid for systems with a large hysteresis, i.e., with
a hysteresis comparable to the full spinodal hysteresis. The Van ‘t Hoff plots ,ln abs desp versus 1/T are then
inherently curved. This can be easily demonstrated by means of the simplest lattice gas model with
pressure-composition isotherms given by equation (S1).
From equations (S5) and (S6) it is evident that Van ’t Hoff plots corresponding to the upper spinodal
pressure (for absorption) and the lower spinodal pressure (for desorption) are not linear. This is in sharp
contrast with the Maxwell plateau pressures given by
2 1ln 4 2Maxwell c
H Sp T
R T R
. (S27)
© 2015 Macmillan Publishers Limited. All rights reserved

11
Supplementary Figure 4. Spinodal pressures and hysteresis calculated with the simplest mean field model (see equations (S5), (S6), (S11) and (S27)) with typical thermodynamic values (S = -65.39 J/K/molH, H = -15 kJ/molH, Tc = 500 K). a, Upper and lower spinodal pressures (pus, pls, blue and pink lines), and the Maxwell pressure (pMaxwell, orange line), plotted logarithmically versus a reciprocal temperature scale. The red and pink dots represent “experimental” data for temperatures between
300 and 380 K. The black dashed lines are linear fits to these “experimental” data points. As clearly
seen in the inset, these two lines cross at a temperature T* that is much lower (black dot at T* = 439 K) than the true critical temperature Tc = 500 K. Noteworthy is that the Maxwell pressure is perfectly linear. b, Full spinodal hysteresis (green line) plotted on the same temperature scale as in a, together with the linear fits corresponding to the dashed black curves in a. The same underestimation of the critical temperature as for the individual spinodal pressures is visible.
The non-linearity of Van ‘t Hoff plots can have severe effects on the determination of the critical
temperature. When using the Van ‘t Hoff analysis to determine Tc as the point of intersection of the linearly
extrapolated absorption and desorption pressures, one underestimates the critical temperature
dramatically as shown in Supplementary Fig. 4a for typical thermodynamic parameters, where the
Tc - T* = 61 K. The same underestimate is obtained when fitting the hysteresis versus inverse temperature
curves with straight lines.
5.2 Determination of Tc with data collapse
We describe here a method of determining Tc that is only based on the assumption that there is a scaling
law for the hysteresis of the form indicated in equation (2) in the MT, i.e.,
,hysteresis , ln
, )abs c
des
p T L T LT L f
p T L T
(S28)
© 2015 Macmillan Publishers Limited. All rights reserved

12
It is important to stress that we do not make any a priori assumptions about the function f except for the
fact that f(1) = 0. We now show that the data of Bardhan et al.1 for four different sizes of nanocubes make
it possible to determine the function f. For this we start from equation (S28) that implies a connection
between the hysteresis data of two particles of sizes L1 and L2. Data points of equal hysteresis satisfy
1 2
1 1 2 21 2
hysteresis( , ) hysteresis( , )c cT L T LT L f T L f
T T
. (S29)
Supplementary Figure 5. Temperature dependence of the hysteresis of 14, 32, 65, and 110 nm Pd nanocubes by Bardhan et al.,1 and of 7 nm nanoparticles of Yamauchi et al.6 a, Collapsed data of Bardhan et al.1 (the original values are taken from their Table S2) using the procedure described in the text. The fit corresponds to our model (equation (S31)) with k = 0.45. b, The critical temperatures for the different nanocubes of Bardhan et al.1 fitted with k = 0.45 are 441 K, 481 K, 523 K, and 556 K. c, The Yamauchi et al.6 nanocube hysteresis of their 7 nm nanoparticles fitted with a standard linear interpolation (red dotted line) and equation (S31) with k = 0.71 and Tc = 428 K. For the three panels the temperature scale is reciprocal.
© 2015 Macmillan Publishers Limited. All rights reserved

13
As the function f is single-valued this means that
1 2 11
1 2 2 2
.c c c
c
T L T L T LTconst
T T T T L (S30)
Equation (S30) makes it possible to rescale the temperatures of the data sets of each nanocube size so as
to collapse all the data on one curve. This is specifically done for the Bardhan et al.1 data in Supplementary
Fig. 5a, where the temperature of the data points for the 14, 32, and 65 nm nanocubes are rescaled relative
to the 110 nm cubes. The collapsed curve is well described by
1ln 8 4ln1
abs c
des
p T zk z
p T z
(S31)
with k = 0.45 and Tc = 556 K. As all data have been rescaled with respect to the 110 nm data, Tc = 556 K is
the critical temperature of the 110 nm cubes. The scaling factors necessary for data collapse allow directly
to calculate the critical temperatures for the 14, 32, and 65 nm cubes. One can alternatively fit equation
(S31) with k = 0.45 to the data sets of the individual nanocubes and finds Tc (14 nm) = 441 K,
Tc (32 nm) = 481 K, and Tc (65 nm) = 523 K (see Supplementary Fig. 5b).
Supplementary Figure 6. Temperature dependence of bulk-like palladium systems. a, Hysteresis of bulk palladium measured by Laesser & Klatt,11 Picard et al.12 and de Ribaupierre & Manchester,13,14 showing that for temperatures close to the critical temperature the full spinodal hysteresis is obeyed. b, Dataset of Pivak et al.15 on 50 nm free standing palladium films exhibiting a similar behaviour as bulk Pd. By fitting the full spinodal model to the point closest to the critical point we find Tc = 532 K.
In bulk palladium and thin films the hysteresis is much narrower than the full spinodal hysteresis and
therefore the spinodal model is not applicable to determine the critical temperatures of such systems.
© 2015 Macmillan Publishers Limited. All rights reserved
14
However, as stated by de Ribaupierre and Manchester13,14, close to the critical point also bulk-like systems
exhibit hysteresis close to the full spinodal one (see Supplementary Fig. 6a for bulk Pd). Hence, by fitting
the full spinodal hysteresis model, i.e., equation (S31) with k = 1 to measurement points close to the critical
point, we are also able to estimate the critical temperature for a free-standing Pd film that behaves bulk-
like (Supplementary Fig. 6b).
6 Critical temperature
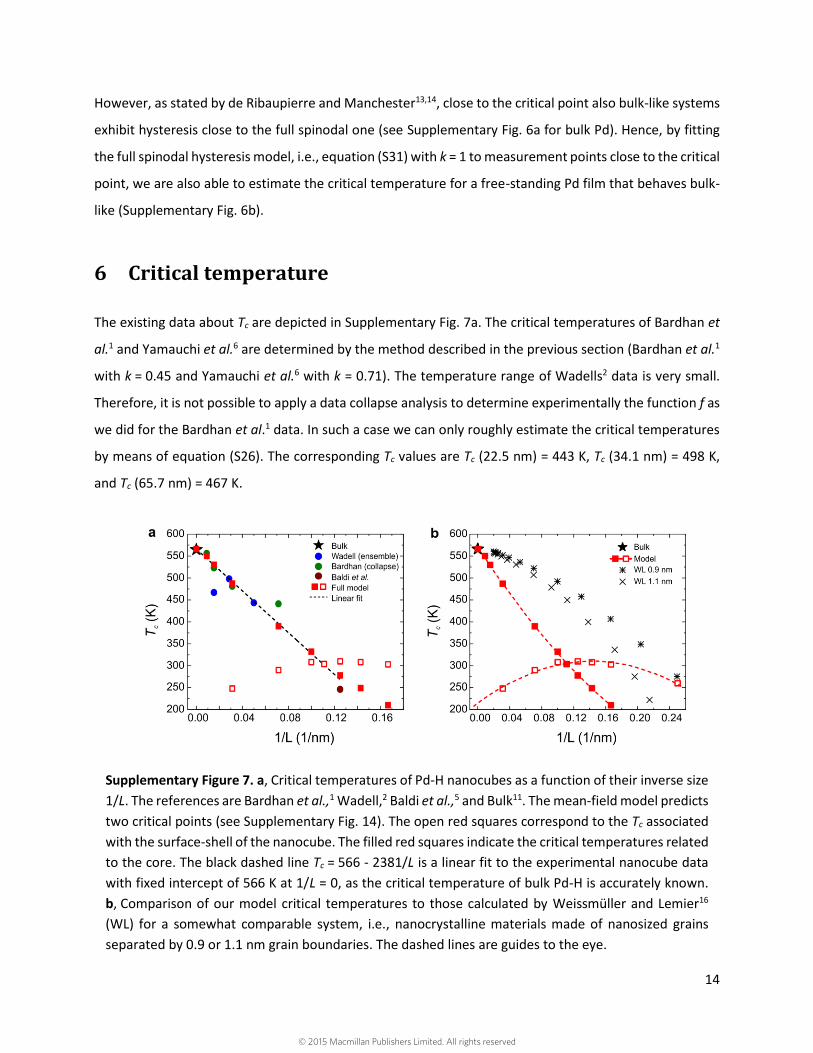
The existing data about Tc are depicted in Supplementary Fig. 7a. The critical temperatures of Bardhan et
al.1 and Yamauchi et al.6 are determined by the method described in the previous section (Bardhan et al.1
with k = 0.45 and Yamauchi et al.6 with k = 0.71). The temperature range of Wadells2 data is very small.
Therefore, it is not possible to apply a data collapse analysis to determine experimentally the function f as
we did for the Bardhan et al.1 data. In such a case we can only roughly estimate the critical temperatures
by means of equation (S26). The corresponding Tc values are Tc (22.5 nm) = 443 K, Tc (34.1 nm) = 498 K,
and Tc (65.7 nm) = 467 K.
Supplementary Figure 7. a, Critical temperatures of Pd-H nanocubes as a function of their inverse size 1/L. The references are Bardhan et al.,1 Wadell,2 Baldi et al.,5 and Bulk11. The mean-field model predicts two critical points (see Supplementary Fig. 14). The open red squares correspond to the Tc associated with the surface-shell of the nanocube. The filled red squares indicate the critical temperatures related to the core. The black dashed line Tc = 566 - 2381/L is a linear fit to the experimental nanocube data with fixed intercept of 566 K at 1/L = 0, as the critical temperature of bulk Pd-H is accurately known. b, Comparison of our model critical temperatures to those calculated by Weissmüller and Lemier16 (WL) for a somewhat comparable system, i.e., nanocrystalline materials made of nanosized grains separated by 0.9 or 1.1 nm grain boundaries. The dashed lines are guides to the eye.
© 2015 Macmillan Publishers Limited. All rights reserved

15
The critical temperature at 246 K (brown dot in Supplementary Fig. 7a) is estimated from Baldi et al.’s5
absorption and desorption data for nanocubes in the range of 13 to 29 nm shown in Supplementary Fig.
8. For this we fitted their absorption pressures to a straight line. As the desorption pressures are increased
by electron beam heating in an uncontrolled fashion we fitted a straight line only to the lowest lying points
(corresponding to the 13, 15, 21, 28, and 29 nm nanocubes). The intersection of these two lines suggests
a vanishing hysteresis at approx. 8 nm. It is noteworthy that the vanishing of hysteresis predicted by our
mean-field model (described in details in Supplementary Sections 9 and 10) is actually around 7 nm
although the desorption data did not enter our fit procedure (see Supplementary Fig. 12).
Supplementary Figure 8. Absorption (dots) and desorption (open circles) plateau pressures measured by Baldi et al.5 at 246 K for a series of nanocubes. As discussed by the authors only the absorption pressures can be reliably measured by EELS5 (Electron Energy Loss Spectroscopy). The construction of the dashed lines is explained in the text.
The data of Weissmüller and Lemier16 are included in Supplementary Fig. 7b for comparison although they
consider a related but clearly different situation. They calculate the critical temperature of a
nanocrystalline material consisting of nanosized grains separated by grain boundaries of various thickness
(0.9, 1 and 1.1 nm). They assume that there is no separation into -PdHx and -PdHx phases within the
grain boundaries in which the concentration dependence of the chemical potential is assumed to be
negligible. In our model both core and surface-shell can exhibit -PdHx and -PdHx phases and the
hydrogen concentration in the surface-shell is directly determined by the chemical potential of the
surrounding hydrogen gas.
© 2015 Macmillan Publishers Limited. All rights reserved

16
The size dependence of the critical temperature Tc (in degrees Kelvin) calculated with the mean-field
model described in Supplementary Sections 9 and 10 is well represented by
2230565.5cT
L , (S32)
for nanocubes with a size L > 10 nm. For smaller nanostructures Tc remains within the range of 250 and
310 K. The existence of two critical temperatures in Supplementary Fig. 7 is a direct consequence of the
core- surface-shell structure assumed in our model for the nanoparticles. The critical temperatures
calculated by Weissmüller and Lemier16 for a somewhat comparable system (nanocrystalline Pd-H with
grain boundary thicknesses of 0.9 and 1.1 nm), exhibit a similar decrease of Tc with inceasing 1/L.
7 Robustness of the scaling law
Optical and EELS techniques used in recent works to measure hydrogen absorption in nanoparticles can in
principle induce local heating of the particles. Baldi et al.5 discuss in great detail the impact of electron
beam heating on their measurements and conclude that their desorption data are upper bounds of the
actual desorption pressures. The Chalmers University group directly compared isotherms measured by
Localized Surface Plasmon Resonance Sensing (LSPR) using light with gravimetric ones measured in the
dark by Quartz Crystal Microbalance with Dissipation Monitoring (QCM-D). The two sets of data being the
same, they conclude that the effect of heating by light is negligible17. This also applies to the Wadell et
al.2,3 and Syrenova et al.4 data as the same experimental setup was used. The conclusion that the effect of
light at fluxes used in the experiment is negligible is theoretically confirmed by Zhdanov et al.18 For the
Bardhan et al.1 data the situation is less clear. The 5 mW laser beam focussed to a 2.5 m spot can in
principle heat up the nanocubes. A simple estimate using equation (2) in a publication by Baffou and
Quidant19 and the scattering cross-section calculated by extended Mie theory for a spherical plasmonic
particle (equation (5.19) in ref. 20) leads to an increase of about 50 K in a 110 nm nanoparticle. This would
roughly decrease the critical temperature by 10%. However, the Tc values of Bardhan et al.1 are
comparable to those of Wadell2. This seems to indicate that heating effects are not serious. For the smaller
nanocubes heating effects are small anyway. For a 30 nm particle the heating effect is less than 2 K.
© 2015 Macmillan Publishers Limited. All rights reserved

17
Supplementary Figure 9. a, Pressure-composition isotherms calculated with the mean-field model described in Supplementary Sections 9 and 10 for a 110 nm nanocube with a local heating (T = 50 K, dashed lines) and without local heating (T = 0 K, solid lines). The local heating decreases the critical temperature by 38 K. b, Scaling-laws with and without local heating. All calculations are done with the same parameters as in Fig. 5 of the MT.
Even in cases where local heating is substantial it is straightforward to demonstrate that our scaling law
analysis is still meaningful. To demonstrate the robustness of the scaling law towards heating effects we
consider an extreme case where a local heating (e.g., produced by a focused laser beam as in Bardhan et
al.’s1 experiment) increases the temperature of a 110 nm nanoparticle by 50 K while keeping the
surrounding gas temperature constant. The calculated pressure-composition isotherms with and without
local heating are depicted in Supplementary Fig. 9a. From these isotherms one calculates the full spinodal
hysteresis and compares it to the one without local heating. Quite remarkably, the two curves are very
close to each other. The origin of the robustness of the scaling-law lays primarily in the fact that it depends
on the ratio Tc / T which is only weakly influenced by a temperature offset due to local heating effects.
8 Quantitative mean-field model of the pressure-composition
isotherms of bulk PdHx
The model described here is a refined version of mean-field models introduced by Brodowsky21, Wicke et
al.,22 Wicke and Blaurock,23 Salomons et al.,24 Hemmes et al.,25 and Feenstra et al.26 It is based on the
following expression for the pressure-composition isotherms of H in bulk Pd,
© 2015 Macmillan Publishers Limited. All rights reserved

18
1 ln ln2 1
elast electH H Hx Sp
x RT R. (S33)
The enthalpy of solution (in J/molH) is
14770 12.94H T , (S34)
where T is the absolute temperature. The expression in equation (S34) is a linear representation of the
experimental enthalpy data shown on page 173 of ref. 9. This figure summarizes the results published in
11 articles about the temperature variation of the enthalpy up to 920 K. The attractive elastic H-H
interaction enthalpy is
2
0
( )x
Helast
BVH x dx
V , (S35)
where B is the bulk modulus and V the molar volume of PdHx , and VH the partial molar volume of H in
PdHx. It is well represented by27
2 363640 40170 9740elast x x xH . (S36)
The repulsive electronic H-H interaction is taken as
4.1791 47248 (87955 )/ ( )electH x x x (S37)
with = 1.0648. It depends mainly on the H concentration dependence of the Fermi energy of PdHx. The
non-linear term arises from the filling of the electronic d-band of Pd26. The compact analytical expression
in equation (S37) reproduces accurately the electronic contribution to the enthalpy shown in Fig. 2 of ref.
25.
The total effective H-H interaction corresponding to the sum of Helast and Helect is depicted in Supplementary
Fig. 10. The entropy is9
5 2 8 3
2 3
71.78 0.0702 6.88 10 2.89 10
29.23 9.15 54.83 .
T T T
x x x
S
(S38)
The concentration dependence of the entropy in equation (S38) is taken from equation (6) in ref. 27. The
temperature dependence of the entropy is mainly due to the contribution of the optical phonons in PdHx.
© 2015 Macmillan Publishers Limited. All rights reserved

19
Supplementary Figure 10. Elastic (green), electronic (blue) and total effective H-H interaction (red). The curves are calculated by means of equations (S36) and (S37).
The pressure-composition isotherms calculated by using equations (S34) - (S38) in equation (S33) are
shown in Fig. 5a of the MT. They are in excellent agreement with the measured desorption isotherms of H
in bulk Pd if one applies Maxwell’s construction to determine the incoherent desorption plateau pressures.
This confirms the early conclusions of Wicke and Blaurock23 that the desorption isotherms represent the
true strain-free equilibrium; the absorption branches represent, instead, an equilibrium under mechanical
constraints.
9 Mean-field model for H in Pd nanoparticles
9.1 Size dependent input parameters
For H in Pd nanoparticles of size L we find that all the essential features of pressure-composition isotherms
measured so far can be reproduced by assuming:
i) an enthalpy of H solution at subsurface sites
surf coreH H , (S39)
© 2015 Macmillan Publishers Limited. All rights reserved

20
ii) a surface tension enthalpy
st
uH
L , (S40)
iii) a weakening of the attractive elastic H-H interaction enthalpy
1bulk
elast elast
wH L H
L. (S41)
The repulsive electronic H-H interaction is assumed to be the same both for H in the core of the
nanoparticle and in its surface-shell. The same is assumed for the entropy.
9.2 Elastic coupling between surface-shell and inner part of the nanoparticle
As the enthalpy of solutions of H at surface-shell sites is more negative than at core sites, the resulting
larger surface H concentration leads to an expansion of the surface-shell, which expands also the inner
part (i.e., the core) of the particle. The problem of elastic coupling between surface-shell and core of a
nanoparticle has repeatedly been considered in the past. Directly relevant for our work is the work of
Pasquini et al.28 who considered the effect of elastic constraint on the thermodynamics of hydrogen
absorption and desorption in composite core-surface-shell nanoparticles, where the core is a hydride
forming metal and the surface-shell is made of a different materials that does not absorb hydrogen. For a
core containing a hydrogen concentration xcore = H/Pd surrounded by a surface-shell without hydrogen
they find for the relative volume change of the hydride due to elastic constraint of the non-hydrogen-
absorbing surface-shell that
3
3 3
2 ( 1)1 2 1
2 2 11 2 1 2
constrainedcore H
surf surfcore Pd
core core
x VV y
V Vy
, (S42)
where is the ratio of the radius of the entire particle (i.e., core plus surface-shell) and the radius of the
core
2 1
2 1 2L
L t t L
, (S43)
y is t the ratio of the surface-shell and core Young moduli
surf
core
Ey
E , (S44)
© 2015 Macmillan Publishers Limited. All rights reserved

21
and core and surf are the Poisson ratios of the core and surface-shell, respectively.
For Pd nanoparticles consisting of a core and a surface-shell we expect in first approximation that the
elastic constants of the surface-shell are the same as those of the core. This implies that y = 1 and core =
surf and consequently
3
3 3
2( 1)12 2 11 2
constrainedcore H
core Pd
x VV
V V
. (S45)
After a hydrogen concentration xcore has been added to the core, the overall relative volume change of the
core is
3
3 3
2 11
12 2 11 2
core core H
core Pd
V x V
V V
. (S46)
This relation takes a much simpler form when expressed in terms of our parameter g defined in equation
(4) of the MT as
3
3
2 11 1 1tg
L
. (S47)
Equation (S46) reduces then simply to
1corecore
core
Vx g
V
, (S48)
with = VH / VPd and as defined in equation (10) of the MT.
In a composite particle consisting of an inner core surrounded by a surface-shell, absorption of a hydrogen
concentration xcore in the core and xsurf in the surface-shell leads to relative volume changes of the core and
surface-shell that depends both on xcore and xsurf. We denote these relative volume changes as
, xcorecore surf
core
Vx
V
(S49)
and
© 2015 Macmillan Publishers Limited. All rights reserved

22
, xsurf
core surf
surf
Vx
V
. (S50)
Equation (S48) corresponds then to
,x 0 1corecore surf core
core
Vx x g
V
(S51)
and the relative dilation of the surface-shell is
,x 0 1surf
core surf core
surf
Vx x g
V
. (S52)
Following the same approach as Pasquini et al.28 it is straightforward to derive expressions for the case
where hydrogen is only absorbed by the surface-shell while keeping the bulk free of hydrogen. Then
0,xcorecore surf surf
core
Vx x g
V
, (S53)
and for the surface-shell
0,x 1 1surf
core surf core
surf
Vx x g
V
. (S54)
In the general case with a hydrogen concentration xcore > 0 in the core and xsurf > 0 in the surface-shell we
obtain
, xcorecore surf core surf core
core
Vx x x x g
V
(S55)
for the core, and
,x 1surf
core surf surf core surf
surf
Vx x x x g
V
(S56)
for the surface-shell.
Exactly the same relations can be derived from the work of Rockenberger et al.29 These authors consider
a situation where the core and the surface-shell have different lattice spacings. As a result of epitaxial
© 2015 Macmillan Publishers Limited. All rights reserved

23
growth this lattice mismatch induces deformations of the core and the surface-shell governed by their
shrink-fit condition (A2). The isotropic strain inside the core is from their equation (A4)
2
3
2 3 3 1 2313 1
shrink fitsurf core
core
a aV
V a
, (S57)
and the relative volume change in the surface-shell from their equations (A5) and (A6)
3
2
3
2
2 1 22 1 2 3 1 ln 1
1
3 1 3 3
2 1 22 4 3 1 ln 1
12
3 1 3 3
shrink fitsurf core
surf
a aV
V ad
(S58)
3
2 1 2313 1
shrink fitsurf core
surf
a aV
V a
, (S59)
with being the ratio of surface-shell thickness t and the radius of the core L/2 – t,
2t
L t
. (S60)
These expressions take a much simpler form when expressed in terms of the volume fraction parameter g
23 3 3
1g
(S61)
and
3
111
g
. (S62)
Introducing these two relations together in equations (S57) and (S59) gives
3shrink fit
surf core
core
a aVg
V a
(S63)
and
© 2015 Macmillan Publishers Limited. All rights reserved

24
3 1shrink fit
surf core
surf
a aVg
V a
. (S64)
To make contact with the situation where both core and surface-shell have different lattice spacings as a
result of different hydrogen concentrations we need the following relations
,shrink fit
corecore surf core
core core
V Vx x x
V V
(S65)
,shrink fit
surf
core surf surf
surf surf
V Vx x x
V V
(S66)
and
3 surf core
surf core
a ax x
a
. (S67)
Introduction of equations (S63), (S64) and (S67) into equations (S65) and (S66) leads then exactly to our
equations (S55) and (S56). It is worthwhile to mention that the basic reason why our relations are
mathematically simpler than those of Pasquini et al.28 and Rockenberger et al.29 is that our volume fraction
parameter g is restricted to 0 and 1 while 0 (see equation (S43)) and 0 (see equation
(S60)). The relative volume change is, however, always finite.
As the volume dependence of the partial enthalpy of hydride formation is30
ln H
T
HBV
V, (S68)
the volume strains in equations (S55) and (S56) lead to
2 2
, H Hcore core surf core core surf core
Pd Pd
BV BVH x x H x x x g
V V (S69)
and
2 2
, 1H Hsurf core surf surf surf core surf
Pd Pd
BV BVH x x H x x x g
V V . (S70)
These two equations can be rewritten as
, 1 ( ) ( )core core surf core elast core elast surfH x x H g H x gH x (S71)
© 2015 Macmillan Publishers Limited. All rights reserved

25
and
, 1 1 ( ) 1 ( )surf core surf surf elast surf elast coreH x x H g H x g H x (S72)
with Helast(x) defined as in equation (S35).
9.3 Pressure-composition isotherms
Thermodynamic equilibrium between the surrounding hydrogen gas and H dissolved in the Pd lattice
requires that
,1 ln ln
2 1core core surf elect stcore
core
H x x H Hx Sp
x RT R
(S73)
for H at core sites and
,1 ln ln
2 1surf core surf elect stsurf
surf
H x x H Hx Sp
x RT R
(S74)
at surface-shell sites. The term Hst accounts for the surface tension contribution to the enthalpy that
depends only on the size L. To proceed one needs to specify the variables determining Helect and S .
a) In a non-local model Helect and S depend only on the total H concentration xtotal
1total core surfx g x gx (S75)
and equations(S73) and (S74) together with (S71) and (S72) lead to
surfcorecore core surf surf
HHN x N x
RT RT
(S76)
with i = core or surface-shell, and
1ln
1elast ii
i i
i
H xxN x
x RT. (S77)
b) In a local model Helect and S depend on the local concentrations xsurf or xcore. The implicit relation in
equation (S76) is then replaced by
surfcorecore core surf surf
HHM x M x
RT RT
(S78)
© 2015 Macmillan Publishers Limited. All rights reserved

26
with i = core or surface-shell, and
1ln
1elast i elect i ii
i i
i
H x H x S xxM x
x RT R. (S79)
In both the local and non-local cases one obtains an implicit relation between the two concentrations xsurf
and xcore which needs to be solved numerically.
10 Fitting of the mean-field model to existing experimental
data
To evaluate the input parameters of the mean-field model described in the preceding sections we use
i) the pressure-composition isotherms of Bardhan et al.,1 ii) the corresponding critical temperatures, and
those of Wadell2 (see Supplementary Fig. 7a) iii) the pressure-composition isotherms of Wadell et al.3 and
iv) the absorption plateau pressures of Baldi et al.5 We find that all the essential features of these
experimental data are well reproduced with an enthalpy of solution 18,000 J/molH surfH for H
occupying sites in the surface-shell of thickness t = 1 nm, and = 0.5, u = 10,000 Jnm/molH and
w = 1.6 nm. All these values are reasonable:
a. A surface-shell enthalpy of solution (i.e., -18,000 J/molH) that is more negative than the core value
(given by equation (S34)) is consistent with the values obtained in ref. 31 ( subsurfaceH = -18,330,
-17,370, and -19,300 J/molH for Pd(111), (100), and (110) surfaces, respectively).
b. The surface-shell thickness t = 1 nm is intermediate between the lattice spacing of Pd (0.389 nm) and
4 nm proposed by Wilde et al.32 on basis of their depth-resolved measurements of subsurface H on
Pd(100). It is, however, important to point out that t = 4 nm is incompatible with the isotherms in
Fig. 5c and f of the MT and Supplementary Fig. 11 and 12. The small value t = 0.3 nm recently reported
by Syrenova et al.4 is probably due to the fact that a model neglecting dislocation generation is fitted
to the absorption pressures at 333 K of particles that are actually large enough to contain dislocations.
This is supported by the hysteresis plotted in Supplementary Fig. 20. For nanocubes larger than 35 nm
the hysteresis is essentially size-independent.
c. The coupling parameter = 0.5 falls within the interval 0.24 < < 1 as mentioned in the MT33.
© 2015 Macmillan Publishers Limited. All rights reserved

27
d. For a particle of size L the surface tension enthalpy is24
4 Hst
VuH
L L (S80)
With a hydrogen partial molar volume VH ≈ 1.5×10⁻⁶ m3/molH and a typical surface tension34,35 of
≈ 2 J/m2 we obtain Hst = 12,000/L with L expressed in nm. This would correspond to
u = 12,000 J×nm/molH, which is comparable to the fitted value u = 10,000 J×nm/molH.
e. The small effective clamping thickness w = 1.6 nm implies that even in the smallest nanocubes
investigated in refs. 1 and 5, i.e., 14 nm, the magnitude of the attractive H-H interaction is lowered
only by ~11%.
10.1 Pressure-composition isotherms of nanocubes
The pressure composition isotherms calculated with these parameters for the four nanocube sizes of
Bardhan et al.1 are shown in Supplementary Fig. 11. As the hydrogen concentrations were not accessible
in the experiment, one can only use the shape (and pressure values) for a comparison. One finds that the
absorption “plateau” pressures are close to the calculated upper spinodal pressure p while the desorption
“plateau” pressures are close to the incoherent pMaxwell (see Fig. 1 in the MT).
© 2015 Macmillan Publishers Limited. All rights reserved

28
Supplementary Figure 11. Pressure composition isotherms for 14, 32, 65, and 110 nm Pd nanocubes in panels a, b, c, and d, respectively. They are calculated with an enthalpy of solution of -18,000 J/molH for the sites in a surface-shell of thickness t = 1 nm and = 0.5, u = 10,000 J×nm/molH, and w = 1.6 nm (coloured lines). These are the same parameters as for Fig. 5c to f in the MT. As the concentration for the isotherms (squares) could not be measured experimentally, Bardhan et al.1 normalized it arbitrarily to unity. For a better comparison, the relative concentrations of the loading and unloading data of Bardhan et al.1 are rescaled by a constant factor, so that the endpoint of every experimental loading curve coincides with the concentration H/Pd obtained by the model at the same pressure. The black lines correspond to the model critical isotherms at 400, 487, 530 and 550 K (see Supplementary Fig. 7a).
© 2015 Macmillan Publishers Limited. All rights reserved

29
10.2 Plateau pressures of nanocubes at 246 K
The size dependence of absorption and desorption plateau pressures at 246 K are shown in Supplementary
Fig. 12. The fit to the measured absorption pressures is excellent. As expected the measured desorption
plateaus are much higher than the calculated ones, as a result of the experimental difficulties with
desorption measurements discussed by Baldi et al.5
Supplementary Figure 12. Size dependence of absorption and desorption plateau pressures at 246 K. Experimental data are from ref. 5 (absorption (green dots), desorption (open green circles)). Pressures are calculated using the same parameters as in Supplementary Fig. 11 (upper spinodal pressure (red dots), lower spinodal pressure (red circles), plateau pressure obtained by means of the Maxwell construction (black squares)).
The calculated hysteresis disappears for nanocubes of approximately 7 nm in size. Interestingly, the
calculated pressures obtained with the Maxwell construction are almost size independent and close to the
lowest measured desorption pressures. One may regard this as further evidence that the true desorption
pressures are close to pMaxwell as is the case for all isotherms in Supplementary Fig. 11. For all the nanocubes
our model demonstrates that the ad hoc assumption of Baldi et al.,5 i.e., that the surface-shell hydrogen
concentration is constant and equal to 0.51 is reasonable for 0.05 < xcore < 0.5 for all their nanocube sizes
between 13 and 29 nm. This is explicitly shown in Supplementary Fig. 13 for 13, 21 and 29 nm nanocubes.
© 2015 Macmillan Publishers Limited. All rights reserved

30
Supplementary Figure 13. Surface-shell hydrogen concentration versus H concentration in the core of 13, 21 and 29 nm Pd nanocubes calculated with the same parameters as in Supplementary Fig. 11. The size dependence is small and the three curves overlap at almost all concentrations.
11 Local versus non-local model
All the results presented above are obtained with the local model (see equations (S78) and (S79)). This is
reasonable as it is unlikely that the electronic term in equations (S73) and (S74) depends on the total
hydrogen concentration in a system where two spatially well separated regions (i.e., core and surface-
shell) in the sample are present. It is important to note here that the electronic term depends on the filling
of the d-band. A difference in the work functions of separated regions can also lead to an electron transfer
that influences the Fermi energy locally in addition to the band filling associated with hydrogen loading.
This is in clear contrast with models for disordered alloys36 where interstitial sites with different local
chemical composition coexist within subnanometer distances. In such cases the constancy of the Fermi
energy together with a spatially averaged work function implies that the electronic repulsive H-H
interaction depends essentially on the average hydrogen concentration.
© 2015 Macmillan Publishers Limited. All rights reserved

31
12 Pressure-composition isotherms of very small Pd clusters
Supplementary Figure 14. Pressure-composition isotherms at 200 (blue), 250 (green), 300 (orange), and 350 K (red curves) for 4 to 14 nm nanocubes calculated with the same parameters as in Fig. 5 in the MT and Supplementary Fig. 11. The existence of two critical temperatures in Supplementary Fig. 7 is directly connected to the wavy shape of the isotherms.
© 2015 Macmillan Publishers Limited. All rights reserved

32
In 10 nm Pd nanocubes the volume fraction g of surface-shell sites is 0.488. This implies that core and
surface-shell contributions are comparable.
In Supplementary Fig. 14 the calculated isotherms exhibit clearly a double structure. For the 4 nm
nanocubes the isotherms are dominated by the contribution of the surface-shell while for 14 nm
nanocubes the core contribution is more important. This switch from a surface-shell-dominated regime to
a core-dominated regime is responsible for the kink in the size dependence of the critical temperature in
Supplementary Fig. 7.
13 Scenarios for hydrogen absorption-desorption cycles
The asymmetry between the absorption and desorption pressures in Fig. 3 of the MT together with the
fact that most of the data points in Fig. 4 of the MT lay between the full- and 45%-spinodal hysteresis
indicate that the hydrogen absorption process can be different from the desorption process in nanocubes.
Deviations from the full spinodal scaling curve are related to the generation of incoherency between core
and surface-shell or/and the generation of misfit dislocations in the core of the nanoparticles. We consider
these two aspects in the following sections and discuss possible scenarios for hydrogen absorption-
desorption cycles.
13.1 Scenario I: Fully coherent absorption-desorption cycle
A fully coherent cycle in which the core/surface-shell elastic coupling remains intact and no misfit
dislocations are generated in the core of the nanoparticle can directly be calculated by means of our mean-
field model described in Supplementary Sections 8, 9, and 10. As the concentration difference xcore - xsurf is
a measure of the strains between surface-shell and core, we depict the hydrogen pressure dependence of
the core and surface-shell concentrations, their difference, and the total concentration in Supplementary
Fig. 15 for a nanocube of 32 nm at 295 K. During hydrogen absorption starting at point A the concentration
difference xcore - xsurf reaches a maximum value close to 0.47 at point C while it remains below 0.25 during
the entire desorption. The maximum concentration difference is only very weakly dependent on the
nanocube size.
© 2015 Macmillan Publishers Limited. All rights reserved

33
Supplementary Figure 15. a, Pressure dependence at 295 K of the core (black), and surface-shell (red) hydrogen concentrations in a 32 nm nanocube calculated with the same parameters as in Fig. 5 of the MT. b, The green curve corresponds to the total H concentration in the cube. The green arrows occur at the upper (pus) and lower (pls) spinodal pressures. c, The blue curve is the concentration difference. The blue arrows indicate the path followed in a fully coherent absorption-desorption cycle during which the core-surface-shell coupling remains intact and no misfit dislocations are generated (Scenario I). The red points are explained in the text.
© 2015 Macmillan Publishers Limited. All rights reserved

34
For the PdHx system xsurf - xcore = 0.47 corresponds to a lattice mismatch of 2.8%. This value is substantially
smaller than the critical mismatch mentioned by Fan et al.37 and Jin et al.38 They observed that epitaxial
growth of heterogeneous core-surface-shell nanocrystals can occur when the lattice mismatch between
core and surface-shell is smaller than about 5%. On the basis of this argument one expects that the
hysteresis should be as large as the full spinodal hysteresis as surface-shell-core coherency is preserved
during the entire cycle.
13.2 Scenario II: Incoherent absorption-desorption cycle without misfit
dislocation generation in the core
Another scenario can, however, occur if during hydrogen absorption a certain critical value of strains is
reached at point B in Supplementary Fig. 15c. As an extreme case we assume that core and surface-shell
are then fully decoupled and each of the subsystems continues to absorb hydrogen as if it were isolated.
At high pressures (for the system considered here this occurs already at pressures above 1 bar), the
hydrogen concentration in the surface-shell is then only slightly larger than in the core. When the pressure
is lowered, core and surface-shell desorb hydrogen individually until at zero pressure they naturally fit
again together.
Supplementary Figure 16. Simulation for a 32 nm Pd nanocube at 295 K of a scenario with coherent core-surface-shell during hydrogen loading and incoherent core-surface-shell during unloading but no misfit dislocation generation (Scenario II). The pressure dependence of the total concentration during coherent loading (green curve), coherent
totalx , is calculated with the mean-field model using the same parameters as in Supplementary Fig. 11. During desorption (magenta curve) all parameters are kept the same except for the elastic core-surface-shell parameter that is set equal to 0. The absorption curve is the same as in Supplementary Fig. 15.
© 2015 Macmillan Publishers Limited. All rights reserved
35
The total concentration incoherenttotalx during desorption is described by the violet curve in Supplementary Fig.
16. The surface-shell-core decoupling leads to a desorption plateau that is higher than the lower spinodal
pressure. The net effect is a 20% reduction of the hysteresis. This is consistent with the data of Wadell2,
Syrenova et al.,4 and Yamauchi et al.6 in Fig. 4 of the MT.
13.3 Scenario III: Absorption-desorption cycle with misfit dislocation
generation in the core
In Scenario I we considered a situation where point C in Supplementary Fig. 15 has been reached without
surface-shell-core decoupling, i.e., a situation for which the surface-shell-core coherency remains intact.
As soon as the upper spinodal pressure is exceeded the nanoparticle absorbs spontaneously more
hydrogen radially and forms a hydride layer. The sample consists then of the surface-shell of layer
thickness t, a -hydride layer of thickness , and an inner sphere of essentially pure Pd until the whole
sample is filled with hydrogen. As clearly explained by Schwarz and Khachaturyan39 there is no equilibrium
coexistence between the hydride layer and the inner Pd sphere. There are, however, large coherency
strains. The corresponding large elastic energy can be circumvented by generating misfit dislocations. The
plateau pressure is then effectively reduced to a value close to the Maxwell plateau that corresponds to
points M in Supplementary Fig. 15 and to the vertical dashed line in Supplementary Fig. 17. The
concentrations of the two coexisting phases are corex and corex .
According to Baldi et al.5 the overall energy associated with the generation of a misfit dislocation (their
equations (S2), (S4) and (S5)) is
2 33
332
8 2ln 1 1 1 12 1 2 9 2
8ln 1 1 1 12 1 9
Ttotal
T
Gb L LE e
b b b b b L
Gb dd d e d
(S81)
with G being the shear modulus of Pd,
db
, (S82)
and
2L
b , (S83)
© 2015 Macmillan Publishers Limited. All rights reserved

36
where b is the Burgers vector of the misfit dislocation and
x
x
Pd PdHT
PdH
V Ve
V
(S84)
is the fractional change in volume between PdHx and Pd (Baldi et al.5 actually used equation (S84) for the
calculations indstead of their quoted equation (S3)). It is favourable to generate dislocations when Etotal
is negative. By taking eT = - 0.1062, which corresponds to the fractional volume change between -phase
and -phase in bulk Pd at room temperature, Baldi et al.5 found that dislocations are not energetically
favourable for particles smaller than 35 nm.
Supplementary Figure 17. Pressure dependence of the calculated surface-shell and core concentrations. a, Schematic hydrogen distribution during the spontaneous hydrogen absorption occurring when the applied hydrogen pressure exceeds the upper spinodal pressure. The core consists of a hydride layer of thickness (blue shaded area) surrounding a sphere of essentially pure Pd (yellow area). The whole core (of diameter L - 2t) is surrounded by a thin surface-shell of thickness t. b, Detail of the pressure dependence of the calculated surface-shell and core concentrations for a 65 nm cube at 400 K. The shell of 1 nm thickness is elastically coherent with the -hydride shell of thickness . As the core concentration exhibits an S-shape it can separate in an - and -phase in the core. The difference core corex x is used in the evaluation of the lattice mismatch parameter eT of Baldi et al.5
In fact their upper size limit is likely to be too small since they assumed that 0.6core corex x . From the
calculated xcore (black curve in Supplementary Fig. 17b) we estimate the concentrations corex and corex of
the -PdHx and -PdHx phases that would form in the core during an incoherent phase transition, where
© 2015 Macmillan Publishers Limited. All rights reserved

37
a shell of thickness of -PdHx phase is surrounding a sphere of -PdHx. These values can then be used to
calculate the lattice mismatch factor eT and consequently the normalised total energy change associated
with the generation of a misfit dislocation (their equations (S2), (S4) and (S5)). For a 32 nm nanocube we
find at 295 K, 0.496core corex x x and at 350 K 0.447core corex x x . For a 14 nm cube the temperature
dependence is stronger and we find at 295 K, 0.386core corex x x and at 350 K 0.27core corex x x .
These values are substantially smaller than the 0.6 assumed by Baldi et al.5 The normalized energy
difference for 14, 32, 45, 65, and 110 nm nanocubes at 295 and 350 K is shown in Supplementary Fig. 18.
The conclusion is that 14 and 32 nm nanocubes should remain coherent during an entire absorption-
desorption cycle in the temperature range 295 to 350 K. This is however not the case for 65 and 110 nm
cubes. The 45 nm nanocube is a limiting case.
Supplementary Figure 18. Normalized total energy change Etotal associated with the generation of a misfit dislocation at 295 and 350 K for various nanocube sizes. The -PdH shell thickness is necessarily smaller than (L/2 – t).
It is interesting to explore the temperature dependence of Etotal for a given size of nanocube (see
Supplementary Fig. 19). As an example we take a 65 nm nanocube. Below approximately 425 K we find
that it is energetically favourable to generate a dislocation loop, however, above this temperature the
transition should remain coherent. This suggests that above 425 K the hysteresis is large and equal to the
full spinodal hysteresis while below 425 K the nucleation of a dislocation introduces incoherency and,
consequently, stress release and a smaller hysteresis. This explains the trend observed in the scaling-law
plot of Fig. 4 in the MT. At temperatures closer to the critical temperature, i.e., when Tc / T approaches 1
© 2015 Macmillan Publishers Limited. All rights reserved

38
the hysteresis tends towards the full spinodal hysteresis. This tendency is even seen for bulk Pd where the
deviation from full spinodal hysteresis close to Tc increases drastically with decreasing temperature (see
Supplementary Fig. 6a). This confirms an early suggestion by Flanagan and Oates40.
Supplementary Figure 19. Temperature dependence of the total energy change Etotal associated with the presence of a misfit dislocation loop for a 65 nm nanocube obtained from equations (S2), (S4) and (S5) in ref. 5 and concentration calculations similar to those presented in Supplementary Fig. 17b.
Supplementary Figure 20. Comparison of experimental hysteresis (black triangles) and hysteresis calculated with the mean-field model using the same parameters as in Fig. 5 in the MT. The temperature is 333 K.
© 2015 Macmillan Publishers Limited. All rights reserved

39
It is important to point out that in Fig. 4 of the MT the data of Wadell2 and Syrenova et al.4 are plotted by
associating a critical temperature according to the empirical expression Tc = 566 - 2831/L (see
Supplementary Fig. 7). This was necessary because no accurate Tc values could be derived from Wadell’s
data2 and because Syrenova et al.4 measured absorption isotherms of 17 to 65 nm nanocubes at
temperatures between 303 and 333 K while desorption could only be measured at 333 K. We can,
however, compare their data directly with the predictions of our mean-field model without the need for
Tc values. As depicted in Supplementary Fig. 20 the measured hysteresis for nanocubes smaller than
35 nm is essentially equal to full-spinodal hysteresis while larger nanocubes have gradually smaller
hystereses. This suggests that dislocations are generated to relieve stresses in larger nanoparticles.
14 Metal-organic framework coated Pd nanocubes
Electron transfer was recently invoked by Li et al.41 to explain the enhanced H concentration in their
HKUST-1 coated 10 nm Pd nanocubes. Following this suggestion, we calculate the pressure composition
isotherms of a 10 nm nanocube with a larger -parameter in equation (S37), namely = 2.1 instead of
= 1.0648 for bulk Pd and for all calculations presented so far. The higher value of the parameter can be
associated with a lowering of the Fermi energy in the core of the Pd nanocube. This would happen if
electrons were extracted from Pd by the metal-organic framework (MOF) coating.
This follows directly from the results of Feenstra et al.26 on bulk PdHx where it is shown that the repulsive
electronic H-H interaction is related to the Fermi energy
1( ) (0) ( )F F electE x E H x (S85)
with EF given in eV and Helect in J/molH. The parameter = 29,620 J/molH/eV is the same for all transition
metal hydrides30. A lowering of the Fermi energy by, for example, the MOF layer, implies that more
hydrogen atoms need to be added to fill the d-band of Pd. With a surface-shell site enthalpy of
-14,000 J/molH the calculated p-c isotherms reproduce the observed influence of the MOF layer on H
absorption. As the reported value41 H/Pd = 0.87, determined volumetrically at 1 bar, is quite different from
H/Pd = 0.71 corresponding to the X-ray lattice spacing data41 we chose to reproduce an intermediate
value, H/Pd = 0.8 at 1 bar with our model pressure-composition isotherm (see Supplementary Fig. 21).
© 2015 Macmillan Publishers Limited. All rights reserved
40
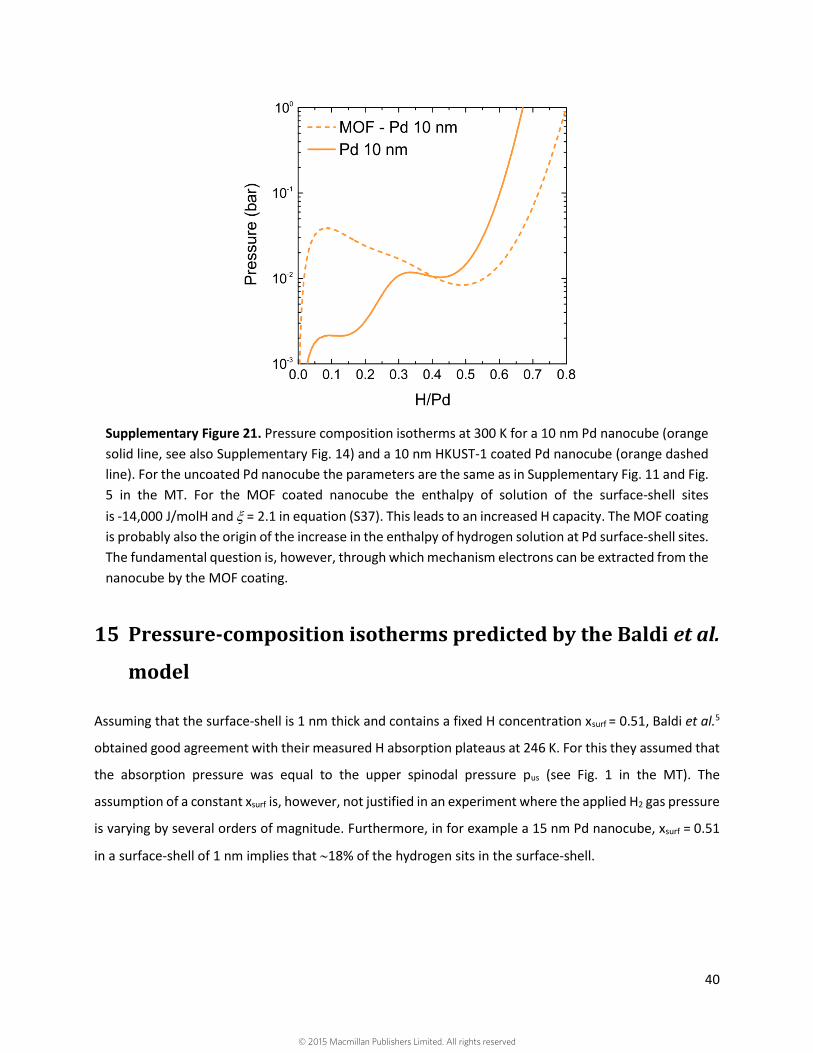
Supplementary Figure 21. Pressure composition isotherms at 300 K for a 10 nm Pd nanocube (orange solid line, see also Supplementary Fig. 14) and a 10 nm HKUST-1 coated Pd nanocube (orange dashed line). For the uncoated Pd nanocube the parameters are the same as in Supplementary Fig. 11 and Fig. 5 in the MT. For the MOF coated nanocube the enthalpy of solution of the surface-shell sites is -14,000 J/molH and = 2.1 in equation (S37). This leads to an increased H capacity. The MOF coating is probably also the origin of the increase in the enthalpy of hydrogen solution at Pd surface-shell sites. The fundamental question is, however, through which mechanism electrons can be extracted from the nanocube by the MOF coating.
15 Pressure-composition isotherms predicted by the Baldi et al.
model
Assuming that the surface-shell is 1 nm thick and contains a fixed H concentration xsurf = 0.51, Baldi et al.5
obtained good agreement with their measured H absorption plateaus at 246 K. For this they assumed that
the absorption pressure was equal to the upper spinodal pressure pus (see Fig. 1 in the MT). The
assumption of a constant xsurf is, however, not justified in an experiment where the applied H2 gas pressure
is varying by several orders of magnitude. Furthermore, in for example a 15 nm Pd nanocube, xsurf = 0.51
in a surface-shell of 1 nm implies that 18% of the hydrogen sits in the surface-shell.
© 2015 Macmillan Publishers Limited. All rights reserved

41
Supplementary Figure 22. Pressure-composition isotherms at 246 K according to the Baldi et al.5 model which is based only on equation (S73) with γ = 0.24 and xsurf = 0.51 in equation (S75). In contrast with Fig. 5e in the MT, the x-axis represents the total hydrogen concentration xtotal defined in equation (5) of the MT.
Supplementary Figure 23. Pressure composition isotherms of a 14 nm Pd nanocube as predicted by the Baldi et al.5 model using the same parameters as in Supplementary Fig. 22.
As the isotherms in Fig. 5 of the MT do not exhibit the presence of this amount of hydrogen, one must
conclude that their experimental method, EELS, with a beam diameter of 7 nm does not sense H in the
© 2015 Macmillan Publishers Limited. All rights reserved
42
surface-shell region for nanocubes with L > 13 nm. Although Baldi et al.5 obtained a good agreement
between their absorption plateau pressures and the calculated upper spinodal pressures, their model
predicts critical temperatures that are much higher than those determined from the data of Bardhan et
al.1 This is explicitly shown in Supplementary Fig. 23 for a 14 nm nanocube. The critical isotherm is at 503
K instead of Tc ≈ 441 K, found in Supplementary Section 5.2.
References
1. Bardhan, R. et al. Uncovering the intrinsic size dependence of hydriding phase transformations in nanocrystals. Nature Mater. 12, 905–912 (2013).
2. Wadell, C. Plasmonic Nanostructures for Optical Absorption Engineering and Hydrogen Sensing. PhD Thesis, Chalmers University of Technology, Sweden (2015).
3. Wadell, C. et al. Thermodynamics of hydride formation and decomposition in supported sub-10nm Pd nanoparticles of different sizes. Chem. Phys. Lett. 603, 75–81 (2014).
4. Syrenova, S. et al. Hydride formation thermodynamics and hysteresis in individual Pd nanocrystals with different size and shape. Nature Mater. in press (2015). DOI:10.1038/nmat4409
5. Baldi, A., Narayan, T. C., Koh, A. L. & Dionne, J. A. In situ detection of hydrogen-induced phase transitions in individual palladium nanocrystals. Nature Mater. 13, 1143–1148 (2014).
6. Yamauchi, M., Ikeda, R., Kitagawa, H. & Takata, M. Nanosize Effects on Hydrogen Storage in Palladium. J. Phys. Chem. C 112, 3294–3299 (2008).
7. Züttel, A. et al. Thermodynamic aspects of the interaction of hydrogen with Pd clusters. Appl. Surf. Sci. 162, 571–575 (2000).
8. Sachs, C. et al. Solubility of hydrogen in single-sized palladium clusters. Phys. Rev. B 64, 075408 (2001).
9. Manchester, F. D. Phase Diagrams of Binary Hydrogen Alloys. (ASM International, 2000).
10. Pundt, A. & Kirchheim, R. HYDROGEN IN METALS: Microstructural Aspects. Annu. Rev. Mater. Res. 36, 555–608 (2006).
11. Lässer, R. & Klatt, K. H. Solubility of hydrogen isotopes in palladium. Phys. Rev. B 28, 748–758 (1983).
12. Picard, C., Kleppa, O. J. & Boureau, G. A thermodynamic study of the palladium–hydrogen system at 245–352 °C and at pressures up to 34 atm. J. Chem. Phys. 69, 5549 (1978).
© 2015 Macmillan Publishers Limited. All rights reserved
43
13. Ribaupierre, Y. de & Manchester, F. D. Experimental study of the critical-point behaviour of the hydrogen in palladium system. I. Lattice gas aspects. J. Phys. C Solid State Phys. 7, 2126–2139 (1974).
14. Ribaupierre, Y. de & Manchester, F. D. Experimental study of the critical-point behaviour of the hydrogen in palladium system. III. Spinodal curves and isotherm relations. J. Phys. C Solid State Phys. 8, 1339–1348 (1975).
15. Pivak, Y. et al. Effect of the substrate on the thermodynamic properties of PdHx films studied by hydrogenography. Scr. Mater. 60, 348–351 (2009).
16. Weissmüller, J. & Lemier, C. On the size dependence of the critical point of nanoscale interstitial solid solutions. Philos. Mag. Lett. 80, 411–418 (2000).
17. Zorić, I., Larsson, E. M., Kasemo, B. & Langhammer, C. Localized Surface Plasmons Shed Light on Nanoscale Metal Hydrides. Adv. Mater. 22, 4628–4633 (2010).
18. Zhdanov, V. P., Zorić, I. & Kasemo, B. Plasmonics: Heat transfer between metal nanoparticles and supporting nanolayers. Phys. E Low-Dimensional Syst. Nanostructures 46, 113–118 (2012).
19. Baffou, G. & Quidant, R. Nanoplasmonics for chemistry. Chem. Soc. Rev. 43, 3898–907 (2014).
20. Maier, S. A. Plasmonics: Fundamentals and Applications. (Springer, 2007).
21. Brodowsky, H. On the non-ideal solution behavior of hydrogen in metals. Berichte der Bunsengesellschaft für Phys. Chemie 76, 740–746 (1972).
22. Wicke, E., Brodowsky, H. & Züchner, H. in Hydrogen in Metals II: Application-Oriented Properties (Alefeld, G. & Völkl, J.) 29, 73–155 (Springer Berlin Heidelberg, 1978).
23. Wicke, E. & Blaurock, J. New experiments on and interpretations of hysteresis effects of Pd-D2 and Pd-H2. J. Less Common Met. 130, 351–363 (1987).
24. Salomons, E., Griessen, R., De Groot, D. G. & Magerl, A. Surface Tension and Subsurface Sites of Metallic Nanocrystals Determined from H-Absorption. Europhys. Lett. 5, 449–454 (1988).
25. Hemmes, H., Salomons, E., Griessen, R., Sänger, P. & Driessen, A. Lattice-gas model for the formation of palladium-silver hydrides at pressures up to 100 GPa. Phys. Rev. B 39, 10606–10613 (1989).
26. Feenstra, R., Griessen, R. & De Groot, D. G. Hydrogen induced lattice expansion and effective H-H interaction in single phase PdH. J. Phys. F Met. Phys 16, 1933–1952 (1986).
27. Salomons, E., Hemmes, H. & Griessen, R. Hydrogen spectroscopy of Pd1-yAgy and Pd1-yCuy alloys. J. Phys. Condens. Matter 2, 817–834 (1990).
28. Pasquini, L. et al. Hydride destabilization in core-shell nanoparticles. Int. J. Hydrogen Energy 39, 2115–2123 (2014).
© 2015 Macmillan Publishers Limited. All rights reserved

44
29. Rockenberger, J. et al. The contribution of particle core and surface to strain, disorder and vibrations in thiolcapped CdTe nanocrystals. J. Chem. Phys. 108, 7807–7815 (1998).
30. Griessen, R. & Driessen, A. Heat of formation and band structure of binary and ternary metal hydrides. Phys. Rev. B 30, 4372–4381 (1984).
31. Dong, W., Ledentu, V., Sautet, P., Eichler, A. & Hafner, J. Hydrogen adsorption on palladium: A comparative theoretical study of different surfaces. Surf. Sci. 411, 123–136 (1998).
32. Wilde, M., Matsumoto, M., Fukutani, K. & Aruga, T. Depth-resolved analysis of subsurface hydrogen absorbed by Pd(100). Surf. Sci. 482-485, 346–352 (2001).
33. Fukai, Y. The Metal-Hydrogen System Basic Bulk Properties. Springer Ser. Mater. Sci. (Springer-Verlag, 2005).
34. Miedema, A. R. Surface energies of solid metals. Zeitschrift für Met. 69, 287 (1978).
35. Tyson, W. R. & Miller, W. A. Surface free energies of solid metals: Estimation from liquid surface tension measurements. Surf. Sci. 62, 267–276 (1977).
36. Gremaud, R., Baldi, A., Gonzalez-Silveira, M., Dam, B. & Griessen, R. Chemical short-range order and lattice deformations in MgyTi1-yHx thin films probed by hydrogenography. Phys. Rev. B 77, 1–10 (2008).
37. Fan, F. R. et al. Epitaxial growth of heterogeneous metal nanocrystals: From gold nano-octahedra to palladium and silver nanocubes. J. Am. Chem. Soc. 130, 6949–6951 (2008).
38. Jin, M. et al. Copper can still be epitaxially deposited on palladium nanocrystals to generate core-shell nanocubes despite their large lattice mismatch. ACS Nano 6, 2566–2573 (2012).
39. Schwarz, R. B. & Khachaturyan, A. G. Thermodynamics of open two-phase systems with coherent interfaces: Application to metal-hydrogen systems. Acta Mater. 54, 313–323 (2006).
40. Flanagan, T. B. & Oates, W. . The effect of hysteresis on the phase diagram of Pd-H. J. Less Common Met. 92, 131–142 (1983).
41. Li, G. et al. Hydrogen storage in Pd nanocrystals covered with a metal-organic framework. Nature Mater. 13, 802–806 (2014).
© 2015 Macmillan Publishers Limited. All rights reserved