Embed Size (px)
Citation preview

Senior Design Project
Project Written Report
Prepared for: Dr. David Bowen
California State University, East Bay
Hayward, California 94542
Prepared by:
Ahmad Alshehri, Abdulaziz Binfares, Justin Serranzana & Noman Arif
Students of ENGR 4620
Engineering Department
California State University, East Bay
Hayward, California 94542
1

June 4, 2015
Executive Summary
The main objective of our study at Therm-x was to reduce the time it takes to kit parts in their
warehouse. To improve the kitting process, we would need to propose a barcode system, reduce
fatigue upon employees, and redesign certain aspects of the warehouse. A Pro-model simulation will
help to find which station is the most inefficient and propose several solutions to increase output in
the kitting process. A barcode scanner system can also improve efficiency within the warehouse by
decreasing the time at “the issuing” station. Our team will utilize the 5S methodology and a storage
method to reorganize the shelving, so that the warehouse becomes safer and more efficient.
The kitting process involves the employees gathering parts needed for a work order. One
main problem occurring is that parts needed are scattered throughout the warehouse among shelves
and some work orders require the use of measured and cut wires. Sometimes the parts are not in their
location and the work order gets put on hold until the part is reordered causing a delay in the process.
By implementing our designs the warehouse can prevent delays and improve the speed of the kitting
process.
A new redesign of the shelf labels as well as layout will benefit the workers by allowing them
to locate parts faster and organize the shelf layout. With proposed a barcode scanner, Therm-x can
eliminate one station from their warehouse and still increase production time.
2

Table of Contents1. Introduction..........................................................................................................5
1.1 Company Background...................................................................................5
1.2 Mission Statement.........................................................................................5
1.3 Project Mission Statement.............................................................................6
2. Process.................................................................................................................6
2.1 Process Flow Diagram & Warehouse Layout...............................................6
Figure 2.1.........................................................................................................7
Figure 2.2a.......................................................................................................8
Figure 2.2b.......................................................................................................9
2.2 Pro-model Simulation....................................................................................9
Table 2.1........................................................................................................10
Figure 2.3.......................................................................................................11
Table 2.2........................................................................................................12
3. Methods.............................................................................................................12
3.1 Redesign Shelves.........................................................................................12
Figure 3.1.......................................................................................................13
Figure 3.2.......................................................................................................14
Table 3.1a......................................................................................................15
Table 3.2........................................................................................................16
Table 3.3........................................................................................................17
3.2 Implement a Wire Spool Station:…………………………………………….………...17
Figure 3.4a.....................................................................................................18
Figure 3.5a.....................................................................................................19
Table 3.4........................................................................................................20
Table 3.5........................................................................................................20
3.3 Implement a Barcode System......................................................................21
Figure 3.6.......................................................................................................22
Figure 3.7.......................................................................................................23
Table 3.6........................................................................................................25
Table 3.7........................................................................................................25
3

4. Analysis.............................................................................................................26
4.1 Cost Analysis:……………………………………………………………………….....26
Table 4.1........................................................................................................26
Figure 4.2.......................................................................................................27
Figure 4.3.......................................................................................................28
Table 4.2........................................................................................................28
4.2 Break-Even Analysis...................................................................................29
Figure 4.4.......................................................................................................29
4.3 Production Analysis.....................................................................................30
Table 4.3........................................................................................................30
Table 4.4........................................................................................................31
5. Conclusion.........................................................................................................32
6. Appendix............................................................................................................33
Table 6.1........................................................................................................33
Table 6.2........................................................................................................34
Table 6.3........................................................................................................35
Table 6.4........................................................................................................36
Figure 6.1.......................................................................................................37
Figure 6.2.......................................................................................................38
7. References..........................................................................................................39
4

1. Introduction
1.1 Company Background
Established in 1983, Therm-x eventually became a leader in advanced temperature and
process control systems, and customizing parts for specific applications to support the evolving
temperature management needs of clients, who envision innovative process solutions. They are
known to serve markets involving semiconductor and electronic equipment, alternative energy,
medical/biotech, defense/aerospace, petrochemical and even food/beverages.
Therm-x has continued to develop advanced staffing, tools for design, and analysis of
customer requirements, as well as sophisticated manufacturing capabilities to support design,
production, test and delivery of temperature and process control systems for their customers.
With all these new technologies, they branched off with their low cost region strategic partner
Therm-x SVT, located in Vietnam, which is their outsource solution for higher volume, lower
cost requirements with a quality system developed in the United States.
1.2 Mission Statement
Therm-x takes pride in delivering thermal solutions incorporating our vertical integration
capabilities including: Thermal Design and Test, CNC Machining, Metal Joining & Sheet Metal
Manufacturing. Therm-x’s goal is to develop into one of the leading manufacturers producing
and supplying these products both domestically and Vietnam.
5

1.3 Project Mission Statement
Our mission is To increase the employee's efficiency in the warehouse by making a
recommendation for implementing a barcode system, wire carousel, fixed storage location, and
utilize 5S methodology, which will lead to a decrease in the overall kitting process time.
2. Process:
During our first visit to the warehouse, our team was able to get an overview of the main
process in the warehouse, which is the kitting process. Our clients introduced us to the
employees in the warehouse where we found that there were six employees in the area of study.
Five of the six employees were kitters and one was an issuer. Before we were able to start
observing and analyzing the process, we had to have a safety training which was giving by
Therm-x safety department. However, after we finished that training, we started going inside the
warehouse and observe the process and understand it more clearly. We spent hours and hours in
order to identify the drawbacks in the main kiting process that needs improvements.
2.1 Process Flow Diagram & Warehouse Layout
After our observation of the kitting process, our first step was to create a process flow
diagram for the kitting process as shown in Figure 2.1. The process flow diagram helps us
identify the step by step process of the kitting process, and also helps identify areas that need
more focus than others.
6

Figure 2.1 Process flow chart (Current)
In Figure 2.1, we can see the process flow of the kitting process starting with receiving
the order and finishing with the issuer. The issuer’s responsibility is to issue the finished work
order and update the ERP system manually, part by part. The yellow line refers to the
uncompleted work-order bin due to missing parts that need to be ordered. The blue line refers to
the completed work-order bin that has all the needed parts in it and is ready to be shipped. Once
7

we had characterized the process flow, we were able to proceed with taking times and
measurements.
Then, we were able to create 2D and 3D warehouse layouts to help us analyze the current
design, and get a better picture of the work site as shown in Figure 2.2a & Figure 2.2b.
Figure 2.2a Current warehouse layout, two-dimensional
8

Figure 2.2b Current warehouse layout, three-dimensional
After that, we started collecting data for a time study of the process in order to identify
the aspects that need improvement. We visited Therm-x multiple times to observe the kitting
process. We also spoke to the workers in the warehouse regarding the kitting process to
determine what they like and do not like in their work process and environment. All the resultant
data and analyses would be discussed in the following sections.
2.2 Pro-model Simulation:
A simulation program is a tool that helps to find the specific areas that delay a process
and then provides a platform to test potential fixes. The program will also run a small simulation
of the real time work that would happen in the workplace, giving us an estimate on how much is
produced, where the bottlenecks are, and which locations should be more or less utilized to help
organize the workflow and optimize the warehouse.
9

Additionally, we determined it would be most beneficial to simulate the most common
three work orders that come into the warehouse to be kitted. To know those three parts we asked
our client to provide us with their production history, which can be found in Table 2.1. We also
questioned workers in the warehouse department about the most common three orders. With the
help of the workers and data we gathered from them, we found the most common work orders in
the warehouse to be the: Water Box, Filter Box, and MESA.
Table 2.1 Actual production history
We analyzed three kits by tracking its movements from station to station and recording
the lead-time in each station. We completed our time studies and collected all the needed data to
start building the simulation. While collecting data for simulation we noticed that the issuer
station was taking the longest time in the process.
10

Figure 2.3 Simulation logical model
Subsequently, we started simulating the work process with all collected data for the three
work orders. Running the simulation program for 250 days/year, 8hrs/day, with 5 kitters, and 1
issuer, as shown in Figure 2.3. Then we got the result from simulation for the process time and
average time in system for each work order. Our client has validated this as a match of their
actual production time for each of the three work orders. For example, as Table 2.2 shows, the
average time in system for the Water Box is 279.73 min. This time include all the process in
system including the queuing time as well.
11

Table 2.2 Summary of simulation results (Current)
Later, we report results of running the simulation program based on prototypes for each
proposed design separately to determine how much our design will improve the process of
kitting and how much throughput can be increased.
3. Methods:
3.1 Redesign Shelves
We have noticed that there are cramped work spaces that obstruct workers and make
kitting process an issue because of lack of organization. Workstations need more space for
workers to organize the gathered parts and to move freely. Finding parts for their order has
become an additional issue, since there are multiple parts in each box in each shelf as it shows in
Figure 3.1. This issue causes each employee to consume extra time to look for the right part and
increases the probability of errors and mistakes during the kitting process. The current layout of
the shelves had many flaws that made the warehouse unorganized and thus, workers take longer
time to find the correct bin and make sure they pick the correct part.
12

Figure 3.1 Current shelf
From what we have observed, we were able to propose a new design of shelves to be
more convenient and ergonomic to the workers. In the new design, we followed 5S and fixed
methodologies to design our new shelves as shown in Figure 3.2.
13

Figure 3.2 Proposed shelf design
The new design organizes the boxes, so the parts are clearly labeled. These labels should
be durable and fixed in place. Also, we added arrow points for the labels of the shelves to
remove any doubt about which location the label is referring to. The boxes should contain only
one part and be organized so that the bigger boxes will be on the bottom while the small boxes
14

are located on the top. This would reduce workers’ stress and fatigue while picking the parts
from shelves. This recommendation meets the new warehouse specification.
Additionally, the new design includes a safety wire to prevent boxes from moving or
falling out of the shelves and also would make sure that all boxes are lined correctly in the
shelves. This will increase the safety and organization in the warehouse. We also used fixed
location storage method to design our new shelves and added numbers to each box. Numbers on
the boxes will refer to the location of the box on the shelf, in order, from left to right. So looking
at Table 3.1a, we can see how the current and Table 3.1b shows the new work order would look
like.
Table 3.1a Current WO label Table 3.1b Proposed WO label
Firstly, the current work order contains 3 digits, which refer to which shelf and rack the
parts are on. By having multiple boxes in each rack and multiple parts in each box, the time spent
on the process of gathering the parts is high. However, in this new design, the work order will
contain 4 digits for the location column. The fourth added digit refers to which box the required
15

part is in. For example, part XTMI123’s location would be written as “1B45”. The first three
digits, “1B4”, refer to the shelf “1B” and rack number “4”. The last digit which is “5” refers to
the fifth box on that shelf.
Applying the above recommendations on the shelves with a prototype, we found the time
spent in finding the parts decreasing. We got the decreased time for finding one part and
multiplied that time for the total parts in each work order. Then we programmed the simulation
based on the new times in finding the parts for work order.
From our proposed design simulation results in Appendix Table 3.2, which is
summarized as shown in Table 3.3. We found that there are improvements in the total exits for
each work order. Thus, the total production rate per day has increased by 18%.
Table 3.2 Current total exits method (1)
Moreover, applying the fixed location storage method would decrease the time spent on
gathering the parts. The decreased time for the three work orders can be shown in Table 3.3. For
example, the time spent on MESA work order was 225.23 min and with our new proposed
16

design, it decreased by 23.71 min, which is a saving of 10.5%. Finally, this new design benefits
the workers by helping them find items and parts more easily with less time possible.
Table 3.3 Proposed Total Exits Method (1)
3.2 Implement a Wire Spool Station:
Many work orders require wires of different sizes and lengths. As shown in Figure 3.3,
workers need to climb a ladder to retrieve the spools, carry the spool down to the cut station, and
replace the spool back on the shelves. This method takes too much time, energy, and travel
distance. In terms of safety, the current organization of
the spools on the shelves increases the chances of
potential injuries and hazards. Therefore, we have come
up with two different alternatives recommendations to
implement a wire spool carousel to reduce worker time
requirements, fatigue, and increase safety.
Figure 3.3 Wire spool shelves
17

● Alternative A (Automatic):
This wire spool carousel, as shown in Figure 3.4a & b, has an organized revolving vertical
storage system, which will come with a measurement and cutter attached to the machine to
prevent the worker from walking back and forth from the wire station. This would reduce the
amount of travel time per order and decrease fatigue for the workers. Also, this machine is safer
because it allows a worker to stay in the same place only having to push a button to revolve the
different spools to locate the specific wire needed.
Figure 3.4a Revolving wire spool Figure 3.4b Cutter and measurer
http://www.storevertical.com/products/vertical-storage-system/wire-carousel
18

● Alternative B (Manual):
The other alternative is a manually operated vertical wire carousel, which is our original
design as shown in Figure 3.5a & b. The workers would need to manually revolve a wheel on the
side to rotate the carousel to find the specific wire spool. Our design comes with ten racks that
can hold up to six spools each, so a total of sixty spools per carousel. With this alternative, it
eliminates the use of a ladder, and thus, the time it takes to retrieve the spools decreases as well
as fatigue.
Figure 3.5a Measurement for wire Figure 3.5b Measurement for wire
19

Applying our proposed recommendation by eliminating the ladder and having a wire
carousel with a prototype, we found the time spent retrieving the spools to be significantly
decreased with the carousels. We got the decreased time for finding one part and multiplied that
time for the spools required in each work order. Then we programmed the simulation based on
the new times spent on the work order, and got the result Table 6.1 in appendix.
The summary of the results as shown in the following Table 3.4 shows the decreased time
in the system for each work order. As an example, the time for water box work order has
decreased by 11.78 min. Therefore, both of these carousels would be beneficial to the warehouse
because it will reduce the time it takes to measure and cut a piece of wire.
Table 3.4 Current average time in system for method (2)
Also, from the simulation data, specifically for both proposed carousel recommendations, the
total production rate in the system has increased by 12.7 % as shown in Table 3.5 because with the wire
carousel, we are expecting to decrease the time for each work order.
Table 3.5 Current Total Exits for Method (2)
20

3.3 Implement a Barcode System
Considering the results of the simulation program as well as the workers' feedback, we
determined that the issuer station takes a long time to update the ERP system. We recommend
adding a barcode system to help Therm-x increase their efficiency in the warehouse. Our
research produced two alternatives for implicating the barcode system, which are both capable
with SAGE 100, the current ERP system.
Since we are proposing to implement a barcode scanner, we can eliminate the “Issuer
Station”, and all the time it takes for each work order. The barcode scanner would update the
ERP system right when the workers gather the parts and thus, eliminate the issuer’s job. The
process flow in this case would be altered since the issuer will be eliminated as shown in Figure
3.6.
21
Figure 3.6 Proposed process flow chart
22

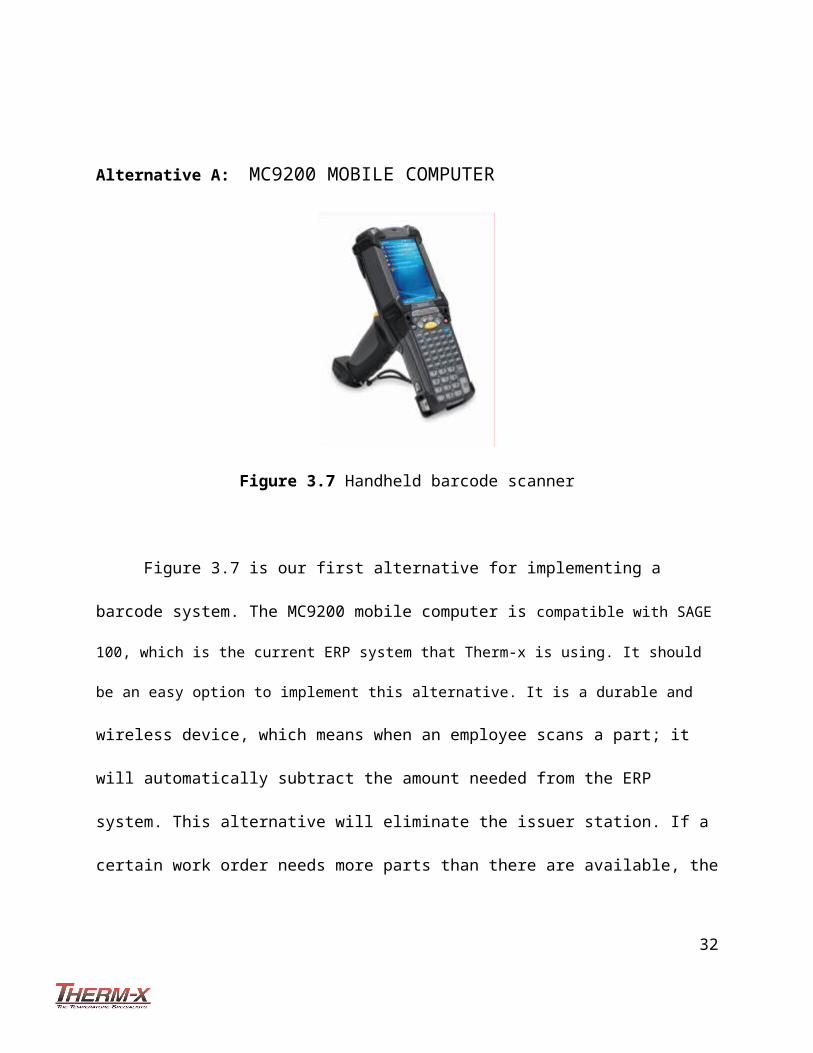
Alternative A: MC9200 MOBILE COMPUTER
Figure 3.7 Handheld barcode scanner
Figure 3.7 is our first alternative for implementing a barcode system. The MC9200
mobile computer is compatible with SAGE 100, which is the current ERP system that Therm-x is using.
It should be an easy option to implement this alternative. It is a durable and wireless device, which
means when an employee scans a part; it will automatically subtract the amount needed from the
ERP system. This alternative will eliminate the issuer station. If a certain work order needs more
parts than there are available, the worker could check with the supplier department and not start
on that work order until all the parts are received. This will save time since the operator knows
that before he starts to gather the parts, not all parts are currently available.
23

Alternative B: App Barcode Scanner
To propose the mobile application, we had to design and prototyped the User Interface to
show get a quote on the cost to build the whole application. We also show the functionality of
the application to our clients, so they can visualize the app and offer suggestions.
Using a mobile application overcomes many potential constraints. For example, mobile
phones have sufficient RAM and hard drive capacities and therefore can run necessary software.
Mobile phones have multiple functionalities and also can meet all the requirements Therm-x
needs currently, and any future implementations. The software can add non-barcode related
functions to the application for better customization to better fulfill the current and future needs
of Therm-x. Financially, the mobile application has a greater cost initially but as the team grows,
the cost does not change for the mobile application.
The mobile application can be programmed to be compatible with the ERP system, Sage-
100. The application features:
● Live inventory
● Location of parts
● Quantity needed to complete the order
● Order unavailable or missing parts
● Image of the part needed
● Print labels
● Customize additional features that can be added later.
24

As an analysis of this implementation, we reprogrammed the simulation with eliminating
the issuer station and the time it takes. The result of the simulation is shown in table 3.6. It shows
the decreased time per work order after eliminating the issuer and replacing it with proposed
barcode scanner. Taking part MESA as an example, we expect to save 62.62 minutes per work
order which is a saving of 27.8% in the average time MESA takes.
Table 3.6 Proposed average time in system method (3)
Also, we can conclude from our simulation results that our applied improvements in the
whole warehouse affected the production positively. From Table 3.7 , we can see the total
production rate in the system expect to increase by 94.4 % by replacing the issuer with a barcode
scanner.
Table 3.7 Proposed total time exits method (3)
25

4. Analysis
4.1 Cost Analysis:
After researching our recommendations, we have calculated and provided the cost
analysis for our proposed designs. We are using 5 years as the time period, MARR at 10%, and
not incorporating depreciation or tax. Starting with the two wire spool carousel designs, The
estimated cost for the automatic carousel is between $20,000 - $25,000, while the estimated cost
of the manual carousel is between $5,000 - $10,000. Although both carry the same load of
spools, the automatic carousel has more maintenance than the manual one. However, the manual
carousel takes more physical effort, which can create fatigue. The following Table 4.1 are
summarizing and comparing these two alternatives.
Table 4.1 Summary for method (2)
26

By implementing the barcode scanners we eliminate the issuer, and thus Therm-x would
benefit by eliminating the cost of the issuer. For our recommendations for the barcode scanner,
we had to do a cost analysis for both alternatives to help Therm-x in making decisions.
Alternative A: Barcode Scanner Cash-flow diagram
Figure 4.2 Cash flow diagram for alternative A
The cost of one barcode scanner is approximately $2,300 with a warranty of $300 each.
Currently, each of the 5 workers will need a scanner, so the initial cost is estimated to be
$11,500, as shown in Figure 4.2. There no maintenance fee, no recurring cost, just a one-time
cost to purchase the scanner. However, it will require some training for employees to understand
the entire functionality of the scanner.
27
Alternative B: Mobile Application
Figure 4.3 Cash flow diagram for alternative B
The cost in building a mobile application is between $30,000 - $40,000. There is a
recurring maintenance cost of $7,500 plus $500 for hosting cost, every year, as shown in Figure
4.3. The mobile app can have unlimited users, which requires little to no training, and any new
functionality can be added with updates to meet Therm-x’s requirements. Table 4.2 below is a
summary of the two alternatives.
Table 4.2 Comparison between alternative A and alternative B
28

4.2 Break-Even Analysis
Here is the break-even analysis for barcode scanner alternatives. If Therm-x decides that
no more than 15 workers will ever be in the warehouse, then Therm-x should go with Alternative
A, Motorola MC9200. Otherwise, Therm-x should go with Alternative B, creating a mobile
application. The Figure 4.4 shows the break-even point for these two proposed alternative is at
15 mobile computers.
29

Figure 4.4 Break-even point for method (3)
4.3 Production Analysis
In table 4.3 shows the production rate of the current vs proposed designs, and the work order cost
for Therm-x. Assuming the workers in the warehouse are getting paid $30/hour (wages plus benefits
included), and working for 8 hours a day, and for 260 days a year. We have assumed the issuer will be
counted only in methods 1 and 2 and not in method 3. We build the following calculation based on these
assumptions.
Table 4.3 Production analysis
Accordingly to table 4.3, Therm-x’s cost of employee per day is at $1,440 (wage plus benefits
included). To Figure out the cost of each work order per day is to divide the employee’s wages by total
30

exit. This gives us our current cost per work order at $115.75. To calculate the total production
capabilities, we multiplied the total work order produce per day by the amount of work days, which will
gives us 3,234.40. Looking at the first method, based on simulation, we expect to increase daily
production rate to 14.68 per day. As a result, we expect to reduce the work order cost to $98.09.
Our second method, based on simulation, we expect to increase daily production rate to 14.08 per
day. And as a result, we expect to reduce our work order cost to $102.71. Our third and last method, we
decreased the production rate to $24.18. We eliminated the issuer, which decreased the cost of a single
work order and based on simulation, increased our work order to 6,286.80 work orders per year.
Table 4.4 Cost analysis
Accordingly to table 4.4, the total cost currently is calculated by total work order produced per
year multiplied by the cost to produce one work order is at $374,355.50 per year. We are assuming the
same production capabilities as the current process so we can see the actual savings using our proposed
work order prices. Following the same calculation method, we calculated the total savings per each
31
proposed methods. Method three shows the most savings because it increases the total work order
produced in a year and eliminated the issuer’s job position.
5. Conclusion:
To summarize this project, we figured out the main problem in the warehouse; the issuer and the
shelf layout. We collected data from the most frequently kitted parts, Water Box, MESA, and Filter Box,
and simulated the kitting process, and then analyzed it. The issuer takes a long time to update the ERP
system, which we recommend to eliminate because of the proposed barcode scanner.
Another problem we wanted to solve was to reorganize the shelving layout. We wanted to
eliminate fatigue and create a safe work environment for the workers by designing a new shelf design that
followed 5S methodology and fixed storage method. This will not only eliminate stress, but also increase
accuracy and decrease the time spent in gathering items.
We also want to recommend a wiring spool carousel. Currently, some spools are located up high
on the shelf and others are located on the bottom. Workers might have to get a spool from the top of the
shelf, where he or she has to grab a ladder to bring the spool down. Not only is this tiresome, it creates a
safety hazard and is prone to injuries. What we recommend is a carousel (containing maximum of 60
spools) so that an employee does not need to bring the spool down, rather just turn the whole carousel and
have the spool be brought to the worker where they can cut the wire needed. This will reduce the
employee's fatigue, increase safety, and speed up the process. Finally, we simulated each proposed
method separately to see individually how each method improved the kitting process. This can be shown
in Tables 6.2, 6.3, 6.4
32

6. Appendix:
Table 6.1 Simulation results for the current kitting process
33

Table 6.2 Simulation results for proposed method (1)
34

Table 6.3 Simulation results for proposed method (2)
35

Table 6.4 Simulation results for proposed method (3)
36

Figure 6.1 Lack of organization at workstation
37

Figure 6.2 Ladder issue (Spools area)
38

7. References
"Barcode Scanners." Zebra Technologies. N.p., n.d. Web. May 2015.
"How to Label Inventory Locations - Clearly Inventory." How to Label Inventory Locations –
Clearly Inventory. Web. May 2015.
."Vidir Vertical Storage Solutions." Automated Storage & Retrieval Storage System & Vertical
Carousels. N.p., n.d. Web. May 2015.
"Vidir Wire Carousel." YouTube. YouTube, n.d. Web. May 2015.
39
![[MS-RPL]: Report Page Layout (RPL) Binary Stream Format€¦ · MS-RPL] —. stream report. report page. report report report](https://img.pdfslide.net/doc/110x75/5fd9f7a7a90b7c34145fa364/ms-rpl-report-page-layout-rpl-binary-stream-format-ms-rpl-a-stream-report.jpg)