Embed Size (px)
Citation preview
These views are my own and do not necessarily represent the views of the Federal Reserve Bank of New York or the Federal Reserve System
Underestimating Insurance Risk:The FHA Case
Andrew Caplin, Anna Cororaton, Joseph TracyUCLA Ziman Center/Economics ConferenceApril 29 & 30, 2011
.
• FHA is intended to be self-financing• Each FHA mortgage carries a credit guarantee
• FHA’s Mutual Mortgage Insurance Fund (MMIF) covers any credit losses
• minimum capital of 2% of insurance-in-force
• FHA charges borrowers guarantee fees which fund the MMIF
• up-front fee which is typically financed in the balance
• annual fee• Annual external audit of MMIF to assess funding level• Conducted by Integrated Financial Engineering (IFE)
• 2010 audit - $2.72b, which is below the 2% level
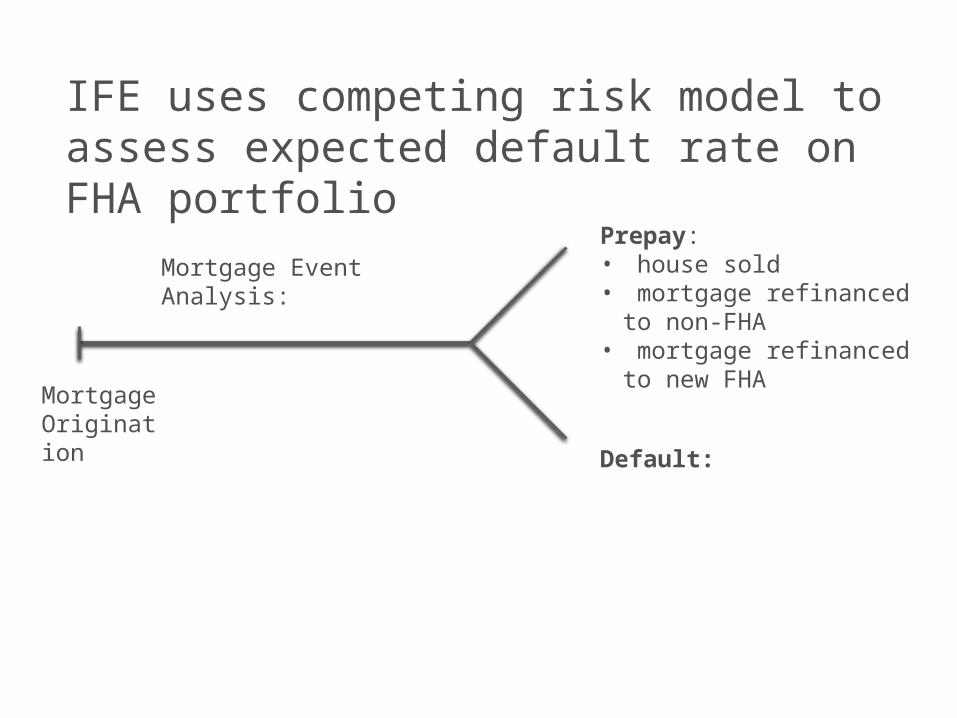
IFE uses competing risk model to assess expected default rate on FHA portfolio
MortgageOrigination
Prepay:• house sold• mortgage refinanced to
non-FHA• mortgage refinanced to
new FHA
Default:
Mortgage Event Analysis:
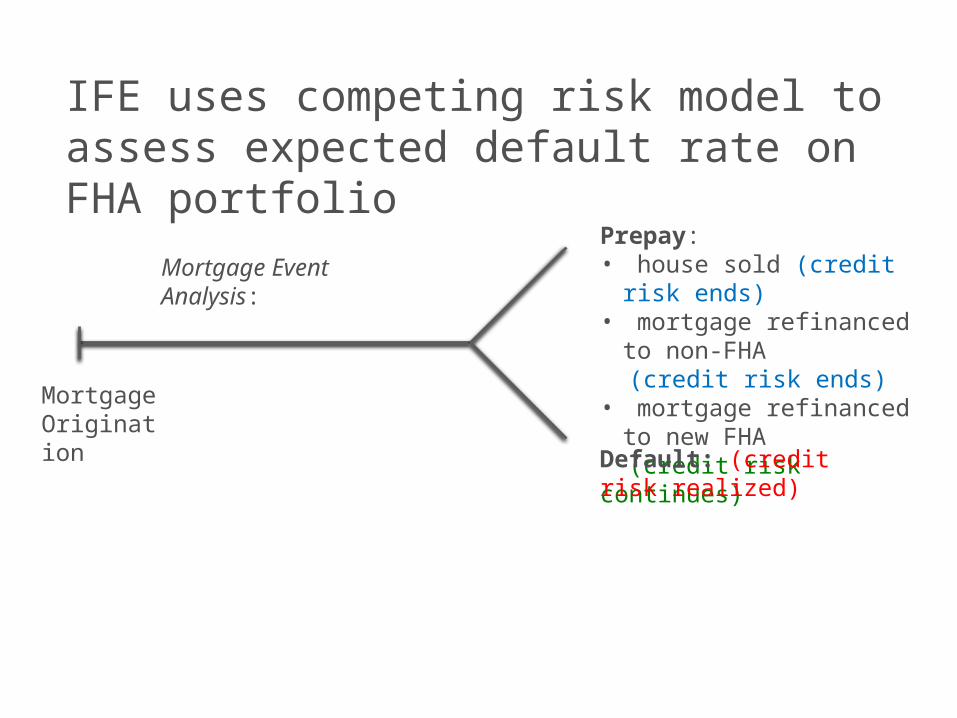
IFE uses competing risk model to assess expected default rate on FHA portfolio
MortgageOrigination
Prepay:• house sold (credit risk
ends)• mortgage refinanced to
non-FHA (credit risk ends)• mortgage refinanced to
new FHA (credit risk continues)Default: (credit risk realized)
Mortgage Event Analysis:
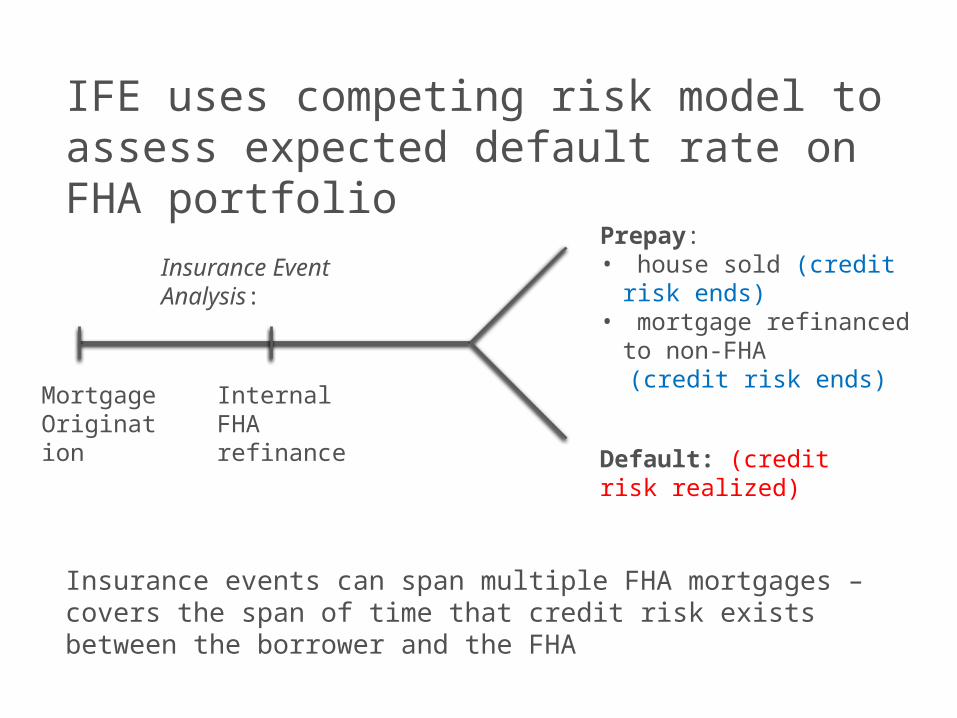
IFE uses competing risk model to assess expected default rate on FHA portfolio
MortgageOrigination
Prepay:• house sold (credit risk
ends)• mortgage refinanced to
non-FHA (credit risk ends)
Default: (credit risk realized)
Insurance Event Analysis:
Internal FHA refinance
Insurance events can span multiple FHA mortgages – covers the span of time that credit risk exists between the borrower and the FHA
CoreLogic Linked FHA Data:
• FHA originations from 2007 to 2010 Q3• For each FHA origination that was a refinance, CoreLogic
searched its deeds records to see if there was a preceding FHA mortgage.• Currently, our linked FHA data are only 2 mortgages
long• CoreLogic is working on extending the chains
• CoreLogic also provided a random sample of purchase mortgages and refinances from non-FHA mortgages
• Built a random sample by working backwards in time• For 2010, randomly select a k% sample based on FHA
published data on each origination type• If we select in a linked FHA refinance, we bring in its
prior FHA mortgage as well• Repeat for 2009, 2008 and 2007 – adjust the count of
each type of origination that we need based on FHA linked loans that have been pulled in for that year
• Selected the largest value of k where we did not run short of any type or origination in any year – 4.5% sample
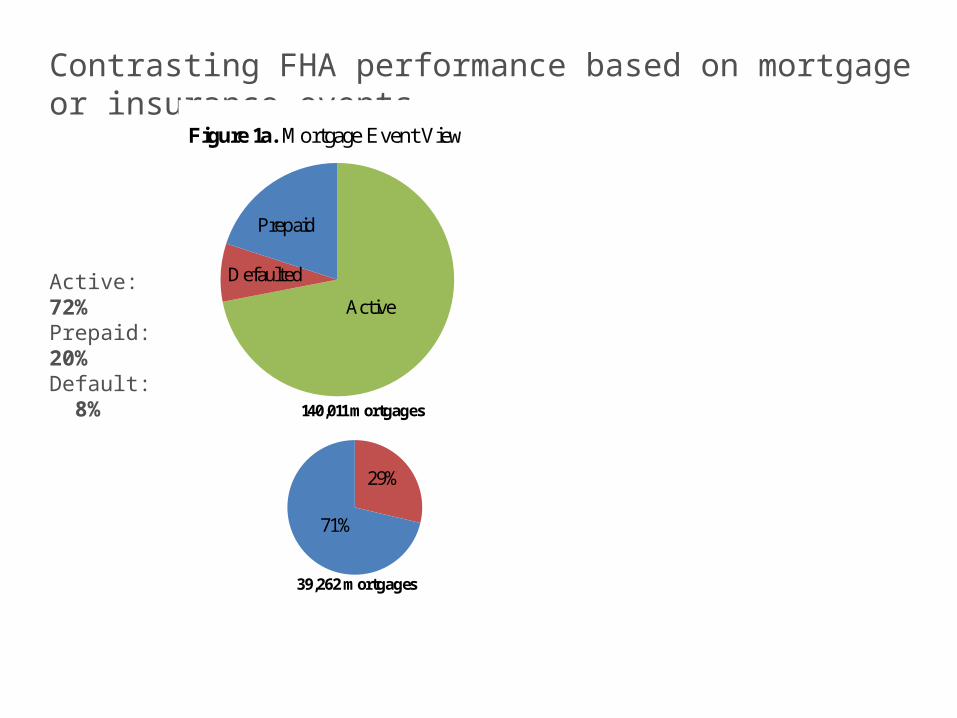
Contrasting FHA performance based on mortgage or insurance events
Active: 72%Prepaid: 20%Default: 8%
Defaulted
Figure 1a. Mortgage Event View
39,262 mortgages
29%
71%
140,011 mortgages
Prepaid
Active
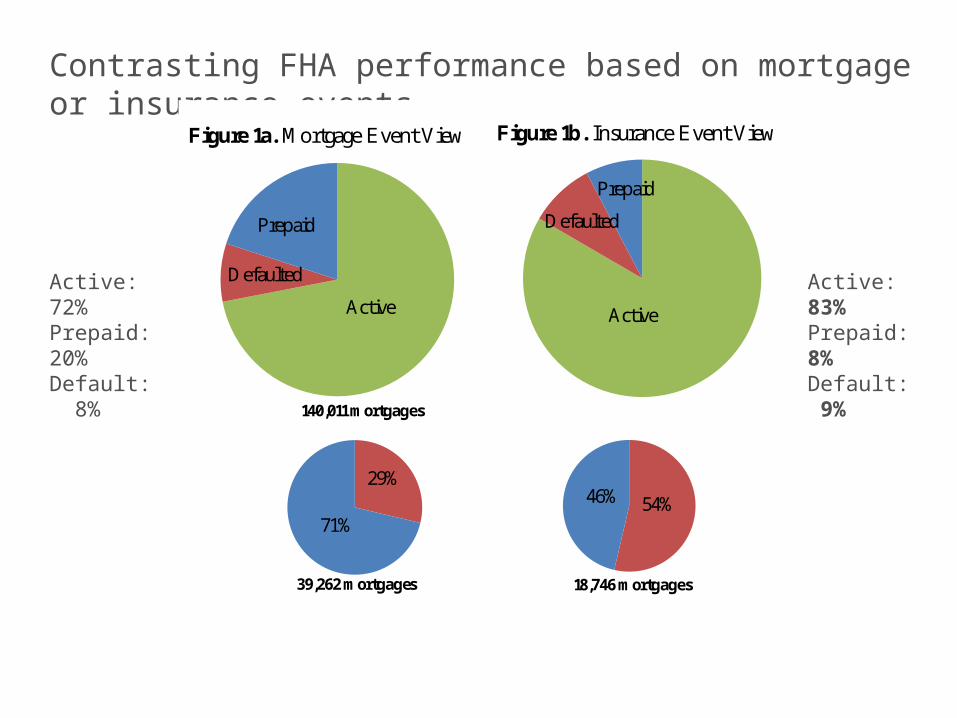
Contrasting FHA performance based on mortgage or insurance events
Active: 72%Prepaid: 20%Default: 8%
Active: 83%Prepaid: 8%Default: 9%
Defaulted
Figure 1a. Mortgage Event View
39,262 mortgages
29%
71%
140,011 mortgages
Prepaid
Active
Defaulted
Figure 1b. InsuranceEvent View
18,746 mortgages
54%46%
Prepaid
Active
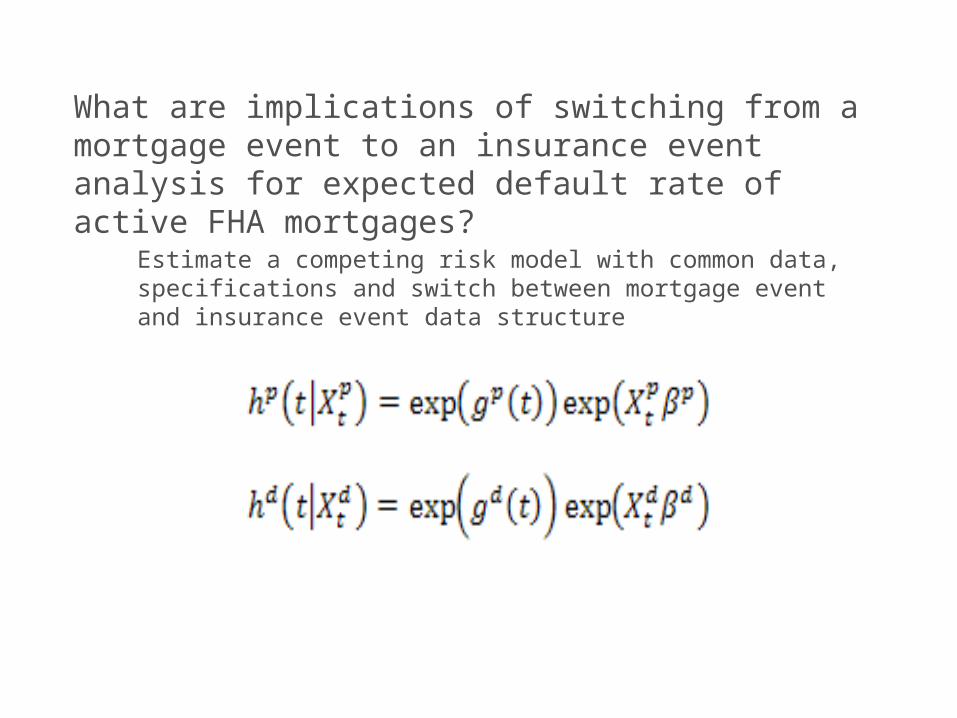
What are implications of switching from a mortgage event to an insurance event analysis for expected default rate of active FHA mortgages?
Estimate a competing risk model with common data, specifications and switch between mortgage event and insurance event data structure
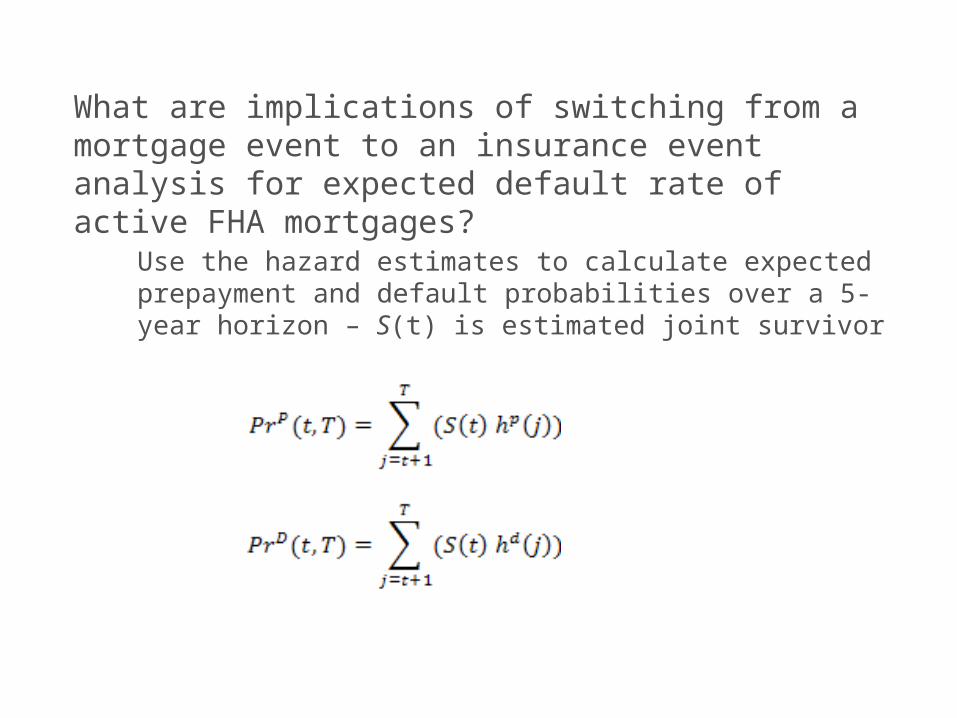
What are implications of switching from a mortgage event to an insurance event analysis for expected default rate of active FHA mortgages?
Use the hazard estimates to calculate expected prepayment and default probabilities over a 5-year horizon – S(t) is estimated joint survivor
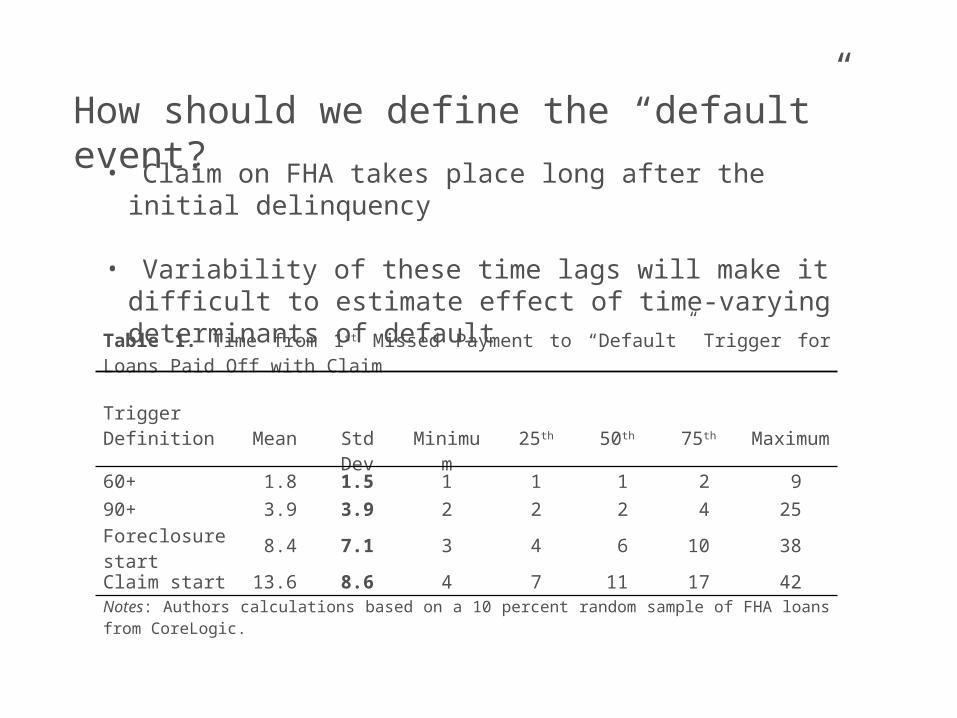
How should we define the “default” event?
• Claim on FHA takes place long after the initial delinquency
• Variability of these time lags will make it difficult to estimate effect of time-varying determinants of defaultTable 1. Time from 1st Missed Payment to “Default” Trigger for Loans Paid
Off with Claim
TriggerDefinition Mean Std
DevMinimu
m25th 50th 75th Maximu
m60+ 1.8 1.5 1 1 1 2 9
90+ 3.9 3.9 2 2 2 4 25Foreclosure start
8.4 7.1 3 4 6 10 38
Claim start 13.6 8.6 4 7 11 17 42Notes: Authors calculations based on a 10 percent random sample of FHA loans from CoreLogic.
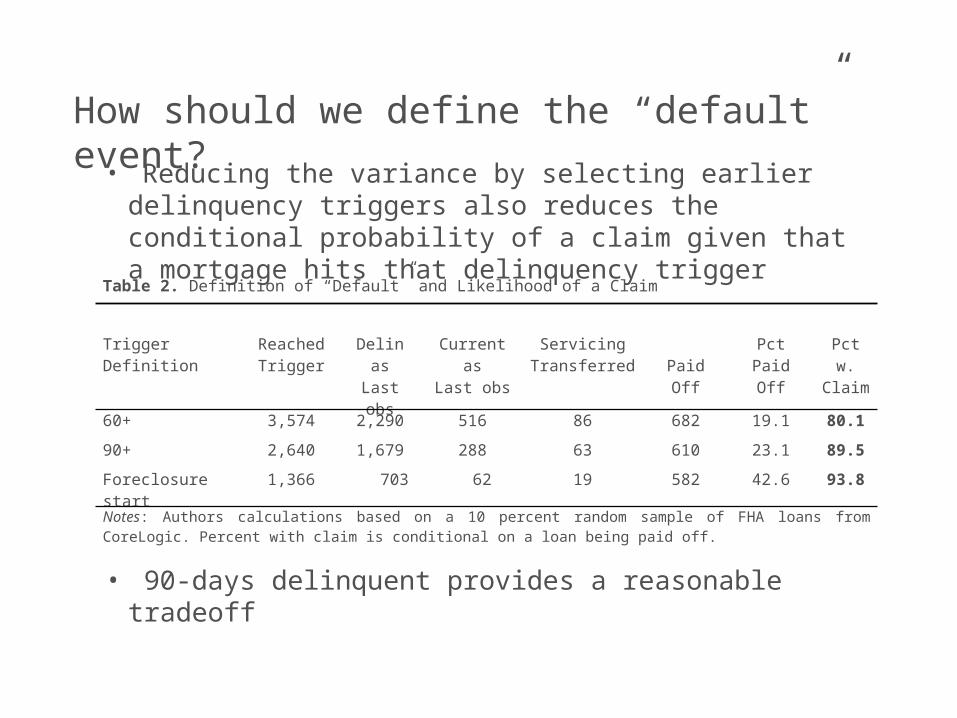
How should we define the “default” event?
• Reducing the variance by selecting earlier delinquency triggers also reduces the conditional probability of a claim given that a mortgage hits that delinquency trigger
Table 2. Definition of “Default” and Likelihood of a Claim
TriggerDefinition
ReachedTrigger
Delin asLast obs
Current as
Last obs
ServicingTransferred Paid Off
PctPaid Off
Pct w.Claim
60+ 3,574 2,290 516 86 682 19.1 80.1
90+ 2,640 1,679 288 63 610 23.1 89.5
Foreclosure start
1,366 703 62 19 582 42.6 93.8
Notes: Authors calculations based on a 10 percent random sample of FHA loans from CoreLogic. Percent with claim is conditional on a loan being paid off.
• 90-days delinquent provides a reasonable tradeoff
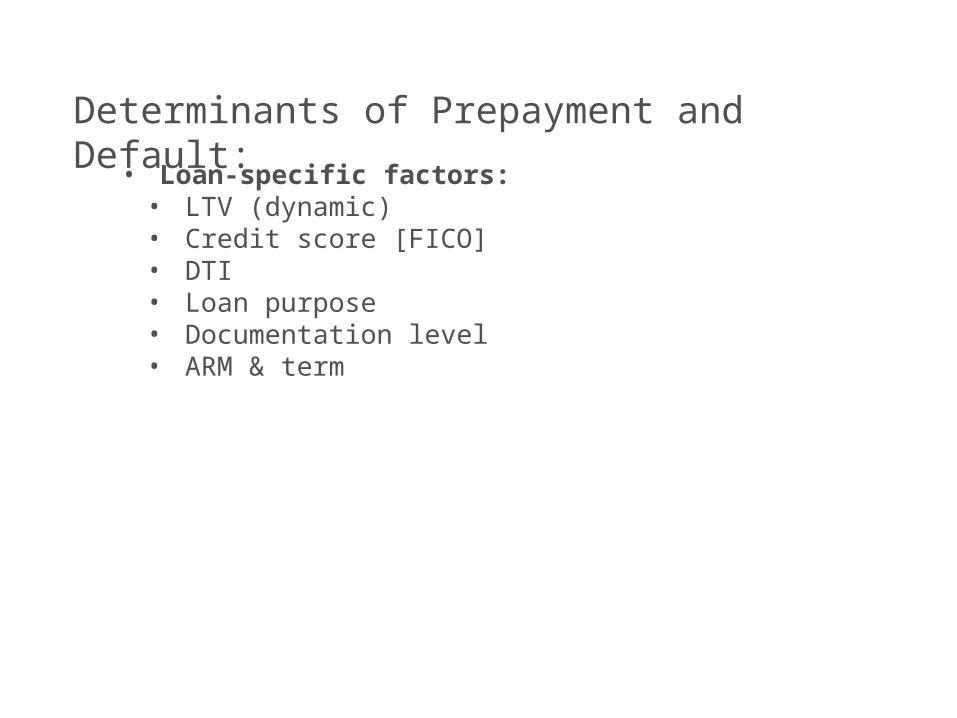
Determinants of Prepayment and Default:
• Loan-specific factors: • LTV (dynamic)• Credit score [FICO] • DTI • Loan purpose• Documentation level • ARM & term
Determinants of Prepayment and Default:
• Loan-specific factors: • LTV (dynamic)• Credit score [FICO] • DTI • Loan purpose• Documentation level • ARM & term
• State-specific factors:• Judicial foreclosure• Recourse
• Loan-specific facors: • LTV (dynamic)• Credit score [FICO] • DTI • Loan purpose• Documentation level • ARM & term
• State-specific factors:• Judicial foreclosure• Recourse
• Economic:• MSA unemployment (dynamic)• House price change – 12 months (dynamic)• Distress sales (dynamic)• Interest rate differential [prepayment only]
(dynamic)• Percent change in monthly payment [internal
FHA refi]
Determinants of Prepayment and Default:
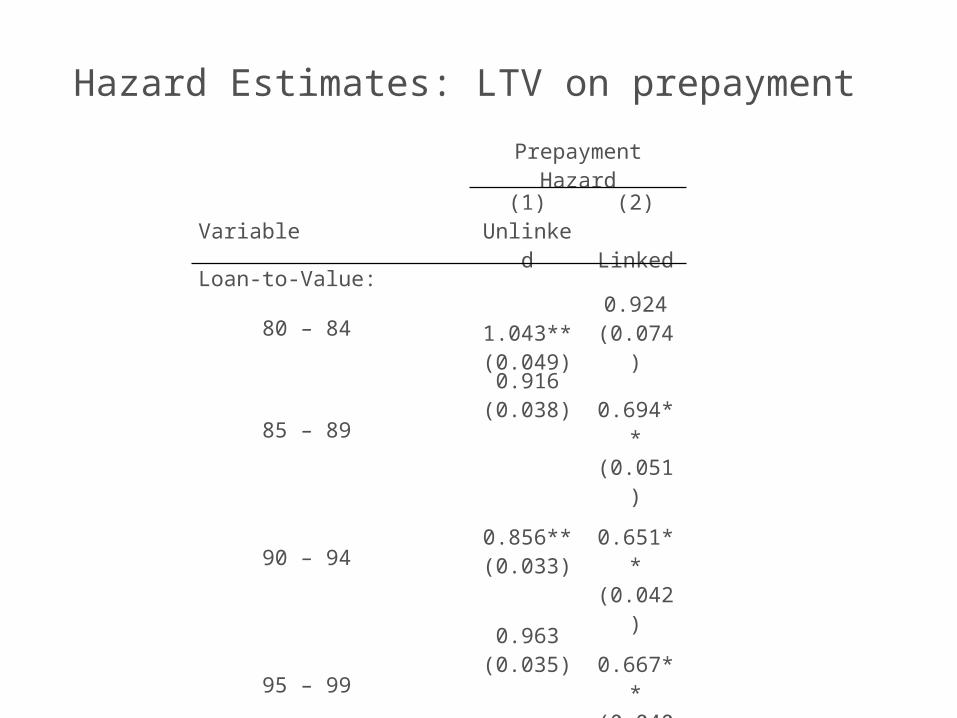
Hazard Estimates: LTV on prepayment
Prepayment Hazard
Variable(1)
Unlinked(2)
LinkedLoan-to-Value:
80 – 84 1.043**(0.049)
0.924(0.074)
85 – 890.916
(0.038)
0.694**(0.051)
90 – 94 0.856**(0.033)
0.651**(0.042)
95 – 990.963
(0.035)
0.667**(0.040)
100 – 104
1.045**(0.038)
0.714**(0.044)
105 – 109
0.993**(0.038)
0.672**(0.045)
110 – 114
0.845**(0.037)
0.552**(0.044)
115 – 119 0.776**(0.041)
0.558**(0.056)
120 or higher 0.737**(0.037)
0.421**(0.044)
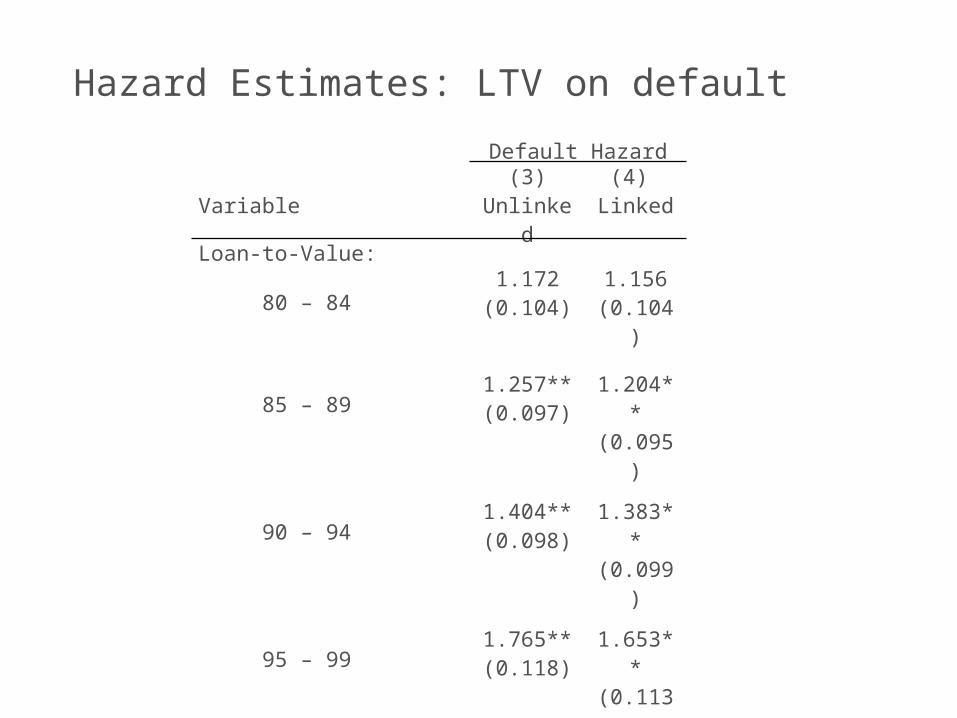
Hazard Estimates: LTV on default
Default Hazard
Variable(3)
Unlinked(4)
LinkedLoan-to-Value:
80 – 841.172
(0.104)1.156
(0.104)
85 – 89 1.257**(0.097)
1.204**(0.095)
90 – 94 1.404**(0.098)
1.383**(0.099)
95 – 99 1.765**(0.118)
1.653**(0.113)
100 – 104 2.199**(0.149)
2.216**(0.153)
105 – 109 2.460**(0.176)
2.769**(0.202)
110 – 114 2.795**(0.220)
3.184**(0.256)
115 – 119 2.953**(0.271)
3.513**(0.326)
120 or higher 3.170**(0.275)
3.784**(0.332)
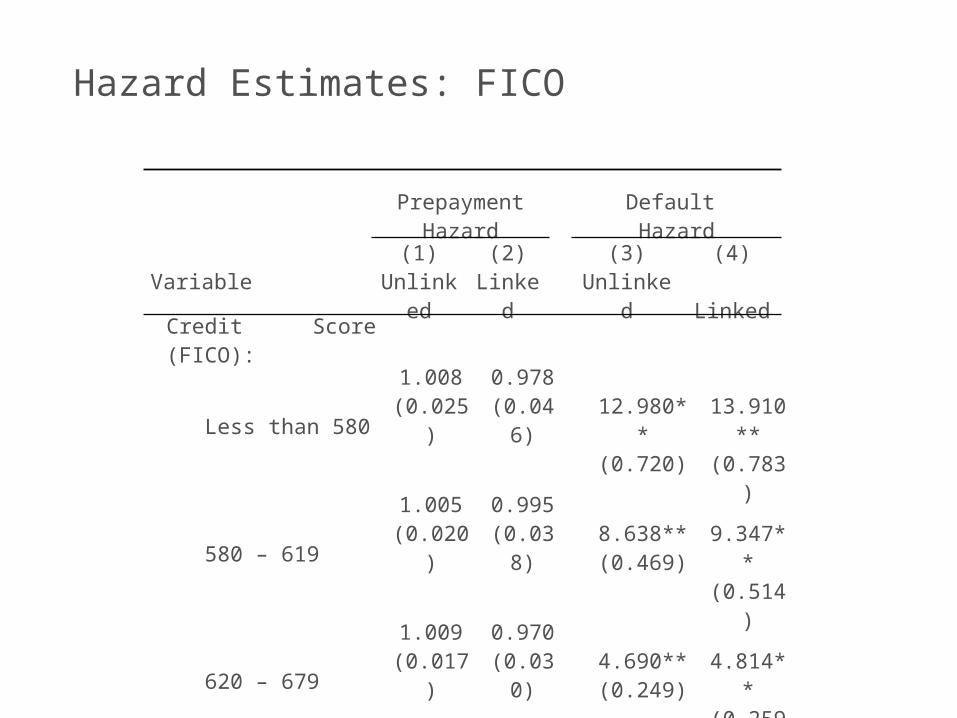
Hazard Estimates: FICO
Prepayment Hazard
Default Hazard
Variable(1)
Unlinked
(2) Linke
d
(3) Unlinke
d
(4) Linked
Credit Score (FICO):
Less than 580
1.008(0.025)
0.978(0.046
)
12.980**(0.720)
13.910*
*(0.783)
580 – 6191.005
(0.020)0.995(0.038
)
8.638**(0.469)
9.347**(0.514)
620 – 6791.009
(0.017)0.970(0.030
)
4.690**(0.249)
4.814**(0.259)
680 – 7190.991
(0.019)0.988(0.036
)
2.257**(0.138)
2.268**(0.141)
Missing
0.635**(0.028)
1.207*
*(0.076
)
5.978**(0.405)
7.289**(0.500)
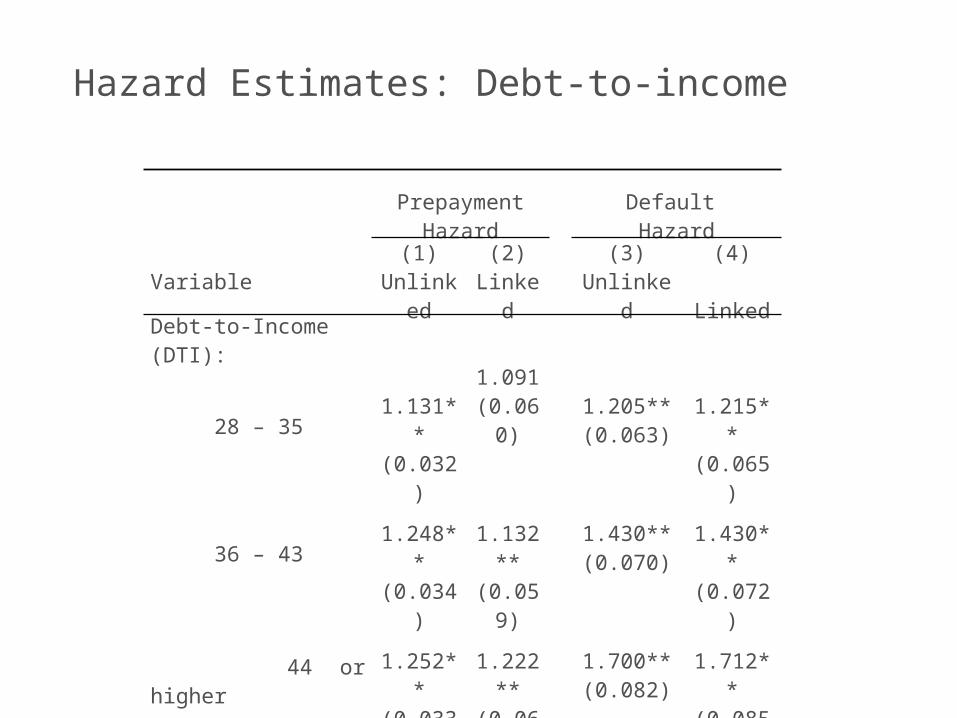
Hazard Estimates: Debt-to-income
Prepayment Hazard
Default Hazard
Variable(1)
Unlinked
(2) Linke
d
(3) Unlinke
d
(4) Linked
Debt-to-Income (DTI):
28 – 35
1.131*
*(0.032)
1.091(0.060
)
1.205**(0.063)
1.215**(0.065)
36 – 43
1.248*
*(0.034)
1.132
**(0.059
)
1.430**(0.070)
1.430**(0.072)
44 or higher
1.252*
*(0.033)
1.222
**(0.062
)
1.700**(0.082)
1.712**(0.085)
Missing
1.226**
(0.035)
1.308
**(0.070
)
1.659**(0.084)
1.823**(0.094)
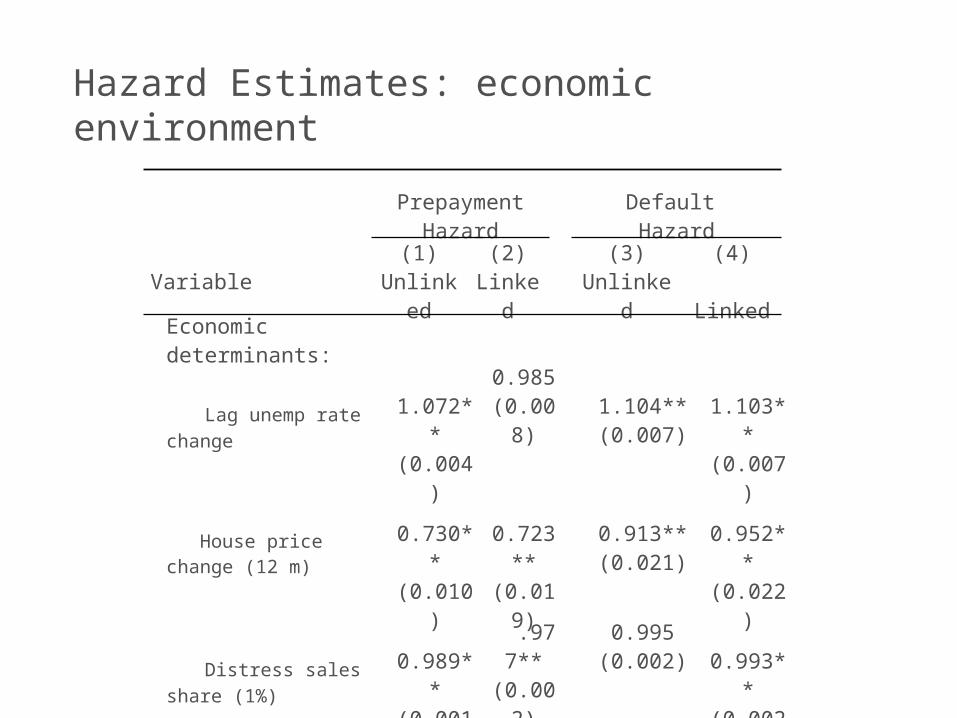
Hazard Estimates: economic environment
Prepayment Hazard
Default Hazard
Variable(1)
Unlinked
(2) Linke
d
(3) Unlinke
d
(4) Linked
Economic determinants:
Lag unemp rate change
1.072*
*(0.004)
0.985(0.008
)
1.104**(0.007)
1.103**(0.007)
House price change (12 m)
0.730*
*(0.010)
0.723
**(0.019
)
0.913**(0.021)
0.952**(0.022)
Distress sales share (1%)
0.989*
*(0.001)
.977**
(0.002)
0.995(0.002)
0.993**(0.002)
Interest rate diff (1%)
3.043*
*(0.041)
.864**
(0.091)
% change in monthly pmt
.382**
(0.058)
1.251**(0.043)
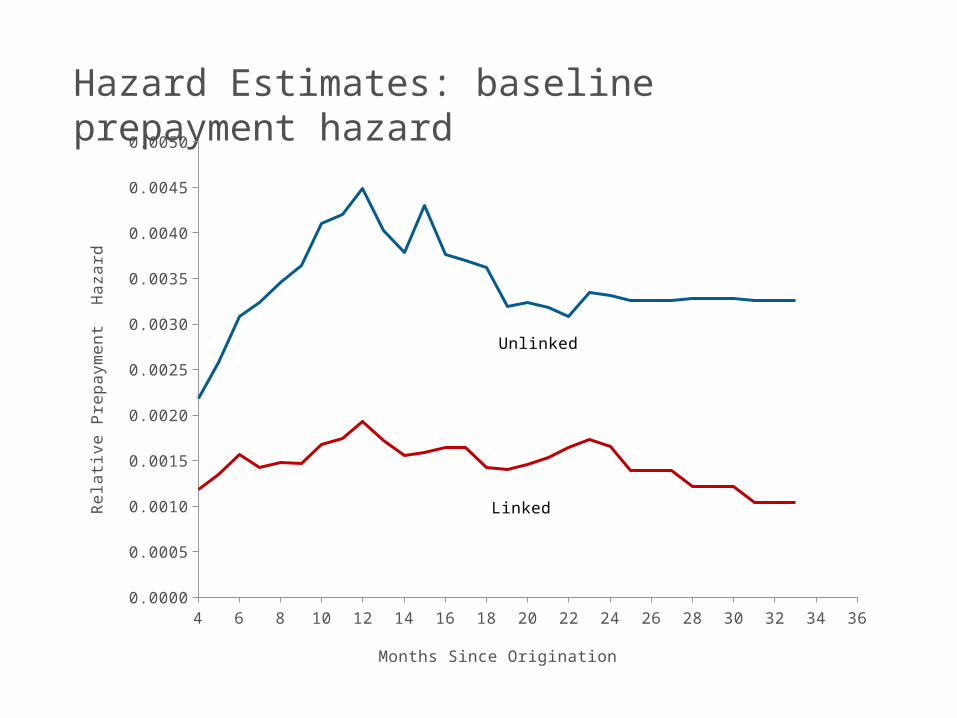
Hazard Estimates: baseline prepayment hazard
4 6 8 10 12 14 16 18 20 22 24 26 28 30 32 34 360.0000
0.0005
0.0010
0.0015
0.0020
0.0025
0.0030
0.0035
0.0040
0.0045
0.0050
Months Since Origination
Rel
ati
ve P
repaym
ent
Haza
rd
Linked
Unlinked
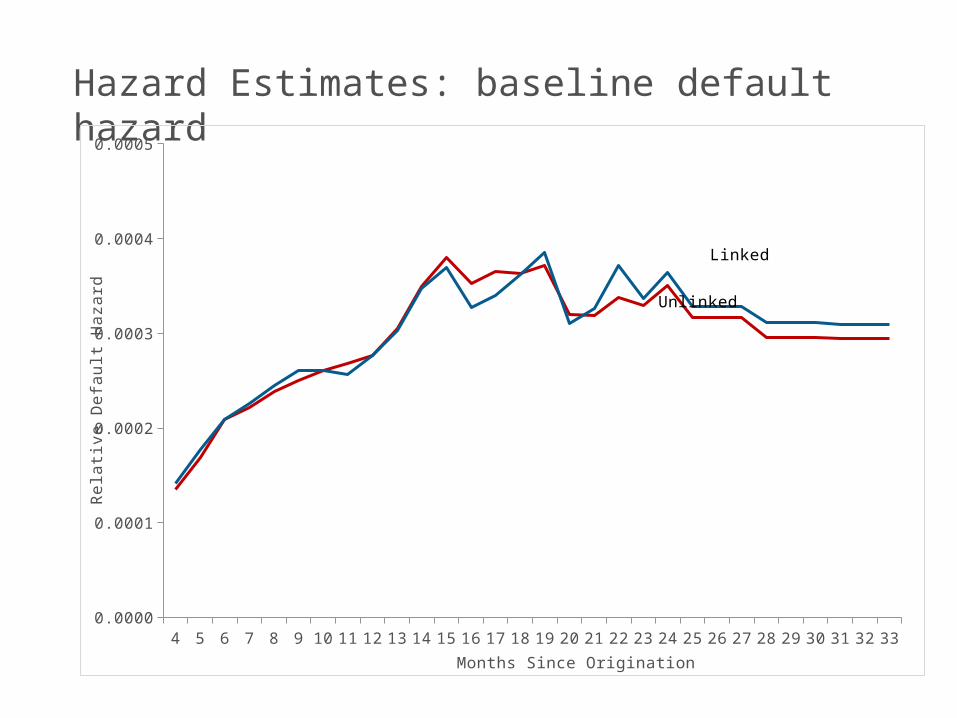
Hazard Estimates: baseline default hazard
4 5 6 7 8 9 10 11 12 13 14 15 16 17 18 19 20 21 22 23 24 25 26 27 28 29 30 31 32 330.0000
0.0001
0.0002
0.0003
0.0004
0.0005
Months Since Origination
Rel
ati
ve D
efault
Haza
rd
Linked
Unlinked
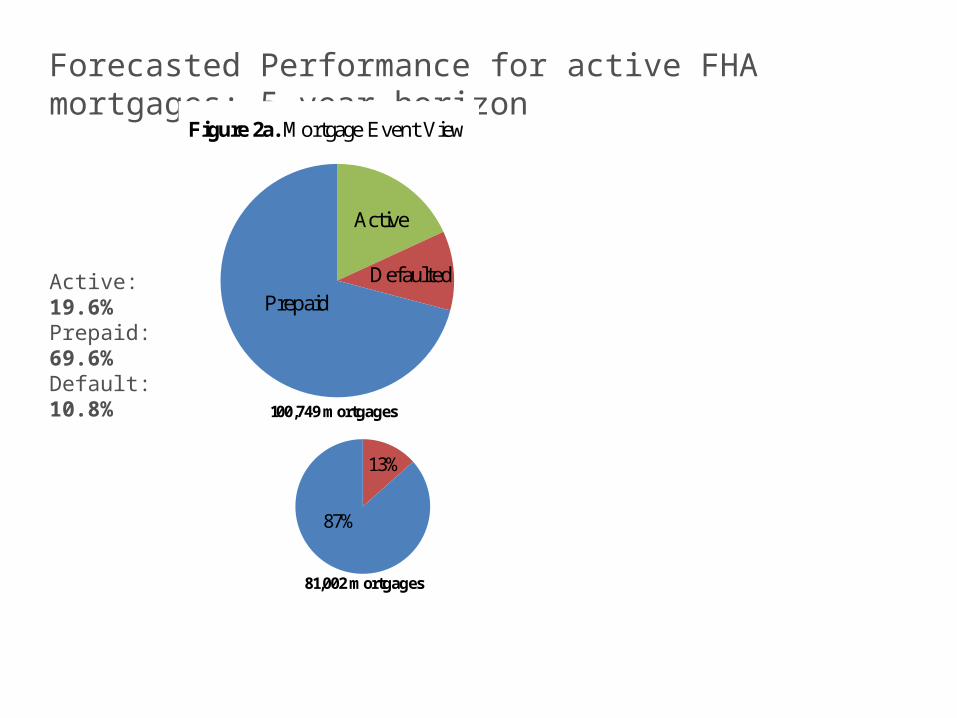
Forecasted Performance for active FHA mortgages: 5-year horizon
Active: 19.6%Prepaid: 69.6%Default: 10.8%
Defaulted
Figure 2a. Mortgage Event View
81,002 mortgages
87%
13%
100,749 mortgages
Prepaid
Active
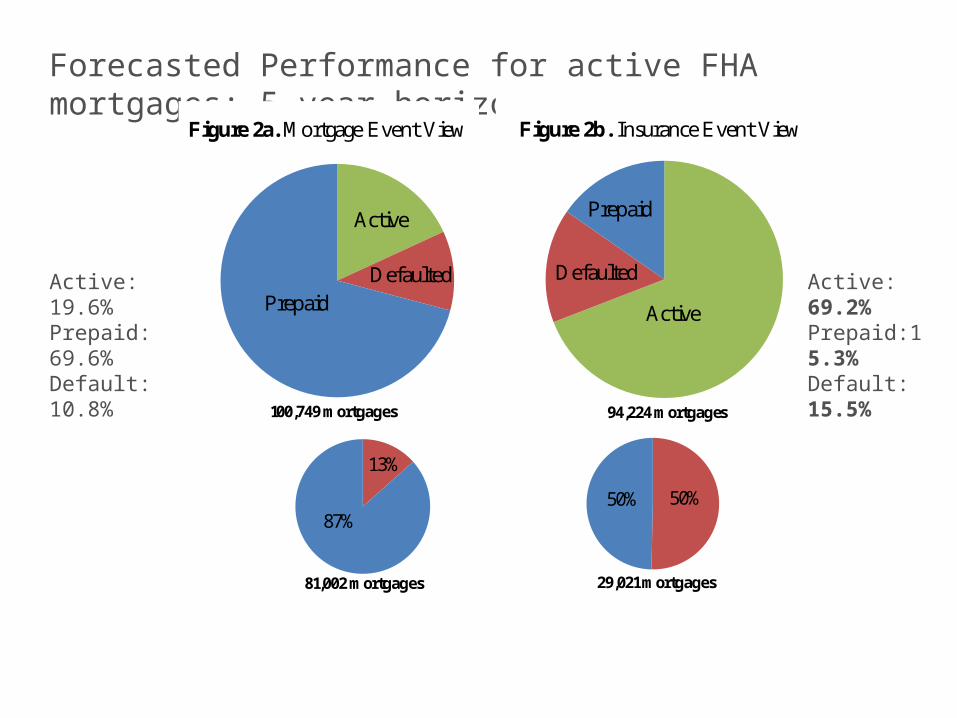
Forecasted Performance for active FHA mortgages: 5-year horizon
Active: 19.6%Prepaid: 69.6%Default: 10.8%
Active: 69.2%Prepaid:15.3%Default: 15.5%
Defaulted
Figure 2a. Mortgage Event View
81,002 mortgages
87%
13%
100,749 mortgages
Prepaid
Active
Defaulted
Figure 2b. InsuranceEvent View
29,021 mortgages
50%50%
94,224 mortgages
Prepaid
Active
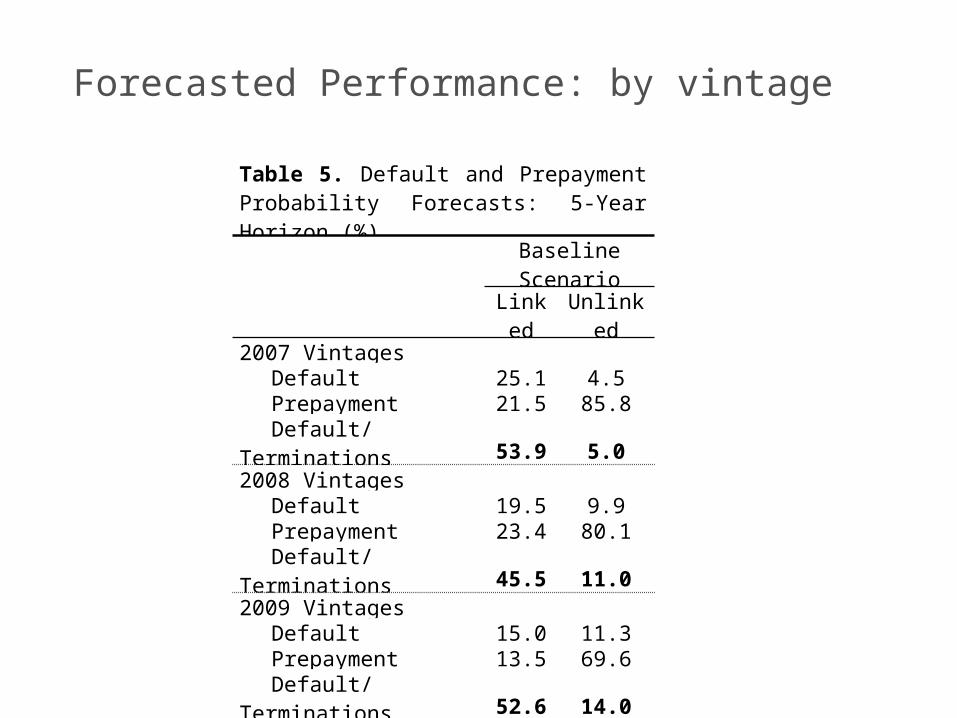
Forecasted Performance: by vintage
Table 5. Default and Prepayment Probability Forecasts: 5-Year Horizon (%)
Baseline Scenario
Linked
Unlinked
2007 Vintages Default 25.1 4.5Prepayment 21.5 85.8Default/
Terminations 53.9 5.02008 Vintages
Default 19.5 9.9Prepayment 23.4 80.1Default/
Terminations 45.5 11.02009 Vintages
Default 15.0 11.3Prepayment 13.5 69.6Default/
Terminations 52.6 14.0