Embed Size (px)
Citation preview
arX
iv:0
705.
1186
v1 [
astr
o-ph
] 8
May
200
7
The Search for Muon Neutrinos from Northern Hemisphere
Gamma-Ray Bursts with AMANDA
A. Achterberg1, M. Ackermann2, J. Adams3, J. Ahrens4, K. Andeen5, J. Auffenberg14,
J. N. Bahcall7,34, X. Bai8, B. Baret9, S. W. Barwick11, R. Bay12, K. Beattie13, T. Becka4,
J. K. Becker10, K.-H. Becker14, P. Berghaus15, D. Berley16, E. Bernardini2, D. Bertrand15,
D. Z. Besson17, E. Blaufuss16, D. J. Boersma5, C. Bohm18, J. Bolmont2, S. Boser2,
O. Botner19, A. Bouchta19, J. Braun5, C. Burgess18, T. Burgess18, T. Castermans20,
D. Chirkin13, B. Christy16, J. Clem8, D. F. Cowen6,21, M. V. D’Agostino12, A. Davour19,
C. T. Day13, C. De Clercq9, L. Demirors8, F. Descamps22, P. Desiati5, T. DeYoung6,
J. C. Diaz-Velez5, J. Dreyer10, J. P. Dumm5, M. R. Duvoort1, W. R. Edwards13,
R. Ehrlich16, J. Eisch23, R. W. Ellsworth16, P. A. Evenson8, O. Fadiran24, A. R. Fazely25,
K. Filimonov12, M. M. Foerster6, B. D. Fox6, A. Franckowiak14 T. K. Gaisser8,
J. Gallagher26, R. Ganugapati5, H. Geenen14, L. Gerhardt11, A. Goldschmidt13,
J. A. Goodman16, R. Gozzini4, T. Griesel4, A. Groß27, S. Grullon5, R. M. Gunasingha25,
M. Gurtner14, A. Hallgren19, F. Halzen5, K. Han3, K. Hanson5, D. Hardtke12, R. Hardtke23,
J. E. Hart6, Y. Hasegawa30, T. Hauschildt8, D. Hays13, J. Heise1, K. Helbing14,
M. Hellwig4, P. Herquet20, G. C. Hill5, J. Hodges5, K. D. Hoffman16, B. Hommez22,
K. Hoshina5, D. Hubert9, B. Hughey5, P. O. Hulth18, J.-P. Hulß32, K. Hultqvist18,
S. Hundertmark18, M. Inaba30, A. Ishihara5, J. Jacobsen13, G. S. Japaridze24,
H. Johansson18, A. Jones13, J. M. Joseph13, K.-H. Kampert14, A. Kappes5, T. Karg14,
A. Karle5, H. Kawai30, J. L. Kelley5, N. Kitamura5, S. R. Klein13, S. Klepser2,
G. Kohnen20, H. Kolanoski28, L. Kopke4, M. Kowalski28, T. Kowarik4, M. Krasberg5,
K. Kuehn11, M. Labare9, H. Landsman5, H. Leich2, D. Leier10, I. Liubarsky29,
J. Lundberg19, J. Lunemann10, J. Madsen23, K. Mase30, H. S. Matis13, T. McCauley13,
C. P. McParland13, A. Meli10, T. Messarius10, P. Meszaros6,21, H. Miyamoto30,
A. Mokhtarani13, T. Montaruli5,35, A. Morey12, R. Morse5, S. M. Movit21, K. Munich10,
R. Nahnhauer2, J. W. Nam11, P. Nießen8, D. R. Nygren13, H. Ogelman5, A. Olivas16,
S. Patton13, C. Pena-Garay7, C. Perez de los Heros19, A. Piegsa4, D. Pieloth2,
A. C. Pohl19,36, R. Porrata12, J. Pretz16, P. B. Price12, G. T. Przybylski13, K. Rawlins31,
S. Razzaque6,21, E. Resconi27, W. Rhode10, M. Ribordy20, A. Rizzo9, S. Robbins14,
P. Roth16, C. Rott6, D. Rutledge6, D. Ryckbosch22, H.-G. Sander4, S. Sarkar33,
S. Schlenstedt2, T. Schmidt16, D. Schneider5, D. Seckel8, B. Semburg14, S. H. Seo6,
S. Seunarine3, A. Silvestri11, A. J. Smith16, M. Solarz12, C. Song5, J. E. Sopher13,
G. M. Spiczak23, C. Spiering2, M. Stamatikos5,38, T. Stanev8, P. Steffen2, T. Stezelberger13,
R. G. Stokstad13, M. C. Stoufer13, S. Stoyanov8, E. A. Strahler5, T. Straszheim16,
K.-H. Sulanke2, G. W. Sullivan16, T. J. Sumner29, I. Taboada12, O. Tarasova2, A. Tepe14,
L. Thollander18, S. Tilav8, M. Tluczykont2, P. A. Toale6, D. Turcan16, N. van Eijndhoven1,
– 2 –
J. Vandenbroucke12, A. Van Overloop22, V. Viscomi6, B. Voigt2, W. Wagner10, C. Walck18,
H. Waldmann2, M. Walter2, Y.-R. Wang5, C. Wendt5, C. H. Wiebusch32, G. Wikstrom18,
D. R. Williams6, R. Wischnewski2, H. Wissing32, K. Woschnagg12, X. W. Xu25, G. Yodh11,
S. Yoshida30, J. D. Zornoza5,37 (the IceCube Collaboration), and M. Boer39, T. Cline38,
G. Crew40, M. Feroci41, F. Frontera42, K. Hurley43, D. Lamb44, A. Rau45, F. Rossi42,
G. Ricker40, A. von Kienlin46 (the InterPlanetary Network)
– 3 –
1Dept. of Physics and Astronomy, Utrecht University/SRON, NL-3584 CC Utrecht, The Netherlands
2DESY, D-15735 Zeuthen, Germany
3Dept. of Physics and Astronomy, University of Canterbury, Private Bag 4800, Christchurch, New Zealand
4Institute of Physics, University of Mainz, Staudinger Weg 7, D-55099 Mainz, Germany
5Dept. of Physics, University of Wisconsin, Madison, WI 53706, USA
6Dept. of Physics, Pennsylvania State University, University Park, PA 16802, USA
7Institute for Advanced Study, Princeton, NJ 08540, USA
8Bartol Research Institute, University of Delaware, Newark, DE 19716, USA
9Vrije Universiteit Brussel, Dienst ELEM, B-1050 Brussels, Belgium
10Dept. of Physics, Universitat Dortmund, D-44221 Dortmund, Germany
11Dept. of Physics and Astronomy, University of California, Irvine, CA 92697, USA
12Dept. of Physics, University of California, Berkeley, CA 94720, USA
13Lawrence Berkeley National Laboratory, Berkeley, CA 94720, USA
14Dept. of Physics, University of Wuppertal, D-42119 Wuppertal, Germany
15Universite Libre de Bruxelles, Science Faculty CP230, B-1050 Brussels, Belgium
16Dept. of Physics, University of Maryland, College Park, MD 20742, USA
17Dept. of Physics and Astronomy, University of Kansas, Lawrence, KS 66045, USA
18Dept. of Physics, Stockholm University, SE-10691 Stockholm, Sweden
19Division of High Energy Physics, Uppsala University, S-75121 Uppsala, Sweden
20University of Mons-Hainaut, 7000 Mons, Belgium
21Dept. of Astronomy and Astrophysics, Pennsylvania State University, University Park, PA 16802, USA
22Dept. of Subatomic and Radiation Physics, University of Gent, B-9000 Gent, Belgium
23Dept. of Physics, University of Wisconsin, River Falls, WI 54022, USA
24CTSPS, Clark-Atlanta University, Atlanta, GA 30314, USA
25Dept. of Physics, Southern University, Baton Rouge, LA 70813, USA
26Dept. of Astronomy, University of Wisconsin, Madison, WI 53706, USA
27Max-Planck-Institut fur Kernphysik, D-69177 Heidelberg, Germany
28Institut fur Physik, Humboldt Universitat zu Berlin, D-12489 Berlin, Germany
29Blackett Laboratory, Imperial College, London SW7 2BW, UK
30Dept. of Physics, Chiba University, Chiba 263-8522 Japan
– 4 –
* Corresponding author K. Kuehn: [email protected]
ABSTRACT
We present the results of the analysis of neutrino observations by the Antarctic
Muon and Neutrino Detector Array (AMANDA) correlated with photon obser-
vations of more than 400 gamma-ray bursts (GRBs) in the Northern Hemisphere
from 1997 to 2003. During this time period, AMANDA’s effective collection area
for muon neutrinos was larger than that of any other existing detector. Based
on our observations of zero neutrinos during and immediately prior to the GRBs
in the dataset, we set the most stringent upper limit on muon neutrino emission
correlated with gamma-ray bursts. Assuming a Waxman-Bahcall spectrum and
31Dept. of Physics and Astronomy, University of Alaska Anchorage, 3211 Providence Dr., Anchorage, AK
99508, USA
32III Physikalisches Institut, RWTH Aachen University, D-52074 Aachen, Germany
33Dept. of Physics, University of Oxford, 1 Keble Road, Oxford OX1 3NP, UK
34Deceased
35on leave of absence from Universita di Bari, Dipartimento di Fisica, I-70126, Bari, Italy
36affiliated with Dept. of Chemistry and Biomedical Sciences, Kalmar University, S-39182 Kalmar, Sweden
37affiliated with IFIC (CSIC-Universitat de Valencia), A. C. 22085, 46071 Valencia, Spain
38NASA Goddard Space Flight Center, Greenbelt, MD 20771, USA
39Observatoire de Haute Provence, F-04870 Saint Michel l’Observatoire, France
40Massachusetts Institute of Technology, Kavli Institute for Astrophysics and Space Research, Cambridge,
MA 02139, USA
41Instituto di Astrofisica Spaziale e Fisica Cosmica, Instituto Nazionale di Astrofisica, c/o CNR Area di
Ricerca di Roma - Tor Vergata, Via Fosso del Cavaliere 100, Roma, I-00133 Italy
42Physics Department, University of Ferrara, Via Saragat 1, 44100 Ferrara, Italy
43University of California, Space Sciences Laboratory, 7 Gauss Way, Berkeley, CA 94720-7450 USA
44Department of Astronomy and Astrophysics, University of Chicago, 5640 South Ellis Avenue Chicago,
IL 60637 USA
45Caltech Optical Observatories, California Institute of Technology, MS 105-24, 1200 E. California Blvd.,
Pasadena, CA 91125 USA
46Max-Planck-Institut fur Extraterrestrische Physik, Giessenbachstrasse, 85748, Garching, Germany
– 5 –
incorporating all systematic uncertainties, our flux upper limit has a normaliza-
tion at 1 PeV of
E2Φν ≤ 6.0 × 10⁻⁹ GeVcm−2s−1sr−1,
with 90% of the events expected within the energy range of ∼10 TeV to ∼3 PeV.
The impact of this limit on several theoretical models of GRBs is discussed, as
well as the future potential for detection of GRBs by next generation neutrino
telescopes. Finally, we briefly describe several modifications to this analysis in
order to apply it to other types of transient point sources.
Subject headings: gamma-ray bursts, high energy astrophysics, neutrino astron-
omy, AMANDA
1. Introduction
1.1. Gamma-Ray Bursts
Gamma-ray bursts (GRBs) are among the most energetic phenomena in the universe;
based on their luminosity and the cosmological distances derived from redshift measurements
of burst afterglows and/or host galaxies(Costa et al. 2003), GRBs require the release of an
enormous amount of energy (E ≈1053 × Ω/4π erg, where Ω is the solid angle of the GRB jet)
in as little as a fraction of a second(Frail et al. 2001). Based on the observations of the Burst
and Transient Source Experiment(BATSE, see Fishman et al. 1993) and other space-based
detectors, they are expected to occur throughout the observable universe at a rate of &700
per year, though current instrument do not have sufficient sky coverage or sensitivity to
detect every burst. Long duration (&2 sec) bursts are believed to originate from the collapse
of a massive stellar progenitor into a black hole, whereas short duration (.2 sec) bursts are
believed to result from the merger of two compact objects into a black hole (Eicher et al.
1989)1. Though these two types of bursts come from different progenitors, both are consistent
with the canonical picture of gamma-ray bursts—the fireball scenario (Fryer & Meszaros
2003; Piran 2004). A fireball is generated during the formation of the black hole when the
outflowing plasma is accelerated to ultrarelativistic speeds. Subsequently, in an optically thin
region (outside of the progenitor), the kinetic energy of the plasma is converted to radiation,
either through interaction with an external medium or through self-interaction within the
flow (Piran 2002). If the circumstellar environment contains enough baryonic material, it
1For a more recent treatment of the compact object merger scenario, see (Paczynski 1998; Lewin et al.
2006), and for an alternative description of the GRB progenitor scenario, see also (Roming et al. 2006).
– 6 –
will be entrained with the accelerated plasma. Subsequent photo-pion production by baryon
interaction with synchrotron or inverse Compton scattered photons will lead to several decay
products, including neutrinos and antineutrinos in a ratio of 2:1. The primary reaction is:
p+ γ → ∆ → π+ + n (1)
followed by
π+→ µ+ + νµ (2)
after which the muon will further decay to
µ+→ e+ + νe + νµ. (3)
Similarly, “precursor” neutrinos may be generated by p-p interactions either within the
star or in the immediate circumburst environment (see Section 2). Due to their minuscule
interaction cross section (Gandhi et al. 1998), neutrinos will reach the AMANDA detector
after traveling nearly unimpeded from the GRB environment. AMANDA has been searching
for high-energy neutrinos from various astrophysical fluxes (both discrete and diffuse) for
nearly a decade; in this work we focus on the analysis of AMANDA data correlated with
photon observations of more than 400 GRBs from 1997 to 2003.
1.2. The AMANDA Detector
The AMANDA detector (Ahrens et al. 2002) is an array of Optical Modules (OMs)
deployed at depths between 1.5 and 2 km beneath the surface of the ice at the South Pole.
An OM consists of a photomultiplier tube housed in a glass pressure sphere. During the
years 1997-1999 the detector operated with 302 OMs on ten strings placed in a circular
geometry with a diameter of about 100 m, and was known as AMANDA B-10. From 2000
onward, nine additional strings were in operation, placed within a diameter of about 200 m,
bringing the total number of optical modules to 677. This phase of the neutrino observatory
(dubbed AMANDA-II) operated through 2004, and continues as a high density component
of IceCube, a km-scale detector currently being constructed (Achterberg et al. 2006a).
The optical modules in AMANDA are designed to detect the Cherenkov emission from
neutrino-induced muons that travel through or near the instrumented volume of ice. While
other neutrinos may be detected with this search, the efficiency for νe or ντ detection is sig-
nificantly smaller. Other multi-flavor GRB neutrino searches which don’t require directional
information have been performed (Achterberg et al. 2007); we focus here on the search for
GRB muon neutrinos from the Northern Hemisphere (δ from 0 to 90). Due to the limited
volume of ice above the detector, few downgoing extraterrestrial neutrinos will interact above
– 7 –
and be detected by AMANDA. At the energies of interest to this analysis, the down-going
events in the AMANDA dataset are primarily the atmospheric muon background which will
completely overwhelm any potential downgoing signal. Thus, our extraterrestrial signal is
primarily confined to the horizontal or up-going direction. As these muon neutrinos travel
through the ice, they may interact with nearby nucleons to create energetic muons:
νµ +N → µ+X, (4)
where N is a nucleon and X represents other reaction products. Muons produced in this
reaction can carry a significant fraction of the original neutrino energy (Gandhi et al. 1996).
Depending on its energy, the muon can travel up to tens of kilometers through the ice; for
νµ in the energy range of greatest interest to AMANDA (∼105 GeV), the muon path length
is ∼10 km (Lipari & Stanev 1991).
Since AMANDA can detect such a muon anywhere along its substantial path length,
the effective detector volume is significantly larger than the actual instrumented volume. A
muon that has sufficient energy will continuously emit Cherenkov radiation, and will also
generate additional particles due to stochastic processes. The ice at a depth of more than
one kilometer is extremely clear, and thus the Cherenkov photons have large scattering (Leffs )
and absorption (La) lengths—at λ = 400 nm, Leffs ≈25 m and La≈100 m (Ackermann et al.
2006). The Cherenkov light therefore has the potential to reach numerous OMs as the muon
travels through the detector, and the relative timing of the hit OMs provides the basis for
a set of maximum-likelihood reconstruction algorithms to determine the muon’s direction of
origin (Ahrens et al. 2004). The algorithms applied to this analysis are based on variations
from a randomly-seeded “first guess” track using the Pandel function to parametrize the
sequence of OM hits. The likelihood of the initial track is calculated, and then the procedure
is iterated (up to 32 times) to determine the most likely muon track. Iterations beyond the
first incorporate increasingly complex features of the detector response to the Cherenkov
photons, the details of which are beyond the scope of this work2. Detector simulations,
along with observations of downgoing cosmic ray muons, have shown that this procedure
provides track reconstructions accurate to within a mean value of ∼2. Atmospheric muons
are almost entirely removed from the dataset by constraining our search to those bursts
occurring in the Northern Hemisphere, allowing the detector to be shielded from a substantial
background flux by the bulk of the earth. Upgoing atmospheric neutrinos caused by cosmic
ray interactions in the Northern hemisphere may also be detected by AMANDA, as their
spectrum extends into the energy range of relevance to the GRB search. However, they
2An alternative track reconstruction known as a “paraboloid fit” is also relevant for our secondary data
selection criteria, see Section 3.3 for further details.
– 8 –
likewise are removed from the dataset by requiring strict spatial and temporal correlation
with photon observations of GRBs. With these selection criteria applied, we expect less than
0.01 atmospheric neutrino events in our dataset.
In Section 2 we describe several models for GRB neutrino emission. In Section 3 we
discuss the method for determining periods of stable detector performance and for separating
the expected GRB neutrino signal from all misreconstructed background events, as well as
the systematic uncertainties associated with this analysis procedure. In Section 4 we compare
the results of the AMANDA observations with the models, as well as provide a spectrum-
independent method for determining the fluence upper limit from GRBs. We conclude with
the future potential of AMANDA/IceCube, for both the standard GRB search in the Swift
era (Markwardt et al. 2005) and for searches optimized for other transient point sources,
such as jet-driven supernovae.
2. Models of Neutrino Emission
According to the canonical description provided above, gamma-ray bursts result from
the dissipation of the energy of relativistic outflows from a central engine. Based on the
assumption that GRBs are the source of ultra-high energy cosmic rays (UHECRs), Waxman
and Bahcall predicted an annual muon neutrino flux associated with GRBs of E2Φν ∼ 9
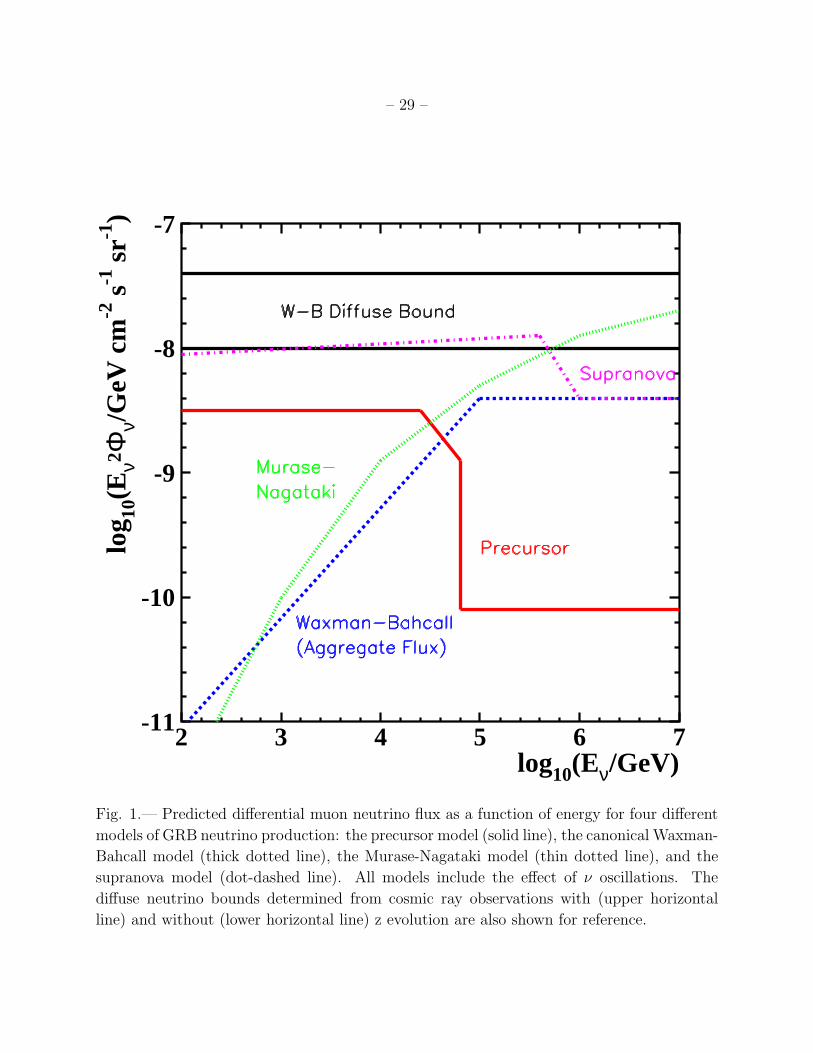
× 10−9 GeVcm−2s−1sr−1 from 100 TeV to 10 PeV (Waxman 2003) 3. Murase & Nagataki
(2006a) predict a similar spectrum to Waxman and Bahcall for long-duration bursts, though
their simulations include a wider range of parameters, leading to a wider variation in pre-
dicted fluxes. Inclusion of neutrino oscillations reduce these predictions by a factor of two4.
Razzaque et al. (2003a) hypothesize a different scenario in which a supernova precedes a
long-duration GRB by several days to a week. In this “supranova” scenario, the supernova
remnant provides target nucleons for pp interactions leading to precursor neutrinos with en-
ergy Eν∼10 TeV. Furthermore, the remnant will produce target photons for pγ interactions,
which will also yield muon neutrinos up to 1016 eV, albeit with a different spectral shape
3For the original formulation of this neutrino flux prediction, see (Waxman & Bahcall 1997). Note that
this GRB neutrino flux is distinct from the Waxman-Bahcall upper bound on the diffuse neutrino flux due
to UHECRs.
4Oscillations modify the flavor ratio from 1:2:0 at the source to 1:1:1 at Earth. However, see
(Kashti & Waxman 2005) for a discussion regarding different flavor ratios due to energy losses of the π
and ν.
– 9 –
than that predicted by the Waxman-Bahcall model5. This model also has implications for
gamma-ray dark (or “choked”) bursts, which are briefly discussed in Section 5. Furthermore,
though these models explicitly incorporate only long-duration bursts into their models, the
GRB central engine is in principle independent of burst type. Thus, though the flux upper
limits for these models include long bursts only, the models could potentially be expanded
to include neutrinos from short bursts as well. Within the AMANDA dataset long bursts
dominate over short bursts; incorporating short bursts would have a small, though not in-
significant, effect on the overall limit (see Section 4 for details). Figure 1 shows the expected
GRB neutrino flux based on four representative models. The precursor model predicts a
neutrino flux as early as several tens of seconds prior to the observed GRB photons, whereas
the other models tested here predict a neutrino flux in coincidence with the GRB photons6.
Other models of GRB emission also exist (see, e.g. Dermer & Atoyan 2006, 2003); though
we do not explicitly focus on such models here, a flux upper limit can be calculated for such
models using the Green’s Function method detailed in Section 4.
Many theoretical models (most notably, the Waxman-Bahcall model) are based on as-
sumptions regarding the circumburst environment as well as the average properties of bursts
(total emission energy, redshift, etc.) which do not correspond directly to the properties
of specific bursts. It is possible to estimate the muon neutrino flux for individual bursts,
but these estimates vary substantially, and often bracket the predictions of the averaged
properties (Stamatikos 2005). For those bursts where redshift and spectral information is
available, more accurate estimates of muon neutrino flux can be made on a burst-by-burst
basis. For extremely bright, nearby bursts (e.g. GRB030329), the predicted fluxes can be
as much as two orders of magnitude greater than the mean burst flux (Stamatikos 2006).
Finally, our simulations assume a Φν :Φν ratio of 1:1. AMANDA does not distinguish the
muon charge; however, neutrino event rates are larger than anti-neutrino rates for an equal
flux, since the neutrino cross section is larger up to energies of ∼105 GeV. Thus, any mod-
els proposing a ratio other than unity will result in a different expected event rate and,
ultimately, a different flux upper limit for this analysis.
5Though the supranova model is still within the realm of possibility, it is somewhat disfavored based on
observations of GRB060218, in which the supernova preceded the GRB by at most a few hours—not long
enough to provide an ideal circumburst environment for a significant neutrino flux.
6Any time delay in observing the neutrinos due to the neutrino mass is assumed to be negligible compared
to the time scale over which we search for the burst emission.
– 10 –
3. Observation Procedure
3.1. Correlated Observations
This AMANDA GRB search relies on spatial and temporal correlations with photon
observations of other instruments including BATSE aboard the Compton Gamma-Ray Ob-
servatory (CGRO), as well as HETE-II, Ulysses, and other satellites of the Third Interplan-
etary Network (IPN) (Hurley 1998). As stated previously, our search is restricted to that
half of the bursts occurring in the Northern Hemisphere. Furthermore, because engineering
and maintenance work is performed on the AMANDA detector during the austral summer
(December-February), only a few bursts from these months can potentially be observed each
year. For each GRB in the dataset, we search for muon neutrino emission during the coinci-
dent phase of burst emission. The coincident phase is determined by either the T90 start and
end times of the burst, or the entire duration of emission in excess of the background rate (for
bursts without well-defined T90). A period of time before and after each burst is added to
the search in order to accommodate the timing errors of the photon observations (which vary
from burst to burst). Most bursts have prompt phases lasting from a few seconds up to to a
few tens of seconds, though there are some exceptional bursts lasting hundreds of seconds.
To investigate different model predictions for the bursts occurring during 2001-2003, we also
performed an extended search for precursor neutrinos from 110 seconds before the burst
start time until the beginning of the coincident search window. BATSE observations were
the sole source of data for the AMANDA B-10 analysis for 1997–1999. Other IPN-detected
bursts were included beginning with the AMANDA-II dataset in 2000, and the analysis then
relied exclusively on IPN data from other satellites once CGRO was decommissioned in May,
2000. Additional bursts were also discovered in the BATSE archival data (Kommers 1998;
Stern et al. 2001); the relevant time periods of the AMANDA data were searched for muon
neutrinos from these bursts as well. We do not, however, include this particular subset of
bursts in the flux or fluence upper limits for the models addressed in this work, because
non-triggered bursts were not incorporated into the primary models of GRB neutrino emis-
sion. The instruments participating in the Interplanetary Network through 2003 are given in
Table 1 and the number of bursts searched in each year of AMANDA observations is listed in
Table 2; information on the specific bursts included in this analysis is also available (Kuehn
2007).
– 11 –
3.2. Background and Detector Stability
To determine the background rate and to establish data selection criteria for each burst,
a larger period of one hour and 50 minutes of data is analyzed—from one hour before the
burst to one hour after the burst, with the 10 minute period during and immediately sur-
rounding the burst excluded to ensure that the data quality cuts are not determined in
a biased fashion (a “blind” analysis). Prior to determination of the data selection crite-
ria, we study detector stability in this background period. The specific stability criteria
for AMANDA B-10 have been discussed previously (Hardtke 2002); here we describe the
AMANDA-II stability criteria in more detail.
We perform two tests to identify non-statistical fluctuations in the data rate that could
produce fake events (“false positives”) or unanticipated dead time (“false negatives”) in the
detector. The first test compares the observed event count per 10 second time bin to the
expected, temporally uncorrelated, distribution of background events. This tests for any non-
statistical fluctuations in data rate due to temporary instability in the detector. Without
this test, an upward fluctuation in the data rate not caused by neutrinos could potentially
be misinterpreted as a signal event. This test has three successive steps based on the P-
value of the event rate distribution. The P-value of a data segment is defined as the percent
difference between the RMS variation of the data event rate and the width of a Gaussian fit
to the data rate distribution. The first step identifies all those bursts with stable periods—
those having a P-value of less than 6% (corresponding to variations of less than 1σ relative
to the overall distribution of P-values). The second step identifies bursts with marginally
stable detector performance: 6%≤P≤12% (1–2σ). Additional tests are performed on these
bursts; specifically, the data rate of the previously blinded 10-minute period is explored in a
region of the sky far away from the GRB (the “on-time, off-source” region). This maintains
the blindness of the analysis, while allowing a more detailed exploration of detector stability.
Marginally stable burst periods are included in the analysis if they are also marginally stable
in the on-time, off-source region (P-value less than 12%), and if the event rate has only small
(≤3σ) variations throughout the on-time, off-source region. The vast majority of all burst
time periods were stable according to these criteria. The final step of this test is applied if
the first two steps are inconclusive. It requires any event rate variations greater than 3σ to
occur at a significant distance from the burst time. Two bursts fall into this category; they
had marginally stable off-time periods and insufficient statistics for an on-time/off-source
stability test. However they were included in this analysis because the largest event rate
variations were separated in time from the burst by several minutes. Only one time period
associated with a burst in the AMANDA dataset had off-time and on-time/off-source P-
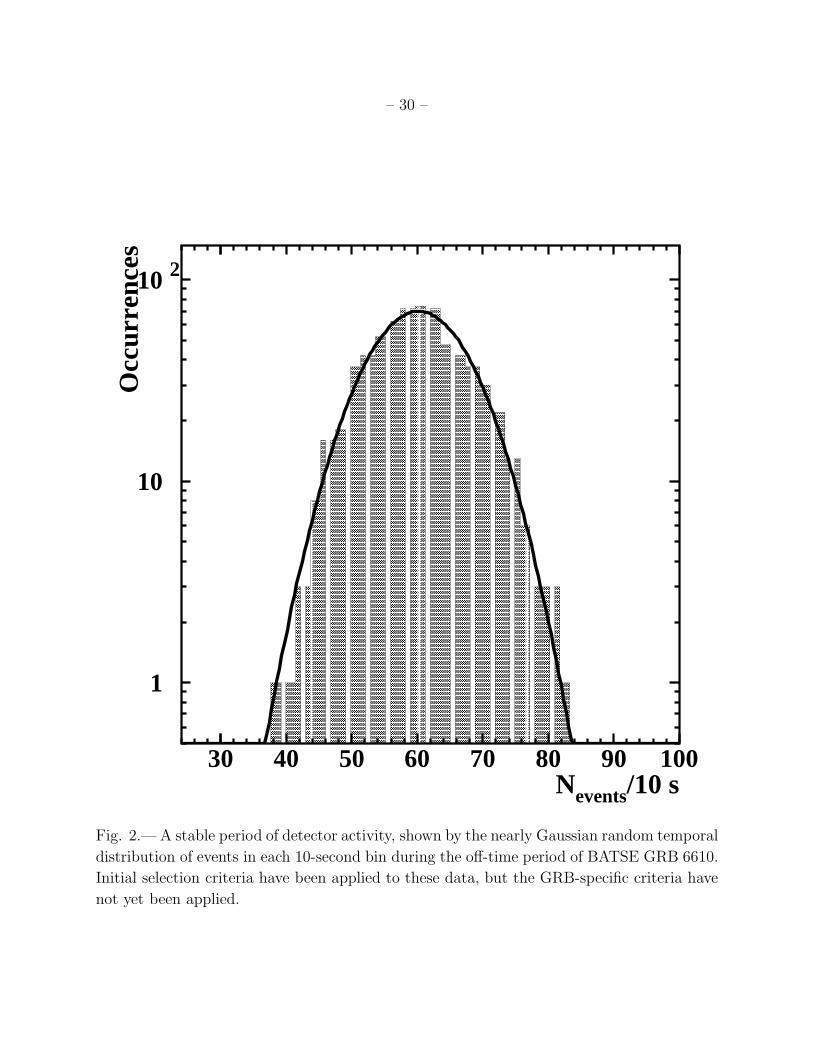
values greater than 12%, and this burst was excluded from the analysis. Figure 2 shows the
data rate per 10 seconds for a sample GRB period, overlaid with the Gaussian fit. They are
– 12 –
in very good agreement, showing a stable data rate for this period of detector activity.
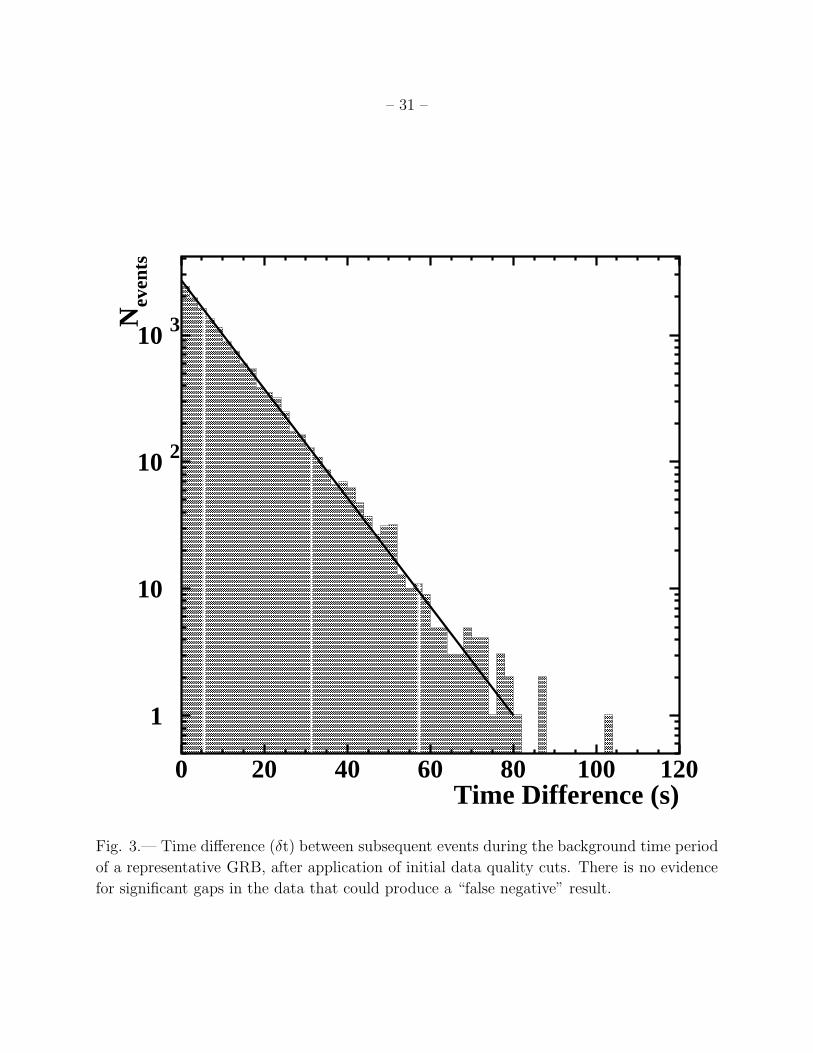
The second test utilizes the time between subsequent events (δt) to ensure that there
is not an anomalously large amount of time between detector triggers. The amount of time
between triggers can vary widely, but larger gaps occur with much less frequency than shorter
gaps. There is also unavoidable (but quantifiable) dead time between each trigger while the
detector is being read out. The overall effect of the expected dead time is to reduce the
detector’s signal acceptance by approximately 17%, and this quantity has been incorporated
into the expected neutrino observation rate for this analysis. However, large unexpected
gaps between triggers would indicate a period of unstable detector performance, and would
mean that an otherwise detectable neutrino signal might not be observed during such a
period. We test the 1 hour and 50 minute time periods surrounding each burst to ensure
that no such gaps occur. An example of the temporal distribution of triggers compared with
an exponentially decreasing fit to the δt distribution is shown in Figure 3. The variations
observed in the data for this time period are within 2σ of the observed fit for all values of
δt. Thus there are no unexpected variations in the time between detector triggers, and we
confirm that AMANDA is collecting data as expected occurring during the on-time window
for this burst. All data periods associated with GRBs that pass the first test also pass this
second test for stable detector operation.
3.3. Data Selection Criteria
For those bursts determined to be stable by the above criteria, data quality cuts are then
selected to separate the predicted signal from the observed background events. This process
relies primarily on the simulated signal events and the observed background events. The
simulation of the detector response to signal and background events is described in Ahrens
et al. (Ahrens et al. 2004). The simulation procedure uses the neutrino generation pro-
gram NuSim (Hill 1997) for signal event simulations. Background events are simulated with
CORSIKA (Heck et al. 1998), which implements the 2001 version of the QGSJET model of
hadronic interactions (Kalmykov & Ostapchenko 1993). Once the neutrino or other cosmic-
ray primaries are generated and propagated to their interaction vertex, we simulate the sec-
ondary propagation with the Muon Monte Carlo (MMC) package (Chirkin & Rhode 2004).
Finally, we simulate the AMANDA detector response with the software package AMASIM.
We then are able to compare simulated signal, simulated background, and observed back-
ground data.
In the case of the GRB search, the background rate is measured using the off-time
window, where no signal is expected. Thus, unlike other AMANDA analyses (Ahrens et al.
– 13 –
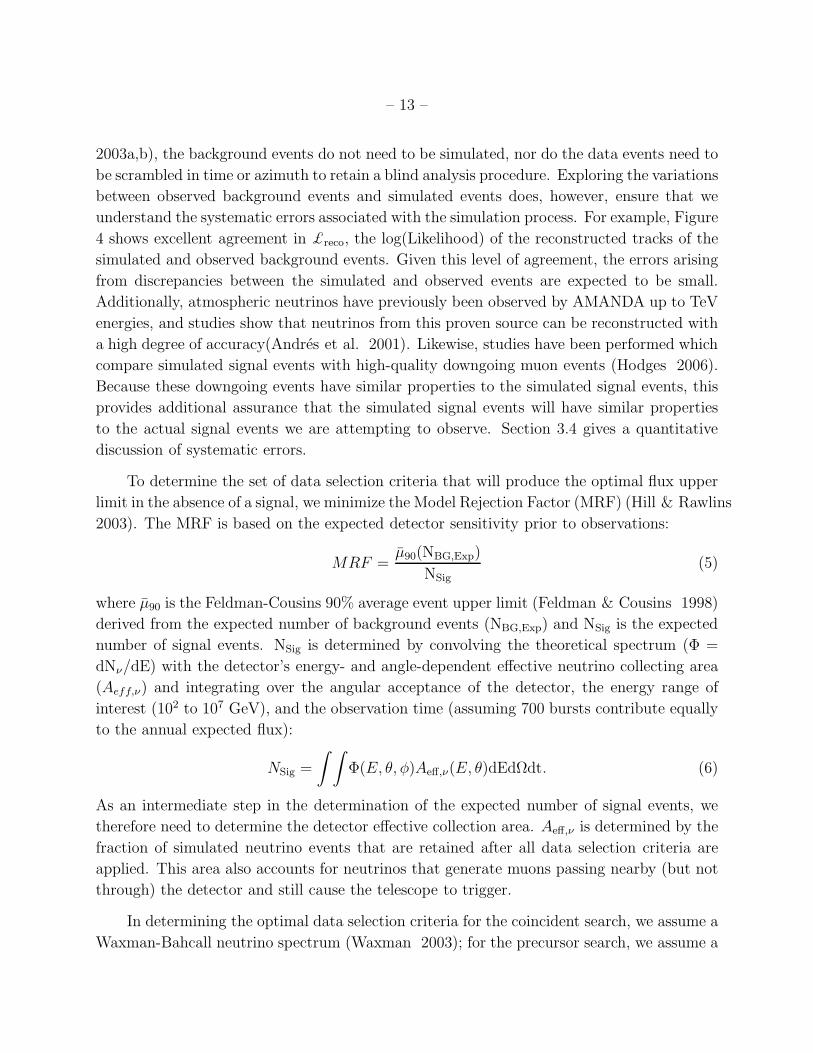
2003a,b), the background events do not need to be simulated, nor do the data events need to
be scrambled in time or azimuth to retain a blind analysis procedure. Exploring the variations
between observed background events and simulated events does, however, ensure that we
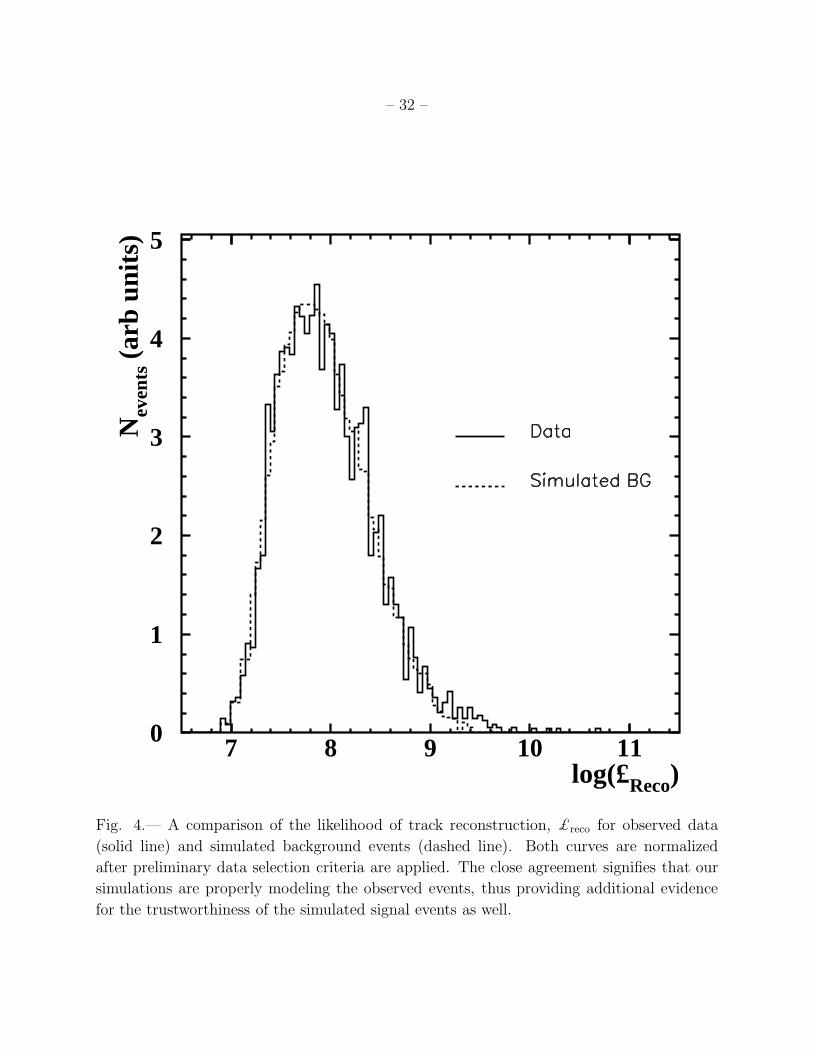
understand the systematic errors associated with the simulation process. For example, Figure
4 shows excellent agreement in £reco, the log(Likelihood) of the reconstructed tracks of the
simulated and observed background events. Given this level of agreement, the errors arising
from discrepancies between the simulated and observed events are expected to be small.
Additionally, atmospheric neutrinos have previously been observed by AMANDA up to TeV
energies, and studies show that neutrinos from this proven source can be reconstructed with
a high degree of accuracy(Andres et al. 2001). Likewise, studies have been performed which
compare simulated signal events with high-quality downgoing muon events (Hodges 2006).
Because these downgoing events have similar properties to the simulated signal events, this
provides additional assurance that the simulated signal events will have similar properties
to the actual signal events we are attempting to observe. Section 3.4 gives a quantitative
discussion of systematic errors.
To determine the set of data selection criteria that will produce the optimal flux upper
limit in the absence of a signal, we minimize the Model Rejection Factor (MRF) (Hill & Rawlins
2003). The MRF is based on the expected detector sensitivity prior to observations:
MRF =µ90(NBG,Exp)
NSig
(5)
where µ90 is the Feldman-Cousins 90% average event upper limit (Feldman & Cousins 1998)
derived from the expected number of background events (NBG,Exp) and NSig is the expected
number of signal events. NSig is determined by convolving the theoretical spectrum (Φ =
dNν/dE) with the detector’s energy- and angle-dependent effective neutrino collecting area
(Aeff,ν) and integrating over the angular acceptance of the detector, the energy range of
interest (102 to 107 GeV), and the observation time (assuming 700 bursts contribute equally
to the annual expected flux):
NSig =
∫ ∫Φ(E, θ, φ)Aeff,ν(E, θ)dEdΩdt. (6)
As an intermediate step in the determination of the expected number of signal events, we
therefore need to determine the detector effective collection area. Aeff,ν is determined by the
fraction of simulated neutrino events that are retained after all data selection criteria are
applied. This area also accounts for neutrinos that generate muons passing nearby (but not
through) the detector and still cause the telescope to trigger.
In determining the optimal data selection criteria for the coincident search, we assume a
Waxman-Bahcall neutrino spectrum (Waxman 2003); for the precursor search, we assume a
– 14 –
Razzaque spectrum (Razzaque et al. 2003a). In addition to temporal coincidence described
previously, the most relevant selection criterion for this analysis is the angular mismatch
(∆Ψi) between the burst position and the reconstructed event track. This mismatch is
determined for each of four separate maximum-likelihood pattern recognition algorithms (i
= 1 to 4) applied to the timing of the hit OMs (as described in Section 2). The different
algorithms are based on different initial seeds and apply a different number of iterations to
the track reconstruction procedure, thus they are able to provide different measures used
for discrimination between expected signal and background events. Though they are not
completely independent, they do offer improvements to the MRF when applied consecutively.
The inherent difference in the muon and neutrino paths, as well as the inaccuracies of
the reconstruction algorithms, prevent perfect characterization of all signal and background
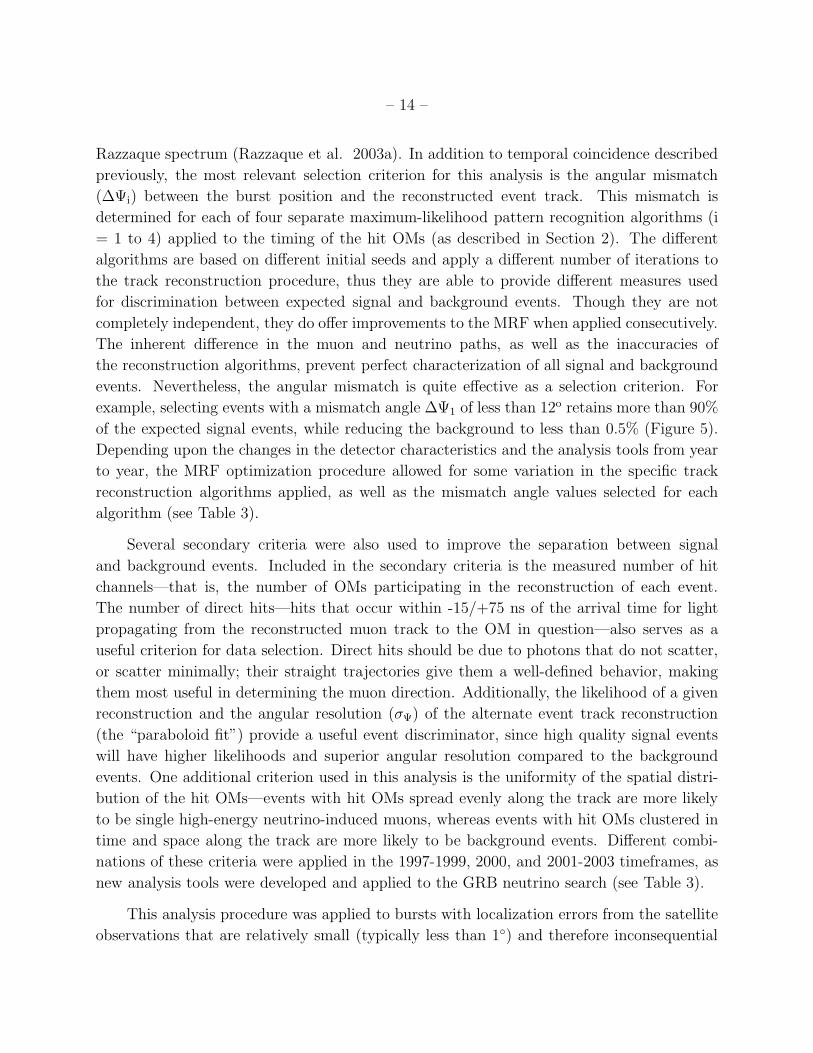
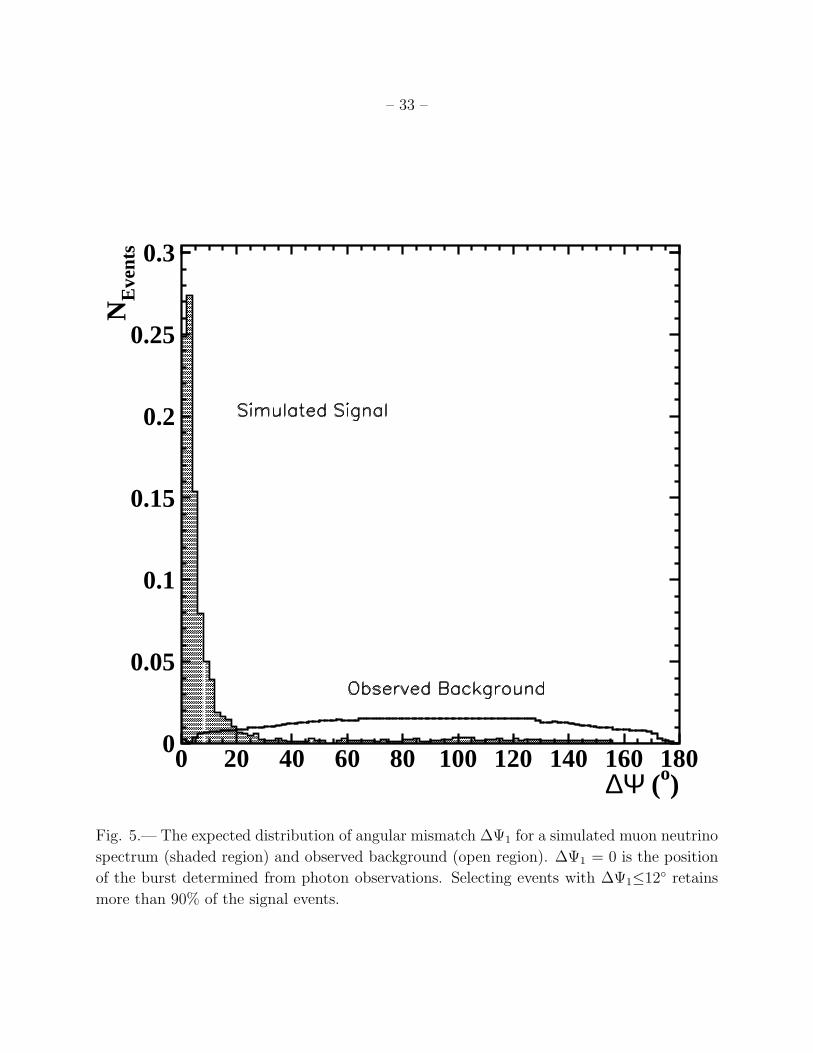
events. Nevertheless, the angular mismatch is quite effective as a selection criterion. For
example, selecting events with a mismatch angle ∆Ψ1 of less than 12o retains more than 90%
of the expected signal events, while reducing the background to less than 0.5% (Figure 5).
Depending upon the changes in the detector characteristics and the analysis tools from year
to year, the MRF optimization procedure allowed for some variation in the specific track
reconstruction algorithms applied, as well as the mismatch angle values selected for each
algorithm (see Table 3).
Several secondary criteria were also used to improve the separation between signal
and background events. Included in the secondary criteria is the measured number of hit
channels—that is, the number of OMs participating in the reconstruction of each event.
The number of direct hits—hits that occur within -15/+75 ns of the arrival time for light
propagating from the reconstructed muon track to the OM in question—also serves as a
useful criterion for data selection. Direct hits should be due to photons that do not scatter,
or scatter minimally; their straight trajectories give them a well-defined behavior, making
them most useful in determining the muon direction. Additionally, the likelihood of a given
reconstruction and the angular resolution (σΨ) of the alternate event track reconstruction
(the “paraboloid fit”) provide a useful event discriminator, since high quality signal events
will have higher likelihoods and superior angular resolution compared to the background
events. One additional criterion used in this analysis is the uniformity of the spatial distri-
bution of the hit OMs—events with hit OMs spread evenly along the track are more likely
to be single high-energy neutrino-induced muons, whereas events with hit OMs clustered in
time and space along the track are more likely to be background events. Different combi-
nations of these criteria were applied in the 1997-1999, 2000, and 2001-2003 timeframes, as
new analysis tools were developed and applied to the GRB neutrino search (see Table 3).
This analysis procedure was applied to bursts with localization errors from the satellite
observations that are relatively small (typically less than 1) and therefore inconsequential
– 15 –
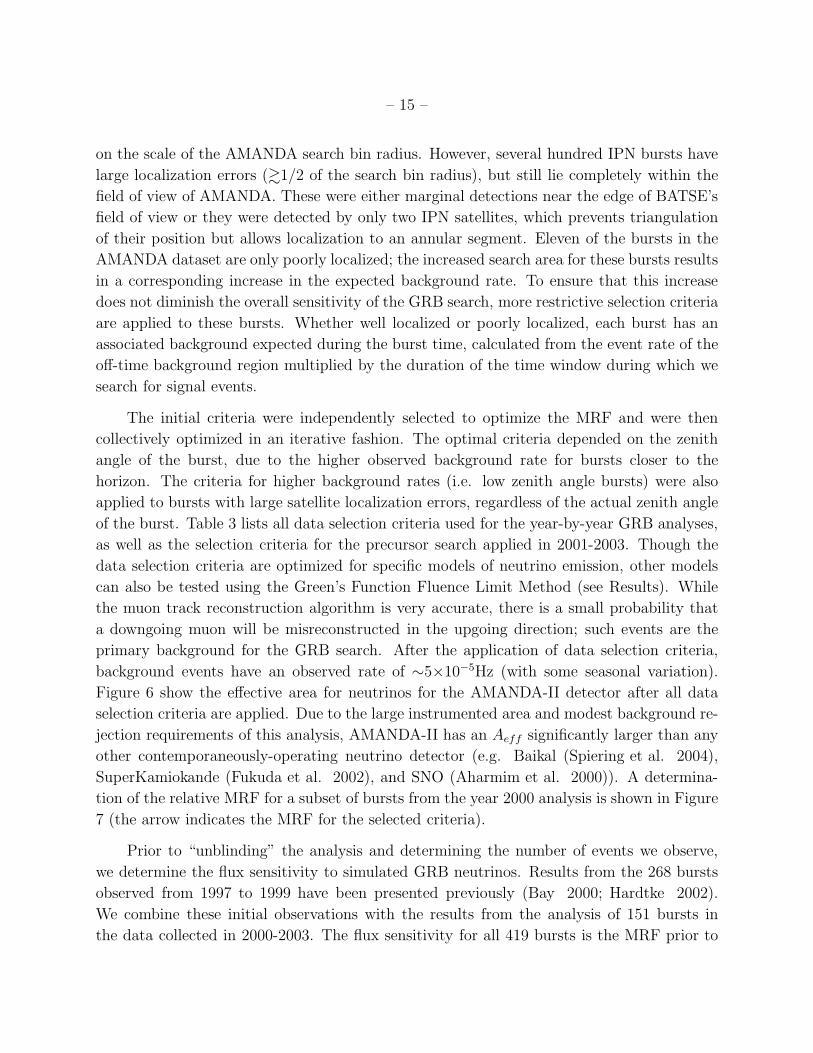
on the scale of the AMANDA search bin radius. However, several hundred IPN bursts have
large localization errors (&1/2 of the search bin radius), but still lie completely within the
field of view of AMANDA. These were either marginal detections near the edge of BATSE’s
field of view or they were detected by only two IPN satellites, which prevents triangulation
of their position but allows localization to an annular segment. Eleven of the bursts in the
AMANDA dataset are only poorly localized; the increased search area for these bursts results
in a corresponding increase in the expected background rate. To ensure that this increase
does not diminish the overall sensitivity of the GRB search, more restrictive selection criteria
are applied to these bursts. Whether well localized or poorly localized, each burst has an
associated background expected during the burst time, calculated from the event rate of the
off-time background region multiplied by the duration of the time window during which we
search for signal events.
The initial criteria were independently selected to optimize the MRF and were then
collectively optimized in an iterative fashion. The optimal criteria depended on the zenith
angle of the burst, due to the higher observed background rate for bursts closer to the
horizon. The criteria for higher background rates (i.e. low zenith angle bursts) were also
applied to bursts with large satellite localization errors, regardless of the actual zenith angle
of the burst. Table 3 lists all data selection criteria used for the year-by-year GRB analyses,
as well as the selection criteria for the precursor search applied in 2001-2003. Though the
data selection criteria are optimized for specific models of neutrino emission, other models
can also be tested using the Green’s Function Fluence Limit Method (see Results). While
the muon track reconstruction algorithm is very accurate, there is a small probability that
a downgoing muon will be misreconstructed in the upgoing direction; such events are the
primary background for the GRB search. After the application of data selection criteria,
background events have an observed rate of ∼5×10⁻⁵Hz (with some seasonal variation).
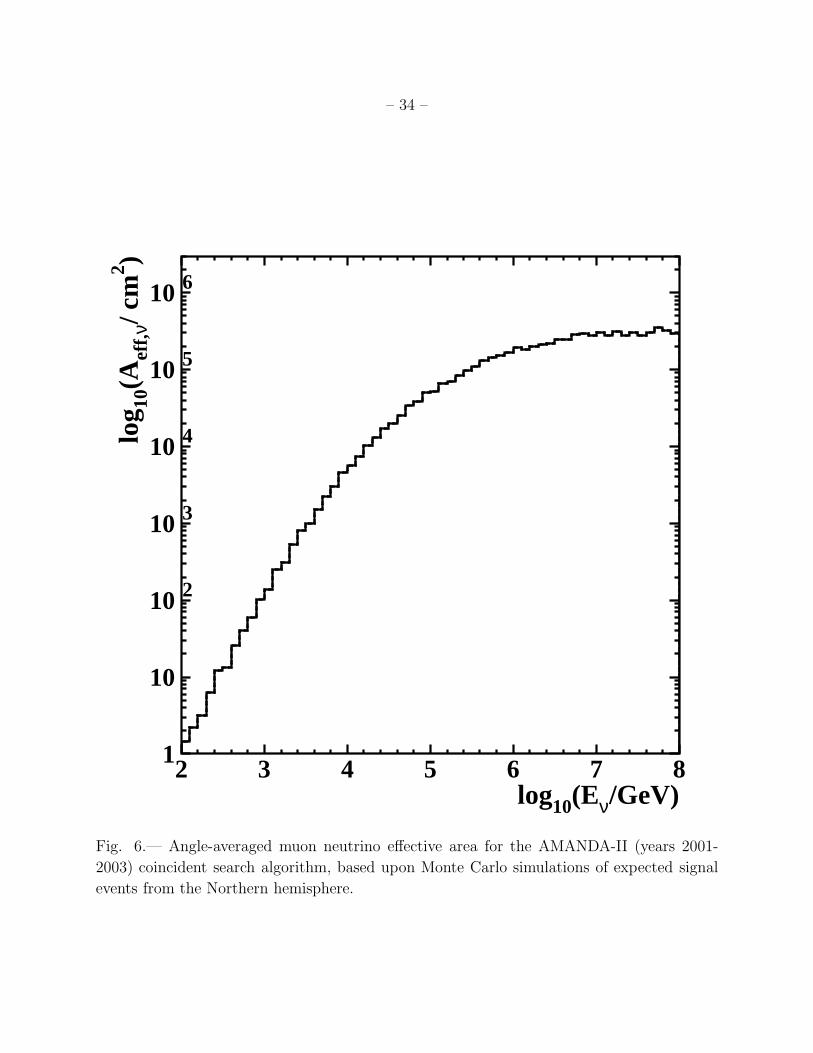
Figure 6 show the effective area for neutrinos for the AMANDA-II detector after all data
selection criteria are applied. Due to the large instrumented area and modest background re-
jection requirements of this analysis, AMANDA-II has an Aeff significantly larger than any
other contemporaneously-operating neutrino detector (e.g. Baikal (Spiering et al. 2004),
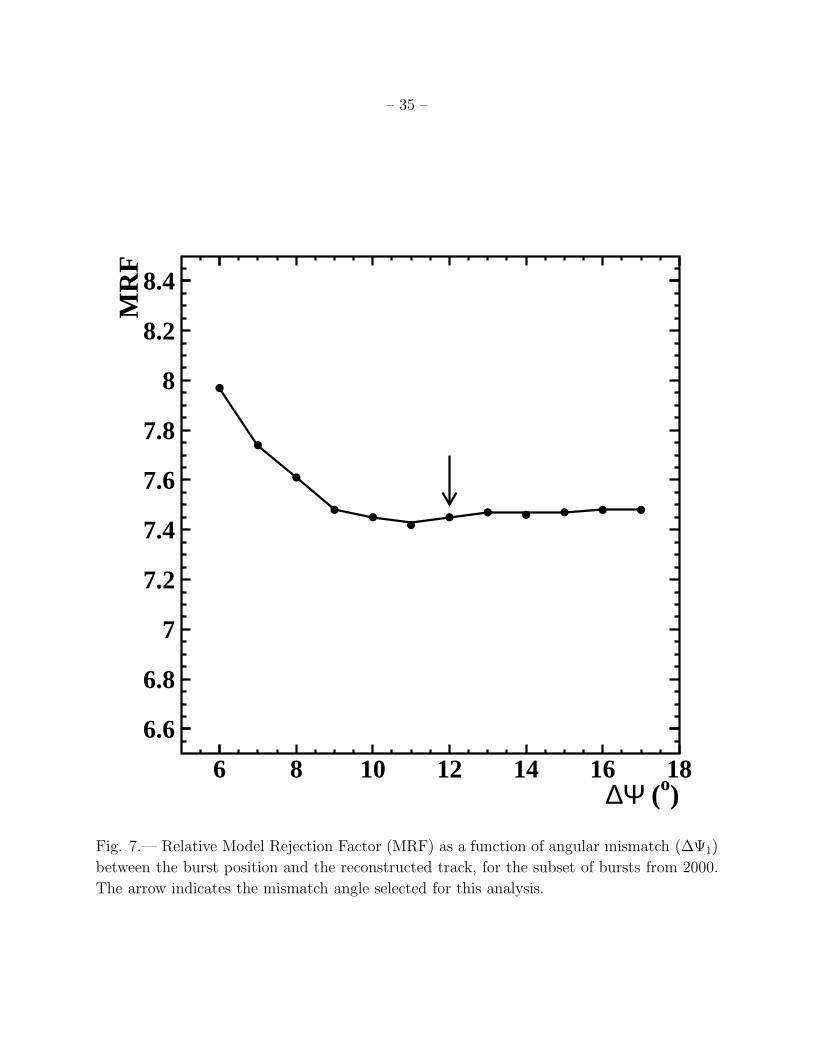
SuperKamiokande (Fukuda et al. 2002), and SNO (Aharmim et al. 2000)). A determina-
tion of the relative MRF for a subset of bursts from the year 2000 analysis is shown in Figure
7 (the arrow indicates the MRF for the selected criteria).
Prior to “unblinding” the analysis and determining the number of events we observe,
we determine the flux sensitivity to simulated GRB neutrinos. Results from the 268 bursts
observed from 1997 to 1999 have been presented previously (Bay 2000; Hardtke 2002).
We combine these initial observations with the results from the analysis of 151 bursts in
the data collected in 2000-2003. The flux sensitivity for all 419 bursts is the MRF prior to
– 16 –
observations (see equation 5) multiplied by the normalization of the input spectrum; that
is, E2Φν ≤2 × 10⁻⁸ GeVcm−2s−1sr−1 for a Waxman-Bahcall muon neutrino spectrum with
90% of the events expected between ∼10 TeV and ∼3 PeV. This sensitivity is calculated
prior to the inclusion of systematic uncertainties.
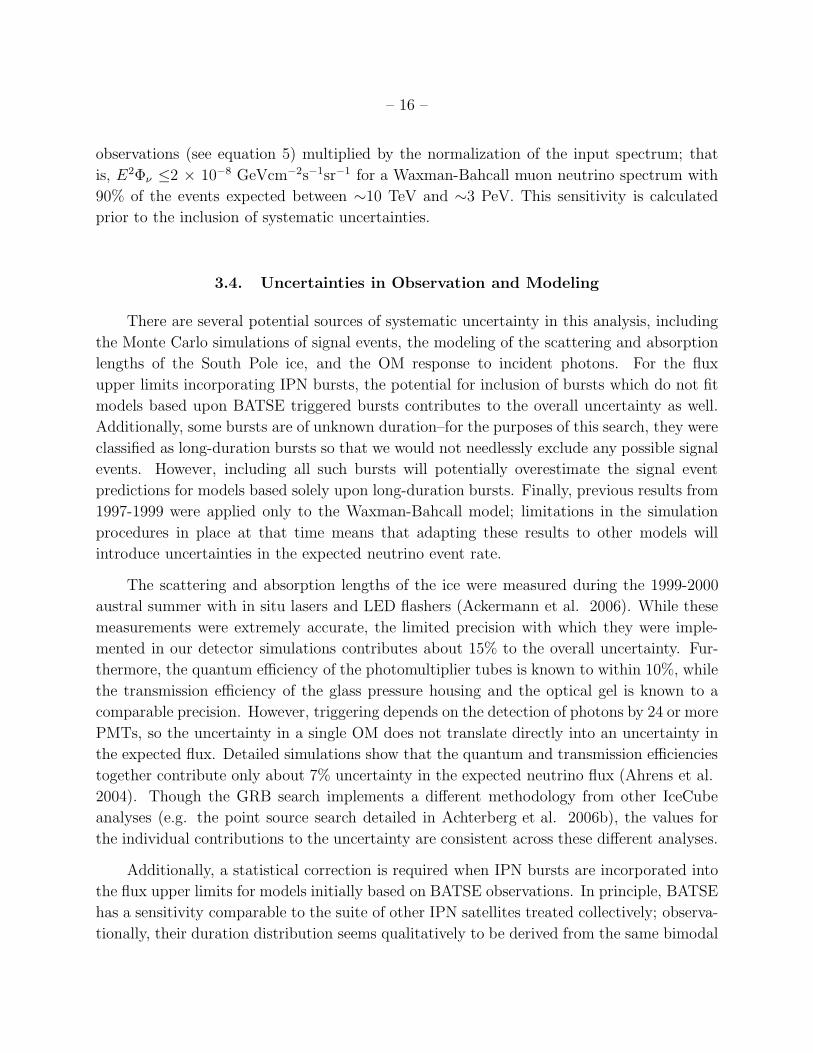
3.4. Uncertainties in Observation and Modeling
There are several potential sources of systematic uncertainty in this analysis, including
the Monte Carlo simulations of signal events, the modeling of the scattering and absorption
lengths of the South Pole ice, and the OM response to incident photons. For the flux
upper limits incorporating IPN bursts, the potential for inclusion of bursts which do not fit
models based upon BATSE triggered bursts contributes to the overall uncertainty as well.
Additionally, some bursts are of unknown duration–for the purposes of this search, they were
classified as long-duration bursts so that we would not needlessly exclude any possible signal
events. However, including all such bursts will potentially overestimate the signal event
predictions for models based solely upon long-duration bursts. Finally, previous results from
1997-1999 were applied only to the Waxman-Bahcall model; limitations in the simulation
procedures in place at that time means that adapting these results to other models will
introduce uncertainties in the expected neutrino event rate.
The scattering and absorption lengths of the ice were measured during the 1999-2000
austral summer with in situ lasers and LED flashers (Ackermann et al. 2006). While these
measurements were extremely accurate, the limited precision with which they were imple-
mented in our detector simulations contributes about 15% to the overall uncertainty. Fur-
thermore, the quantum efficiency of the photomultiplier tubes is known to within 10%, while
the transmission efficiency of the glass pressure housing and the optical gel is known to a
comparable precision. However, triggering depends on the detection of photons by 24 or more
PMTs, so the uncertainty in a single OM does not translate directly into an uncertainty in
the expected flux. Detailed simulations show that the quantum and transmission efficiencies
together contribute only about 7% uncertainty in the expected neutrino flux (Ahrens et al.
2004). Though the GRB search implements a different methodology from other IceCube
analyses (e.g. the point source search detailed in Achterberg et al. 2006b), the values for
the individual contributions to the uncertainty are consistent across these different analyses.
Additionally, a statistical correction is required when IPN bursts are incorporated into
the flux upper limits for models initially based on BATSE observations. In principle, BATSE
has a sensitivity comparable to the suite of other IPN satellites treated collectively; observa-
tionally, their duration distribution seems qualitatively to be derived from the same bimodal
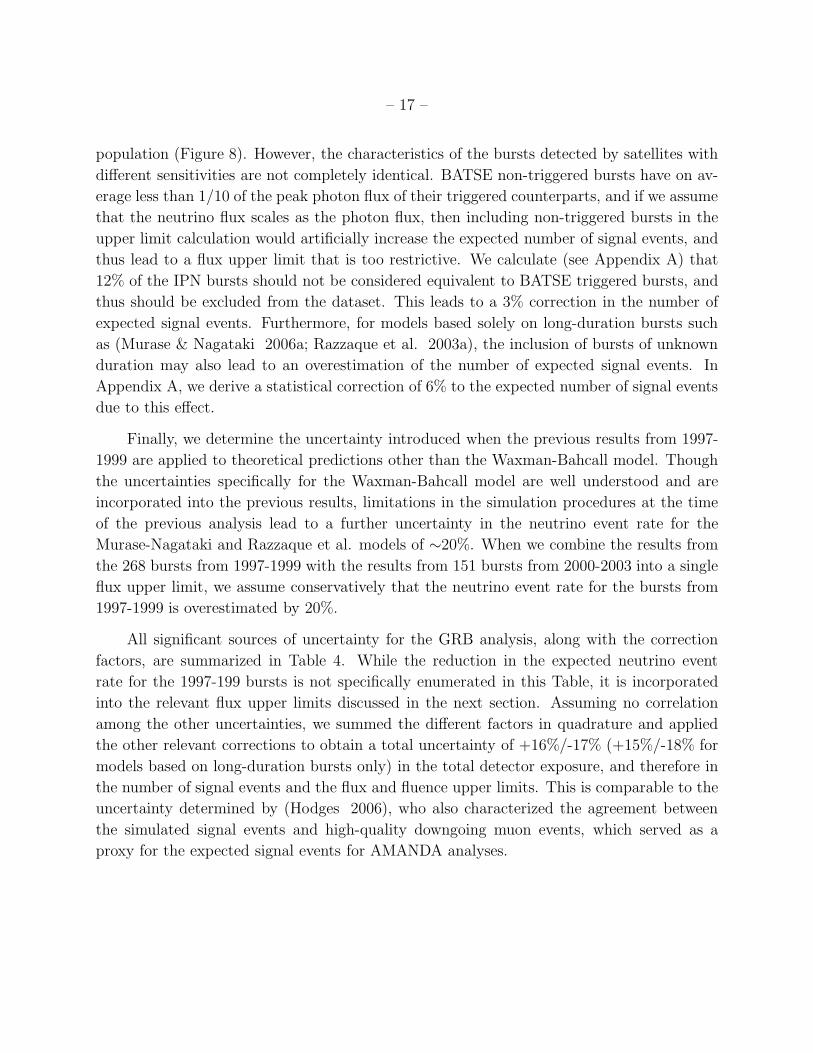
– 17 –
population (Figure 8). However, the characteristics of the bursts detected by satellites with
different sensitivities are not completely identical. BATSE non-triggered bursts have on av-
erage less than 1/10 of the peak photon flux of their triggered counterparts, and if we assume
that the neutrino flux scales as the photon flux, then including non-triggered bursts in the
upper limit calculation would artificially increase the expected number of signal events, and
thus lead to a flux upper limit that is too restrictive. We calculate (see Appendix A) that
12% of the IPN bursts should not be considered equivalent to BATSE triggered bursts, and
thus should be excluded from the dataset. This leads to a 3% correction in the number of
expected signal events. Furthermore, for models based solely on long-duration bursts such
as (Murase & Nagataki 2006a; Razzaque et al. 2003a), the inclusion of bursts of unknown
duration may also lead to an overestimation of the number of expected signal events. In
Appendix A, we derive a statistical correction of 6% to the expected number of signal events
due to this effect.
Finally, we determine the uncertainty introduced when the previous results from 1997-
1999 are applied to theoretical predictions other than the Waxman-Bahcall model. Though
the uncertainties specifically for the Waxman-Bahcall model are well understood and are
incorporated into the previous results, limitations in the simulation procedures at the time
of the previous analysis lead to a further uncertainty in the neutrino event rate for the
Murase-Nagataki and Razzaque et al. models of ∼20%. When we combine the results from
the 268 bursts from 1997-1999 with the results from 151 bursts from 2000-2003 into a single
flux upper limit, we assume conservatively that the neutrino event rate for the bursts from
1997-1999 is overestimated by 20%.
All significant sources of uncertainty for the GRB analysis, along with the correction
factors, are summarized in Table 4. While the reduction in the expected neutrino event
rate for the 1997-199 bursts is not specifically enumerated in this Table, it is incorporated
into the relevant flux upper limits discussed in the next section. Assuming no correlation
among the other uncertainties, we summed the different factors in quadrature and applied
the other relevant corrections to obtain a total uncertainty of +16%/-17% (+15%/-18% for
models based on long-duration bursts only) in the total detector exposure, and therefore in
the number of signal events and the flux and fluence upper limits. This is comparable to the
uncertainty determined by (Hodges 2006), who also characterized the agreement between
the simulated signal events and high-quality downgoing muon events, which served as a
proxy for the expected signal events for AMANDA analyses.
– 18 –
4. Results
We observe zero events from the 419 Northern Hemisphere bursts searched during the
years 1997 to 2003, which is consistent with the background estimate of 1.74 events (Table
5)7. Since the observed number of events is less than the expected background, the flux upper
limits for the coincident muon neutrino search is approximately a factor of three better than
the expected sensitivity (i.e. the observed MRF for a Waxman-Bahcall flux is 1.3 compared
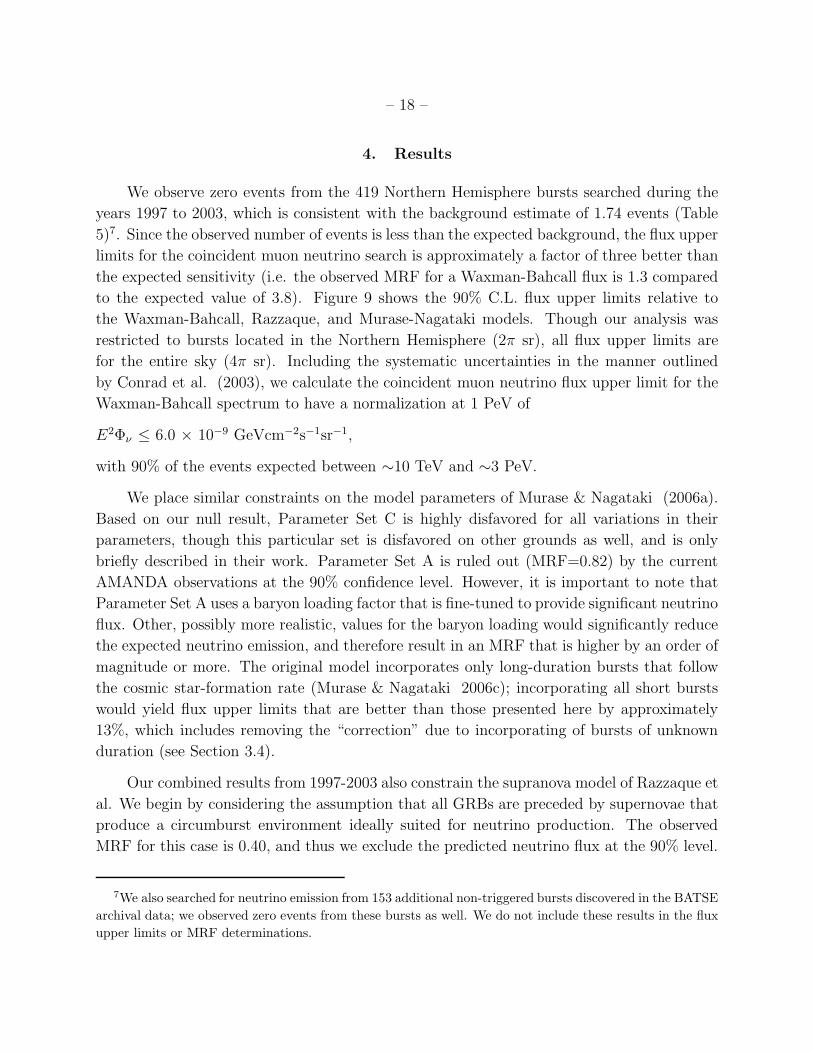
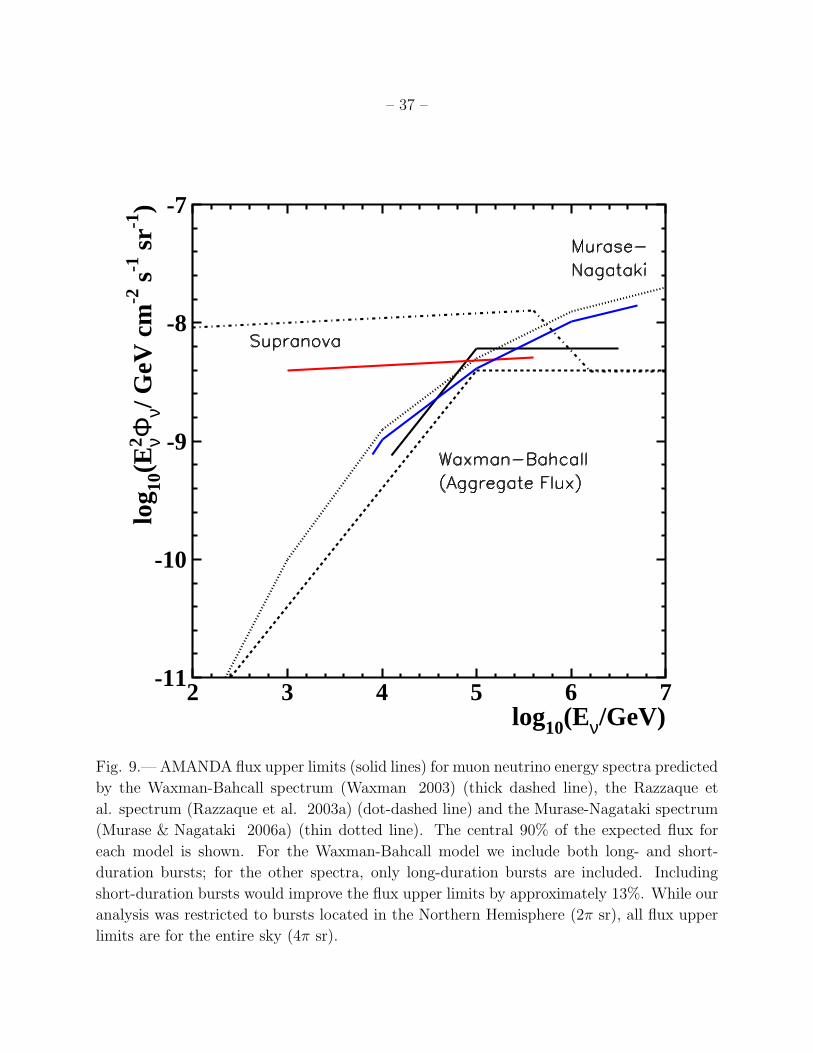
to the expected value of 3.8). Figure 9 shows the 90% C.L. flux upper limits relative to
the Waxman-Bahcall, Razzaque, and Murase-Nagataki models. Though our analysis was
restricted to bursts located in the Northern Hemisphere (2π sr), all flux upper limits are
for the entire sky (4π sr). Including the systematic uncertainties in the manner outlined
by Conrad et al. (2003), we calculate the coincident muon neutrino flux upper limit for the
Waxman-Bahcall spectrum to have a normalization at 1 PeV of
E2Φν ≤ 6.0 × 10⁻⁹ GeVcm−2s−1sr−1,
with 90% of the events expected between ∼10 TeV and ∼3 PeV.
We place similar constraints on the model parameters of Murase & Nagataki (2006a).
Based on our null result, Parameter Set C is highly disfavored for all variations in their
parameters, though this particular set is disfavored on other grounds as well, and is only
briefly described in their work. Parameter Set A is ruled out (MRF=0.82) by the current
AMANDA observations at the 90% confidence level. However, it is important to note that
Parameter Set A uses a baryon loading factor that is fine-tuned to provide significant neutrino
flux. Other, possibly more realistic, values for the baryon loading would significantly reduce
the expected neutrino emission, and therefore result in an MRF that is higher by an order of
magnitude or more. The original model incorporates only long-duration bursts that follow
the cosmic star-formation rate (Murase & Nagataki 2006c); incorporating all short bursts
would yield flux upper limits that are better than those presented here by approximately
13%, which includes removing the “correction” due to incorporating of bursts of unknown
duration (see Section 3.4).
Our combined results from 1997-2003 also constrain the supranova model of Razzaque et
al. We begin by considering the assumption that all GRBs are preceded by supernovae that
produce a circumburst environment ideally suited for neutrino production. The observed
MRF for this case is 0.40, and thus we exclude the predicted neutrino flux at the 90% level.
7We also searched for neutrino emission from 153 additional non-triggered bursts discovered in the BATSE
archival data; we observed zero events from these bursts as well. We do not include these results in the flux
upper limits or MRF determinations.
– 19 –
Furthermore, the flux upper limit determined for this model is derived from observations
of long bursts only. As with the results of Murase & Nagataki (2006a), if this model is
expanded to include short-duration bursts, the flux upper limit improves by approximately
13%. However, only a very small number of all bursts (∼4 out of many thousands) have
been observed in association with SNe. And, as described in Section 2, at least a fraction
of these SNe did not occur at an ideal time relative to the burst. Thus, AMANDA’s results
confirm previous observations that lead us to expect less than maximal emission from this
model of GRB neutrino production.
Finally, we observe zero events (on an expected background of 0.2 events) from the
precursor time period of the bursts from 2001-2003 (Table 6). The precursor model of
neutrino production was tested for only a small subset of the long-duration bursts, and
the neutrino energy spectrum peaks at a level where the AMANDA-II sensitivity is greatly
reduced. Thus, the flux upper limit for the precursor model is significantly less restrictive.
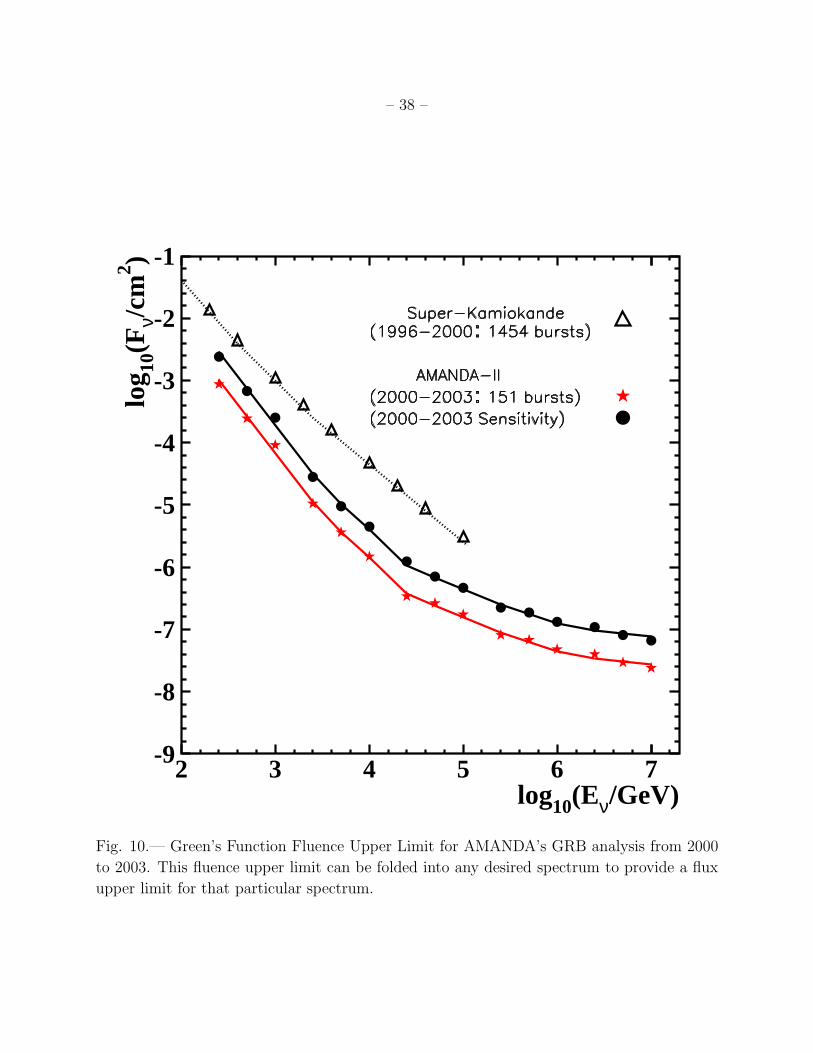
The results of these analyses can also be applied to any other hypothesized spec-
trum by using the Green’s Function Fluence Limit formula, in a method similar to that
presented by the Super-Kamiokande Collaboration (Fukuda et al. 2002). By folding the
energy-dependent sensitivity of the detector into a desired theoretical spectrum, one can
straightforwardly calculate a flux upper limit for that specific spectrum. The Green’s Func-
tion fluence upper limit for AMANDA-II (Figure 10) extends several orders of magnitude
in energy beyond the range of the Super-Kamiokande limit, and is approximately an order
of magnitude lower than the Super-Kamiokande results in the region of overlap, primarily
due to the much larger effective area of AMANDA-II. For example, at 100 TeV we calculate
Fν ≤ 1.7 × 10⁻⁷ cm−2 (see also Appendix B). As this method does not rely on averaging
burst properties (as many specific models do), it is particularly effective for incorporating
large burst-to-burst variations in expected muon neutrino flux (e.g. for GRB030329, see
Stamatikos 2006).
5. Conclusion and Outlook
The AMANDA dataset has been searched for muon neutrino emission from more than
400 GRBs based on temporal and spatial coincidence with photon detections from numerous
other observatories. We determined that the detector was operating in a stable fashion
during all of these bursts, and we have shown that the application of a number of data
selection criteria lead to an optimized value of the Model Rejection Factor for the Waxman-
Bahcall neutrino spectrum. After the application of these criteria, zero neutrino events were
observed in coincidence with the bursts, resulting in the most stringent upper limit on the
– 20 –
muon neutrino flux from GRBs to date. We have compared this limit to the flux predictions
from several prominent GRB models based on averaged burst properties. We constrain the
parameter space of a number of these models at the 90% confidence level; in particular, our
flux upper limit is more than a factor of 2 below the most optimistic predictions of Razzaque
et al. However, we do not yet rule out the predictions of the canonical Waxman & Bahcall
model. Furthermore, because individual bursts vary significantly in their expected neutrino
spectra, we have presented a spectrum-independent method for determining flux upper limits
for these bursts. The observations detailed in this work will play a significant role as future
analyses seek to further constrain various theoretical models.
Finally, AMANDA’s search for muon neutrinos from more recent GRBs will benefit
greatly from the advanced capabilities of the Swift satellite (Burrows et al. 2005), as will
the GRB searches of other neutrino observatories currently in operation (Spiering et al.
2004; Resvanis et al. 2003; Aguilar et al. 2006). While Swift’s rate of GRB detections is
lower than that of BATSE, the spatial localizations of the bursts by Swift are much more
precise, which will obviate the need for a special analysis of poorly-localized bursts with
its accompanying reduction in signal detection efficiency. Additionally, the InterPlanetary
Network of satellites will continue to operate, and will incorporate newer instruments as
they come online. In particular, future missions such as the Gamma-Ray Large Area Space
Telescope (Carson 2006) will provide an even greater number of GRB localizations for use
in neutrino searches. Furthermore, while analyses similar to the one presented here will con-
tinue to search specifically for muon neutrino flux in coincidence with photon observations of
gamma-ray bursts, the method described here can be expanded to search for neutrinos corre-
lated with other transient point sources as well (see Appendix C). In the future, AMANDA
and its successor, IceCube, will have many more opportunities to detect neutrino emission
from a host of astrophysical sources. Construction of IceCube is currently underway, and
the instrumented volume for the partial detector is already significantly larger than the final
instrumented volume of AMANDA. A fully-instrumented IceCube detector should surpass
AMANDA’s flux upper limits within its first few years of operation.
6. Acknowledgements
The authors are thankful to E. Waxman and K. Murase for productive and thought-
provoking discussions, S. Desai for detailed discussions regarding the Super-Kamiokande
GRB analysis, and the additional members of the Interplanetary Network for providing data
that were crucial to this work. The IceCube collaboration acknowledges the support from
the following agencies: National Science Foundation-Office of Polar Program, National Sci-
– 21 –
ence Foundation-Physics Division, University of Wisconsin Alumni Research Foundation,
Department of Energy, and National Energy Research Scientific Computing Center (sup-
ported by the Office of Energy Research of the Department of Energy), the NSF-supported
TeraGrid system at the San Diego Supercomputer Center (SDSC), and the National Center
for Supercomputing Applications (NCSA); Swedish Research Council, Swedish Polar Re-
search Secretariat, and Knut and Alice Wallenberg Foundation, Sweden; German Ministry
for Education and Research, Deutsche Forschungsgemeinschaft (DFG), Germany; Fund for
Scientific Research (FNRS-FWO), Flanders Institute to encourage scientific and technologi-
cal research in industry (IWT), Belgian Federal Office for Scientific, Technical and Cultural
affairs (OSTC); the Netherlands Organisation for Scientific Research (NWO); M. Ribordy
acknowledges the support of the SNF (Switzerland); J. D. Zornoza acknowledges the Marie
Curie OIF Program (contract 007921). K. Hurley is grateful for IPN support under the
following contractsand grants: Ulysses, JPL958056; Mars Odyssey, JPL 1282043; HETE,
MIT-SC-R-293291; the U.S. BeppoSAX Guest Investigator program; the U.S. INTEGRAL
Guest Investigator program. Integration of NEAR into the Interplanetary Network was
supported by NASA’s NEAR Participating Scientist program. Integration of RHESSI was
supported by NASA’s Long Term Space Astrophysics program under grant NAG5-13080.
Facilities: AMANDA
A. Model-Dependent Statistical Corrections to Flux Upper Limits
Though the ν flux formulation of Waxman (2003) explicitly links GRB neutrinos
to the UHECR flux, elsewhere a formulation based on BATSE observations is treated in
a comparable fashion, and is considered to arise from the same underlying phenomena
(Waxman & Bahcall 1997). Thus it is necessary to address the limitations introduced by
AMANDA’s reliance upon BATSE observations. As described in Section 3.4, models defined
initially in terms of BATSE observations were also applied to bursts detected by the other
IPN satellites. However, we cannot assume that characteristics of bursts detected by satel-
lites with different sensitivities are completely identical. Since BATSE was decommissioned
in May of 2000, there is no longer a way to cross-correlate the two datasets. Non-triggered
BATSE bursts have on average less than 1/10 of the peak photon flux of the triggered bursts;
assuming that the energy of neutrinos scales with the energy carried by gamma rays, we ex-
pect only a small fraction of the standard neutrino flux from these non-triggered bursts.
Thus, if non-triggered bursts are inadvertently included in the flux upper limit, they will
artificially improve that limit, because the extra bursts are assumed to have a larger neutrino
flux than they would actually possess.
– 22 –
During the period of simultaneous operation from 1991 to 2000, 1088 IPN bursts were
observed by BATSE, 953 of which were triggered. Undoubtedly some of these bursts did not
trigger BATSE for reasons other than a lower flux. For example, BATSE may have been
powered down, may have been in the vicinity of the South Atlantic Anomaly, or may have
experienced unrelated on-board performance problems. However, we assume conservatively
that all such bursts did in fact exhibit the lower flux common to non-triggered bursts.
Therefore, ∼12% of the IPN bursts should not actually be a part of the dataset that is
compared with the models that are based upon BATSE’s triggered GRB rate. Because IPN
bursts are expected to contribute ∼25% of our detectable signal, this effect reduces the total
expected neutrino flux by ∼3%. This correction is applied asymmetrically to the overall
uncertainty, because it can hinder, but not improve, the effectiveness of the analysis (see
Table 4).
For models based solely on long-duration bursts, such as (Murase & Nagataki 2006a;
Razzaque et al. 2003a), the inclusion of bursts of unknown duration may also lead to an
overestimation of the expected signal events, and thus a flux upper limit that is too restrictive.
In order to ensure that we would not exclude potentially detectable neutrino events, the 75
bursts of unknown duration included in the dataset are assumed to last 100 s (for 1997-
1999) or 50 s (for 2000-2003). Thus, for purposes of data analysis, they are classified as
long-duration bursts. However, this necessitates a statistical correction to the resulting flux
limits. We assume that up to 1/3 of these bursts may in fact be short-duration, based upon
the standard ratio of short- to long-duration bursts observed by BATSE. So, of the 389
bursts known (or assumed) to be long-duration, 25 were excluded from the relevant limits,
thus reducing the expected number of signal events by 25/389, or ∼6%. This correction is
likewise applied asymmetrically to the overall uncertainty.
B. Green’s Function Fluence Upper Limit Calculation
We show here sample calculations of the differential neutrino fluence upper limit, as
well as a procedure to determine the integrated fluence and flux upper limits, following the
Green’s Function method set out in Section 3 of Fukuda et al. (2002). The fluence upper
limit calculation assumes a monochromatic neutrino spectrum; the calculation is repeated
at different values of the neutrino energy. The benefit of this method is that an integrated
fluence upper limit can then be determined for any input spectrum, whether it be based on
all of the bursts in this dataset or only on a subset of all bursts.
– 23 –
The fluence upper limit is defined as
F (E) ≤N90
Aeff,ν(Eν)(B1)
where N90 is µ90/NBursts and Aeff,ν is the energy-dependent neutrino effective collecting area
(see Section 3.3)8.
Figure 10 is determined by the results of AMANDA’s 2000-2003 observations. For
example, µ90 = 1.30 and NBursts = 151; therefore, N90 = 8.61 × 10⁻³.
For Eν = 100 TeV (near the peak of the predicted neutrino flux), Aeff,ν = 5.0 × 10⁴
cm2 therefore F(100 TeV) ≤ 1.7 × 10⁻⁷ cm−2.
We now determine the integrated fluence upper limit explicitly for an E−2 spectrum, as
well the Waxman-Bahcall spectrum. First, the integrated fluence, Fint for an E−2 spectrum
is
Fint ≤ [
∫ 107GeV
250GeV
CE−2ν
F (E)dEν ]
−1 = 1.4×10⁻⁵cm−2, (B2)
where C is the factor required to normalize the neutrino spectrum to unity—in this case,
C = 250 GeV. This integrated fluence upper limit is significantly lower than the results of
similar calculations performed by Fukuda et al. (2002) (we combine the νµ and νµ fluences
into a single limit, while they present two separate fluence upper limits). However, a direct,
quantitative comparison between these two results cannot be made due to the vastly different
energy ranges of the two instruments. Note also the limits of integration employed here—
though AMANDA is sensitive to neutrinos at higher and lower energies, the vast majority
of the flux from GRBs is expected to come from neutrinos of a few hundred GeV to a few
PeV.
Now we determine the integrated fluence upper limit for the Waxman-Bahcall spectrum,
to provide a further example of the wide applicability of the Green’s Function method:
Fint ≤ [
∫ 105GeV
250GeV
CE−1ν E−1
Break
F (E)dEν +
∫ 107
105
CE−2ν
F (E)dEν ]
−1 = 5.3×10⁻⁷cm−2, (B3)
where C again is the constant required to normalize the overall spectrum to unity; here C
= 7.0×10⁻⁵GeV.
8Instead of using the neutrino effective area, one could also use the muon effective area multiplied by the
neutrino to muon conversion probability (as in Fukuda et al. 2002); in the case of AMANDA one must also
account for attenuation of neutrinos in the earth.
– 24 –
Finally, we compare this fluence upper limit to the flux upper limit derived for the
Waxman-Bahcall spectrum in Section 4. To do this, we must convert the integrated fluence
upper limit into a differential all-sky flux upper limit per burst; that is, from units of cm−2
to units of GeV−1cm−2s−1sr−1:
Fint
Ωt=
5.3×10⁻⁷
(4π)(3.15×10⁷/700)= 9.4× 10⁻¹³cm−2s−1sr−1. (B4)
Next, we multiply by the normalization of the energy spectrum and take the differential
to provide a flux upper limit of
E2Φν ≤ 1.3 × 10⁻⁸ GeVcm−2s−1sr−1.
This is nearly identical to the flux upper limit derived in the manner described in Section 3
for 151 bursts from 2000 to 2003 (see also Table 5, where an MRF of 2.5 yields a flux upper
limit of E2Φν ≤ 1.1 × 10⁻⁸ GeVcm−2s−1sr−1, consistent with the result derived above to
within the applicable uncertainties).
Thus we show that the Green’s Function Method agrees with calculations which ex-
plicitly incorporated prior assumptions about the GRB neutrino spectrum. Therefore, this
alternate method provides a powerful tool for determining the flux upper limit based on
AMANDA observations for any proposed neutrino spectrum.
C. Expanding the GRB Search to Other Transient Point Sources
While this work has provided the most stringent upper limit to date specifically for muon
neutrino flux for gamma-ray bursts in coincidence with photon observations, the method
described above can be expanded to search for other transient point sources as well. X-ray
flares occurring minutes to hours after a GRB are thought to be caused by re-activation
of the GRB central engine, and are a natural candidate for correlated neutrino searches
(Murase & Nagataki 2006b). Additionally, photon emission from supernovae could be used
as a key element in searches for neutrino emission from jet-driven supernovae and γ-ray
dark (“choked”) GRBs (Razzaque et al. 2003b). Jet-driven supernovae are expected to
accelerate baryonic material to mildly relativistic energies (the Lorentz boost Γ ∼ a few),
which may subsequently result in significant neutrino emission (Ando & Beacom 2005). Not
all supernovae will be jet-driven, but population estimates vary between 0.2% and 25% of all
type Ib/c SNe (van Putten 2004; Berger et al. 2003; Soderberg 2005). Given the number
of such supernovae observed annually, it is reasonable to search for a neutrino signal from
these events.
– 25 –
Another reason to search for neutrino emission from supernovae becomes apparent when
we consider the recently-established SN-GRB connection. Several supernovae (including
1998bw and 2003dh) are known to be associated with GRBs. Furthermore, Razzaque et al.
(2003b) describe a scenario where as many as 103 times the standard number of GRBs occur,
though in these bursts the photon jet does not succeed in escaping the stellar envelope (the γ-
ray dark GRBs). For these types of bursts, no gamma-rays will be observed. However, if even
a fraction of these GRBs are associated with SNe (the fraction for observed GRBs has been
calculated to be in the range of 10−2 to 10−3 (Bissaldi et al. 2006)), then it will be possible to
search for neutrinos in the time period surrounding the SN emission (provided the SN start
time, the GRB time delay relative to the SN, and the duration of the GRB can be estimated
with sufficient precision). Because these SNe are localized transient phenomena, the primary
selection criteria for the GRB analysis (spatial and temporal correlation) are an excellent
starting point for such a search, though it is possible that not all of the other data quality cuts
used in the GRB search would be optimal for a supernova search. Finally, it is also possible
to complement any of the transient point source searches described above by inverting the
search algorithm, that is, by implementing Target of Opportunity photon searches based on
spatio-temporal localization of potential neutrino events (Kowalski & Mohr 2007). Any of
these searches can potentially be of great benefit to the long-term goals of multi-messenger
astronomy.
REFERENCES
Achterberg, A. et al., ApJ, in press (astro-ph/0702265)
Achterberg, A. et al., submitted to PRD, November 2006 (astro-ph/0611063)
Achterberg, A. et al., Astropart. Phys. 26 (2006) 155 (astro-ph/0604450)
Ackermann, M. et al., J. Geophys. Res. 111 (2006), D13203
Aguilar, A.J. et al., Astropart. Phys. 26 (2006) 314-324; see also the Antares Neutrino
Telescope Page: http://antares.in2p3.fr
Aharmim, B. et al., NIM A449 (2000) 172-207
Ahrens, J. et al., NIM A54 (2004) 169
Ahrens, J. et al., PRL 90 (2003) 251101
Ahrens, J. et al., ApJ 583 (2003) 1040
– 26 –
Ahrens, J. et al., PRD 66 (2002) 012005
Andres, E. et al., Nature 410 (2001) 441-443
Ando, S. and J. Beacom, PRL 95 (2005) 061103
Bay, R.C. Ph.D. Thesis, University of California (2000) (astro-ph/0008255)
Berger, E. et al., ApJ 599 (2003) 408
Bissaldi, E. et al., A&A, in press (astro-ph/0702652)
Burrows, D. et al., Space Sci. Rev. 120 (2005) 165; see also the Swift Gamma-Ray Burst
Mission Page: http://swift.gsfc.nasa.gov/docs/swift/swiftsc.html
Carson, J. for the GLAST Collaboration, Proc. 2nd TeV Workshop, Madison, WI (2006)
(astro-ph/0610960); see also the GLAST Mission Page: http://glast.gsfc.nasa.gov
Chirkin, D. and W. Rhode, hep-ph/0407075
Conrad, J. et al., PRD 67 (2003) 012002
Costa, E. et al., Nature 386 (1997) 686-688
Dermer, C. and A. Atoyan, New Journal of Physics 8 (2006) 122 (astro-ph/0606629)
Dermer, C. and A. Atoyan, PRL 91 (2003) 1102
Eicher, D. et al., Nature 340 (1989) 126-128
Feldman, G. and R. Cousins, PRD 57 (1998) 3873-3889
Fishman, G.J. et al., A&A Supp 97 (1993) 17-20
Frail, D. et al., ApJ 562 L55-58 (2001)
Fryer, C. and P. Meszaros, ApJ 588 L25-28 (2003)
Fukuda, S. et al., ApJ 578 (2002) 317
Gandhi, R. et al., PRD 58 (1998) 093009
Gandhi, R. et al., Astropart. Phys. 5 (1996) 81-110
Hardtke, R., Ph.D Thesis, University of Wisconsin (2002)
– 27 –
Heck, D. et al., Report FZKA 6019 (1998). An update of the original Corsika (6.030) was
used in this analysis. See http://www-ik.fzk.de/corsika/ for additional information
and more recent versions.
Hill, G.C. and K. Rawlins, Astropart. Phys. 19 (2003) 393
Hill, G.C., Astropart. Phys. 6 (1997) 215
Hodges, J. for the IceCube Collaboration, Proc. 2nd TeV Workshop, Madison, WI (2006)
(astro-ph/0611597)
Hurley, K. et al., in “Compact Stellar X-Ray Sources”, Lewin, W. et al., Eds. Cambridge
University Press, Cambridge (2006)
Hurley, K., Astron. Telegram #19 (1998)
Kalmykov, N. and S. Ostapchenko, Phys. Atom. Nucl. 56 (1993) 346
Kashti, T. and E. Waxman, PRL 95 (2005) 181101
Kommers, J. Ph.D. Thesis, MIT (1998); see also http://space.mit.edu/BATSE
Kowalski, M. and A. Mohr, astro-ph/0701618
Kuehn, K., http://icecube.wisc.edu/∼kuehn/grb9703.html (AMANDA-GRB Supplemental
Information Page)
Lipari, P. and T. Stanev, PRD 44 (1991) 113543
Markwardt, C.B. et al., ApJ 633 L77-80 (2005)
Murase, K. and S. Nagataki, PRD 73 (2006) 063002
Murase, K. and S. Nagataki, PRL 97 (2006) 051101 (astro-ph/0604437)
Murase, K. and S. Nagataki, private communication
Paczynski, B., ApJ 494 L45 (1998)
Piran, T., Rev. Mod. Phys. 76 (2004) 1143
Piran, T., Science 295 (2002) 986
Razzaque, S. et al., PRD 68 (2003) 3001
Razzaque, S. et al., PRL 90 (2003) 241103
– 28 –
Resvanis, L.K. et al., Nuc. Phys. B Proc. Supp. 122 (2003) 24-39; see also the NESTOR
Institute for Astroparticle Physics Page: http://www.nestor.org.gr
Roming, P.W.A. et al., ApJ 651 (2006) 985 (astro-ph/0605005)
Soderberg, A. Nuovo Cim. 28C (2005) 563-573
Spiering, C. et al., astro-ph/0404096
Stamatikos, M. for the IceCube Collaboration, et al. Proc. 29th ICRC, Pune, India (2005)
471-474 (astro-ph/0510336)
Stamatikos, M. for the IceCube Collaboration, and D. Band, AIP Conf. Proc. 836 (2006)
599 (astro-ph/0604281)
Stern, B.E. et al., ApJ 563 (2001) 80
van Putten, M., ApJ 611 L81-84 (2004)
Waxman, E., Nuc. Phys. B Proc. Supp. 118 (2003) 353-362 (and references therein)
Waxman, E. and J. Bahcall PRL 78 (1997) 2292
This preprint was prepared with the AAS LATEX macros v5.2.
– 29 –
log10(Eν/GeV)
log 10
(Eν2 Φ
ν/G
eV c
m-2
s-1
sr-1
)
-11
-10
-9
-8
-7
2 3 4 5 6 7
Fig. 1.— Predicted differential muon neutrino flux as a function of energy for four different
models of GRB neutrino production: the precursor model (solid line), the canonical Waxman-
Bahcall model (thick dotted line), the Murase-Nagataki model (thin dotted line), and the
supranova model (dot-dashed line). All models include the effect of ν oscillations. The
diffuse neutrino bounds determined from cosmic ray observations with (upper horizontal
line) and without (lower horizontal line) z evolution are also shown for reference.
– 30 –
Nevents/10 s
Occ
urre
nces
1
10
10 2
30 40 50 60 70 80 90 100
Fig. 2.— A stable period of detector activity, shown by the nearly Gaussian random temporal
distribution of events in each 10-second bin during the off-time period of BATSE GRB 6610.
Initial selection criteria have been applied to these data, but the GRB-specific criteria have
not yet been applied.
– 31 –
Time Difference (s)
Nev
ents
1
10
10 2
10 3
0 20 40 60 80 100 120
Fig. 3.— Time difference (δt) between subsequent events during the background time period
of a representative GRB, after application of initial data quality cuts. There is no evidence
for significant gaps in the data that could produce a “false negative” result.
– 32 –
log(£Reco)
Nev
ents
(ar
b un
its)
0
1
2
3
4
5
7 8 9 10 11
Fig. 4.— A comparison of the likelihood of track reconstruction, £reco for observed data
(solid line) and simulated background events (dashed line). Both curves are normalized
after preliminary data selection criteria are applied. The close agreement signifies that our
simulations are properly modeling the observed events, thus providing additional evidence
for the trustworthiness of the simulated signal events as well.
– 33 –
∆Ψ (o)
NE
vent
s
0
0.05
0.1
0.15
0.2
0.25
0.3
0 20 40 60 80 100 120 140 160 180
Fig. 5.— The expected distribution of angular mismatch ∆Ψ1 for a simulated muon neutrino
spectrum (shaded region) and observed background (open region). ∆Ψ1 = 0 is the position
of the burst determined from photon observations. Selecting events with ∆Ψ1≤12 retains
more than 90% of the signal events.
– 34 –
log10(Eν/GeV)
log 10
(Aef
f,ν/
cm
2 )
1
10
10 2
10 3
10 4
10 5
10 6
2 3 4 5 6 7 8
Fig. 6.— Angle-averaged muon neutrino effective area for the AMANDA-II (years 2001-
2003) coincident search algorithm, based upon Monte Carlo simulations of expected signal
events from the Northern hemisphere.
– 35 –
∆Ψ (o)
MR
F
6.6
6.8
7
7.2
7.4
7.6
7.8
8
8.2
8.4
6 8 10 12 14 16 18
Fig. 7.— Relative Model Rejection Factor (MRF) as a function of angular mismatch (∆Ψ1)
between the burst position and the reconstructed track, for the subset of bursts from 2000.
The arrow indicates the mismatch angle selected for this analysis.

– 36 –
Log(D) (s)
NB
urst
s
0
5
10
15
20
25
30
35
40
45
-2 -1 0 1 2 3
Fig. 8.— Duration distribution of BATSE GRBs (upper, open histogram) and IPN bursts
for which durations have been determined (lower, shaded histogram). Both distributions
appear to be drawn from the same underlying population.
– 37 –
log10(Eν/GeV)
log 10
(Eν2 Φ
ν/ G
eV c
m-2
s-1
sr-1
)
-11
-10
-9
-8
-7
2 3 4 5 6 7
Fig. 9.— AMANDA flux upper limits (solid lines) for muon neutrino energy spectra predicted
by the Waxman-Bahcall spectrum (Waxman 2003) (thick dashed line), the Razzaque et
al. spectrum (Razzaque et al. 2003a) (dot-dashed line) and the Murase-Nagataki spectrum
(Murase & Nagataki 2006a) (thin dotted line). The central 90% of the expected flux for
each model is shown. For the Waxman-Bahcall model we include both long- and short-
duration bursts; for the other spectra, only long-duration bursts are included. Including
short-duration bursts would improve the flux upper limits by approximately 13%. While our
analysis was restricted to bursts located in the Northern Hemisphere (2π sr), all flux upper
limits are for the entire sky (4π sr).
– 38 –
log10(Eν/GeV)
log 10
(Fν/
cm2 )
-9
-8
-7
-6
-5
-4
-3
-2
-1
2 3 4 5 6 7
Fig. 10.— Green’s Function Fluence Upper Limit for AMANDA’s GRB analysis from 2000
to 2003. This fluence upper limit can be folded into any desired spectrum to provide a flux
upper limit for that particular spectrum.
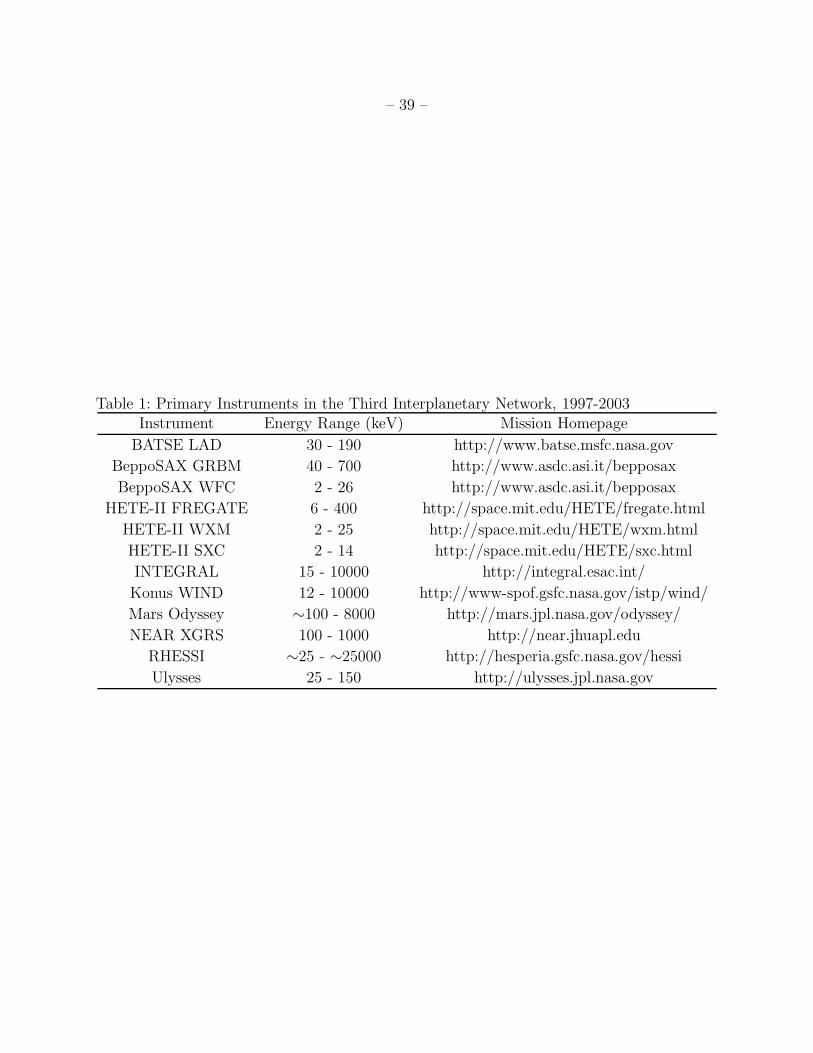
– 39 –
Table 1: Primary Instruments in the Third Interplanetary Network, 1997-2003Instrument Energy Range (keV) Mission Homepage
BATSE LAD 30 - 190 http://www.batse.msfc.nasa.gov
BeppoSAX GRBM 40 - 700 http://www.asdc.asi.it/bepposax
BeppoSAX WFC 2 - 26 http://www.asdc.asi.it/bepposax
HETE-II FREGATE 6 - 400 http://space.mit.edu/HETE/fregate.html
HETE-II WXM 2 - 25 http://space.mit.edu/HETE/wxm.html
HETE-II SXC 2 - 14 http://space.mit.edu/HETE/sxc.html
INTEGRAL 15 - 10000 http://integral.esac.int/
Konus WIND 12 - 10000 http://www-spof.gsfc.nasa.gov/istp/wind/
Mars Odyssey ∼100 - 8000 http://mars.jpl.nasa.gov/odyssey/
NEAR XGRS 100 - 1000 http://near.jhuapl.edu
RHESSI ∼25 - ∼25000 http://hesperia.gsfc.nasa.gov/hessi
Ulysses 25 - 150 http://ulysses.jpl.nasa.gov
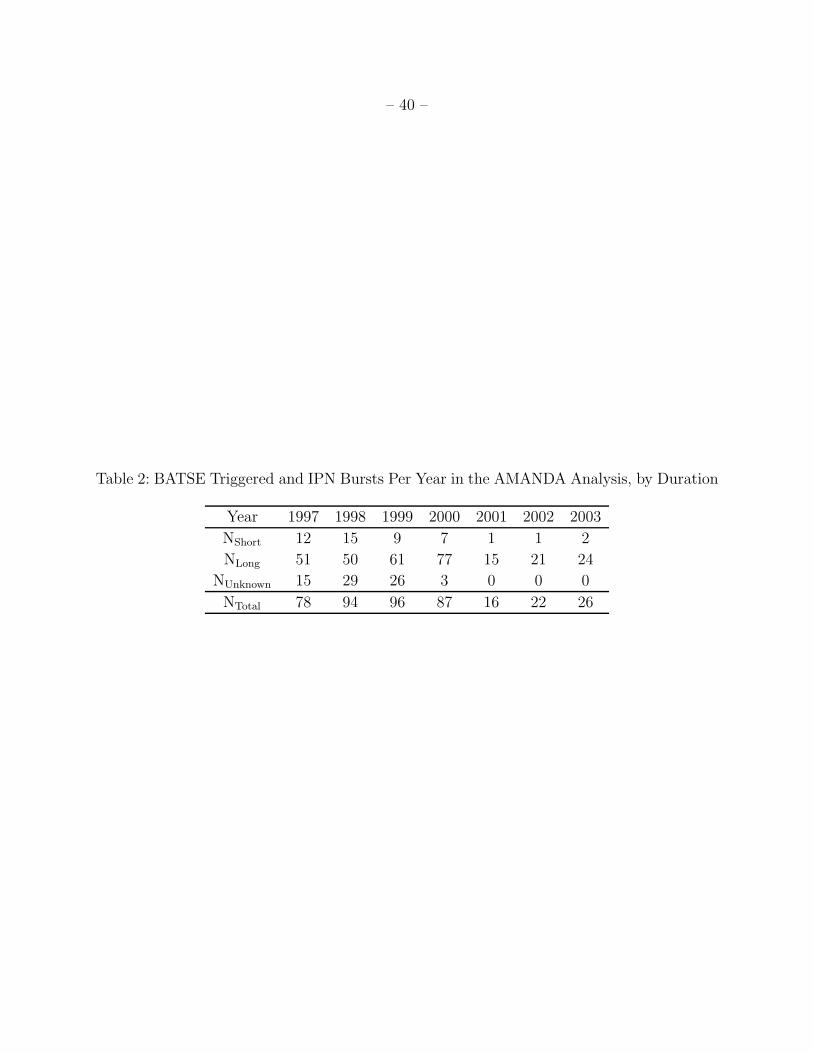
– 40 –
Table 2: BATSE Triggered and IPN Bursts Per Year in the AMANDA Analysis, by Duration
Year 1997 1998 1999 2000 2001 2002 2003
NShort 12 15 9 7 1 1 2
NLong 51 50 61 77 15 21 24
NUnknown 15 29 26 3 0 0 0
NTotal 78 94 96 87 16 22 26
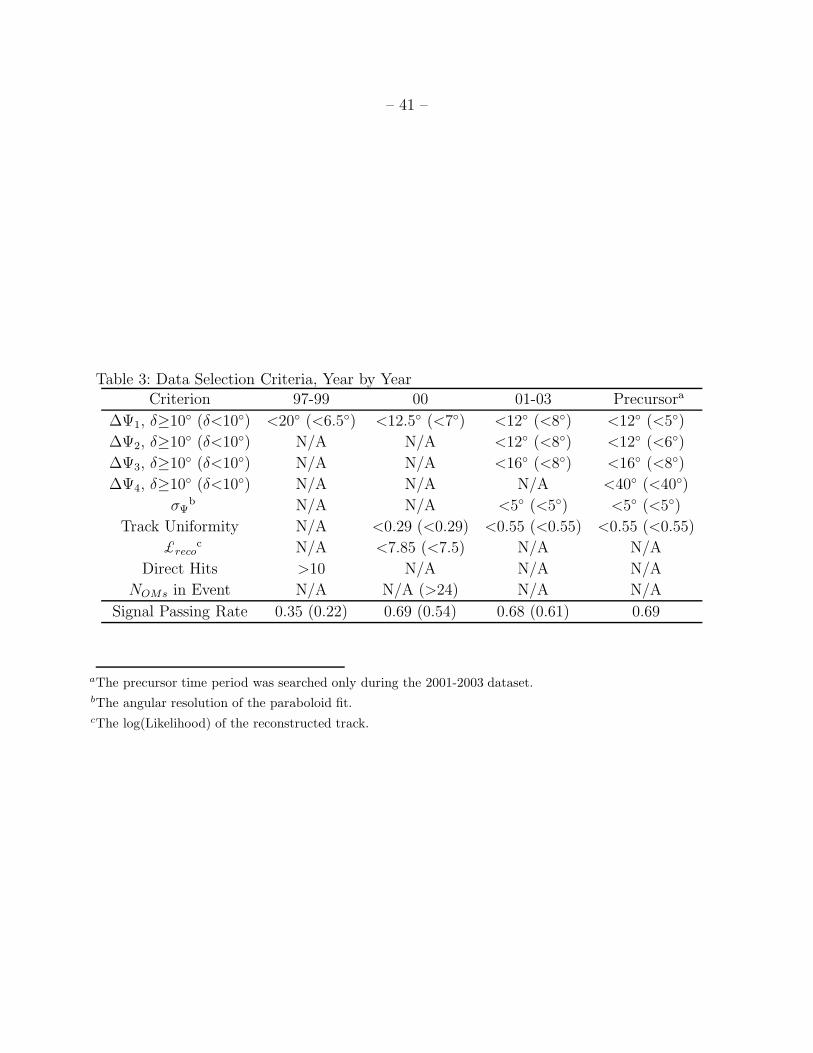
– 41 –
Table 3: Data Selection Criteria, Year by YearCriterion 97-99 00 01-03 Precursora
∆Ψ1, δ≥10 (δ<10) <20 (<6.5) <12.5 (<7) <12 (<8) <12 (<5)
∆Ψ2, δ≥10 (δ<10) N/A N/A <12 (<8) <12 (<6)
∆Ψ3, δ≥10 (δ<10) N/A N/A <16 (<8) <16 (<8)
∆Ψ4, δ≥10 (δ<10) N/A N/A N/A <40 (<40)
σΨb N/A N/A <5 (<5) <5 (<5)
Track Uniformity N/A <0.29 (<0.29) <0.55 (<0.55) <0.55 (<0.55)
£recoc N/A <7.85 (<7.5) N/A N/A
Direct Hits >10 N/A N/A N/A
NOMs in Event N/A N/A (>24) N/A N/A
Signal Passing Rate 0.35 (0.22) 0.69 (0.54) 0.68 (0.61) 0.69
aThe precursor time period was searched only during the 2001-2003 dataset.bThe angular resolution of the paraboloid fit.cThe log(Likelihood) of the reconstructed track.
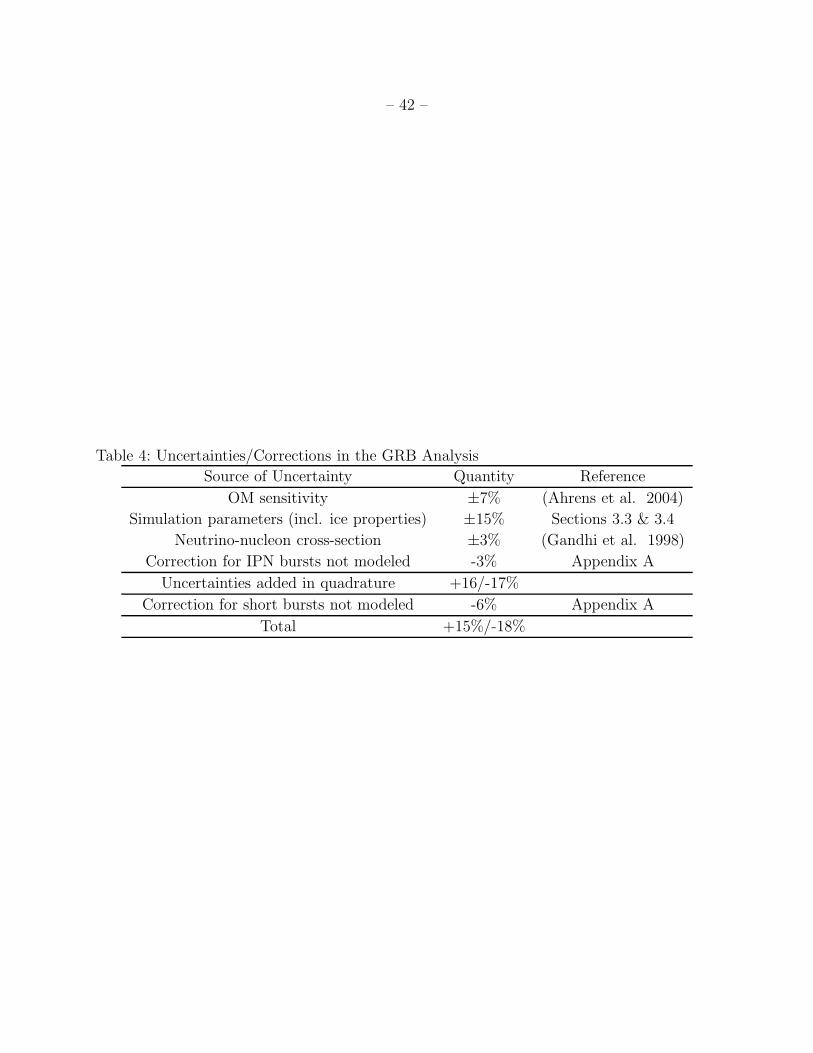
– 42 –
Table 4: Uncertainties/Corrections in the GRB Analysis
Source of Uncertainty Quantity Reference
OM sensitivity ±7% (Ahrens et al. 2004)
Simulation parameters (incl. ice properties) ±15% Sections 3.3 & 3.4
Neutrino-nucleon cross-section ±3% (Gandhi et al. 1998)
Correction for IPN bursts not modeled -3% Appendix A
Uncertainties added in quadrature +16/-17%
Correction for short bursts not modeled -6% Appendix A
Total +15%/-18%
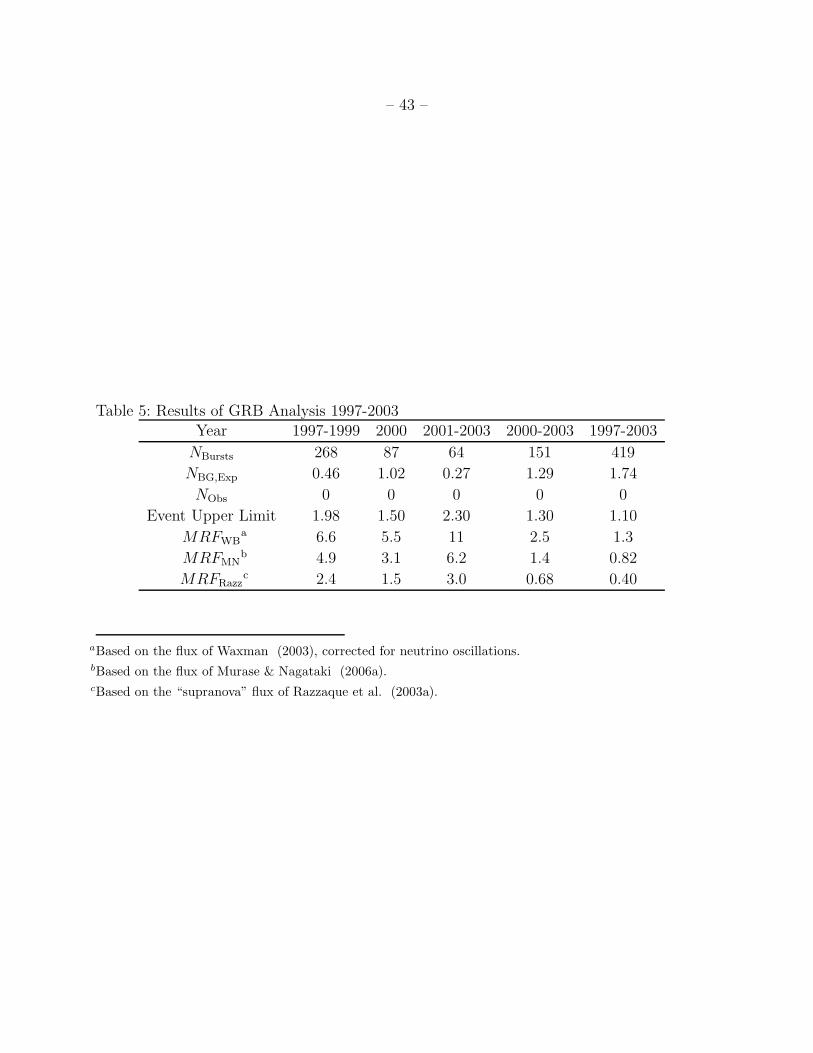
– 43 –
Table 5: Results of GRB Analysis 1997-2003Year 1997-1999 2000 2001-2003 2000-2003 1997-2003
NBursts 268 87 64 151 419
NBG,Exp 0.46 1.02 0.27 1.29 1.74
NObs 0 0 0 0 0
Event Upper Limit 1.98 1.50 2.30 1.30 1.10
MRFWBa 6.6 5.5 11 2.5 1.3
MRFMNb 4.9 3.1 6.2 1.4 0.82
MRFRazzc 2.4 1.5 3.0 0.68 0.40
aBased on the flux of Waxman (2003), corrected for neutrino oscillations.bBased on the flux of Murase & Nagataki (2006a).cBased on the “supranova” flux of Razzaque et al. (2003a).
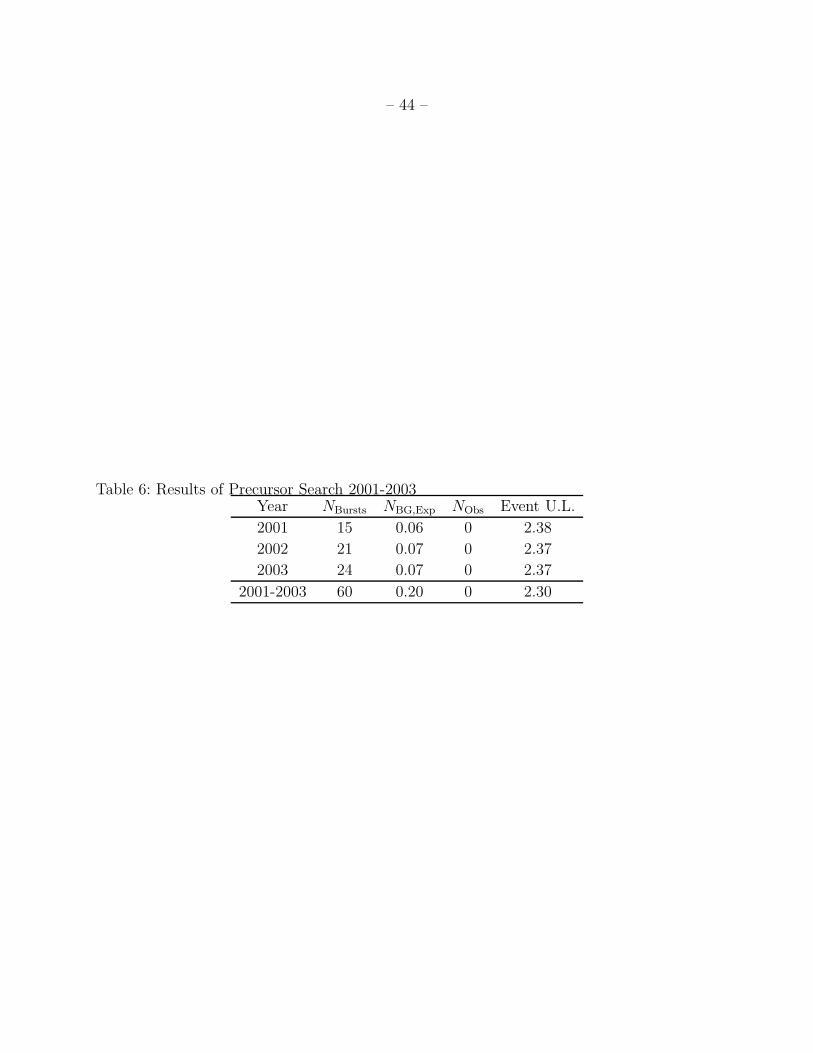
– 44 –
Table 6: Results of Precursor Search 2001-2003Year NBursts NBG,Exp NObs Event U.L.
2001 15 0.06 0 2.38
2002 21 0.07 0 2.37
2003 24 0.07 0 2.37
2001-2003 60 0.20 0 2.30