Embed Size (px)
Citation preview

THE IMPACT OF POLITICAL VIOLENCE ON TOURISM IN NEPAL
A THESIS
Presented to
The Faculty of the Department of Economics and Business
The Colorado College
In Partial Fulfillment of the Requirements for the Degree
Bachelor of Arts
By
Sidharth Moktan
May 2015
THE IMPACT OF POLITICAL VIOLENCE ON TOURISM IN NEPAL
Sidharth Moktan
May 2015
Economics
Abstract
This study uses the Auto Regressive Distributed Lag (ARDL) framework to investigate the
relationship between tourism and political violence in Nepal in the presence of a structural
break. Using monthly time series data from January 1991 to December 2012, we find
results that suggest the existence of negative short run and long run relationships between
the two variables. The results of a dynamic ordinary least squares (DOLS) model
estimation suggests that our results are robust to differences in model specification. A
Toda-Yamomoto Granger Causality analysis suggests that political violence
Granger-causes tourism in Nepal. The stability of the long run estimates is tested using
CUSUM and CUSUMSQ tests.
KEYWORDS: Maoist, Nepal, Political Violence, Tourism, Terrorism, ARDL,
Cointegration, Time Series, Causality, CUSUM
JEL CODES: L83, C32

ON MY HONOR, I HAVE NEITHER GIVEN NOR RECEIVED
UNAUTHORIZED AID ON THIS THESIS
Sidharth Moktan
Signature
Contents
1 Introduction 1
2 Background 2
2.1 Empirical background . . . . . . . . . . . . . . . . . . . . . . . . . . . . . 2
2.2 Theoretical background . . . . . . . . . . . . . . . . . . . . . . . . . . . . 5
3 Data and Methodology 7
3.1 Data . . . . . . . . . . . . . . . . . . . . . . . . . . . . . . . . . . . . . . 7
3.2 Methodology . . . . . . . . . . . . . . . . . . . . . . . . . . . . . . . . . 9
4 Results and Discussion 13
4.1 Preliminary testing and model specification . . . . . . . . . . . . . . . . . 13
4.2 Bounds testing and estimation of long run and short run relationships . . . . 15
4.3 Toda-Yamamoto Granger Causality . . . . . . . . . . . . . . . . . . . . . 18
4.4 Dynamic ordinary least squares . . . . . . . . . . . . . . . . . . . . . . . . 19
4.5 CUSUM AND CUSUMSQ Stability Tests . . . . . . . . . . . . . . . . . . 21
5 Conclusion 23
6 References 24
1 Introduction
Nepal, a small landlocked country situated in between China and India, has long been con-
sidered one of the top tourist destinations in Asia. 1 The country owes its popularity to its
rich flora and fauna, the abundance of Buddhist and Hindu heritage sites, and the Himalayan
range which is home to nine of the ten highest peaks in the world. The country has been
able to capitalize on its popularity and now derives a significant portion of its revenue and
employment from tourism. In 2013, the tourism sector accounted for 8.2 % of the country’s
GDP and employed 7% of the nation’s labor force making it one of the largest economic
sectors in the country (World travel and tourism council, 2014).
It stands to reason that the growth of the country should be strongly tied to the
performance of tourism. The existence of such a causal relationship is supported by Gau-
tam (2011) who uses cointegration analysis to find results that suggest that tourism causes
economic growth in both the short run and long run. Given the importance of tourism to
the welfare of Nepal, we believe that it is crucial for the country to formulate policies that
mitigate factors that are harmful to the industry.
In this paper, we examine the impact of one such factor, namely, political violence
and instability. We focus on the violence that erupted out of the decade long Maoist conflict.
The insurgency, which resulted in the deaths of 15,000 people and the internal displacement
of 200,000 people, was one of the most important events in the history of the nation (INSEC,
2007). The conflict, which mainly stemmed from the poor and marginalized people’s frus-
trations with income inequality, nepotism, favoritism, and discrimination within the political
and social system, played an integral role in transforming the socio-economic and political
structures of the country (INSEC, 2007 and Upadhyay et al., 2011).1Kathmandu, the nation’s capital, recently featured in trip advisor’s ranking of the top 10 places to visit in
Asia.
1

While the conflict was successful in bringing about much needed positive change
in many domains, including the empowerment of the poor and marginalized, it created an
atmosphere that was less than ideal for attracting tourists. Although the Maoists never di-
rectly targeted tourists, their conflicts with the government and other entities led them to be
involved in a number of activities that indirectly affected tourists. For instance, they bombed
and attacked multiple hotels and properties owned by the Ranas and Shahs whom they con-
sidered to be a part of the ruling class that had impeded the equitable growth of the country
(Upadhyay et al., 2011). Although, these bombings weren’t directed at tourists, they were
perceived as threats by foreign nationals who make up a large part of the clientele for these
hotels.
Our paper analyzes the extent to which tourism was affected by the violence per-
petrated by the Maoists. Our results suggest that the conflict had a significant and negative
impact on tourism in the short and long run. Given these findings, we believe that the gov-
ernment should formulate policies that prevent political violence and instability in the future.
We hope that our work can be used to inform such policy decisions.
The remainder of this paper is organized as follows. Section 2 introduces the
theoretical and empirical background, Section 3 explains the empirical methods, Section
4 presents the econometric results along with a discussion of its relevance, and section 5
concludes.
2 Background
2.1 Empirical background
The literature on the impact of violence on tourism has almost exclusively been focused
on the study of the impact of terrorism as compared to other forms of violence such as
2
armed conflicts, revolutions and political instability (Neumayer, 2004). The existing body
of literature provides contradicting information on the relationship between non-terrorist
forms of violence and tourism. Using a panel data approach, Neumayer (2004) finds that
political violence and unrest caused by non-terrorist activities have a significant impact on
tourism. This finding is contradicted by Fielding and Shortland’s (2010) time series study
which finds that local political instability does not significantly affect tourism in Egypt.
Measuring the impact of a slightly more intense form of conflict, Selvanath (2007) finds that
the Tamils Independence war had a significant and negative impact on the inflow of tourists
into Sri Lanka. The lack of studies on the impact of political violence on tourism combined
with the mixed results provided by existing studies highlight the need for more studies on
this topic.
As compared to literature on the impact of political violence on tourism, the studies
on the impact of terrorism on tourism is fairly extensive. The body of literature almost unan-
imously agrees on the significant and negative impact of terrorism on tourism. A number
of these studies employ the Auto Regressive Distributed Lag (ARDL) method of cointe-
gration developed by Pesaran and Pesaran (1997), Pesaran and Shin (1999), and Pesaran et
al. (2000, 2001) to test for the existence of a long run relationship between terrorism and
tourism. Using the ARDL procedure on annual time series data, Raza & Jawaid (2013) find
results that indicate the existence of short run and long run relationships between terrorism
and tourism in Pakistan. Employing the same methodology for annual time series data on
Turkey, Feridun (2013) finds that terrorism has significantly and negatively impacted Turk-
ish tourism in the short and long run. While both of these studies indicate that terrorism
has a negative impact on tourism, they provide very different estimates for the magnitude of
this impact. The presence of such a big difference between estimates from two studies that
3
employ the same methodology suggests that the results of these studies are not generaliz-
able and that country-specific characteristics have a significant influence on how terrorism
impacts tourism.
The significance of country-specific effects is further demonstrated by Drakos and
Kutan (2001). The paper employs the Seemingly Unrelated Regression (SURE) model on
monthly time series data to study the regional effects of terrorism on tourism in Turkey,
Israel and Greece. The authors find that the inflow of tourists into Turkey and Israel is more
sensitive to terrorism than Greece.
One strand of literature attributes these inter-country differences to the character-
istics of the host country and its surroundings. Mansfeld (1996) and Raza & Jawaid (2013)
suggests that a country’s level of involvement in its security situation is correlated with the
inflow of tourists into the country. In addition, Mansfeld (1996), Enders et al. (1992), Son-
mez (1998) and Raza & Jawaid (2013) argue that tourism is not only affected by the security
situation within the country but also by the conditions affecting the neighboring countries.
The factors outlined above could potentially explain the differences between countries since
variations in location, resource endowments and rates of development could lead to differ-
ences in these factors.
Another body of research suggests that these differences could be partially at-
tributed to differences in the characteristics of tourists. Cook and McCleary (1983), D’Amore
and Anuza (1986), and Raza & Jawaid (2013) argue that a tourist’s response to terrorism is
influenced by the tourist’s previous international experience. Furthermore, Mazursky (1989)
and Raza & Jawaid (2013) finds that travel behaviour is affected by the nature of previous
travel. Both of these findings could potentially explain the inter-country differences in the
response of tourists to terrorism since it is reasonable to expect that different countries attract
4
different types of tourists due to variations in location, visa restrictions and travel expenses.
As previously mentioned, there is a gap in the existing literature with regards to
studies that examine the impact of political violence and instability on tourism. Combined
with the contradictory findings made by existing papers, this shortcoming in the literature
provides an opportunity for us to make a contribution by examining the impact of the Maoist
revolution on the inflow of tourists into Nepal.
2.2 Theoretical background
We employ the theoretical framework developed by Enders, Sandler and Parise (1992) to
explain how terrorism affects the rational decision making process undertaken by tourists.
The model assumes a two stage budgeting process in which the consumer allocates his in-
come between broad consumption categories in the first stage and then divides the allocated
income in each category into category-specific expenditures in the second stage. For the pur-
poses of this paper, we will only present the sub maximization procedure that corresponds
with the second stage of the budgeting process because the first stage does not shed light on
how political violence affects a consumer’s decision to travel to certain countries. 2
The consumer’s overall budget constraint can be represented as follows.
IA = IT + IO (2.1)
Where IA stands for aggregate income, and IT and IO represent the income allocated to
tourism and non-tourism related activities respectively. Without loss of generality, we can
assume that the consumer can only choose between two tourist destinations. This allows us
to define the budget constraint and utility function for the sub maximization procedure as2The decision to travel to certain countries over others is an example of a consumer dividing her expenditure
within a broad category of consumption i.e., tourism. This decision corresponds with the second stage ofthe budgeting process.
5

follows:IT = QA · PA +QB · PB (2.2)
U = U(QA, QB) (2.3)
Where Q represents quantity, P represents price, and A and B correspond with destinations
A and B respectively. Enders et al. (1992) notes that the price of tourism is dependent on
income, the value of time, and risk factors. We thus define the prices of tourism as follows.
PA = PA(IT , V T,RA) (2.4)
PB = PB(IT , V T,RB) (2.5)
Where V T represents value of time and Rk is a measure of the degree of risk at location
k. Having defined the budget constraint, utility function and price for the sub maximization
procedure, we can now maximize the consumer’s utility as follows.
maxQA,QB
U(QA, QB) subject to IT = QA · PA +QB · PB (2.6)
Using the first order conditions, we derive the following demand functions.
q∗A = qA(PA, PB, IT ) (2.7)
q∗B = qB(PA, PB, IT ) (2.8)
Substituting the values of PA and PB from Equations 2.4 and 2.5 into the demand functions
yields the following.
q∗A = qA (PA(IT , V T,RA), PB(IT , V T,RB), IT ) (2.9)
q∗B = qB(PA(IT , V T,RA), PB(IT , V T,RB), IT ) (2.10)
The existing theory established by Enders et al. (1992) claims that an increase in risk caused
by violent activities will lead to an increase in the perceived price of travel to the country i.e.,
∂P∂R
> 0. Furthermore, the assumption of monotonic utility dictates that price is inversely
6
related to quantity demanded i.e., ∂q∂P
< 0. Combining these relationships, we can show that
an increase in risk caused by violence leads to a fall in quantity demanded in the following
manner.
∂q∗
∂R=∂P
∂R· ∂q
∗
∂P< 0 (2.11)
Having demonstrated the theoretical underpinnings that have been used to describe the rela-
tionship between violence and tourism, we proceed to describe the empirical methodology
that allows us to test the validity of this relationship.
3 Data and Methodology
3.1 Data
This study uses monthly data that spans the 21 year period from January 1991 to December
2012. The sample period captures the 5 years prior to the Maoist conflict, the full 11 years
during the conflict, and the 6 years following the conflict. The information on violence,
denoted by Vt, was collected from the global terrorism database and measures the number
of politically violent acts perpetrated by the Maoist party and its affiliates in a given month.
The information on tourism, denoted by Tt, was collected from the Nepal Tourism Board
and is measured as the total number of foreign nationals that entered the country in a given
month.
7
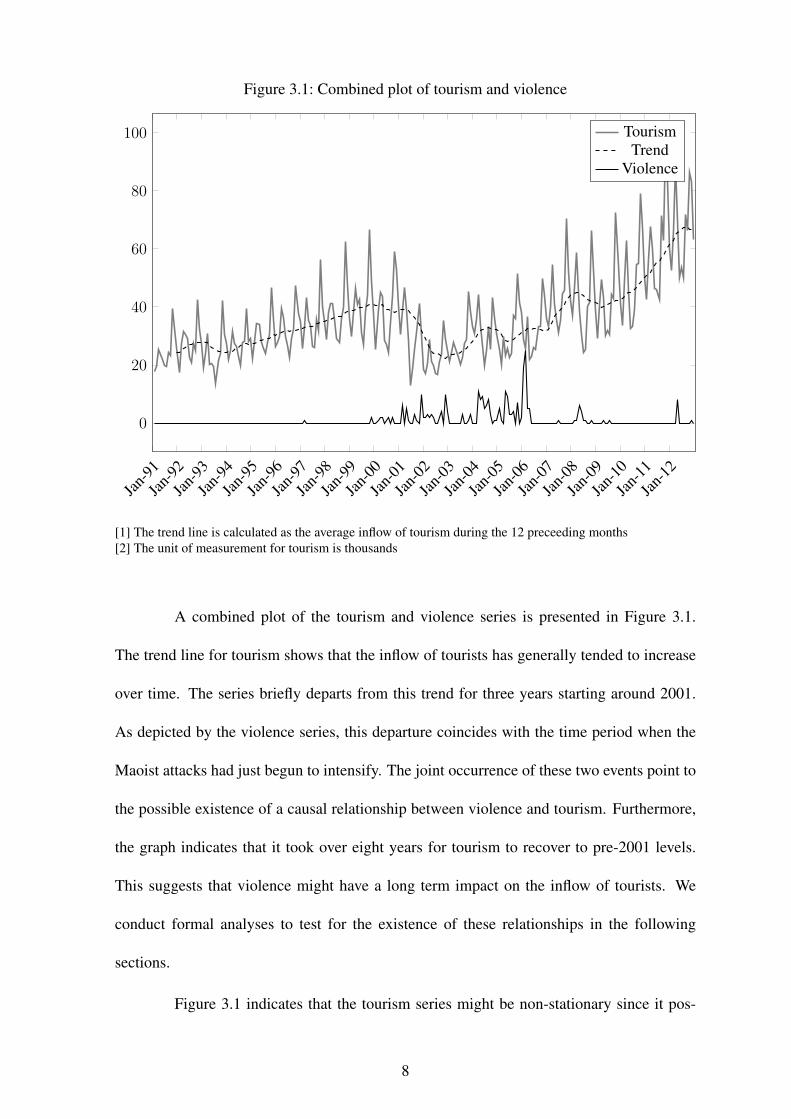
Figure 3.1: Combined plot of tourism and violence
Jan-91
Jan-92
Jan-93
Jan-94
Jan-95
Jan-96
Jan-97
Jan-98
Jan-99
Jan-00
Jan-01
Jan-02
Jan-03
Jan-04
Jan-05
Jan-06
Jan-07
Jan-08
Jan-09
Jan-10
Jan-11
Jan-12
0
20
40
60
80
100 TourismTrend
Violence
[1] The trend line is calculated as the average inflow of tourism during the 12 preceeding months[2] The unit of measurement for tourism is thousands
A combined plot of the tourism and violence series is presented in Figure 3.1.
The trend line for tourism shows that the inflow of tourists has generally tended to increase
over time. The series briefly departs from this trend for three years starting around 2001.
As depicted by the violence series, this departure coincides with the time period when the
Maoist attacks had just begun to intensify. The joint occurrence of these two events point to
the possible existence of a causal relationship between violence and tourism. Furthermore,
the graph indicates that it took over eight years for tourism to recover to pre-2001 levels.
This suggests that violence might have a long term impact on the inflow of tourists. We
conduct formal analyses to test for the existence of these relationships in the following
sections.
Figure 3.1 indicates that the tourism series might be non-stationary since it pos-
8
sesses a trend, exhibits seasonal variation and seems to have suffered from a structural break
around 2001. The existence of non-stationarity could pose challenges during the estima-
tion process and will most definitely influence the model selection process. The violence
series, on the other hand, seems to be stationary since the violent incidents seem to occur
sporadically. We will formally address these econometric issues in the methods section.
3.2 Methodology
Recent literature suggests that failure to account for structural breaks can produce spurious
results for unit root and cointegration tests (Zivot and Andrews, 1992; Pahlavani, et al.,
2006). As a result, we begin our analysis by using the Zivot-Andrews (ZA) procedure to
formally test for the presence of structural breaks in the tourism series. This procedure
involves testing the null hypothesis that tourism contains a unit-root with drift but does
not contain a structural break against the alternative hypothesis that the series is a trend
stationary process with a one-time break (Jayanthakumaran, 2007). We test the hypotheses
by sequentially estimating the following identity over different values of Tb.
Tt = µ+ θDUt(Tb) + βt+ γDTt(Tb) + αyt−1 +k∑j=1
cj∆yt−j + et (3.1)
WhereDUt(Tb) is a dummy variable that captures a level shift in time period Tb andDTt(Tb)
is a dummy variable that captures a trend shift in Tb. The dummy variables are defined as
follows: DUt = 1 if t > Tb and zero otherwise, and DTt = t − Tb if t > Tb and zero
otherwise. The null hypothesis is rejected if α is significant. Furthermore, the value of Tb
that yields the most significant t-ratio for α, tα, is selected as the point of structural break. If
the ZA procedure identifies a significant structural break in the tourism series, we augment
our cointegration model by including a dummy variable that accounts for the presence of
9

this structural break.
We use the Auto Regressive Distributed Lag (ARDL) method of cointegration, de-
veloped by Pesaran and Pesaran (1997), Pesaran and Shin (1999), and Pesaran et al. (2000,
2001), to test for the presence of a cointegrating relationship and to study the long run and
short run relationships between tourism and violence. We chose this method because of the
advantages it offers over other methods of cointegration. Firstly, unlike other methods that
can only be used when the underlying variables are I(1) or greater, the ARDL method can
be applied when the underlying variables are I(0), I(1), or a combination of both orders of
integration (Pesaran and Shin, 1999). The usefulness of this property will become apparent
when we specify our model. Secondly, the ARDL can be used in the presence of endo-
geneous independent variables (Pesaran and Shin, 1999). This property could potentially
prove to be useful in our estimation since a number of past studies have found the presence
of bi-directional causality between violence and tourism. Lastly, the ARDL model has better
small sample properties (Haug, 2002).
The ARDL approach involves estimating the following Unrestricted Error Correc-
tion Model (UECM) using Ordinary Least Squares (OLS)3.
∆Tt = ω0 +
p∑i=1
αi∆Tt−i +
q∑j=1
αj∆Vt−j + β1Tt−1 + β2Vt−1 + ω1Bi + ω2TRi + εt (3.2)
Where ω0 is the intercept, Bi is a structural break dummy variable that equals one if t is
greater than or equal to break point and zero otherwise, TRi is a trend term, εt is a white
noise error term, Tt is the number of tourists entering Nepal in month t, Vt is the number of
violent activities that occurred in the country in month t, ∆ is the first difference operator,
3In this section, we present the most general version of the ARDL model which includes a drift term, a trend,and a term for structural break. More restrictive versions of this model can easily be derived by setting thecoefficient of these terms to zero. The results of these restricted models will be presented in the resultssection.
10

and p and q are the maximum lags determined by minimizing an information criterion such
as the Schwarz Bayesian Criterion (SBC).
The coefficients on the lagged level terms, Tt−1 and Vt−1, represent the long run
relationship between tourism and violence and the coefficients on the first differenced lagged
terms, ∆Tt−1 and ∆Vt−1, represent the short run dynamics. Before we estimate and interpret
these relationships, we must ensure that a long run cointegrating relationship exists between
tourism and violence. This involves testing the null hypothesis H0 : β1 = β2 = 0 i.e., there
is no cointegrating relationship between violence and tourism. These hypotheses are tested
by comparing the calculated Wald F-statistic to the critical bounds reported by Pesaran et
al. (2001). Pesaran et al. (2001) reports bounds for five cases with different restrictions
on the trend and intercept. Similar to Feridun (2010), we analyze results for three of these
cases. The null hypothesis is accepted if the F-statistic falls below the critical value for
I(0), rejected if it falls above the critical value for I(1), and the result is inconclusive if the
F-statistic falls in between the values for I(0) and I(1). If the null hypothesis is rejected,
we can proceed to calculate the long run and short run coefficients of the model using the
estimated values of the ARDL model.
In order to estimate the long run relationship between tourism and violence, we
assume that the model is in equillibrium in the long run. This allows us to set the coefficients
on the first differenced terms in Equation 3.2 equal to zero. This yields the following long
run expression:
ω0 + β1Tt−1 + β2Vt−1 + ω1Bi + ω2TRi = 0 (3.3)
Which can be rearranged to generate our coefficients of interest as follows.
Tt−1 = −(ω0
β1+β2β1
Vt−1 +ω1
β1Bi +
ω2
β1TRi
)(3.4)
11

The term −β2β1
represents the long run relationship between violence and tourism. If −β2β1
is
negative and significant, we can conclude that a single act of violence significantly reduces
the inflow of tourists into Nepal by an amount equal to the magnitude of the coefficient in
the long run.
Using these long run coefficients, we can estimate the following Error Correction
Model (ECM) and generate the coefficients for the short term.
∆Tt = φ0 +
p∑i=1
φi∆Tt−i +
q∑j=1
φj∆Vt−j + ηECTt−1 + µt (3.5)
Where the lagged error correction term, ECTt−1, is generated as follows:
ECTt−1 = Tt−1 − ˆTt−1 (3.6)
= Tt−1 −(−ω0
β1− β2β1
Vt−1 −ω1
β1Bi −
ω2
β1TRi
)(3.7)
The coefficient φj in Equation 3.5 represents the relationship between violence and tourism
in the short run. If φj is negative and significant, we can conclude that a single act of vi-
olence significantly reduces the inflow of tourists into the country by an amount equal to
the magnitude of the coefficient. The coefficient η on ECTt−1 represents the speed of ad-
justment to the long run equillibrium following a shock in the short run (Raza and Jawaid,
2013). If −1 < η < 0, we can conclude that the model converges to the long run equillib-
rium and that a shock in the current time period is corrected by η in each subsequent time
period until the shock is completely corrected. Alternatively, 0 < η < 1 indicates that the
model is convergent to the long run equillibrium but a shock is reinforced in the following
time periods until it decreases to zero , and −1 > η > 1 indicates that the model does not
converge and that the error is magnified in subsequent time periods until the values explode.
In the following section, we implement the tests outlined above and discuss the
relevance of the findings.
12
4 Results and Discussion
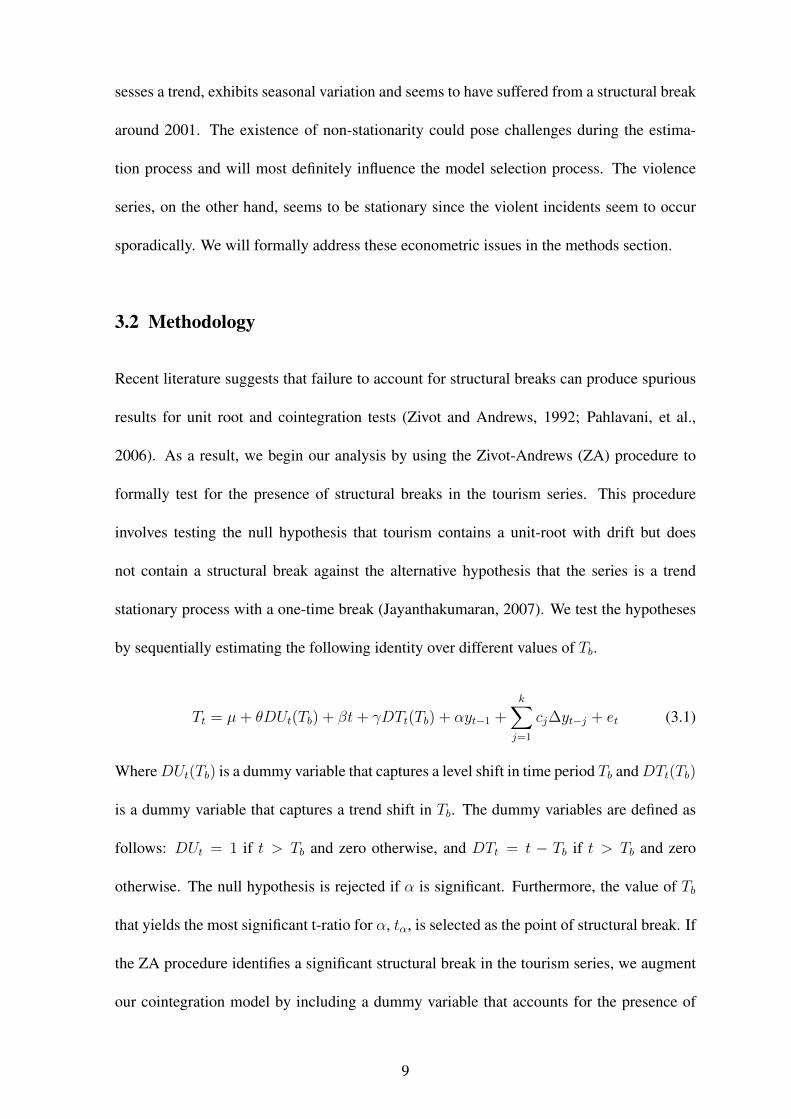
4.1 Preliminary testing and model specification
We start by checking for the presence of a structural break in the tourism series. The result of
the Zivot-Andrews test reported in Table 4.1 suggests that a statistically significant structural
break occurred in the tourism series in April 2001. As a result, we include a dummy variable
in our cointegration model to account for this break.
Table 4.1: Zivot-Andrews test
Break Estimated Asymptotic Critical Valuespoint t-statistic 1% 5% 10%
April 2001 -6.22 ∗∗∗ -5.57 -5.08 -4.82
Notes:[1] The model used to calculate the t-statistic includes a drift and trendterm[2] *** Denotes the null hypothesis of unit root with no structuralbreak can be rejected at the 1% level
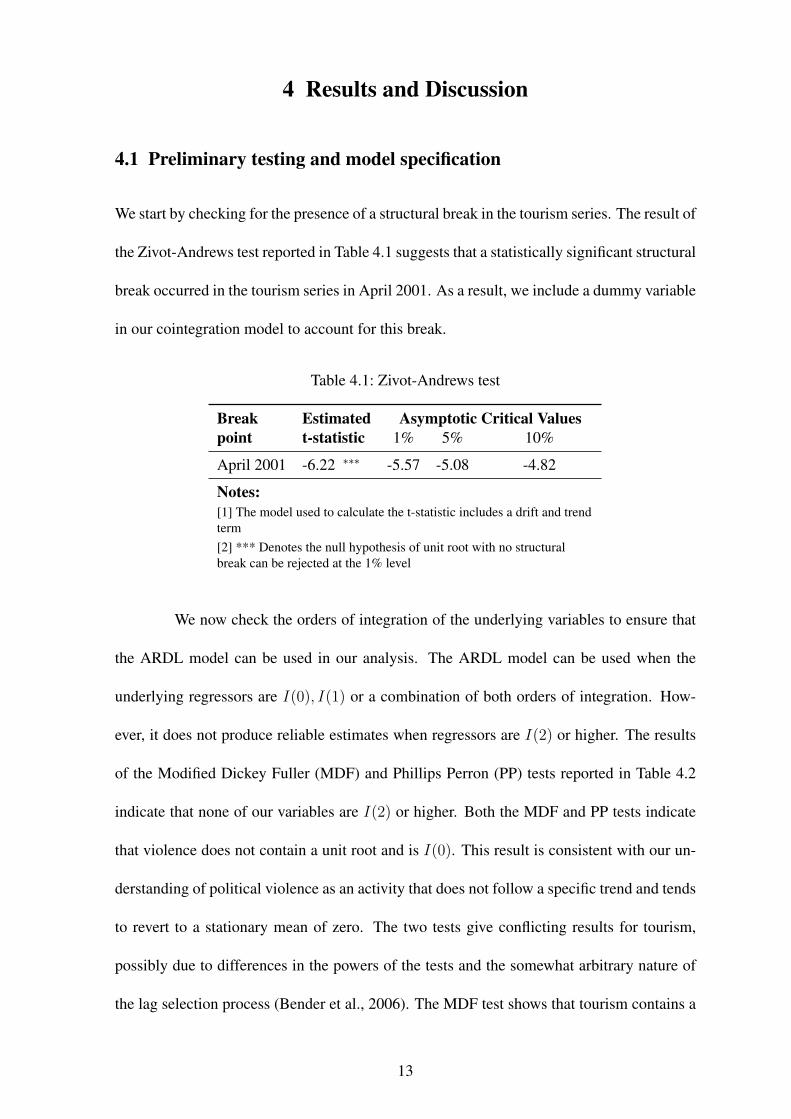
We now check the orders of integration of the underlying variables to ensure that
the ARDL model can be used in our analysis. The ARDL model can be used when the
underlying regressors are I(0), I(1) or a combination of both orders of integration. How-
ever, it does not produce reliable estimates when regressors are I(2) or higher. The results
of the Modified Dickey Fuller (MDF) and Phillips Perron (PP) tests reported in Table 4.2
indicate that none of our variables are I(2) or higher. Both the MDF and PP tests indicate
that violence does not contain a unit root and is I(0). This result is consistent with our un-
derstanding of political violence as an activity that does not follow a specific trend and tends
to revert to a stationary mean of zero. The two tests give conflicting results for tourism,
possibly due to differences in the powers of the tests and the somewhat arbitrary nature of
the lag selection process (Bender et al., 2006). The MDF test shows that tourism contains a
13
unit root and is I(1), whereas, the PP test shows that tourism does not contain a unit root and
is I(0). The result of the PP test is a little surprising since Figure 3.1 shows the existence of
seasonality and a time dependent trend in the tourism series. The result of the MDF test is
more consistent with our understanding and expectation of the tourism series. Regardless of
which test produces the more accurate results, we can use the ARDL procedure since both
of our variables are lower than I(2).
Table 4.2: Results for Modified Dickey Fuller and Philips Perron tests
Variables Modified Dickey Fuller (MDF) Philips Perron (PP)I(0) I(1) I(0) I(1)
Tourism 0.97 -2.75 ∗∗∗ -2.57 ∗∗∗ -20.44 ∗∗∗
Violence -5.53 ∗∗∗ -10.99 ∗∗∗ -9.25 ∗∗∗ -24.38 ∗∗∗
Notes:[1] *** denotes that the null hypothesis of a unit root is rejected at the 1% level
Having found results that indicate that our variables possess the required stationar-
ity properties, we proceed to specify the lag structure for our model. We use the Akaike In-
formation Criterion (AIC), Hannan-Quinn Information Criterion (HQIC) and the Schwarz-
Bayesian Information Criterion (SBIC) to inform our lag selection process. The results
reported in Table 4.3 show that all three information criteria are minimized at the first lag.
Therefore, we include all of our variables at the first lag.
Table 4.3: Lag length selection
Lag Order AIC HQIC SBIC0 63.23 63.26 63.311 -145.84 ∗ -145.61 ∗ -145.26 ∗
2 -142.09 -141.76 -141.273 -138.89 -138.46 -137.82
Notes:[1] * Denotes the lag order that minimizes each informationcriterion
14
4.2 Bounds testing and estimation of long run and short run
relationships
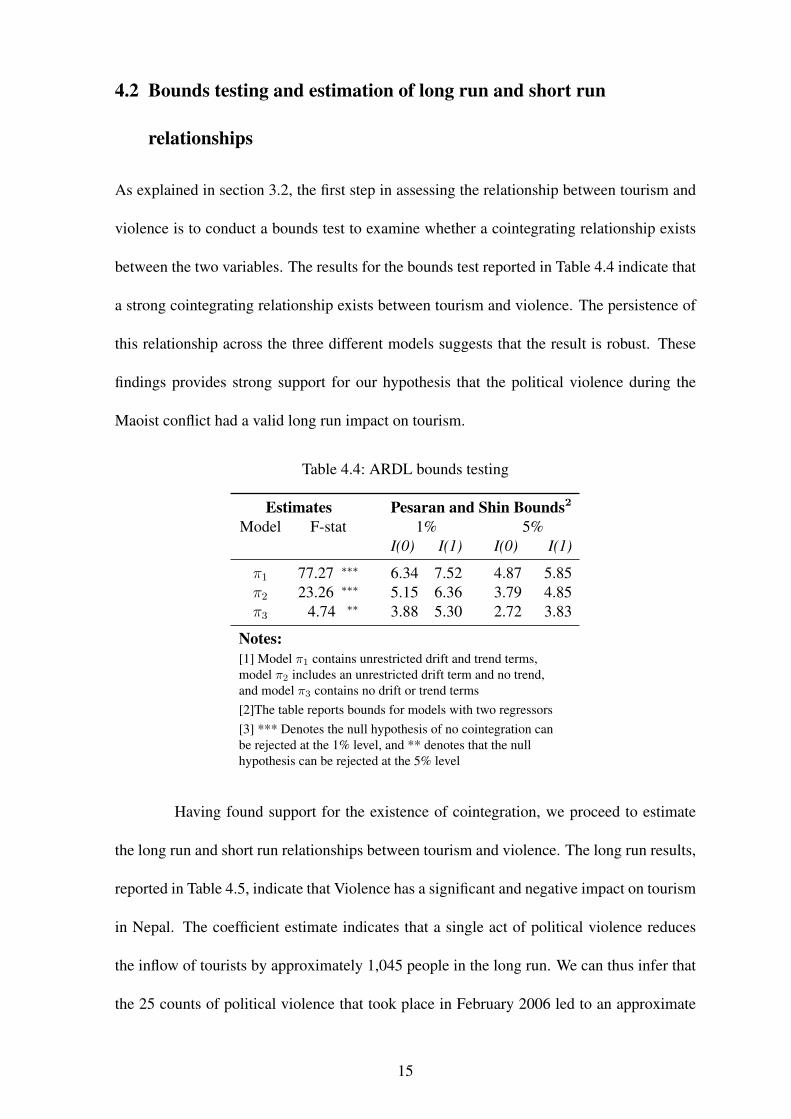
As explained in section 3.2, the first step in assessing the relationship between tourism and
violence is to conduct a bounds test to examine whether a cointegrating relationship exists
between the two variables. The results for the bounds test reported in Table 4.4 indicate that
a strong cointegrating relationship exists between tourism and violence. The persistence of
this relationship across the three different models suggests that the result is robust. These
findings provides strong support for our hypothesis that the political violence during the
Maoist conflict had a valid long run impact on tourism.
Table 4.4: ARDL bounds testing
Estimates Pesaran and Shin Bounds2
Model F-stat 1% 5%I(0) I(1) I(0) I(1)
π1 77.27 ∗∗∗ 6.34 7.52 4.87 5.85π2 23.26 ∗∗∗ 5.15 6.36 3.79 4.85π3 4.74 ∗∗ 3.88 5.30 2.72 3.83
Notes:[1] Model π1 contains unrestricted drift and trend terms,model π2 includes an unrestricted drift term and no trend,and model π3 contains no drift or trend terms[2]The table reports bounds for models with two regressors[3] *** Denotes the null hypothesis of no cointegration canbe rejected at the 1% level, and ** denotes that the nullhypothesis can be rejected at the 5% level
Having found support for the existence of cointegration, we proceed to estimate
the long run and short run relationships between tourism and violence. The long run results,
reported in Table 4.5, indicate that Violence has a significant and negative impact on tourism
in Nepal. The coefficient estimate indicates that a single act of political violence reduces
the inflow of tourists by approximately 1,045 people in the long run. We can thus infer that
the 25 counts of political violence that took place in February 2006 led to an approximate
15
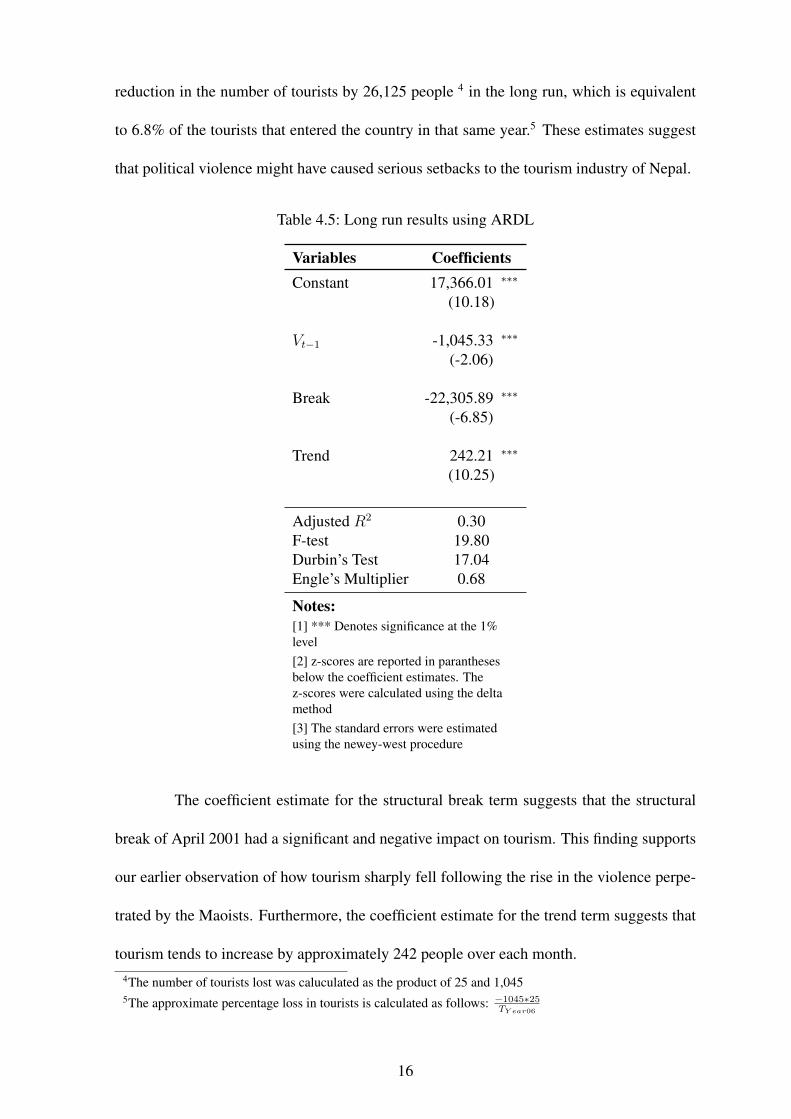
reduction in the number of tourists by 26,125 people 4 in the long run, which is equivalent
to 6.8% of the tourists that entered the country in that same year.5 These estimates suggest
that political violence might have caused serious setbacks to the tourism industry of Nepal.
Table 4.5: Long run results using ARDL
Variables CoefficientsConstant 17,366.01 ∗∗∗
(10.18)
Vt−1 -1,045.33 ∗∗∗
(-2.06)
Break -22,305.89 ∗∗∗
(-6.85)
Trend 242.21 ∗∗∗
(10.25)
Adjusted R2 0.30F-test 19.80Durbin’s Test 17.04Engle’s Multiplier 0.68
Notes:[1] *** Denotes significance at the 1%level[2] z-scores are reported in paranthesesbelow the coefficient estimates. Thez-scores were calculated using the deltamethod[3] The standard errors were estimatedusing the newey-west procedure
The coefficient estimate for the structural break term suggests that the structural
break of April 2001 had a significant and negative impact on tourism. This finding supports
our earlier observation of how tourism sharply fell following the rise in the violence perpe-
trated by the Maoists. Furthermore, the coefficient estimate for the trend term suggests that
tourism tends to increase by approximately 242 people over each month.4The number of tourists lost was caluculated as the product of 25 and 1,0455The approximate percentage loss in tourists is calculated as follows: −1045∗25
TY ear06
16

To check the validity of our model, we test for the presence of serial correlation and
Auto Regressive Conditional Heteroskedasticity (ARCH) effects. The results for Durbin’s
Alternative test indicates that our model suffers from serial correlation. We correct for this
by estimating Newey-West standard errors. The results for Engler’s Lagrange Multiplier test
indicates that our model does not contain ARCH effects.
Table 4.6: Short run dynamics
Variables Coefficients
Constant 100.41(0.19)
∆ Vt−1 -236.42 ∗
(-1.77)
ECTt−1 -0.65 ∗∗∗
(-12.57)
∆ Tt−1 -0.42 ∗∗∗
(-8.30)
Adjusted R2 0.31F-score 40.02
Notes:[1] *** Denotes significance atthe 1% level, ** denotessignificance at the 5% level,and * denotes significance atthe 10% level
The estimation results of the short run model are reported in Table 4.6. Similar to
the long run estimates, the short run estimates indicate that violence has a significant and
negative impact on the inflow of tourists in the short run. The coefficient estimate for the
lagged term of violence, ∆Vt−1, shows that a single act of political violence reduces the
inflow of tourists by approximately 236 people in the short run. Once again, we can use
the events of February 2006 to show that the 25 counts of violence that occurred in that
17
month led to an approximate reduction of tourists by 5,900 people6 in the short run, which
is equivalent to approximately 23% of the tourists that entered Nepal in that month.7 On
a percentage basis, these results show that violence has a bigger impact on tourism in the
short run than in the long run. This finding is consistent with our expectations since a recent
event of violence is more likely to deter tourists from visiting a country than an incident that
occurred years in the past.
Furthermore, the results in Table 4.6 show that the error correction term, ECTt−1,
is statistically significant and negative. The estimate indicates that the model corrects a
disturbance felt in period t by 65% in the following period. We can thus conclude that the
model seems to converges relatively quickly to the long run equilibrium following a shock.
4.3 Toda-Yamamoto Granger Causality
While the ARDL procedure outlined above allows us to detect the presence of a cointegrat-
ing relationship between tourism and violence, it does not give us information on the direc-
tion of this long run relationship. We use the Granger Causality test procedure developed by
Toda and Yamamoto (1995) to uncover this direction of causality. The Toda-Yamamoto pro-
cedure involves estimating the following system of equations with the Seemingly Unrelated
Regression (SURE) technique.
Tt = α1 +m+d∑i=1
γ1,i∆Tt−i
m+d∑i=1
γ2,i∆Vt−i + ε1,t (4.1)
Vt = α2 +m+d∑i=1
λ1,i∆Tt−i
m+d∑i=1
λ2,i∆Vt−i + ε2,t (4.2)
Where the error terms ε1,t and ε2,t are white noise error terms, m is the maximum lag length
determined by minimizing an information criterion such as the Schwarz Bayesian Criterion,6The number of tourists lost was caluculated as the product of 25 and 2367The approximate percentage loss in tourists is calculated as follows: −236∗25
TFeb,06
18
and d is the highest order of integration among all of the underlying variables in the model.
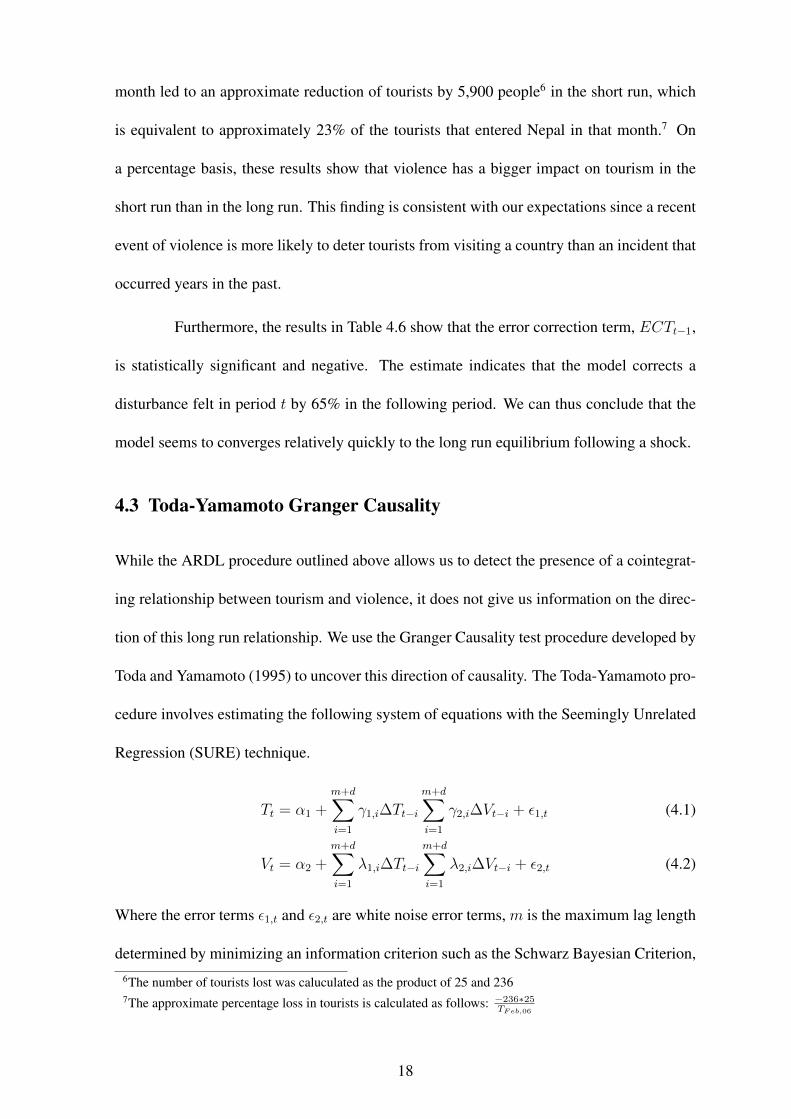
The procedure involves testing the two null hypotheses H0 : γ2,i = 0 i.e., violence
does not Granger cause tourism and H0 : λ1,i = 0 i.e., tourism does not Granger cause
violence.
Table 4.7: Results of the Toda and Yamamoto Granger Causality tests
Dependent Variable Wald’s Chi-SquaredTourism Violence
Tourism - 41.99(0.00)
Violence 22.35 -(0.10)
Notes:[1] The lag lengths for Tourism and Terrorism are 15 asper the Schwarz Bayesian Criteria[2] p-values are reported in parantheses below the F statistics
The results of the Toda-Yamamoto Granger causality test, reported in Table 4.6,
indicate that unidirectional Granger causality exists between the two variables and that this
causality flows from violence to tourism. The existence of Granger causality provides ad-
ditional support for the existence of a valid relationship between violence and tourism. The
unidirectional nature of the causal relationship tells us that political violence in Nepal is
not determined by the number of tourists entering the country. This is consistent with our
expectations since the people’s war was not concerned with the terrorization of foreigners
but with the upliftment of the poor and down trodden.
4.4 Dynamic ordinary least squares
We compare the ARDL estimates with estimates generated from the Dynamic ordinary least
squares (DOLS) method, Stock and Watson (1993), to check if our findings are robust to
differences in model specification. The DOLS method involves estimating the dependent
19

variable as a function of the level value of the independent variable and the leads, level and
lags of the first difference of the independent variable. The addition of the leads and lags
corrects for endogeneity and serial correlation (Stock and Watson, 1993). The following
equation is used to estimate the dynamic ordinary least squares model.
Tt = α0 + α1Vt +
p∑i=−p
φpVt−p + α2TRt + α2Bt + εt (4.3)
The results for the DOLS estimation are reported in Table 4.8.
Table 4.8: Dynamic ordinary least squares
Variables Coefficients
Constant 17,910.5 ∗∗∗
(12.53)
V -1,409.64 ∗∗∗
(-3.60)
∆Vt−1 979.62 ∗∗∗
(3.24)
∆V 1,342.02 ∗∗∗
(3.94)
∆Vt+1 129.09(0.43)
Trend 232.22 ∗∗∗
(13.58)
Break -20,441.47 ∗∗∗
(-7.42)
Adjusted R2 0.52F-stat 36.30
Notes:[1] *** Denotes significance at the 1% level[2] t-scores are reported in parantheses below thecoefficient estimates
Although we estimated the model using 2 leads and lags of violence, we only
20

report results for the 1st lead and lag for the sake of brevity. The results indicate that the
estimates of the ARDL procedure are robust to model differences. The DOLS estimates
indicate that violence reduces the inflow of tourists by approximately 1,410 people in the
long run. This estimate is very close to the estimate of 1,045 people made by the ARDL
model. This similarity of results provides further support for the robustness of our findings.
4.5 CUSUM AND CUSUMSQ Stability Tests
We use the CUSUM and CUSUMSQ tests, proposed by Brown et al., (1975), to check the
stability of our parameter estimates over time. It is important to verify the constancy of
parameter estimates because this knowledge allows us to judge the reliability of our findings
for future time periods. This information might be especially useful to policy makers as it
provides information on whether political violence can be expected to have a similar impact
on tourism in the long run.
Figure 4.1: Cumulative sum of recursive residuals
Jan-92
Jan-93
Jan-94
Jan-95
Jan-96
Jan-97
Jan-98
Jan-99
Jan-00
Jan-01
Jan-02
Jan-03
Jan-04
Jan-05
Jan-06
Jan-07
Jan-08
Jan-09
Jan-10
Jan-11
Jan-12
−40
−20
0
20
40
[1] The thick line represents the cumulative sum of recursive residuals[2] The dashed lines represent critical bounds at the 5% significance level
The CUSUM test involves recursively plotting the cumulative sum of residuals
21
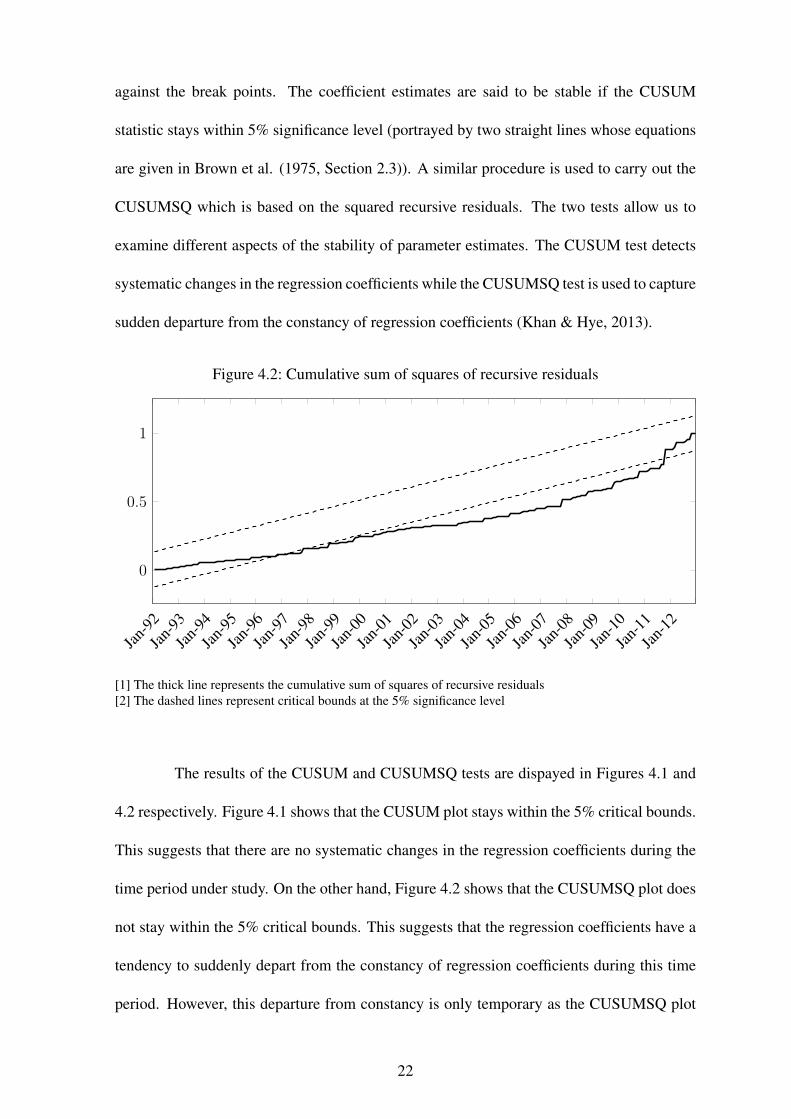
against the break points. The coefficient estimates are said to be stable if the CUSUM
statistic stays within 5% significance level (portrayed by two straight lines whose equations
are given in Brown et al. (1975, Section 2.3)). A similar procedure is used to carry out the
CUSUMSQ which is based on the squared recursive residuals. The two tests allow us to
examine different aspects of the stability of parameter estimates. The CUSUM test detects
systematic changes in the regression coefficients while the CUSUMSQ test is used to capture
sudden departure from the constancy of regression coefficients (Khan & Hye, 2013).
Figure 4.2: Cumulative sum of squares of recursive residuals
Jan-92
Jan-93
Jan-94
Jan-95
Jan-96
Jan-97
Jan-98
Jan-99
Jan-00
Jan-01
Jan-02
Jan-03
Jan-04
Jan-05
Jan-06
Jan-07
Jan-08
Jan-09
Jan-10
Jan-11
Jan-12
0
0.5
1
[1] The thick line represents the cumulative sum of squares of recursive residuals[2] The dashed lines represent critical bounds at the 5% significance level
The results of the CUSUM and CUSUMSQ tests are dispayed in Figures 4.1 and
4.2 respectively. Figure 4.1 shows that the CUSUM plot stays within the 5% critical bounds.
This suggests that there are no systematic changes in the regression coefficients during the
time period under study. On the other hand, Figure 4.2 shows that the CUSUMSQ plot does
not stay within the 5% critical bounds. This suggests that the regression coefficients have a
tendency to suddenly depart from the constancy of regression coefficients during this time
period. However, this departure from constancy is only temporary as the CUSUMSQ plot
22
returns to the 5% bands around 2011. This suggests that the short term deviation of the
parameter estimates is only transitory in nature. Combined, these findings imply that the
regression coefficients tend to fluctuate around the constant value in the short term but that
the constant value does not undergo any significant systematic shifts in the long run. This
suggests that our findings might not be suitable for short run forecasts but that they provide
reliable estimates for the long run.
5 Conclusion
Our results indicate that political violence has had a significant and negative impact on
tourism in Nepal. We use the ARDL framework to test for the existence and magnitude of
this effect. Our findings suggest that a single act of violence leads to a reduction in tourism
by 236 people in the short run and 1,045 people in the long run. In addition, the Toda-
Yamamoto procedure indicates that political violence Granger-causes tourism. Our findings
are consistent with Neumayer (2004) and Selvanath’s (2010) findings which indicate that
political violence has a negative and significant impact on tourism.
Given Gautam’s (2011) findings which indicates the existence of a causal rela-
tionship between tourism and economic growth in Nepal, we believe that it is of utmost
importance for the government to formulate policies that eliminate factors that deter tourism
within the country. Our study identifies political violence as one such deterrent. To mini-
mize political violence, we believe that the government should devise non-violent methods
of appeasing and quelling protestors. Furthermore, the government should formulate poli-
cies aimed at alleviating poverty, discrimination, inequality and other conditions that have
historically been known to create breeding grounds for protests and violent revolutions.
The results of our study should be interpreted with caution since there are a num-
23
ber of factors other than political violence that could have affected the inflow of tourists into
the country during the same time period. We leave it to future researchers to identify and
examine the impact of such factors. We believe that the ongoing energy crisis provides a
particularly interesting opportunity for researchers to examine the impact of infrastructural
deficiencies on tourism. Furthermore, the abolition of the 240 year old monarchy in 2008
provides an opportunity to study the impact of a dramatic political regime shift on tourism.
References
[1] Bender, K.A., Neumann, R.M., & Skatun, J.D. (2006). Unemployment and other mea-
sures of labor market inefficiency: a comparison of UK and US labor markets 1931-96.
Economic Inquiry. 44. 629-43.
[2] Brown, R. L., J. Durbin, & J. M. Evans. (1975). Techniques for Testing the Constancy
of Regression Relations over Time. Journal of the Royal Statistical Society, Series B.
37. 149-192.
[3] Cook, R.L. & McCleary, K.W. (1983). Redefining vacation distances in consumer
minds. Journal of Travel Research. 22 (2). 31-34.
[4] D’Amore, L.J. & Anuza, T.E. (1986). International terrorism: implications and chal-
lenge for global tourism. Business Quarterly. 20-29.
[5] Drakos, K. & Kutan, AM. (2003). Regional effects of terrorism on tourism in three
Mediterranean countries. Journal of Conflict Resolution. 47. 621-41.
[6] Enders, W., Sandler, T. & Parise, G.F. (1992). An econometric analysis of the impact
of terrorism on tourism. Kyklos. 45. 531-554.
24
[7] Feridun, M. (2011). Impact of terrorism on tourism in Turkey: empirical evidence from
Turkey. Applied Economics. 43 (24). 3349-3354.
[8] Fielding, D. & Shortland, A. (2010). How Do Tourists React to Political Violence?:
An Empirical Analysis of Tourism in Egypt. Discussion Papers of DIW Berlin 1022.
German Institute for Economic Research.
[9] Gautam B.P. (2011). Tourism and Economic Growth in Nepal. NRB Economic Review,
Nepal Rastra Bank, Research Department. 23 (2). 18-30.
[10] Government of Nepal - Ministry of Culture, Tourism & Civil Aviation. (2013). Nepal
Tourism Statistics 2012. Nepal.
[11] Haug, A. (2002). Temporal aggregation and the power of co-integration tests: a Monte
Carlo study. Oxford Bulletin of Economics and Statistics. 64. 399-412.
[12] Informal Sector Service Centre (INSEC). (2007). Nepal Human Rights Year Book
2006. Kathmandu.
[13] Jayanthakumaran, K., Pahlavani, M. & Neri, F. V. (2007). Trade reforms and break-
points in Australia’s manufactured trade: an application of the Zivot and Andrews
model. International Journal of Applied Econometrics and Quantitative Studies4 (2).
69-78.
[14] Khan R.E.A & Hye Q.M.A. (2013). Financial Liberalization and Demand for Money:
A Case of Pakistan. The Journal of Developing Areas 47(2). 175-198.
[15] Lutkepohl, H. (2007). New Introduction to Multiple Time Series Analysis. New York.
Springer.
[16] Mansfeld, Y. (1996). Wars, Tourism and the "Middle East" Factor. In: Pizam, A.,
Mansfeld, Y. (Eds.), Tourism, Crime and International Security Issues. Wiley, New
York. 265-278.
25
[17] Mazursky, D. (1989). Past experience and future tourism decision. Annals of Tourism
Research. 16. 333-344.
[18] National Consortium for the Study of Terrorism and Responses to Terror-
ism (START). (2013). Global Terrorism Database [Data file]. Retrieved from
http://www.start.umd.edu/gtd
[19] Neumayer, E. (2004). The impact of political violence on tourism : dynamic econo-
metric estimation in a cross-national panel. London: LSE Research Online.
[20] Pahlavani, M. & Harvie, C. (2006). Sources of Economic Growth in South Korea: An
Application of the ARDL Analysis in the Presence of Structural Breaks âAS 1980-
2005. Department of Economics. University of Wollongong.
[21] Pesaran, M.H. & Pesaran, B. (1997). Working with Microfit 4.0: Interactive Econo-
metric Analysis. Oxford University Press, Oxford.
[22] Pesaran, M.H. & Shin, Y. (1999). An autoregressive distributed lag modeling approach
to co-integration analysis. In: Strom, S. (Ed.), Econometrics and Economic Theory in
the 20th Century: The Ragnar Frisch Centennial Symposium. Cambridge University
Press, Cambridge.
[23] Pesaran, M.H., Shin, Y. & Smith, R.J. (2000). Structural analysis of vector error cor-
rection models with exogenous I(1) variables. Journal of Econometrics 97. 293-343.
[24] Pesaran, M.H., Shin, Y. & Smith, R.J. (2001). Bounds testing approaches to the analy-
sis of level relationships. Journal of Applied Economics. 16. 289-326.
[25] Raza, S.A., & Jawaid, S.T. (2013). Terrorism and tourism: A conjunction and ramifi-
cation in Pakistan. Economic Modelling. 33. 65-70.
[26] Selvanathan, S. (2007). The effect of war and other factors on Sri Lankan tourism.
Applied Economics Letters. 14 (1). 35-38.
26
[27] Sonmez, S. (1998). Tourism, terrorism, and political instability. Annals of Tourism
Research. 25 (2). 416-456.
[28] Stock, J. & Watson, M.W. (1993). A simple estimator of cointegrating vector in higher
order integrated systems. Econometrica. 6 (4). 783-820.
[29] Toda, H.Y. & Yamamoto, T. (1995). Statistical Inference in Vector Autoregressions
with Possibly Integrated Processes. Journal of Econometrics. 66. 225-250.
[30] Upadhyay P.K., Muller-Boker.U. & Sharma S.R. (2011). Tourism Amidst Armed Con-
flict: Consequences, Copings, and Creativity for Peace-building Through Tourism in
Nepal. The Journal of Tourism and Peace Research. 1 (2). 22-40.
[31] World Travel and Tourism Council. (2014). The Economic impact of travel and tourism
2014 Nepal.
[32] Zivot E. & Andrews D.W.K. (1990). Further Evidence on the Great Crash, the Oil
Price Shock, and the Unit Root Hypothesis. Cowles Foundation Discussion Papers
944, Cowles Foundation for Research in Economics Yale University.
27


![THESIS TITLE A THESIS SUBMITTED TO THE MIDDLE EAST ...ii.metu.edu.tr/system/files/documents/thesis... · [SAMPLE 1] Approval of the thesis: THESIS TITLE Submitted by STUDENT NAME](https://img.pdfslide.net/doc/110x75/6019035f39977162fc4f0b03/thesis-title-a-thesis-submitted-to-the-middle-east-iimetuedutrsystemfilesdocumentsthesis.jpg)