Embed Size (px)
Citation preview
PROMOTING EXPORTS OR FOSTERING DISPARITY? THE EFFECTS OF EXCHANGE RATE UNDERVALUATION ON INCOME INEQUALITY
A Thesis submitted to the Faculty of the
Graduate School of Arts and Sciences of Georgetown University
in partial fulfillment of the requirements for the degree of
Master of Public Policy By
Shiladitya Chakrabarti, B.S.
Washington, DC April 15, 2014
ii
Copyright 2014 by Shiladitya Chakrabarti All Rights Reserved
iii
PROMOTING EXPORTS OR FOSTERING DISPARITY? THE EFFECTS OF EXCHANGE RATE UNDERVALUATION ON INCOME INEQUALITY
Shiladitya Chakrabarti, B.S.
Thesis Advisor: Andreas T. Kern, Ph.D.
ABSTRACT
Income inequality finds a prominent place in contemporary political and economic debates. I
demonstrate that sustained exchange rate undervaluation increases inequality, building on
research linking undervaluation with growth (Rodrik, 2008). I offer evidence that sustained
undervaluation increases income inequality levels using fixed effects and dynamic panel
estimators with country-level data. The relationship is robust to the inclusion of controls such as
the political regime type, nature of the banking system, trade, and education levels. The adverse
effects of inequality due to undervalued exchange rates imply that governments pursuing
undervaluation-based strategies for spurring economic growth should consider the
socioeconomic effects of such policies and the potential threat to political stability posed by
rising societal disparities. The existence of a relationship between these variables also offers
insights about the behavior of autocratic governments that undergo a sustained period of export-
driven economic growth.
Keywords: income inequality, exchange rates, currency undervaluation
08 Fall
iv
I would like to acknowledge everybody who assisted in the writing of this thesis, in
particular friends, family members, faculty and staff at the McCourt School of Public Policy.
A special note of appreciation is owed to my thesis advisor Dr. Andreas T. Kern for his vital
inputs and assistance during the entire process of researching and writing this document.
Shiladitya Chakrabarti
v
TABLE OF CONTENTS INTRODUCTION ................................................................................................................................. 1 LITERATURE REVIEW ...................................................................................................................... 2 THEORETICAL CONSIDERATIONS ........................................................................................... 10 DATA DESCRIPTION ........................................................................................................................ 14 ANALYSIS ............................................................................................................................................... 18 POLICY IMPLICATIONS ................................................................................................................... 26 APPENDIX ............................................................................................................................................. 32 BIBLIOGRAPHY ................................................................................................................................... 37
1
INTRODUCTION
Inequality has been a topic of fierce debate in recent years. Phenomena as diverse as the Arab Spring
revolts of 2011 and the Occupy Wall Street movement have been attributed in part to the increasing
gap between the rich and poor in societies around the world.
The post-war economic order was characterized by substantial growth in the United States,
Western Europe and Japan, rapid productivity increases, fixed exchange rates underpinned by
Bretton-Woods institutions, and restricted capital flows. Beginning in the 1970s, various
developments including the oil shocks, introduction of floating currencies, and high inflation in
advanced economies led to its unraveling in favor of the “Washington Consensus”1 that emphasized
trade liberalization, low taxation and deregulation of industry as a way of increasing living standards.
While the effects of such policies on growth rates has at best been mixed, most of the advanced
economies have witnessed a simultaneous rise in the income gap between the richer and poorer
sections of society.2
At the same time, the past several decades have been a period of rapid economic growth for a
number of economies that have attempted a rapid transition to developed-country status. A select
group of these countries, particularly in the East Asia region, have managed to combine rising
prosperity with changes in their political systems enabling greater democratic representation. For
instance, South Korea has epitomized this type of transformation in the past 60 years. A closer look
at forces in their political economy suggests that the rising power of economic elites during a period
of high growth and financial liberalization paved the way to democratic transition.3 It is also of
interest that many of these economies relied on a development strategy that emphasized
competitiveness of their national currencies to boost manufacturing exports, which found lucrative
markets in advanced economies.
In the contemporary era, the People’s Republic of China seems to be following a similar trajectory
2
of exports-fueled economic development and financial liberalization along with gradual opening up
of the political system. It might well be the case that such economic and political developments
cannot be replicated outside of East Asia due to the unique historical experiences and cultural
circumstances of that particular region. Nevertheless, the relationship between currency
undervaluation (a key factor in the East Asian development story) and income inequality (a plausible
result of policies focused on promoting selected economic sectors) merits investigation.
This paper is intended as an investigation into the determinants of income inequality, specifically
the role of currency exchange rate undervaluation that may be pursued by countries in search of
economic development and rapid rise in living standards for their impoverished populations, in
exacerbating the income gap between the poorest and richest segments of society. I hypothesize that
sustained periods of undervaluation result in greater earnings gap between the upper and lower
halves of the income distribution. To validate this theory empirically, I shall analyze the effect of
exchange rate undervaluation on income inequality in various regression specifications, including
cross-sectional, fixed effects, and dynamic panel GMM models. Evidence of this type of relationship
between undervaluation and income inequality would signify that the strategy of emphasizing
exports to generate GDP growth might impose a cost on the wider society, and in turn generate
social and political instability.
LITERATURE REVIEW
In this section I analyze the literature on income inequality and how my research question fits into
the body of work on this topic. A number of broad trends have shaped the extent and direction of
income inequality across the world over time. Here I shall point to some of the key channels
influencing inequality levels.
Macroeconomic Channel
In his classic contribution to the literature, Kuznets (1955) surveyed the income inequality landscape
3
by observing the advanced economies of United States, Great Britain, and Germany through their
periods of industrialization in the 19th and early 20th centuries, including two world wars and the
Great Depression. Although Kuznets concedes a lack of empirical rigor in this rather descriptive
work, the author theorizes a long-term trend for the “secular income structure: widening in the early
phases of economic growth when the transition from the pre-industrial to the industrial civilization
was most rapid; becoming stabilized for a while; and then narrowing.”4 While he gives legislative
measures (e.g. inheritance taxes and other limits on capital accumulation) their due in restricting the
wealth of those at the top of the income distribution, the major role in offsetting widening inequality
is attributed to “a rise in the income share of the lower groups within the nonagricultural sector of
the population.”5 Following a period of increasing rural-urban earnings gaps as the population
migrates from low-productivity agricultural settings to higher-earning industrial sectors, the lower
income groups within those urban populations adapt to “the possibilities of the city life”6 and their
participation in the political system ensured that the benefits of industrialization accrued to people at
the bottom of the income distribution at a faster rate than those at the top. Kuznets also speculates
on the relationship between the long-term inequality trends and patterns “in other important
components of the growth process,”7 including population growth rates, changes in savings and
capital formation rates, and proportion of foreign trade in terms of overall economic activity.
Although this paper serves as a useful starting point in terms of an investigation into determinants
of income inequality, the lack of robust empirical evidence calls into question the applicability of the
authors’ assertions spelled out in his paper. Rather, one should deem Kuznets’ contribution as a
thoughtful piece of literature hypothesizing different avenues through which long-term
macroeconomic processes can affect the income distribution, particularly in societies that have
witnessed a significant amount of urbanization and industrial activity.
In their study of twentieth-century income inequality patterns in the United States, Piketty and
4
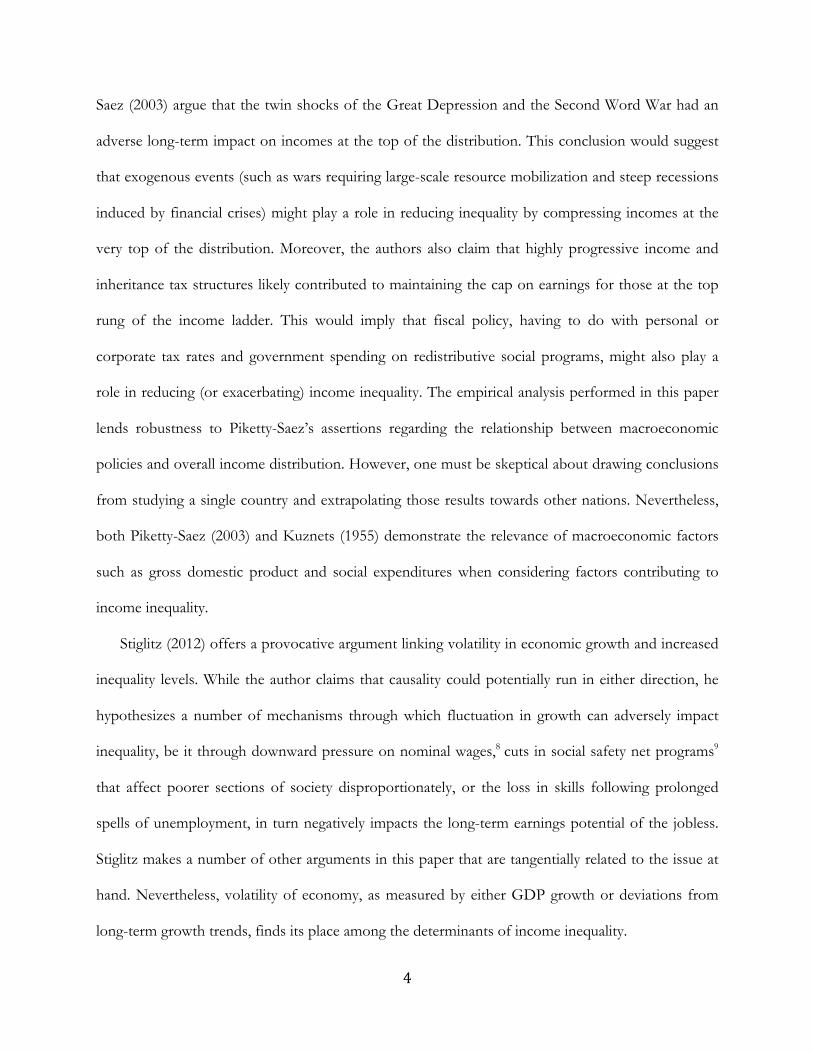
Saez (2003) argue that the twin shocks of the Great Depression and the Second Word War had an
adverse long-term impact on incomes at the top of the distribution. This conclusion would suggest
that exogenous events (such as wars requiring large-scale resource mobilization and steep recessions
induced by financial crises) might play a role in reducing inequality by compressing incomes at the
very top of the distribution. Moreover, the authors also claim that highly progressive income and
inheritance tax structures likely contributed to maintaining the cap on earnings for those at the top
rung of the income ladder. This would imply that fiscal policy, having to do with personal or
corporate tax rates and government spending on redistributive social programs, might also play a
role in reducing (or exacerbating) income inequality. The empirical analysis performed in this paper
lends robustness to Piketty-Saez’s assertions regarding the relationship between macroeconomic
policies and overall income distribution. However, one must be skeptical about drawing conclusions
from studying a single country and extrapolating those results towards other nations. Nevertheless,
both Piketty-Saez (2003) and Kuznets (1955) demonstrate the relevance of macroeconomic factors
such as gross domestic product and social expenditures when considering factors contributing to
income inequality.
Stiglitz (2012) offers a provocative argument linking volatility in economic growth and increased
inequality levels. While the author claims that causality could potentially run in either direction, he
hypothesizes a number of mechanisms through which fluctuation in growth can adversely impact
inequality, be it through downward pressure on nominal wages,8 cuts in social safety net programs9
that affect poorer sections of society disproportionately, or the loss in skills following prolonged
spells of unemployment, in turn negatively impacts the long-term earnings potential of the jobless.
Stiglitz makes a number of other arguments in this paper that are tangentially related to the issue at
hand. Nevertheless, volatility of economy, as measured by either GDP growth or deviations from
long-term growth trends, finds its place among the determinants of income inequality.
5
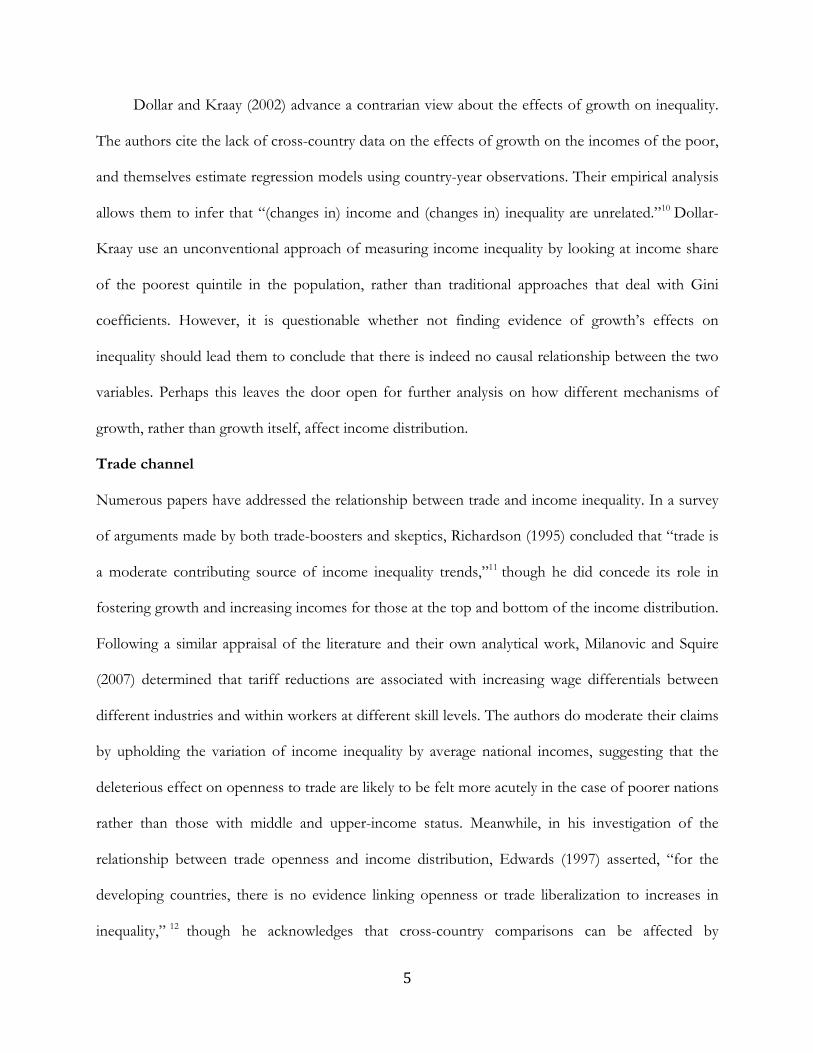
Dollar and Kraay (2002) advance a contrarian view about the effects of growth on inequality.
The authors cite the lack of cross-country data on the effects of growth on the incomes of the poor,
and themselves estimate regression models using country-year observations. Their empirical analysis
allows them to infer that “(changes in) income and (changes in) inequality are unrelated.”10 Dollar-
Kraay use an unconventional approach of measuring income inequality by looking at income share
of the poorest quintile in the population, rather than traditional approaches that deal with Gini
coefficients. However, it is questionable whether not finding evidence of growth’s effects on
inequality should lead them to conclude that there is indeed no causal relationship between the two
variables. Perhaps this leaves the door open for further analysis on how different mechanisms of
growth, rather than growth itself, affect income distribution.
Trade channel
Numerous papers have addressed the relationship between trade and income inequality. In a survey
of arguments made by both trade-boosters and skeptics, Richardson (1995) concluded that “trade is
a moderate contributing source of income inequality trends,”11 though he did concede its role in
fostering growth and increasing incomes for those at the top and bottom of the income distribution.
Following a similar appraisal of the literature and their own analytical work, Milanovic and Squire
(2007) determined that tariff reductions are associated with increasing wage differentials between
different industries and within workers at different skill levels. The authors do moderate their claims
by upholding the variation of income inequality by average national incomes, suggesting that the
deleterious effect on openness to trade are likely to be felt more acutely in the case of poorer nations
rather than those with middle and upper-income status. Meanwhile, in his investigation of the
relationship between trade openness and income distribution, Edwards (1997) asserted, “for the
developing countries, there is no evidence linking openness or trade liberalization to increases in
inequality,” 12 though he acknowledges that cross-country comparisons can be affected by
6
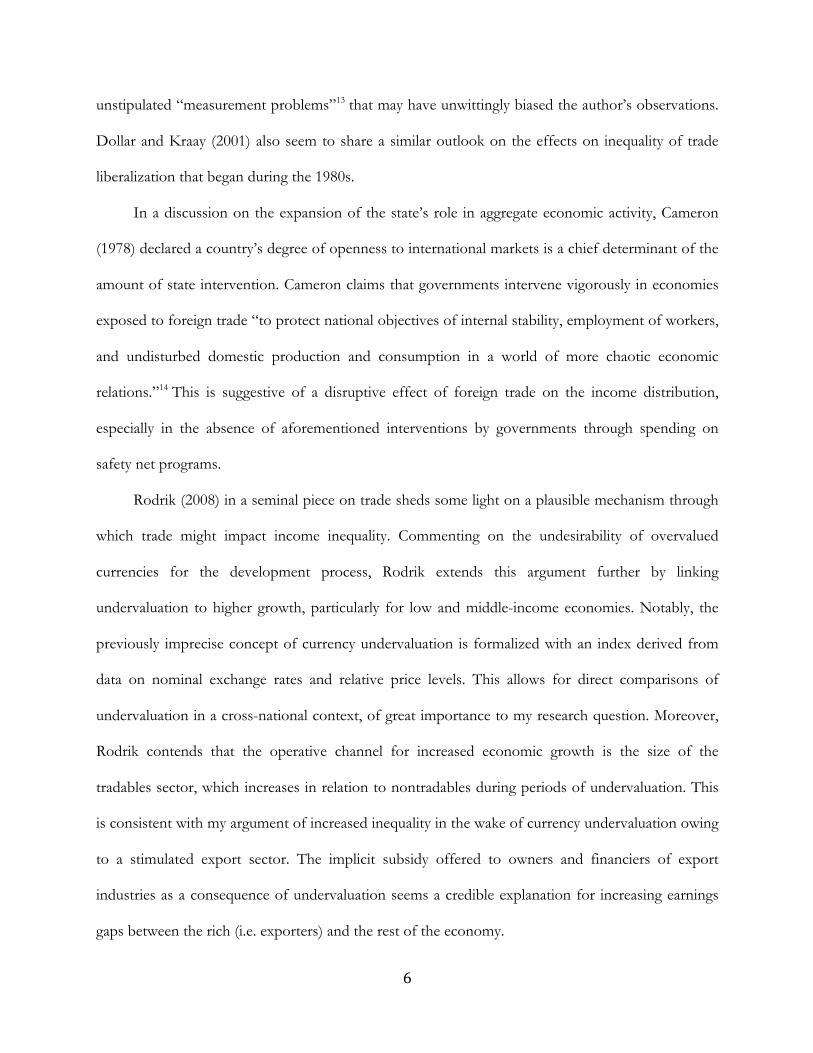
unstipulated “measurement problems”13 that may have unwittingly biased the author’s observations.
Dollar and Kraay (2001) also seem to share a similar outlook on the effects on inequality of trade
liberalization that began during the 1980s.
In a discussion on the expansion of the state’s role in aggregate economic activity, Cameron
(1978) declared a country’s degree of openness to international markets is a chief determinant of the
amount of state intervention. Cameron claims that governments intervene vigorously in economies
exposed to foreign trade “to protect national objectives of internal stability, employment of workers,
and undisturbed domestic production and consumption in a world of more chaotic economic
relations.”14 This is suggestive of a disruptive effect of foreign trade on the income distribution,
especially in the absence of aforementioned interventions by governments through spending on
safety net programs.
Rodrik (2008) in a seminal piece on trade sheds some light on a plausible mechanism through
which trade might impact income inequality. Commenting on the undesirability of overvalued
currencies for the development process, Rodrik extends this argument further by linking
undervaluation to higher growth, particularly for low and middle-income economies. Notably, the
previously imprecise concept of currency undervaluation is formalized with an index derived from
data on nominal exchange rates and relative price levels. This allows for direct comparisons of
undervaluation in a cross-national context, of great importance to my research question. Moreover,
Rodrik contends that the operative channel for increased economic growth is the size of the
tradables sector, which increases in relation to nontradables during periods of undervaluation. This
is consistent with my argument of increased inequality in the wake of currency undervaluation owing
to a stimulated export sector. The implicit subsidy offered to owners and financiers of export
industries as a consequence of undervaluation seems a credible explanation for increasing earnings
gaps between the rich (i.e. exporters) and the rest of the economy.
7
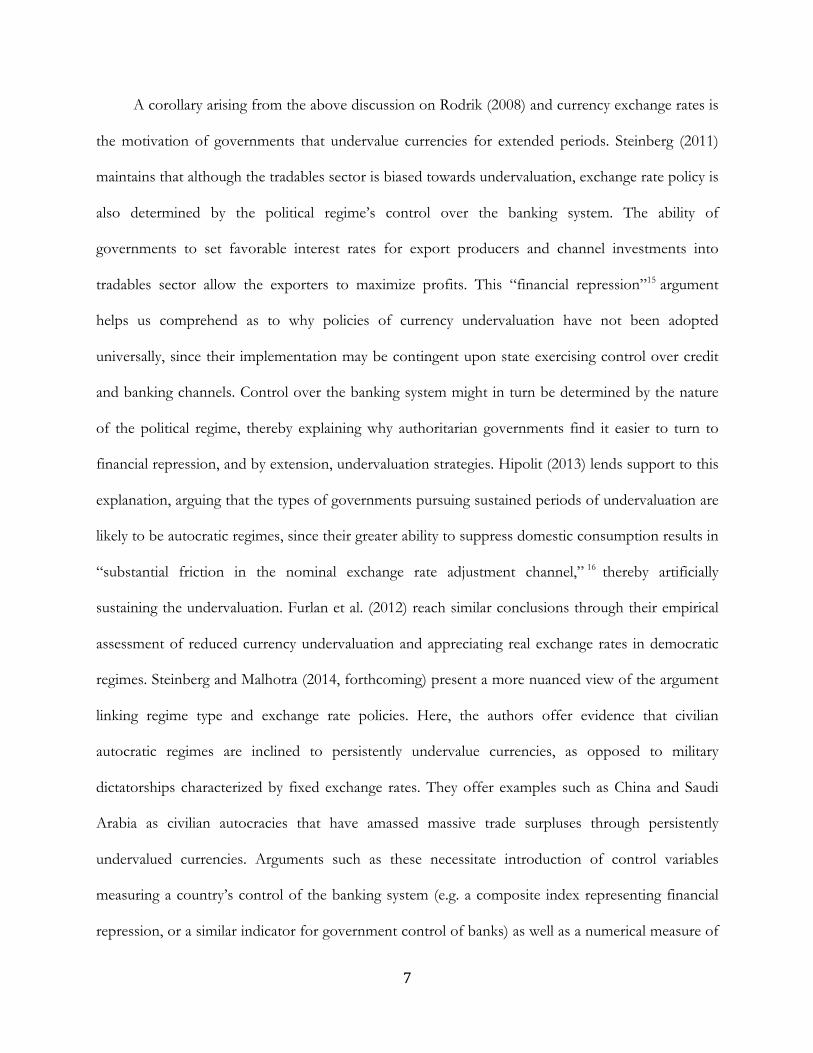
A corollary arising from the above discussion on Rodrik (2008) and currency exchange rates is
the motivation of governments that undervalue currencies for extended periods. Steinberg (2011)
maintains that although the tradables sector is biased towards undervaluation, exchange rate policy is
also determined by the political regime’s control over the banking system. The ability of
governments to set favorable interest rates for export producers and channel investments into
tradables sector allow the exporters to maximize profits. This “financial repression”15 argument
helps us comprehend as to why policies of currency undervaluation have not been adopted
universally, since their implementation may be contingent upon state exercising control over credit
and banking channels. Control over the banking system might in turn be determined by the nature
of the political regime, thereby explaining why authoritarian governments find it easier to turn to
financial repression, and by extension, undervaluation strategies. Hipolit (2013) lends support to this
explanation, arguing that the types of governments pursuing sustained periods of undervaluation are
likely to be autocratic regimes, since their greater ability to suppress domestic consumption results in
“substantial friction in the nominal exchange rate adjustment channel,” 16 thereby artificially
sustaining the undervaluation. Furlan et al. (2012) reach similar conclusions through their empirical
assessment of reduced currency undervaluation and appreciating real exchange rates in democratic
regimes. Steinberg and Malhotra (2014, forthcoming) present a more nuanced view of the argument
linking regime type and exchange rate policies. Here, the authors offer evidence that civilian
autocratic regimes are inclined to persistently undervalue currencies, as opposed to military
dictatorships characterized by fixed exchange rates. They offer examples such as China and Saudi
Arabia as civilian autocracies that have amassed massive trade surpluses through persistently
undervalued currencies. Arguments such as these necessitate introduction of control variables
measuring a country’s control of the banking system (e.g. a composite index representing financial
repression, or a similar indicator for government control of banks) as well as a numerical measure of
8
the political system (e.g. Polity scores) into the empirical model for estimating the impact on income
inequality.
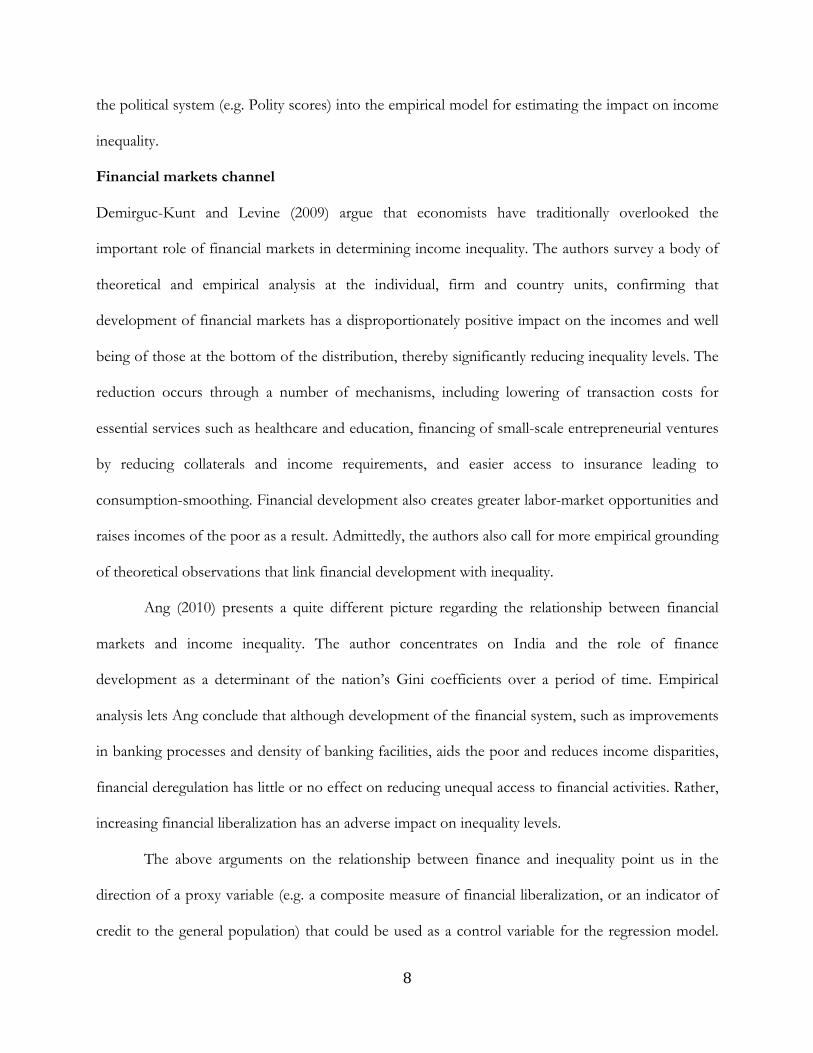
Financial markets channel
Demirguc-Kunt and Levine (2009) argue that economists have traditionally overlooked the
important role of financial markets in determining income inequality. The authors survey a body of
theoretical and empirical analysis at the individual, firm and country units, confirming that
development of financial markets has a disproportionately positive impact on the incomes and well
being of those at the bottom of the distribution, thereby significantly reducing inequality levels. The
reduction occurs through a number of mechanisms, including lowering of transaction costs for
essential services such as healthcare and education, financing of small-scale entrepreneurial ventures
by reducing collaterals and income requirements, and easier access to insurance leading to
consumption-smoothing. Financial development also creates greater labor-market opportunities and
raises incomes of the poor as a result. Admittedly, the authors also call for more empirical grounding
of theoretical observations that link financial development with inequality.
Ang (2010) presents a quite different picture regarding the relationship between financial
markets and income inequality. The author concentrates on India and the role of finance
development as a determinant of the nation’s Gini coefficients over a period of time. Empirical
analysis lets Ang conclude that although development of the financial system, such as improvements
in banking processes and density of banking facilities, aids the poor and reduces income disparities,
financial deregulation has little or no effect on reducing unequal access to financial activities. Rather,
increasing financial liberalization has an adverse impact on inequality levels.
The above arguments on the relationship between finance and inequality point us in the
direction of a proxy variable (e.g. a composite measure of financial liberalization, or an indicator of
credit to the general population) that could be used as a control variable for the regression model.
9
Having surveyed the literature on how macroeconomics, trade, and financial markets may affect
inequality, we should also consider whether a certain level of inequality might be determined by
factors of human development.
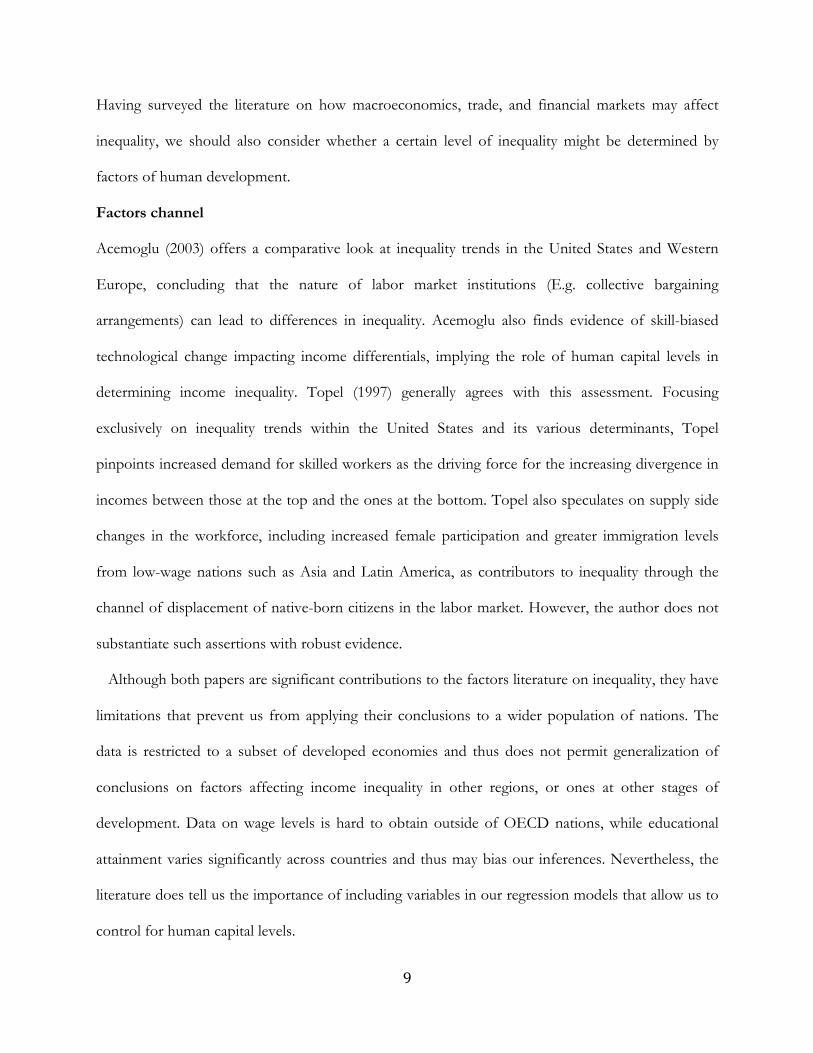
Factors channel
Acemoglu (2003) offers a comparative look at inequality trends in the United States and Western
Europe, concluding that the nature of labor market institutions (E.g. collective bargaining
arrangements) can lead to differences in inequality. Acemoglu also finds evidence of skill-biased
technological change impacting income differentials, implying the role of human capital levels in
determining income inequality. Topel (1997) generally agrees with this assessment. Focusing
exclusively on inequality trends within the United States and its various determinants, Topel
pinpoints increased demand for skilled workers as the driving force for the increasing divergence in
incomes between those at the top and the ones at the bottom. Topel also speculates on supply side
changes in the workforce, including increased female participation and greater immigration levels
from low-wage nations such as Asia and Latin America, as contributors to inequality through the
channel of displacement of native-born citizens in the labor market. However, the author does not
substantiate such assertions with robust evidence.
Although both papers are significant contributions to the factors literature on inequality, they have
limitations that prevent us from applying their conclusions to a wider population of nations. The
data is restricted to a subset of developed economies and thus does not permit generalization of
conclusions on factors affecting income inequality in other regions, or ones at other stages of
development. Data on wage levels is hard to obtain outside of OECD nations, while educational
attainment varies significantly across countries and thus may bias our inferences. Nevertheless, the
literature does tell us the importance of including variables in our regression models that allow us to
control for human capital levels.
10
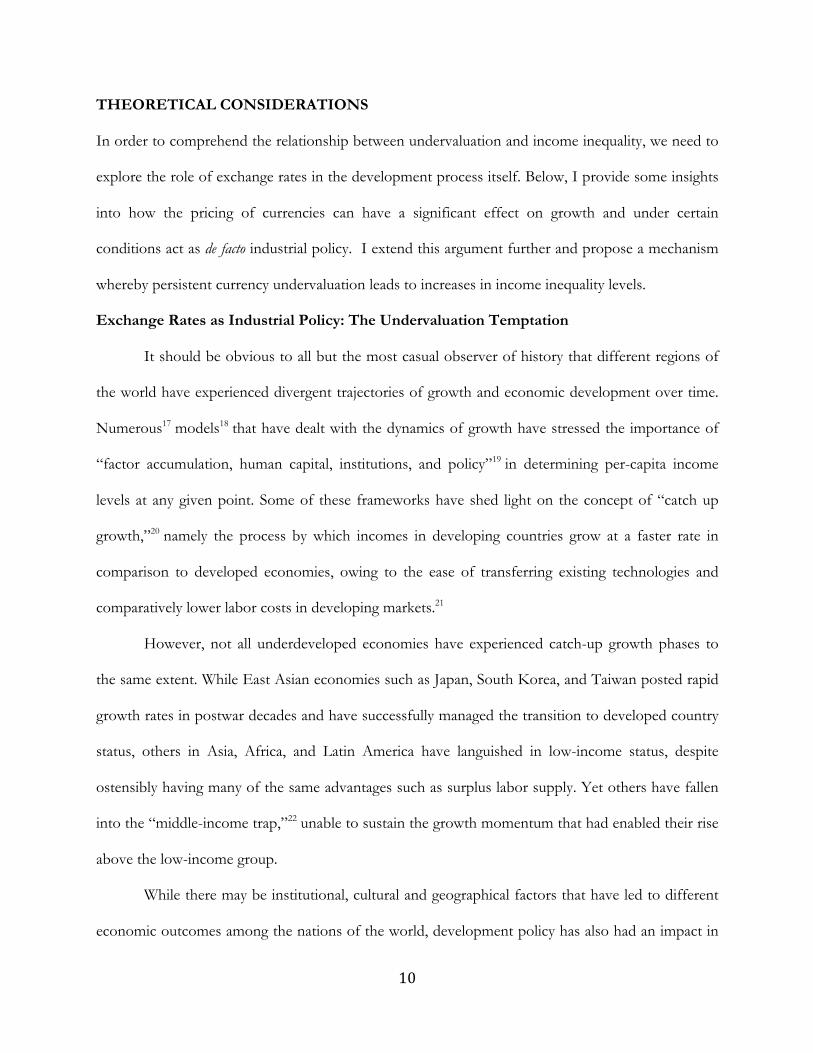
THEORETICAL CONSIDERATIONS
In order to comprehend the relationship between undervaluation and income inequality, we need to
explore the role of exchange rates in the development process itself. Below, I provide some insights
into how the pricing of currencies can have a significant effect on growth and under certain
conditions act as de facto industrial policy. I extend this argument further and propose a mechanism
whereby persistent currency undervaluation leads to increases in income inequality levels.
Exchange Rates as Industrial Policy: The Undervaluation Temptation
It should be obvious to all but the most casual observer of history that different regions of
the world have experienced divergent trajectories of growth and economic development over time.
Numerous17 models18 that have dealt with the dynamics of growth have stressed the importance of
“factor accumulation, human capital, institutions, and policy”19 in determining per-capita income
levels at any given point. Some of these frameworks have shed light on the concept of “catch up
growth,”20 namely the process by which incomes in developing countries grow at a faster rate in
comparison to developed economies, owing to the ease of transferring existing technologies and
comparatively lower labor costs in developing markets.21
However, not all underdeveloped economies have experienced catch-up growth phases to
the same extent. While East Asian economies such as Japan, South Korea, and Taiwan posted rapid
growth rates in postwar decades and have successfully managed the transition to developed country
status, others in Asia, Africa, and Latin America have languished in low-income status, despite
ostensibly having many of the same advantages such as surplus labor supply. Yet others have fallen
into the “middle-income trap,”22 unable to sustain the growth momentum that had enabled their rise
above the low-income group.
While there may be institutional, cultural and geographical factors that have led to different
economic outcomes among the nations of the world, development policy has also had an impact in
11
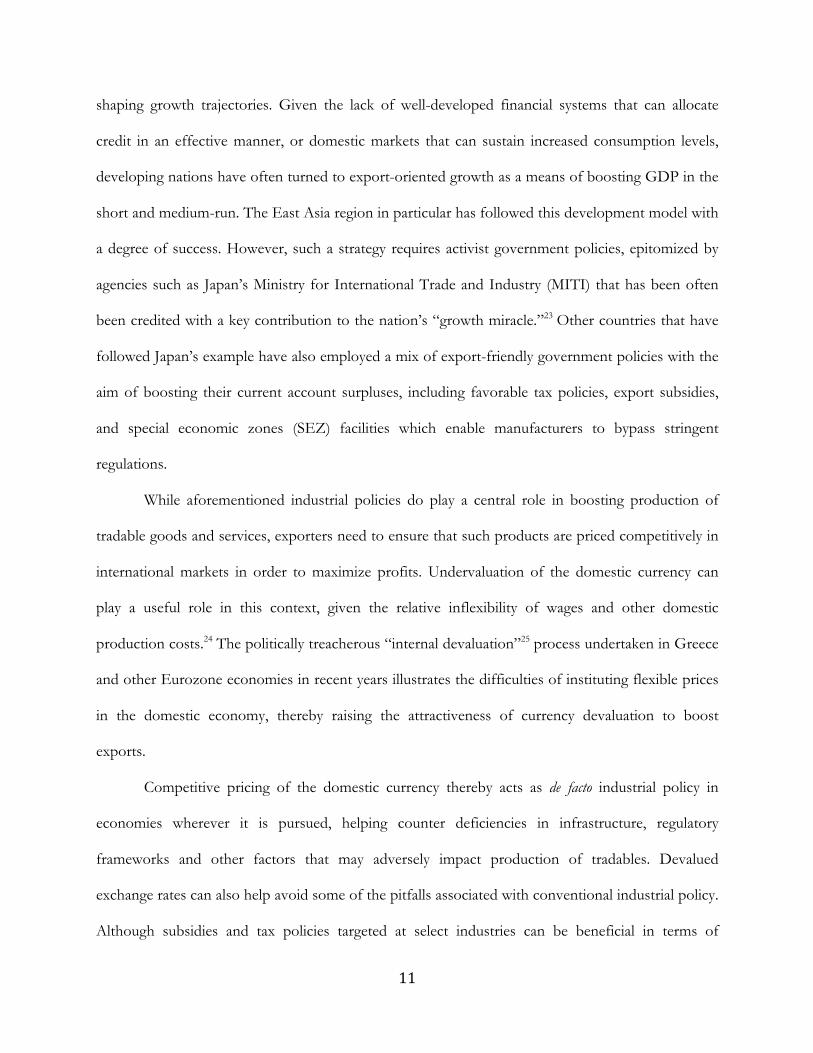
shaping growth trajectories. Given the lack of well-developed financial systems that can allocate
credit in an effective manner, or domestic markets that can sustain increased consumption levels,
developing nations have often turned to export-oriented growth as a means of boosting GDP in the
short and medium-run. The East Asia region in particular has followed this development model with
a degree of success. However, such a strategy requires activist government policies, epitomized by
agencies such as Japan’s Ministry for International Trade and Industry (MITI) that has been often
been credited with a key contribution to the nation’s “growth miracle.”23 Other countries that have
followed Japan’s example have also employed a mix of export-friendly government policies with the
aim of boosting their current account surpluses, including favorable tax policies, export subsidies,
and special economic zones (SEZ) facilities which enable manufacturers to bypass stringent
regulations.
While aforementioned industrial policies do play a central role in boosting production of
tradable goods and services, exporters need to ensure that such products are priced competitively in
international markets in order to maximize profits. Undervaluation of the domestic currency can
play a useful role in this context, given the relative inflexibility of wages and other domestic
production costs.24 The politically treacherous “internal devaluation”25 process undertaken in Greece
and other Eurozone economies in recent years illustrates the difficulties of instituting flexible prices
in the domestic economy, thereby raising the attractiveness of currency devaluation to boost
exports.
Competitive pricing of the domestic currency thereby acts as de facto industrial policy in
economies wherever it is pursued, helping counter deficiencies in infrastructure, regulatory
frameworks and other factors that may adversely impact production of tradables. Devalued
exchange rates can also help avoid some of the pitfalls associated with conventional industrial policy.
Although subsidies and tax policies targeted at select industries can be beneficial in terms of
12
increased exports, they may not be the most efficient measures and can lead to significant distortions
in the country’s political economy.26 In contrast, a strategy of competitive currency valuation would
uniformly impact the economy, thereby minimizing “political and economic distortions that
could result from state favoritism and state intervention.”27
Is Undervaluation Paving the Road to Income Inequality?
Although the above discussion highlights the advantages of a development strategy oriented
around exports and currency devaluation, this particular approach should not be considered a
panacea for all developing markets. While devaluation may be valuable to overall GDP growth and
the tradables sector in particular, it may also affect the income distribution in the overall economy,
in turn impacting the political system and long-run social stability.
I present a simple mechanism to determine the association (and possible causal relationship)
between undervaluation and inequality. The model consists of income inequality, represented by a
Gini index, as the dependent variable. The primary independent variable in the model is an index
measuring the extent of exchange rate undervaluation, initially developed in a study measuring the
impact of undervaluation on economic growth (Rodrik, 2008). In order to get a more accurate
estimate of the effect of undervaluing currencies on income inequality, I also include other
confounding variables. These control variables may broadly be divided into the categories of
macroeconomics (e.g. GDP), trade (e.g. exports as a percentage of GDP), financial markets (e.g.
government control of banking system, index of financial repression etc.) and socioeconomic factors
(e.g. social expenditures, level of education etc.). Prior to estimating the effects on inequality
empirically, it is useful to consider the mechanism(s) by which currency undervaluation might
influence the outcome of interest. Below, I present one such theory that might bring about a causal
connection between the two variables.
13
Consider an economy comprising two distinct segments, manufacturing goods and
nontradables. This model assumes that manufacturing goods are traded across international borders
and their sales are dependent on the exchange rate at any given point of time, whereas the
nontradables sector is impervious to exchange rate fluctuations. A sustained period of
undervaluation is going to disproportionately benefit the manufacturing exports sector.28 In this
scenario, the increased economic growth owing to undervaluation pushes the production
possibilities frontier outwards, and at the same time the curve would skew in the direction of the
exports sector. In other words, not only does the economic pie increase in overall size, but a greater
portion of it accrues to the manufacturing sector that benefits disproportionately from
undervaluation.
The increased exports signify sustained profits for firms in the manufacturing sector, and
dependent on the ownership structures in those businesses, the profits are channeled into higher
disposable incomes for the investors/management in these firms. In the case of partially or
completely state-owned enterprises, those profits theoretically accumulate within national treasuries.
Exchange rate depreciation may also adversely impact inequality through other means.
Rising commodity prices in domestic markets that are a direct result of undervalued currencies, in
particular food29 and fuel costs that form a significant portion of the budget in developing countries.
The reduction in real consumption among the poorer sections of society, a consequence of the
undervaluation, increases overall poverty30 and contributes to the income gap with the tradables
sector, which benefits disproportionately from the depreciated currency.
The trend towards greater income inequality may be reinforced if exchange rate
undervaluation is combined with “financial repression,”31 marked by limits on interest rates, credit
allocation restrictions, and government control of banking activities. The control exercised by the
state on the financial system can lead to “concentration of investment opportunities in few hands”32
14
allied with major political actors, particularly in authoritarian regimes.33 The channeling of credit
towards politically favored enterprises hampers those industries that are not as well connected to the
incumbent government, hampering the supposed reductions in inequality that may result from
greater access to financial markets.34
In the absence of countervailing policies that redistribute profits made by the tradables
sector to the general population, all of the aforementioned factors should lead to increasing
disparities between the top and the bottom ends of the income distribution. We would expect this
relationship to be stronger for developing nations (since they are characterized by weak social safety
nets) and countries where the government has effective control over the banking and financial
systems (enabling it to restrain household consumption and channel credit to manufacturing). Given
these arguments I have outlined in this section, there ought to be considerable empirical evidence
demonstrating the relationship between sustained currency undervaluation and rising income
inequality.
DATA DESCRIPTION
The cross-country panel dataset I shall be using for empirical investigation has observations across
85 countries between the years 1973 and 2010, and my unit of analysis is country-year. The
dependent variable in my empirical analysis will be a measure of income inequality. The key
independent variable in the model(s) shall be an index measuring the extent of undervaluation in a
currency at a given point in time. In addition to these, I include some other variables as controls to
provide a more unbiased effect of undervaluation on income inequality. In order to estimate the
hypothesized effect of currency undervaluation on income inequality, the following regression
model will be used:
15
Gini it = β0 + β1 * log (undervaluat ion) it + β2 * Poli ty it + β3 * Financial Repress ion it + β4 *
State Ownership it + β5 * Trade it + β6 * Years School ing it + β7 * GDP per capi ta i t + αi
(αi denotes fixed effects indicators for countries present in the dataset)
Assuming there are no other time-varying variables omitted from this regression model that are
associated with both log (undervaluation) and Gini coefficient, β1 should provide us with an
unbiased estimate of the effect of currency undervaluation on income inequality.
Alternatively, if we use sustained undervaluation as our primary independent variable instead
of the aforementioned logarithmic version of the index, then our model looks like the following:
Gini it = β0 + β1 * Sustained Undervaluat ion it + β2 * Poli ty it + β3 * Financial Repress ion it + β4
* State Ownership it + β5 * Trade it + β6 * Years School ing it + β7 * GDP per capi ta it + αi
(αi denotes fixed effects indicators for countries present in the dataset)
In the following paragraphs, I provide details on each of the variables in the empirical model.
Gini Coefficient – This is a widely recognized measure of income distribution in the social science
literature. The coefficient values range between 0 and 100, with a higher coefficient indicating a
greater amount of dispersion in income levels for a given country. While there exist a variety of data
sources providing this information, for my research I am using the World Income Inequality
Database (version 2.0c, May 2008) made available by the World Institute for Development
Economics Research (UNU-WIDER). The database has compiled income inequality measures from
various studies over the years, and where data on income is unavailable, the Gini coefficients have
been estimated using other criteria such as expenditure and consumption levels. There are a total of
2332 observations for the Gini variable in the dataset, with values ranging from a minimum of 15.5
to a maximum of 77.6, with a mean value of 38.78 and standard deviation equal to 11.52.
Undervaluation – Currency undervaluation is a challenging entity in terms of measurement. Here I
am using an index constructed by Rodrik (2008), one that has been referred to in other research
16
(Hipolit, 2013) dealing with the subject of undervaluation. The index is derived using the Penn
World Tables on domestic price levels, which scales a country’s nominal exchange rate with the
nation’s purchasing power parity (PPP). Then an undervaluation index is calculated by adjusting for
the Balassa-Samuelson effect (Ito et al, 1999). The advantage of using an admittedly complex
operationalization for currency undervaluation is that this lends itself to comparison across countries
and different time-periods. It should be noted that the index being in logarithmic form makes it less
sensitive to changes, and would allow interpretations to be made in percentage terms rather than
absolute units. This particular dataset contains 2591 observations for the undervaluation variable,
with values ranging from a minimum of -3.16 to a maximum of 1.69, a mean index of -0.061 and
standard deviation equal to 1.69. Note that values less than zero indicate an overvaluation of the
currency in a given year, whereas values greater than zero signal an undervaluation.
Additionally, a “sustained undervaluation”35 indicator form of this construct may be used as
the primary independent variable in place of the logarithmic functional form. The indicator shall be
set to 1 if the undervaluation was sustained for three consecutive years, and 0 otherwise. There are
2433 observations for this variable in the dataset, ranging from 0 at a minimum to a maximum of 1.
The mean value for sustained undervaluation is 0.446, and its standard deviation is 0.497.
Polity Score – Polity scores are an ordinal variable denoting the extent of democratic rule in
countries, taking into account the strength of institutions, constraints on executive power, and
existence of individual rights. These data are collected as part of the Polity IV project researching
political systems in countries dating back to 1800. My dataset contains 2562 observations ranging
from -10 to +10 (a higher score indicates a greater degree of political openness). The mean and
standard deviation for this indicator are 3.428 and 6.958 respectively. The Polity scores shall serve as
a control variable in the model.
Financial Repression – The financial repression index is an ordinal variable downloaded from “A
17
New Database of Financial Reform” that was constructed in 2010 (Abiad et al, 2010) as a way of
comparing the different forms of control on nations’ financial system that are exerted by
governments. This particular index is a composite measure of multiple channels of said repression,
namely credit controls, interest rate controls, entry barriers, bank regulations, privatization, capital
account, and securities markets (Hipolit, 2013). While the original composite index indicating the
extent of financial liberalization (Abiad et al, 2010) ranged from 0 to 21, with a higher score
signifying a greater degree of openness, Hipolit (Hipolit, 2013) redefined this particular scale by
multiplying the composite index by -1, thus converting the scale to one of values ranging from -21
to 0. Under this particular variable definition, higher values imply a greater degree of repression in a
country’s financial system. My dataset contains 2605 observations with minimum and maximum
values of -21 and 0 respectively. The mean and standard deviation for this particular index are -10.28
and 6.326 respectively.
State Ownership of Banking System – This variable complements the financial repression index
as a barometer of the amount of control exerted by governments on the banking channel. There are
2605 observations in my dataset with values ranging from a minimum of -3 to a maximum of 0
(higher values indicate greater degree of banking system by the government). Mean and standard
deviation for this particular index are -1.240 and 1.178 respectively. This will also serve as a control
in the regression model.
Trade (% of GDP) – Trade as a percentage of gross domestic product serves as another control
covariate in my empirical model. There are a total of 2078 observations available for this particular
variable, and values range from a minimum of 6.32 per cent to a maximum of 428.45 per cent
(standard deviation = 34.48, mean = 61.38)
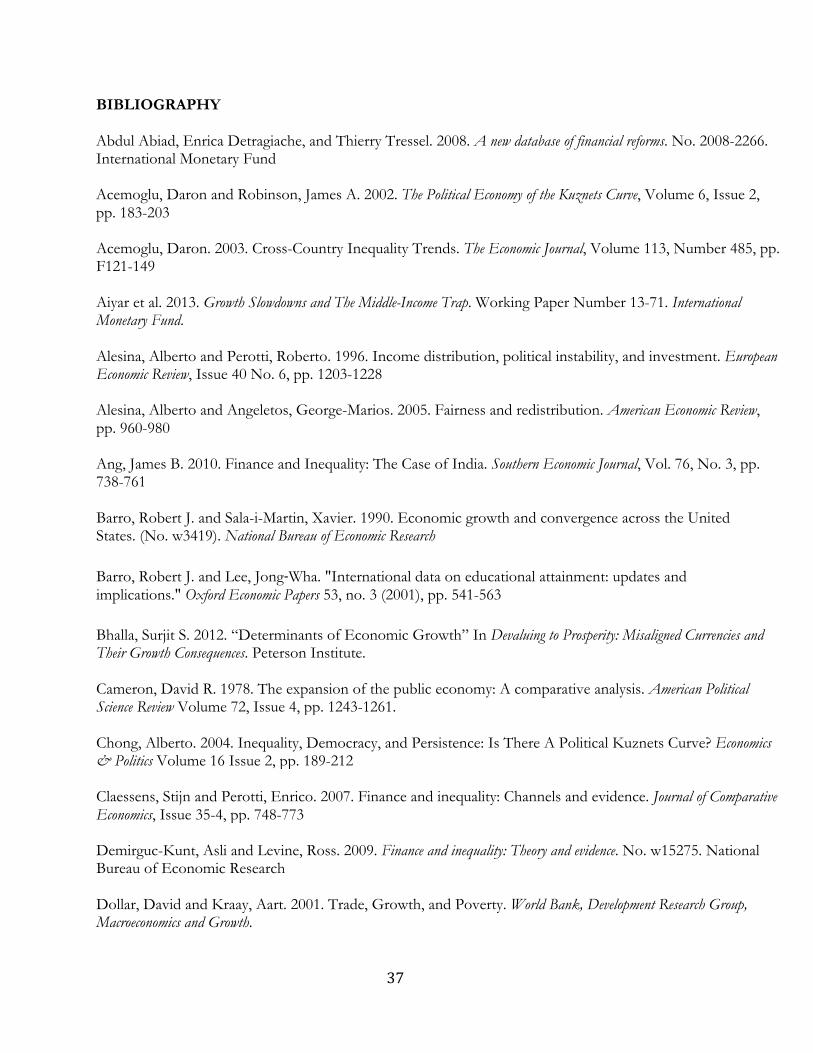
Education – I use education across countries as one of my control variables. As a proxy for
education levels, I am using the Barro-Lee dataset that provides information on average years of
18
total schooling (including all primary, secondary, and tertiary education) in countries. The
justification for using years of schooling rather than adult literacy rates (available from the World
Development Indicators database) is that years of education are a more reliable indicator of human
capital stock as compared with crude literacy measures (Barro & Lee, 2010). There are a total of
1898 observations for years of schooling in the dataset with a range between 0.023 and 13.09 years
(mean = 5.459 years, standard deviation = 3.12 years).
GDP per capita – Per capita GDP is also a control variable I use in my regression model to
account for the effect of development on a country’s income inequality. The data is available in
terms of constant US dollars (year = 2000) to control for inflation. There are a total of 2562
observations available in the dataset ranging from a minimum of US$ 102.29 to a maximum of US$
40,617.84, with a mean of US$ 6,890.52 and standard deviation equal to 8,873.39.
Country and Time Fixed Effects – To remove bias associated with time-invariant country
characteristics, I use indicator variables known as “fixed-effects” dummies. These dichotomous
variables help control for any country-level attributes (E.g. geographical location) that do not change
over time. Additionally, I include indicator variables representing all years for which there are
observations i.e. “time fixed effects”. This would let the model control for characteristics that
affected all countries in the same manner at a given point in time (E.g. international oil shocks and
financial crises).
ANALYSIS
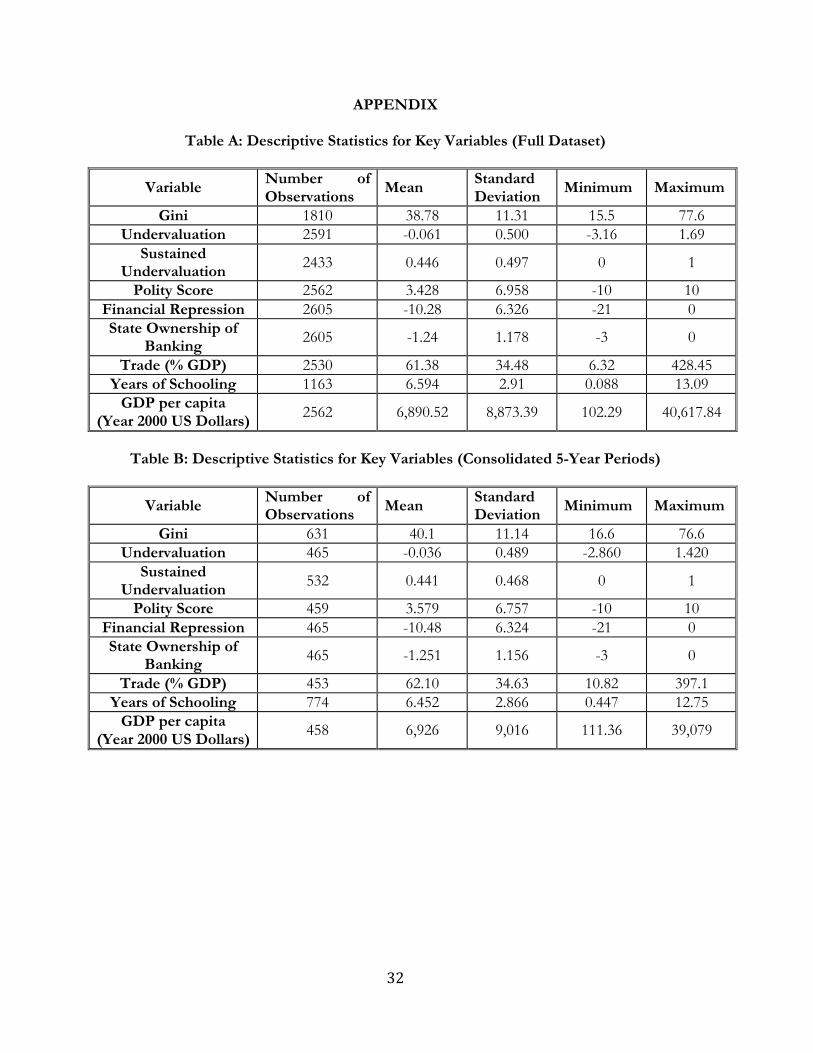
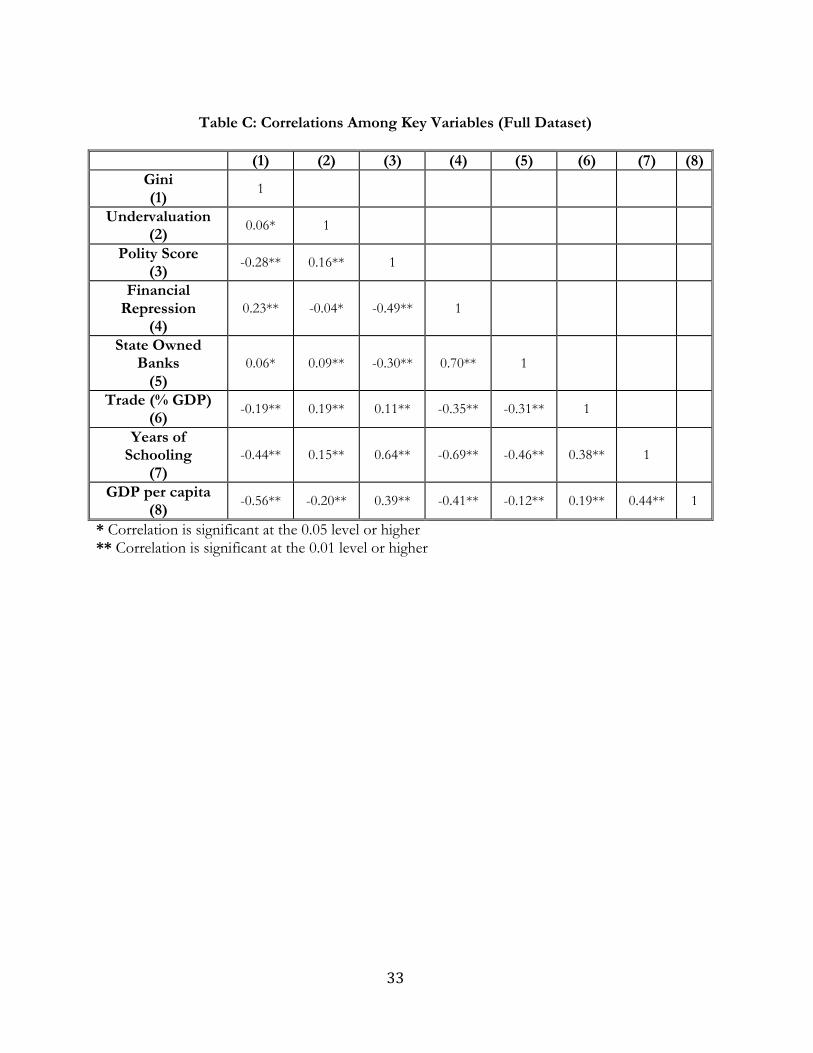
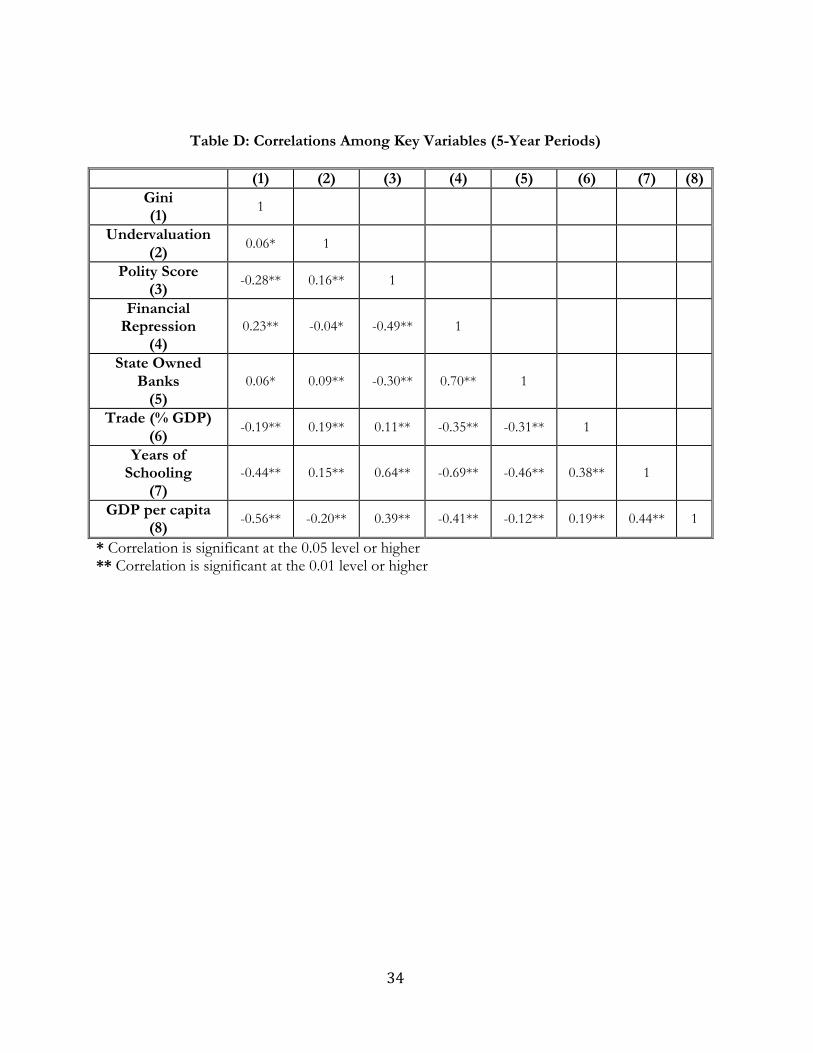
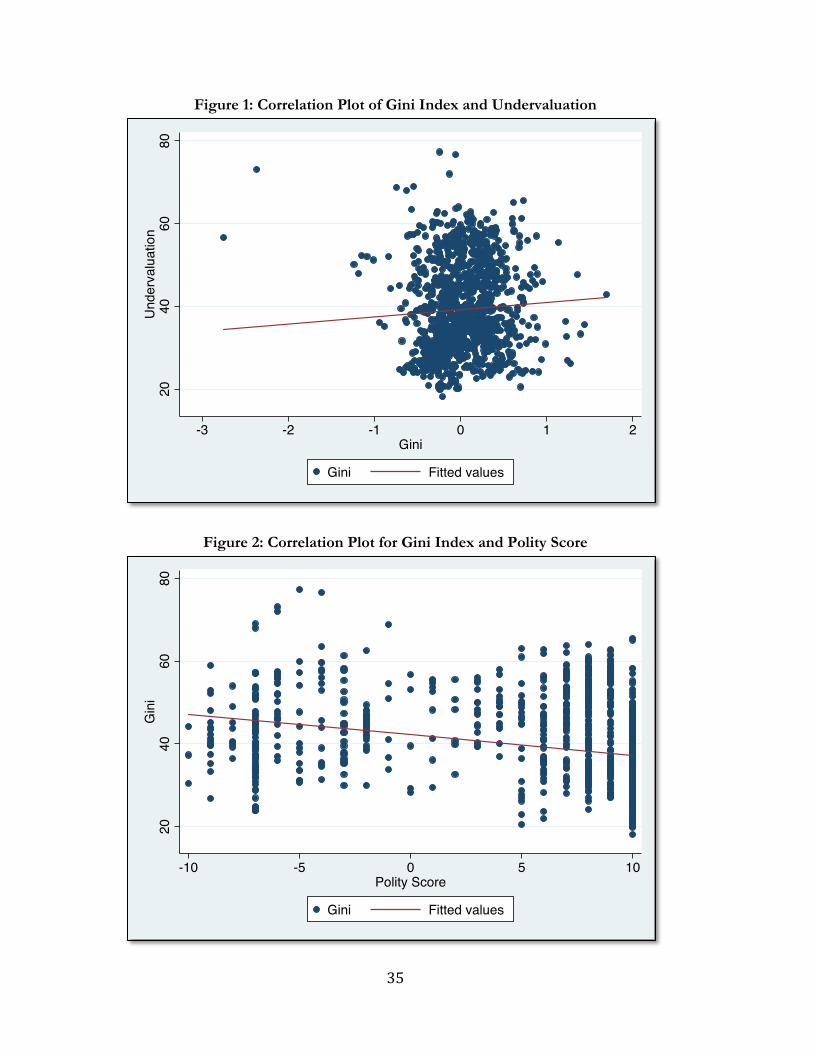
Tables A through D in the appendix present a snapshot of descriptive statistics described in the
previous section. I have also provided additional correlation plots between undervaluation and some
key variables from the empirical model. The statistically significant and positive correlation between
log (undervaluation) and Gini provides hints of the causal effect that I will be exploring fully in this
19
section of the paper. Of interest to the reader may also be some of the other correlations, including
a negative association between Gini and Polity scores, suggestive of a relationship between increased
representative rule and lesser inequality. The education variable is also negative correlated with
income inequality, indicating that more years of schooling could help ameliorate income disparities.
I began the empirical analysis of my research question by considering linear regression
results from a pooled cross-sectional model, wherein all country-year observations are assigned the
same predictive power. The model contains the Gini index as the dependent variable, and the
primary independent variable is a ‘sustained undervaluation’ indicator. This dichotomous variable is
set to one if the observation in question has an undervaluation index that is greater than zero, and is
also part of a consecutive three-year period where the country’s currency was undervalued. If either
of these conditions is not met, the sustained undervaluation indicator is set to zero. This particular
functional form of the undervaluation variable is intended to reduce “noise associated with one-time
depreciations linked to a currency crisis,”36 which may bias the estimated effect of undervaluation on
inequality. The cross-sectional model controls for other factors expected to impact income
inequality, namely democracy (represented by Polity score), financial repression, state ownership of
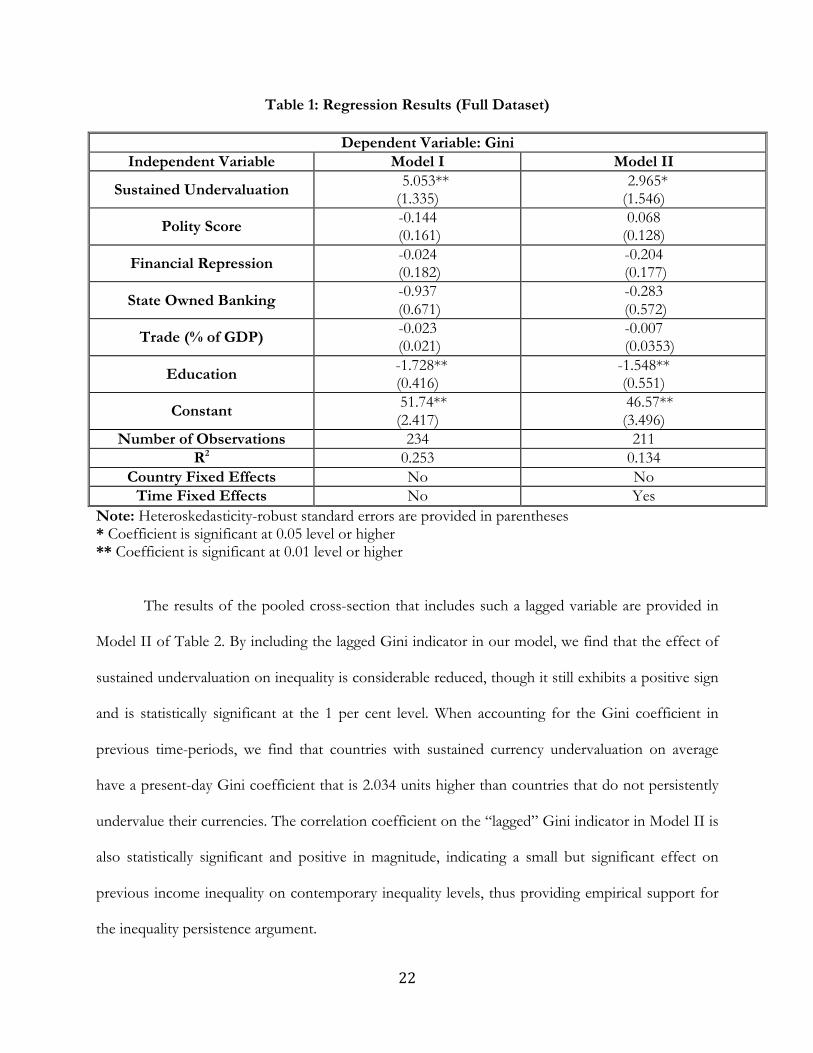
banking, trade, and education levels. The results of this pooled cross-sectional model, displayed
under the ‘Model I’ column of Table 1, show that sustained undervaluation has a statistically
significant effect on income inequality,37 and the coefficient’s positive sign and magnitude indicate
that there is a difference of 5.053 units in the Gini coefficient between countries that experienced
sustained undervaluation and those that did not undergo such undervaluation of their currency. In
other words, on average undervalued currencies are associated with increased income inequality, a
result that is consistent with my hypothesis. Additionally, of the other covariates included in this
model, we see that only education has a statistically significant impact on income inequality. The
standard errors calculated in this model also account for heteroskedasticity among the observations.
20
Although the standard errors may have been overestimated due to problems of autocorrelation,
various visual and statistical tests on the model’s residuals revealed that this is unlikely to be the case
with this particular cross-sectional model.38 This obviates the need for statistical techniques such as
the Newey-West39 estimator that are employed for obtaining more precise standard errors.
However, we cannot deduce a definitive causal effect of undervaluation on income inequality
based on a naïve pooled cross-sectional regression, since there could be other factors omitted from
this model that are associated with both inequality and undervaluation. If that were the case, the
aforementioned parameter estimate off sustained undervaluation on inequality would be biased in a
particular direction. To obtain a more accurate estimate on the undervaluation coefficient, we would
need to account for some, if not all, of the endogeneity. I attempt to accomplish this through a
model specification that includes country and time fixed effects. Prior to running the full fixed
regression, I was able to determine that the country fixed effects did not have a statistically
significant impact on the overall model through a Hausmann-Taylor test. Therefore, for my fixed
effects specification listed in Model II of Table 1, I have only included the time fixed effects in the
regression.
The results of this fixed effects specification demonstrate that sustained undervaluation leads
to an increase in income inequality, and that this effect is statistically significant.40 Specifically, the
model tells us that on average countries experiencing sustained undervaluation have a Gini index
that is 2.96 units higher than for nations that have not undergone such undervaluation. This is
consistent with my hypothesis linking currency undervaluation to increased inequality. Although the
magnitude of coefficients for the other covariates specification is different in the fixed effects
specification when compared to the pooled cross-sectional model, the sign and significance (or lack
thereof) for each of them are similar. This fixed effects specification does allow us to claim that
sustained undervaluation of currency leads to increased income inequality. A crucial assumption
21
underlying the assertion is that no other time-variant characteristics, affecting both undervaluation and
inequality, have been omitted from this model, lending support to my hypothesis.41
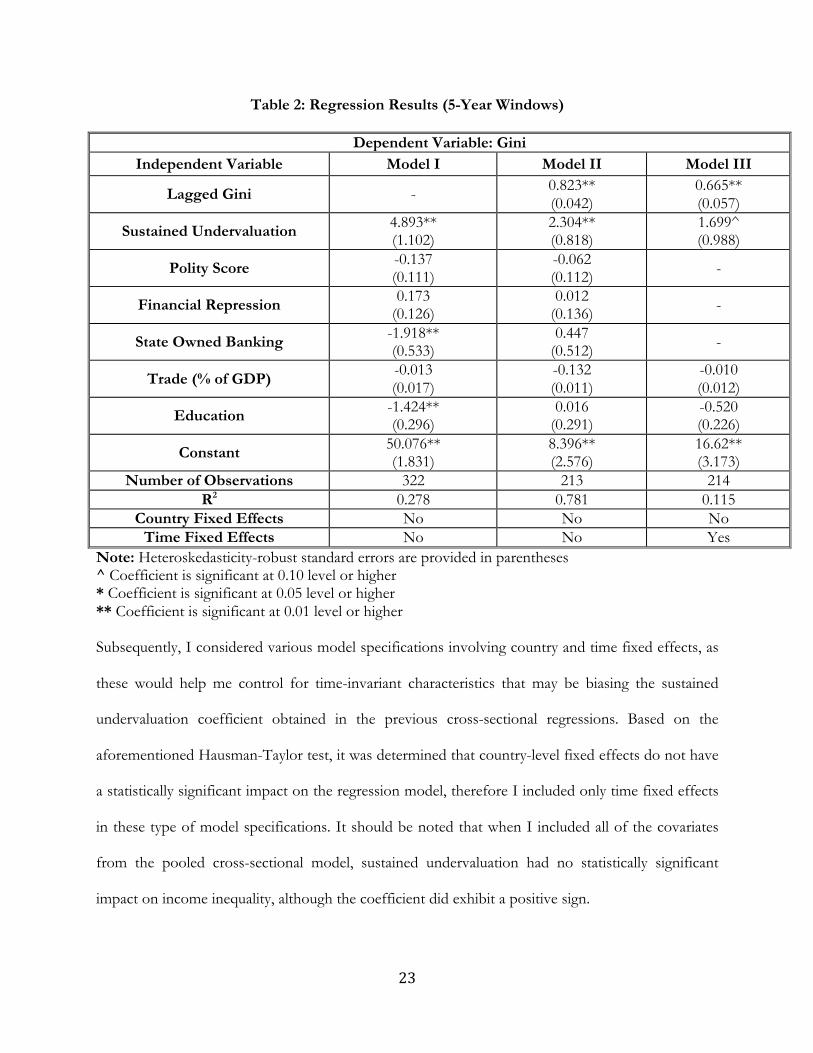
Following standard practice in country-level macroeconomic analysis, I collapsed the
individual country-year observations into 5-year periods between 1973 and 201042 for further
exploration of the link between undervaluation and inequality. As in the original dataset of annual
observations, I considered a pooled cross-sectional data model with Gini as the dependent variable,
sustained undervaluation (as defined previously) as the primary independent variable, and all of the
other controls that were also listed in Table 1. I provide the regression results with the collapsed 5-
year window observations in the Model I column of Table 2. As expected, sustained undervaluation
has a statistically significant impact on income inequality43 in the collapsed version of the dataset,
although the magnitude of this effect is less than was the case in the non-collapsed version from
Table 1. The results of this cross-sectional regression may be interpreted such that the Gini
coefficient for countries experiencing sustained undervaluation of the currency is 4.893 units higher
on average than in countries that did not undergo sustained devaluation. This bolsters the
relationship proposed in my research question.
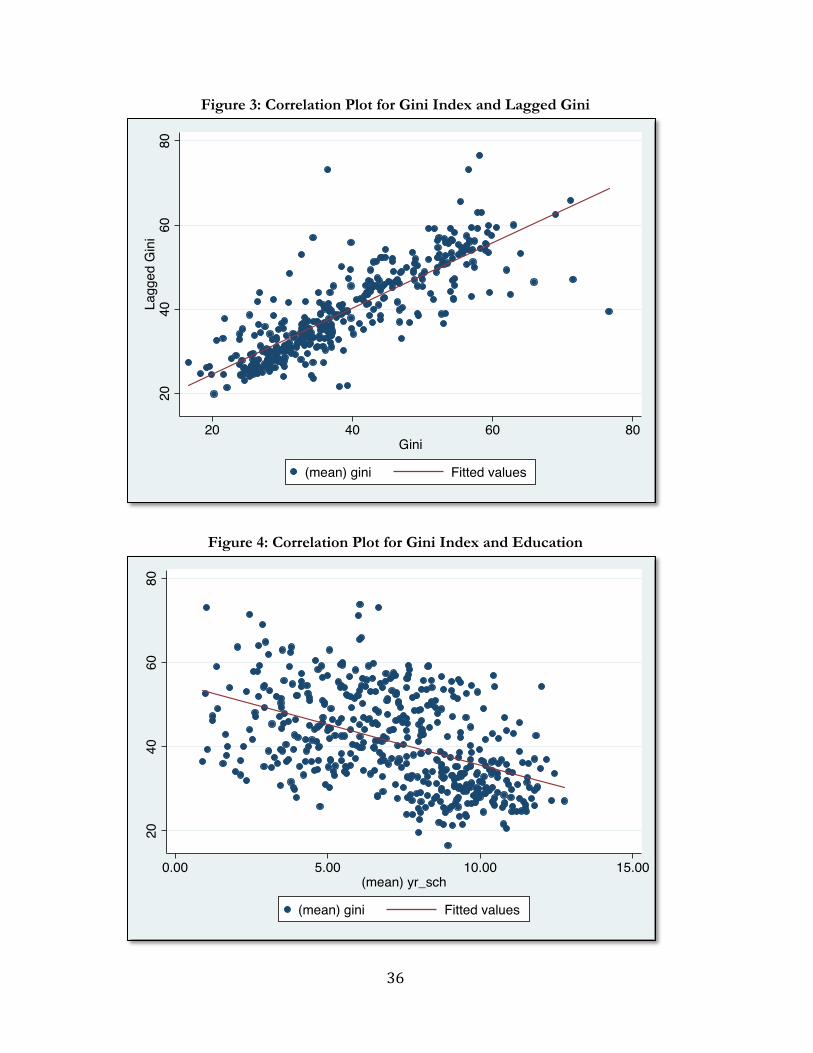
Additionally, I also examined results from a pooled cross-sectional model that contained a “lagged”
Gini indicator as an independent variable. The value of this “lagged” variable is the Gini index for a
country in the previous time period (in this case, the last 5-year window). The purpose of this
exercise is to ascertain any potential bias in the parameter estimate of sustained undervaluation in the
absence of lagged Gini, given support for the theory of persisting income inequality within the
literature.44
22
Table 1: Regression Results (Full Dataset)
Dependent Variable: Gini Independent Variable Model I Model II
Sustained Undervaluation 5.053** (1.335)
2.965* (1.546)
Polity Score -0.144 (0.161)
0.068 (0.128)
Financial Repression -0.024 (0.182)
-0.204 (0.177)
State Owned Banking -0.937 (0.671)
-0.283 (0.572)
Trade (% of GDP) -0.023 (0.021)
-0.007 (0.0353)
Education -1.728** (0.416)
-1.548** (0.551)
Constant 51.74** (2.417)
46.57** (3.496)
Number of Observations 234 211 R2 0.253 0.134
Country Fixed Effects No No Time Fixed Effects No Yes
Note: Heteroskedasticity-robust standard errors are provided in parentheses * Coefficient is significant at 0.05 level or higher ** Coefficient is significant at 0.01 level or higher
The results of the pooled cross-section that includes such a lagged variable are provided in
Model II of Table 2. By including the lagged Gini indicator in our model, we find that the effect of
sustained undervaluation on inequality is considerable reduced, though it still exhibits a positive sign
and is statistically significant at the 1 per cent level. When accounting for the Gini coefficient in
previous time-periods, we find that countries with sustained currency undervaluation on average
have a present-day Gini coefficient that is 2.034 units higher than countries that do not persistently
undervalue their currencies. The correlation coefficient on the “lagged” Gini indicator in Model II is
also statistically significant and positive in magnitude, indicating a small but significant effect on
previous income inequality on contemporary inequality levels, thus providing empirical support for
the inequality persistence argument.
23
Table 2: Regression Results (5-Year Windows)
Dependent Variable: Gini Independent Variable Model I Model II Model III
Lagged Gini - 0.823** (0.042)
0.665** (0.057)
Sustained Undervaluation 4.893** (1.102)
2.304** (0.818)
1.699^ (0.988)
Polity Score -0.137 (0.111)
-0.062 (0.112) -
Financial Repression 0.173 (0.126)
0.012 (0.136) -
State Owned Banking -1.918** (0.533)
0.447 (0.512) -
Trade (% of GDP) -0.013 (0.017)
-0.132 (0.011)
-0.010 (0.012)
Education -1.424** (0.296)
0.016 (0.291)
-0.520 (0.226)
Constant 50.076** (1.831)
8.396** (2.576)
16.62** (3.173)
Number of Observations 322 213 214 R2 0.278 0.781 0.115
Country Fixed Effects No No No Time Fixed Effects No No Yes
Note: Heteroskedasticity-robust standard errors are provided in parentheses ^ Coefficient is significant at 0.10 level or higher * Coefficient is significant at 0.05 level or higher ** Coefficient is significant at 0.01 level or higher Subsequently, I considered various model specifications involving country and time fixed effects, as
these would help me control for time-invariant characteristics that may be biasing the sustained
undervaluation coefficient obtained in the previous cross-sectional regressions. Based on the
aforementioned Hausman-Taylor test, it was determined that country-level fixed effects do not have
a statistically significant impact on the regression model, therefore I included only time fixed effects
in these type of model specifications. It should be noted that when I included all of the covariates
from the pooled cross-sectional model, sustained undervaluation had no statistically significant
impact on income inequality, although the coefficient did exhibit a positive sign.
24
I proceeded with the analysis by omitting selected variables from the list of controls that
were used in the cross-sectional models. Results of a fixed effects specification have been published
in Model III of Table 2, where the correlation coefficient on sustained undervaluation is positive and
statistically significant at the 0.10 levels,45 indicating that countries with sustained undervaluation
experience a Gini coefficient that is on average 1.699 units higher than those without undervalued
currencies. However, this association is not robust to the inclusion of indicators on democracy
(Polity score), financial repression, and state ownership of the banking system, since those controls
have been omitted from this particular specification. The results in Model III of Table 2 indicate
that the causal effect of undervaluation on inequality may not be as unambiguous as previously
asserted. More robust econometric models are required for obtaining confirmation of a statistically
significant relationship effect of undervaluation on income inequality.
An Arellano-Bond 46 dynamic panel system GMM estimator is useful for researchers
confronted with issues related to panel data analysis, 47 namely endogenous error terms,
autocorrelation, heteroskedasticity, and ambiguity on the direction of causality. This technique may
also be useful for our purposes as the number of time slices in my panel dataset is considerably
smaller than the number of countries.
I evaluated three distinct models using this type of estimator, and the regression results are
available in Table 3. As with earlier models, all three specifications consist of Gini index as the
dependent variable and sustained undervaluation as the primary independent variable. Model I,
however, omits the “lagged” Gini index as a control variable, whereas Model II includes it in the list
of covariates. For Models I and II, the sustained undervaluation coefficient is significant at the 0.05
and 0.1 levels respectively.48 The magnitude of the effect on income inequality is reduced if the
model accounts for “lagged” Gini, consistent with the earlier specifications. It is noteworthy that the
statistically significant correlation between sustained undervaluation and inequality in the dynamic
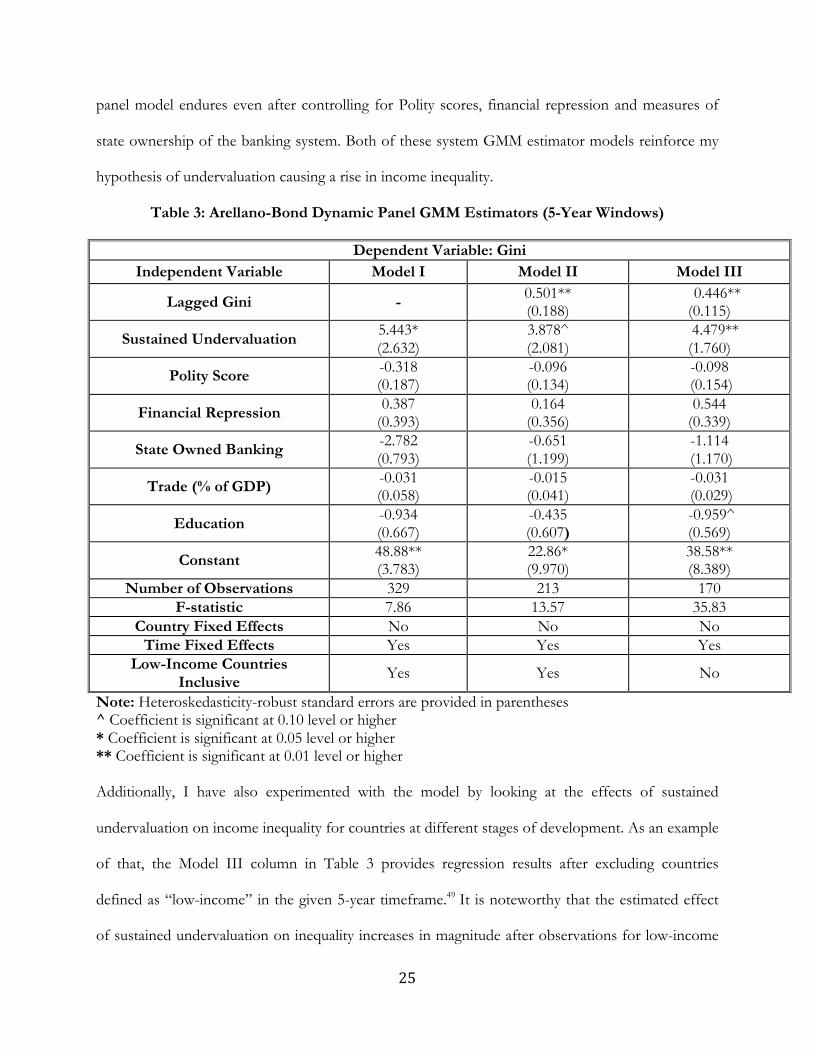
25
panel model endures even after controlling for Polity scores, financial repression and measures of
state ownership of the banking system. Both of these system GMM estimator models reinforce my
hypothesis of undervaluation causing a rise in income inequality.
Table 3: Arellano-Bond Dynamic Panel GMM Estimators (5-Year Windows)
Dependent Variable: Gini Independent Variable Model I Model II Model III
Lagged Gini - 0.501** (0.188)
0.446** (0.115)
Sustained Undervaluation 5.443* (2.632)
3.878^ (2.081)
4.479** (1.760)
Polity Score -0.318 (0.187)
-0.096 (0.134)
-0.098 (0.154)
Financial Repression 0.387 (0.393)
0.164 (0.356)
0.544 (0.339)
State Owned Banking -2.782 (0.793)
-0.651 (1.199)
-1.114 (1.170)
Trade (% of GDP) -0.031 (0.058)
-0.015 (0.041)
-0.031 (0.029)
Education -0.934 (0.667)
-0.435 (0.607)
-0.959^ (0.569)
Constant 48.88** (3.783)
22.86* (9.970)
38.58** (8.389)
Number of Observations 329 213 170 F-statistic 7.86 13.57 35.83
Country Fixed Effects No No No Time Fixed Effects Yes Yes Yes
Low-Income Countries Inclusive Yes Yes No
Note: Heteroskedasticity-robust standard errors are provided in parentheses ^ Coefficient is significant at 0.10 level or higher * Coefficient is significant at 0.05 level or higher ** Coefficient is significant at 0.01 level or higher Additionally, I have also experimented with the model by looking at the effects of sustained
undervaluation on income inequality for countries at different stages of development. As an example
of that, the Model III column in Table 3 provides regression results after excluding countries
defined as “low-income” in the given 5-year timeframe.49 It is noteworthy that the estimated effect
of sustained undervaluation on inequality increases in magnitude after observations for low-income
26
countries are removed. Moreover, the statistical significance of this correlation is greater in Model
III as compared to Model II.50 This is suggestive of the relationship being stronger for countries that
are in the middle-income or upper-income groups, lending support to a non-linear relationship
involving income, undervaluation, and income distribution.
To summarize, my empirical analysis using cross-country datasets appears to confirm the
hypothesis that exchange rate undervaluation leads to a rise in income inequality levels. The results
are consistent with various regression specifications, including pooled cross-sectional data, panel
data with time fixed effects and system GMM estimators. The relationship is also robust to the
inclusion of other control variables, including “lagged” Gini coefficients, democracy indicators,
financial repression, government control of banking, trade, and education levels.
POLICY IMPLICATIONS
A development strategy built around currency devaluation and manufacturing exports holds obvious
appeal for low and middle-income countries, where governments are looking for ways to boost their
populations’ living standards. The relationship between undervaluation and increased income
inequality that has been explored in this paper, however, ought to give pause to public policy
practitioners chasing the prospect of rapid growth by employing depreciation as a tool of industrial
policy. A direct consequence of such an approach to development is an excessively powerful
exporting sector that tends to profit disproportionately, with the rest of the economy lagging behind.
The implications of my argument linking undervaluation with income inequality depend on
how political systems and social institutions respond to the specter of widening inequality. Based on
their cross-country research, Alesina and Perotti (1996) concluded that rising inequality contributes
to “increased socio-political instability which in turn decreases investment.”51 Others authors such as
Glaeser (2005) have argued that unequal societies have governments that do not behave in a
27
democratic manner,52 or may not respect property rights that are the basis of modern capitalist
societies. Alesina and Angeletos (2005), in their research on redistribution policies in Western
Europe and the United States, have claimed that higher levels of income inequality adversely affect
perceptions of fairness.53 In highly unequal societies where people do not believe that income is
mainly the result of individual initiative, but rather is dependent on elements of luck, bribery or
familial connections, there will likely be a clamor for higher taxes, leading to higher deadweight
losses and a reduction in economic well being. Meanwhile, Stiglitz (2012) points out that higher
inequality reduces investments in human capital development, thereby affecting economic growth
prospects.54
There has also been extensive research regarding the long-term effects of inequality on the
development process. In an analysis of factor endowments in the development process, Sokoloff
and Engerman (2000) stressed the role of inequality levels in shaping long-run prosperity.55 Support
for this hypothesis has been provided by Easterly (2007), where the author emphasizes the
relationship between inequality and heightened barriers to educational attainment, institutional
development, and shared economic prosperity.56
The above discussion hints at a tradeoff wherein currency undervaluation leads to increased
growth in the short run, but the resulting rise in inequality may generate instability in the long term,
perhaps accompanied by stunted economic development. Faced with this tradeoff, one might expect
that governments in countries following this particular development model would step in with
redistributive measures to ameliorate widening income disparities.
However, an important piece of research suggests that the incentives for governments,
particularly in authoritarian systems, may not lie in that direction. Freeman and Quinn (2012)
unearthed evidence linking political transitions to integration with global financial markets, asserting
that nations with autocratic governments, high inequality, and assimilated financial systems were
28
more likely to transition into democracy.57 Given that sustained currency undervaluation is typically a
feature of authoritarian regimes,58 this raises the question of which interest groups benefit the most
from democratization, and whether opening up of the political system is actually a way of
entrenching power and influence for political elites and their allies in the business community. A
perfunctory analysis of democratic transformations in recent decades, such as those in Taiwan and
South Korea, reveal some recognizable patterns. Changes in the political institution within these
countries were preceded by an extended period of export-led economic growth that boosted the
fortunes of firms closely allied with national governments (E.g. Korean chaebol conglomerates).
Notwithstanding the opening up of domestic financial markets and establishment of property rights,
and gradual dismantling of political controls, government and business elites have managed to retain
a preeminent position within the political economy. Given these similarities and the empirical
evidence unearthed in this paper, a question that should be asked by policymakers is whether
currency undervaluation strategies are the best route to rapid growth for underdeveloped markets, or
whether implicit subsidy to a sector of the economy is setting the stage for the entrenchment of the
dictatorial regime, with the assumed gains accruing at the expense of the general welfare of the
public? The rise in income inequality adversely affects economic and political stability, and impedes
human development in the long term.
1 Williamson, John. 1990. “What Washington Means by Policy Reform”. Chapter 2. Latin American Adjustment: How Much Has Happened? 2 Acemoglu, Daron. 2003. Cross-Country Inequality Trends. The Economic Journal, Volume 113, Number 485, pp. F121-149 3 Freeman, John R. & Quinn, Dennis P. 2012. Economic Origins of Democracy Reconsidered. American Political Science Review, pp. 58-80 4 Kuznets, Simon. 1955. Economic Growth and Income Inequality. American Economic Review, Volume 45, Number 1, p. 18. 5 Kuznets, Simon. 1955. Economic Growth and Income Inequality. American Economic Review, Volume 45, Number 1, p.17 6 Kuznets, Simon. 1955. Economic Growth and Income Inequality. American Economic Review, Volume 45, Number 1, p.17
29
7 Kuznets, Simon. 1955. Economic Growth and Income Inequality. American Economic Review, Volume 45, Number 1, p. 19 8 Joseph E. Stiglitz. 2012. Macroeconomic Fluctuations, Inequality, and Human Development. Journal of Human Development and Capabilities: A Multi-Disciplinary Journal for People-Centered Development, Volume 13, Issue 1, p. 35 9 Joseph E. Stiglitz. 2012. Macroeconomic Fluctuations, Inequality, and Human Development. Journal of Human Development and Capabilities: A Multi-Disciplinary Journal for People-Centered Development, Volume 13, Issue 1, p. 35 10 Dollar, David and Kraay, Aart. 2002. Growth is Good for the Poor. Journal of economic growth, Volume 7, Number 3, p. 198 11 Richardson, J. David. 1995. Income inequality and trade: how to think, what to conclude. The Journal of Economic Perspectives Volume 9, Number 3, p. 51 12 Edwards, Sebastian. 1997. Trade policy, growth, and income distribution. The American Economic Review Volume 87, Issue 2, p. 209 13 Edwards, Sebastian. 1997. Trade policy, growth, and income distribution. The American Economic Review Volume 87, Issue 2, p. 209 14 Cameron, David R. 1978. The expansion of the public economy: A comparative analysis. American Political Science Review Volume 72, Issue 4, p. 1250 15 Steinberg, David A. 2011. The Conditional Effects of Interest Groups on Undervalued Exchange Rates. International Political Economy Society Annual Conference 2011, p. 14 16 Hipolit, J. Andrew. 2013. Real Exchange Rates, Financial Repression, and Regime Type - A Political Economy Analysis of Real Exchange Rate Undervaluation. Georgetown University Institutional Repository 17 Solow, Robert. 1957. Technical Change and the Aggregate Production Function. The Review of Economics and Statistics Vol. 39-3, pp. 312-320 18 Swan, Trevor W. 1956. Economic growth and capital accumulation. 1956. Economic Record Vol. 32.2, pp. 334-361 19 Bhalla, Surjit S. 2012. “Determinants of Economic Growth” In Devaluing to Prosperity: Misaligned Currencies and Their Growth Consequences, p. 13. Peterson Institute. 20 Barro, Robert J., & Sala-i-Martin, Xavier. 1990. “Economic growth and convergence across the United States” (No. w3419). National Bureau of Economic Research 21 Bhalla, Surjit S. 2012. “Determinants of Economic Growth” In Devaluing to Prosperity: Misaligned Currencies and Their Growth Consequences, pp. 25-26. Peterson Institute 22 Aiyar, Shekhar, et al. 2013. Growth Slowdowns and The Middle-Income Trap. Working Paper Number 13-71. International Monetary Fund. 23 Johnson, Chalmers. 1982. MITI and the Japanese miracle: the growth of industrial policy: 1925-1975. Stanford University Press 24 Friedman, Milton. 1953. “The Case for Flexible Exchange Rates” In Essays In Positive Economics, p. 165. Publisher: University of Chicago Press 25 Eichengreen, Barry and Temin, Peter. 2010. "Fetters of Gold and Paper." Oxford Review of Economic Policy Volume 26 Issue 3, pp. 370-384 26 Bhalla, Surjit S. 2012. “Determinants of Economic Growth” In Devaluing to Prosperity: Misaligned Currencies and Their Growth Consequences, p. 23. Peterson Institute. 27 Bhalla, Surjit S. 2012. “Determinants of Economic Growth” In Devaluing to Prosperity: Misaligned Currencies and Their Growth Consequences, p. 23. Peterson Institute.
30
28 Rodrik, Dani. 2008. The Real Exchange Rate and Economic Growth. Brookings Papers on Economic Activity, pp. 365-412. 29 Mitchell, Donald. 2008. A note on rising food prices. World Bank Policy Research, Working Paper 4682 30 Ivanic, Maros & Martin, Will. 2008. Implications of higher global food prices for poverty in low‐income countries. Agricultural economics, 39 No. s1, pp. 405-416 31 Hipolit, J. Andrew. 2013. Real Exchange Rates, Financial Repression, and Regime Type - A Political Economy Analysis of Real Exchange Rate Undervaluation. Georgetown University Institutional Repository. 32 Claessens, Stijn & Perotti, Enrico. 2007. Finance and inequality: Channels and evidence. Journal of Comparative Economics, Issue 35-4, pp. 748-773 33 Hipolit, J. Andrew. 2013. Real Exchange Rates, Financial Repression, and Regime Type - A Political Economy Analysis of Real Exchange Rate Undervaluation. Georgetown University Institutional Repository. 34 Demirguc-Kunt, Asli, and Ross Levine. 2009. Finance and Inequality: Theory and Evidence. No. w15275, National Bureau of Economic Research 35 Hipolit, J. Andrew. 2013. Real Exchange Rates, Financial Repression, and Regime Type - A Political Economy Analysis of Real Exchange Rate Undervaluation. Georgetown University Institutional Repository, p. 14 36 Hipolit, J. Andrew. 2013. Real Exchange Rates, Financial Repression, and Regime Types: A Political Economy Analysis of Real Exchange Rate Undervaluation. Georgetown University Institutional Repository, p. 14 37 Coefficient on sustained undervaluation has p-value < 0.001 38 Plotting the residuals over time did not expose patterns of autocorrelation. The Pearson’s R coefficient between the residuals and lagged residuals is a small negative value that is not statistically significant at the 90 per cent level. 39 StataCorp LP. “newey – Regression with Newey-West Standard Errors.” Stata.com. http://www.stata.com/manuals13/tsnewey.pdf (accessed April 4, 2014) 40 The p-value for sustained undervaluation when including time fixed effects is just above 0.055, demonstrating the coefficient’s significance at the near 95 per cent level. 41 Note that running a similar specification that included both country and time fixed effects yielded the exact coefficients and standard errors as noted in Model II. I have chosen not to publish those results to avoid redundancy. 42 In the collapsed version of the dataset, there are a total of eight 5-year windows. The first window is for observations between the years of 1973 and 1975; the second one is for rows between 1976 and 1980, and so on, until the final 5-year window for observations between 2006 and 2010. 43 The coefficient on sustained undervaluation has a p-value of less than 0.001. 44 Chong, Alberto. 2004. Inequality, Democracy, and Persistence: Is There A Political Kuznets Curve? Economics & Politics Volume 16 Issue 2, pp. 189-212 45 Coefficient for sustained undervaluation has p-value equal to 0.086. 46 Roodman, D. 2006. How to do xtabond2: an introduction to “Difference” and “System” GMM in Stata. Center for Global Development Working Paper Number 103. 47 Mileva, Elitza. “Using Arellano – Bond Dynamic Panel GMM Estimators in Stata”. Fordham University, Department of Economics. http://www.fordham.edu/economics/mcleod/Elitz-UsingArellano%E2%80%93BondGMMEstimators.pdf (accessed April 5, 2014)
31
48 The p-values for sustained undervaluation parameter estimate in Model I and Model II are 0.039 and 0.064 respectively 49 I define a country as “low-income” if the per-capita income does not exceed an average of $1,000 in a five-year period (amounts calculated in US dollars for the year 2000) 50 The p-value for the sustained undervaluation parameter estimate increases from 0.064 in Model II to 0.012 in Model III. 51 Alesina, Alberto & Perotti, Roberto. (1996). Income distribution, political instability, and investment. European Economic Review, Issue 40 No. 6, pp. 1203-1228 52 Glaeser, Edward L. 2005. Inequality. Working Paper 11511. National Bureau of Economic Research 53 Alesina, Alberto and Angeletos, George-Marios. 2005. Fairness and Redistribution. American Economic Review, pp. 960-980. 54 Stiglitz, Joseph E. 2012. Macroeconomic Fluctuations, Inequality, and Human Development. Journal of Human Development and Capabilities: A Multi-Disciplinary Journal for People-Centered Development, Volume 13, Issue 1, p. 35 55 Sokoloff, Kenneth L. and Engerman, Stanley L. 2000. Institutions, Factor Endowments, and Paths of Development in the New World. Journal of Economic Perspectives, Volume 14, Number 3, pp. 217–232
56 Easterly, William. 2007. Inequality Does Cause Underdevelopment. Journal of Development Economics, Volume 84, Number 2, pp. 755-776 57 Freeman, John R. and Quinn, Dennis P. 2012. The Economic Origins of Democracy Reconsidered. American Political Science Review, Volume 1, Issue 106, pp. 58-80 58 Hipolit, J. Andrew. 2013. Real Exchange Rates, Financial Repression, and Regime Type - A Political Economy Analysis of Real Exchange Rate Undervaluation. Georgetown University Institutional Repository.
32
APPENDIX
Table A: Descriptive Statistics for Key Variables (Full Dataset)
Variable Number of Observations Mean Standard
Deviation Minimum Maximum
Gini 1810 38.78 11.31 15.5 77.6 Undervaluation 2591 -0.061 0.500 -3.16 1.69
Sustained Undervaluation 2433 0.446 0.497 0 1
Polity Score 2562 3.428 6.958 -10 10 Financial Repression 2605 -10.28 6.326 -21 0 State Ownership of
Banking 2605 -1.24 1.178 -3 0
Trade (% GDP) 2530 61.38 34.48 6.32 428.45 Years of Schooling 1163 6.594 2.91 0.088 13.09
GDP per capita (Year 2000 US Dollars) 2562 6,890.52 8,873.39 102.29 40,617.84
Table B: Descriptive Statistics for Key Variables (Consolidated 5-Year Periods)
Variable Number of Observations Mean Standard
Deviation Minimum Maximum
Gini 631 40.1 11.14 16.6 76.6 Undervaluation 465 -0.036 0.489 -2.860 1.420
Sustained Undervaluation 532 0.441 0.468 0 1
Polity Score 459 3.579 6.757 -10 10 Financial Repression 465 -10.48 6.324 -21 0 State Ownership of
Banking 465 -1.251 1.156 -3 0
Trade (% GDP) 453 62.10 34.63 10.82 397.1 Years of Schooling 774 6.452 2.866 0.447 12.75
GDP per capita (Year 2000 US Dollars) 458 6,926 9,016 111.36 39,079
33
Table C: Correlations Among Key Variables (Full Dataset)
(1) (2) (3) (4) (5) (6) (7) (8)
Gini (1)
1
Undervaluation (2)
0.06* 1
Polity Score (3)
-0.28** 0.16** 1
Financial Repression
(4) 0.23** -0.04* -0.49** 1
State Owned Banks
(5) 0.06* 0.09** -0.30** 0.70** 1
Trade (% GDP) (6)
-0.19** 0.19** 0.11** -0.35** -0.31** 1
Years of Schooling
(7) -0.44** 0.15** 0.64** -0.69** -0.46** 0.38** 1
GDP per capita (8)
-0.56** -0.20** 0.39** -0.41** -0.12** 0.19** 0.44** 1
* Correlation is significant at the 0.05 level or higher ** Correlation is significant at the 0.01 level or higher
34
Table D: Correlations Among Key Variables (5-Year Periods)
(1) (2) (3) (4) (5) (6) (7) (8) Gini (1)
1
Undervaluation (2)
0.06* 1
Polity Score (3)
-0.28** 0.16** 1
Financial Repression
(4) 0.23** -0.04* -0.49** 1
State Owned Banks
(5) 0.06* 0.09** -0.30** 0.70** 1
Trade (% GDP) (6)
-0.19** 0.19** 0.11** -0.35** -0.31** 1
Years of Schooling
(7) -0.44** 0.15** 0.64** -0.69** -0.46** 0.38** 1
GDP per capita (8)
-0.56** -0.20** 0.39** -0.41** -0.12** 0.19** 0.44** 1
* Correlation is significant at the 0.05 level or higher ** Correlation is significant at the 0.01 level or higher
35
Figure 1: Correlation Plot of Gini Index and Undervaluation
Figure 2: Correlation Plot for Gini Index and Polity Score
2040
6080
Und
erva
luat
ion
-3 -2 -1 0 1 2Gini
Gini Fitted values
2040
6080
Gin
i
-10 -5 0 5 10Polity Score
Gini Fitted values
36
Figure 3: Correlation Plot for Gini Index and Lagged Gini
Figure 4: Correlation Plot for Gini Index and Education
2040
6080
Lagg
ed G
ini
20 40 60 80Gini
(mean) gini Fitted values
2040
6080
0.00 5.00 10.00 15.00(mean) yr_sch
(mean) gini Fitted values
37
BIBLIOGRAPHY Abdul Abiad, Enrica Detragiache, and Thierry Tressel. 2008. A new database of financial reforms. No. 2008-2266. International Monetary Fund
Acemoglu, Daron and Robinson, James A. 2002. The Political Economy of the Kuznets Curve, Volume 6, Issue 2, pp. 183-203
Acemoglu, Daron. 2003. Cross-Country Inequality Trends. The Economic Journal, Volume 113, Number 485, pp. F121-149 Aiyar et al. 2013. Growth Slowdowns and The Middle-Income Trap. Working Paper Number 13-71. International Monetary Fund. Alesina, Alberto and Perotti, Roberto. 1996. Income distribution, political instability, and investment. European Economic Review, Issue 40 No. 6, pp. 1203-1228 Alesina, Alberto and Angeletos, George-Marios. 2005. Fairness and redistribution. American Economic Review, pp. 960-980 Ang, James B. 2010. Finance and Inequality: The Case of India. Southern Economic Journal, Vol. 76, No. 3, pp. 738-761 Barro, Robert J. and Sala-i-Martin, Xavier. 1990. Economic growth and convergence across the United States. (No. w3419). National Bureau of Economic Research Barro, Robert J. and Lee, Jong‐Wha. "International data on educational attainment: updates and implications." Oxford Economic Papers 53, no. 3 (2001), pp. 541-563 Bhalla, Surjit S. 2012. “Determinants of Economic Growth” In Devaluing to Prosperity: Misaligned Currencies and Their Growth Consequences. Peterson Institute. Cameron, David R. 1978. The expansion of the public economy: A comparative analysis. American Political Science Review Volume 72, Issue 4, pp. 1243-1261. Chong, Alberto. 2004. Inequality, Democracy, and Persistence: Is There A Political Kuznets Curve? Economics & Politics Volume 16 Issue 2, pp. 189-212 Claessens, Stijn and Perotti, Enrico. 2007. Finance and inequality: Channels and evidence. Journal of Comparative Economics, Issue 35-4, pp. 748-773 Demirguc-Kunt, Asli and Levine, Ross. 2009. Finance and inequality: Theory and evidence. No. w15275. National Bureau of Economic Research Dollar, David and Kraay, Aart. 2001. Trade, Growth, and Poverty. World Bank, Development Research Group, Macroeconomics and Growth.
38
Dollar, David and Kraay, Aart. 2002. Growth is Good for the Poor. Journal of economic growth, Volume 7, Number 3, pp. 195-225. Easterly, William. 2007. Inequality Does Cause Underdevelopment. Journal of Development Economics, Volume 84, Number 2, pp. 755-776 Edwards, Sebastian. 1997. Trade policy, growth, and income distribution. The American Economic Review Volume 87, Issue 2, pp. 205-210. Eichengreen, Barry and Temin, Peter. 2010. "Fetters of Gold and Paper." Oxford Review of Economic Policy Volume 26 Issue 3, pp. 370-384 Freeman, John R. and Quinn, Dennis P. 2012. The Economic Origins of Democracy Reconsidered. American Political Science Review, Volume 106, Issue 1, pp. 58-80. Friedman, Milton. 1953. “The Case for Flexible Exchange Rates” In Essays In Positive Economics, p. 165. Publisher: University of Chicago Press Furlan, Benjamin, Martin Gächter, Bob Krebs, and Harald Oberhofer. 2012. Democratization and Real Exchange Rates. University of Salzburg Economics & Finance Working Paper No. 2012-06 Glaeser, Edward L. 2005. Inequality. Working Paper 11511. National Bureau of Economic Research Hipolit, J. Andrew. 2013. Real Exchange Rates, Financial Repression, and Regime Type - A Political Economy Analysis of Real Exchange Rate Undervaluation. Georgetown University Institutional Repository. Ivanic, Maros and Martin, Will. 2008. Implications of higher global food prices for poverty in low‐income countries. Agricultural Economics, 39 No. s1, pp. 405-416 Johnson, Chalmers. 1982. MITI and the Japanese miracle: the growth of industrial policy: 1925-1975. Stanford University Press Kuznets, Simon. 1955. Economic Growth and Income Inequality. American Economic Review, Volume 45, Number 1, pp. 1-28. Milanovic, Branko and Squire, Lyn. 2005. Does tariff liberalization increase wage inequality? Some empirical evidence. National Bureau of Economic Research, Number w11046 Mileva, Elitza. “Using Arellano – Bond Dynamic Panel GMM Estimators in Stata”. Fordham University, Department of Economics. http://www.fordham.edu/economics/mcleod/Elitz-UsingArellano%E2%80%93BondGMMEstimators.pdf (accessed April 5, 2014) Mitchell, Donald. 2008. A note on rising food prices. World Bank Policy Research, Working Paper 4682 Piketty, Thomas and Saez, Emmanuel. "Income inequality in the United States, 1913–1998." The Quarterly Journal of Economics 118, no. 1 (2003), pp. 1-41.
39
Richardson, J. David. 1995. Income inequality and trade: how to think, what to conclude. The Journal of Economic Perspectives, Volume 9, Number 3, pp. 33-55. Rodrik, Dani. 2008. The Real Exchange Rate and Economic Growth. Brookings Papers on Economic Activity. Volume 2008, Issue 2, pp. 365 – 412 Roodman, David. 2006. How to do xtabond2: an introduction to “Difference” and “System” GMM in Stata. Center for Global Development. Working Paper Number 103 Sokoloff, Kenneth L. and Engerman, Stanley L. 2000. Institutions, Factor Endowments, and Paths of Development in the New World. Journal of Economic Perspectives, Volume 14, Number 3, pp. 217–232 Solow, Robert. 1957. Technical Change and the Aggregate Production Function. The Review of Economics and Statistics Vol. 39-3, pp. 312-320 StataCorp LP. “newey – Regression with Newey-West Standard Errors.” Stata.com. http://www.stata.com/manuals13/tsnewey.pdf (accessed April 4, 2014) StataCorp LP. “Stata User's Guide - Release 13.” Stata.com. http://www.stata.com/manuals13/u.pdf (accessed April 14, 2014) Steinberg, David A. 2011. The Conditional Effect of Interest Groups on Undervalued Exchange Rates. In International Political Economy Society annual conference. Steinberg, David A. and Malhotra, Krishan. 2014 (Forthcoming). The Effect of Authoritarian Regime Type on Exchange Rate Policy. World Politics Volume 66, Issue 3 Stiglitz, Joseph E. 2012. Macroeconomic Fluctuations, Inequality, and Human Development. Journal of Human Development and Capabilities: A Multi-Disciplinary Journal for People-Centered Development, Volume 13, Issue 1, pp. 31-58 Swan, Trevor W. 1956. Economic growth and capital accumulation. 1956. Economic Record Vol. 32.2, pp. 334-361 Takatoshi Ito, Peter Isard, and Steven Symansky. 1999. "Economic growth and real exchange rate: an overview of the Balassa-Samuelson hypothesis in Asia." In Changes in Exchange Rates in Rapidly Developing Countries: Theory, Practice, and Policy Issues (NBER-EASE volume 7), pp. 109-132. University of Chicago Press. Topel, Robert H. 1997. Factor Proportions and Relative Wages: The Supply-Side Determinants of Wage Inequality. The Journal of Economic Perspectives, Volume 11, Number 2, pp. 55-74