Embed Size (px)
Citation preview
Thesis Proposal
Low-Cost Fine Particulate Monitors and
their Applications
Michael D. Taylor
Tuesday, November 10th, 2015
School of Computer ScienceCarnegie Mellon University
Pittsburgh, PA 15213
Thesis Committee:Illah R. Nourbakhsh, Aaron Steinfeld, Albert Presto, James Longhurst
Copyright c© 2015 Michael D. Taylor

Keywords: Low-cost sensing, PM2.5, calibration, air quality, fine particulate matter,sensor characterization, citizen science, building management, building automation
Abstract
Air quality has long been a major health concern for citizens around theworld, and increased levels of exposure to fine particulate matter (PM2.5) hasbeen definitively linked to serious health effects such as cardiovascular disease,respiratory illness, and increased mortality. PM2.5 is one of six attainmentcriteria pollutants used by the EPA, and is similarly regulated by many othergovernments worldwide. Unfortunately, the high cost and complexity of mostcurrent instruments results in a lack of detailed spatial and temporal resolution,which means that concerned individuals have little insight into their personalexposure levels. This is especially true regarding hyper-local variations andshort-term pollution events associated with industrial activity, heavy fossil fueluse, or indoor activity such as cooking.
Advances in sensor miniaturization, decreased fabrication costs, and rapidlyexpanding data connectivity have encouraged the development of small, inex-pensive devices capable of estimating PM2.5 concentrations. This new classof sensors opens up new possibilities for personal exposure monitoring andbuilding instrumentation. It also creates new challenges related to calibratingand characterizing inexpensively manufactured sensors to provide the level ofprecision and accuracy needed to yield actionable information without signifi-cantly increasing device cost. Additionally, we must develop new methods forvisualizing and presenting data in an interactive fashion such that the wealthof data presented by many spatially distributed sensors continues to empowerindividuals and communities to better understand their personal exposure.
This proposed thesis seeks to pursue the following three questions:
1. Can an inexpensive air quality monitor based on mass-manufactured dustsensors be calibrated efficiently in order to achieve inter-device agreementin addition to agreement with professional and federally-endorsed particlemonitors?
2. Can an inexpensive air quality monitor increase the confidence and capac-ity of individuals to understand and control their indoor air quality?
3. Can networks of inexpensive air quality monitors be used in tandem withexisting building monitoring systems to characterize and control air qualityin large multi-occupant spaces such as offices and university buildings?
In the proposed experiments, we will utilize the Speck fine particulate mon-itor, developed over the course of four years. The Speck processes data froma low-cost dust sensor using an asymmetric low-pass filtering algorithm. Wehave optimized the parameters for the algorithm through short-term co-locationtests with professional HHPC-6 particle counters, and verified typical correla-tions between the Speck and HHPC-6 units of r2 > 0.90. To account forvariations in sensitivity, we have developed a calibration procedure wherebyfine particles are aerosolized from a container resting on a 6-inch speaker cone.This allows us to produce Specks for commercial distribution as well as theexperiments presented herein. Over the course of the thesis, we will continueto refine this process to increase accuracy and precision as well as automationand throughput.
Drawing from previous pilot studies, we will distribute low-cost monitorsthrough local library systems and community groups. We will use pre-deploymentand post-deployment surveys to characterize user perception of personal expo-sure and the effect of a low-cost fine particulate monitor on empowerment.
We will also deploy monitors in academic and industry campuses in orderto explore the potential for small internet-connected particulate monitors toprovide higher spatiotemporal resolution for air quality data in building man-agement and automation applications.
iv
Contents
1 Introduction 1
2 Problem Statement 3
3 Related Work 53.1 Health Effects of PM2.5 . . . . . . . . . . . . . . . . . . . . . . . . . . . . . 5
3.1.1 Harvard study . . . . . . . . . . . . . . . . . . . . . . . . . . . . . . 53.2 Survey of existing PM2.5 monitoring technologies . . . . . . . . . . . . . . 6
3.2.1 Federal Reference Method . . . . . . . . . . . . . . . . . . . . . . . 63.2.2 GRIMM Laser Aerosol Spectrometer (LAS) . . . . . . . . . . . . . 63.2.3 Beta Attenuation Monitor (BAM) . . . . . . . . . . . . . . . . . . . 73.2.4 Tapered-Element Oscillating Microbalance (TEOM) . . . . . . . . . 83.2.5 Handheld Optical Particle Counter (OPC) . . . . . . . . . . . . . . 9
3.3 Existing Low Cost Air Quality Monitors . . . . . . . . . . . . . . . . . . . 93.4 Building Management Systems . . . . . . . . . . . . . . . . . . . . . . . . . 103.5 Studies With Low Cost or Portable Air Quality Monitors . . . . . . . . . . 11
3.5.1 Backpack study . . . . . . . . . . . . . . . . . . . . . . . . . . . . . 113.5.2 Clarkson HEPAiRx Study . . . . . . . . . . . . . . . . . . . . . . . 12
4 Prior Work 154.1 Speck Design . . . . . . . . . . . . . . . . . . . . . . . . . . . . . . . . . . 154.2 Speck Pilot Study . . . . . . . . . . . . . . . . . . . . . . . . . . . . . . . . 17
4.2.1 Experimental methods . . . . . . . . . . . . . . . . . . . . . . . . . 174.2.2 Results and Discussion . . . . . . . . . . . . . . . . . . . . . . . . . 18
4.3 Comparison with handheld particle counters . . . . . . . . . . . . . . . . . 224.3.1 Calibration Pre-Test . . . . . . . . . . . . . . . . . . . . . . . . . . 224.3.2 Cooking Test . . . . . . . . . . . . . . . . . . . . . . . . . . . . . . 234.3.3 Incense Test . . . . . . . . . . . . . . . . . . . . . . . . . . . . . . . 244.3.4 Results and Discussion . . . . . . . . . . . . . . . . . . . . . . . . . 26
4.4 Rapid Autonomous Group Exposure (RAGE) Calibration Method . . . . . 284.5 Comparison with Federal Equivalence Methods . . . . . . . . . . . . . . . 32
4.5.1 Outdoor tests with South Coast Air Quality Management District . 324.6 ESDR . . . . . . . . . . . . . . . . . . . . . . . . . . . . . . . . . . . . . . 334.7 Building Management System Integration . . . . . . . . . . . . . . . . . . 36
v
4.7.1 Demonstration of Integration Potential . . . . . . . . . . . . . . . . 374.7.2 Newell Simon Trial Deployment . . . . . . . . . . . . . . . . . . . . 38
5 Proposed Work 395.1 Calibration Refinement . . . . . . . . . . . . . . . . . . . . . . . . . . . . . 395.2 Large-scale community deployment . . . . . . . . . . . . . . . . . . . . . . 405.3 Building Management System Integration . . . . . . . . . . . . . . . . . . 42
5.3.1 Office Buildings: Infosys Deployments . . . . . . . . . . . . . . . . 425.4 Visualization concepts for building management . . . . . . . . . . . . . . . 43
5.4.1 Visualization for occupants . . . . . . . . . . . . . . . . . . . . . . . 445.4.2 Visualization for management . . . . . . . . . . . . . . . . . . . . . 445.4.3 Visualization for building evaluation . . . . . . . . . . . . . . . . . 44
6 Schedule of Work 47
7 Contributions 497.1 Calibration and Characterization . . . . . . . . . . . . . . . . . . . . . . . 497.2 Community Resources . . . . . . . . . . . . . . . . . . . . . . . . . . . . . 497.3 Building Management . . . . . . . . . . . . . . . . . . . . . . . . . . . . . 50
A Pilot Study Surveys 51
Bibliography 65
vi
List of Figures
3.1 Rack-mount GRIMM EDM 180 and sampling tube[4] . . . . . . . . . . . . 73.2 Schematic of the laser chamber in the GRIMM Model 1.109 LAS[4] . . . . 73.3 Diagram of BAM operation[24] . . . . . . . . . . . . . . . . . . . . . . . . 83.4 Diagram of TEOM operation[23] . . . . . . . . . . . . . . . . . . . . . . . 9
4.1 The Speck air quality monitor . . . . . . . . . . . . . . . . . . . . . . . . . 154.2 Calibration setup showing five Specks, the HHPC-6+ (left), and the HHPC-
6 (right). Displayed values are scaled down from recorded ppl counts. . . . 224.3 Plot of calibration data over time. Note the large discrepancy between the
HHPC-6 channels. . . . . . . . . . . . . . . . . . . . . . . . . . . . . . . . 234.4 Plot of cooking data over time . . . . . . . . . . . . . . . . . . . . . . . . . 244.5 Comparison of additional HHPC size channels for the cooking test, showing
ppl vs time (minutes) . . . . . . . . . . . . . . . . . . . . . . . . . . . . . . 254.8 Plot of incense data over time . . . . . . . . . . . . . . . . . . . . . . . . . 254.6 Table of cooking r2 values. Shaded cells indicate r2 > .9 . . . . . . . . . . 264.7 Incense setup. Notice the close spacing of the instruments, which may have
disrupted readings (see Results and Discussion). . . . . . . . . . . . . . . . 264.9 Comparison of additional HHPC size channels for the incense test, showing
ppl vs time (minutes) . . . . . . . . . . . . . . . . . . . . . . . . . . . . . . 274.10 Table of incense r2 values. Shaded cells indicate r2 > .9 . . . . . . . . . . . 284.11 Current calibration setup . . . . . . . . . . . . . . . . . . . . . . . . . . . . 294.12 Future calibration chamber. . . . . . . . . . . . . . . . . . . . . . . . . . . 314.13 One week of time-series AQMD data at default device sampling rates . . . 324.14 One week of time-series AQMD data at hourly averaged sampling rates . . 334.15 One week of time-series AQMD with 24hr averages, reported hourly . . . . 344.16 Early concept of interactive building air quality visualization using simulated
data . . . . . . . . . . . . . . . . . . . . . . . . . . . . . . . . . . . . . . . 37
5.1 An Acu-Rite 01057 weather station used to measure windspeed and directionas well as temperature, humidity, and rainfall[1] . . . . . . . . . . . . . . . 42
vii

viii
List of Tables
4.1 Table of pairwise r2 values for all Specks for the calibration test . . . . . . 234.2 Table of scalar calibration values . . . . . . . . . . . . . . . . . . . . . . . 244.3 Table of pairwise RMS error between devices at hourly sampling averages . 334.4 Table of pairwise r2 values between devices at hourly sampling averages . . 344.5 Table of pairwise r2 values between devices at 24hr sampling averages, re-
ported hourly . . . . . . . . . . . . . . . . . . . . . . . . . . . . . . . . . . 344.6 Comparison of features afforded by ESDR vs. other available platforms . . 36
ix

x
Chapter 1
Introduction
Fine airborne particles that are smaller than 2.5 microns, collectively designated as PM2.5,pose a serious health risk to the public. These airborne particulates have been linked tosignificantly increased risk of cardiopulmonary and respiratory illnesses, particularly in theelderly and other sensitive populations.[16][17][20]
PM2.5 can be composed of any number of airborne particulate substances, and is a par-ticularly useful metric in predicting adverse health effects.[8] Outdoor fine particulates com-monly include products from combustion such as diesel exhaust and coal particulates[18]but not larger particles such as pollen. PM2.5 is often present indoors as well, and includesfine dust and particulates created from certain kinds of cooking, such as frying.
Inside the home, PM2.5 is composed of particles both from indoor sources as well asoutdoor sources. Open windows and doors as well as insulation can affect how muchparticle interchange occurs. Because air quality dynamics are complex, there are timeswhen it is beneficial to open a window if the outside air is cleaner than the indoor air, andvice versa. Different cooking oils have varying smoke points, which can affect the number ofparticulates generated. Kitchen smoke hoods should ideally vent outside, but it is commonfor these hoods to simply pass cooking emissions through a coarse filter and then exhaustback into the kitchen. A HEPA air purifier can dramatically lower indoor particle countsif located in an appropriately sized room. Unfortunately, air quality is largely an unknownuntil adverse symptoms present themselves and prompt the need for personal indoor airquality monitoring.
Because PM2.5 is a measurement that can indicate the presence of a diverse rangeof pollutants,[15] it is an ideal single metric for personal air quality monitors. Existingparticle counters are almost solely available in the scientific and industrial markets, andas such are much more expensive than is practical for a home budget. As a result, PM2.5
measurements are sparse and information on personal exposure is often unavailable ordifficult to understand. A new class of low-cost air quality monitors is emerging, however.This thesis will examine the potential for this technology to increase awareness and effectchanges in behavior as an individual and also at a community level. We will also examinethe effects of inexpensive air quality monitors spatially distributed in mass-occupied spaceslike open office buildings and university campuses.
In addressing these questions, we will also pursue new methods of calibration, char-
1

acterization, and visualization necessary for this new class of sensors to present precise,accurate, and actionable information to users.
2
Chapter 2
Problem Statement
Air quality measurement and analysis with high temporal and spatial resolution has yetto be achieved due to prior limitations on instrument cost, size, and technical complexity.Rather than precision optics and complex control of temperature, flow, and humidity ofincoming air, low cost air quality monitors may utilize an inexpensive mass-manufactureddust sensor and on-board signal processing to estimate particle count and PM2.5. Thisthesis will seek to answer the following two questions:
1. Can an inexpensive air quality monitor based on mass-manufactured dust sensorsbe calibrated efficiently in order to achieve inter-device agreement in addition toagreement with professional and federally-endorsed particle monitors?
2. Can an inexpensive air quality monitor increase the confidence and capacity of indi-viduals to understand and control their indoor air quality?
3. Can networks of inexpensive air quality monitors be used in tandem with existingbuilding monitoring systems to characterize and control air quality in large multi-occupant spaces such as offices and university buildings?
Calibration of inexpensive sensors is generally challenging because of the low precisionof manufacturing, large numbers of sensors to be calibrated, and the goal to keep thecalibration inexpensive relative to the cost of the monitor. This challenge is made moredifficult for air quality, where it can be hard to generate repeatable levels of air pollution.We have explored a method using large low-frequency speakers to aerosolize fine dust andspread it across a bench of sensors to be calibrated. In this thesis, we seek to refinethis procedure through the development of a calibration enclosure, controlled distributionof source particle sizes, and additional instrumentation using an optical PM2.5 federalequivalence monitor.
We will deploy low-cost monitors through local pilots in the Pittsburgh region in order tostudy the effect of these monitors on individual empowerment. One vector for distributionwill be through the public library system. Through surveys conducted at the time ofcheck-out and at check-in, we will evaluate changes in user confidence and understandingof their indoor air quality while in possession of the monitor. We will also use the surveysto gauge whether people were able to use their collected and observed data to make in-home changes to improve their air quality by reducing PM2.5. We will conduct additional
3

in-person interviews when possible to gather anecdotal evidence to support the results ofthe surveys.
In evaluating the use of inexpensive air quality monitors in tandem with building man-agement systems, we will deploy monitors both in university buildings such as Newell SimonHall as well as in office buildings in the United States and India. Deployment of the currentSpeck models will allow us to begin collecting data while gaining insight which will informthe co-design of a monitor specifically for integration into building management systems.The hardware co-design will focus on discovering a form factor and communication proto-col that allows for integration into the largest percentage of existing systems. The collecteddata will allow us to design separate visualizations specific to three user groups: individualoffice occupants, building managers, and public relations specialists. Analysis of the datawill identify the appropriate device density for segregated offices and for large open-officespaces. We will conduct surveys and interviews to answer the following questions:
1. What is the effect of access to air quality measurements on the comfort and behaviorof individual office occupants?
2. Does increased access to spatio-temporal air quality data enable building managersto improve occupant personal exposure through HVAC control and building modifi-cation?
3. Can visualizations be effectively used by public relations specialists to promote build-ing innovations leading to cleaner air quality technology?
4
Chapter 3
Related Work
3.1 Health Effects of PM2.5
Exposure to elevated levels of particulate matter has been linked to numerous health im-pacts, including but not limited to respiratory illness, cardiovascular problems, low birthweight, and reduced productivity. Particulate matter is one of the EPA’s six criteria airpollutants, alongside ozone, carbon monoxide, nitrogen oxides, sulfur dioxide, and lead.While particles less than 10 microns are recognized to pose a significant threat to humanhealth, the EPA is especially concerned with particles smaller than 2.5 microns, collectivelyreferred to as fine particulate matter or PM2.5. Particles within this size range are smallenough to enter the lungs, and the smallest of these can additionally enter the bloodstream.Populations at increased risk of negative health effects include children and older adults,and premature death can result in people with heart or lung disease.
PM2.5 is also of concern to employers and workers whose jobs regularly place them inenvironments with higher exposure to fine particulate matter. Increased levels of pollution,including fine particulate matter, has been linked with lower productivity in the workplace.This in turn results in higher employment costs, which often constitute the greatest fractionof operational expenses for many businesses.
3.1.1 Harvard study
The Harvard Six Cities Study[11] followed 8111 participants in six cities around the UnitedStates in order to determine the effects of air pollution on mortality and cause of deathover a period of 14 to 16 years. The study found that fine inhalable particulate matterand sulfate particles had the greatest effect on mortality rates, moreso than total partic-ulate pollution, aerosol acidity, sulfur dioxide, or nitrogen dioxide. Fine particulates wereespecially significant in association with cardiopulmonary illness, lung cancer, and otherrespiratory illnesses. The study acknowledges potential confounding factors including cu-mulative lifetime exposure to particulate matter, though controlling for as many factorsas possible yields similar results. Smoking was also shown to have an extreme effect onmortality due to lung cancer, as additionally supported by most other relevant studies.
5
3.2 Survey of existing PM2.5 monitoring technologies
3.2.1 Federal Reference Method
The federal reference methods (FRM) for measuring PM2.5 and PM10 involve circulatingair through carefully pre-weighed filters over a period of time[19]. The change in massover time, given a constant and known flow rate, can be used to determine the particu-late concentration of a volume of air. This method is very labor intensive, however, andoutdated by more recent methods. It has the advantage of being the only widely-acceptedmeans of measuring mass directly (rather than through resonance, beta attenuation, etc.).Its downsides include non-continuous sampling over large intervals, and the large poten-tial for human error. Additionally, volatile substances may be initially captured as fineparticulates, but they have the ability to sublimate off of the filters, and are thus onlyintermittently recorded.
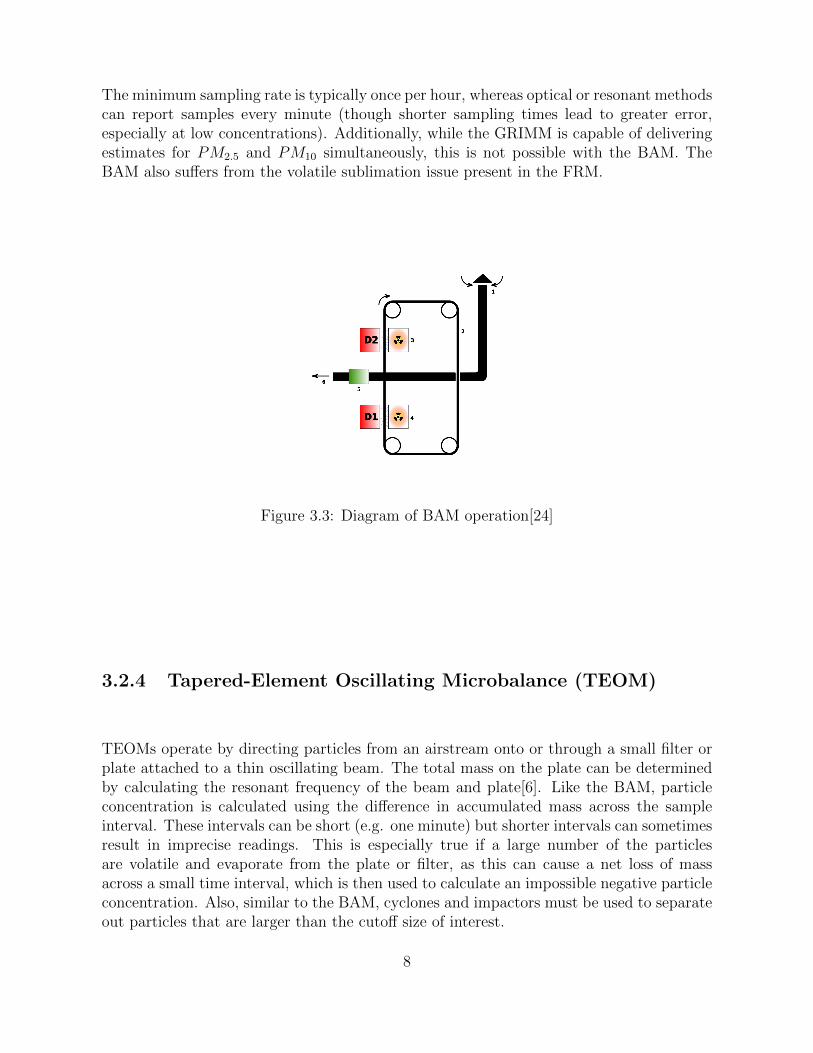
3.2.2 GRIMM Laser Aerosol Spectrometer (LAS)
The GRIMM EDM 180 is a federal equivalence monitor that calculates mass at multiplesize cutoffs by counting and sizing particles optically[21]. The GRIMM is capable of dis-criminating between 32 distinct size ranges of particles. Because the measured particlesare categorized by size, no cyclones or impactors are required; only very coarse filtering toprevent bugs and singly-visible particles from entering. Because the instrument is based onoptical measurement, however, the device must account for or reduce hydroscopic growthdue to humidity. The GRIMM accomplishes this by transporting newly sampled air downthrough a long nafion tube. Dry, non-sample air flows upward in a concentric pipe aroundthe nafion tube, extracting moisture from the intake air in the process. An additionalconcentric pipe recirculates the air back into the base unit for expulsion. The pressureneeded to circulate this air necessitates a large and relatively noisy pump, but this systemonly receives power at an observed humidity of around 70%.
6
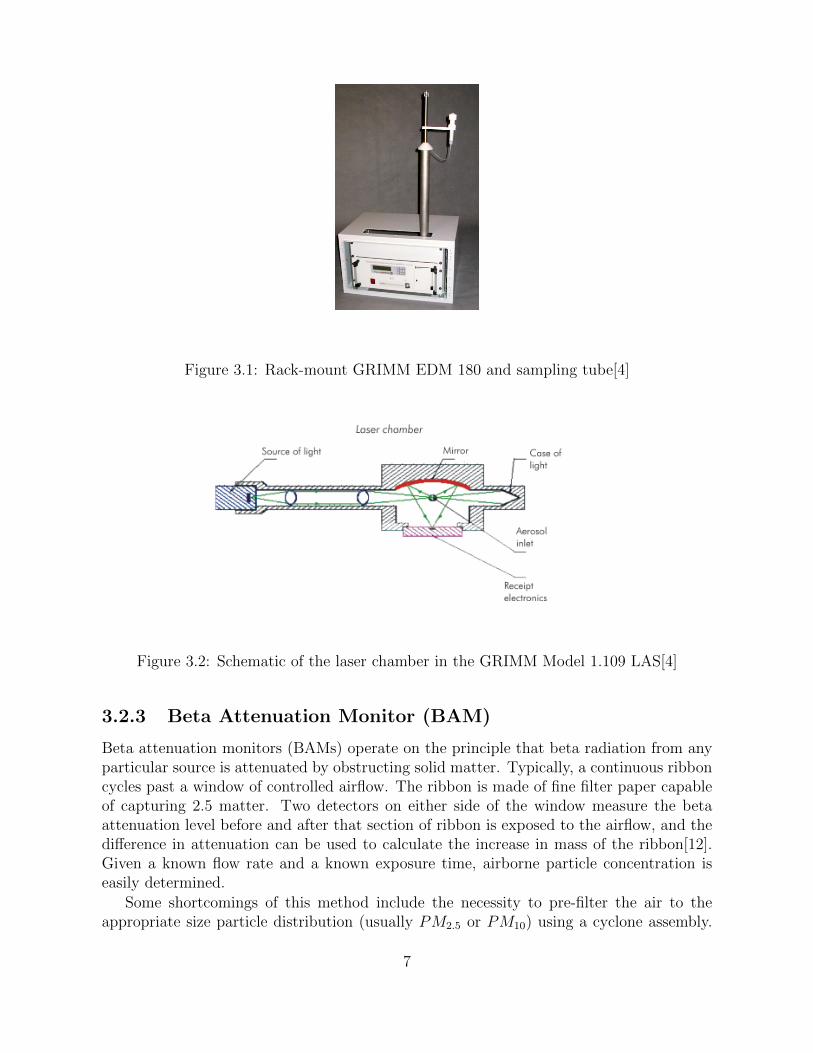
Figure 3.1: Rack-mount GRIMM EDM 180 and sampling tube[4]
Figure 3.2: Schematic of the laser chamber in the GRIMM Model 1.109 LAS[4]
3.2.3 Beta Attenuation Monitor (BAM)
Beta attenuation monitors (BAMs) operate on the principle that beta radiation from anyparticular source is attenuated by obstructing solid matter. Typically, a continuous ribboncycles past a window of controlled airflow. The ribbon is made of fine filter paper capableof capturing 2.5 matter. Two detectors on either side of the window measure the betaattenuation level before and after that section of ribbon is exposed to the airflow, and thedifference in attenuation can be used to calculate the increase in mass of the ribbon[12].Given a known flow rate and a known exposure time, airborne particle concentration iseasily determined.
Some shortcomings of this method include the necessity to pre-filter the air to theappropriate size particle distribution (usually PM2.5 or PM10) using a cyclone assembly.
7
The minimum sampling rate is typically once per hour, whereas optical or resonant methodscan report samples every minute (though shorter sampling times lead to greater error,especially at low concentrations). Additionally, while the GRIMM is capable of deliveringestimates for PM2.5 and PM10 simultaneously, this is not possible with the BAM. TheBAM also suffers from the volatile sublimation issue present in the FRM.
Figure 3.3: Diagram of BAM operation[24]
3.2.4 Tapered-Element Oscillating Microbalance (TEOM)
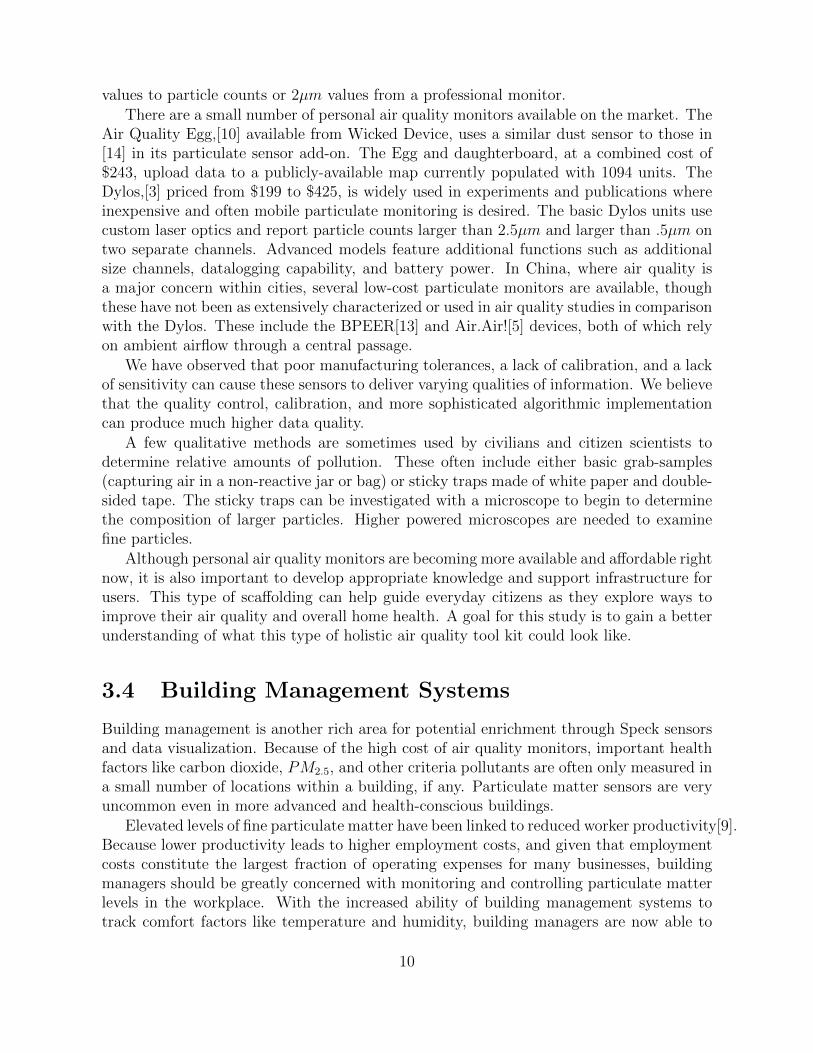
TEOMs operate by directing particles from an airstream onto or through a small filter orplate attached to a thin oscillating beam. The total mass on the plate can be determinedby calculating the resonant frequency of the beam and plate[6]. Like the BAM, particleconcentration is calculated using the difference in accumulated mass across the sampleinterval. These intervals can be short (e.g. one minute) but shorter intervals can sometimesresult in imprecise readings. This is especially true if a large number of the particlesare volatile and evaporate from the plate or filter, as this can cause a net loss of massacross a small time interval, which is then used to calculate an impossible negative particleconcentration. Also, similar to the BAM, cyclones and impactors must be used to separateout particles that are larger than the cutoff size of interest.
8
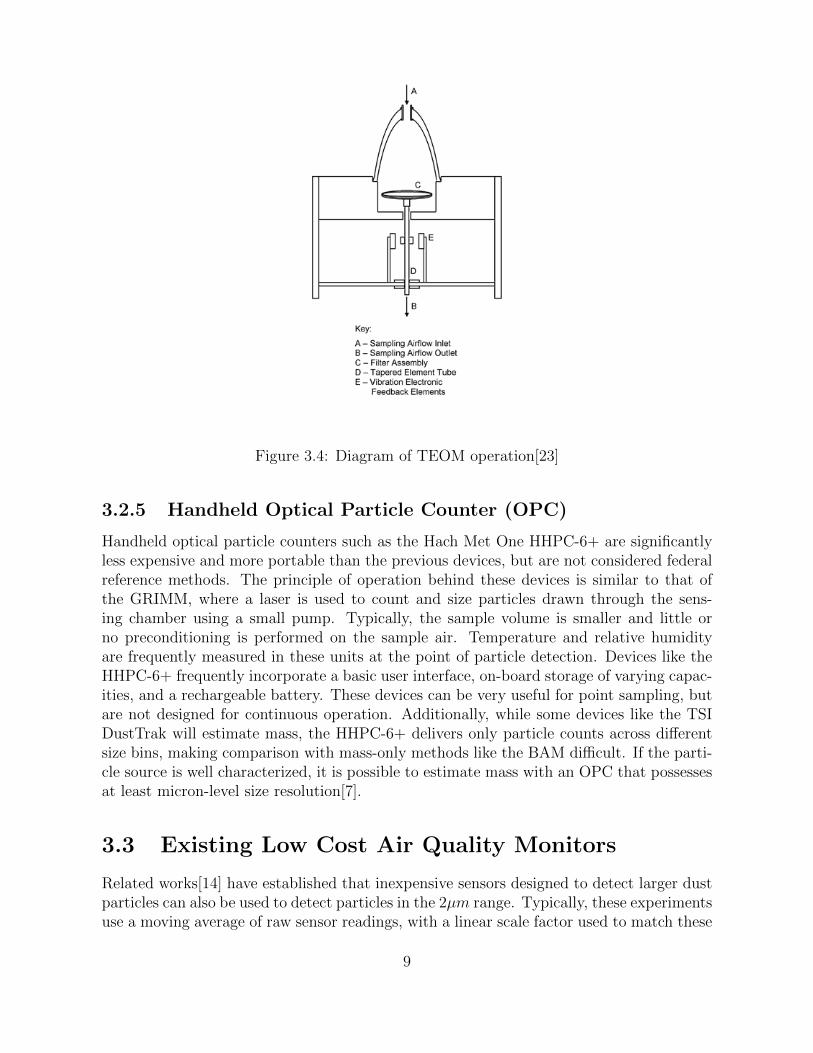
Figure 3.4: Diagram of TEOM operation[23]
3.2.5 Handheld Optical Particle Counter (OPC)
Handheld optical particle counters such as the Hach Met One HHPC-6+ are significantlyless expensive and more portable than the previous devices, but are not considered federalreference methods. The principle of operation behind these devices is similar to that ofthe GRIMM, where a laser is used to count and size particles drawn through the sens-ing chamber using a small pump. Typically, the sample volume is smaller and little orno preconditioning is performed on the sample air. Temperature and relative humidityare frequently measured in these units at the point of particle detection. Devices like theHHPC-6+ frequently incorporate a basic user interface, on-board storage of varying capac-ities, and a rechargeable battery. These devices can be very useful for point sampling, butare not designed for continuous operation. Additionally, while some devices like the TSIDustTrak will estimate mass, the HHPC-6+ delivers only particle counts across differentsize bins, making comparison with mass-only methods like the BAM difficult. If the parti-cle source is well characterized, it is possible to estimate mass with an OPC that possessesat least micron-level size resolution[7].
3.3 Existing Low Cost Air Quality Monitors
Related works[14] have established that inexpensive sensors designed to detect larger dustparticles can also be used to detect particles in the 2µm range. Typically, these experimentsuse a moving average of raw sensor readings, with a linear scale factor used to match these
9
values to particle counts or 2µm values from a professional monitor.There are a small number of personal air quality monitors available on the market. The
Air Quality Egg,[10] available from Wicked Device, uses a similar dust sensor to those in[14] in its particulate sensor add-on. The Egg and daughterboard, at a combined cost of$243, upload data to a publicly-available map currently populated with 1094 units. TheDylos,[3] priced from $199 to $425, is widely used in experiments and publications whereinexpensive and often mobile particulate monitoring is desired. The basic Dylos units usecustom laser optics and report particle counts larger than 2.5µm and larger than .5µm ontwo separate channels. Advanced models feature additional functions such as additionalsize channels, datalogging capability, and battery power. In China, where air quality isa major concern within cities, several low-cost particulate monitors are available, thoughthese have not been as extensively characterized or used in air quality studies in comparisonwith the Dylos. These include the BPEER[13] and Air.Air![5] devices, both of which relyon ambient airflow through a central passage.
We have observed that poor manufacturing tolerances, a lack of calibration, and a lackof sensitivity can cause these sensors to deliver varying qualities of information. We believethat the quality control, calibration, and more sophisticated algorithmic implementationcan produce much higher data quality.
A few qualitative methods are sometimes used by civilians and citizen scientists todetermine relative amounts of pollution. These often include either basic grab-samples(capturing air in a non-reactive jar or bag) or sticky traps made of white paper and double-sided tape. The sticky traps can be investigated with a microscope to begin to determinethe composition of larger particles. Higher powered microscopes are needed to examinefine particles.
Although personal air quality monitors are becoming more available and affordable rightnow, it is also important to develop appropriate knowledge and support infrastructure forusers. This type of scaffolding can help guide everyday citizens as they explore ways toimprove their air quality and overall home health. A goal for this study is to gain a betterunderstanding of what this type of holistic air quality tool kit could look like.
3.4 Building Management Systems
Building management is another rich area for potential enrichment through Speck sensorsand data visualization. Because of the high cost of air quality monitors, important healthfactors like carbon dioxide, PM2.5, and other criteria pollutants are often only measured ina small number of locations within a building, if any. Particulate matter sensors are veryuncommon even in more advanced and health-conscious buildings.
Elevated levels of fine particulate matter have been linked to reduced worker productivity[9].Because lower productivity leads to higher employment costs, and given that employmentcosts constitute the largest fraction of operating expenses for many businesses, buildingmanagers should be greatly concerned with monitoring and controlling particulate matterlevels in the workplace. With the increased ability of building management systems totrack comfort factors like temperature and humidity, building managers are now able to
10
optimize thermal comfort and energy expenditures. This is in large part due to the quan-tification of the impact of discomfort on employee productivity and the resulting increasein personnel costs. As particulate matter sensors are only now becoming miniaturizedand affordable, however, these systems have yet to implement spatially-distributed PM2.5
monitoring, which would provide another variable for assessing employee comfort. Somerecently launched products such as the Airassure PM2.5 monitor from TSI are designedto connect to networked building management systems, though at this time the AirassurePM2.5 monitor is not yet available in the USA or Europe.
Automated Logic currently offers one of the most advanced commercially-availablebuilding automation systems. A full building solution allows building managers to moni-tor environmental conditions as well as the status of energy and climate related buildinginfrastructure. Additionally, control of these systems can be automated using schedulesand instrumentation feedback rules. WebCTRL, one of Automated Logic’s flagship prod-ucts, integrates most of these features into a single interface which can be accessed fromany device with a network-connected web browser. Automation rules can be created usinga largely graphical, object-oriented interface. Set points for these rules are easily createdand modified as necessary by the building manager. Visualization of current, projected,and past data is presented either as floor-based heatmaps, trend graphs, or detailed de-vice or subsystem animations. WebCTRL EnergyReports summarize data over specifiedperiods of time for easy review of large campuses by management staff. WebCTRL Time-lapse allows for building managers to review past data as a replay over periods of up to 24hours. This functionality allows reviewers to identify performance or unexpected changesin energy use or climate after the event has already passed. Automated Logic’s softwareis largely customizable, which allows it to be used in a variety of buildings or campuses.
3.5 Studies With Low Cost or Portable Air Quality
Monitors
3.5.1 Backpack study
Spira-Cohen et al ([22]) measured personal exposure to fine particulates in asthmaticschoolchildren in their oft-cited South Bronx backpack study. This study found a sig-nificant correlation between respiratory symptoms and fine particulate matter, especiallydiesel exhaust. These symptoms included increased coughing, wheezing, allergic inflamma-tion, decreased lung function, and other asthma symptoms. The data for this study wasobtained through qualitative and quantitative self-assessment of symptom presence andseverity along with quantitative data from mobile and stationary air quality monitors.
Stationary monitors included a TEOM 1400a PM2.5 sampler, AE-21 black carbonaethalometer, and an ACCU filter sampler as well as monitors for O3, CO, SO2, andNOx, all located at the school. Additionally, background PM2.5 data was available from arooftop monitor operated by the New York State Department of Environmental Conserva-tion. The personal monitors carried by the children were placed in rolling backpacks, whichthe children were instructed to keep with them 24/7. The backpacks contained filter-based
11
24-hour integrated weekday PM2.5 samples as well as motion sensors to determine if thebackpacks were being carried at all times.
The wide assortment of sensor data gathered in this study allowed the research team toinvestigate many independent correlations, and represented a significant amount of researcheffort as each of the 40 students required regular intervention to change, collect, and analyzefilter samples in addition to gathering symptom data. One shortcoming of this study isthat because of the 24-hour integrated samples, the lag effect between exposure and thepresentation of symptoms could only be resolved as same-day or in one-day increments.Continuous sampling as is made possible by optical nephelometer-based devices couldprovide significant time resolution in similar experiments. These devices also do not requirechanging filters or regular maintenance over a period of only a few months, and withautomatic wireless data uploads, the interventions of the research team could be decreasedto symptom collection. Additionally, smaller and more lightweight optical monitors couldreduce the impact and intrusion of the equipment on the participants’ behavior. Withnew technology, these monitors may become wearable, thus increasing the accuracy ofpersonal exposure monitoring. The scope of the experiments can also be extended to alarger population if the cost of the equipment is reduced along with the personnel expenseassociated with tending to filter-based samplers.
3.5.2 Clarkson HEPAiRx Study
In a study conducted by Xu et al.[25], air quality monitors were placed in the homes of 30asthmatic children for 18 weeks along with a HEPAiRx air cleaning and ventilation unit.The unit was kept on for 12 of the 18 weeks for each household, with half of the groupturning the unit on during the first 12 weeks and the other half turning it on for the last 12weeks. During this period, the AirAdvice air quality monitor was used to track the effectsof the HEPAiRx operating status on PM10, CO, CO2, TVOC, temperature and humidity.Every sixth day, measurements would be taken from participants of their exhaled breathconcentrate (EBC), pH, and peak expiratory flow (PEF). The study found that the airpurifier reduced PM10 by 72%, VOC by 59%, CO2 by 19%, and CO by 30%. Additionally,these reductions were shown to have a statistically significant effect in improving EBCnitrate concentrations, pH, and PEF. These results were made possible by the relativelysmall and unobtrusive AirAdvice unit, which can rest on a table or countertop and requiresonly one household power outlet. Data is relayed wirelessly on a minute by minute basis,thus simplifying measurement collection. The typical business model of AirAdvice is forcontractors to place the monitor in the home for a short time, typically less than onehour. This data is automatically transmitted and analyzed by the AirAdvice servers.The monitor itself is not available to consumers, potentially because of cost and usabilityconstraints. A lower-cost monitor with greater ease of use could potentially expand thescope of similar experiments to a greater number of houses. The AirAdvice platform solvesmany of the shortcomings associated with using other technology, such as the difficulty ofmanually collecting data or the requirement for multiple and/or large monitoring devicesin the home. Clarkson University was able to confirm the value of the HEPAiRx unit byutilizing the AirAdvice monitor over a long period of time. With a commercially available
12

and affordable air quality monitor, individuals can verify the effectiveness of their own airpurifier, including whether it has sufficient airflow to properly clean any specific room orfloor.
13

14
Chapter 4
Prior Work
4.1 Speck Design
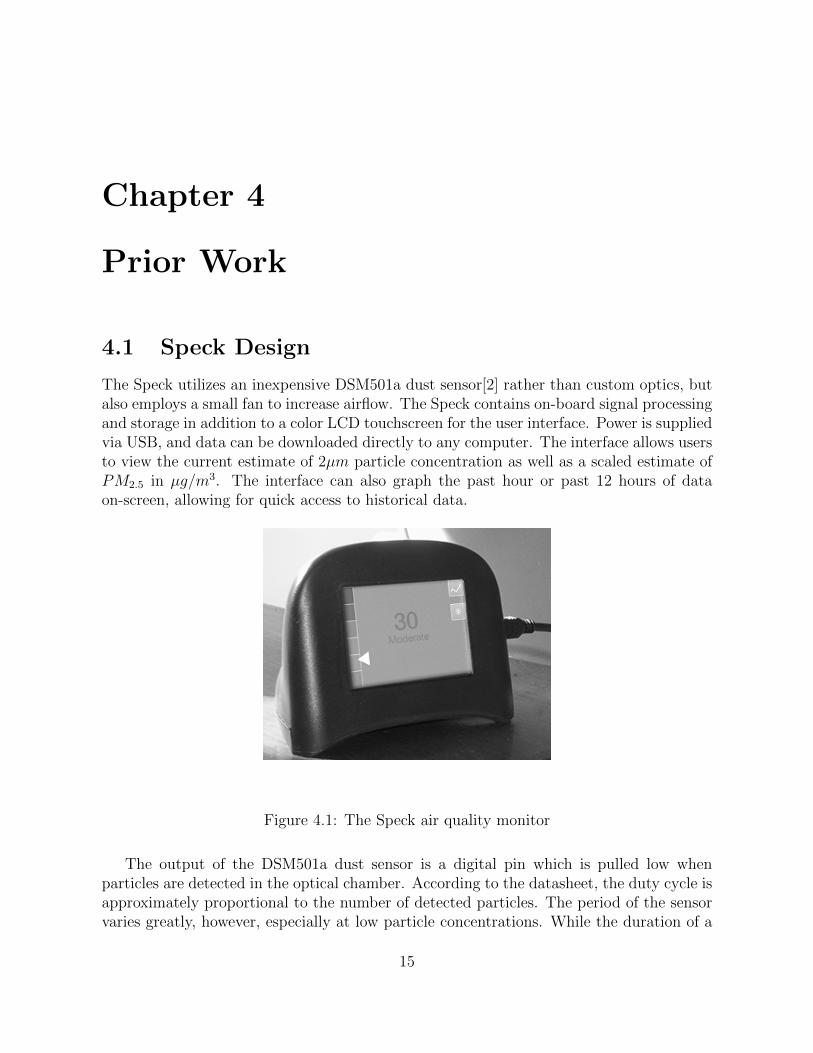
The Speck utilizes an inexpensive DSM501a dust sensor[2] rather than custom optics, butalso employs a small fan to increase airflow. The Speck contains on-board signal processingand storage in addition to a color LCD touchscreen for the user interface. Power is suppliedvia USB, and data can be downloaded directly to any computer. The interface allows usersto view the current estimate of 2µm particle concentration as well as a scaled estimate ofPM2.5 in µg/m3. The interface can also graph the past hour or past 12 hours of dataon-screen, allowing for quick access to historical data.
Figure 4.1: The Speck air quality monitor
The output of the DSM501a dust sensor is a digital pin which is pulled low whenparticles are detected in the optical chamber. According to the datasheet, the duty cycle isapproximately proportional to the number of detected particles. The period of the sensorvaries greatly, however, especially at low particle concentrations. While the duration of a
15
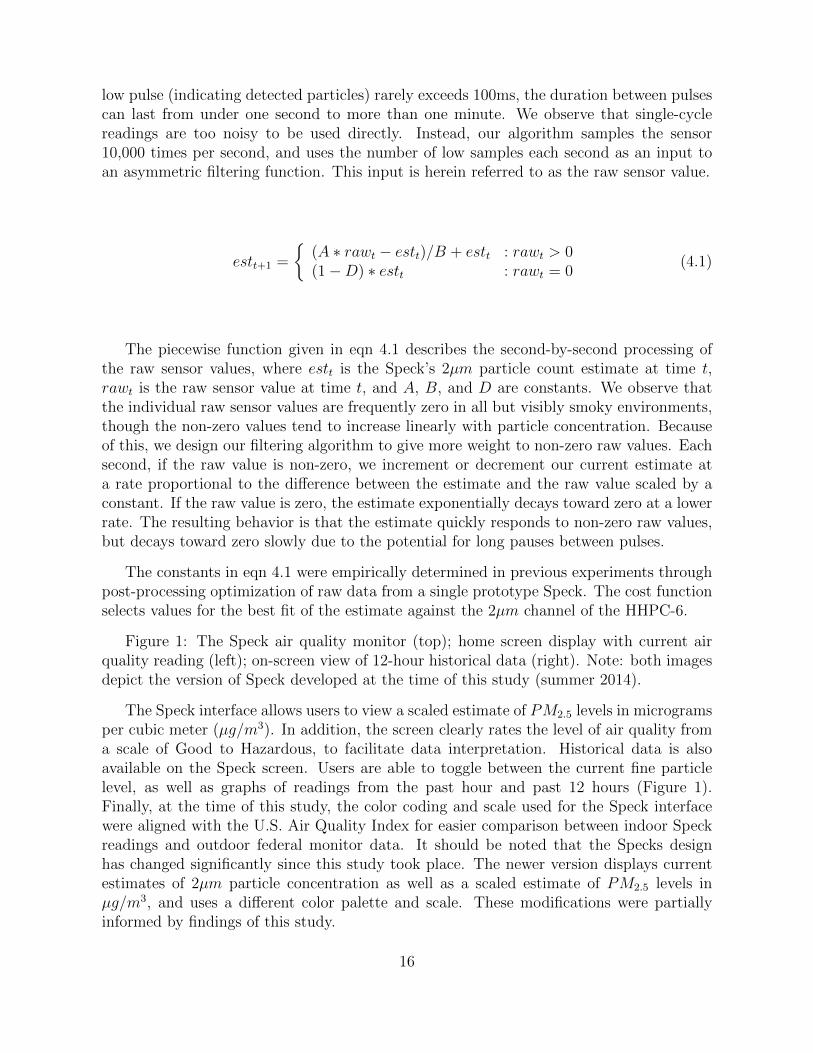
low pulse (indicating detected particles) rarely exceeds 100ms, the duration between pulsescan last from under one second to more than one minute. We observe that single-cyclereadings are too noisy to be used directly. Instead, our algorithm samples the sensor10,000 times per second, and uses the number of low samples each second as an input toan asymmetric filtering function. This input is herein referred to as the raw sensor value.
estt+1 =
{(A ∗ rawt − estt)/B + estt : rawt > 0(1−D) ∗ estt : rawt = 0
(4.1)
The piecewise function given in eqn 4.1 describes the second-by-second processing ofthe raw sensor values, where estt is the Speck’s 2µm particle count estimate at time t,rawt is the raw sensor value at time t, and A, B, and D are constants. We observe thatthe individual raw sensor values are frequently zero in all but visibly smoky environments,though the non-zero values tend to increase linearly with particle concentration. Becauseof this, we design our filtering algorithm to give more weight to non-zero raw values. Eachsecond, if the raw value is non-zero, we increment or decrement our current estimate ata rate proportional to the difference between the estimate and the raw value scaled by aconstant. If the raw value is zero, the estimate exponentially decays toward zero at a lowerrate. The resulting behavior is that the estimate quickly responds to non-zero raw values,but decays toward zero slowly due to the potential for long pauses between pulses.
The constants in eqn 4.1 were empirically determined in previous experiments throughpost-processing optimization of raw data from a single prototype Speck. The cost functionselects values for the best fit of the estimate against the 2µm channel of the HHPC-6.
Figure 1: The Speck air quality monitor (top); home screen display with current airquality reading (left); on-screen view of 12-hour historical data (right). Note: both imagesdepict the version of Speck developed at the time of this study (summer 2014).
The Speck interface allows users to view a scaled estimate of PM2.5 levels in microgramsper cubic meter (µg/m3). In addition, the screen clearly rates the level of air quality froma scale of Good to Hazardous, to facilitate data interpretation. Historical data is alsoavailable on the Speck screen. Users are able to toggle between the current fine particlelevel, as well as graphs of readings from the past hour and past 12 hours (Figure 1).Finally, at the time of this study, the color coding and scale used for the Speck interfacewere aligned with the U.S. Air Quality Index for easier comparison between indoor Speckreadings and outdoor federal monitor data. It should be noted that the Specks designhas changed significantly since this study took place. The newer version displays currentestimates of 2µm particle concentration as well as a scaled estimate of PM2.5 levels inµg/m3, and uses a different color palette and scale. These modifications were partiallyinformed by findings of this study.
16
4.2 Speck Pilot Study
4.2.1 Experimental methods
Overview
This was a proof of concept study to explore whether and how an environmental sensor canempower a community of users to improve the air they breathe. To this end, we provideda sample of Pittsburgh residents with a Speck air quality monitor along with supportingmaterial, and monitored how using this device affected their perspectives and behaviors.We hypothesized that, given a sufficient support structure, everyday citizens can gain theknowledge and confidence they need to investigate, discover and take action to mitigateair quality problems in their homes.
A secondary objective of this study was to discover the usability and utility of the Speckand associated support material, from the perspective of end users. Research participantswere asked to rate the device and supporting material twice during the study period, so asto capture their feedback at varying stages of use.
Supporting Material
Based on feedback received during prior prototype testing, it was clear that people whouse the Speck also require a support structure to help guide their process of discoveryand action. The primary questions asked regarded what to do when residents discoverhigh levels of particulate matter in their homes. While there is no single answer to thisquestion, there are a few steps people can take as they investigate sources of and solutionsto their air quality issues. Through this study, we wanted to understand which modes(or collection of modes) were most effective for conveying this type of information to thecommunity of Speck users. We designed print material in the form of a Speck setup guide aswell as a Speck website (http://specksensor.org) to test with research participants. Thesemedia contained instructions for how to use the Speck, along with guidance on recognizingpollution sources and experimenting to uncover ways to resolve air quality problems.
In addition, it was important to design a platform through which individual Speck userscould connect with others in their community (as well as researchers) to discuss air qualityproblems and brainstorm solutions collectively. To leverage the popularity of existing socialmedia frameworks, we created a private Facebook page where study participants couldinteract with one another about their experiences with the Speck. Joining the Facebookgroup was an optional aspect of participation in the study, and we ensured that onlyparticipants and researchers had access to this page.
Community Selection
The target audience for this study was people in the Pittsburgh region who had someinterest in learning more about their air quality. A total of 47 participants were recruitedthrough the research groups network of local community partners. Email solicitations were
17
sent out to individuals and community groups, who in turn passed on the call for researchparticipants to their contacts via email and social media.
Interested individuals met in person with researchers to receive an overview of thestudy, provide consent to participate (if willing), and pick up their Speck. The majorityof consenting participants were white females, who were approximately 25 to 50 years old.This study was approved by Carnegie Mellon Universitys Institutional Review Board, andaccordingly, we followed appropriate protocol during the course of the study.
Data Collection and Analysis
Each participant received a Speck to use in their home for 2 to 3 weeks, and was asked tocomplete a total of 3 surveys. The first survey was administered before participants receivedthe Speck to gauge their baseline level of knowledge about indoor air quality. About a weekafter picking up their Speck, participants received a second survey to inquire about theirexperiences to-date. When it was time to return their Speck, participants completed afinal survey to provide their overall feedback about the Speck and supporting material,describe what they learned from the study, and share any relevant personal stories.
In addition to survey data, we also captured discussions and posts that occurred onthe participant Facebook page. These anecdotes provided valuable insight into how par-ticipants used their Speck, the discoveries they made, actions they took, and air qualityconversations that were sparked by the Speck. This social media platform was also usefulfor participants to pose questions about the Speck and its applications, which could beanswered by researchers as well as other participants. Thus, the Facebook group servedas a virtual community meeting place where participants could discuss their air qualityfindings and concerns, as well as share knowledge and ideas with each other.
Findings from this study were primarily qualitative and anecdotal. As such, surveyresults and Facebook posts were qualitatively examined to detect data trends and commonthemes in participant responses. In addition, participant quotes were compiled to create astoryboard of user experiences and feedback.
4.2.2 Results and Discussion
Speck Assessment
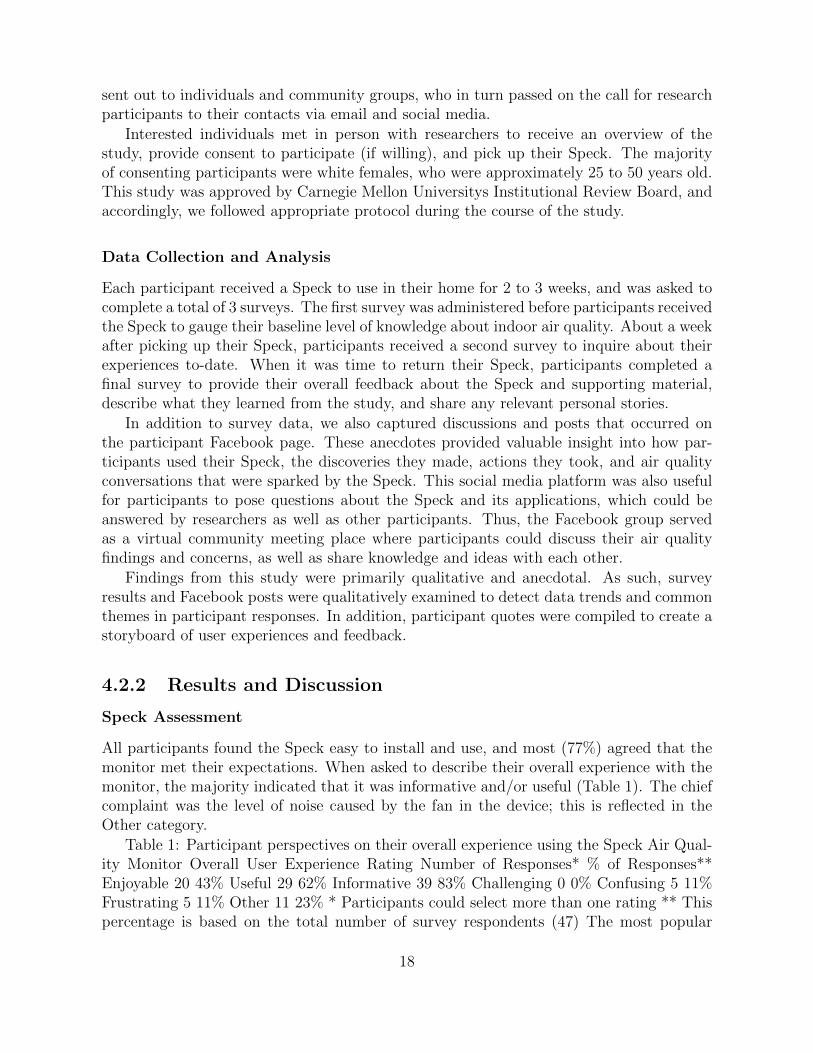
All participants found the Speck easy to install and use, and most (77%) agreed that themonitor met their expectations. When asked to describe their overall experience with themonitor, the majority indicated that it was informative and/or useful (Table 1). The chiefcomplaint was the level of noise caused by the fan in the device; this is reflected in theOther category.
Table 1: Participant perspectives on their overall experience using the Speck Air Qual-ity Monitor Overall User Experience Rating Number of Responses* % of Responses**Enjoyable 20 43% Useful 29 62% Informative 39 83% Challenging 0 0% Confusing 5 11%Frustrating 5 11% Other 11 23% * Participants could select more than one rating ** Thispercentage is based on the total number of survey respondents (47) The most popular
18
locations for in-home Speck placement were the kitchen, bedrooms and living room, andon average, most participants left the monitor in each location for 1 to 6 days. Participantsmade note of their Speck reading multiple times a day, with the majority (62%) lookingat the screen each time they walked into the room the Speck was in.
In terms of the hardware, participants were mostly happy with the Speck, but wouldhave liked to see an even smaller and more portable design (including a battery pack),and longer USB cable to connect to the power supply. Some respondents also requesteda better option for securing the Speck to a surface (with added weight or foot grips) so itwouldnt slide off as easily.
Apart from including a quieter fan and more robust micro-USB port, participants wereprimarily interested in Speck modifications that would allow them to:
• Receive alerts about significant changes in air quality; the majority wanted the alertto be in the form of a blinking light (43%) or text message (26%)
• Personalize Speck settings to be able to choose when they get alerts, alter the typesof historical views that are displayed, change the color coding, etc.
• Connect to their device through a mobile phone app
• Download their data and run independent analyses on it
Overall, the Speck design and functionality were satisfactory to participants, who foundthe device to be a useful addition to their homes. Note that the data download featurewas already implemented. However, given that participants would only have the Speckfor a short time, we did not include training on how to utilize this feature as part of thissmall-scale study.
Perception and Behavioral Impact
Based on pre and post data from participants, we found that 53% had a different perceptionof their in-home air quality after using the Speck. This suggests that the use of Speckcan promote greater awareness about a persons indoor environment; making the invisibleparticles more visible to users. Additionally, 55% of participants reported an increased levelof confidence in their ability to act when the air quality is poor in their homes, hinting ata sense of empowerment among this group of users. At the end of the study, when asked ifthe Speck helped them feel empowered to understand and manage their air quality, 72% ofparticipants responded positively. This provided further evidence of the Specks potentialto motivate and support citizens to become more aware of their home environment andtake action to improve their air quality. While the Speck was in their possession, severalparticipants reported that they:
• Became more aware of how cooking affected air quality, and/or altered cooking habits(e.g. turning on stove vents, frying less, etc.) to mitigate these effects
• Gained a better understanding of how cleaning affected air quality, experimentedwith different cleaning methods, and in general cleaned more often or thoroughly
• Experimented with opening and closing windows and discovered more about howthose actions impacts air quality differently
19
• Changed or cleaned air filters
• Added air purifiers to their homes
Thus, participants were able to gain useful insight from using the Speck, and werethereby motivated to take explicit steps to improve their air quality.
Effectiveness of Supporting Material
A notable aspect of this study was its pairing with supporting material and a social mediaplatform for Speck users. Most participants (87%) indicated that the setup guide wasuseful. On the other hand, 39% of participants never visited the Speck website to obtainfurther tips and information. Findings highlighted that the Speck website may need to bereconfigured and supplemented (e.g. through workshops, instructional videos, step-by-stepinstructions, etc.) in order to improve user engagement and overall effectiveness.
The Facebook group, on the other hand, proved to be very actively utilized. 77% ofparticipants joined the group, and 72% reported that they found it useful to connect withother users through this social media outlet. These results indicated that a communityforum can enhance an individuals experience, and produce a broader body of shared knowl-edge and ideas. A key component missing from these community interactions was inputfrom air quality, health and other relevant experts who could potentially further enrichthe impact and utility of such forums. In particular, if policy-level decision makers areincluded in the conversation, these community interactions could have longer-term impacton achieving better air quality for all citizens.
Participant Stories
Overall, results from this pilot study were encouraging and support the notion that theSpeck could serve as a tool to empower a community of users to rally around commonissues related to air quality. A few noteworthy examples of participant comments thatfurther bolster this idea are given below:
• My husband and son have asthma and the Speck has been very informative aboutwhy their symptoms are worse at night. The readings in the bedrooms are muchhigher vs the front of the house. Appreciate the tips to improve the air quality andon the lookout for more.
• Vacuuming my hardwood floor made it spike from mid 20s to an unhealthy 67 inseconds. Guess I should use a mask while cleaning, seriously.
• Very excited to be testing the Speck. First day with it we turned on the broiler.Dangerous levels! Woah.
• I really like the speck... I am putting in it my bedroom tonight to see what thereadings are. My daughter has been keeping detailed notes in the notebook :)
• I absolutely love being able to measure the air quality of what I’m breathing in- it’sa very empowering tool.
20
• Its been fun watching the reading [on the Speck] go up and down in response topredictable stimuli. For example, the reading shot up very quickly when a guest lita cigarette.
• I think these [Specks] will be super useful to many, many people in the future (likeasthmatics like myself)...
• I never thought about the invisible particles floating around before. It was interestingto watch the monitor spike and then drop. After the first time, I was more confidentthat the spike would drop again. I totally knew the cause.
• I’ve found it [the Speck] very beneficial as someone who is very concerned about myhealth.
• I have learned a surprising amount about my home and work environment and havefound solutions to problems. I’m breathing easier!
• Mostly the Speck has been fun to have and has certainly been the topic of conver-sation whenever someone sees it for the first time - so it has been good at initiatingconversations about air quality - which is a good thing in my opinion :-)
• I think this [the Speck] is going to a very popular and empowering tool (just imaginethis being used worldwide!)
• I really liked the speck. My whole family participated in following it.
• I found myself checking the display each time I walked past. It was a useful andinteresting data point about our lives that had not been revealed before.
• Overall, it was a good experience. Not hard to set up, easy to monitor and it gaveme a sense of relief to know that the air in my home was basically good as I live neara coke plant that exceeds particulate emission standards many days a year!
• The biggest surprises were how different household activities affected the readings.I had thought opening the windows would freshen the air - not so!... The [Speck]study opened our eyes to all of the ways that we could improve and control the airquality in our home. Fantastic information!
Limitations
While findings from this study did offer useful insight to support our proof of concept,certain aspects of the study design limited the extent to which results could be generalized.A primary drawback was that participants opted into the study and thereby were not arepresentative sample of the larger Pittsburgh population. In particular, people of colorand individuals from lower socio-economic backgrounds were under-represented in or absentfrom our sample. It would be critical to cast a wider net for the next phase of thisresearch, so as to capture more people from communities who are potentially more likelyto experience and be vulnerable to impacts of poor air quality in their homes.
Additionally, the timing of participation was not consistent across all individuals, giventheir varying schedules and availability. As such, participation in the social media conver-sation occurred in phases, with the majority of contributions coming from the first and
21
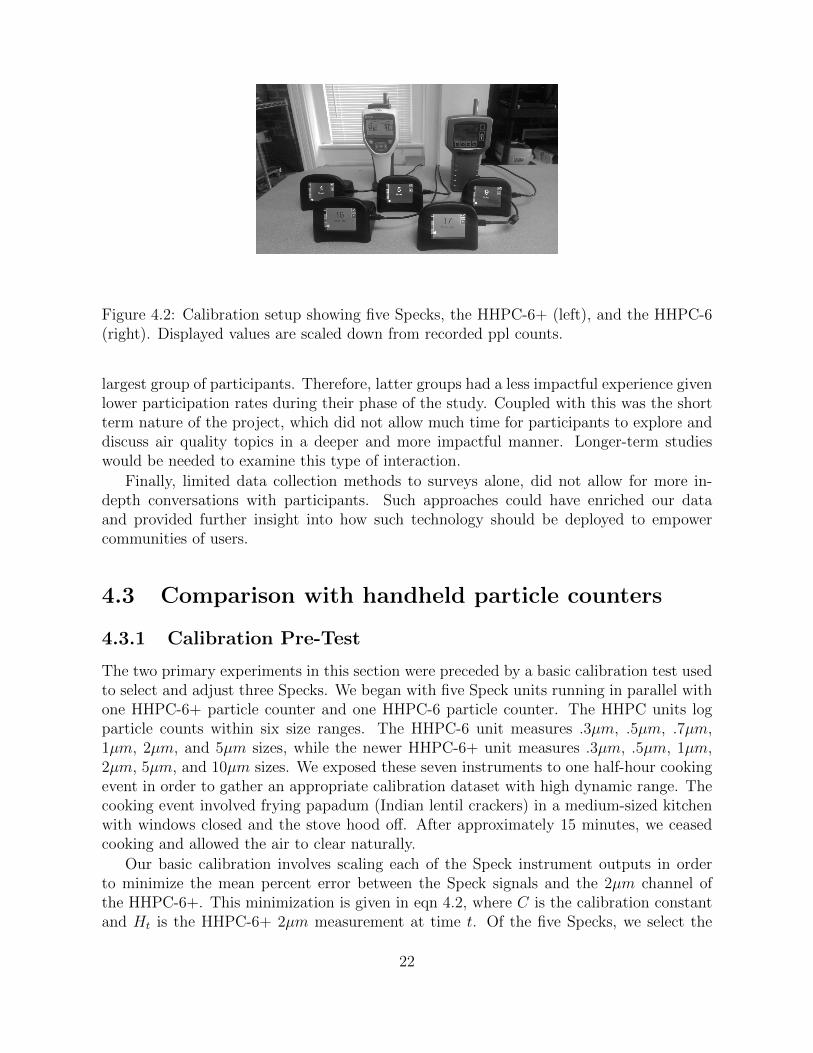
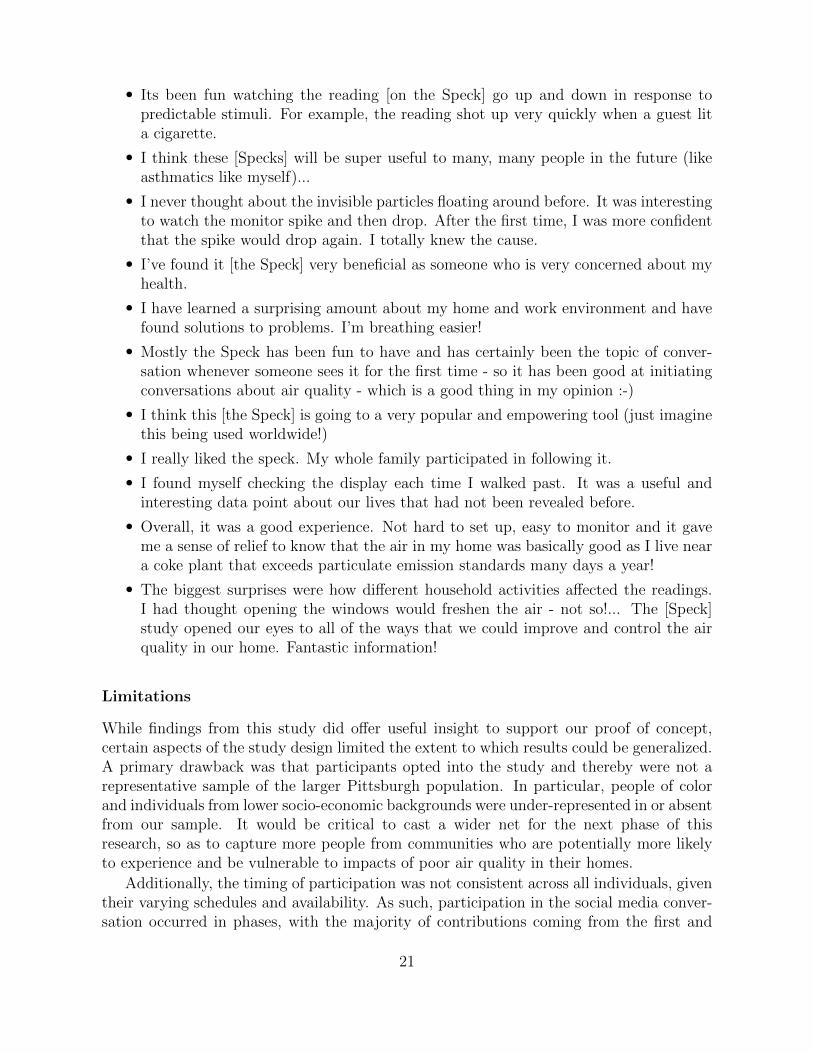
Figure 4.2: Calibration setup showing five Specks, the HHPC-6+ (left), and the HHPC-6(right). Displayed values are scaled down from recorded ppl counts.
largest group of participants. Therefore, latter groups had a less impactful experience givenlower participation rates during their phase of the study. Coupled with this was the shortterm nature of the project, which did not allow much time for participants to explore anddiscuss air quality topics in a deeper and more impactful manner. Longer-term studieswould be needed to examine this type of interaction.
Finally, limited data collection methods to surveys alone, did not allow for more in-depth conversations with participants. Such approaches could have enriched our dataand provided further insight into how such technology should be deployed to empowercommunities of users.
4.3 Comparison with handheld particle counters
4.3.1 Calibration Pre-Test
The two primary experiments in this section were preceded by a basic calibration test usedto select and adjust three Specks. We began with five Speck units running in parallel withone HHPC-6+ particle counter and one HHPC-6 particle counter. The HHPC units logparticle counts within six size ranges. The HHPC-6 unit measures .3µm, .5µm, .7µm,1µm, 2µm, and 5µm sizes, while the newer HHPC-6+ unit measures .3µm, .5µm, 1µm,2µm, 5µm, and 10µm sizes. We exposed these seven instruments to one half-hour cookingevent in order to gather an appropriate calibration dataset with high dynamic range. Thecooking event involved frying papadum (Indian lentil crackers) in a medium-sized kitchenwith windows closed and the stove hood off. After approximately 15 minutes, we ceasedcooking and allowed the air to clear naturally.
Our basic calibration involves scaling each of the Speck instrument outputs in orderto minimize the mean percent error between the Speck signals and the 2µm channel ofthe HHPC-6+. This minimization is given in eqn 4.2, where C is the calibration constantand Ht is the HHPC-6+ 2µm measurement at time t. Of the five Specks, we select the
22
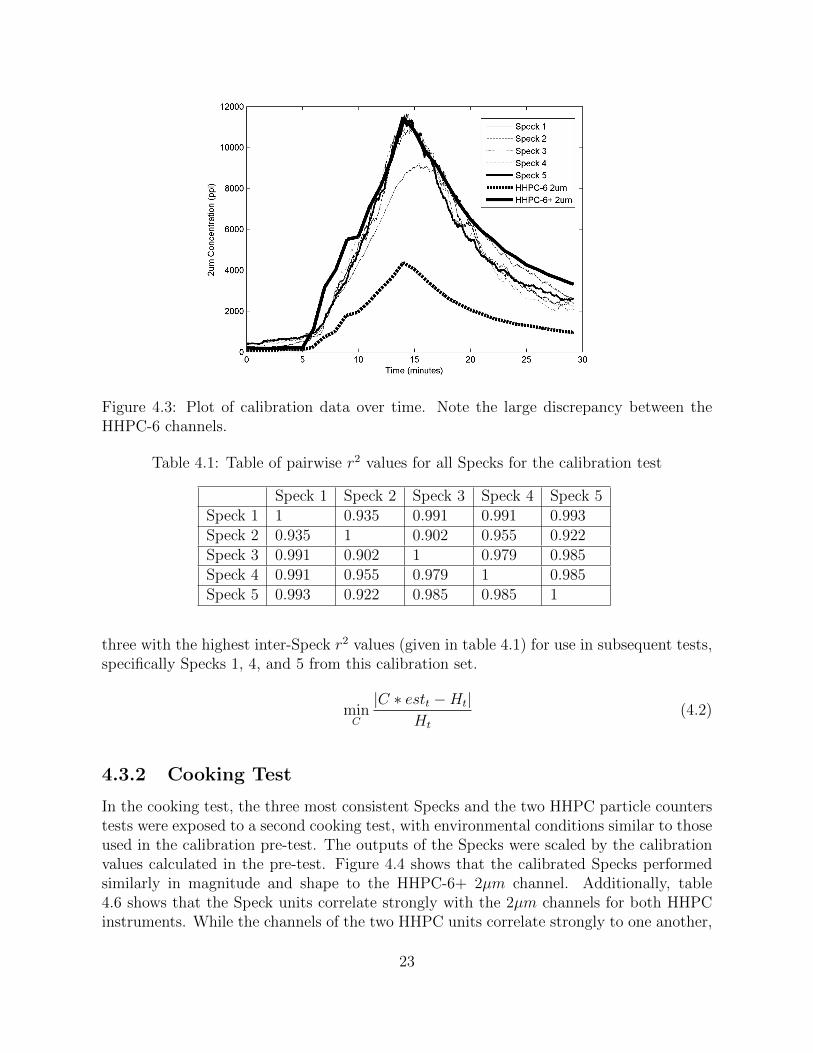
Figure 4.3: Plot of calibration data over time. Note the large discrepancy between theHHPC-6 channels.
Table 4.1: Table of pairwise r2 values for all Specks for the calibration test
Speck 1 Speck 2 Speck 3 Speck 4 Speck 5Speck 1 1 0.935 0.991 0.991 0.993Speck 2 0.935 1 0.902 0.955 0.922Speck 3 0.991 0.902 1 0.979 0.985Speck 4 0.991 0.955 0.979 1 0.985Speck 5 0.993 0.922 0.985 0.985 1
three with the highest inter-Speck r2 values (given in table 4.1) for use in subsequent tests,specifically Specks 1, 4, and 5 from this calibration set.
minC
|C ∗ estt −Ht|Ht
(4.2)
4.3.2 Cooking Test
In the cooking test, the three most consistent Specks and the two HHPC particle counterstests were exposed to a second cooking test, with environmental conditions similar to thoseused in the calibration pre-test. The outputs of the Specks were scaled by the calibrationvalues calculated in the pre-test. Figure 4.4 shows that the calibrated Specks performedsimilarly in magnitude and shape to the HHPC-6+ 2µm channel. Additionally, table4.6 shows that the Speck units correlate strongly with the 2µm channels for both HHPCinstruments. While the channels of the two HHPC units correlate strongly to one another,
23
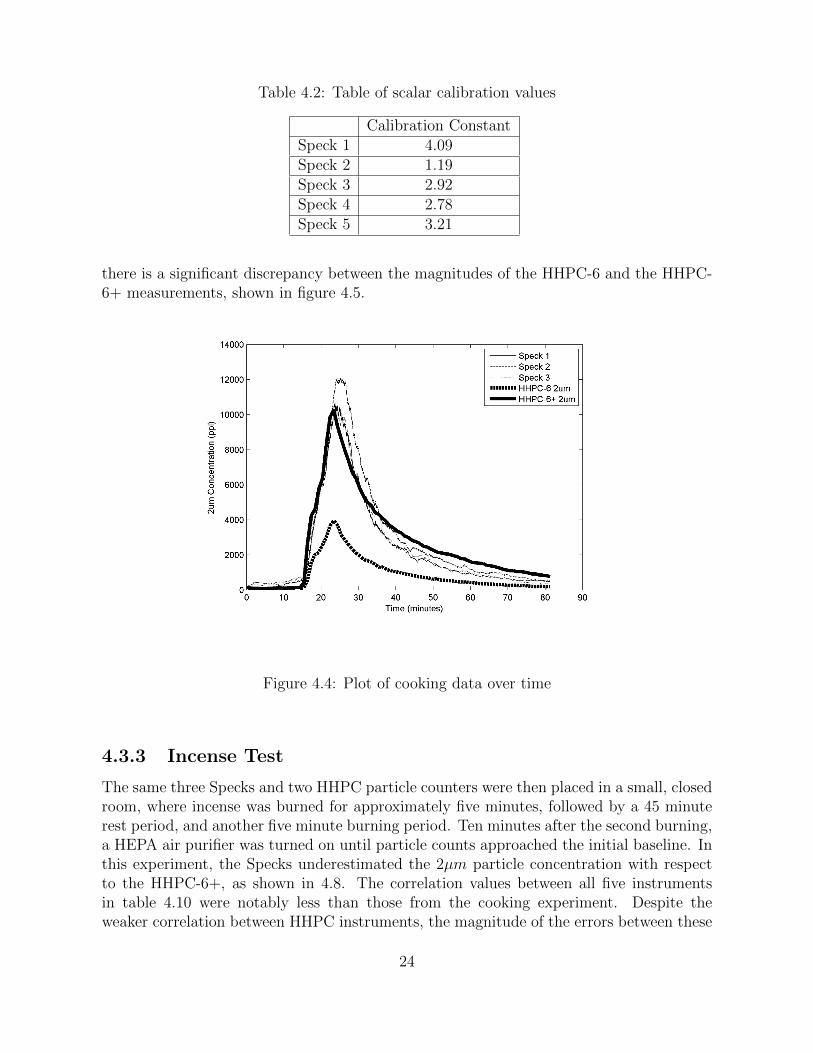
Table 4.2: Table of scalar calibration values
Calibration ConstantSpeck 1 4.09Speck 2 1.19Speck 3 2.92Speck 4 2.78Speck 5 3.21
there is a significant discrepancy between the magnitudes of the HHPC-6 and the HHPC-6+ measurements, shown in figure 4.5.
Figure 4.4: Plot of cooking data over time
4.3.3 Incense Test
The same three Specks and two HHPC particle counters were then placed in a small, closedroom, where incense was burned for approximately five minutes, followed by a 45 minuterest period, and another five minute burning period. Ten minutes after the second burning,a HEPA air purifier was turned on until particle counts approached the initial baseline. Inthis experiment, the Specks underestimated the 2µm particle concentration with respectto the HHPC-6+, as shown in 4.8. The correlation values between all five instrumentsin table 4.10 were notably less than those from the cooking experiment. Despite theweaker correlation between HHPC instruments, the magnitude of the errors between these
24
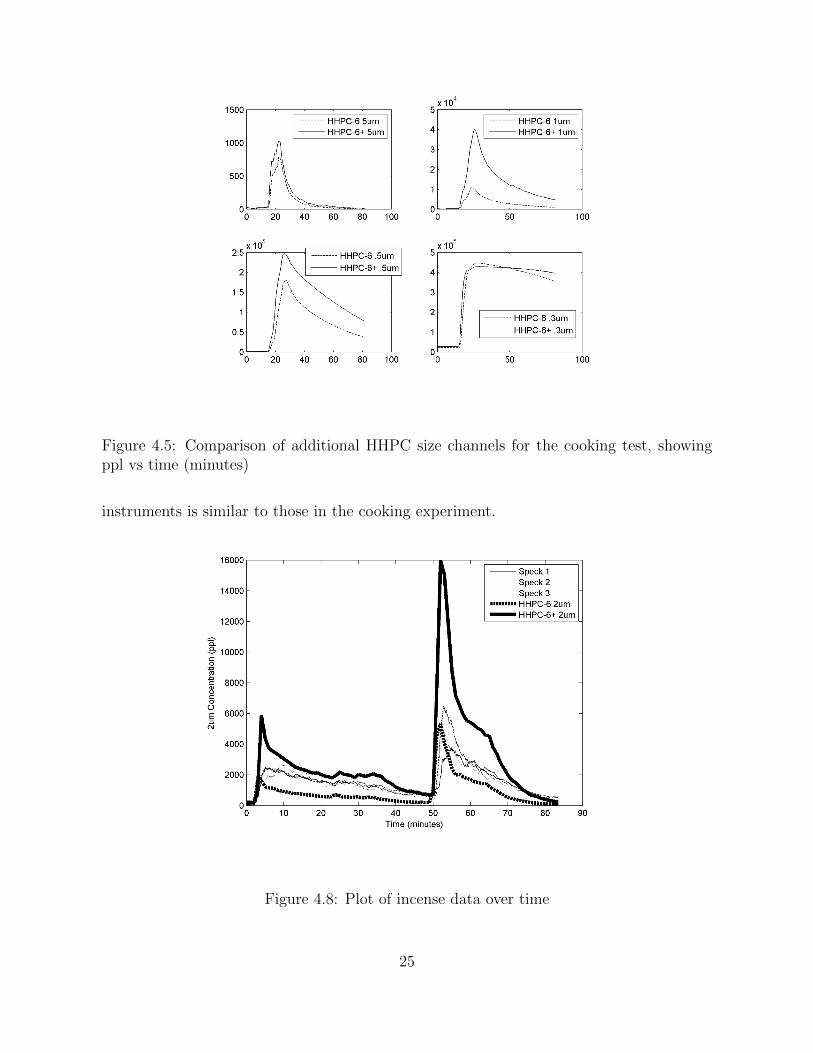
Figure 4.5: Comparison of additional HHPC size channels for the cooking test, showingppl vs time (minutes)
instruments is similar to those in the cooking experiment.
Figure 4.8: Plot of incense data over time
25
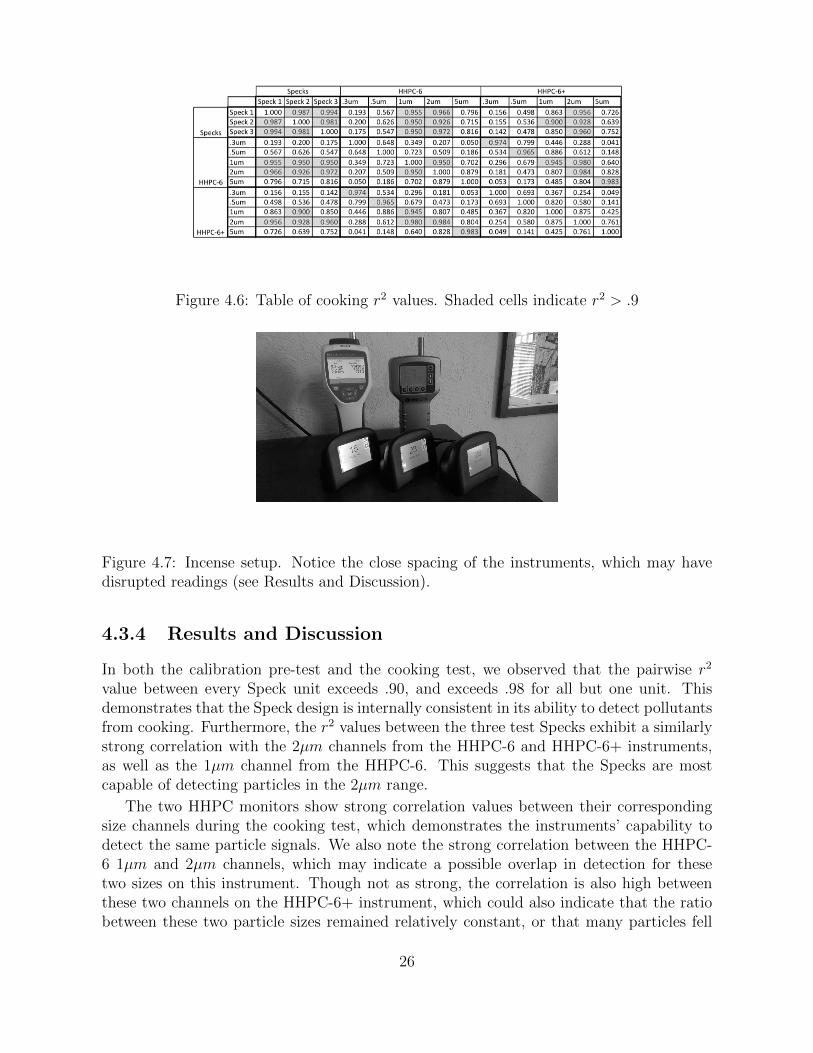
Figure 4.6: Table of cooking r2 values. Shaded cells indicate r2 > .9
Figure 4.7: Incense setup. Notice the close spacing of the instruments, which may havedisrupted readings (see Results and Discussion).
4.3.4 Results and Discussion
In both the calibration pre-test and the cooking test, we observed that the pairwise r2
value between every Speck unit exceeds .90, and exceeds .98 for all but one unit. Thisdemonstrates that the Speck design is internally consistent in its ability to detect pollutantsfrom cooking. Furthermore, the r2 values between the three test Specks exhibit a similarlystrong correlation with the 2µm channels from the HHPC-6 and HHPC-6+ instruments,as well as the 1µm channel from the HHPC-6. This suggests that the Specks are mostcapable of detecting particles in the 2µm range.
The two HHPC monitors show strong correlation values between their correspondingsize channels during the cooking test, which demonstrates the instruments’ capability todetect the same particle signals. We also note the strong correlation between the HHPC-6 1µm and 2µm channels, which may indicate a possible overlap in detection for thesetwo sizes on this instrument. Though not as strong, the correlation is also high betweenthese two channels on the HHPC-6+ instrument, which could also indicate that the ratiobetween these two particle sizes remained relatively constant, or that many particles fell
26
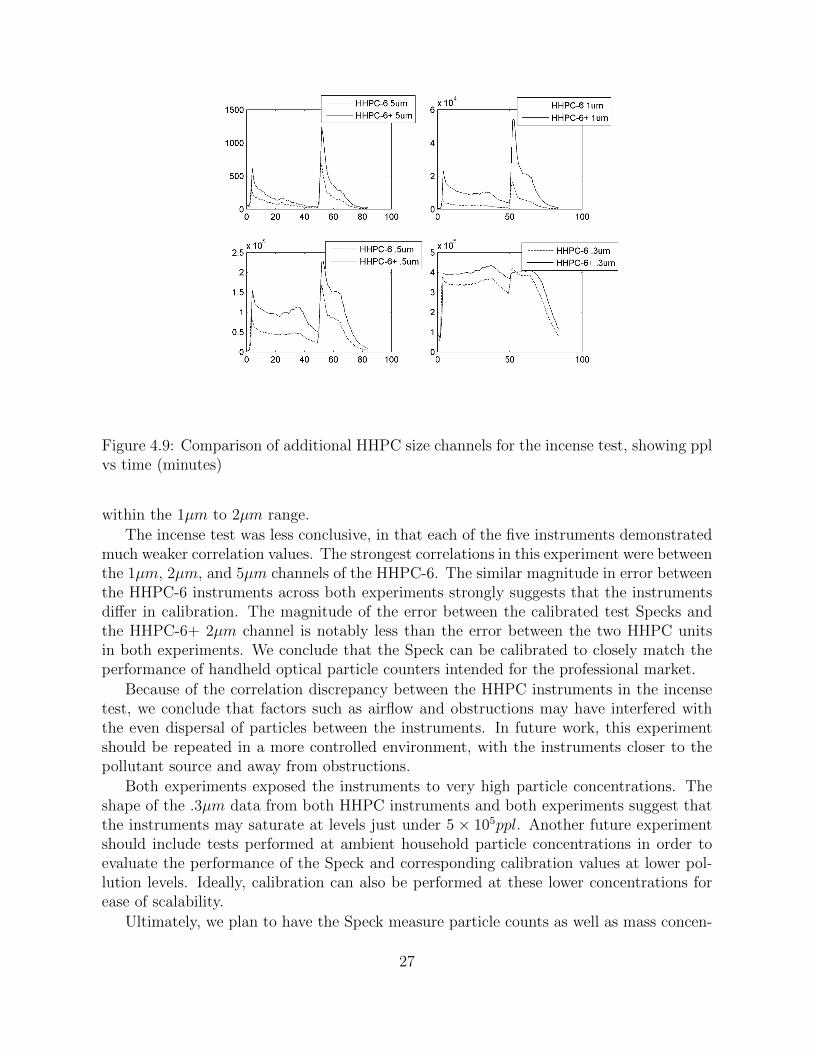
Figure 4.9: Comparison of additional HHPC size channels for the incense test, showing pplvs time (minutes)
within the 1µm to 2µm range.
The incense test was less conclusive, in that each of the five instruments demonstratedmuch weaker correlation values. The strongest correlations in this experiment were betweenthe 1µm, 2µm, and 5µm channels of the HHPC-6. The similar magnitude in error betweenthe HHPC-6 instruments across both experiments strongly suggests that the instrumentsdiffer in calibration. The magnitude of the error between the calibrated test Specks andthe HHPC-6+ 2µm channel is notably less than the error between the two HHPC unitsin both experiments. We conclude that the Speck can be calibrated to closely match theperformance of handheld optical particle counters intended for the professional market.
Because of the correlation discrepancy between the HHPC instruments in the incensetest, we conclude that factors such as airflow and obstructions may have interfered withthe even dispersal of particles between the instruments. In future work, this experimentshould be repeated in a more controlled environment, with the instruments closer to thepollutant source and away from obstructions.
Both experiments exposed the instruments to very high particle concentrations. Theshape of the .3µm data from both HHPC instruments and both experiments suggest thatthe instruments may saturate at levels just under 5 × 10⁵ppl. Another future experimentshould include tests performed at ambient household particle concentrations in order toevaluate the performance of the Speck and corresponding calibration values at lower pol-lution levels. Ideally, calibration can also be performed at these lower concentrations forease of scalability.
Ultimately, we plan to have the Speck measure particle counts as well as mass concen-
27
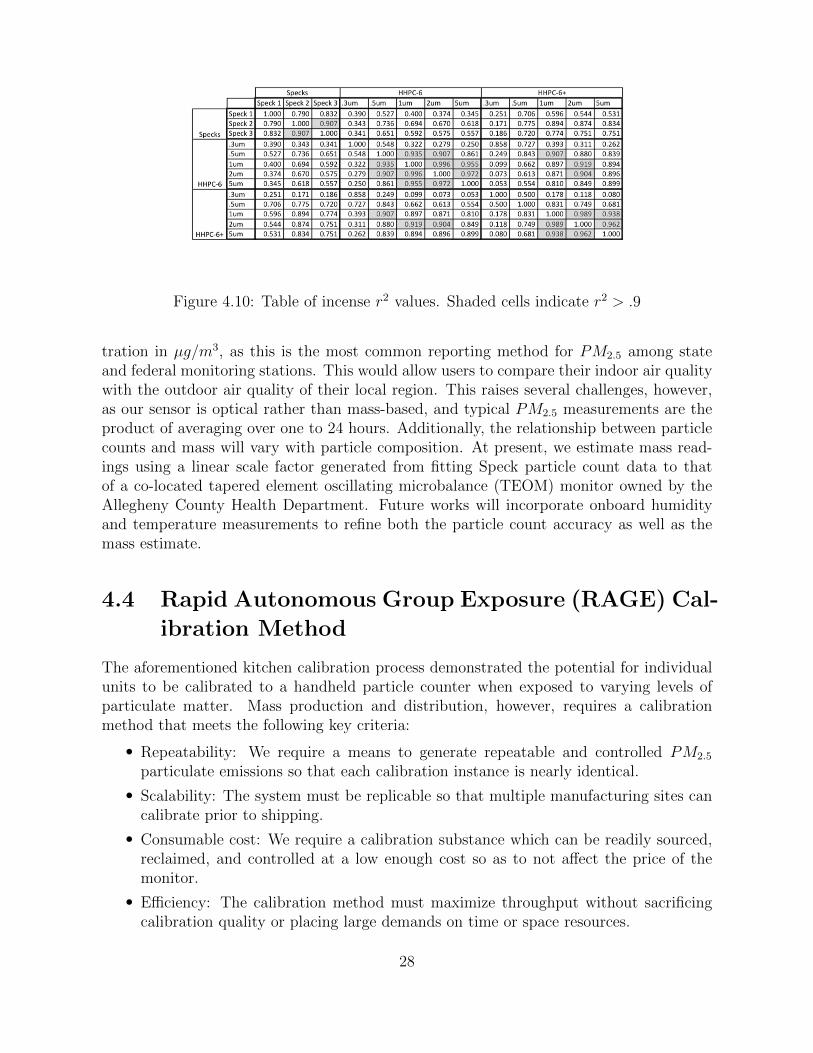
Figure 4.10: Table of incense r2 values. Shaded cells indicate r2 > .9
tration in µg/m3, as this is the most common reporting method for PM2.5 among stateand federal monitoring stations. This would allow users to compare their indoor air qualitywith the outdoor air quality of their local region. This raises several challenges, however,as our sensor is optical rather than mass-based, and typical PM2.5 measurements are theproduct of averaging over one to 24 hours. Additionally, the relationship between particlecounts and mass will vary with particle composition. At present, we estimate mass read-ings using a linear scale factor generated from fitting Speck particle count data to thatof a co-located tapered element oscillating microbalance (TEOM) monitor owned by theAllegheny County Health Department. Future works will incorporate onboard humidityand temperature measurements to refine both the particle count accuracy as well as themass estimate.
4.4 Rapid Autonomous Group Exposure (RAGE) Cal-
ibration Method
The aforementioned kitchen calibration process demonstrated the potential for individualunits to be calibrated to a handheld particle counter when exposed to varying levels ofparticulate matter. Mass production and distribution, however, requires a calibrationmethod that meets the following key criteria:
• Repeatability: We require a means to generate repeatable and controlled PM2.5
particulate emissions so that each calibration instance is nearly identical.
• Scalability: The system must be replicable so that multiple manufacturing sites cancalibrate prior to shipping.
• Consumable cost: We require a calibration substance which can be readily sourced,reclaimed, and controlled at a low enough cost so as to not affect the price of themonitor.
• Efficiency: The calibration method must maximize throughput without sacrificingcalibration quality or placing large demands on time or space resources.
28
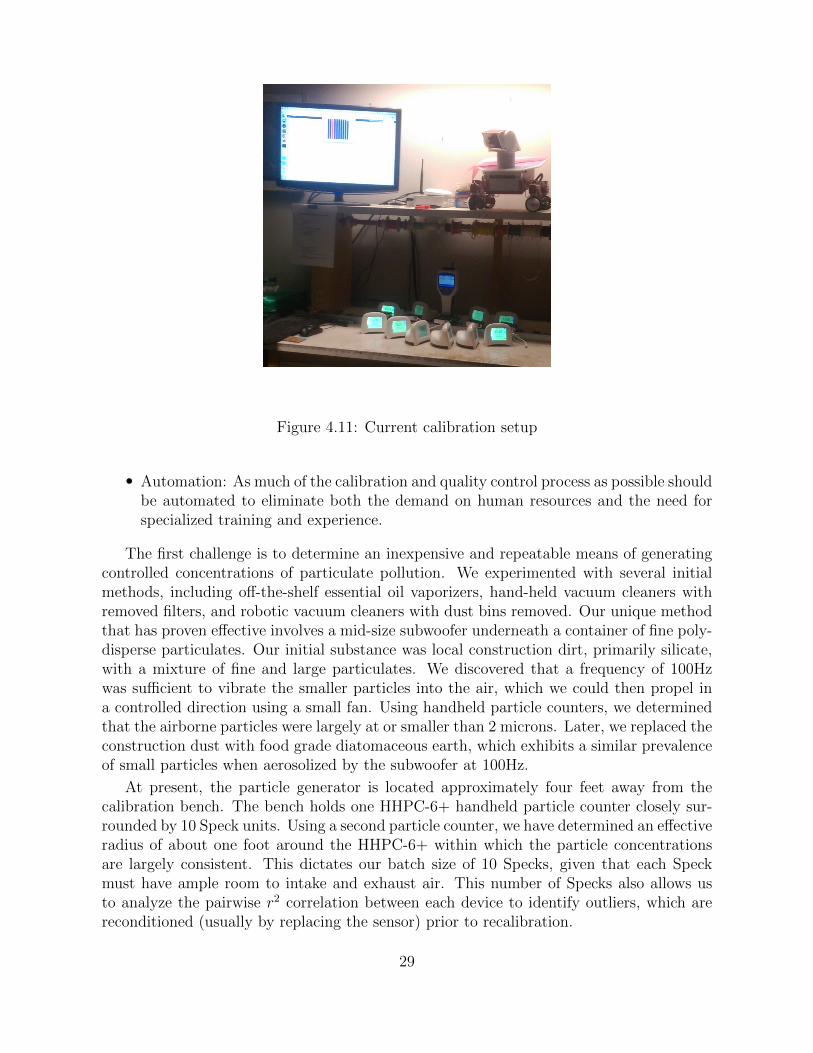
Figure 4.11: Current calibration setup
• Automation: As much of the calibration and quality control process as possible shouldbe automated to eliminate both the demand on human resources and the need forspecialized training and experience.
The first challenge is to determine an inexpensive and repeatable means of generatingcontrolled concentrations of particulate pollution. We experimented with several initialmethods, including off-the-shelf essential oil vaporizers, hand-held vacuum cleaners withremoved filters, and robotic vacuum cleaners with dust bins removed. Our unique methodthat has proven effective involves a mid-size subwoofer underneath a container of fine poly-disperse particulates. Our initial substance was local construction dirt, primarily silicate,with a mixture of fine and large particulates. We discovered that a frequency of 100Hzwas sufficient to vibrate the smaller particles into the air, which we could then propel ina controlled direction using a small fan. Using handheld particle counters, we determinedthat the airborne particles were largely at or smaller than 2 microns. Later, we replaced theconstruction dust with food grade diatomaceous earth, which exhibits a similar prevalenceof small particles when aerosolized by the subwoofer at 100Hz.
At present, the particle generator is located approximately four feet away from thecalibration bench. The bench holds one HHPC-6+ handheld particle counter closely sur-rounded by 10 Speck units. Using a second particle counter, we have determined an effectiveradius of about one foot around the HHPC-6+ within which the particle concentrationsare largely consistent. This dictates our batch size of 10 Specks, given that each Speckmust have ample room to intake and exhaust air. This number of Specks also allows usto analyze the pairwise r2 correlation between each device to identify outliers, which arereconditioned (usually by replacing the sensor) prior to recalibration.
29
The calibration constants are generated by the same means as described in the kitchencalibration tests, producing individual scaling constants that minimizes the percent errorbetween each Speck and the HHPC-6+. Unlike the kitchen tests, however, the constantsare generated in real-time by a host server connected via Wi-Fi to each Speck and viaEthernet to the HHPC-6+. Upon the completion of the calibration batch, calibration filesare automatically written to the host server, where the Specks automatically downloadtheir specific calibration file and begin displaying the new calibrated values.
The operator inspects each Speck visually to confirm functioning touch screens, fans,and Wi-Fi. In addition, the operator ensures that no Speck’s meanr2 coefficient deviatessignificantly from the batch, or that the graphed output of the sensor deviates from that ofthe other Specks or the HHPC-6+. Outliers are immediately removed for reconditioning.
A typical calibration batch takes approximately 20 minutes, yielding 10 Specks perbatch, or 30 per hour, or two minutes per Speck. Within a 20 minute batch, approx-imately five minutes are required for setup, and 15 minutes for particle exposure. Thefirst five minutes of data are unused for calibration as the Specks acclimate to the initialparticle concentration level of 500 2µm particles per liter. After 10 minutes, the particleconcentration is increased to 1000 particles per liter. At minute 15, all Speck calibrationfiles are written and transmitted.
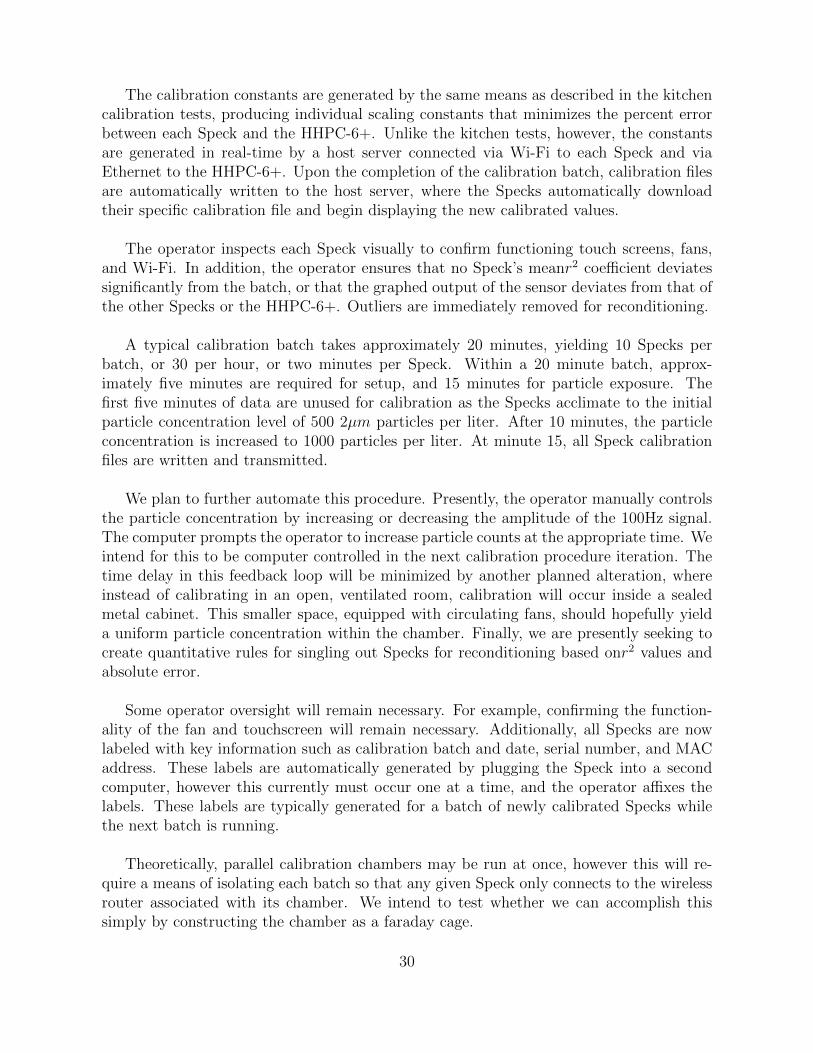
We plan to further automate this procedure. Presently, the operator manually controlsthe particle concentration by increasing or decreasing the amplitude of the 100Hz signal.The computer prompts the operator to increase particle counts at the appropriate time. Weintend for this to be computer controlled in the next calibration procedure iteration. Thetime delay in this feedback loop will be minimized by another planned alteration, whereinstead of calibrating in an open, ventilated room, calibration will occur inside a sealedmetal cabinet. This smaller space, equipped with circulating fans, should hopefully yielda uniform particle concentration within the chamber. Finally, we are presently seeking tocreate quantitative rules for singling out Specks for reconditioning based onr2 values andabsolute error.
Some operator oversight will remain necessary. For example, confirming the function-ality of the fan and touchscreen will remain necessary. Additionally, all Specks are nowlabeled with key information such as calibration batch and date, serial number, and MACaddress. These labels are automatically generated by plugging the Speck into a secondcomputer, however this currently must occur one at a time, and the operator affixes thelabels. These labels are typically generated for a batch of newly calibrated Specks whilethe next batch is running.
Theoretically, parallel calibration chambers may be run at once, however this will re-quire a means of isolating each batch so that any given Speck only connects to the wirelessrouter associated with its chamber. We intend to test whether we can accomplish thissimply by constructing the chamber as a faraday cage.
30
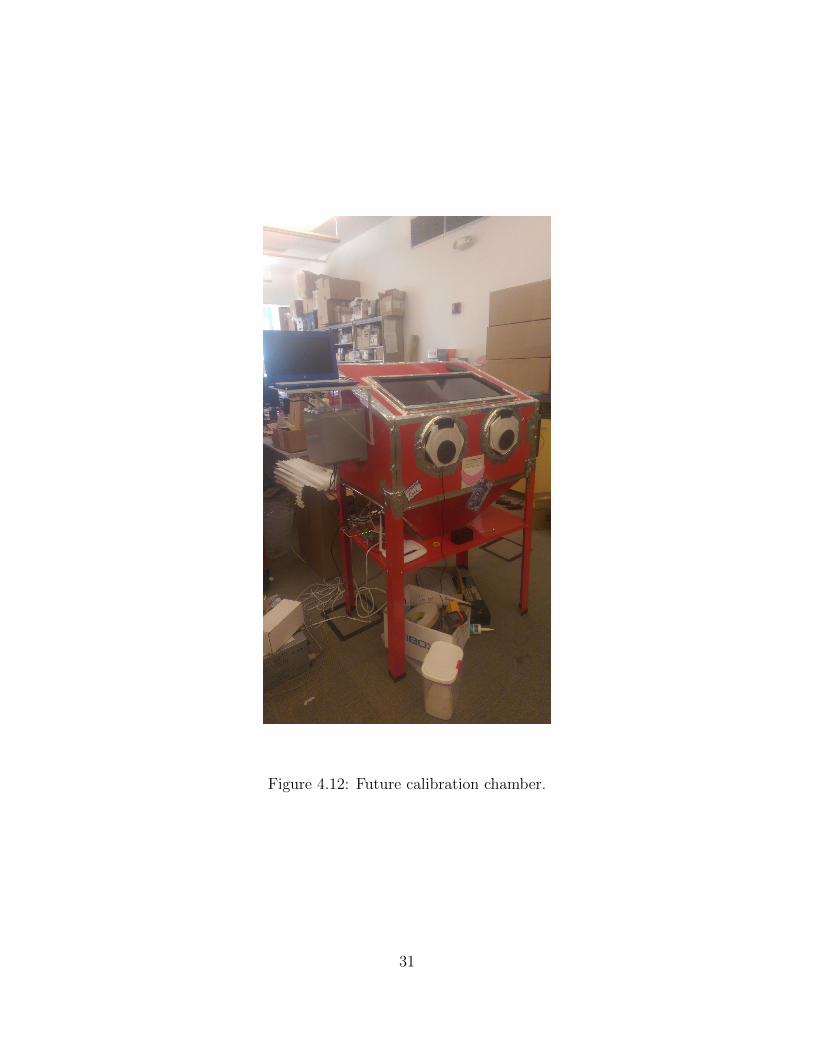
Figure 4.12: Future calibration chamber.
31
Figure 4.13: One week of time-series AQMD data at default device sampling rates
4.5 Comparison with Federal Equivalence Methods
4.5.1 Outdoor tests with South Coast Air Quality ManagementDistrict
In April and May of 2015, the South Coast Air Quality Management District (AQMD)performed one month of colocation tests using two calibrated Specks, one beta attenuationmonitor (BAM) and one GRIMM federal equivalence monitor. Due to technical difficultieswith each of the monitors, only one week of data is available where all four monitors arefunctioning normally. Despite this, the data provides several insights into the performanceof the Speck against federal equivalence monitors, in addition to insight regarding theperformance of the BAM and GRIMM federal equivalence monitors side-by-side. In fig.4.13, we see the unfiltered data as reported by each of the four monitors across a one-week period. The Specks and GRIMM collect samples once per minute, whereas the BAMcollects hourly averages. In order to better examine error and correlation, we convert theSpeck and GRIMM data to one-hour moving averages with timestamps identical to thoserecorded by the BAM, as seen in fig. 4.14.
Some qualitative observations can be made at first glance from fig. 4.14. The hourlyBAM data is somewhat erratic, frequently fluctuating by more than 10 µg/m3 betweenreadings. By contrast, this signal frequency is largely absent from the GRIMM and Speckdata. The GRIMM also consistently reads lower particle concentrations than either theBAM or the two Specks. The median error between the GRIMM and the BAM is approxi-mately a factor of 1.7. This makes assessing the absolute error of the Specks difficult, as thediscrepancy between the federal equivalence monitors leaves uncertainty as to the actual
32
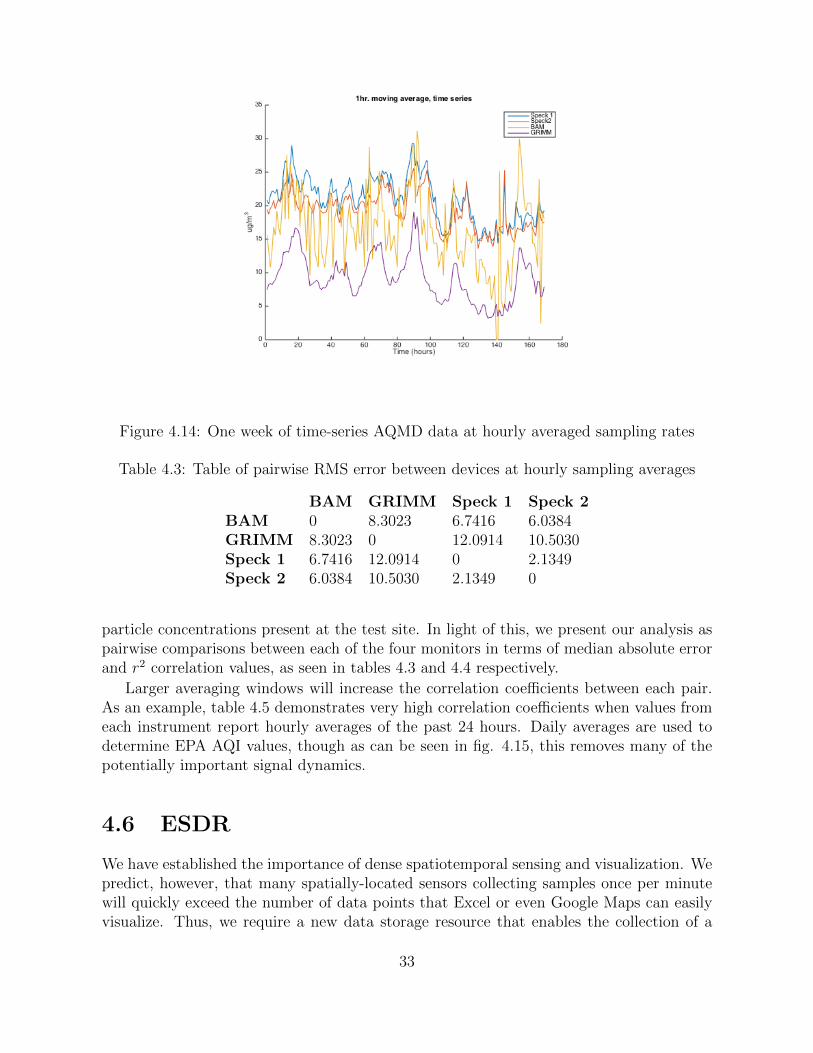
Figure 4.14: One week of time-series AQMD data at hourly averaged sampling rates
Table 4.3: Table of pairwise RMS error between devices at hourly sampling averages
BAM GRIMM Speck 1 Speck 2BAM 0 8.3023 6.7416 6.0384GRIMM 8.3023 0 12.0914 10.5030Speck 1 6.7416 12.0914 0 2.1349Speck 2 6.0384 10.5030 2.1349 0
particle concentrations present at the test site. In light of this, we present our analysis aspairwise comparisons between each of the four monitors in terms of median absolute errorand r2 correlation values, as seen in tables 4.3 and 4.4 respectively.
Larger averaging windows will increase the correlation coefficients between each pair.As an example, table 4.5 demonstrates very high correlation coefficients when values fromeach instrument report hourly averages of the past 24 hours. Daily averages are used todetermine EPA AQI values, though as can be seen in fig. 4.15, this removes many of thepotentially important signal dynamics.
4.6 ESDR
We have established the importance of dense spatiotemporal sensing and visualization. Wepredict, however, that many spatially-located sensors collecting samples once per minutewill quickly exceed the number of data points that Excel or even Google Maps can easilyvisualize. Thus, we require a new data storage resource that enables the collection of a
33
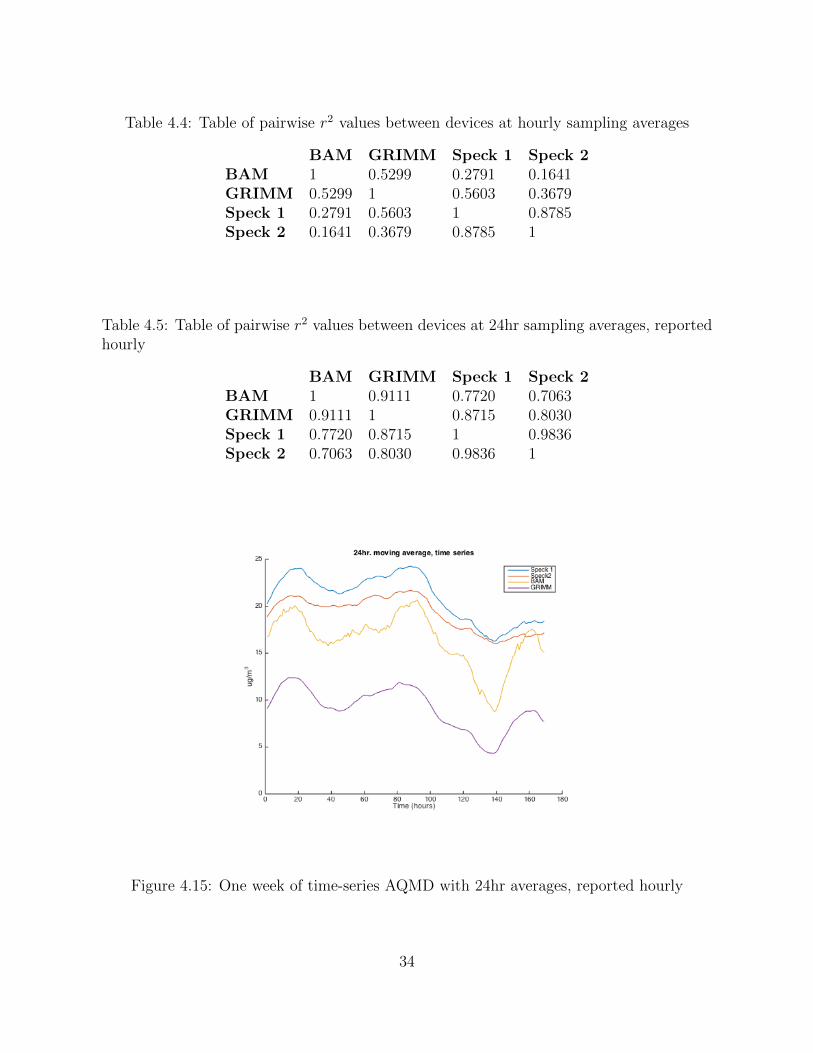
Table 4.4: Table of pairwise r2 values between devices at hourly sampling averages
BAM GRIMM Speck 1 Speck 2BAM 1 0.5299 0.2791 0.1641GRIMM 0.5299 1 0.5603 0.3679Speck 1 0.2791 0.5603 1 0.8785Speck 2 0.1641 0.3679 0.8785 1
Table 4.5: Table of pairwise r2 values between devices at 24hr sampling averages, reportedhourly
BAM GRIMM Speck 1 Speck 2BAM 1 0.9111 0.7720 0.7063GRIMM 0.9111 1 0.8715 0.8030Speck 1 0.7720 0.8715 1 0.9836Speck 2 0.7063 0.8030 0.9836 1
Figure 4.15: One week of time-series AQMD with 24hr averages, reported hourly
34
large amount of data. Additionally, this system must provide a method for interactivedata exploration by both scientists and the public. For data sources that vary greatlywithin short time intervals but also demonstrate longer-term trends, subsampling and datasummaries are important for the data to remain easily decipherable when viewed over longintervals such as months or years. Normally, this would require client-side computation.
Precomputing various summary levels on the server side both eliminates the compu-tational load on the client while providing a bandwidth-efficient means to transmit dataat lower zoom levels (across longer time intervals). Additionally, as with any typical datatiling system, the storage cost increase is only twice that of the raw data.
The ability for users to annotate the data (providing relevant metadata) is an additionalkey feature in encouraging dialogue and shared learning. The combination of context anddata allows for rich storytelling that carries much more rhetorical power than data oranecdotal evidence alone.
We have conducted a large-scale survey of existing data repository systems, both open-source and for-profit, and have established that no extant repository system is able toprovide the features required for a community-based air quality reporting system withauthentication, privacy, annotation, and the ability to handle massive spatial-temporalresolution. Thus, as part of the proposed work, we will develop an open-source Environ-mental Sensor Data Repository (ESDR) customized for these particular requirements.
We have examined existing data repositories and visualization tools, and as shown inTable 1, no current tools have both the features we need for data upload flexibility andexploration. See the data plan for more information on system architecture and datasecurity.
There are several use cases for ESDR, each of which requires a diverse set of visualizationtechniques. Our system will allow for the user to create and tailor views that meet theirinquiries. For example, if a user is interested in personal exposure inside his or her ownhome, a timeline view of the sensor or sensors installed in that location may make the mostsense. This timeline will be zoomable along both the time axis and the vertical value axis.Annotation capabilities will allow the user to mark when specific events such as cookingoccur.
On a community level, multiple individuals may be interested in comparing ambientdata side by side. Stacked timelines may be appropriate for this, which we have demon-strated and implemented in BodyTrack (http://bodytrack.org/info.html) and Fluxtream(https://fluxtream.org/) projects. These too will have adjustable scales and resolutionsfor better comparison.
In other cases, spatial information is important, such as any data collected using thebicycle monitoring kits from GASP. In this case, heat maps (Wilkinson and Friendly, 2009)with variable time ranges and zoomable scales will be essential. We have experience withthis type of visualization, as evidenced by our visualization of 599 AirNow stations fromacross the United States (http://explorables.cmucreatelab.org/explorables/airnow.html).Multiple sources can be used, including any indoor sensors with geolocation whose ownersare open to sharing their data.
Privacy is a major concern, and so any users who are not comfortable with openlysharing their data will have the ability to abstain or to selectively share. It is our hope,
35
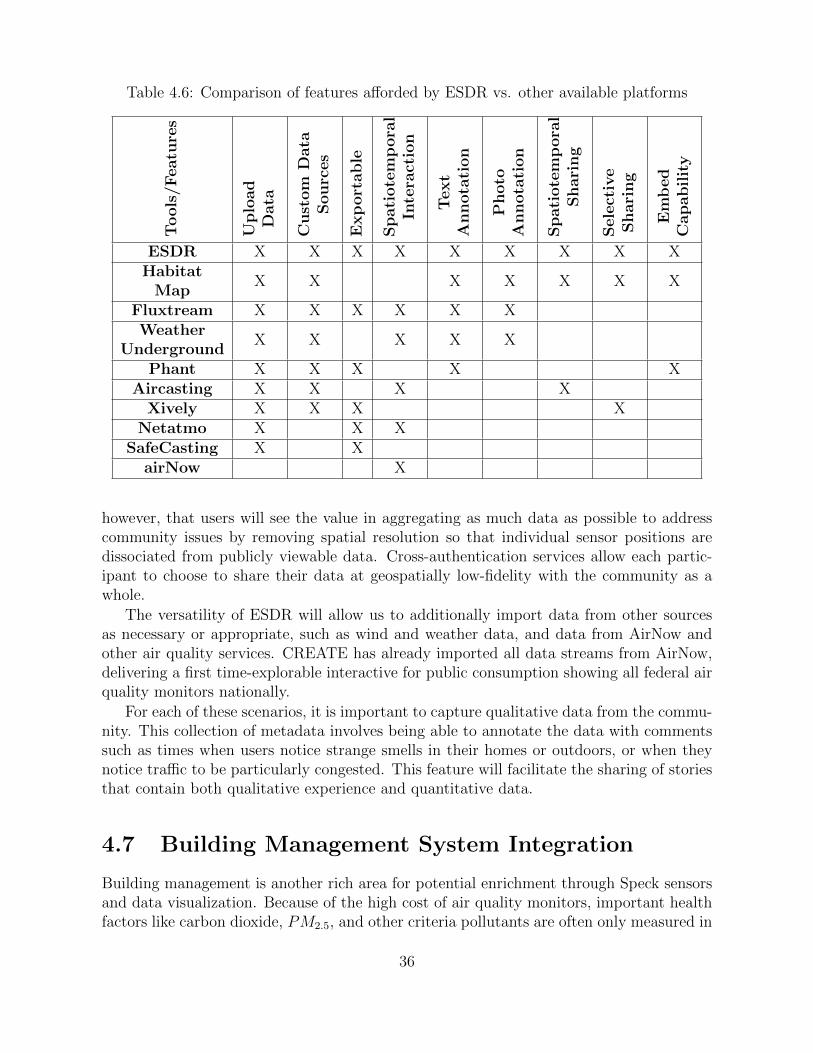
Table 4.6: Comparison of features afforded by ESDR vs. other available platforms
Tools
/Featu
res
Uplo
ad
Data
Cu
stom
Data
Sourc
es
Exp
ort
able
Spati
ote
mp
ora
lIn
tera
ctio
n
Text
An
nota
tion
Ph
oto
An
nota
tion
Sp
ati
ote
mp
ora
lSh
ari
ng
Sele
ctiv
eShari
ng
Em
bed
Capabil
ity
ESDR X X X X X X X X XHabitat
MapX X X X X X X
Fluxtream X X X X X XWeather
UndergroundX X X X X
Phant X X X X XAircasting X X X X
Xively X X X XNetatmo X X X
SafeCasting X XairNow X
however, that users will see the value in aggregating as much data as possible to addresscommunity issues by removing spatial resolution so that individual sensor positions aredissociated from publicly viewable data. Cross-authentication services allow each partic-ipant to choose to share their data at geospatially low-fidelity with the community as awhole.
The versatility of ESDR will allow us to additionally import data from other sourcesas necessary or appropriate, such as wind and weather data, and data from AirNow andother air quality services. CREATE has already imported all data streams from AirNow,delivering a first time-explorable interactive for public consumption showing all federal airquality monitors nationally.
For each of these scenarios, it is important to capture qualitative data from the commu-nity. This collection of metadata involves being able to annotate the data with commentssuch as times when users notice strange smells in their homes or outdoors, or when theynotice traffic to be particularly congested. This feature will facilitate the sharing of storiesthat contain both qualitative experience and quantitative data.
4.7 Building Management System Integration
Building management is another rich area for potential enrichment through Speck sensorsand data visualization. Because of the high cost of air quality monitors, important healthfactors like carbon dioxide, PM2.5, and other criteria pollutants are often only measured in
36
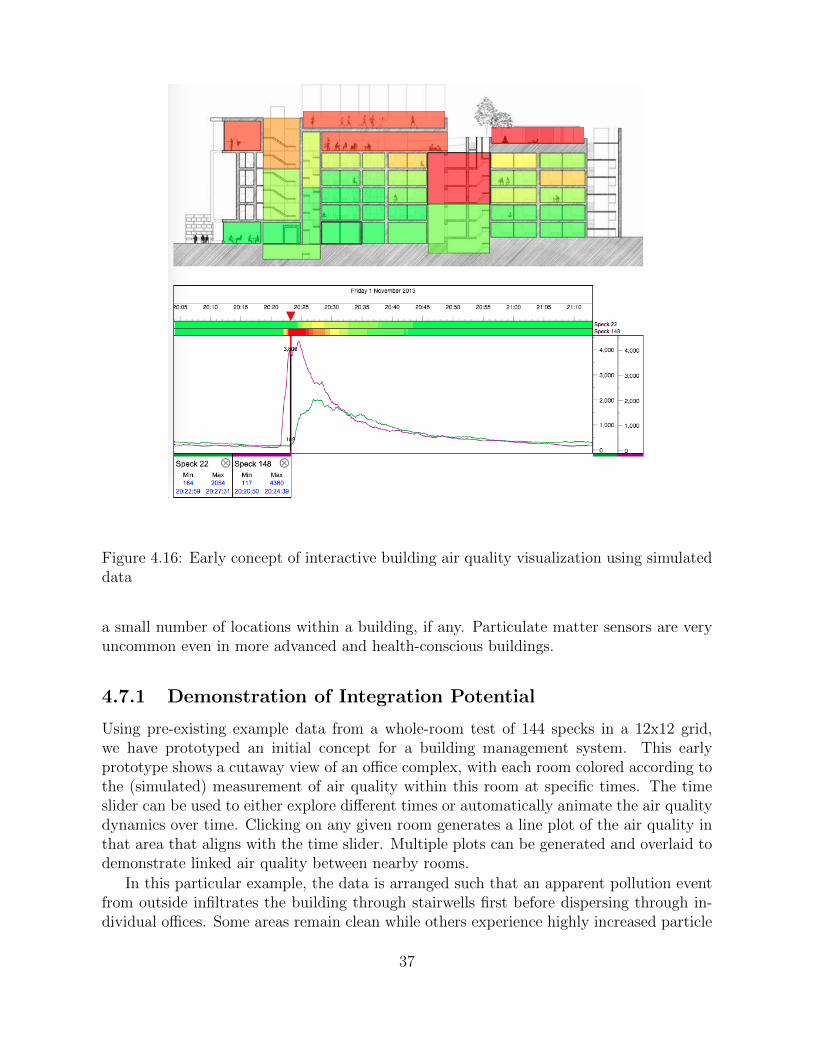
Figure 4.16: Early concept of interactive building air quality visualization using simulateddata
a small number of locations within a building, if any. Particulate matter sensors are veryuncommon even in more advanced and health-conscious buildings.
4.7.1 Demonstration of Integration Potential
Using pre-existing example data from a whole-room test of 144 specks in a 12x12 grid,we have prototyped an initial concept for a building management system. This earlyprototype shows a cutaway view of an office complex, with each room colored according tothe (simulated) measurement of air quality within this room at specific times. The timeslider can be used to either explore different times or automatically animate the air qualitydynamics over time. Clicking on any given room generates a line plot of the air quality inthat area that aligns with the time slider. Multiple plots can be generated and overlaid todemonstrate linked air quality between nearby rooms.
In this particular example, the data is arranged such that an apparent pollution eventfrom outside infiltrates the building through stairwells first before dispersing through in-dividual offices. Some areas remain clean while others experience highly increased particle
37
concentrations.The usefulness of such a visualization for real buildings with real-time air quality data
is that it can enable building managers to identify effective strategies for ventilating thebuilding to optimize both energy usage and air quality. Built-in temperature and humiditysensors can help building managers to estimate occupant comfort levels. Furthermore, thefuture addition of carbon dioxide sensors give a simultaneous indication of air freshness inaddition to occupancy levels. If carbon dioxide levels or particle concentration levels arehigh, an articulate HVAC system can circulate new, filtered air into those areas. Addition-ally, external building sensors can be used to control how much air is recirculated versushow much new air to draw in from outside.
Such a system also has Human Resources benefits as well. By identifying the officeswith the cleanest air, managers can proactively offer these spaces to employees with knownbreathing conditions, those who may be pregnant, and other sensitive populations. Thismay help to simultaneously increase productivity and employee comfort while reducing therate of workplace illnesses.
4.7.2 Newell Simon Trial Deployment
The low cost and small size of the Speck, in addition to its wireless connectivity, will allowbuilding managers to densely install air quality sensors in areas of interest such as offices,open workspaces, and factory floors. These sensors can be easily moved and reconfiguredas necessary and do not require planned or pre-existing infrastructure beyond wirelessconnectivity and power. We predict that the Speck will not require additional calibrationor maintenance beyond simply cleaning the optics with canned air, so the cost of thisincreased capability does not greatly exceed the cost of initial installation. In preparationfor our first major deployment of Speck sensors on the Infosys campus, we installed fiveSpeck sensors on the third and fourth floors of Newell Simon Hall on Carnegie MellonUniversity’s campus. These sensors were spatially distributed in a combination of openand closed spaces. One sensor each on the third and fourth floors are located in openareas. While this initial deployment was very sparse because of the currently high demandand low supply of Specks, the data collected from these five units were intended to give usexample data from the following locations:
- Unoccupied double-occupant offices- Regularly occupied double-occupant offices- Intermittently occupied multi-occupant offices- Copy and printer rooms- Regularly occupied offices with constant open hallway airflowThe only campus wireless SSID that the Specks can connect to is unsecured, but requires
all MAC addresses to be pre-approved. More importantly, however, is the fact that thisnetwork seems to have a hidden SSID and broadcasts weakly and intermittently. As aresult, two of five Specks are typically behind on ESDR. This raises an important questionfor future deployments, however, regarding how real-time visualizations should deal withstale or absent data. We will address this in the thesis work for Infosys deployments.
38
Chapter 5
Proposed Work
5.1 Calibration Refinement
We have established the necessity of individual calibration for low-cost air quality sensorsin previous chapters. Manufacturing differences inherent in complex but low-cost devicesensures that no single set of calibration values will work for all sensors. Additionally, theimportance of quality control procedures is much higher than in many other consumerdevices because users will be basing important health decisions around the readings shownby their device, often in comparison with local federal monitors, co-located Specks, orSpecks owned by nearby neighbors. As described previously, in order to keep cost low andreliability high, our calibration system must be judged based on the following criteria:
• Repeatability: We require a means to generate repeatable and controlled PM2.5
particulate emissions so that each calibration instance is nearly identical.
• Scalability: The system must be replicable so that multiple manufacturing sites cancalibrate prior to shipping.
• Consumable cost: We require a calibration substance which can be readily sourced,reclaimed, and controlled at a low enough cost so as to not affect the price of themonitor.
• Efficiency: The calibration method must maximize throughput without sacrificingcalibration quality or placing large demands on time or space resources.
• Automation: As much of the calibration and quality control process as possible shouldbe automated to eliminate both the demand on human resources and the need forspecialized training and experience.
We already have a largely automated system with the potential to meet all of thesegoals, however, further improvements can be made to enhance our adherence to each ofthese criteria.
Automatic regulation of particle concentrations can be done via a feedback controlloop between the HHPC-6+ reference instrument and the amplitude of the 100Hz audiosignal. This will increase repeatability as well as automation, since it removes the cognitiveload of the operator significantly. It also reduces the observed tendency for operators to
39
overestimate the degree and rate to which the amplitude should be increased due to thesignificant time taken for additional particles to become airborne, cover the devices, andachieve equilibrium. The calibration particle signal will thus be more consistent and stable.
Encasing the entire calibration system within a smaller enclosure (as opposed to anopen room) will reduce this time lag, thus making automatic control simpler. It also in-creases repeatability by eliminating external factors such as air currents in the ventilatedopen room. Scalability is improved because these calibration chambers can be producedidentically and in quantity, allowing for other calibration locations to have identical equip-ment and environments. If multiple calibration chambers can be used in the same locationvia Wi-Fi isolation, efficiency is also increased by improving parallelism and throughput.Additionally, whereas it is currently not possible to reclaim used particles from an openroom, some particles may be reclaimed from a closed chamber by emptying an underlyinghopper collection system. This reduces consumable cost.
We also plan to make the particle source smaller, such that a smaller amount of cali-bration substance (likely to remain food-grade diatomaceous earth) can be used. This alsoreduces consumable cost, and the source can be replenished after every calibration batchusing a fixed quantity of particles to improve repeatability.
Additional automation improvements may be possible through the use of automaticallyprinted labels and on-screen messages identifying which labels should be affixed to whichSpecks. These on-screen messages can also be used to identify Specks for reconditioningbased on new quantified rules for Specks whose dynamics deviate from simultaneouslycalibrated units, or whose calibration data does not meet a maximum error threshold incomparison to the reference instrument.
Finally, if we are able to improve the repeatability and quality of the calibration processsignificantly, then the HHPC-6+ can be replaced with a single trusted and well-calibratedSpeck. These master Specks will be calibrated and individually assessed by a calibrationspecialist against the HHPC-6+ to ensure that they will be an appropriate substitute for thereference instrument. Thus, calibration for consumer Specks can be achieved for lower costusing a process with one degree of separation from the HHPC-6+ monitor, eliminatingthe need for multiples of these expensive monitors in one location. Recalibration andregular cleaning of the reference Specks can be performed at regular intervals as determinedthrough our initial testing.
5.2 Large-scale community deployment
A section of this thesis will focus on the impact of Specks in individuals and communities.Specifically, we will seek to qualitatively and quantitatively understand and improve theeffect of Specks on the empowerment of individuals to understand and control their airquality. The first step toward this goal is to collectively determine the definition and di-mensions of empowerment in conjunction with Carnegie Mellon’s Environment and PublicPolicy program. We will achieve this in collaboration with faculty members and graduatestudents who are familiar with the codification of empowerment in other domains suchas social safety and awareness. The Speck will be used in student self-guided capstone
40
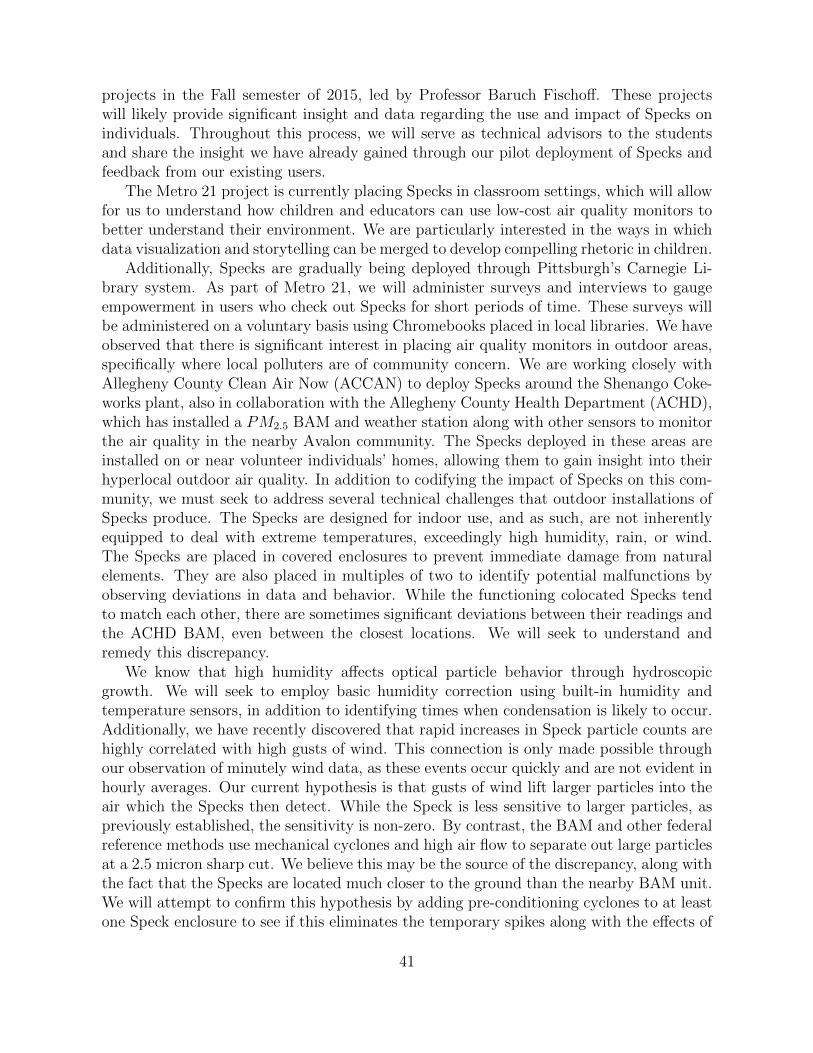
projects in the Fall semester of 2015, led by Professor Baruch Fischoff. These projectswill likely provide significant insight and data regarding the use and impact of Specks onindividuals. Throughout this process, we will serve as technical advisors to the studentsand share the insight we have already gained through our pilot deployment of Specks andfeedback from our existing users.
The Metro 21 project is currently placing Specks in classroom settings, which will allowfor us to understand how children and educators can use low-cost air quality monitors tobetter understand their environment. We are particularly interested in the ways in whichdata visualization and storytelling can be merged to develop compelling rhetoric in children.
Additionally, Specks are gradually being deployed through Pittsburgh’s Carnegie Li-brary system. As part of Metro 21, we will administer surveys and interviews to gaugeempowerment in users who check out Specks for short periods of time. These surveys willbe administered on a voluntary basis using Chromebooks placed in local libraries. We haveobserved that there is significant interest in placing air quality monitors in outdoor areas,specifically where local polluters are of community concern. We are working closely withAllegheny County Clean Air Now (ACCAN) to deploy Specks around the Shenango Coke-works plant, also in collaboration with the Allegheny County Health Department (ACHD),which has installed a PM2.5 BAM and weather station along with other sensors to monitorthe air quality in the nearby Avalon community. The Specks deployed in these areas areinstalled on or near volunteer individuals’ homes, allowing them to gain insight into theirhyperlocal outdoor air quality. In addition to codifying the impact of Specks on this com-munity, we must seek to address several technical challenges that outdoor installations ofSpecks produce. The Specks are designed for indoor use, and as such, are not inherentlyequipped to deal with extreme temperatures, exceedingly high humidity, rain, or wind.The Specks are placed in covered enclosures to prevent immediate damage from naturalelements. They are also placed in multiples of two to identify potential malfunctions byobserving deviations in data and behavior. While the functioning colocated Specks tendto match each other, there are sometimes significant deviations between their readings andthe ACHD BAM, even between the closest locations. We will seek to understand andremedy this discrepancy.
We know that high humidity affects optical particle behavior through hydroscopicgrowth. We will seek to employ basic humidity correction using built-in humidity andtemperature sensors, in addition to identifying times when condensation is likely to occur.Additionally, we have recently discovered that rapid increases in Speck particle counts arehighly correlated with high gusts of wind. This connection is only made possible throughour observation of minutely wind data, as these events occur quickly and are not evident inhourly averages. Our current hypothesis is that gusts of wind lift larger particles into theair which the Specks then detect. While the Speck is less sensitive to larger particles, aspreviously established, the sensitivity is non-zero. By contrast, the BAM and other federalreference methods use mechanical cyclones and high air flow to separate out large particlesat a 2.5 micron sharp cut. We believe this may be the source of the discrepancy, along withthe fact that the Specks are located much closer to the ground than the nearby BAM unit.We will attempt to confirm this hypothesis by adding pre-conditioning cyclones to at leastone Speck enclosure to see if this eliminates the temporary spikes along with the effects of
41
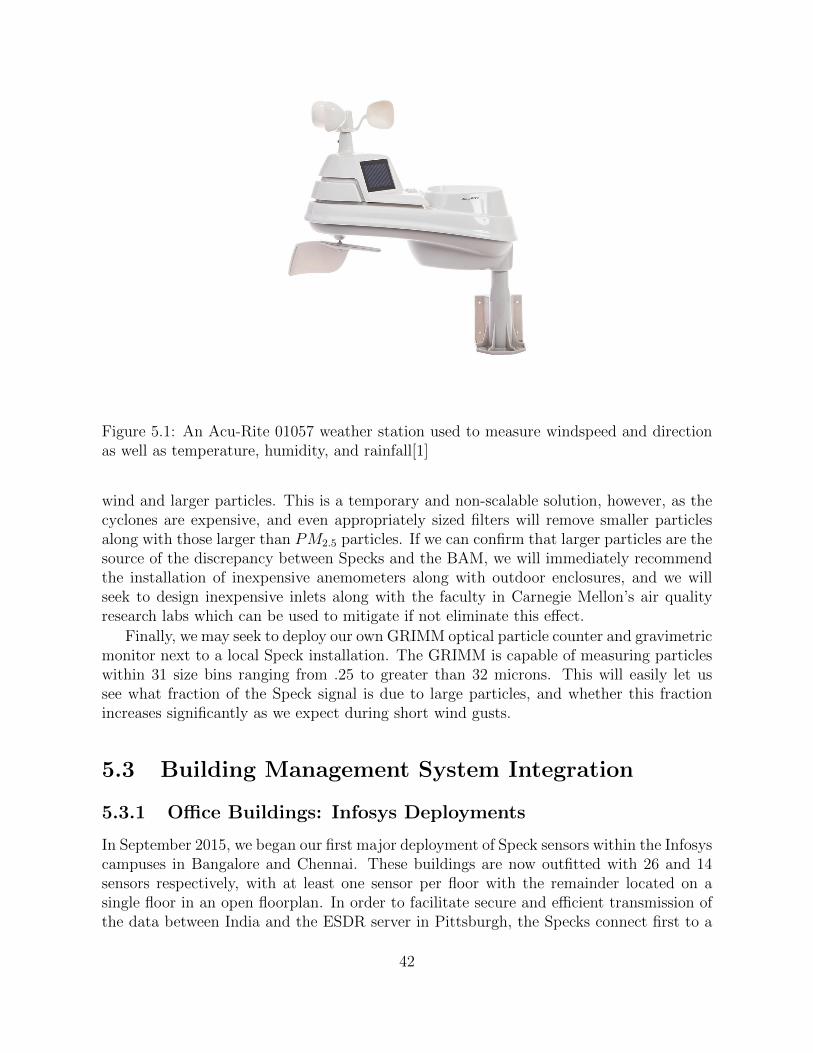
Figure 5.1: An Acu-Rite 01057 weather station used to measure windspeed and directionas well as temperature, humidity, and rainfall[1]
wind and larger particles. This is a temporary and non-scalable solution, however, as thecyclones are expensive, and even appropriately sized filters will remove smaller particlesalong with those larger than PM2.5 particles. If we can confirm that larger particles are thesource of the discrepancy between Specks and the BAM, we will immediately recommendthe installation of inexpensive anemometers along with outdoor enclosures, and we willseek to design inexpensive inlets along with the faculty in Carnegie Mellon’s air qualityresearch labs which can be used to mitigate if not eliminate this effect.
Finally, we may seek to deploy our own GRIMM optical particle counter and gravimetricmonitor next to a local Speck installation. The GRIMM is capable of measuring particleswithin 31 size bins ranging from .25 to greater than 32 microns. This will easily let ussee what fraction of the Speck signal is due to large particles, and whether this fractionincreases significantly as we expect during short wind gusts.
5.3 Building Management System Integration
5.3.1 Office Buildings: Infosys Deployments
In September 2015, we began our first major deployment of Speck sensors within the Infosyscampuses in Bangalore and Chennai. These buildings are now outfitted with 26 and 14sensors respectively, with at least one sensor per floor with the remainder located on asingle floor in an open floorplan. In order to facilitate secure and efficient transmission ofthe data between India and the ESDR server in Pittsburgh, the Specks connect first to a
42
local Raspberry Pi based server, which then makes the single secure outgoing connection toESDR. The Raspberry Pi also generates and hosts formatted Speck data which is accessibleby campus BACnet systems already in place for building management.
For this initial deployment, we will continue using our existing personal monitor tech-nology as a proof of concept. While the system is functional, it is not suited for widespreaddeployment because of the difficulty of adapting the home monitors to a secure office cam-pus. During installation, we gained key experience that we will use to co-design air qualitymonitoring technology specifically for building management. The following is a list of keyhardware changes to be made:
• Change the form factor to a wall or ceiling mount design to avoid protruding intowalking spaces
• Eliminate or reduce on-device screen and emphasize use of networked visualizations
• Make the device permanently mountable to prevent theft or tampering
• Upgrade WiFi chip to be capable of secure WPA2 Enterprise encryption
• Potentially integrate reliable CO2, temperature, and humidity capability
• Potentially enable any device to be hardwired and act as a BACnet gateway
• Potentially upgrade particle sensor or use multiple sensors in each unit for redundancy
With a device capable of measuring particulate matter, CO2, temperature, and hu-midity, we will have created a monitor that can measure the key parameters for occupantcomfort as well as air quality factors that are related to health and productivity. For largecampuses, many building sensors are used directly in the loop for ventilation, heating, andcooling automation. We will work to integrate our technology with existing building man-agement systems, for example those from Automated Logic or Johnson Controls. Some ofthese software products are designed to allow building managers to add a variety of sensorsand devices as long as they communicate using common protocols such as BACnet. Timeand resources permitting, we will conduct a second deployment to demonstrate the use ofbuilding sensor prototypes and software integration for control of building features. First,we will simulate building automation by comparing the prescribed behavior from installedsensors with the automated behavior from existing air quality monitors. When it is evidentthat sensor accuracy and reliability are high enough to control real building parameterswithout adversely affecting occupant comfort or productivity, we will begin testing actualautomation.
At the end of this deployment, we will perform a cost-benefit analysis of our system fora variety of building sizes and configurations. We will develop recommendations for sensorplacement density, installation guidelines, and estimated return-on-investment rates basedon predicted changes in occupant productivity.
5.4 Visualization concepts for building management
The utility of a building management system is largely dependent on the way in whichit presents data to stakeholders. We have identified the importance of spatiotemporal
43
data visualization, and have developed several key technologies that may be of use inbuilding management scenarios. While most existing building management platforms areprimarily concerned with presenting data to those in charge of operating and monitoringthe building’s systems, we identify three classes of stakeholders with different sets of needs,each of which can be designed for separately.
5.4.1 Visualization for occupants
Occupants may wish to know their immediate environmental conditions. Most frequently,they are likely to be interested in temperature. In manufacturing environments, air qualitymay also be of natural interest. With the ability to view temperature, humidity, CO2 levels,and particulate matter measurements in real time, however, we expect individuals to gaina better understanding of how these factors influence their comfort and productivity. Onekey aspect of designing for occupants will be that these readings should be presentedon-demand rather than spontaneously in order to avoid inducing placebo effects. Whileoccupants may be interested in historical data as well, we predict that their primary interestwill be in current local conditions, so their visualization portal may resemble a dashboardor dock on their computer or phone. Additionally, not all occupants may have accessto data from the entire campus, and may be restricted both for security and simplicityreasons. While these are our initial assumptions, we will conduct user studies to determinewhat is needed and appropriate for this group.
5.4.2 Visualization for management
This class of visualizations will draw largely from existing systems, augmented with ourown visualization technology. If possible, we will directly integrate into an existing build-ing management software package such as WebCTRL in order to maximize impact andfamiliarity among existing users. We will conduct user studies here as well in order topresent building managers with the most useful information. It is likely that these userswill need to view the data on adjustable spatiotemporal scales, either at a whole-campus,floor by floor, or partition level. WebCTRL currently allows for regional viewing as wellas subsystem viewing for heating, cooling, and ventilation. Timeline viewing of historicaldata will be important for identifying trends, as well as a method of viewing cyclical pat-terns on a daily, weekly, monthly, or yearly basis. Potentially, quantities such as a comfortindex can also be calculated and visualized using a combination of sensor data, such astemperature and humidity.
5.4.3 Visualization for building evaluation
Upper management and marketing may also be interested in visualizing climate and airquality data. In these cases, users may desire easily-explorable summaries, similar to thosefor building management teams but with less granularity and more generalization. Thesesummaries may be used for promotion of environmental technologies, broad evaluation of
44

working conditions, and potential marketing to clients who may lease the space in the caseof independent building owners.
45

46

Chapter 6
Schedule of Work
The three thrusts of this thesis, being the Device Focus, Community Focus, and BuildingManagement Focus, will be undertaken largely in parallel due to each of these becomingactivated in the latter half of 2015.
Most of the Device Focus work will occur early in 2016, as we have need of a new devicedesign due to the discontinuation of several key components. We will ideally complete thisdesign in the first third of 2016, after which we will characterize this sensor extensivelyalongside federal monitors as well as other personal monitors that are rapidly becomingavailable.
The Metro21 library deployments are currently in progress, and we will be collectingdata from library users over the coming months. We will use this along with customerfeedback and projects conducted by the Fall 2015 EPP class using Speck to improve edu-cational resources on our website to better help people understand and use their Speck dataon fine particulate matter. In parallel, we will test the device (ideally prototypes of thesecond version) in more robust outdoor enclosures to attempt to discover if interferencesfrom wind and external conditions can be eliminated or minimized.
We have currently developed a first prototype of a building management visualizationbased on the Bangalore deployment. This visualization is not integrated with any existingsystems, however, and will undergo significant refinement in the first third of 2016. Work todesign an integrated building monitor will commence in the Spring, and shortly thereafter,we will begin work on building automation integration using the current deployment. If asecond deployment can be made, we will transition to using those monitors for automationas well.
The Fall of 2016 will be used to finalize documentation and write the thesis manuscript,to be presented in December.
47
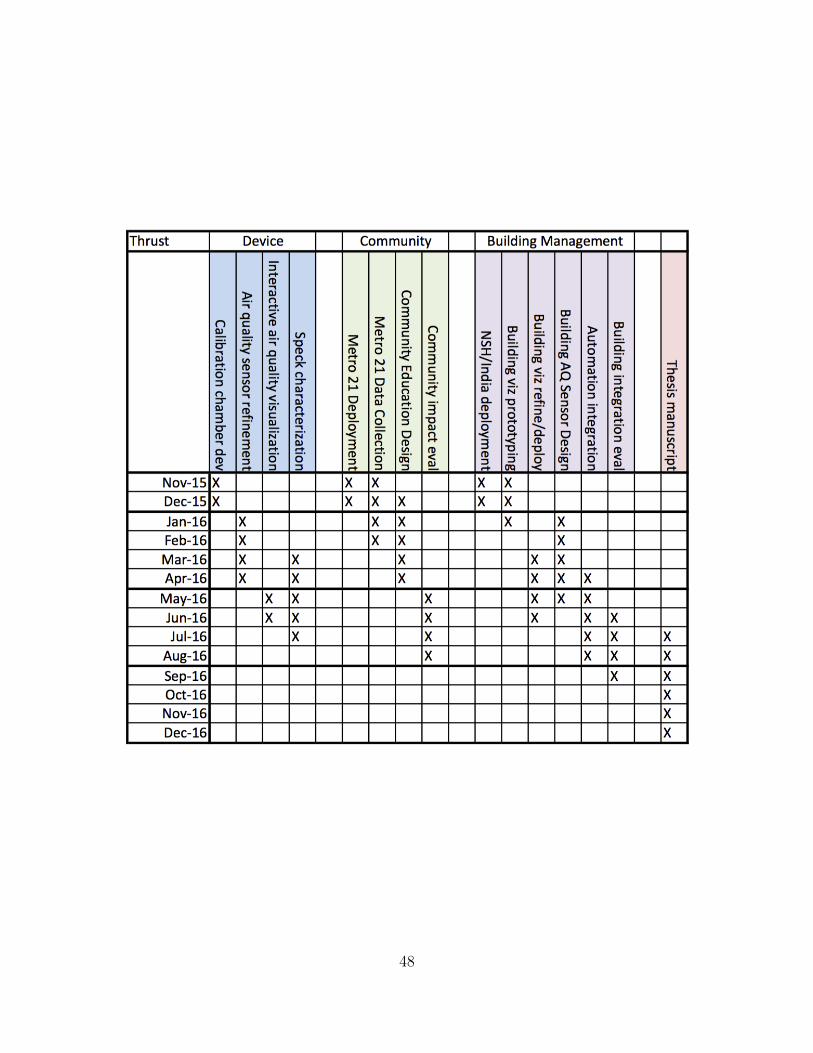
48
Chapter 7
Contributions
7.1 Calibration and Characterization
As previously mentioned, efficient and effective calibration is necessary for low-cost sensorsto become an important part of a monitoring ecosystem. The calibration techniques de-scribed in this thesis along with the quality control methods employed are generalizable toother sensors as well. These generalizations can be used by others seeking to develop low-cost but accurate sensors or monitors by enabling multi-sensor calibration and comparativequality control.
Additionally, the characterization presented in this thesis can be used as a basis forcharacterizing other sensors as well by highlighting the limitations of traditional compar-ative techniques like correlation coefficients and cumulative absolute error. The value ofappropriate filters and real-world evaluation conditions will be emphasized, along with thequalitative importance of a sensor’s ability to detect events of significance and interest.
7.2 Community Resources
Proper integration of personal low-cost monitors into society requires that we provide ameans for individuals to obtain proper data fluency and an understanding of the parame-ters they seek to measure, such as fine particulate matter. In this thesis, we will presenteducational resources and interactive visualizations that promote intuition of spatiotem-poral data and an exploratory mindset for determining environmental causes and effects,specifically focused on air quality and health.
We will also present methods for dispersing low-cost monitors throughout communitiesusing libraries, citizen science groups, and educational outreach. We will demonstrate theimportance of community in understanding data in larger regional contexts.
49

7.3 Building Management
This thesis will explore the means by which air quality data can become a staple of buildingmanagement. We will demonstrate the added value to building managers of measuringparameters such as fine particulates and CO2 in the context of comfort indices and occupantproductivity. The prototype building monitors will demonstrate the potential of integratedtemperature, humidity, CO2 and fine particulate sensors into a single unit which can easilybe installed in existing buildings because of wireless communication.
The building visualizations developed in this thesis will show that environmental datain the workplace can be of common interest to building occupants and managers alike.Finally, we will explore and present new methods of using this spatially distributed datato identify and model environmental patterns, and subsequently create automation rulesto regulate comfort and clean air.
50
Appendix A
Pilot Study Surveys
51
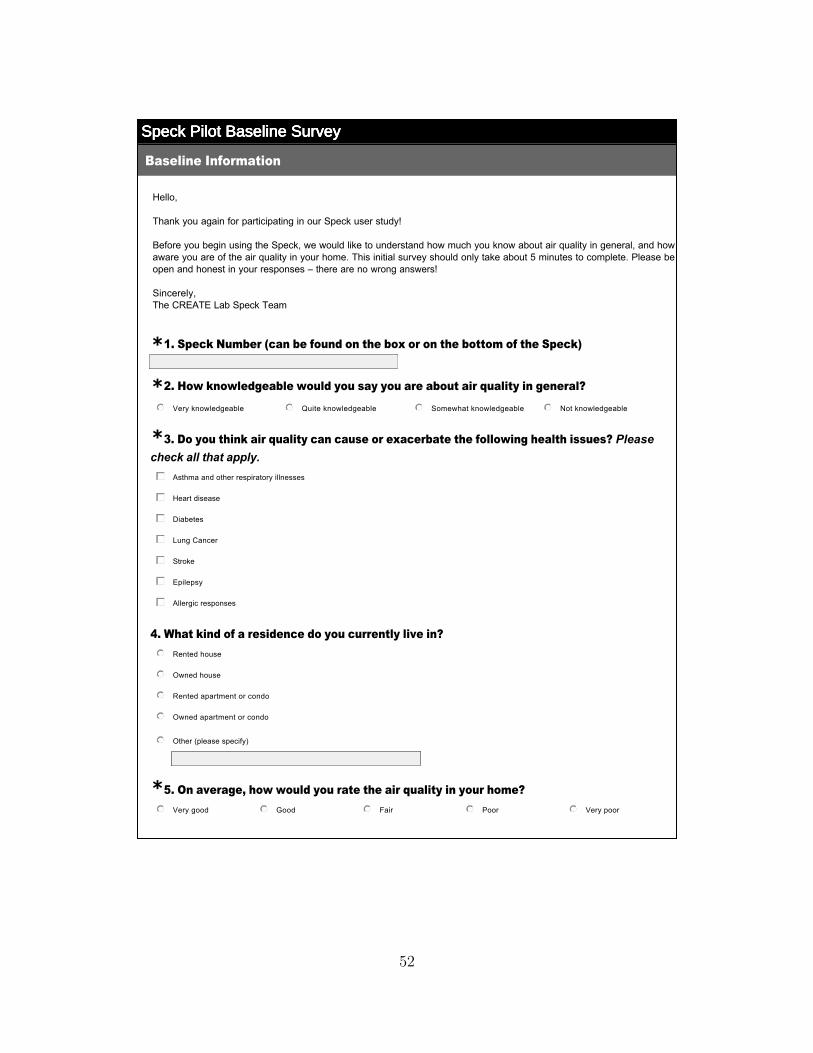
Speck Pilot Baseline SurveySpeck Pilot Baseline SurveySpeck Pilot Baseline SurveySpeck Pilot Baseline Survey
Hello, Thank you again for participating in our Speck user study! Before you begin using the Speck, we would like to understand how much you know about air quality in general, and how aware you are of the air quality in your home. This initial survey should only take about 5 minutes to complete. Please be open and honest in your responses – there are no wrong answers! Sincerely, The CREATE Lab Speck Team
1. Speck Number (can be found on the box or on the bottom of the Speck)
2. How knowledgeable would you say you are about air quality in general?
Baseline Information
*
*
3. Do you think air quality can cause or exacerbate the following health issues? Please check all that apply.
4. What kind of a residence do you currently live in?
5. On average, how would you rate the air quality in your home?
*
*
Very knowledgeable
nmlkj Quite knowledgeable
nmlkj Somewhat knowledgeable
nmlkj Not knowledgeable
nmlkj
Asthma and other respiratory illnesses
gfedc
Heart disease
gfedc
Diabetes
gfedc
Lung Cancer
gfedc
Stroke
gfedc
Epilepsy
gfedc
Allergic responses
gfedc
Rented house
nmlkj
Owned house
nmlkj
Rented apartment or condo
nmlkj
Owned apartment or condo
nmlkj
Other (please specify)
nmlkj
Very good
nmlkj Good
nmlkj Fair
nmlkj Poor
nmlkj Very poor
nmlkj
52

Speck Pilot Baseline SurveySpeck Pilot Baseline SurveySpeck Pilot Baseline SurveySpeck Pilot Baseline Survey6. Are you confident that you will know what actions to take, if you learned that your
indoor air quality was poor?*
7. What do you think are some of the sources of pollution inside your home? Please check all that apply.
8. Are you aware of what kind of air filtration system is installed in your home?
9. Do you have a hood vent or ventilation fan over your stove?
*
*
*
Very confident
nmlkj Quite confident
nmlkj Somewhat confident
nmlkj Not confident
nmlkj
Cooking
gfedc
Vacuuming
gfedc
Smoking
gfedc
Microwave oven
gfedc
Gas heating
gfedc
Fireplace
gfedc
Open windows
gfedc
Insulation
gfedc
Refrigerator
gfedc
Other (please specify)
gfedc
Yes
nmlkj
No
nmlkj
I don't have one
nmlkj
Yes
nmlkj
No
nmlkj
I don't know
nmlkj
53
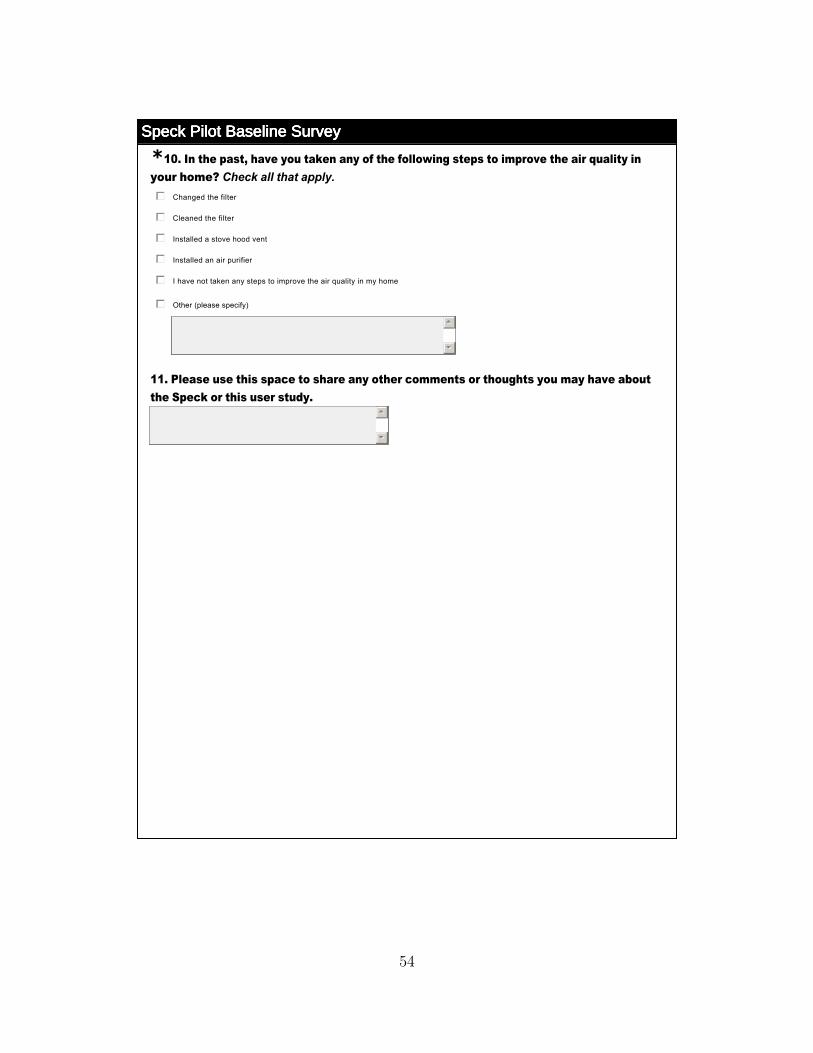
Speck Pilot Baseline SurveySpeck Pilot Baseline SurveySpeck Pilot Baseline SurveySpeck Pilot Baseline Survey10. In the past, have you taken any of the following steps to improve the air quality in
your home? Check all that apply.
11. Please use this space to share any other comments or thoughts you may have about the Speck or this user study.
*
55
66
Changed the filter
gfedc
Cleaned the filter
gfedc
Installed a stove hood vent
gfedc
Installed an air purifier
gfedc
I have not taken any steps to improve the air quality in my home
gfedc
Other (please specify)
gfedc
55
66
54
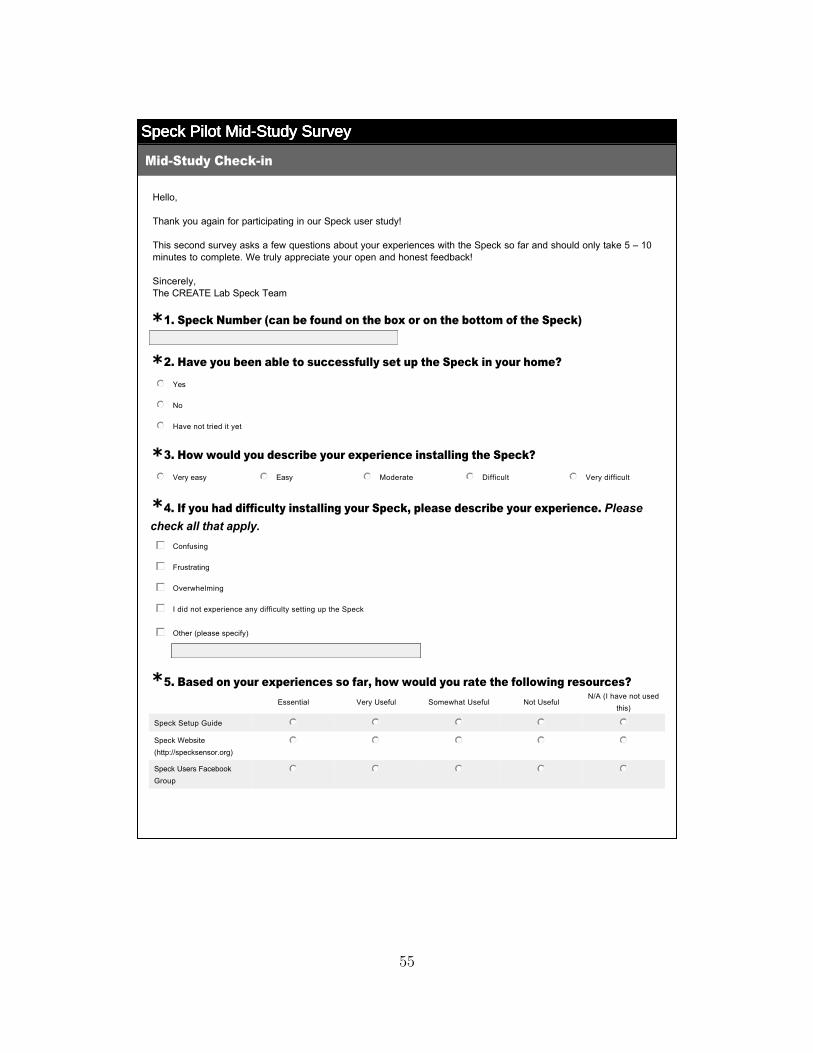
Speck Pilot Mid-Study SurveySpeck Pilot Mid-Study SurveySpeck Pilot Mid-Study SurveySpeck Pilot Mid-Study Survey
Hello, Thank you again for participating in our Speck user study! This second survey asks a few questions about your experiences with the Speck so far and should only take 5 – 10 minutes to complete. We truly appreciate your open and honest feedback! Sincerely, The CREATE Lab Speck Team
1. Speck Number (can be found on the box or on the bottom of the Speck)
2. Have you been able to successfully set up the Speck in your home?
3. How would you describe your experience installing the Speck?
MidStudy Checkin
*
*
*
4. If you had difficulty installing your Speck, please describe your experience. Please check all that apply.
5. Based on your experiences so far, how would you rate the following resources?
*
*Essential Very Useful Somewhat Useful Not Useful
N/A (I have not used this)
Speck Setup Guide nmlkj nmlkj nmlkj nmlkj nmlkj
Speck Website (http://specksensor.org)
nmlkj nmlkj nmlkj nmlkj nmlkj
Speck Users Facebook Group
nmlkj nmlkj nmlkj nmlkj nmlkj
Yes
nmlkj
No
nmlkj
Have not tried it yet
nmlkj
Very easy
nmlkj Easy
nmlkj Moderate
nmlkj Difficult
nmlkj Very difficult
nmlkj
Confusing
gfedc
Frustrating
gfedc
Overwhelming
gfedc
I did not experience any difficulty setting up the Speck
gfedc
Other (please specify)
gfedc
55

Speck Pilot Mid-Study SurveySpeck Pilot Mid-Study SurveySpeck Pilot Mid-Study SurveySpeck Pilot Mid-Study Survey6. If you saw a spike in the Speck reading in the past week, how did that make you feel?
Please check all that apply.
7. If you saw a drop in the Speck reading in the past week, how did that make you feel? Please check all that apply.
8. Have you become aware of or learned anything new about the air quality in your home after using the Speck? Please explain briefly.
9. Based on readings you’ve seen on the Speck during the past week, have you made any changes in your home to improve the air quality? Please briefly explain your response.
10. Please use this space to comment on the experiences you've had so far with the Speck and supporting material (setup guide, website and Facebook group) .
*
*
55
66
*
Yes, I have:
Not yet, but I plan to:
No, I have not and don't plan to:
55
66
Nervous
gfedc
Stressed
gfedc
Uncertain about what to do
gfedc
Curious to find the source
gfedc
Motivated to fix the issue
gfedc
Skeptical about the reading
gfedc
I did not see a spike
gfedc
Satisfied
gfedc
Relieved
gfedc
Confused
gfedc
Motivated to identify the cause
gfedc
Skeptical about the reading
gfedc
I did not see a drop
gfedc
56
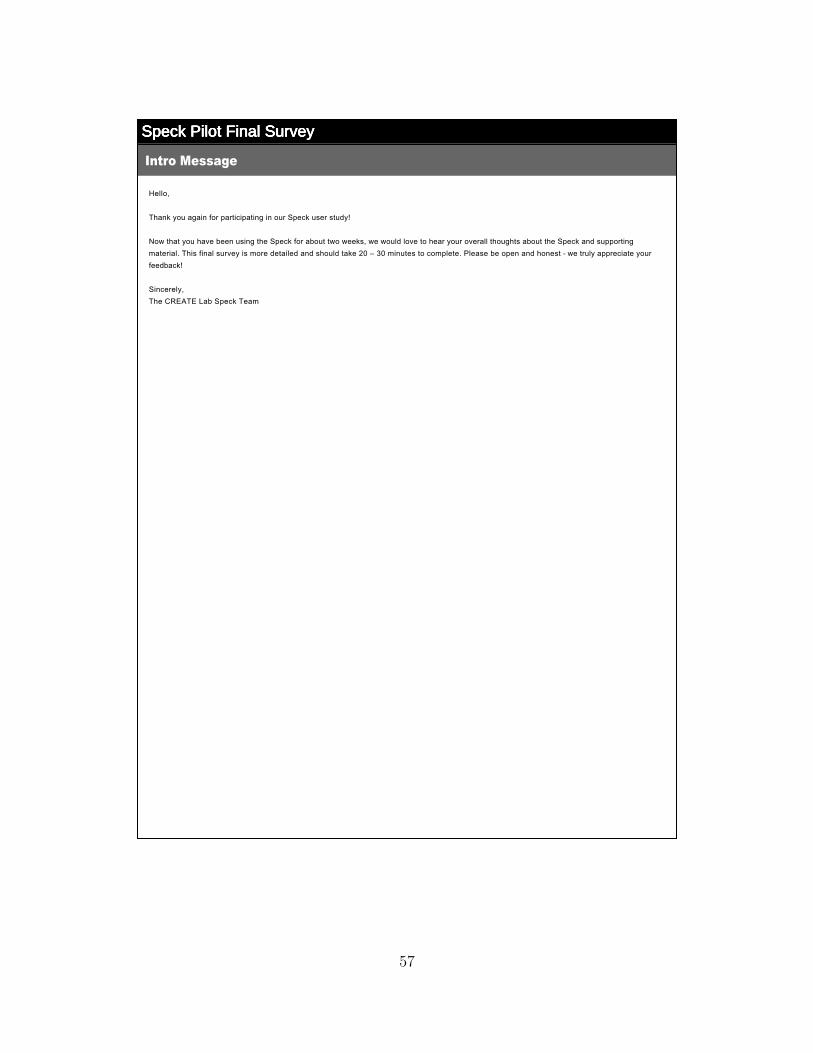
Speck Pilot Final SurveySpeck Pilot Final SurveySpeck Pilot Final SurveySpeck Pilot Final Survey
Hello, Thank you again for participating in our Speck user study! Now that you have been using the Speck for about two weeks, we would love to hear your overall thoughts about the Speck and supporting material. This final survey is more detailed and should take 20 – 30 minutes to complete. Please be open and honest we truly appreciate your feedback! Sincerely, The CREATE Lab Speck Team
Intro Message
57
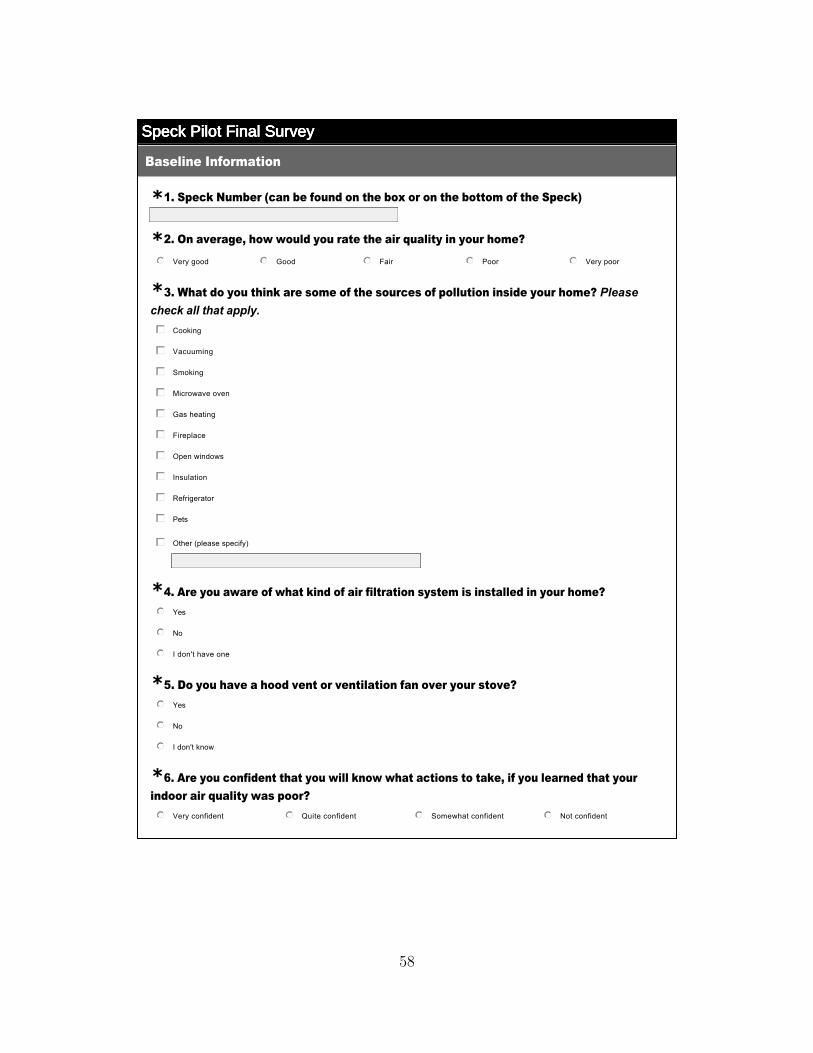
Speck Pilot Final SurveySpeck Pilot Final SurveySpeck Pilot Final SurveySpeck Pilot Final Survey
1. Speck Number (can be found on the box or on the bottom of the Speck)
2. On average, how would you rate the air quality in your home?
Baseline Information
*
*
3. What do you think are some of the sources of pollution inside your home? Please check all that apply.
4. Are you aware of what kind of air filtration system is installed in your home?
5. Do you have a hood vent or ventilation fan over your stove?
6. Are you confident that you will know what actions to take, if you learned that your indoor air quality was poor?
*
*
*
*
Very good
nmlkj Good
nmlkj Fair
nmlkj Poor
nmlkj Very poor
nmlkj
Cooking
gfedc
Vacuuming
gfedc
Smoking
gfedc
Microwave oven
gfedc
Gas heating
gfedc
Fireplace
gfedc
Open windows
gfedc
Insulation
gfedc
Refrigerator
gfedc
Pets
gfedc
Other (please specify)
gfedc
Yes
nmlkj
No
nmlkj
I don't have one
nmlkj
Yes
nmlkj
No
nmlkj
I don't know
nmlkj
Very confident
nmlkj Quite confident
nmlkj Somewhat confident
nmlkj Not confident
nmlkj
58

Speck Pilot Final SurveySpeck Pilot Final SurveySpeck Pilot Final SurveySpeck Pilot Final Survey7. How knowledgeable would you say you are about air quality in general?*
Very knowledgeable
nmlkj Quite knowledgeable
nmlkj Somewhat knowledgeable
nmlkj Not knowledgeable
nmlkj
59
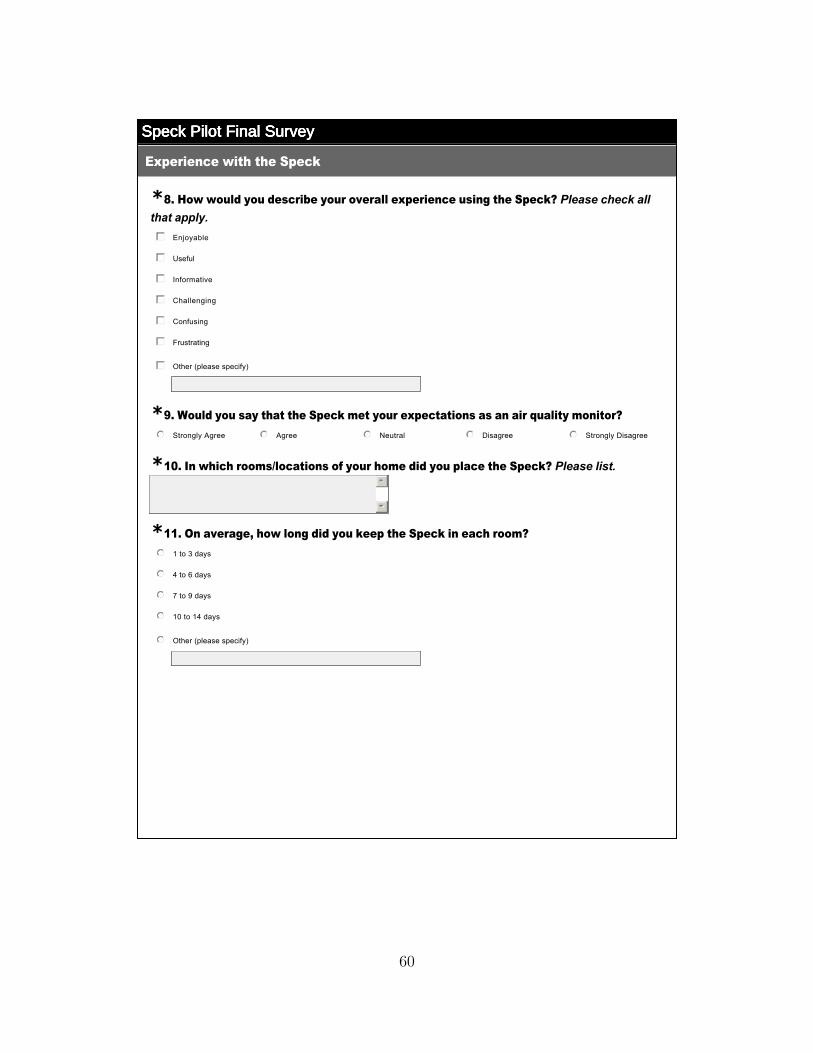
Speck Pilot Final SurveySpeck Pilot Final SurveySpeck Pilot Final SurveySpeck Pilot Final Survey
Experience with the Speck
8. How would you describe your overall experience using the Speck? Please check all that apply.
9. Would you say that the Speck met your expectations as an air quality monitor?
*
*
10. In which rooms/locations of your home did you place the Speck? Please list.
11. On average, how long did you keep the Speck in each room?
*55
66
*
Enjoyable
gfedc
Useful
gfedc
Informative
gfedc
Challenging
gfedc
Confusing
gfedc
Frustrating
gfedc
Other (please specify)
gfedc
Strongly Agree
nmlkj Agree
nmlkj Neutral
nmlkj Disagree
nmlkj Strongly Disagree
nmlkj
1 to 3 days
nmlkj
4 to 6 days
nmlkj
7 to 9 days
nmlkj
10 to 14 days
nmlkj
Other (please specify)
nmlkj
60

Speck Pilot Final SurveySpeck Pilot Final SurveySpeck Pilot Final SurveySpeck Pilot Final Survey12. How often did you look at the Speck reading?
13. Were you surprised by Speck readings in any specific rooms/locations? Please explain briefly.
14. What action, if any, did you take to improve your air quality based on what you learned from using the Speck? Please explain briefly.
15. How would you like to be alerted about significant changes in your air quality, if at all?
16. Would you want the capability to personalize the Speck settings so that you can, for example, choose when you get alerts, alter the types of historical views that are displayed, change the color coding, etc.? Please explain briefly.
*
55
66
55
66
*
55
66
Each time I walked into the room it was in
nmlkj
Multiple times a day
nmlkj
Once a day
nmlkj
Less than once a day
nmlkj
Only when I thought there was a problem
nmlkj
Other (please specify)
nmlkj
Blinking light
nmlkj
Sound
nmlkj
Text message
nmlkj
nmlkj
Voicemail
nmlkj
I do not want alerts
nmlkj
Other (please specify)
61

Speck Pilot Final SurveySpeck Pilot Final SurveySpeck Pilot Final SurveySpeck Pilot Final Survey17. The next version of the Speck will include a quieter fan and a more robust micro USB port. Apart from these modifications, what other changes would you suggest for the Speck (e.g. shape, size, color, screen, displayed information, portability, etc.)? Please explain briefly.
55
66
62
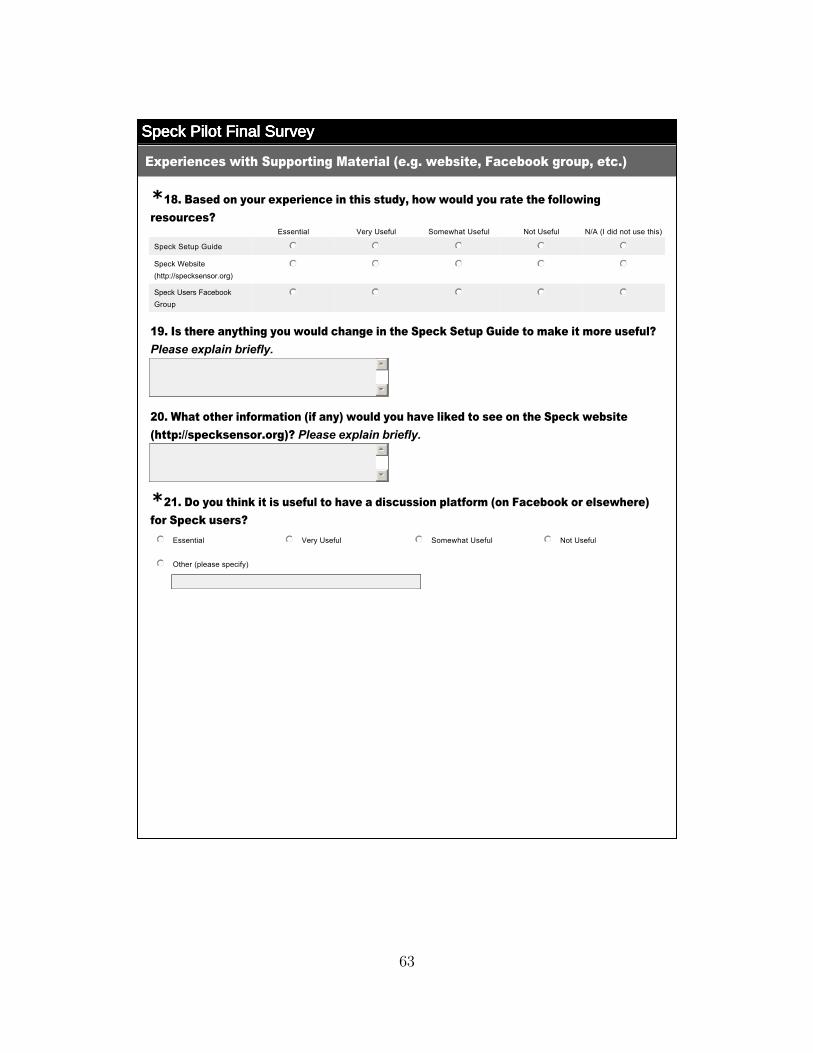
Speck Pilot Final SurveySpeck Pilot Final SurveySpeck Pilot Final SurveySpeck Pilot Final Survey
18. Based on your experience in this study, how would you rate the following resources?
19. Is there anything you would change in the Speck Setup Guide to make it more useful? Please explain briefly.
20. What other information (if any) would you have liked to see on the Speck website (http://specksensor.org)? Please explain briefly.
21. Do you think it is useful to have a discussion platform (on Facebook or elsewhere) for Speck users?
Experiences with Supporting Material (e.g. website, Facebook group, etc.)
*Essential Very Useful Somewhat Useful Not Useful N/A (I did not use this)
Speck Setup Guide nmlkj nmlkj nmlkj nmlkj nmlkj
Speck Website (http://specksensor.org)
nmlkj nmlkj nmlkj nmlkj nmlkj
Speck Users Facebook Group
nmlkj nmlkj nmlkj nmlkj nmlkj
55
66
55
66
*
Essential
nmlkj Very Useful
nmlkj Somewhat Useful
nmlkj Not Useful
nmlkj
Other (please specify)
nmlkj
63
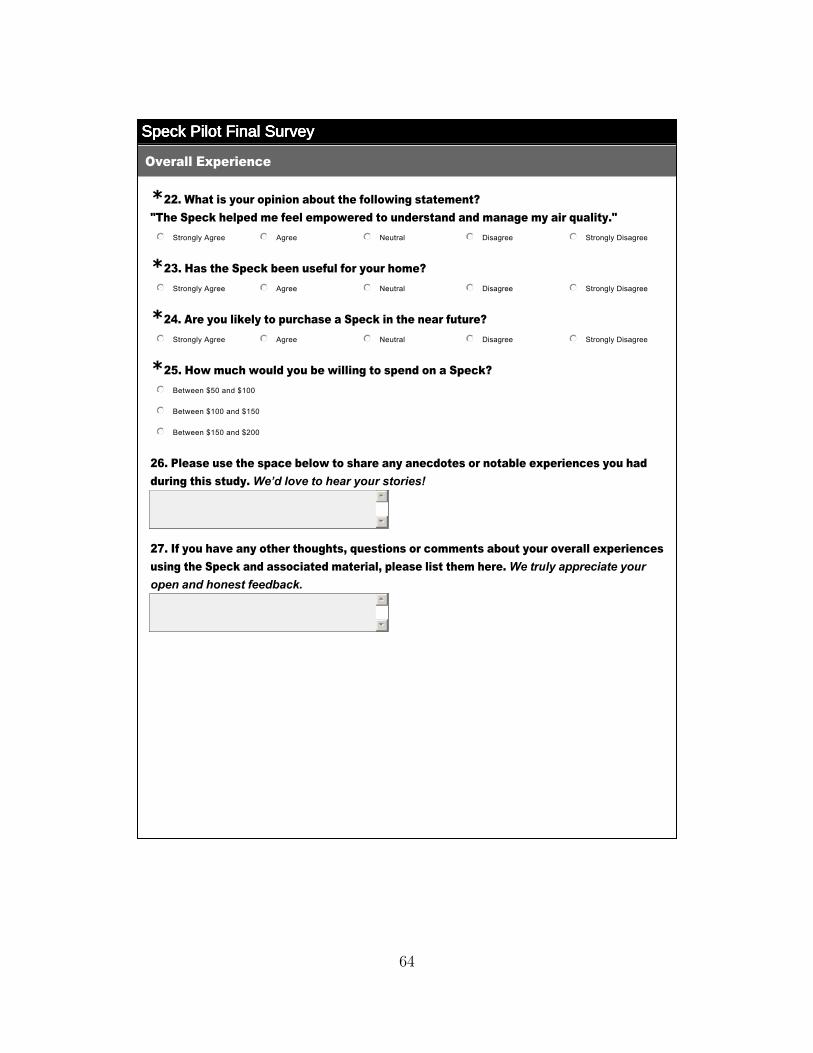
Speck Pilot Final SurveySpeck Pilot Final SurveySpeck Pilot Final SurveySpeck Pilot Final Survey
22. What is your opinion about the following statement? "The Speck helped me feel empowered to understand and manage my air quality."
23. Has the Speck been useful for your home?
24. Are you likely to purchase a Speck in the near future?
25. How much would you be willing to spend on a Speck?
26. Please use the space below to share any anecdotes or notable experiences you had during this study. We’d love to hear your stories!
27. If you have any other thoughts, questions or comments about your overall experiences using the Speck and associated material, please list them here. We truly appreciate your open and honest feedback.
Overall Experience
*
*
*
*
55
66
55
66
Strongly Agree
nmlkj Agree
nmlkj Neutral
nmlkj Disagree
nmlkj Strongly Disagree
nmlkj
Strongly Agree
nmlkj Agree
nmlkj Neutral
nmlkj Disagree
nmlkj Strongly Disagree
nmlkj
Strongly Agree
nmlkj Agree
nmlkj Neutral
nmlkj Disagree
nmlkj Strongly Disagree
nmlkj
Between $50 and $100
nmlkj
Between $100 and $150
nmlkj
Between $150 and $200
nmlkj
64
Bibliography
[1] Wireless weather station. URL http://www.acurite.com/
weather-environment-system-01057.html. (document), 5.1
[2] Dust sensor module specifications. URL http://www.samyoungsnc.com/products/
3-1SpecificationDSM501.pdf. 4.1
[3] Dc1100 air quality monitor, air quality, laser particle counter. URL http://www.
dylosproducts.com/learnabout.html. 3.3
[4] Grimm technologies, inc. - instrument solutions for research, industry, and homelanddefense. URL http://www.dustmonitor.com/. (document), 3.1, 3.2
[5] Air.air! - portable air dust detector for mobile device, 2014. URL http://www.
airair.info/. 3.3
[6] GP Ayers, MD Keywood, and JL Gras. Teom vs. manual gravimetric methods fordetermination of pm2. 5 aerosol mass concentrations. Atmospheric Environment, 33(22):3717–3721, 1999. 3.2.4
[7] J Binnig, J Meyer, and G Kasper. Calibration of an optical particle counter to providepm2. 5 mass for well-defined particle materials. Journal of aerosol science, 38(3):325–332, 2007. 3.2.5
[8] Richard T Burnett, C Arden Pope, Majid Ezzati, Casey Olives, Stephen S Lim, SumiMehta, Hwashin H Shin, Gitanjali Singh, Bryan Hubbell, Michael Brauer, et al. Anintegrated risk function for estimating the global burden of disease attributable toambient fine particulate matter exposure. 2014. 1
[9] Tom Chang, Joshua S Graff Zivin, Tal Gross, and Matthew J Neidell. Particulatepollution and the productivity of pear packers. Technical report, National Bureau ofEconomic Research, 2014. 3.4
[10] Nathan Chantrell. Air quality egg - community air qual-ity monitoring. URL http://nathan.chantrell.net/20130210/
air-quality-egg-community-air-quality-monitoring/. 3.3
[11] Douglas W Dockery, C Arden Pope, Xiping Xu, John D Spengler, James H Ware,Martha E Fay, Benjamin G Ferris Jr, and Frank E Speizer. An association betweenair pollution and mortality in six us cities. New England journal of medicine, 329(24):1753–1759, 1993. 3.1.1
[12] David Gobeli, Herbert Schloesser, and Thomas Pottberg. Met one instruments bam-
65
1020 beta attenuation mass monitor us-epa pm2. 5 federal equivalent method fieldtest results. In The Air & Waste Management Association (A&WMA) Conference,Kansas City, MO, January, 2008. 3.2.3
[13] B. Hillen. Bpeer tracks your home’s air quality, 2014. URL http://www.slashgear.
com/bpeer-tracks-your-homes-air-quality-18359937/. 3.3
[14] David Holstius. Monitoring Particulate Matter with Commodity Hardware. 2014. 3.3
[15] Eugene Kim, Philip K Hopke, Joseph P Pinto, and William E Wilson. Spatial vari-ability of fine particle mass, components, and source contributions during the regionalair pollution study in st. louis. Environmental science & technology, 39(11):4172–4179,2005. 1
[16] Jane Q Koenig, Therese F Mar, Ryan W Allen, Karen Jansen, Thomas Lumley, Jef-frey H Sullivan, Carol A Trenga, Timothy Larson, and L-Jane S Liu. Pulmonary effectsof indoor- and outdoor-generated particles in children with asthma. Environmentalhealth perspectives, 113(4):499–503, Apr 2005. 1
[17] D Liao, J Creason, C Shy, R Williams, R Watts, and R Zweidinger. Daily varia-tion of particulate air pollution and poor cardiac autonomic control in the elderly.Environmental health perspectives, 107(7):521–5, Jul 1999. 1
[18] Charles D Litton. Studies of the measurement of respirable coal dusts and dieselparticulate matter. Measurement Science and Technology, 13(3):365, 2002. 1
[19] Thomas M Peters, Gary A Norris, Robert W Vanderpool, Dave B Gemmill, Russell WWiener, Robert W Murdoch, Frank F Mcelroy, and Marc Pitchford. Field performanceof pm2. 5 federal reference method samplers. Aerosol Science & Technology, 34(5):433–443, 2001. 3.2.1
[20] C Arden Pope, Richard T Burnett, George D Thurston, Michael J Thun, Eugenia ECalle, Daniel Krewski, and John J Godleski. Cardiovascular mortality and long-termexposure to particulate air pollution epidemiological evidence of general pathophysi-ological pathways of disease. Circulation, 109(1):71–77, 2004. 1
[21] Jurgen Spielvogel, Stefan Hartstock, and Hans Grimm. New methods and standardsfor fine dust. In Journal of Physics: Conference Series, volume 170, page 012024. IOPPublishing, 2009. 3.2.2
[22] Ariel Spira-Cohen, Lung Chi Chen, Michaela Kendall, Ramona Lall, and George DThurston. Personal exposures to traffic-related air pollution and acute respiratoryhealth among bronx schoolchildren with asthma. Environmental health perspectives,119(4):559–565, 2011. 3.5.1
[23] Donald P Tuchman, Jon C Volkwein, and Robert P Vinson. Implementing infrareddetermination of quartz particulates on novel filters for a prototype dust monitor.Journal of Environmental Monitoring, 10(5):671–678, 2008. (document), 3.4
[24] Wikipedia. Beta attenuation monitoring — wikipedia, the free encyclopedia,2014. URL https://en.wikipedia.org/w/index.php?title=Beta_attenuation_
monitoring&oldid=638123475. [Online; accessed 22-October-2015]. (document), 3.3
66

[25] Ying Xu, Suresh Raja, Andrea R Ferro, Peter A Jaques, Philip K Hopke, CherylGressani, and Larry E Wetzel. Effectiveness of heating, ventilation and air conditioningsystem with hepa filter unit on indoor air quality and asthmatic children’s health.Building and Environment, 45(2):330–337, 2010. 3.5.2
67