Embed Size (px)
Citation preview
THESIS RESEARCH REPORT
IN FULFILMENT OF THE AWARD OF M.Sc CHEMICAL ENGINEERING
(ENVIRONMENTAL ENGINEERING)
13/09/2007 SUPERVISOR: Dr. ILONA SARVARI HORVATH
THESIS RESEARCH REPORT ON
ANAEROBIC DIGESTION OF
ETHANOL DISTILLERY WASTE-STILLAGE
FOR BIOGAS PRODUCTION.
By
Awosolu Mary Omolola
TABLE OF CONTENTS. Pgs
Acknowledgement……………………………………………………………………..i
Dedication……………………………………………………………………………..ii
Abstract………………………………………………………………………………..iii
Chapter I.INTRODUCTION…….…………………………………………………….1
-1.0.Introduction……………………………………………………………..............2
-1.1.Background Information……………………………………………….....2-3
-1.1.2.Basic Principles of Biofuels……………………………………………..3-3
-1.2. Biofuels Environmental Impacts .……………………………………………....4-5
-1.3. Biofuels Types………………..…………………………………………….…...5-7
-1.3.1.Ethanol……………………………………………………………….…..5-5
-1.3.2.Biodiesel……………………………………………………………….…6-6
-1.3.3.Non-food Biofuels…………………………………………………….….7-7
-2.1. Biogas …………………………………………………………..……..…………7-8
-2.1.1.Key Drivers for Biogas Production.……………………………………...9-9
-2.1.2.Biogas Prospects, Beneficiaries and Actors……………………………....9-9
-2.1.3.Resource Development and Waste Management…………………………10-10
-2.2. Process of Anaerobic Digestion…………………………………………………..10-11
-2.3. Anaerobic Treatment Applications………………………………………………..11-12
-3.1. The Biorefinery Integrated Concept of Ethanol and Biogas……...……………….12-14
-3.2. European Legislation and Policy on Biogas……………………………….………14-15
-3.3. Swedish Bioenergy Approaches…………………………………………….……. 16-16
-4.0. Integrated Ethanol-Biogas Chart Flow…………………………………………….17-19
-4.1. Ethanol Distillery Waste- Stillage…………………………………………………19-19
-4.2. Stillage Characterization ………………………………………. ……………........20-21
Chapter II. AIMS AND METHODOLOGY………………………………....………….22-22
-2.0. Research Objectives………………………………………………………………23-23
-2.1. Standard Method for Total Solids Analysis of Stillage Samples..................23-23
-2.1.2.Test Principle……………………………………………………….……..24-24
-2.1.3.Equipment and Apparatus………………………………………….……...24-24
-2.2. Standard Convection Oven Drying Procedure for
Total Solids TS% Stillage Samples………………………………………………24-24
-2.2.1.Precision…………………………………………………….………….…25-25
-2.3. Standard Methods for Volatile Solids Analysis of Stillage Samples………..…....25-25
-2.4. Thermophilic and Mesophilic Anaerobic Digestion of
Ethanol Distillery Stillage.......................................................................................26-26
-2.4.1.Introduction…………………………………………………………….…..26-26
-2.4.2.Materials and Supplies….…………………...……………..………………27-27
-2.4.2.1.Equipment and Apparatus..........................................................................28-28
-2.4.3.Samples, Reagents and Supplies………………………………………..….28-28
-2.5. Method…………………………………………………………………….……….27-27
-2.5.1.Laboratory Experimental Procedures……………………………….……...28-29
-2.5.2.Experimental Consistency and Monitoring………………………….……..29-29
Chapter III.RESULTS……………………………………………………………..…….30-30
-3.1. Data analyses and Presentations………………………………………….………...31-32
-3.1.1.Total Solids (TS) and Volatile Solids Computations of Stillage……..……..31-32
-3.2. Anaerobic Digestion of Ethanol Distillery Stillage Samples………………..……...33-34
-3.2.1.Mesophilic Anaerobic Digestion of Wheat Stillage…………………………35-35
-3.2.2.Mesophilic Anaerobic Digestion of Lignocellulose Stillage……...…………36-36
-3.2.3.Comparison of Wheat Stillage and Lignocellulose Stillage………...……….37-37
-3.3. Thermophilic Anaerobic Digestion of Wheat Stillage. ……….…………...………..38-38
-3.3.1.Thermophilic Anaerobic Digestion of Lignocellulose Stillage…..……….....39-39
-3.3.2.Thermophilic Anaerobic Digestion of Distillery Stillage Samples
Comparison of Wheat Stillage and Lignocellulose Stillage……………....40-40
-3.3.3.Comparisons of the Temperature Anaerobic Digestion on
Stillage Test Samples, Reference Cellulose and Blanks……....................41-41
Chapter IV.DISCUSSIONS AND CONCLUSIONS………………………….…..….42-44
Chapter V. REFERENCES………………………………………………………..…..45-47
Chapter VI.APPENDICES…………………………………………………….…..….48-53
LISTS OF TABLES
Table 1.Varying composition of Biogas……………………………………………….8-8
Table 2.Primary Potential Feedstocks for Ethanol Production………………………..12-12
Table 3.Primary Production of Biogas (ktoe) in European Union…………………….15-15
Table 4.Swedish Bioenergy Share Sector……………………………………………..15-15
Table 5.Charactrization of Thin Stillage……………………………………….……...20-20
Table 6.Data obtained on Total Solids TS% (g/g) on Stillage Samples……………....31-31
Table 7.Data computation for Volatile Solids VS% (g/g) on Stillage Samples………32-32
Table 8.Thermophilic Anaerobic Digestion Volume of CH4(g) of
Test Stillage Samples, Controls and Reference Samples………………..........50-50
Table 9.Mesophilic Anaerobic Digestion of Digestion Volume of CH4(g) of
Test Stillage Samples, Controls and Reference Samples……………..………50-50
Table10.Laboratory Analysis of Wheat Stillage (WS) and Lignocellulose Stillage Composition…………………………………………………………………..……….51-52
Table 11.World Ethanol Producing Countries……………………………….…..……53-53
LISTS OF FIGURES.
Chapter I.INTRODUCTION.
Fig.1.Projected World Energy Demand…………………………………………………2-2
Fig.2.Imported Oil Dependence………………………………………………………....3-3
Fig.3a.Biomass General Use……………………………………………………………..4-4
Fig.3b.Energetic Use of Biomass-Overview……………………………………………..4-4
Fig.4.Pathways of Biofuel Production…………………………………………..……….7-7
Fig.5.Biogas Drivers……………………..……………………………………..……….9-9
Fig.6.Biogas sustainable Benefits…………………………………………………..…...10-10
Fig.7.Schematic illustration of Anaerobic Digestion for Biogas Synthesis………..…...11-11
Fig.8.Integration of Anaerobic Digestion and Waste Recovery…………………..…....12-12
Fig.9a&9b.Swedish Biofuel Progressive Report…….…………………………..……..16-16
Fig.10.Evaluation of Swedish Biogas Plants Upgrading………………………..……...17-17
Fig.11.Conversion of Lignocellulose Biomass to Ethanol...………………….…..…….18-18
Fig.12.World Fuel Ethanol…………………………………………………….………...21-21
Fig.13.European Ethanol Production Statistics……………………………………….….21-21
Chapter II.AIMS AND METHODOLOGY
Fig.14.Experimental set up for Methane potential yield measurement for
Mesophilic and Thermophilic Anaerobic Digestion………………………..…..…28-28
Fig.15.Triplicate curve averages for Methane yield from
Wheat Stillage at 35°C……………………………………………………..……...35-35
Fig.16. Triplicate curve averages for Methane yield from
Lignocellulose Stillage at 35°C………………………………………………..…..36-36
Fig.17.Methane Potential Triplicate Average Composition curves of
Lignocellulose Stillage and Wheat Stillage at 35°C……………….……….…..…37-37
Fig.18.Methane Potential Triplicate Average Composition curves of
Wheat Stillage at 55°C……………….………………………………………...….38-38
Fig.19. Methane Potential Triplicate Average Composition curves of
Lignocellulose Stillage at 55°C……………….……………………………..…….39-39
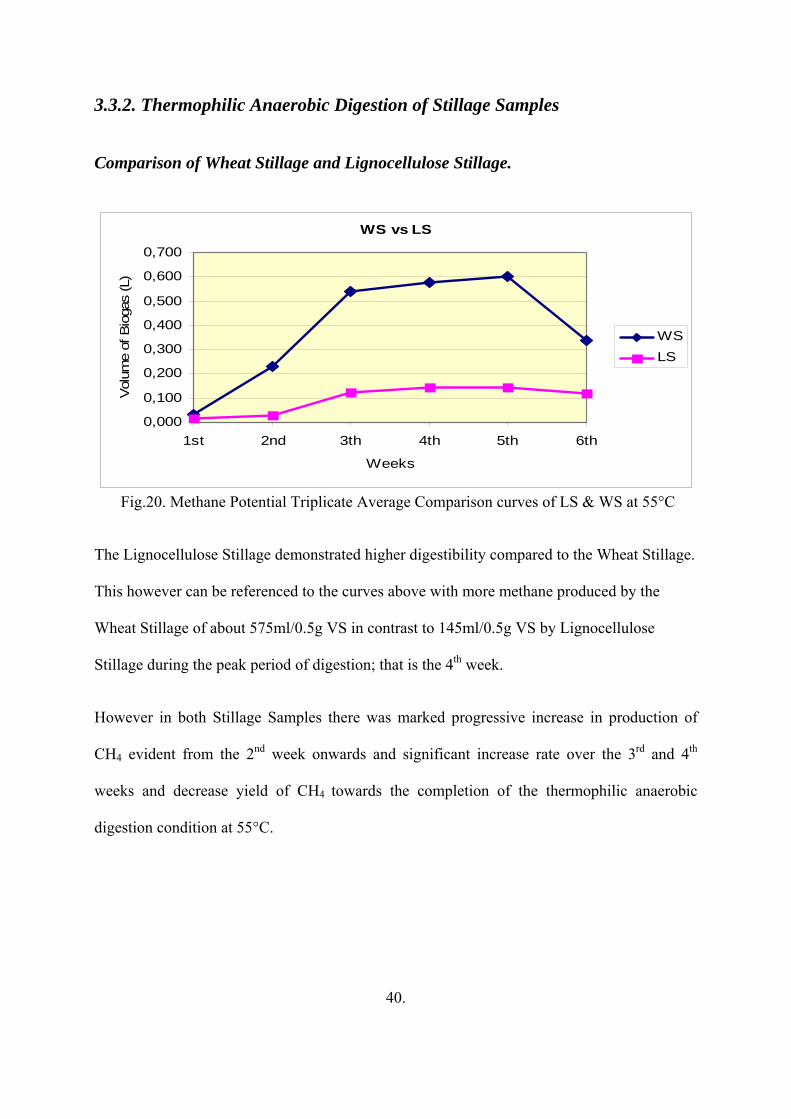
Fig.20. Methane Potential Triplicate Average Composition curves of
Lignocellulose Stillage and Wheat Stillage at 55°C…………………………...….40-40
Fig.21A. Methane Triplicate Average curves for respective samples at 55°C
(Thermophilic Digestion)………………………………………………..……...41-41
Fig.21B. Methane Triplicate Average curves for respective samples at 35°C
(Mesophilic Digestion)…………………………………………………..…….41-41
Fig.22. World Ethanol Production………………………………………………..……53-53
ABBREVIATIONS USED
WS…………………………Wheat Stillage
LS………………………….Lignocellulose Stillage
Rf………………………….Reference Avicel Sample
CS…………………………Control Samples
VS…………………………Volatile Solids
TS…………………………Total Solids
TP…………………………Total Protein
TF………………………….Total Fat
Vete………………………..Wheat
Enhet………………………Percentage
CO2(g)……………………...Carbon (IV) Oxide gas
N2(g)………………………..Nitrogen gas
CH4(g)………………………Methane gas.
std………………………….Standard
n……………………………number of moles
R……………………………Ideal Gas Constant
P(atm)………………………..Atmospheric Pressure
T……………………………Temperature
K……………………………Kelvin (Standard Temperature unit)
V…………………………....Volume (L, m3).
OFMSW…………………….Organic Fraction of Municipal Solid Waste
ACKNOWLEDGEMENT.
The research work for this thesis was carried out at University College of Borås School of Engineering Sweden within a six month intensive rigorous practical explorations. This thesis with its fragile nature would not have been finalized without supervision, assistance and professional support and encouragement of unique personalities. I would like to acknowledge priceless positive and constructive supervision of Dr. Ilona Horvath Mrs., the Swedish Ethanol producing company, Agroetanol for the provision of the Feedstocks utilized for the conduction of the project thesis as well as the personnel of the Environmental Engineering Department, University College of Borås and also many thanks to ESPIRA, the Research project awarding body for the award honor granted to me for my Research Thesis as the Best Most Promising Commercially Research Project as promising roadmap for Future Sustainability.
My profound appreciation to Dr. Dag Henriksson, the Director of Studies and Head of Department of Environmental Engineering University College of Borås for his outstanding immeasurable professional effort in this thesis. Special humble thanks to Michael Tittus, Associate Professor Anders Nylund and Professor Håkan Torstesson for your wonderful remarkable impacts.
Special heart warm thanks to the Mr. & Mrs. Gustafson, Dr. & Mrs. Henriksson and Mr. Kwame Aboh for their huge unparalleled and unquantifiable outstanding support and financial assistance towards the successful completion of my studies. Vote of thanks to the Advent Church Members Borås, my wonderful friends and colleagues (Wiktor, Marion, Anastasia and Maskim, Vinnay Reddy, Charlotte, Jenny, Emma Nilsson, Emma Karlsson, Tayo Lekuti, Edwin, Shedrack, Nelly, Richard and Lilli, Alinda, Mohamed, Bada, Zahra, Zhoreh, Shanin and others) for their assistance and labor of love.
Most profound gratitude to my Loving and Caring Parents, Barrister & Mrs. Christopher Oladunni Awosolu, sweet wonderful Siblings (Dr. Samuel Awosolu, Dr. Gabriel Awosolu and Mrs. Olutoye Joshua) and Micheal Adewole Ologbenla for your loving kind gesture, genuine support, care and encouragement. Thank you so much you’re very wonderful treasure and unique Loving Family.
Above all, I give Almighty God the Glory, Honor, Thanks and Praise for His Presence, Love, sustenance, and grace for the successful completion of my studies. Thank you God for making this Research project a unique achievement with promising future prospects.
i

DEDICATION.
In Evergreen Loving Memory of my Dearly Beloved Brother, Emmanuel Olusegun Awosolu.
You’re a Rare Gem gone too soon, I will never forget your esteem love and care you nurtured
me, I really dearly miss you very much. May your Gentle Soul Continue to Rest in Perfect
Eternal Peace in Bosom of the Lord, Amen Adieu.
ii
Abstract
iii
Dependence on oil imported from foreign countries affect the National Energy securities
and Energy security of global economies has become one of the most challenging problem
that needs to be resolved as the fossil sources are fast diminishing and irreplaceable. The
alarming energy demand and consumption rate of the present global status is currently
exponentially exceeding the rate of local supply sources, becoming an issue of concern. A
look beyond the fossils is crucial for long tern economic growth and energy security as
there are numerous uncertainties about the fossil supplies coupled with the greater
environmental risks encountered during exploitation. Thus the new concept for treating
ethanol distillery waste anaerobically to produce Biogas- a clean renewable alternative
energy with many applications projects sustainable and more realistic option.
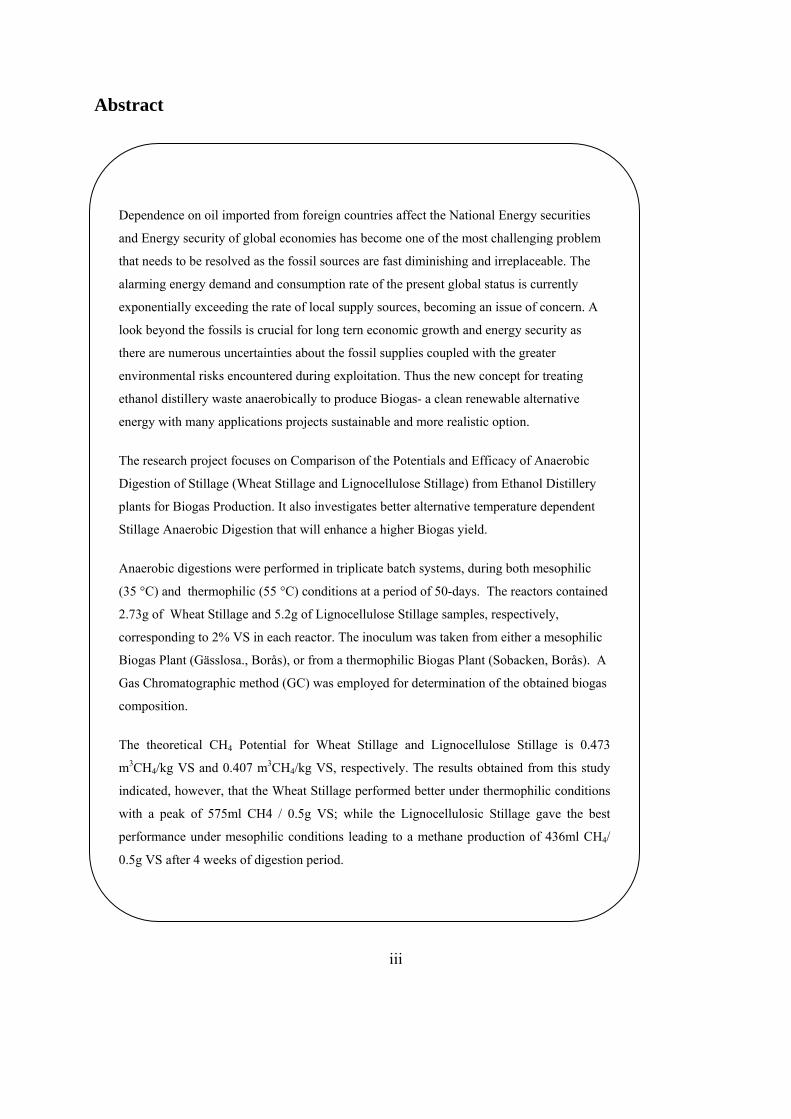
The research project focuses on Comparison of the Potentials and Efficacy of Anaerobic
Digestion of Stillage (Wheat Stillage and Lignocellulose Stillage) from Ethanol Distillery
plants for Biogas Production. It also investigates better alternative temperature dependent
Stillage Anaerobic Digestion that will enhance a higher Biogas yield.
Anaerobic digestions were performed in triplicate batch systems, during both mesophilic
(35 °C) and thermophilic (55 °C) conditions at a period of 50-days. The reactors contained
2.73g of Wheat Stillage and 5.2g of Lignocellulose Stillage samples, respectively,
corresponding to 2% VS in each reactor. The inoculum was taken from either a mesophilic
Biogas Plant (Gässlosa., Borås), or from a thermophilic Biogas Plant (Sobacken, Borås). A
Gas Chromatographic method (GC) was employed for determination of the obtained biogas
composition.
The theoretical CH4 Potential for Wheat Stillage and Lignocellulose Stillage is 0.473
m3CH4/kg VS and 0.407 m3CH4/kg VS, respectively. The results obtained from this study
indicated, however, that the Wheat Stillage performed better under thermophilic conditions
with a peak of 575ml CH4 / 0.5g VS; while the Lignocellulosic Stillage gave the best
performance under mesophilic conditions leading to a methane production of 436ml CH4/
0.5g VS after 4 weeks of digestion period.

1.
I. INTRODUCTION
1. Introduction.
1.1 Background Information.
Oil prices are at all times high and there is growing zest to reduce our dependence on oil. It is
finite resource, gas supplies and oil reserves are shrinking, will definitely run out in the future.
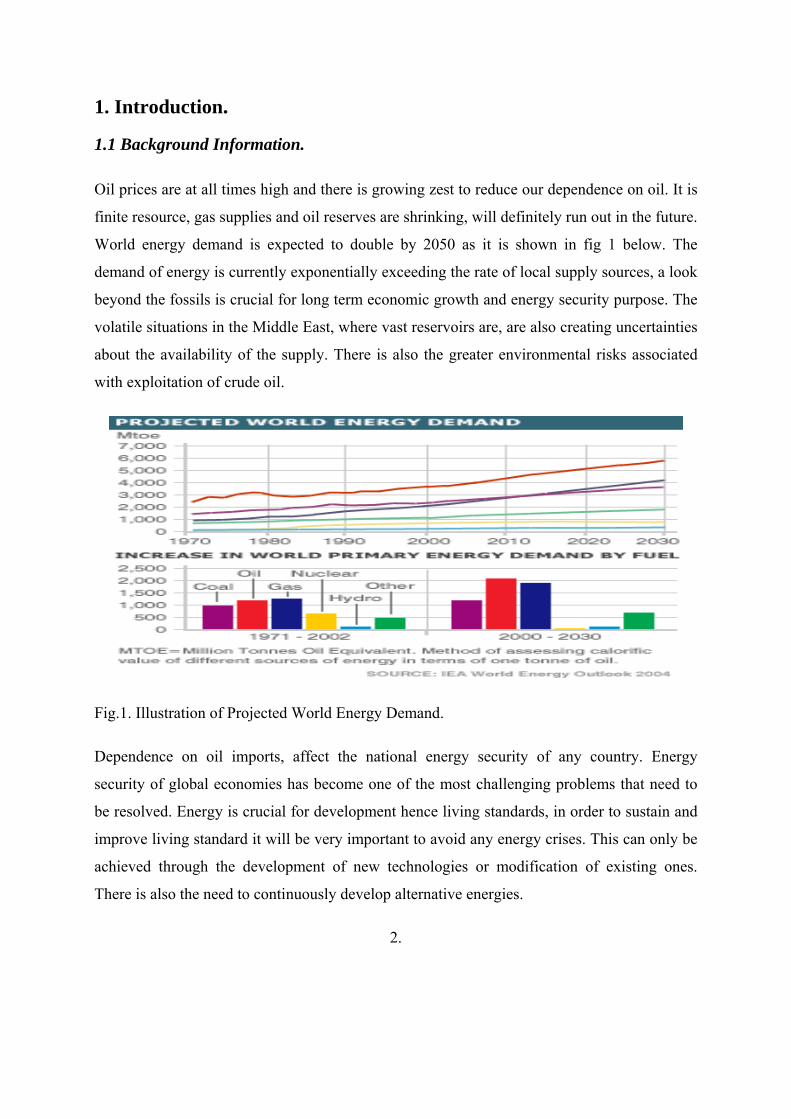
World energy demand is expected to double by 2050 as it is shown in fig 1 below. The
demand of energy is currently exponentially exceeding the rate of local supply sources, a look
beyond the fossils is crucial for long term economic growth and energy security purpose. The
volatile situations in the Middle East, where vast reservoirs are, are also creating uncertainties
about the availability of the supply. There is also the greater environmental risks associated
with exploitation of crude oil.
Fig.1. Illustration of Projected World Energy Demand.
Dependence on oil imports, affect the national energy security of any country. Energy
security of global economies has become one of the most challenging problems that need to
be resolved. Energy is crucial for development hence living standards, in order to sustain and
improve living standard it will be very important to avoid any energy crises. This can only be
achieved through the development of new technologies or modification of existing ones.
There is also the need to continuously develop alternative energies.
2.
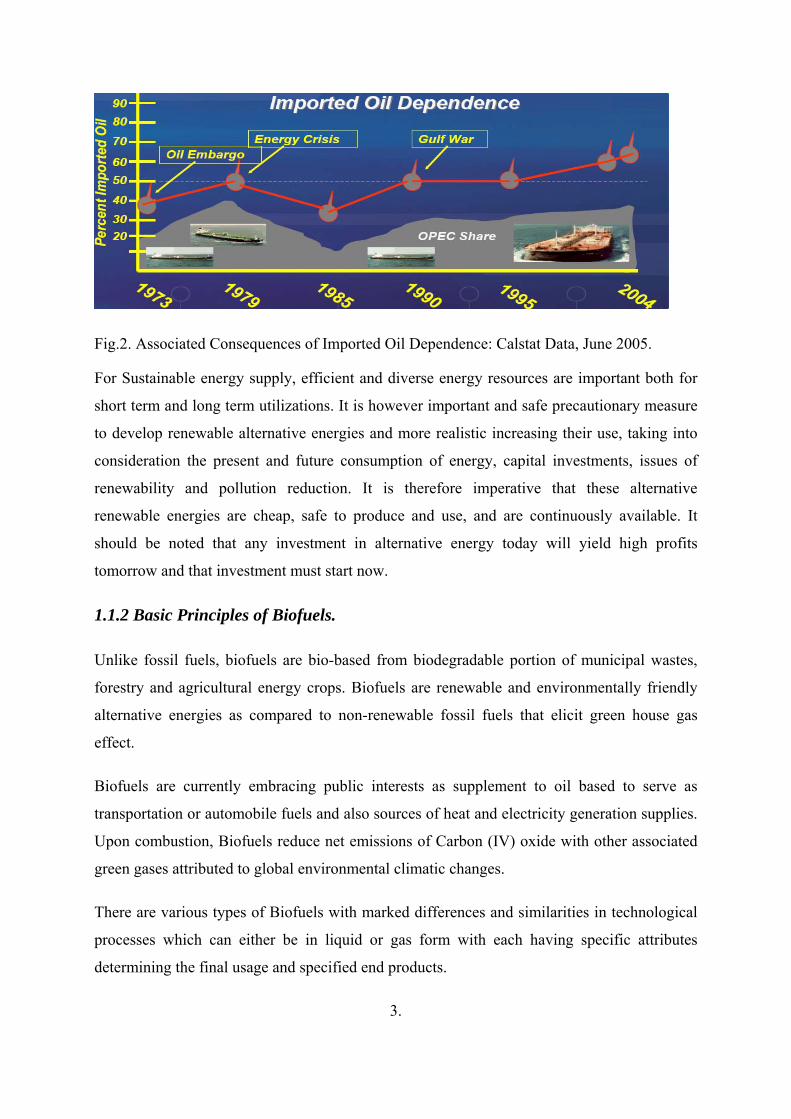
Fig.2. Associated Consequences of Imported Oil Dependence: Calstat Data, June 2005.
For Sustainable energy supply, efficient and diverse energy resources are important both for
short term and long term utilizations. It is however important and safe precautionary measure
to develop renewable alternative energies and more realistic increasing their use, taking into
consideration the present and future consumption of energy, capital investments, issues of
renewability and pollution reduction. It is therefore imperative that these alternative
renewable energies are cheap, safe to produce and use, and are continuously available. It
should be noted that any investment in alternative energy today will yield high profits
tomorrow and that investment must start now.
1.1.2 Basic Principles of Biofuels.
Unlike fossil fuels, biofuels are bio-based from biodegradable portion of municipal wastes,
forestry and agricultural energy crops. Biofuels are renewable and environmentally friendly
alternative energies as compared to non-renewable fossil fuels that elicit green house gas
effect.
Biofuels are currently embracing public interests as supplement to oil based to serve as
transportation or automobile fuels and also sources of heat and electricity generation supplies.
Upon combustion, Biofuels reduce net emissions of Carbon (IV) oxide with other associated
green gases attributed to global environmental climatic changes.
There are various types of Biofuels with marked differences and similarities in technological
processes which can either be in liquid or gas form with each having specific attributes
determining the final usage and specified end products.
3.
Biomass- general use.
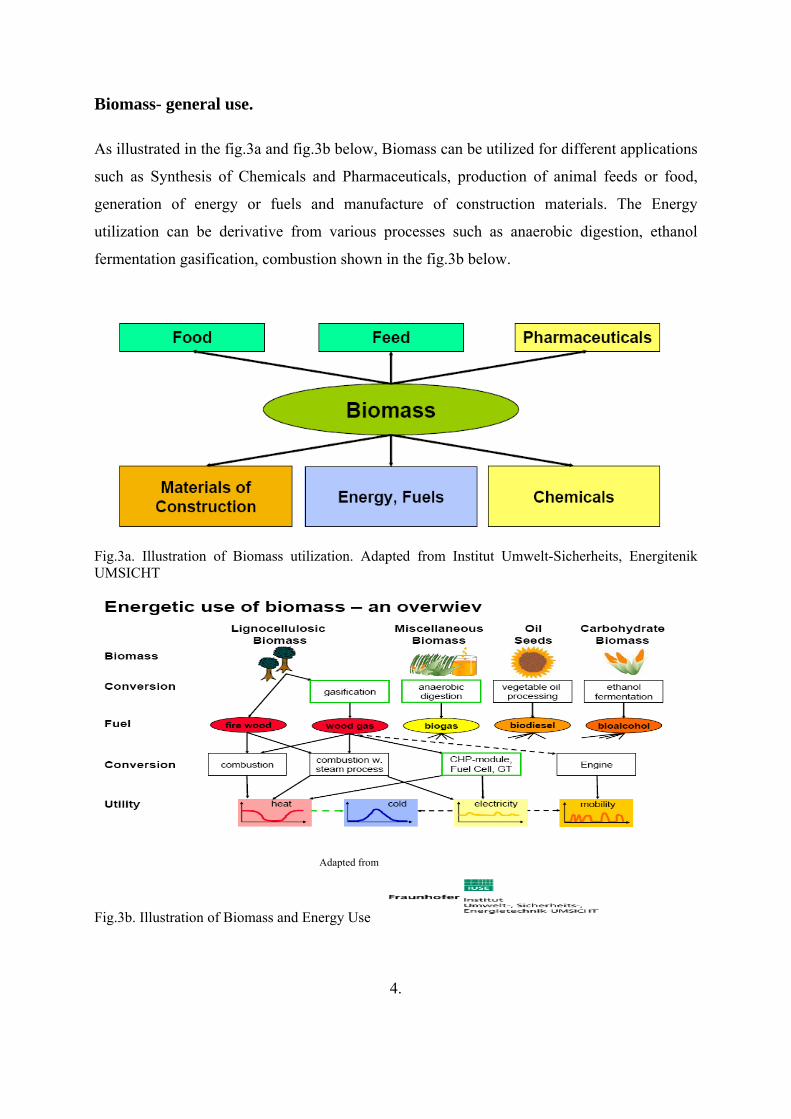
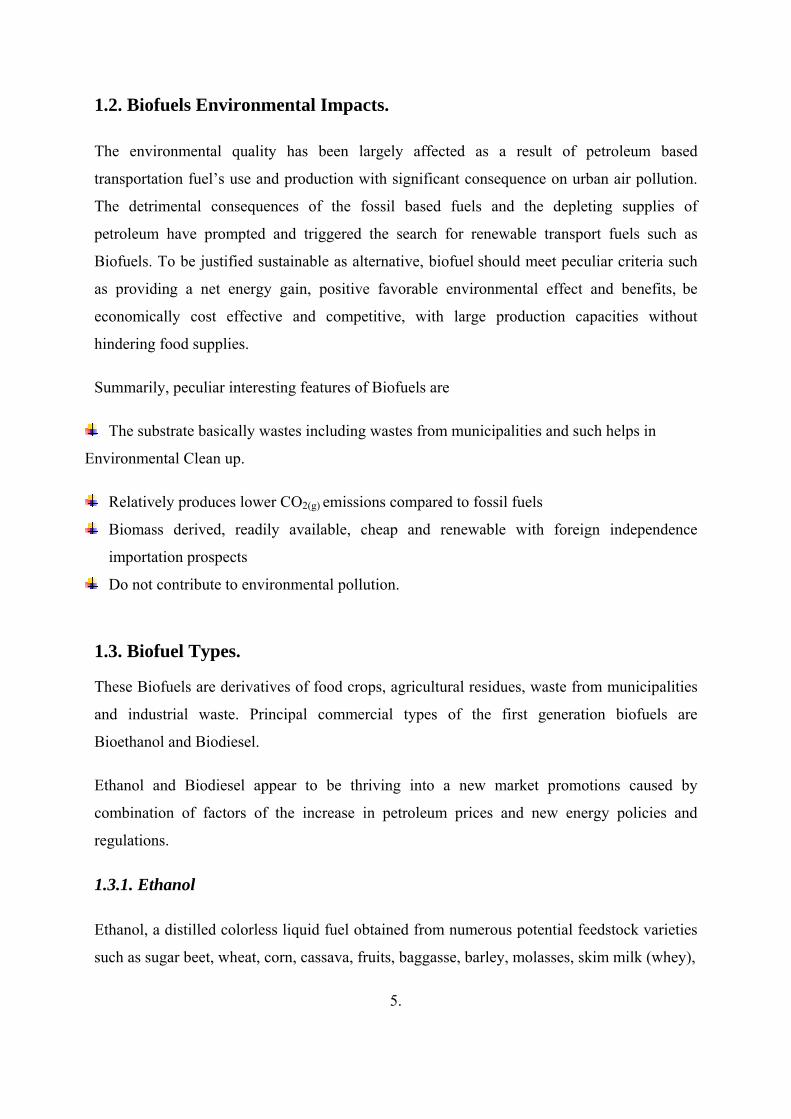
As illustrated in the fig.3a and fig.3b below, Biomass can be utilized for different applications
such as Synthesis of Chemicals and Pharmaceuticals, production of animal feeds or food,
generation of energy or fuels and manufacture of construction materials. The Energy
utilization can be derivative from various processes such as anaerobic digestion, ethanol
fermentation gasification, combustion shown in the fig.3b below.
Fig.3a. Illustration of Biomass utilization. Adapted from Institut Umwelt-Sicherheits, Energitenik UMSICHT
Fig.3b. Illustration of Biomass and Energy Use
4.
Adapted from
1.2. Biofuels Environmental Impacts.
The environmental quality has been largely affected as a result of petroleum based
transportation fuel’s use and production with significant consequence on urban air pollution.
The detrimental consequences of the fossil based fuels and the depleting supplies of
petroleum have prompted and triggered the search for renewable transport fuels such as
Biofuels. To be justified sustainable as alternative, biofuel should meet peculiar criteria such
as providing a net energy gain, positive favorable environmental effect and benefits, be
economically cost effective and competitive, with large production capacities without
hindering food supplies.
Summarily, peculiar interesting features of Biofuels are
The substrate basically wastes including wastes from municipalities and such helps in
Environmental Clean up.
Relatively produces lower CO2(g) emissions compared to fossil fuels
Biomass derived, readily available, cheap and renewable with foreign independence
importation prospects
Do not contribute to environmental pollution.
1.3. Biofuel Types.
These Biofuels are derivatives of food crops, agricultural residues, waste from municipalities
and industrial waste. Principal commercial types of the first generation biofuels are
Bioethanol and Biodiesel.
Ethanol and Biodiesel appear to be thriving into a new market promotions caused by
combination of factors of the increase in petroleum prices and new energy policies and
regulations.
1.3.1. Ethanol
Ethanol, a distilled colorless liquid fuel obtained from numerous potential feedstock varieties
such as sugar beet, wheat, corn, cassava, fruits, baggasse, barley, molasses, skim milk (whey),
5.
potatoes, sorghum, switch grass and cellulose biomass such as wood, paper, straw and other
cellulose wastes such as grasses, others includes municipal solid wastes. These various waste
streams for Ethanol production have their peculiar properties and generally differ. Feedstocks
prices and price of natural gas are predominant influential factors that determine the cost of
Ethanol Production. Ethanol as an alternative fuel, offers a Sustainable economy by reducing
the use of imported petroleum, emitting neutral CO2(g), boost economy providing value added
market opportunities for the Agricultural sector (Shell Global, 2001).
Ethanol with its high octane count has is currently positively used as an automobile fuels with
policies to promote its production most especially in Brazil, United States, majority of the
European Union Countries and South Africa.
1.3.2. Biodiesel.
Biodiesel is mainly produced from animal fats and vegetable oil sources. This is a methyl or
ethyl derived organic fuel from waste cooking oil or animal fats Either blended with
petroleum diesel at various ratios (80 percent petroleum diesel and 20 percent biodiesel) or in
its pure form (B100) is a dependable alternative to petroleum diesel. Primarily produced from
chemically catalyzed acid or base reaction between alcohol and vegetable oil can be used in
vehicles with engines specified for low blend concentrations or pure concentrations.
Furthermore renewable agricultural sources such as vast vegetable oil and animal fats sources
comprise of Virgin Plant oils such as (rapeseed oil commonly used in Sweden and Europe,
Soybean, Canola oil, sunflower, saffleflower), Crude vegetable oils, greases, edible and non
edible tallow, used fried oils, acid oils can also be used for biodiesel production.
Summarily, Bio-based compared to Conventional Fossil fuels, environmentally friendly
renewable fuels and Waste Management options. (Shell Global, 2001). Ethanol and Biodiesel
have similar strengths in utilization of great variety of Feedstocks, Particulate emission
reduction, Oil independence, Stimulant to Farming Sector, Sustainable and Non-Toxic,
National Security, Global market expansion with job opportunities,
6.
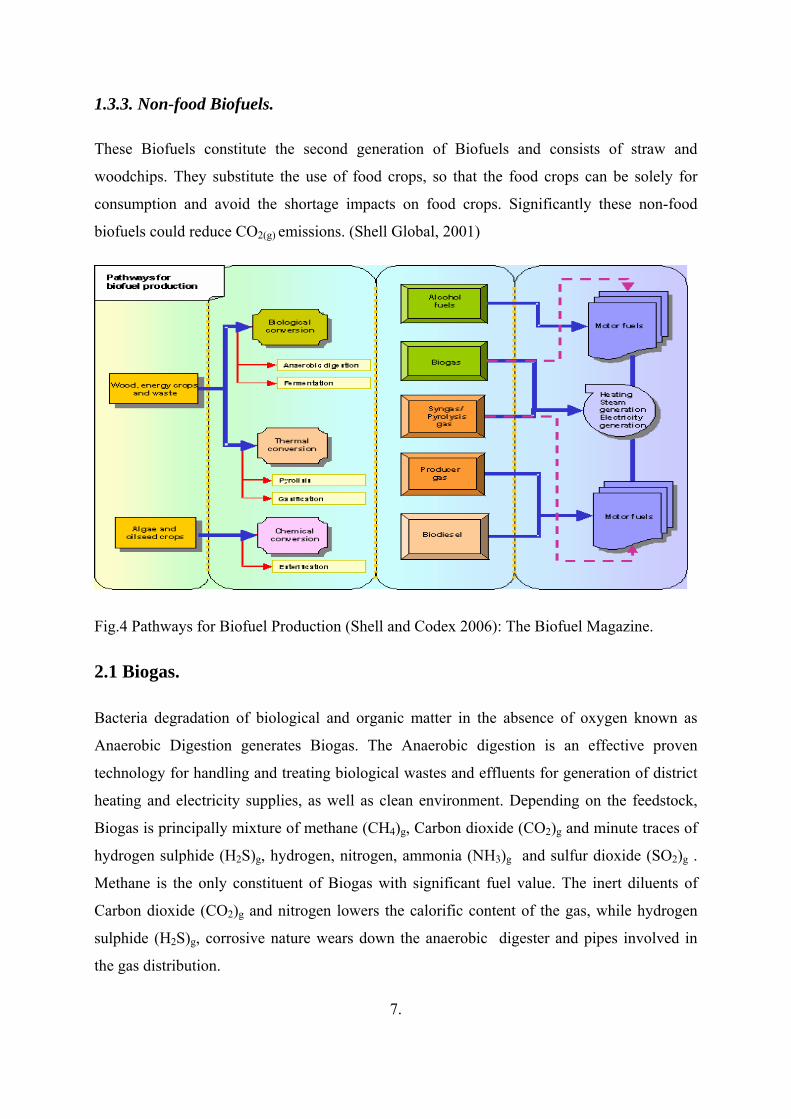
1.3.3. Non-food Biofuels.
These Biofuels constitute the second generation of Biofuels and consists of straw and
woodchips. They substitute the use of food crops, so that the food crops can be solely for
consumption and avoid the shortage impacts on food crops. Significantly these non-food
biofuels could reduce CO2(g) emissions. (Shell Global, 2001)
Fig.4 Pathways for Biofuel Production (Shell and Codex 2006): The Biofuel Magazine.
2.1 Biogas.
Bacteria degradation of biological and organic matter in the absence of oxygen known as
Anaerobic Digestion generates Biogas. The Anaerobic digestion is an effective proven
technology for handling and treating biological wastes and effluents for generation of district
heating and electricity supplies, as well as clean environment. Depending on the feedstock,
Biogas is principally mixture of methane (CH4)g, Carbon dioxide (CO2)g and minute traces of
hydrogen sulphide (H2S)g, hydrogen, nitrogen, ammonia (NH3)g and sulfur dioxide (SO2)g .
Methane is the only constituent of Biogas with significant fuel value. The inert diluents of
Carbon dioxide (CO2)g and nitrogen lowers the calorific content of the gas, while hydrogen
sulphide (H2S)g, corrosive nature wears down the anaerobic digester and pipes involved in
the gas distribution.
7.
The process of anaerobic digestion is carried out in a simplified number of steps using any
substrate of organic or biological origin and occurs in septic tanks, rubbish dumps, garbage
refuse bins, decaying municipal waste or food waste.
The sources of Anaerobic Digestion can be classified specifically as either:
Agricultural materials such as liquid manure, energy crops and crop residues (Ley crops,
maize, straw, sugar beet), Silages (grass silage, maize silage), Vegetable wastes
Industrial residues such as Distillery wastes (Stillage), Whey, and Pomace.
Municipal wastes such as Source Separated Solid Organic Wastes.
Municipal wastewaters and Sewage Treatment Plants
Animal manures and Slaughtery wastes. (O. Jönsson, ENGVA 2001, Malmö)
Methane potential fraction differs and ranges between 40%-80% do the basis of the digester
type, substrate quality and digesting bacteria (Stewart et al., 1984). A small fraction of
hydrogen sulphide often is present in Biogas (Speece, 1996).
In Table.1 below the varying percentage constituents of Biogas according to (Stewart et al.,
1984) is shown
Constituents % Composition
Methane 50-75
Nitrogen 0-1
Carbon IV Oxide 30-45
Water 0-1
Ammonia Traces
Hydrogen Sulphide Traces (ppm)
Table.1. Varying composition of Biogas components mixture. (Stewart et al., 1984).
8.
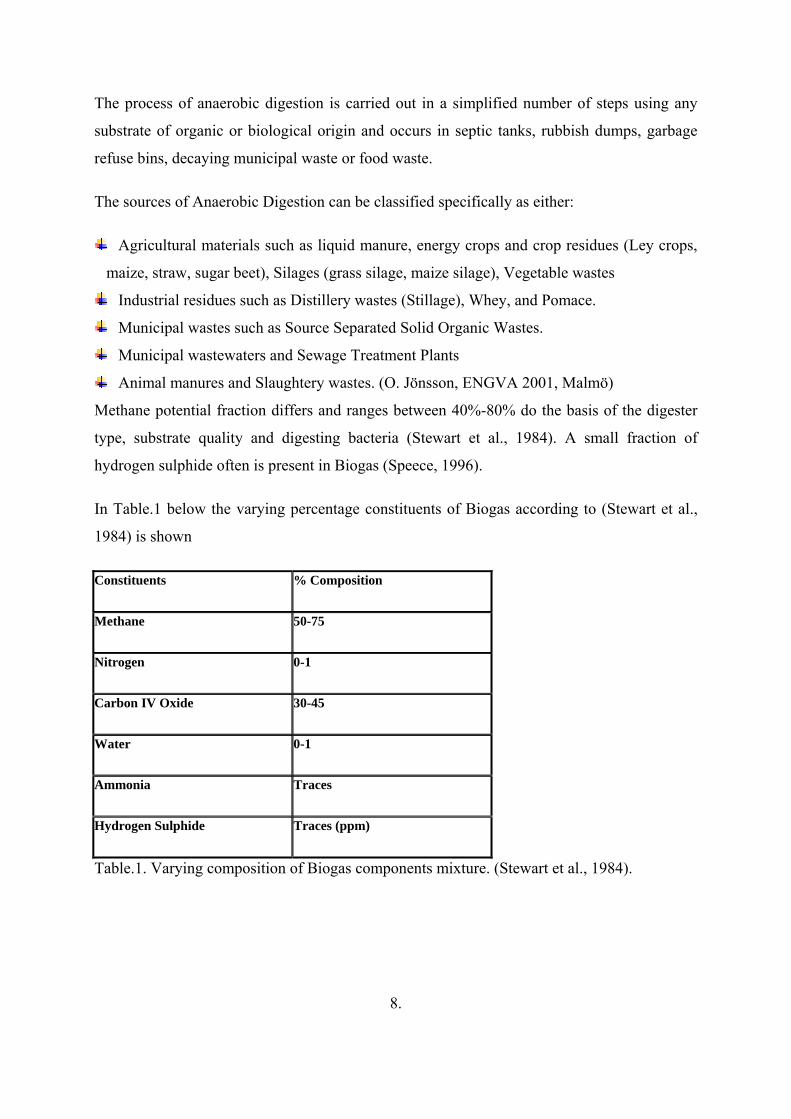
2.1.1 Key Drivers for Biogas Production.
Fig.5 highlights the major influential key factors for search of alternative renewable fuel,
Biogas are
Oil Independence,
Reduced Emissions,
Rural Development and Value Added Agriculture
Fig.5. Biogas Drivers
2.1.2 Biogas, Prospects, Beneficiaries and Actors
- Potential Beneficiaries & Policy Actors
Municipalities and Industrial Authorities
Solid Waste and Waste-water treatment Sectors
Energy and Transportation Industries
-Future Prospects
Business Development Opportunities: Long-term investment in infrastructure, financial
incentives, extensive biogas supply and an integrated approach are keys to ensuring stable
market conditions and large- scale public buy-in of biogas fuelled transport and digestates
returned to farmers as valuable fertilizers, this however involves technological innovations
and consistent upgrading of utilization of available resources.
Socio-Economic Development Opportunities: The cost-benefit analyses of methane
generation vary widely, depending upon the uses and actual benefits of biogas production,
public and private costs associated with the development and utilization of methane and on
the technology used to generate methane. It promotes sustainable Agriculture, an economy
wealth to the rural areas with addition increased economic investment returns.
9.
KEY DRIVERS GLOBAL
WARMING
AIR ENERGY
B
I
O
G
A
S
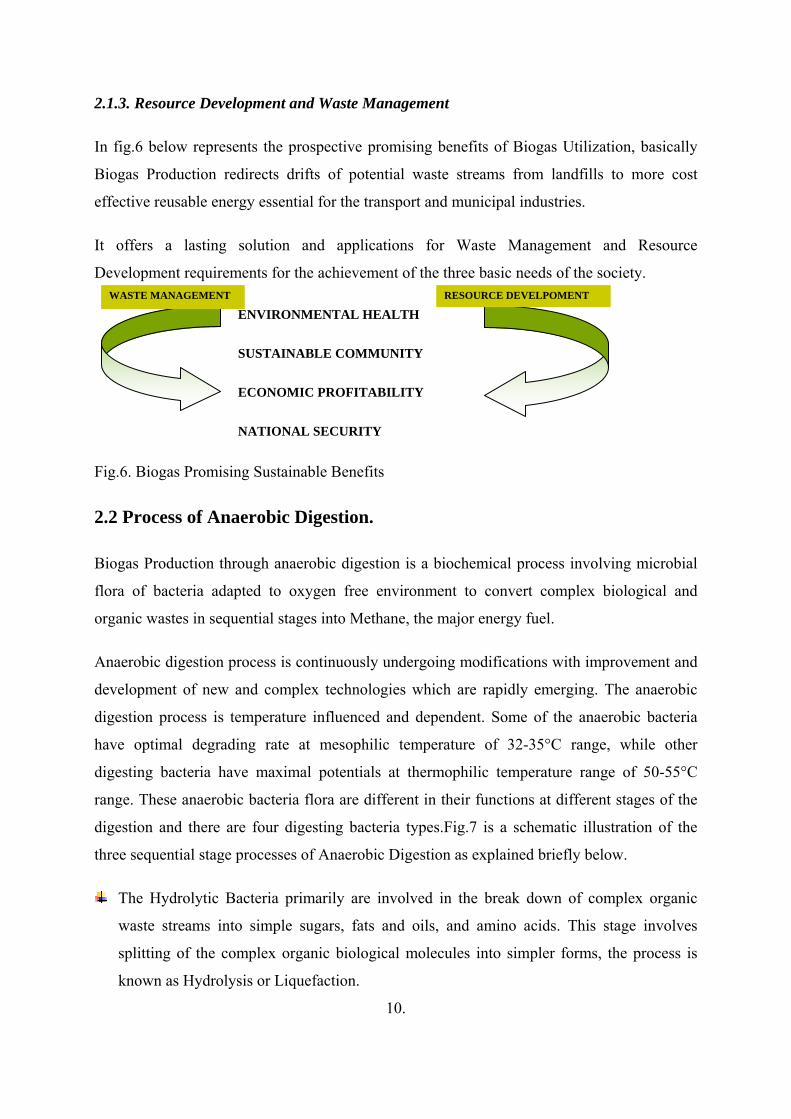
2.1.3. Resource Development and Waste Management
In fig.6 below represents the prospective promising benefits of Biogas Utilization, basically
Biogas Production redirects drifts of potential waste streams from landfills to more cost
effective reusable energy essential for the transport and municipal industries.
It offers a lasting solution and applications for Waste Management and Resource
Development requirements for the achievement of the three basic needs of the society.
ENVIRONMENTAL HEALTH
SUSTAINABLE COMMUNITY
ECONOMIC PROFITABILITY
NATIONAL SECURITY
Fig.6. Biogas Promising Sustainable Benefits
2.2 Process of Anaerobic Digestion.
Biogas Production through anaerobic digestion is a biochemical process involving microbial
flora of bacteria adapted to oxygen free environment to convert complex biological and
organic wastes in sequential stages into Methane, the major energy fuel.
Anaerobic digestion process is continuously undergoing modifications with improvement and
development of new and complex technologies which are rapidly emerging. The anaerobic
digestion process is temperature influenced and dependent. Some of the anaerobic bacteria
have optimal degrading rate at mesophilic temperature of 32-35°C range, while other
digesting bacteria have maximal potentials at thermophilic temperature range of 50-55°C
range. These anaerobic bacteria flora are different in their functions at different stages of the
digestion and there are four digesting bacteria types.Fig.7 is a schematic illustration of the
three sequential stage processes of Anaerobic Digestion as explained briefly below.
The Hydrolytic Bacteria primarily are involved in the break down of complex organic
waste streams into simple sugars, fats and oils, and amino acids. This stage involves
splitting of the complex organic biological molecules into simpler forms, the process is
known as Hydrolysis or Liquefaction.
10.
RESOURCE DEVELPOMENT WASTE MANAGEMENT
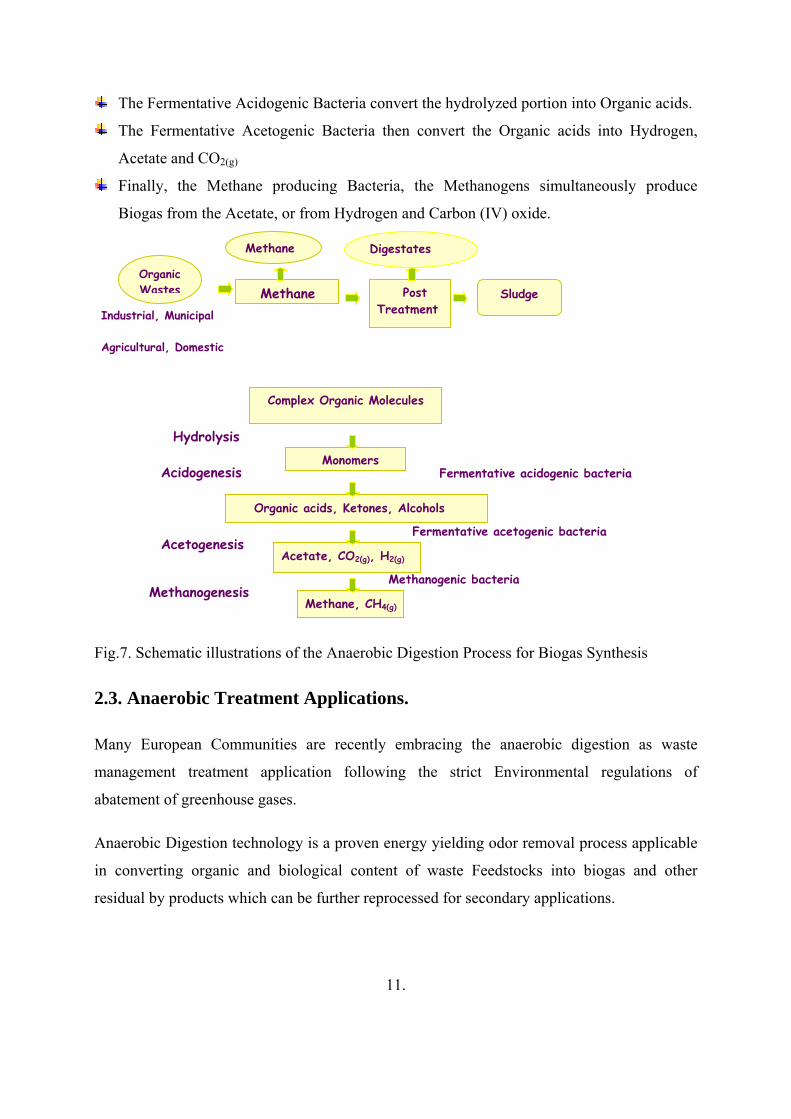
The Fermentative Acidogenic Bacteria convert the hydrolyzed portion into Organic acids.
The Fermentative Acetogenic Bacteria then convert the Organic acids into Hydrogen,
Acetate and CO2(g)
Finally, the Methane producing Bacteria, the Methanogens simultaneously produce
Biogas from the Acetate, or from Hydrogen and Carbon (IV) oxide.
Fig.7. Schematic illustrations of the Anaerobic Digestion Process for Biogas Synthesis
2.3. Anaerobic Treatment Applications.
Many European Communities are recently embracing the anaerobic digestion as waste
management treatment application following the strict Environmental regulations of
abatement of greenhouse gases.
Anaerobic Digestion technology is a proven energy yielding odor removal process applicable
in converting organic and biological content of waste Feedstocks into biogas and other
residual by products which can be further reprocessed for secondary applications.
11.
Organic Wastes Methane
Methane
Post Treatment Industrial, Municipal
Agricultural, Domestic
Sludge
Complex Organic Molecules
Monomers
Organic acids, Ketones, Alcohols
Acetate, CO2(g), H2(g)
Hydrolysis
Acidogenesis
Acetogenesis
Methane, CH4(g) Methanogenesis
Fermentative acetogenic bacteria
Methanogenic bacteria
Digestates
Fermentative acidogenic bacteria
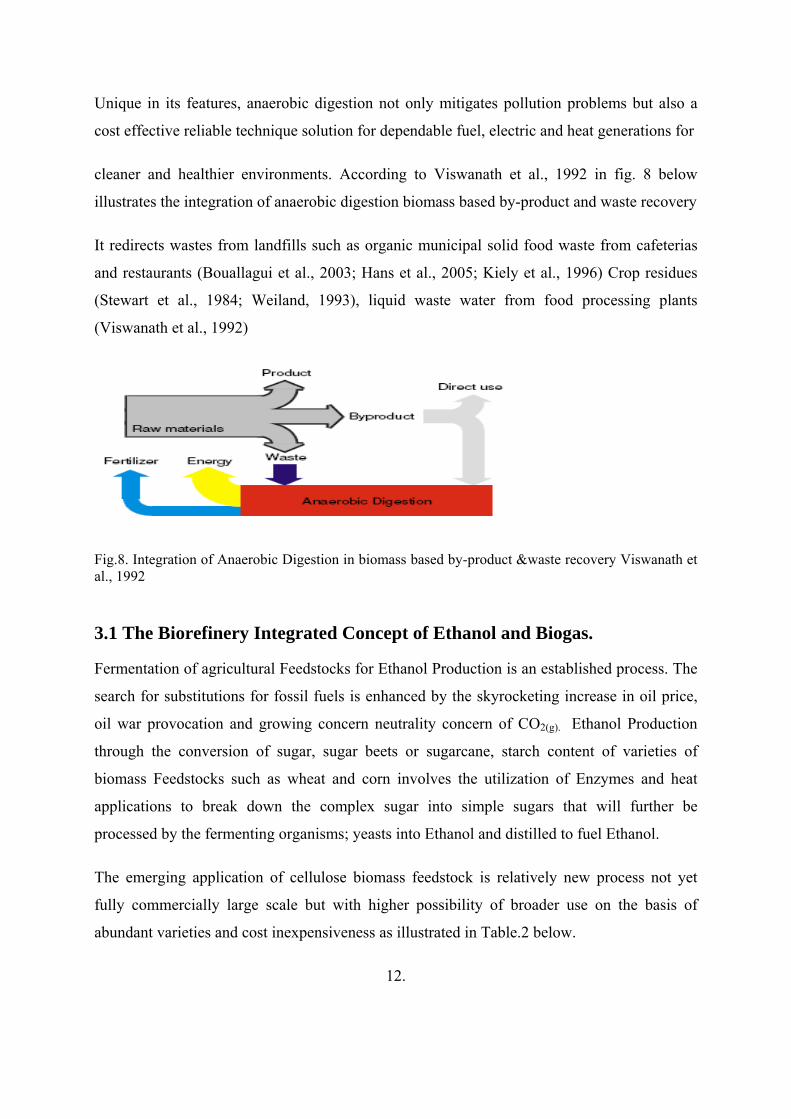
Unique in its features, anaerobic digestion not only mitigates pollution problems but also a
cost effective reliable technique solution for dependable fuel, electric and heat generations for
cleaner and healthier environments. According to Viswanath et al., 1992 in fig. 8 below
illustrates the integration of anaerobic digestion biomass based by-product and waste recovery
It redirects wastes from landfills such as organic municipal solid food waste from cafeterias
and restaurants (Bouallagui et al., 2003; Hans et al., 2005; Kiely et al., 1996) Crop residues
(Stewart et al., 1984; Weiland, 1993), liquid waste water from food processing plants
(Viswanath et al., 1992)
Fig.8. Integration of Anaerobic Digestion in biomass based by-product &waste recovery Viswanath et al., 1992
3.1 The Biorefinery Integrated Concept of Ethanol and Biogas.
Fermentation of agricultural Feedstocks for Ethanol Production is an established process. The
search for substitutions for fossil fuels is enhanced by the skyrocketing increase in oil price,
oil war provocation and growing concern neutrality concern of CO2(g). Ethanol Production
through the conversion of sugar, sugar beets or sugarcane, starch content of varieties of
biomass Feedstocks such as wheat and corn involves the utilization of Enzymes and heat
applications to break down the complex sugar into simple sugars that will further be
processed by the fermenting organisms; yeasts into Ethanol and distilled to fuel Ethanol.
The emerging application of cellulose biomass feedstock is relatively new process not yet
fully commercially large scale but with higher possibility of broader use on the basis of
abundant varieties and cost inexpensiveness as illustrated in Table.2 below.
12.
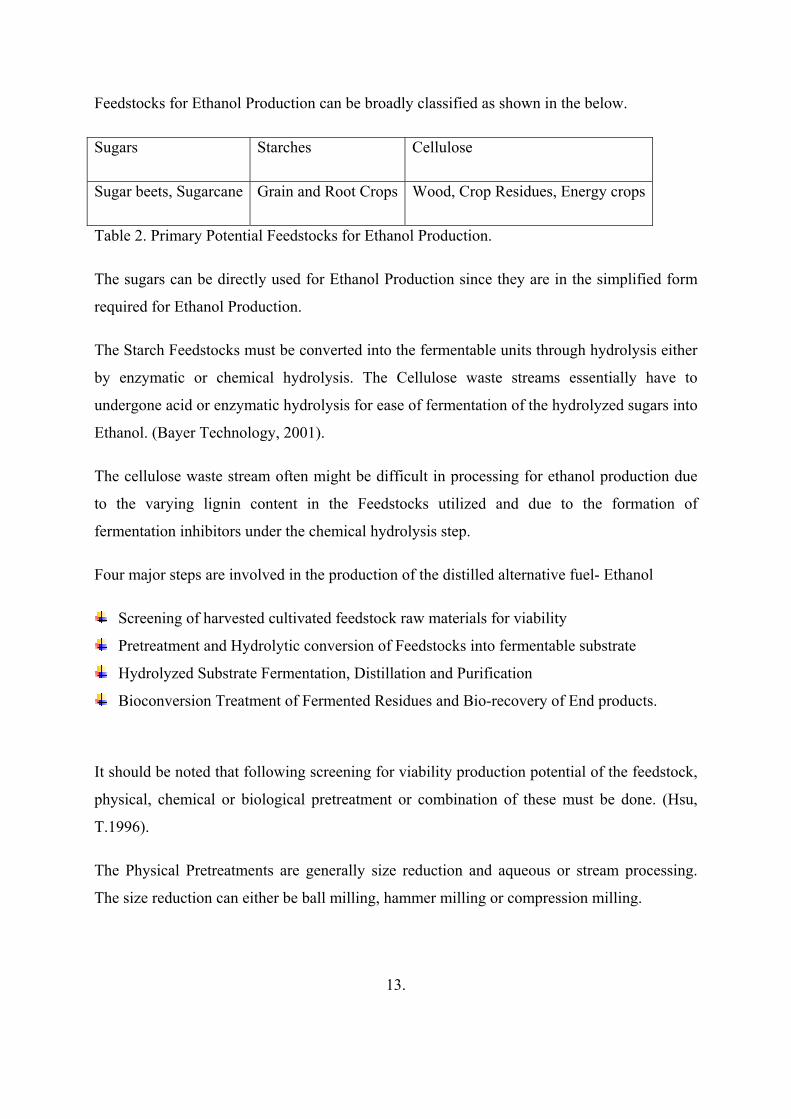
Feedstocks for Ethanol Production can be broadly classified as shown in the below.
Sugars Starches Cellulose
Sugar beets, Sugarcane Grain and Root Crops Wood, Crop Residues, Energy crops
Table 2. Primary Potential Feedstocks for Ethanol Production.
The sugars can be directly used for Ethanol Production since they are in the simplified form
required for Ethanol Production.
The Starch Feedstocks must be converted into the fermentable units through hydrolysis either
by enzymatic or chemical hydrolysis. The Cellulose waste streams essentially have to
undergone acid or enzymatic hydrolysis for ease of fermentation of the hydrolyzed sugars into
Ethanol. (Bayer Technology, 2001).
The cellulose waste stream often might be difficult in processing for ethanol production due
to the varying lignin content in the Feedstocks utilized and due to the formation of
fermentation inhibitors under the chemical hydrolysis step.
Four major steps are involved in the production of the distilled alternative fuel- Ethanol
Screening of harvested cultivated feedstock raw materials for viability
Pretreatment and Hydrolytic conversion of Feedstocks into fermentable substrate
Hydrolyzed Substrate Fermentation, Distillation and Purification
Bioconversion Treatment of Fermented Residues and Bio-recovery of End products.
It should be noted that following screening for viability production potential of the feedstock,
physical, chemical or biological pretreatment or combination of these must be done. (Hsu,
T.1996).
The Physical Pretreatments are generally size reduction and aqueous or stream processing.
The size reduction can either be ball milling, hammer milling or compression milling.
13.
Aqueous or steam pretreatment method is often acid or base catalyzed, the main objective of
this method is to process the feedstock biomass with hot water or steam applications at high
temperatures and pressures for short periods. In this process the use of acids and other
chemicals are minimized with high sugar recovery tendencies and minimal fermentation
inhibition.
Chemical Pretreatments use chemicals which can be acidic or alkaline solvents such as dilute
acid, ammonia and dilute alkaline solvents.
Biological Pretreatments are widely applicable for Cellulose feedstock digestion to solubilize
lignin and provide larger surface area for hydrolysis into fermentable sugars.
Combination of either of the Pretreatment methods may enhance the effective yield of
Ethanol Production. Combined pretreatments often result in separating components into
individual product streams as depicted by Technology adopted by Bayer involving an
Integration of Ethanol Production with the conversion of the Distillery waste product into
Biogas and its numerous application uses (Bayer Technology, 2001).
3.2 European Legislation and Policy on Biogas
The major objective of the European energy policy is to attain competitive, sustainable and
secure energy. Europe is increasingly becoming vulnerable to rising energy prices, climatic
change and to the unpredictable reserves of fossil fuel.
The ultimate key to attaining sustainable future depends on a drift to use of alternative
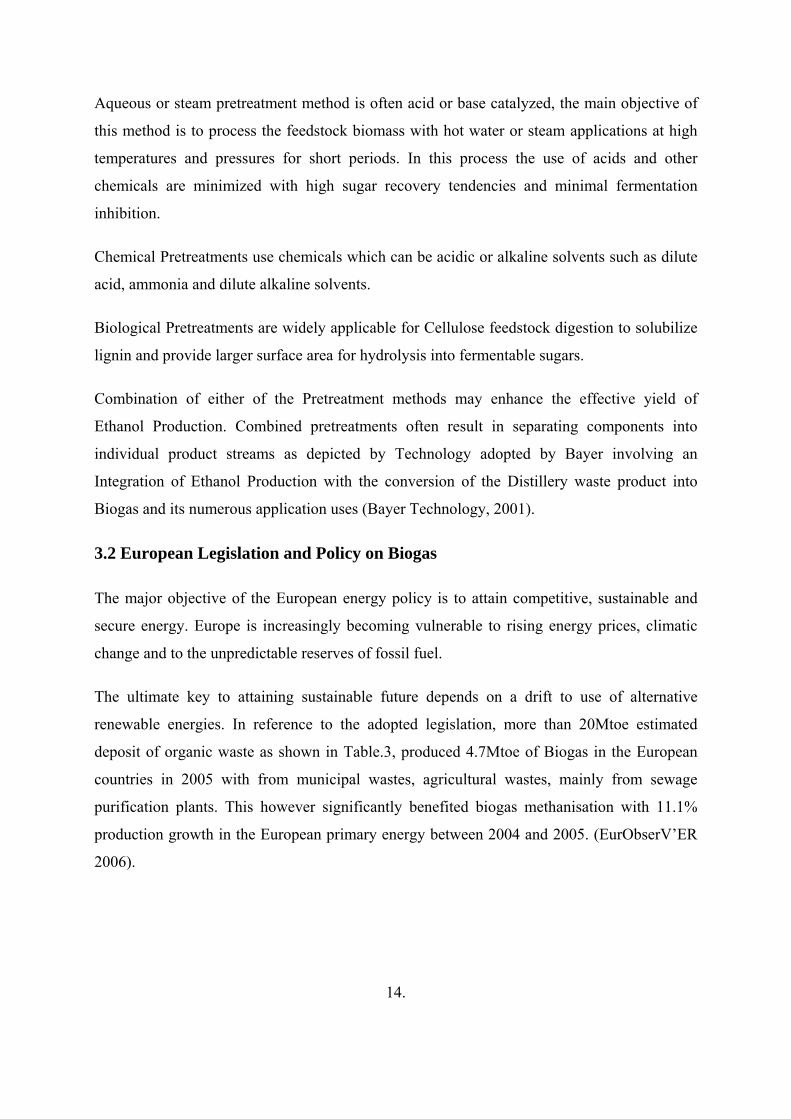
renewable energies. In reference to the adopted legislation, more than 20Mtoe estimated
deposit of organic waste as shown in Table.3, produced 4.7Mtoe of Biogas in the European
countries in 2005 with from municipal wastes, agricultural wastes, mainly from sewage
purification plants. This however significantly benefited biogas methanisation with 11.1%
production growth in the European primary energy between 2004 and 2005. (EurObserV’ER
2006).
14.
Summarily the European Union member States Biogas Legislations are:
To reduce green house emissions (Kyoto protocol 1997)
-Demand for renewable clean greenhouse gas emission-free fuels.
Increase in demand for energy-security energy supply
Promoting Environmental Sustainability
Promotion of biofuel for transport EU-Directive 2003, 2% Increase in 2005 to 5.75%
increase by 2010.
Projecting the European Economies Competitiveness.
Moreover the in the European States or the European countries there was marked noticeable
increase in Energy Production in kilotonnes as illustrated in Table.3 below between 2004-
2005).
Primary Production of Biogas (ktoe) in the European Union in 2004 and 2005.
Table 3. Source: EurObserV’ER 2006, European Commission on Energy EUROPA.
15.
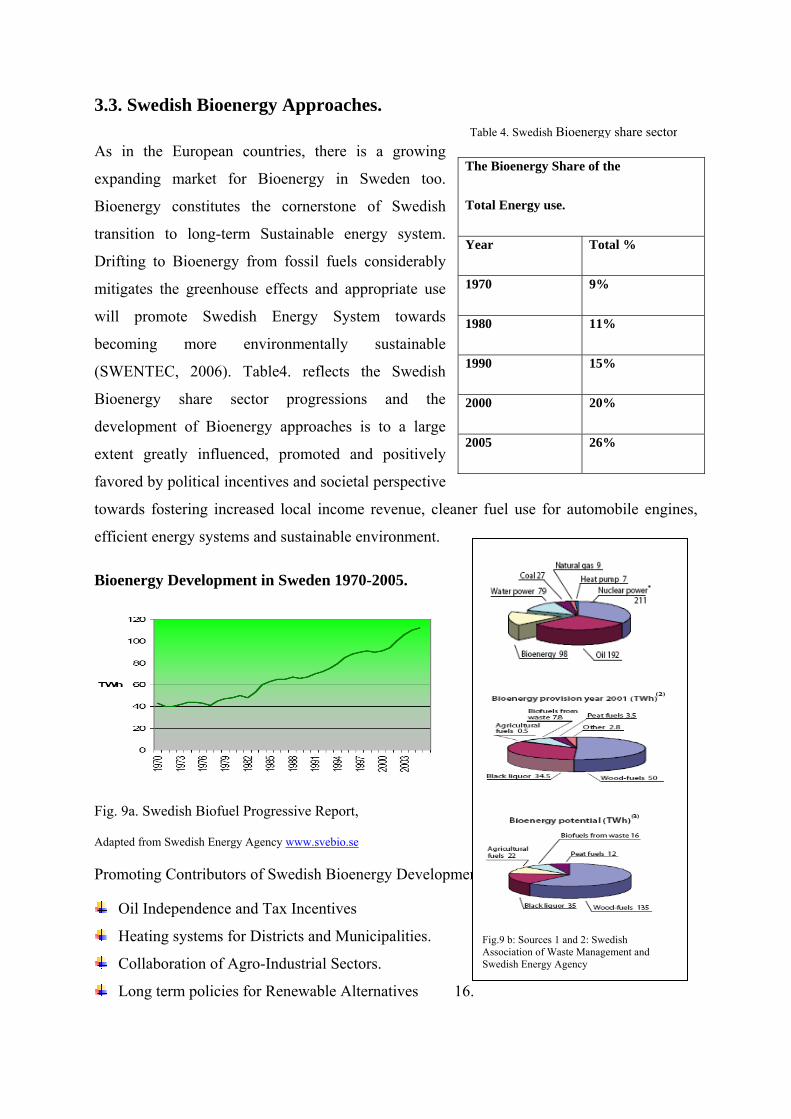
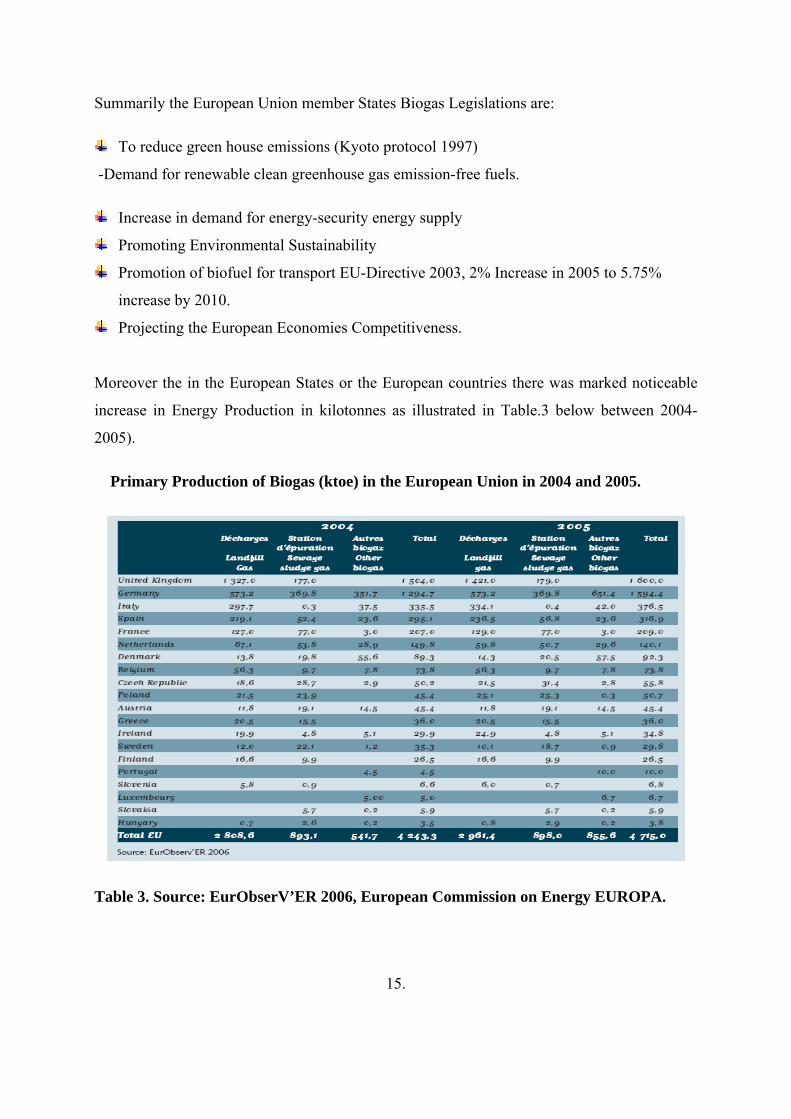
3.3. Swedish Bioenergy Approaches.
As in the European countries, there is a growing
expanding market for Bioenergy in Sweden too.
Bioenergy constitutes the cornerstone of Swedish
transition to long-term Sustainable energy system.
Drifting to Bioenergy from fossil fuels considerably
mitigates the greenhouse effects and appropriate use
will promote Swedish Energy System towards
becoming more environmentally sustainable
(SWENTEC, 2006). Table4. reflects the Swedish
Bioenergy share sector progressions and the
development of Bioenergy approaches is to a large
extent greatly influenced, promoted and positively
favored by political incentives and societal perspective
towards fostering increased local income revenue, cleaner fuel use for automobile engines,
efficient energy systems and sustainable environment.
Bioenergy Development in Sweden 1970-2005.
Fig. 9a. Swedish Biofuel Progressive Report,
Adapted from Swedish Energy Agency www.svebio.se
Promoting Contributors of Swedish Bioenergy Development.
Oil Independence and Tax Incentives
Heating systems for Districts and Municipalities.
Collaboration of Agro-Industrial Sectors.
Long term policies for Renewable Alternatives 16.
The Bioenergy Share of the
Total Energy use.
Year Total %
1970 9%
1980 11%
1990 15%
2000 20%
2005 26%
Fig.9 b: Sources 1 and 2: Swedish Association of Waste Management and Swedish Energy Agency
Table 4. Swedish Bioenergy share sector
Public Consumer Acceptance.
Effective Waste Management Technologies and Services.
Proven Technologies and International Partnerships
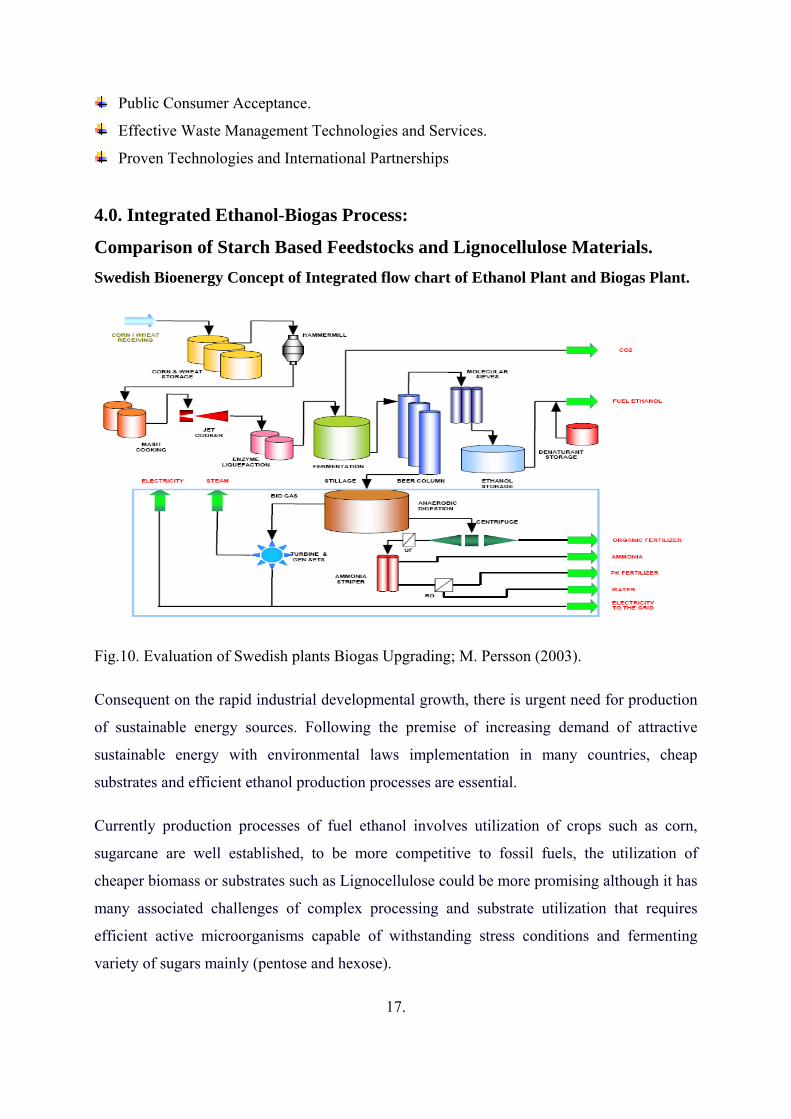
4.0. Integrated Ethanol-Biogas Process:
Comparison of Starch Based Feedstocks and Lignocellulose Materials. Swedish Bioenergy Concept of Integrated flow chart of Ethanol Plant and Biogas Plant.
Fig.10. Evaluation of Swedish plants Biogas Upgrading; M. Persson (2003).
Consequent on the rapid industrial developmental growth, there is urgent need for production
of sustainable energy sources. Following the premise of increasing demand of attractive
sustainable energy with environmental laws implementation in many countries, cheap
substrates and efficient ethanol production processes are essential.
Currently production processes of fuel ethanol involves utilization of crops such as corn,
sugarcane are well established, to be more competitive to fossil fuels, the utilization of
cheaper biomass or substrates such as Lignocellulose could be more promising although it has
many associated challenges of complex processing and substrate utilization that requires
efficient active microorganisms capable of withstanding stress conditions and fermenting
variety of sugars mainly (pentose and hexose).
17.
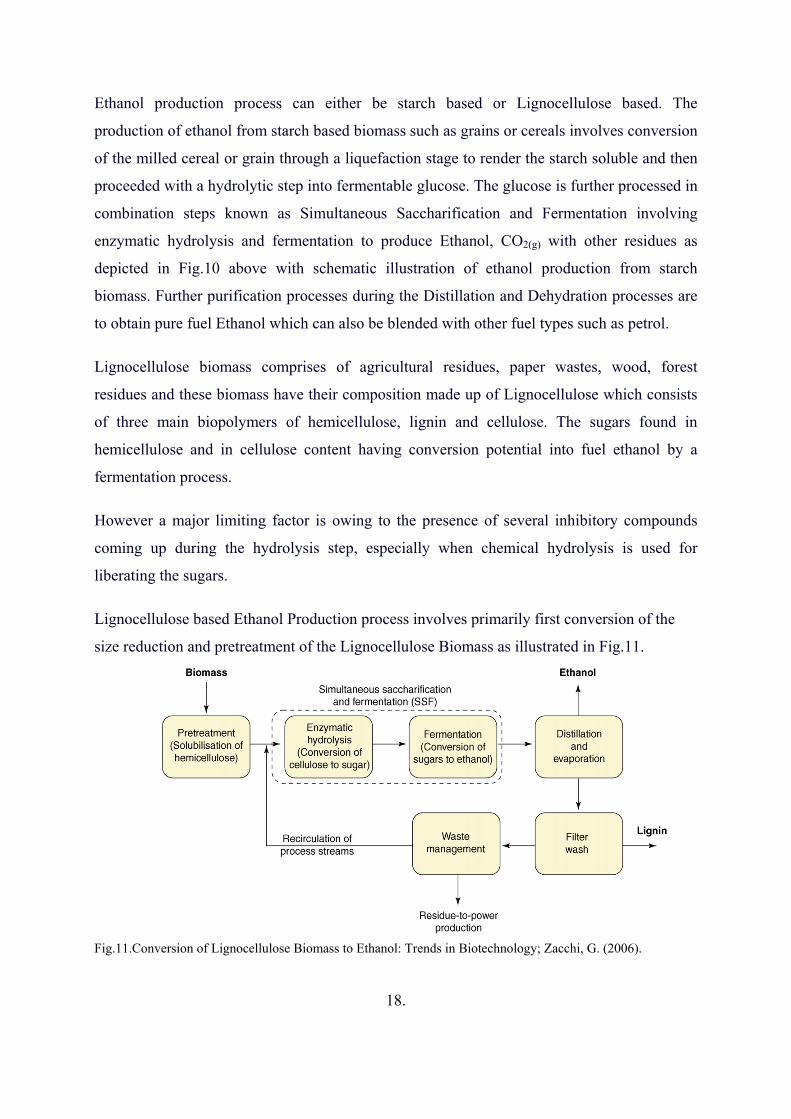
Ethanol production process can either be starch based or Lignocellulose based. The
production of ethanol from starch based biomass such as grains or cereals involves conversion
of the milled cereal or grain through a liquefaction stage to render the starch soluble and then
proceeded with a hydrolytic step into fermentable glucose. The glucose is further processed in
combination steps known as Simultaneous Saccharification and Fermentation involving
enzymatic hydrolysis and fermentation to produce Ethanol, CO2(g) with other residues as
depicted in Fig.10 above with schematic illustration of ethanol production from starch
biomass. Further purification processes during the Distillation and Dehydration processes are
to obtain pure fuel Ethanol which can also be blended with other fuel types such as petrol.
Lignocellulose biomass comprises of agricultural residues, paper wastes, wood, forest
residues and these biomass have their composition made up of Lignocellulose which consists
of three main biopolymers of hemicellulose, lignin and cellulose. The sugars found in
hemicellulose and in cellulose content having conversion potential into fuel ethanol by a
fermentation process.
However a major limiting factor is owing to the presence of several inhibitory compounds
coming up during the hydrolysis step, especially when chemical hydrolysis is used for
liberating the sugars.
Lignocellulose based Ethanol Production process involves primarily first conversion of the
size reduction and pretreatment of the Lignocellulose Biomass as illustrated in Fig.11.
Fig.11.Conversion of Lignocellulose Biomass to Ethanol: Trends in Biotechnology; Zacchi, G. (2006).
18.
Moreover, the pretreatment methods could be enzymatic, acid or alkaline pretreatment
methods. The enzymatic pretreatment amidst its limitations offers the most promising
pretreatment result. The hydrolysis of the cellulose and hemicellulose chains release the
repeating sugars which are then fermented by filamentous fungi, bacteria or yeasts
Although similar steps are involved but contrary to production of ethanol from starch biomass
there is need for Detoxification especially if Chemical hydrolysis methods are used before
Fermentation process in order to improve efficiency of the fermentation process and reduce
the Inhibitory concentration.
4.1. Ethanol Distillery Waste- Stillage.
One of the most polluting industries are the Alcohol distilleries, generating an average of 8-
15 L of Stillage effluent per liter of ethanol produced. (Saha et al., 2005). Stillage is a non
toxic biodegradable effluent which is the main source of pollution in distilleries. However,
Stillage treatment can also be energy recovery process to produce Biogas, which can be
obtained by anaerobic digestion of the Distillery waste- Stillage.
Qualities of Stillage differ following the various enormous feedstock sources applied for
Ethanol Product. Anaerobic digestion of Wheat Stillage is significantly different from other
Stillage obtained from molasses, fruits, potatoes, rice etc., higher protein contents and higher
saccharides of lower biodegradability account for the significant differences. (Miroslav et.al,
2005).
19.
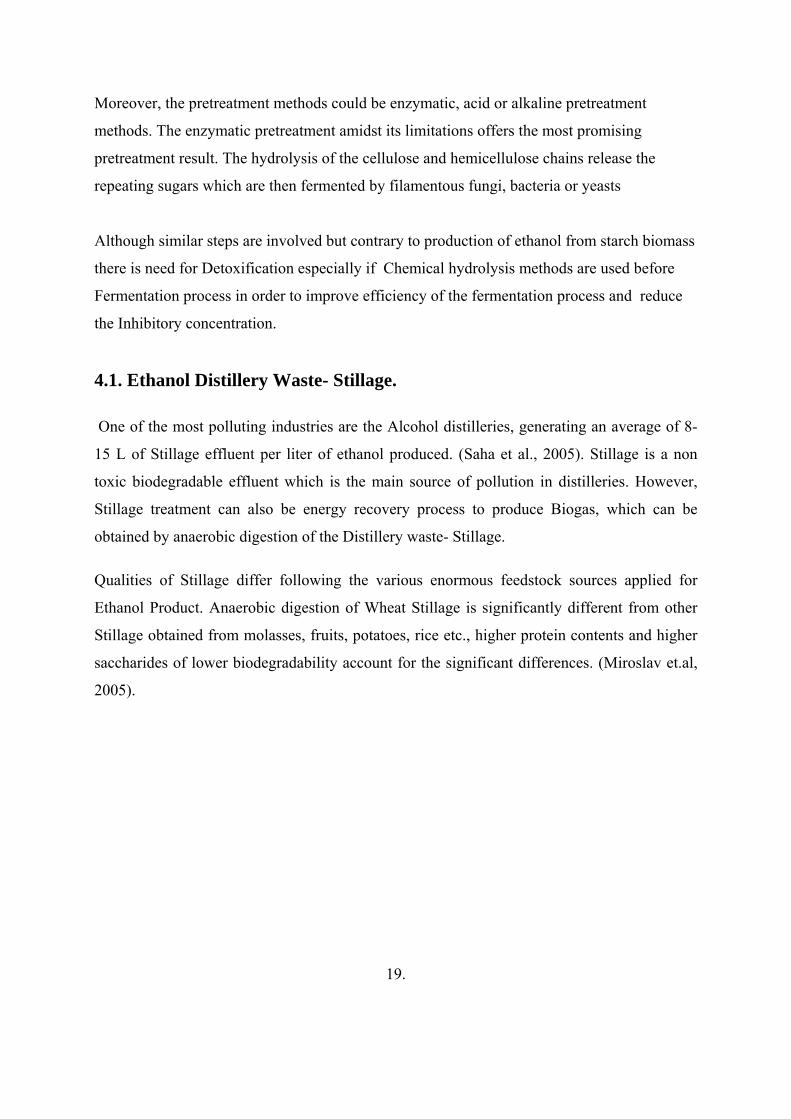
4.2. Stillage Characterization
Parameters for the characterization of Thin Stillage sample, a distillery waste obtained as
byproduct of Ethanol Production are basically the Total Solid Contents (TS), Volatile Solids
Contents(VS), Total Suspended Solids (TSS), Volatile Suspended Solids (VSS), Total
Chemical Oxygen Demand (TCOD), Volatile Fatty Acid (VFA), Total Protein (TP),
Carbohydrates mainly the Sugar (Glucose) Contents, Ratio of the Chemical Oxygen Demand-
Volatile Solids COD/VS, Ratio of the Volatile Solids-Total Solids fractions (VS/TS), pH.
The IOWA Biotechnology Byproducts Consortium, 2005 characterized Thin Stillage into
respective chemical contents with varying composition as shown in Table 5.
20.
Parameters Thin Stillage Sample
% TS 6.1
% VS 5.3
VS/TS 0.87
%TSS, %VSS 2.1
TCOD g/L 94
COD/VS 49
pH 1.8
Carbohydrates mg/L (glucose) 13, 600
TP, mg/L 1,292
VFA, mg/L 4.46
Table 5. Characterization of Thin Stillage, Iowa Biotechnology Consortium; Samir et al., 2005
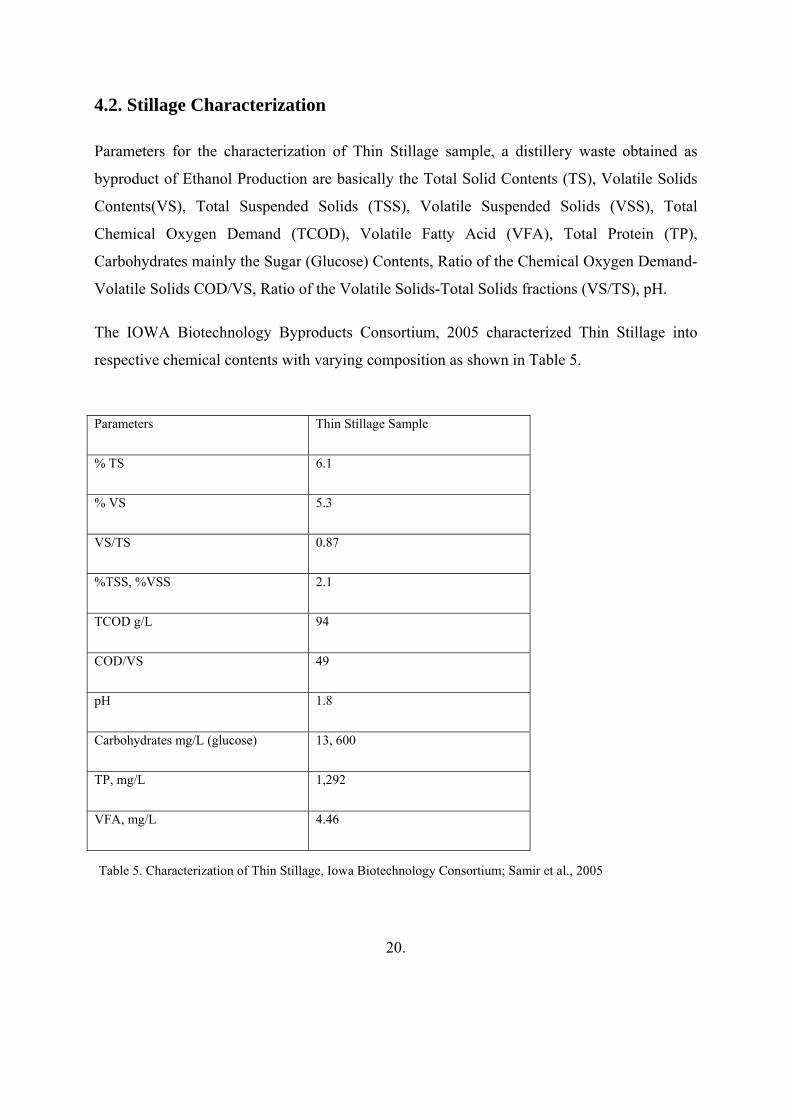
Ethanol fuel production is increasing rapidly around the world as depicted in Fig.12 below,
Fig.12. World fuel Ethanol Production; Renewable Fuels Association, 2005.
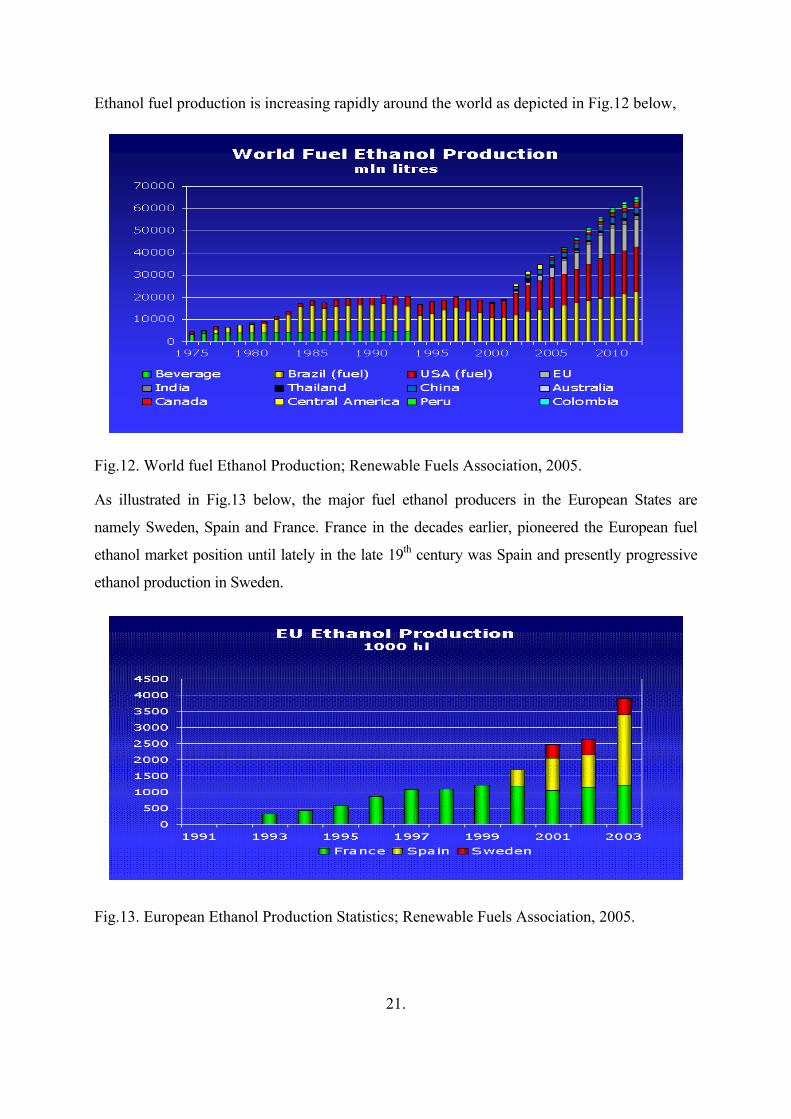
As illustrated in Fig.13 below, the major fuel ethanol producers in the European States are
namely Sweden, Spain and France. France in the decades earlier, pioneered the European fuel
ethanol market position until lately in the late 19th century was Spain and presently progressive
ethanol production in Sweden.
Fig.13. European Ethanol Production Statistics; Renewable Fuels Association, 2005.
21.

II. AIMS AND METHODOLOGY
22.
2. Research Objectives The Research thesis primarily focuses on Biogas Potential of different Stillage Samples using
batch digestion under both Thermophilic conditions and Mesophilic conditions with focus on
comparison of the Potentials and Efficacy of Anaerobic Digestion of Stillage (Wheat Stillage
and Lignocellulose Stillage) from Ethanol Distillery plants for Biogas Production.
It also investigates comparison of temperature dependent Anaerobic Digestion processes
either Thermophilic Anaerobic Digestion or Mesophilic Anaerobic Digestion in determining a
better alternative temperature dependent Stillage Anaerobic Digestion that will enhance a
higher Biogas yield.
Distillery Ethanol By-Product Stillage samples from Swedish Ethanol producing plants
(Agroetanol, Norrköpping and SECAB Örnsköldsviz were collected. The Stillage Samples
were stored at 4ºC. Based on the hygroscopic nature of the Stillage samples with high varying
percentage of moisture, for precision, the general chemical analyses were experimentally
conducted on dry weight.
The samples were characterized and analyzed for total solids TS (%), volatile solids VS (%),
Carbohydrate content (Sugar), total nitrogen TN (%) and total fat TF (%)based on standard
determination test methods for organic biomass samples. The total nitrogen and total fat
contents of the Stillage samples (Wheat and Lignocellulose), were performed at AK Lab
research institute. However, it should be noted that the characteristics of Stillage are highly
subjected to the feedstock and the dependent on the ethanol production process.
2.1. Standard Method for Total Solids Analysis of Stillage Samples.
Primarily based on the determination of the total solids contents, that is the sample residue left
in the crucible after evaporation of the Stillage samples (Wheat Stillage and Lignocellulose
Stillage) using National Renewable Laboratory Energy Standard Methods in a convection
oven at 105°C. The Total Solid Content (%) is the amount of sample residues remaining
following heating the Stillage samples in a convection oven at a temperature of 105°C
expressed in (%).
23.
2.1.2. Test Principle: A well mixed sample of each Stillage is evaporated in a weighed dish
and dried to a constant weight in a convection oven for overnight at a temperature of 105°C,
the weighed samples are placed in the during the above specified time and dried until a
constant mass is obtainable.
2.1.3. Equipment and Apparatus:
• Porcelain evaporating crucibles of approx. 90mm diameter,
• Analytical balance with sensitivity capable of weighing 0.01g
• Drying oven for operation at 103°C-105°C temperature
• Desiccator
• Micropipettes
• Magnetic Stirrer
• Metal Tongs.
2.2. Standard Convection Oven Drying Procedure for TS % Stillage Samples.
The Convection Oven Procedure based on the ASTM E1756-01 method by Department of
Energy, the National Renewable Energy Laboratory (NREL) 2005, USA was adopted in this
standard test determination method for the Stillage samples to be analyzed as it is easy to use,
precise, relatively cheap test method, widely acceptable standard method with vast range of
applications and simultaneous analyses of many samples. Although the method has some
limitations as it is unsuitable for determination of solids in some heat sensitive liable samples
and time consuming.
2.2.1. Precision.
The Stillage Samples (Wheat and Lignocellulose) were run in triplicates to attain for accuracy
and negligible deviation.
Data Computations and analyses are referenced in the appendix section.
The % TS result from the laboratory procedures and that determined by the AKo Lab were
reported in the appendix.
24.
The % TS is reported to two decimal places, samples were analyzed in triplicates with
average report of replicate samples analyzed.
2.3. Standard Determination of Volatile Solids Content (VS %) of Stillage Samples.
Sample solids lost upon ignition at firing temperature of 550°C (±25°C) are Volatile Solids.
Analysis of Volatile solids in a sample has important application in that it gives rough
estimation of the amount of organic matter present in the industrial wastes and effluents, solid
fraction of wastewater and activated sludge.
Muffle Furnace Analytical Procedure of Volatile Solids Analysis of Stillage Samples.
a). After determining the final weight in total solids analysis, the respective cooled oven dried
Stillage samples and crucible were placed in a muffle furnace and ignited at 550°C at a ±25°C
for exactly 1hr.
b). Following the ignition duration for complete combustion process to take place, the oven
ignition switch is switched off and allowed to cool down for 10 minutes.
c). The cooled muffle furnace dried samples were then placed and kept in desiccator for an
hour. Immediately after samples were allowed to desiccate, samples were weighed together
with the crucible in the sensitive analytical measuring balance.
Cautions Taken.
Three replicates were analyzed for the Stillage samples (Wheat Stillage WS and
Lignocellulose Stillage LS) for reasonable statistical average measure. Comparable precision
with Total solids performed and Illustration of Data Computations on Volatile Solids analyses
obtained from laboratory procedure and from AKo Lab annexed in appendix section.
25.
2.4. Thermophilic and Mesophilic Anaerobic Digestion of Distillery Ethanol Waste-
Stillage for Methane Production.
2.4.1. Introduction.
A batch digestion procedure was employed with modifications of existing technique by
Angelidaki and Ahring (2004) for measuring the methane potential resulting from anaerobic
digestion of the Distillery Ethanol waste- Stillage (Wheat and Lignocellulose derived).
Triplicate reactors of Wheat Stillage and Lignocellulose Stillage of samples 2.73g and 5.20g
respectively, corresponding to 2%VS in the digester were incubated with 20ml of active
inoculum coming from full scale Thermophilic Biogas Plant (Sobacken-Borås) at 35°C in
water bath shaker under Mesophilic anaerobic conditions and 55°C under Thermophilic
anaerobic conditions over a 50-day digestion cycle. Reference material (Avicel) was used as
Control and water as blank instead of the substrates
The methane production was regularly monitored over the 50days digestion phase and the
concentration of methane was measured with gas chromatograph.
The inoculum for laboration was from full scale Thermophilic Biogas Plant (Sobacken-Borås)
for the thermophilic digestions as well as from a Mesophilic Plant (Gässlosa, Borås) for the
Mesophilic experiments.
26.
2.4.2 Materials and Supplies.
2.4.2.1. Equipments and Apparatus.
The below list of laboratory equipments and apparatus were used during the laboration.
• 50ml Measuring Cylinders and 50ml Beakers
• 5ml Test tubes and 5ml Micropipettes
• Glass bottles of around 118ml with thick rubber septum- determination of volume of each
reactor done by weighing contained water in the glass bottles (reactors).
• Temperature regulated and adjustable incubator for thermophilic digestion at 55°C
• 250µl pressure lock glass syringe for fixed volume at exact pressure from reactors.
• Weighing balance (sensitivity measurement ≈100g-200g)
• Temperature-regulated Water bath shaker (35°C) for Mesophilic anaerobic digestion.
• Gas Chromatograph thermal FID detector and methane standards.
2.4.3 Samples, Reagents and Supplies.
• Gas Mixture of 20% CO2(g) and 80% N2(g)
• A Cellulose Avicel powder to be use for Reference
• Creamy liquid Wheat Stillage and black liquid Lignocellulose Stillage
• Active Inoculum from thermophilic Biogas Plant, Sobacken-Borås and Mesophilic Biogas
Plant, Gässlosa-Borås.
The inoculum was stored at 55°C with an anaerobic headspace in an incubator for 2days.
2.5. Method
Stillage distillery wastes collected from the Ethanol production plant of Norrköpping (Wheat
Based) and from the pilot plant Ethanol Plant (Lignocellulose Based) Örnsköldsviz -Sweden
were investigated. The effluent Stillage samples were stored in the cooling room.
27.
2.5.1. Laboratory Experimental Procedures.
The laboratory investigation procedure was performed as triplicate batch test runs for each
temperature digestion conditions, that is at Mesophilic (35°C) or Thermophilic (55°C).
Pure N2(g) gas could be used for flushing as alternative.
The triplicate reactors were then placed in the incubator at 35°C or 55°C. Occasionally during
incubation, the triplicate reactor batches were gently shaken and moved to readjust minor
temperature variation difference in the incubator. In case of Mesophilic digestion, the reactors
were placed in temperature regulated adjustable water bath at 35°C .The water level in the
water bath shaker is consistently monitored and top up daily to facilitate optimal
environmental incubation conditions for the digestion of the samples.
The procedure set-up was also experimented using blanks with only 20µl inoculum and 5ml
distilled water to measure the amount of Methane yield from the inoculum. The quality of the
inoculum was also tested in addition using a triplicate of Reference Cellulose Avicel for each
run.
28.
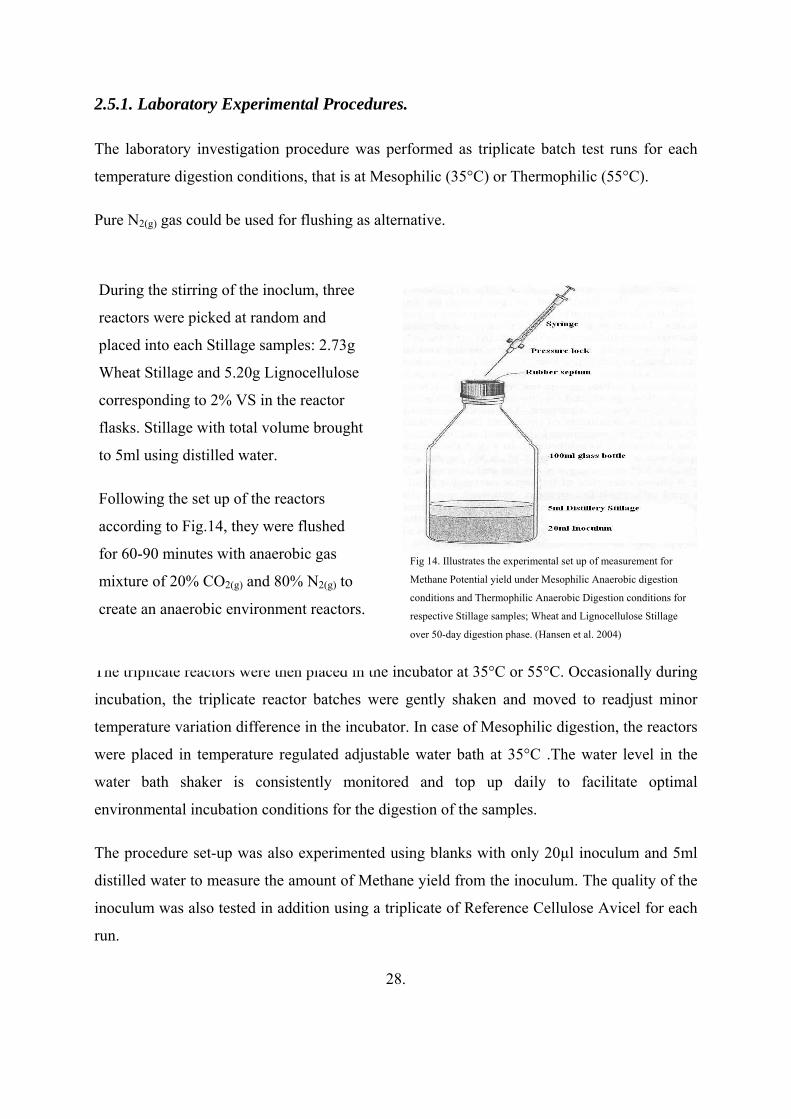
During the stirring of the inoclum, three
reactors were picked at random and
placed into each Stillage samples: 2.73g
Wheat Stillage and 5.20g Lignocellulose
corresponding to 2% VS in the reactor
flasks. Stillage with total volume brought
to 5ml using distilled water.
Following the set up of the reactors
according to Fig.14, they were flushed
for 60-90 minutes with anaerobic gas
mixture of 20% CO2(g) and 80% N2(g) to
create an anaerobic environment reactors.
Fig 14. Illustrates the experimental set up of measurement for
Methane Potential yield under Mesophilic Anaerobic digestion
conditions and Thermophilic Anaerobic Digestion conditions for
respective Stillage samples; Wheat and Lignocellulose Stillage
over 50-day digestion phase. (Hansen et al. 2004)
Placed on a magnetic stirrer at steady stirring revolution 20ml inoculum was transferred using
the measuring cylinder to each triplicate reactor. Three reactors were picked at random during
the inoculum stirring and added with each Stillage samples: 2.73g Wheat Stillage and 5.20g
Lignocellulose Stillage with total volume brought to 5ml using distilled water.
The reactors were flushed for 60-90 seconds with anaerobic gas mixture of 20% CO2(g) and
80% N2(g) to create an anaerobic environment in the headspace of the glass bottles (reactors)
following the set up. Refer to Fig.14 above for illustration of the experimental set up.
2.5.2. Experimental Consistency and Monitoring.
The methane levels in the headspace reactors were consistently and regularly measured
throughout the 50-day digestion phase. During the first week, daily measurements were taken,
followed by once a week afterwards measurements.
The methane samples about 250µl were taken with a pressure lock syringe through the septum
from the headspace of the reactors. Following the syringe’s penetration into each reactor’s
headspace, was the pressure lock closure for possible sampling of fixed volume of methane
gas at exact pressure conditions in each reactor.
Measuring the Methane content in the samples before and after releasing the pressure from
the reactors, the produced volume of the methane can be calculated. The fixed volume of the
gas is taken by syringe withdrawal and directly injected into gas chromatograph for exact
measurement of the number of moles of the methane gas.
29.

30.
III. RESULTS
3. RESULTS.
3.1 Data Analyses and Presentations.
The Results of the (TS %) and (VS %) annexed in the appendix section rounded up to two
decimal places. The samples were analyzed in triplicates with average values of triplicate
analyzed respective values reported.
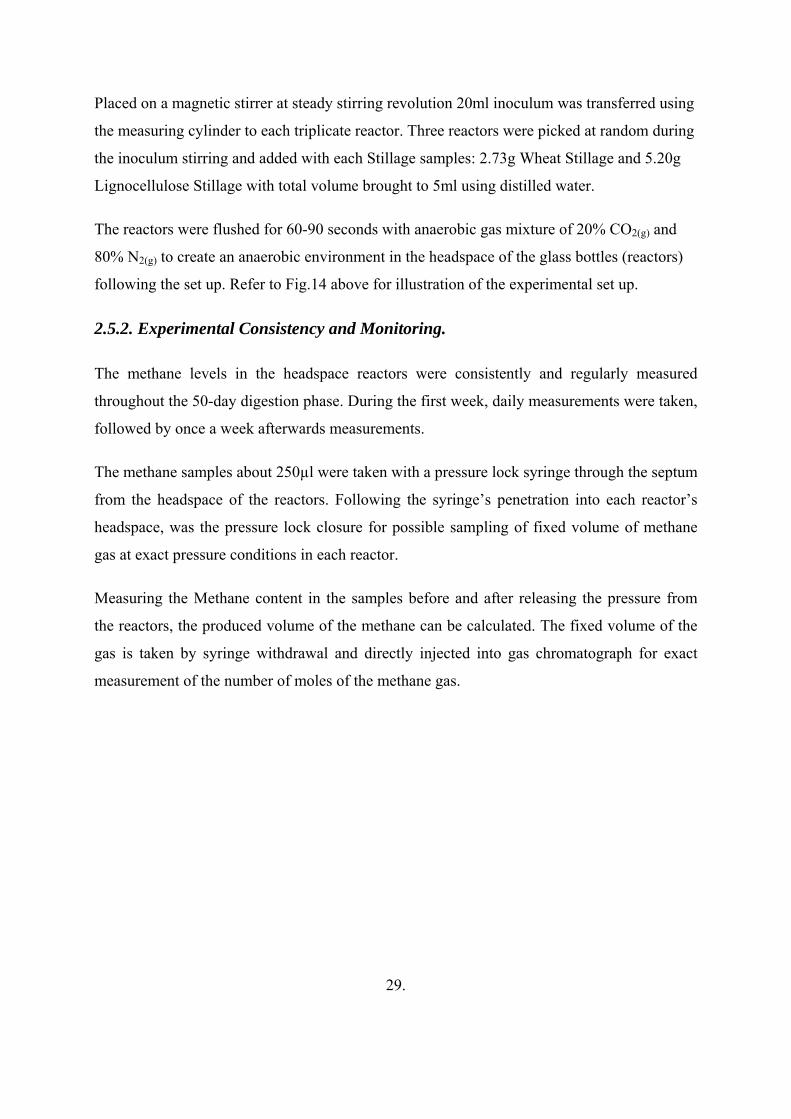
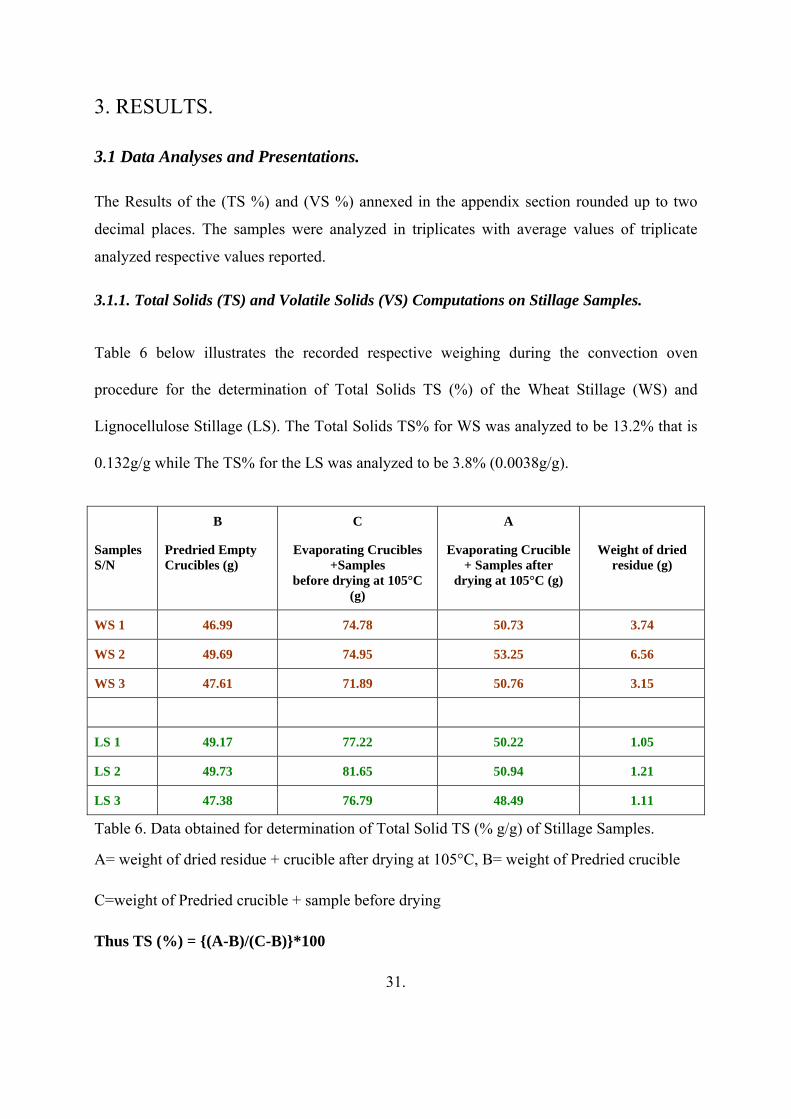
3.1.1. Total Solids (TS) and Volatile Solids (VS) Computations on Stillage Samples.
Table 6 below illustrates the recorded respective weighing during the convection oven
procedure for the determination of Total Solids TS (%) of the Wheat Stillage (WS) and
Lignocellulose Stillage (LS). The Total Solids TS% for WS was analyzed to be 13.2% that is
0.132g/g while The TS% for the LS was analyzed to be 3.8% (0.0038g/g).
Samples S/N
B
Predried Empty Crucibles (g)
C
Evaporating Crucibles +Samples
before drying at 105°C (g)
A
Evaporating Crucible + Samples after
drying at 105°C (g)
Weight of dried residue (g)
WS 1 46.99 74.78 50.73 3.74
WS 2 49.69 74.95 53.25 6.56
WS 3 47.61 71.89 50.76 3.15
LS 1 49.17 77.22 50.22 1.05
LS 2 49.73 81.65 50.94 1.21
LS 3 47.38 76.79 48.49 1.11
Table 6. Data obtained for determination of Total Solid TS (% g/g) of Stillage Samples.
A= weight of dried residue + crucible after drying at 105°C, B= weight of Predried crucible
C=weight of Predried crucible + sample before drying
Thus TS (%) = {(A-B)/(C-B)}*100
31.
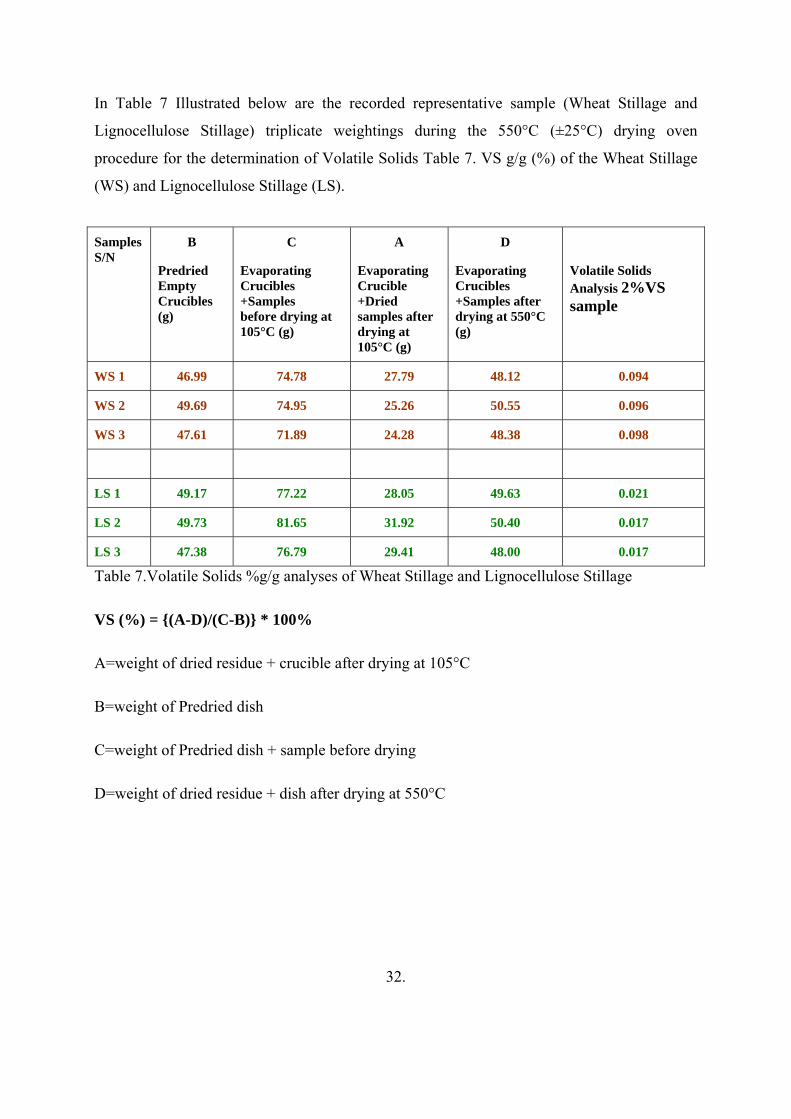
In Table 7 Illustrated below are the recorded representative sample (Wheat Stillage and
Lignocellulose Stillage) triplicate weightings during the 550°C (±25°C) drying oven
procedure for the determination of Volatile Solids Table 7. VS g/g (%) of the Wheat Stillage
(WS) and Lignocellulose Stillage (LS).
Table 7.Volatile Solids %g/g analyses of Wheat Stillage and Lignocellulose Stillage
VS (%) = {(A-D)/(C-B)} * 100%
A=weight of dried residue + crucible after drying at 105°C
B=weight of Predried dish
C=weight of Predried dish + sample before drying
D=weight of dried residue + dish after drying at 550°C
32.
Samples S/N
B
Predried Empty Crucibles (g)
C
Evaporating Crucibles +Samples before drying at 105°C (g)
A
Evaporating Crucible +Dried samples after drying at 105°C (g)
D
Evaporating Crucibles +Samples after drying at 550°C (g)
Volatile Solids Analysis 2%VS sample
WS 1 46.99 74.78 27.79 48.12 0.094
WS 2 49.69 74.95 25.26 50.55 0.096
WS 3 47.61 71.89 24.28 48.38 0.098
LS 1 49.17 77.22 28.05 49.63 0.021
LS 2 49.73 81.65 31.92 50.40 0.017
LS 3 47.38 76.79 29.41 48.00 0.017
3.2. Anaerobic Digestion of Ethanol Distillery Stillage Samples.
The data presentation and evaluation of triplicate batch reactors for each samples with
consecutive triplicate series for Wheat Stillage and Lignocellulose Stillage each which
resulting in a total of 12 reactors including cellulose controls, the control blanks (inoculum
and water only) and the Stillage Samples, each in triplicates was computed and analyzed
using MS Excel-sheet .
The amount of Methane produced was directly measured on the GC based on the volume of
the headspace of each triplicate reactors of each Stillage Samples. The CH4(g)-content per
0.25ml of reactor headspace was determined. For every measurements two readings from
each samples are taken and recorded before the pressure is released and after the pressure is
released to obtain the CH4(g) number of moles of each samples. For every measurement of the
Methane gas produced (nm, CH4(g)) at (T, Celsius (298K)= 22°C) and Atmospheric
Pressure(Patm,= 101325 Pa), the volume of the methane produced is determined with reference
to the Peak Area standard methane mole number (nstd) the number of mole (n)of Methane gas
(nCH4) as deduced from GC analyses.
After running each samples readings of the Standard (100%) Methane is also determined.
Simply the methane gas yield is determined by measuring the concentration of before
pressure is released under experimental parameters of (T, Celsius (298K) = 22°C) and
Atmospheric Pressure (Patm, = 101325 Pa) is:
Standard 100% Methane = n(std); n(std) = (pVm)/(RT)
Where (Atmospheric Standard Pressure): Patm, = 101325 Pa, (Sample Volume): Vm= 250 * 10-
9(m3), (Ideal Standard Gas Constant): R=8,314 and (Sampling Temperature) T= T, Celsius
(298K) = 22°C.
33.
Thus, the number of mole of methane in the reactor can be deduced from the equation,
nstd = (A/Astd) X (nstd.93000/250), that is , n=(A/Astd)*nstd*372
where A= Area of each Stillage sample obtained from the GC curve
A(std) = Area of the standard methane (100%) analyzed
n(std) = number of moles of the standard methane (100%) analyzed
372 is derived from the ratio of the volume of the reactor by the volume of injected methane
It is important to note also that Vflask is the gas space in flask obtained by subtracting the
volume of the sampling mixture contents from the volume of the flask, which was 93ml.
Hence for the number of mole of Methane gas for each Sample is calculated and
n1aý is the number of moles of methane produced before the release pressure in reactor
n1bý is the number of moles of methane produced after release of pressure in the reactor
The Volume of the produced Methane however is obtained in between the respective
measurements before (na) and after (nb) release of pressure and can be derived by applying
the equation below, hence the produced methane in between ý and ý+1 measurements was can
be calculated by
V(produced, m3) = ((naý+1 - nbý)*(R*T))/ Patm
The Volume of methane produced can be deduced using the mathematical formula above.
The Maximal produced Methane during the 50-day incubation digestion phase is referred to
as the Methane potential. The result of the amount of Methane content produced in sample
analyzed is thus the CH4 (g) produced per.
34.
3.2.1. Mesophilic Anaerobic Digestion of Ethanol Distillery Waste
Wheat Stillage.
WS
0,000
0,020
0,040
0,060
0,080
0,100
0,120
0,140
0,160
1st 2nd 3th 4th 5th 6th
Weeks
Vol
ume
of B
ioga
s (L
)
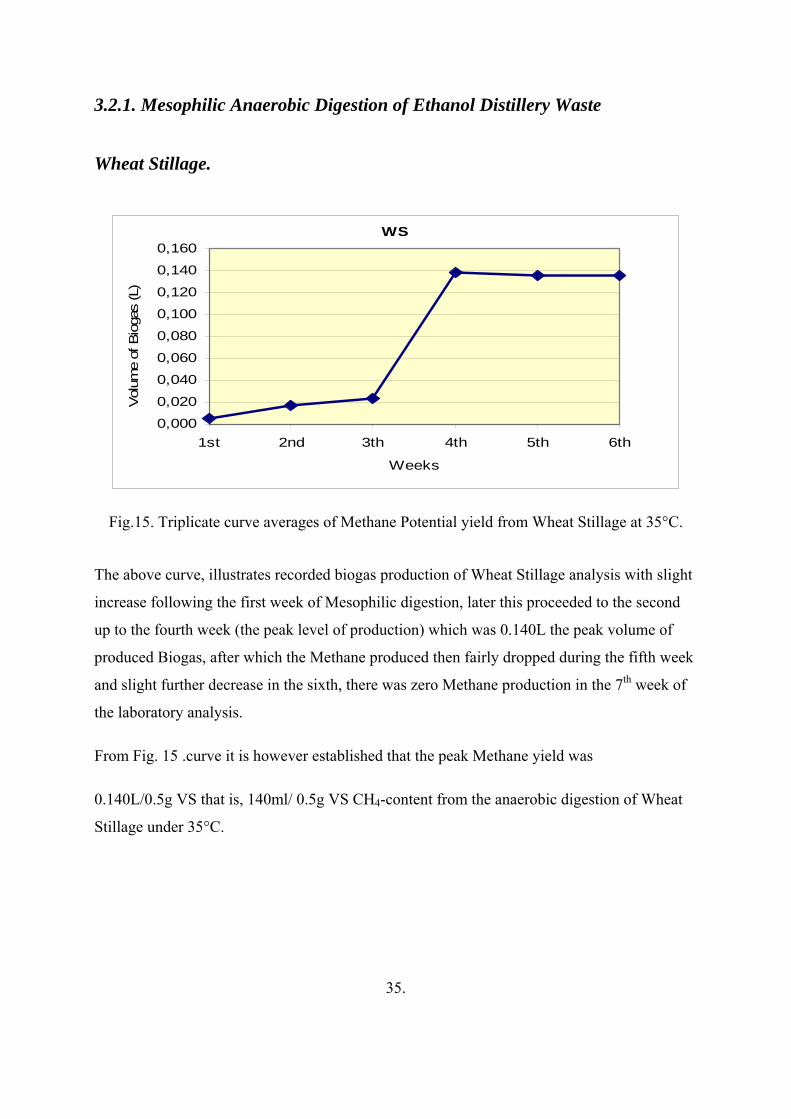
Fig.15. Triplicate curve averages of Methane Potential yield from Wheat Stillage at 35°C.
The above curve, illustrates recorded biogas production of Wheat Stillage analysis with slight
increase following the first week of Mesophilic digestion, later this proceeded to the second
up to the fourth week (the peak level of production) which was 0.140L the peak volume of
produced Biogas, after which the Methane produced then fairly dropped during the fifth week
and slight further decrease in the sixth, there was zero Methane production in the 7th week of
the laboratory analysis.
From Fig. 15 .curve it is however established that the peak Methane yield was
0.140L/0.5g VS that is, 140ml/ 0.5g VS CH4-content from the anaerobic digestion of Wheat
Stillage under 35°C.
35.
3.2.2. Mesophilic Anaerobic Digestion of Stillage Samples
Lignocellulose Stillage
LS
0,0000,0500,1000,1500,2000,2500,3000,3500,4000,4500,500
1st 2nd 3th 4th 5th 6th
Weeks
Vol
ume
of B
ioga
s (L
)
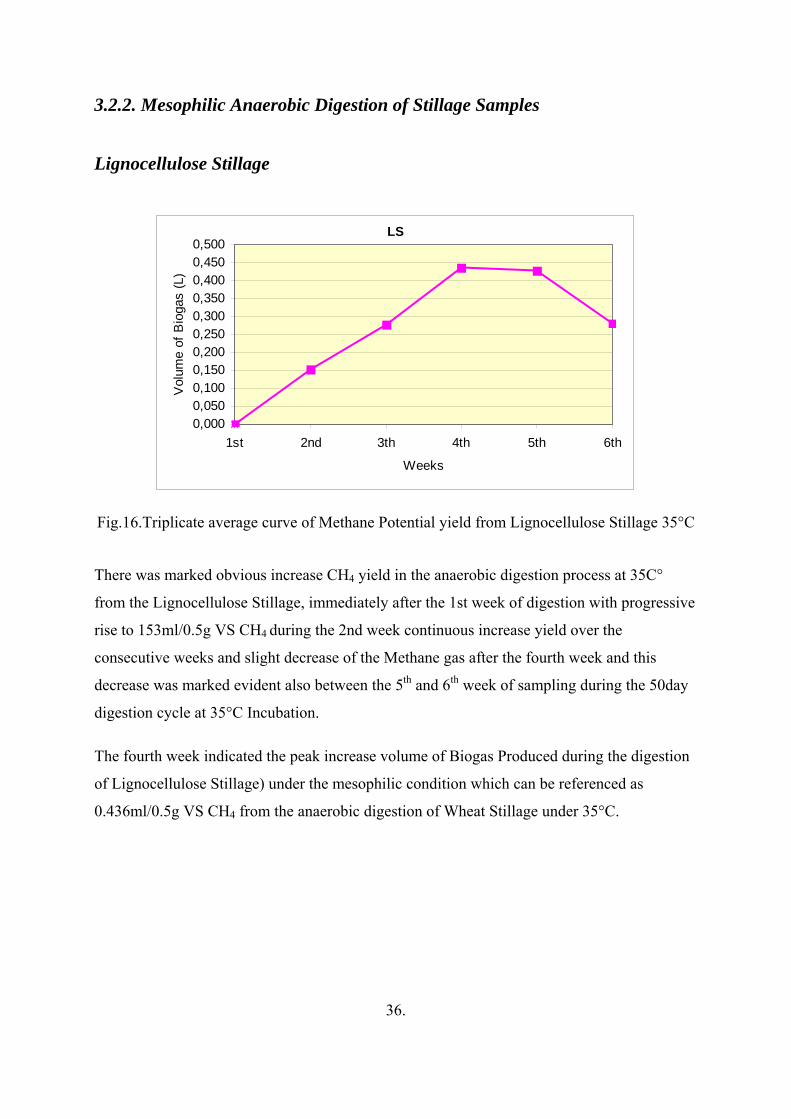
Fig.16.Triplicate average curve of Methane Potential yield from Lignocellulose Stillage 35°C
There was marked obvious increase CH4 yield in the anaerobic digestion process at 35C°
from the Lignocellulose Stillage, immediately after the 1st week of digestion with progressive
rise to 153ml/0.5g VS CH4 during the 2nd week continuous increase yield over the
consecutive weeks and slight decrease of the Methane gas after the fourth week and this
decrease was marked evident also between the 5th and 6th week of sampling during the 50day
digestion cycle at 35°C Incubation.
The fourth week indicated the peak increase volume of Biogas Produced during the digestion
of Lignocellulose Stillage) under the mesophilic condition which can be referenced as
0.436ml/0.5g VS CH4 from the anaerobic digestion of Wheat Stillage under 35°C.
36.
3.2.3. Mesophilic Anaerobic Digestion of Stillage Samples
Comparison of Wheat Stillage and Lignocellulose Stillage.
WS vs LS
0,0000,0500,1000,1500,2000,2500,3000,3500,4000,4500,500
1st 2nd 3th 4th 5th 6th
Weeks
Vol
ume
of B
ioga
s (L
)
WSLS
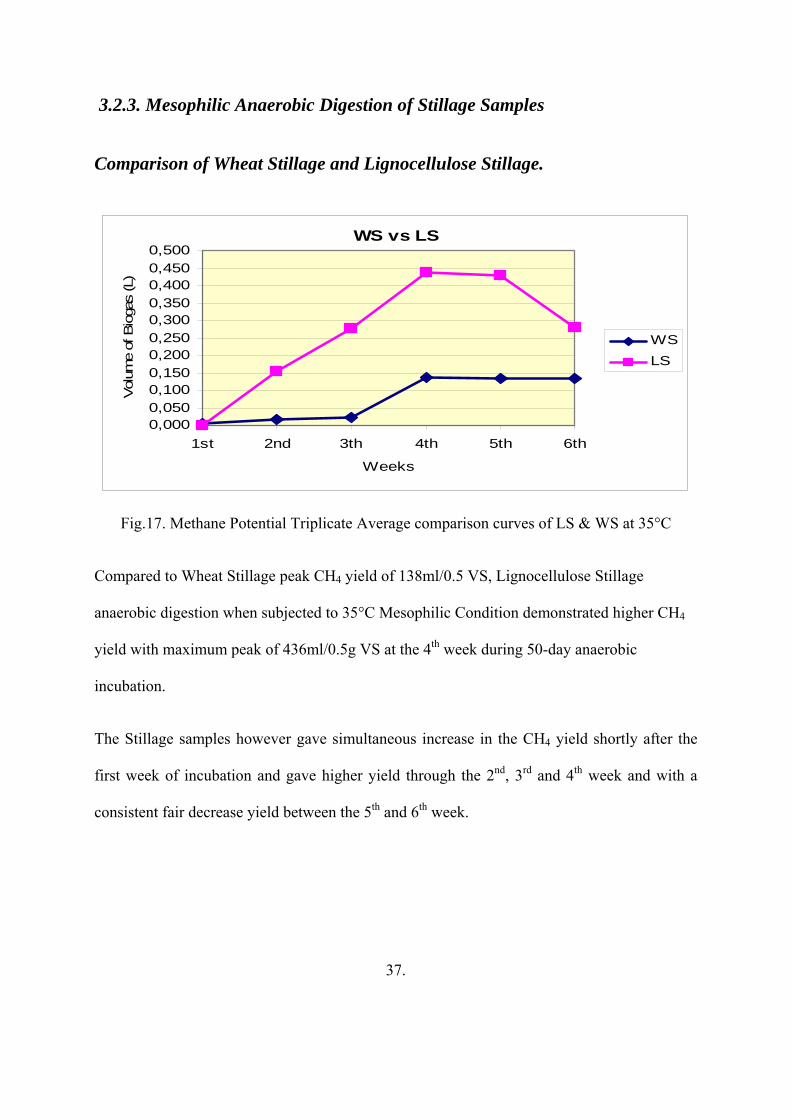
Fig.17. Methane Potential Triplicate Average comparison curves of LS & WS at 35°C
Compared to Wheat Stillage peak CH4 yield of 138ml/0.5 VS, Lignocellulose Stillage
anaerobic digestion when subjected to 35°C Mesophilic Condition demonstrated higher CH4
yield with maximum peak of 436ml/0.5g VS at the 4th week during 50-day anaerobic
incubation.
The Stillage samples however gave simultaneous increase in the CH4 yield shortly after the
first week of incubation and gave higher yield through the 2nd, 3rd and 4th week and with a
consistent fair decrease yield between the 5th and 6th week.
37.
3.3. Thermophilic Anaerobic Digestion of Stillage Samples.
Wheat Stillage.
WS
0,1000,1500,2000,2500,3000,3500,4000,4500,5000,5500,600
1st 2nd 3th 4th 5th 6th
Weeks
Vol
ume
of B
ioga
s (L
)
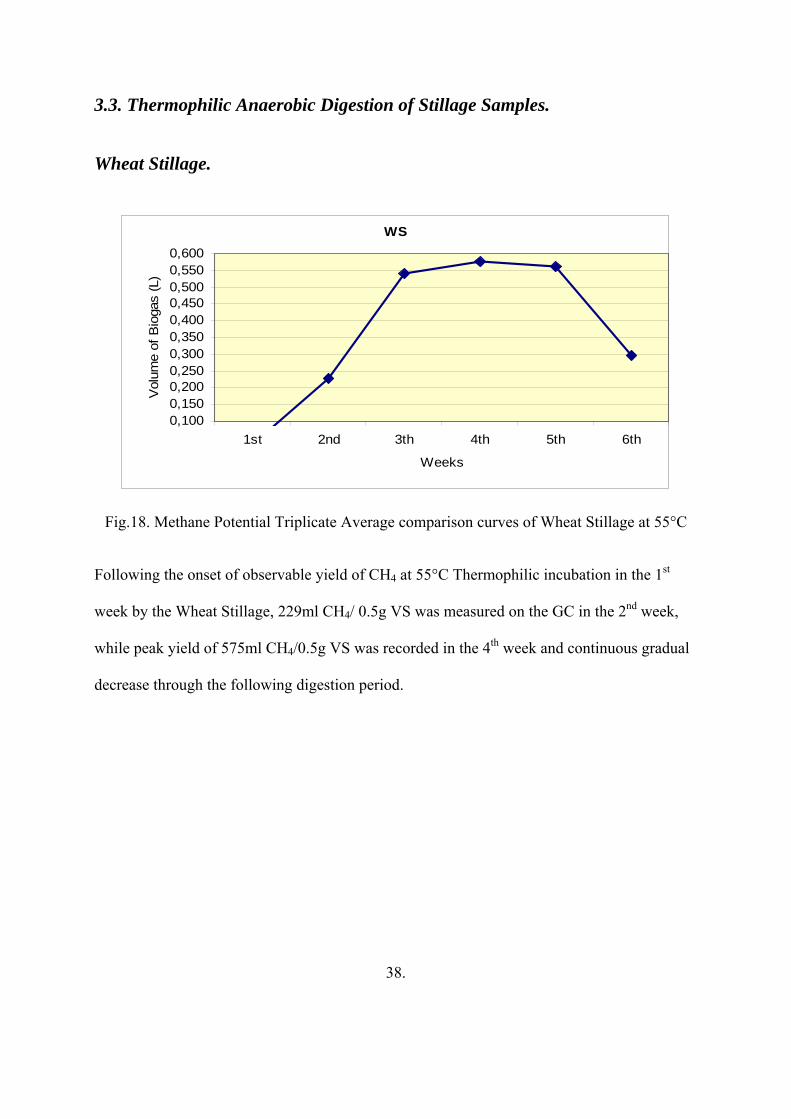
Fig.18. Methane Potential Triplicate Average comparison curves of Wheat Stillage at 55°C
Following the onset of observable yield of CH4 at 55°C Thermophilic incubation in the 1st
week by the Wheat Stillage, 229ml CH4/ 0.5g VS was measured on the GC in the 2nd week,
while peak yield of 575ml CH4/0.5g VS was recorded in the 4th week and continuous gradual
decrease through the following digestion period.
38.
3.3.1. Thermophilic Anaerobic Digestion of Stillage Samples.
Lignocellulose Stillage
LS
0,0000,0200,0400,0600,0800,1000,1200,1400,160
1st 2nd 3th 4th 5th 6th
Weeks
Vol
ume
of B
ioga
s (L
)
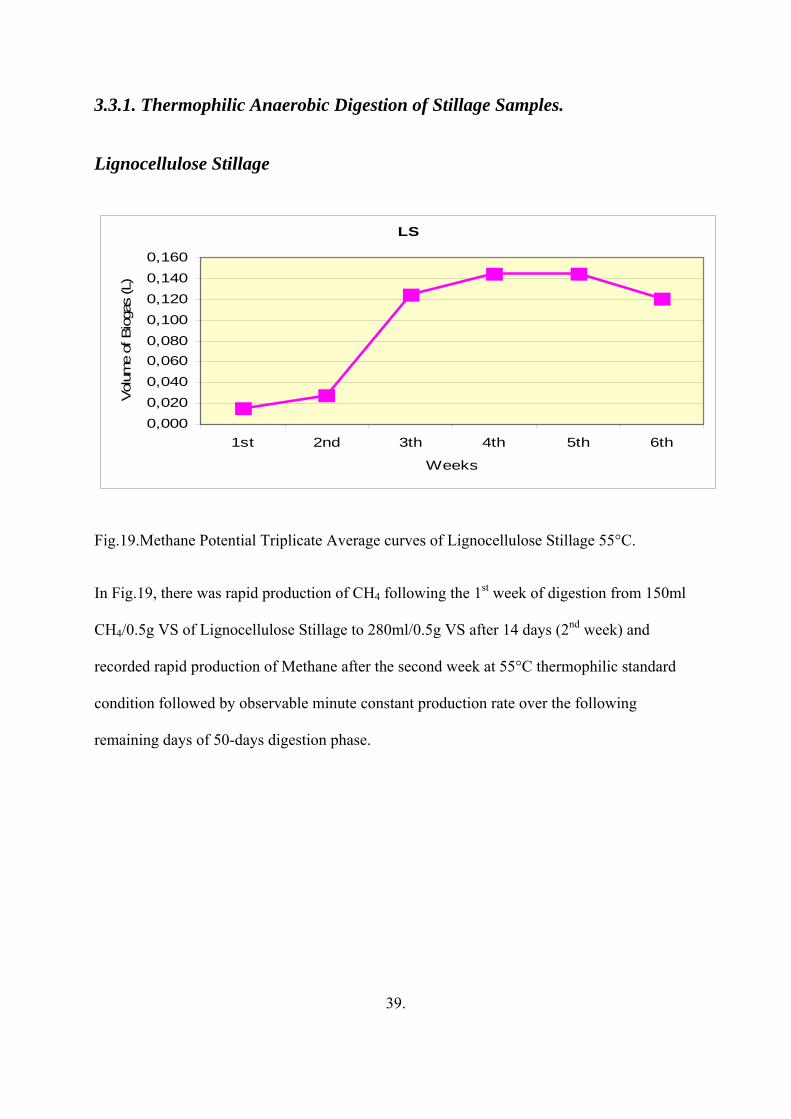
Fig.19.Methane Potential Triplicate Average curves of Lignocellulose Stillage 55°C.
In Fig.19, there was rapid production of CH4 following the 1st week of digestion from 150ml
CH4/0.5g VS of Lignocellulose Stillage to 280ml/0.5g VS after 14 days (2nd week) and
recorded rapid production of Methane after the second week at 55°C thermophilic standard
condition followed by observable minute constant production rate over the following
remaining days of 50-days digestion phase.
39.
3.3.2. Thermophilic Anaerobic Digestion of Stillage Samples
Comparison of Wheat Stillage and Lignocellulose Stillage.
WS vs LS
0,000
0,100
0,200
0,300
0,400
0,500
0,600
0,700
1st 2nd 3th 4th 5th 6th
Weeks
Vol
ume
of B
ioga
s (L
)
WSLS
Fig.20. Methane Potential Triplicate Average Comparison curves of LS & WS at 55°C
The Lignocellulose Stillage demonstrated higher digestibility compared to the Wheat Stillage.
This however can be referenced to the curves above with more methane produced by the
Wheat Stillage of about 575ml/0.5g VS in contrast to 145ml/0.5g VS by Lignocellulose
Stillage during the peak period of digestion; that is the 4th week.
However in both Stillage Samples there was marked progressive increase in production of
CH4 evident from the 2nd week onwards and significant increase rate over the 3rd and 4th
weeks and decrease yield of CH4 towards the completion of the thermophilic anaerobic
digestion condition at 55°C.
40.
3.3.3. Comparisons of the Temperature Anaerobic Digestion Conditions on
Stillage Samples (Wheat Stillage and Lignocellulose Stillage), Reference
Cellulose Controls and Blanks.
Thermophilic Digestion 55°C Mesophilic Digestion 35°C
0,000
0,100
0,200
0,300
0,400
0,500
0,600
0,700
1st 2nd 3th 4th 5th 6th
Weeks
Vol
ume
of B
ioga
s (L
)
WSLSRfCS
0,0000,0500,1000,1500,2000,2500,3000,3500,4000,4500,500
1st 2nd 3th 4th 5th 6th
Weeks
Vol
ume
of B
ioga
s (L
)
WSLSRfCS
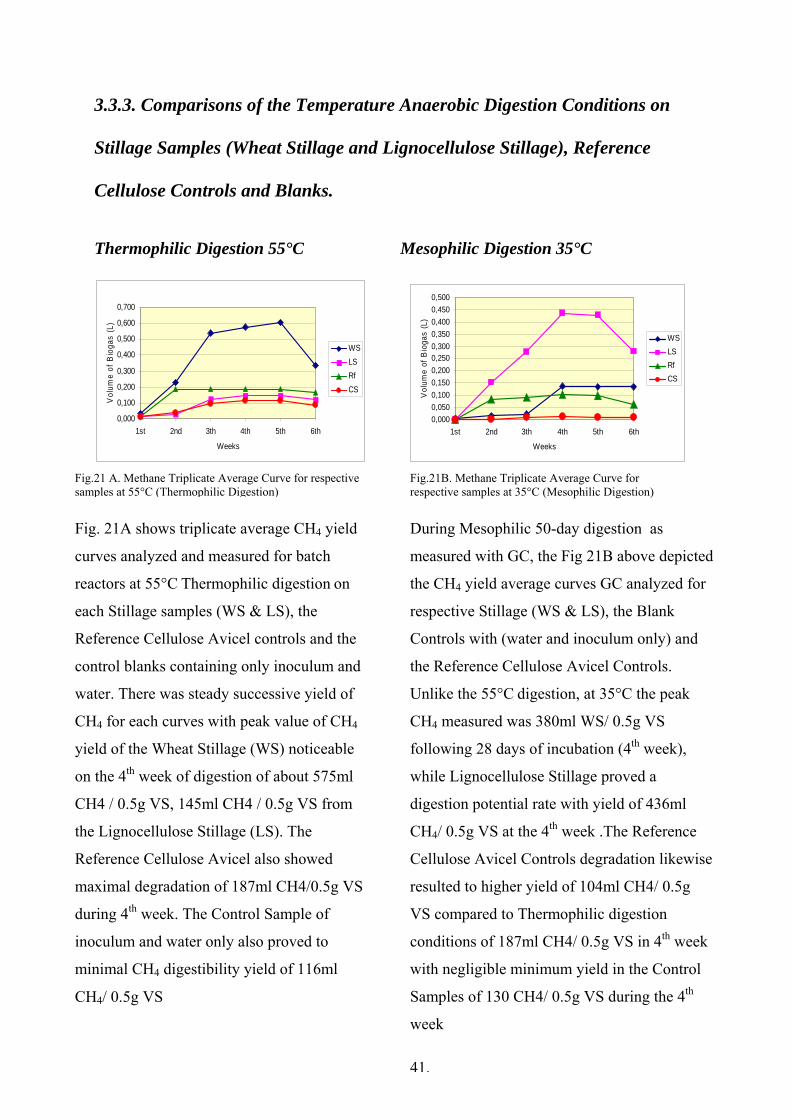
Fig. 21A shows triplicate average CH4 yield
curves analyzed and measured for batch
reactors at 55°C Thermophilic digestion on
each Stillage samples (WS & LS), the
Reference Cellulose Avicel controls and the
control blanks containing only inoculum and
water. There was steady successive yield of
CH4 for each curves with peak value of CH4
yield of the Wheat Stillage (WS) noticeable
on the 4th week of digestion of about 575ml
CH4 / 0.5g VS, 145ml CH4 / 0.5g VS from
the Lignocellulose Stillage (LS). The
Reference Cellulose Avicel also showed
maximal degradation of 187ml CH4/0.5g VS
during 4th week. The Control Sample of
inoculum and water only also proved to
minimal CH4 digestibility yield of 116ml
CH4/ 0.5g VS
During Mesophilic 50-day digestion as
measured with GC, the Fig 21B above depicted
the CH4 yield average curves GC analyzed for
respective Stillage (WS & LS), the Blank
Controls with (water and inoculum only) and
the Reference Cellulose Avicel Controls.
Unlike the 55°C digestion, at 35°C the peak
CH4 measured was 380ml WS/ 0.5g VS
following 28 days of incubation (4th week),
while Lignocellulose Stillage proved a
digestion potential rate with yield of 436ml
CH4/ 0.5g VS at the 4th week .The Reference
Cellulose Avicel Controls degradation likewise
resulted to higher yield of 104ml CH4/ 0.5g
VS compared to Thermophilic digestion
conditions of 187ml CH4/ 0.5g VS in 4th week
with negligible minimum yield in the Control
Samples of 130 CH4/ 0.5g VS during the 4th
week
41.
Fig.21B. Methane Triplicate Average Curve for respective samples at 35°C (Mesophilic Digestion)
Fig.21 A. Methane Triplicate Average Curve for respective samples at 55°C (Thermophilic Digestion)

42.
IV. DISCUSSIONS & CONCLUSIONS
DISCUSSIONS AND CONCLUSIONS
The CH4 Potential analysis gave same yield value for Wheat Stillage and Lignocellulose
Stillage as 0.473 m3CH4/kg VS and 0.407 m3CH4/kg VS respectively.
The Total Fat (TF) Content of the Wheat Stillage was much higher having value of 73.8g/kg
VS while Lignocellulose Stillage was zero. The Total Nitrogen Content (TN) of the
Lignocellulose Stillage of about 4.7g/kg TS was on the other hand much less compared than
the Total Nitrogen Content(TN) of the Wheat Stillage which is 63.8 g/kg TS. The Protein
Contents of the Wheat Stillage analyzed were significantly much higher in amount having the
values of 389.3g/kg TS Protein Content while the Carbohydrate content was much lower
463.1g/kg TS Carbohydrate Content relative to 416.7g/kg TS Carbohydrate of Lignocellulose
Stillage.
The Ammonium content of the Wheat Stillage is 1.46g/ kg TS about twice more than that of
the Lignocellulose Stillage with 0.7g/kg TS Ammonium content.
The above analyses however reflect the fact that the decline Methane CH4 production by
Wheat Stillage could be likely subjected to the higher Protein values which might have been
inhibited by ammonia. This however is in contrast to the elevated production of Methane gas
by the Lignocellulose Stillage with lower Protein Content although there could be some other
inhibitors that might likely be present with negligible inhibitory effects.
The decreased methane production by the Wheat Stillage unlike Lignocellulose Stillage can
be accounted with reference high amount of 73.8g/kgTS Fat Content with associated probable
effects of long chain fatty acids during degradation process conditions.
In addition, negative methane potential yields observed might be suggested to be presence of
inhibitory substances likely to be present in both Wheat Stillage and Lignocellulose Stillage
samples resulting in lower methane which can be attributed to the high protein content of the
Wheat Stillage with resultant ammonium inhibitory effects and other probable inhibitors in
the Lignocellulose compared to yields from the control batches with inoculum and water only.
It is essential to investigate further experimentally in future studies, the possible inhibitory
sources associated with the Stillage Samples to obtain increased CH4 potential result.
43.
Potential promising recommendations in attaining extensive research findings in determining
the associated inhibitory effects for negative CH4 produced center on possible cost effective
pretreatment methods, Enzymatic Upgrading, Co-digestion with other Organic Waste
Streams.
Biogas future as a renewable alternative fuel depends to some extent on how western
countries and other developing nations address the enormous challenge of controlling
greenhouse gases and atmospheric emissions of carbon dioxide. In addition, another
important factor of production of Biogas from Ethanol Distillery Waste depends relatively on
improved production technology for Ethanol from economically cost affordable cellulose-
based Feedstocks.
The Concept of Stillage Utilization for Biogas Production offers effective Waste Management
and Resource Development solutions with positive measures for the economy, improved air
quality and sustained energy security, the crucial necessary however revolves round is a clear
vision and strong collaborative partnership among the various stakeholders.
The AK Lab analytical experimental result (ref. Table 10) presented the potential methane
analysis of each respective Stillage, that is, Wheat Stillage and Lignocellulose Stillage have
gas potential CH4(g) yield of 0.4m3 CH4/kgVS with the CH4(g) constituting with the 70% CH4
content of the produced Biogas. Hence the method will be very viable but will have to be tried
on a pilot scale so the necessary modification made for a commercial system.
44.

45.
VI. REFERENCES.
References. Angelidaki, I., Ahring, B.K., (1992). Effects of free long-chain fatty acids on thermophilic
anaerobic digestion. Applied Microbiology and Biotechnology 37, 808-812.
Bouallagui, H.; Touhami, Y.; Ben Cheikh, R.; Hamdi, M. (2005) “Bioreactor performance in anaerobic digestion of fruit and vegetable wastes.” Process Biochemistry 40(3-4): pp 989-999.
Biofuel Review Magazine, December 2006.
Biogas Upgrading and Utilization, IEA Bioenergy (International Energy Agency) (2004). Biofuels for transport: an international perspective. International Energy Agency, OECD
Christoph Berg., (2004). WORLD FUEL ETHANOL ANALYSIS AND OUTLOOK
Danish Biogas Co-digestion for Energy and Environment, Washington, D.C., (2006).
EurObservER (2006). European Commission on Energy Publications (EUROPA) http://ec.europa.eu/energy/res/publications/barometers_en.htm.
Farrell et al. (2006) Ethanol can contribute to energy and environmental goals. Science 311, p.506–508. F.O. Licht, (2004).World Ethanol & Biofuels Report, V2 N. 19.
F.O. Licht., (2005): cited in Renewable Fuels Association, Homegrown for the Homeland: Industry Outlook 2005, Washington, DC: p. 14
Focus Bioenergy (2003). A REVIEW, Swedish Bioenergy Association. www.svebio.se
Hagen. et al., (2001). Adding gas from biomass to the gas grid, SGC report 118.
Hansen, T.L, Schmidt, J.E., Angelidaki, I., Marca, E., Jansen, J.C., Mosbaek, H., et al. (2004). Method for determination of Methane potential of solid waste. Waste Management and Research, 24:393-400. Holm J B (2000), The future of biogas in Europe, a general overview.
Hsu, T, (1996). Pretreatment of Biomass in Handbook in Ethanol: Production and Utilization; pp 179-212.
Josephine Bahr, (2006). Swedish Energy agency Presentation of Bioenergy in Sweden. Seminar of -biogas in Sacramento. Published by SWENTEC, Swedish Environmental Technology Council.
Kiely, G.; Tayfur, G.; Dolan, C.; Tanji, K (1997). “Physical and Mathematical modeling of -Anaerobic Digestion of Organic Wastes.” Water Research 31 (3): 534-540.
46.
Licht FO., (2004). Ethanol production costs: a worldwide survey. Agra Informa Ltd, Kent, United Kingdom http://www.agra-net.com.
Microslav Hutnnan, Marek Honak, Vladimir Havaklar (2005). Proceedings of the 30th International Conference of SSCHE, Department of Environmental Engineering, Faculty of Chemical and Food Technology, Slovak University of Technology.
M. Persson., (2003).Evaluation of Swedish plants for upgrading of biogas, SGC-report 142
Mosier, N. et al. (2005) Features of promising technologies for pretreatment of lignocellulosic biomass. Bioresour. Technol. 96, 1986–1993
O. Jönsson, 2001. The Swedish Case for Methane Gas, ENGVA Annual Meeting, Malmö.
Ogier, J.C. et al. (1999) Ethanol production from lignocellulosic biomass. Oil Gas Sci-Technol 54, 67–94. Renewable Fuels Association RFA (2005). World Ethanol Production Outlook.
Saha, N.K.; Balakrishnan, M.; Batra, V.S. (2005). Improving Industrial Water Use: Case Study for an Indian distillery. Resour. Conserv.Recycl.43, 163-174.
Samir Kumar Khanal, Scott Schaefer, Shihwu Sung (2005): Anaerobic Digestion of Thin Stillage to produce Methane and Class-A Biosolids. Biotechnology Byproducts Consortium, Iowa University.
Shell and Codex Exploration of Biofuels (2006): The Biofuel Review Magazine.
Stewart, D.J.; Bogue, M.J.; Badger, D.M. (1984). “Biogas production from crops and organic wastes” New Zealand Journal of Science 27(3): 285-294.
Solagro, (2001). Sweden from Biogas to Energy, an European Overview.
Viswanath et al., (1992).Integration of Anaerobic Digestion in biomass by-product & waste recovery
Von Sivers, M. and Zacchi, G. (1996) Ethanol from lignocellulosics: A review of the economy. Bioresour. Technol. 56, 131–140 Weiland, P. (1993). “One- and Two-Step Anaerobic Digestion of Solid Agroindustrial Residues” Water Science &Technology 27(2): 145-151.
Wyman, C.E. et al. (2005) Coordinated development of leading biomass pretreatment technologies. Bioresour. Technol. 96, 1959–1966
47.

48.
V. APPENDICES
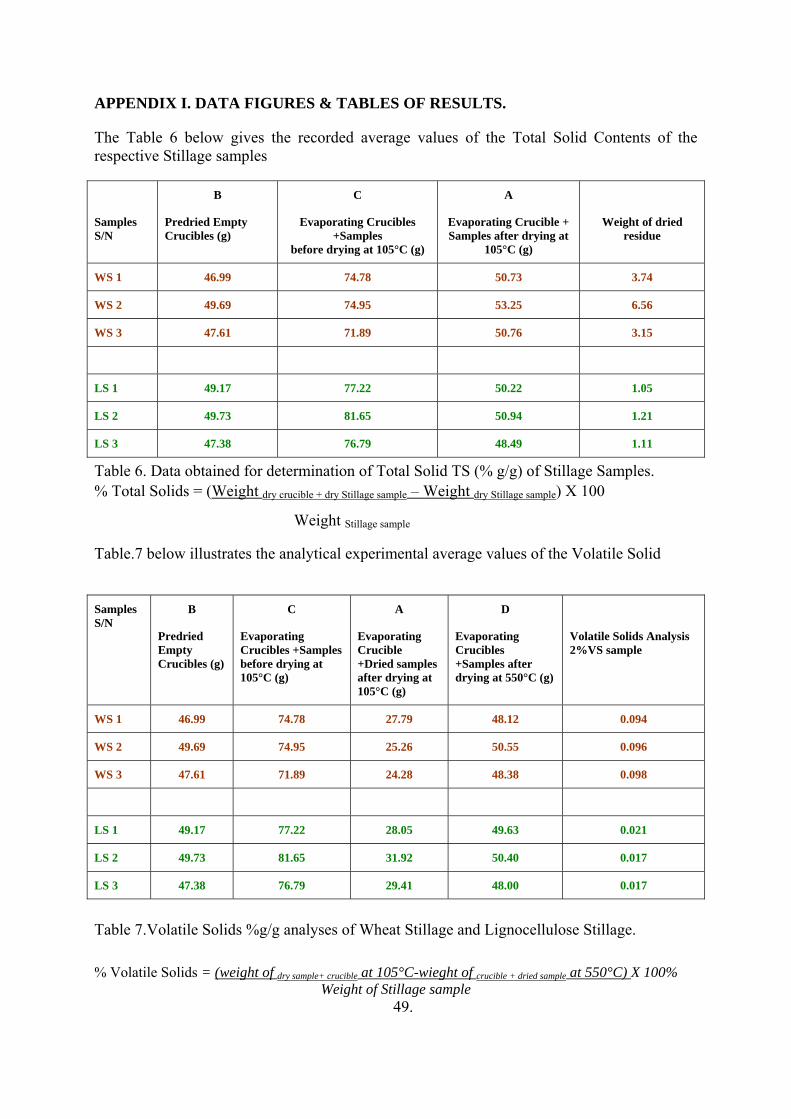
APPENDIX I. DATA FIGURES & TABLES OF RESULTS.
The Table 6 below gives the recorded average values of the Total Solid Contents of the respective Stillage samples
Samples S/N
B
Predried Empty Crucibles (g)
C
Evaporating Crucibles +Samples
before drying at 105°C (g)
A
Evaporating Crucible + Samples after drying at
105°C (g)
Weight of dried residue
WS 1 46.99 74.78 50.73 3.74
WS 2 49.69 74.95 53.25 6.56
WS 3 47.61 71.89 50.76 3.15
LS 1 49.17 77.22 50.22 1.05
LS 2 49.73 81.65 50.94 1.21
LS 3 47.38 76.79 48.49 1.11
Table 6. Data obtained for determination of Total Solid TS (% g/g) of Stillage Samples. % Total Solids = (Weight dry crucible + dry Stillage sample – Weight dry Stillage sample) X 100
Weight Stillage sample
Table.7 below illustrates the analytical experimental average values of the Volatile Solid
Table 7.Volatile Solids %g/g analyses of Wheat Stillage and Lignocellulose Stillage.
% Volatile Solids = (weight of dry sample+ crucible at 105°C-wieght of crucible + dried sample at 550°C) X 100% Weight of Stillage sample
49.
Samples S/N
B
Predried Empty Crucibles (g)
C
Evaporating Crucibles +Samples before drying at 105°C (g)
A
Evaporating Crucible +Dried samples after drying at 105°C (g)
D
Evaporating Crucibles +Samples after drying at 550°C (g)
Volatile Solids Analysis 2%VS sample
WS 1 46.99 74.78 27.79 48.12 0.094
WS 2 49.69 74.95 25.26 50.55 0.096
WS 3 47.61 71.89 24.28 48.38 0.098
LS 1 49.17 77.22 28.05 49.63 0.021
LS 2 49.73 81.65 31.92 50.40 0.017
LS 3 47.38 76.79 29.41 48.00 0.017
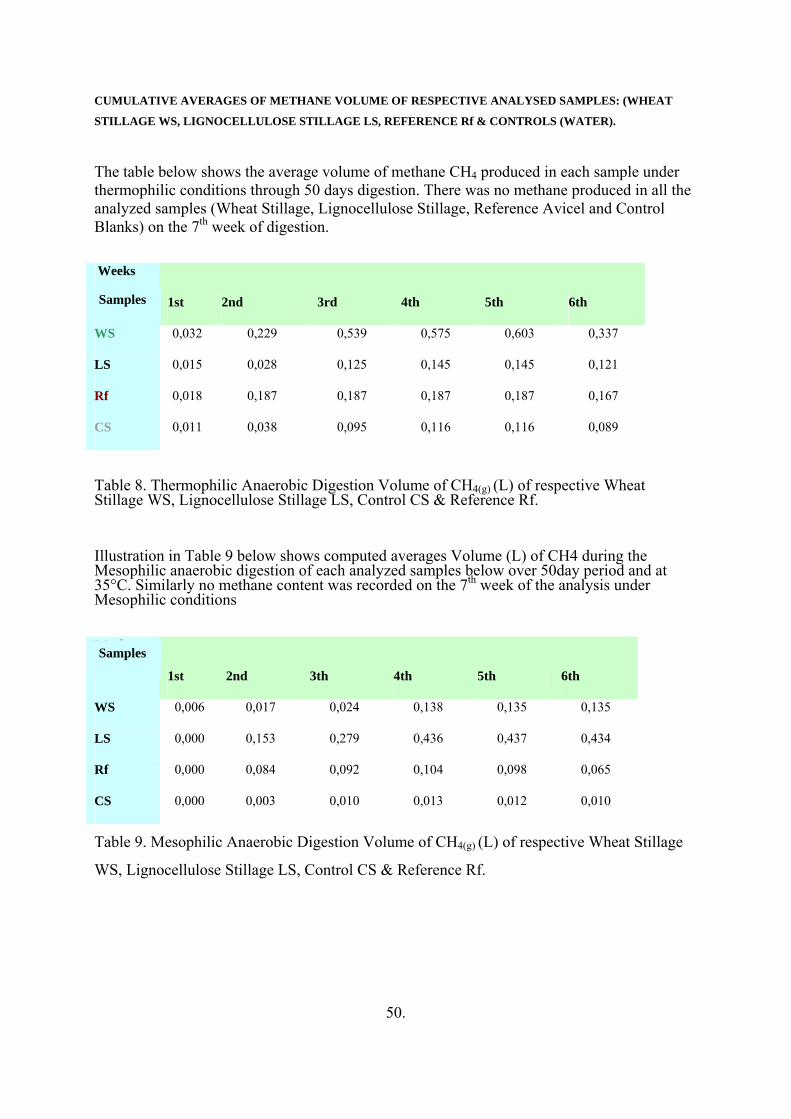
CUMULATIVE AVERAGES OF METHANE VOLUME OF RESPECTIVE ANALYSED SAMPLES: (WHEAT
STILLAGE WS, LIGNOCELLULOSE STILLAGE LS, REFERENCE Rf & CONTROLS (WATER).
The table below shows the average volume of methane CH4 produced in each sample under thermophilic conditions through 50 days digestion. There was no methane produced in all the analyzed samples (Wheat Stillage, Lignocellulose Stillage, Reference Avicel and Control Blanks) on the 7th week of digestion.
Table 8. Thermophilic Anaerobic Digestion Volume of CH4(g) (L) of respective Wheat Stillage WS, Lignocellulose Stillage LS, Control CS & Reference Rf.
Illustration in Table 9 below shows computed averages Volume (L) of CH4 during the Mesophilic anaerobic digestion of each analyzed samples below over 50day period and at 35°C. Similarly no methane content was recorded on the 7th week of the analysis under Mesophilic conditions
Table 9. Mesophilic Anaerobic Digestion Volume of CH4(g) (L) of respective Wheat Stillage
WS, Lignocellulose Stillage LS, Control CS & Reference Rf.
50.
Weeks
1st 2nd 3rd 4th 5th 6th
WS 0,032 0,229 0,539 0,575 0,603 0,337
LS 0,015 0,028 0,125 0,145 0,145 0,121
Rf 0,018 0,187 0,187 0,187 0,187 0,167
CS 0,011 0,038 0,095 0,116 0,116 0,089
Weeks
1st 2nd 3th 4th 5th 6th
WS 0,006 0,017 0,024 0,138 0,135 0,135
LS 0,000 0,153 0,279 0,436 0,437 0,434
Rf 0,000 0,084 0,092 0,104 0,098 0,065
CS 0,000 0,003 0,010 0,013 0,012 0,010
Samples
Samples
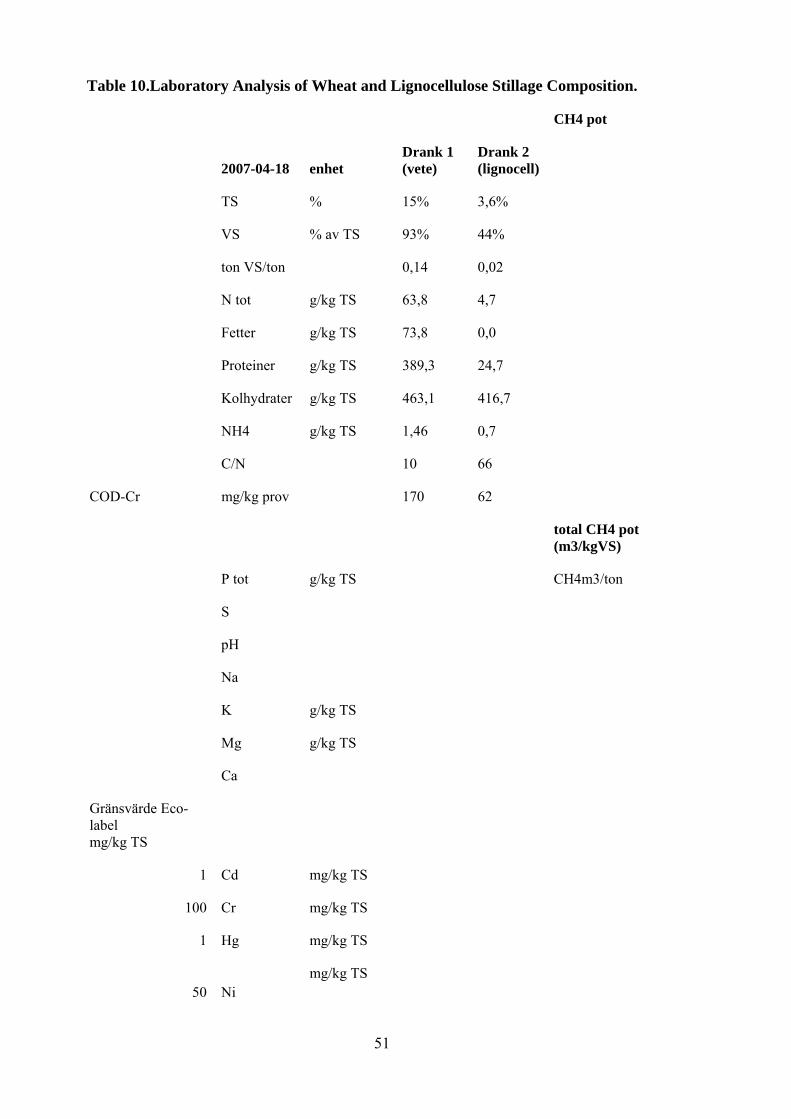
CH4 pot
2007-04-18 enhet Drank 1 (vete)
Drank 2 (lignocell)
TS % 15% 3,6%
VS % av TS 93% 44%
ton VS/ton 0,14 0,02
N tot g/kg TS 63,8 4,7
Fetter g/kg TS 73,8 0,0
Proteiner g/kg TS 389,3 24,7
Kolhydrater g/kg TS 463,1 416,7
NH4 g/kg TS 1,46 0,7
C/N 10 66
COD-Cr mg/kg prov 170 62
total CH4 pot (m3/kgVS)
P tot g/kg TS CH4m3/ton
S
pH
Na
K g/kg TS
Mg g/kg TS
Ca
Gränsvärde Eco-label mg/kg TS
1 Cd mg/kg TS
100 Cr mg/kg TS
1 Hg mg/kg TS
50 Ni mg/kg TS
Table 10.Laboratory Analysis of Wheat and Lignocellulose Stillage Composition.
51
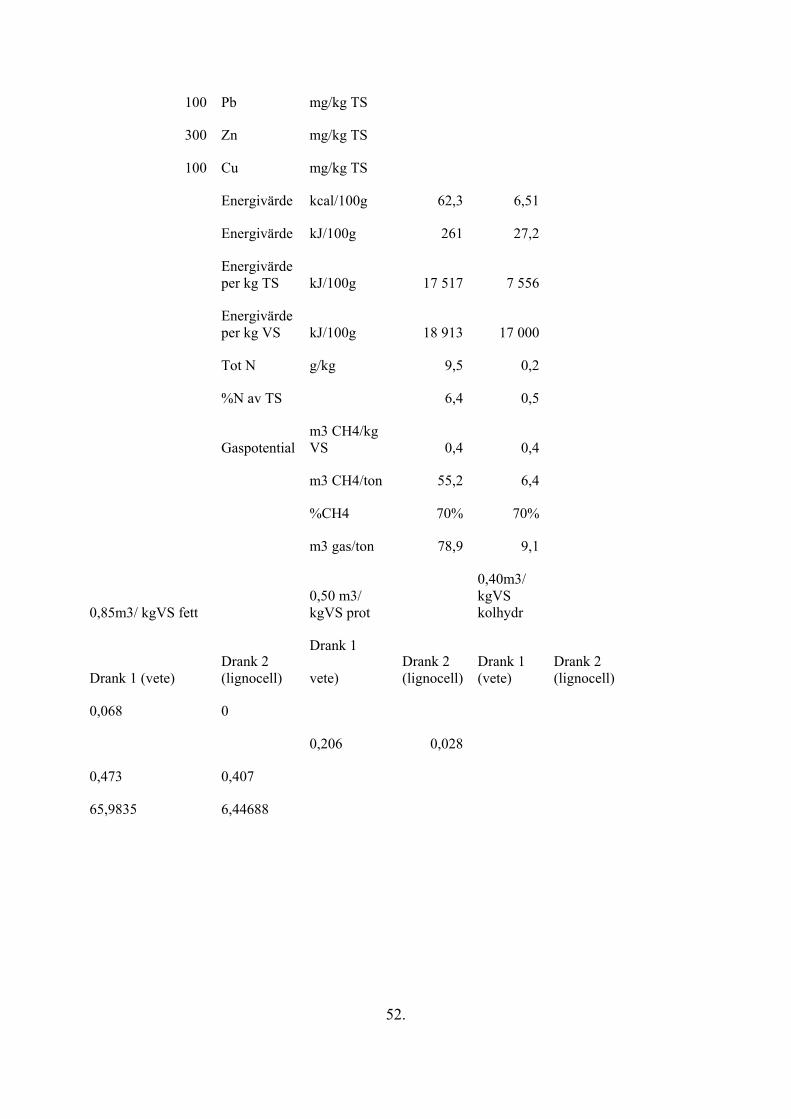
100 Pb mg/kg TS
300 Zn mg/kg TS
100 Cu mg/kg TS
Energivärde kcal/100g 62,3 6,51
Energivärde kJ/100g 261 27,2
Energivärde per kg TS kJ/100g 17 517 7 556
Energivärde per kg VS kJ/100g 18 913 17 000
Tot N g/kg 9,5 0,2
%N av TS 6,4 0,5
Gaspotential m3 CH4/kg VS 0,4 0,4
m3 CH4/ton 55,2 6,4
%CH4 70% 70%
m3 gas/ton 78,9 9,1
0,85m3/ kgVS fett 0,50 m3/ kgVS prot
0,40m3/ kgVS kolhydr
Drank 1 (vete) Drank 2 (lignocell)
Drank 1
vete) Drank 2 (lignocell)
Drank 1 (vete)
Drank 2 (lignocell)
0,068 0
0,206 0,028
0,473 0,407
65,9835 6,44688
52.
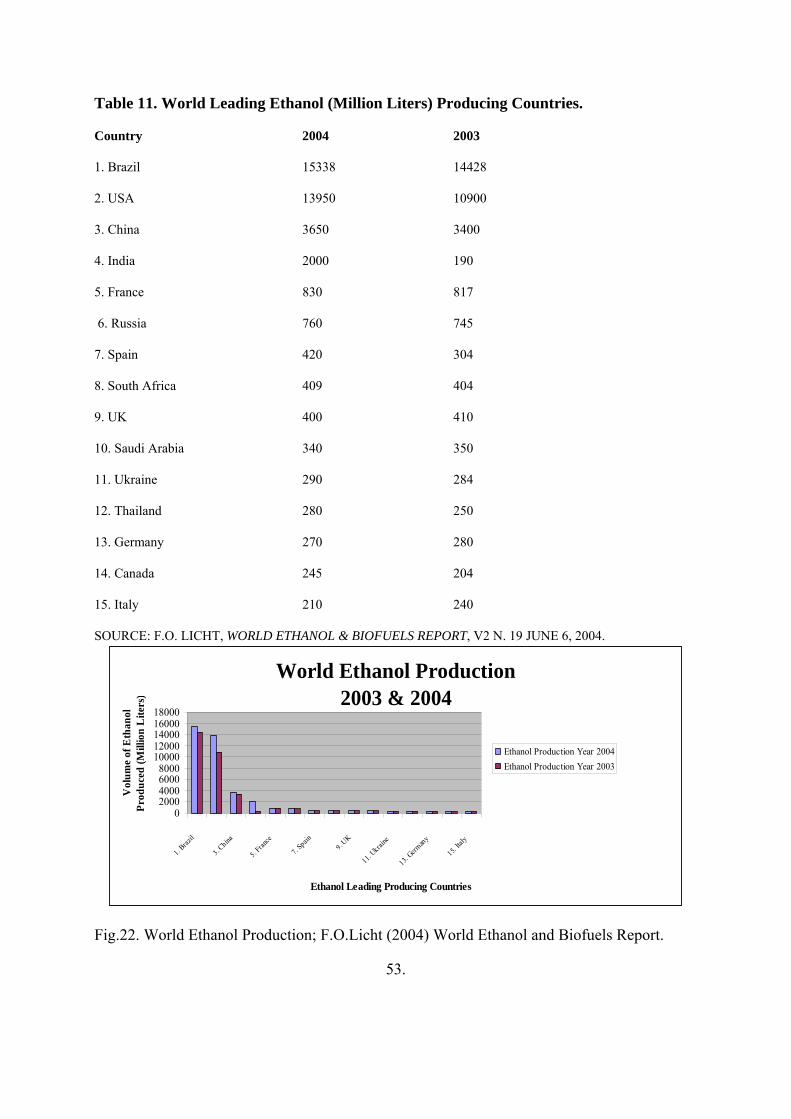
Table 11. World Leading Ethanol (Million Liters) Producing Countries.
Country 2004 2003
1. Brazil 15338 14428
2. USA 13950 10900
3. China 3650 3400
4. India 2000 190
5. France 830 817
6. Russia 760 745
7. Spain 420 304
8. South Africa 409 404
9. UK 400 410
10. Saudi Arabia 340 350
11. Ukraine 290 284
12. Thailand 280 250
13. Germany 270 280
14. Canada 245 204
15. Italy 210 240
SOURCE: F.O. LICHT, WORLD ETHANOL & BIOFUELS REPORT, V2 N. 19 JUNE 6, 2004.
World Ethanol Production2003 & 2004
02000400060008000
1000012000140001600018000
1. Braz
il
3. China
5. Fran
ce
7. Spain
9. UK
11. Ukrai
ne
13. Germ
any
15. Ita
ly
Ethanol Leading Producing Countries
Vol
ume
of E
than
ol
Prod
uced
(Mill
ion
Lite
rs)
Ethanol Production Year 2004Ethanol Production Year 2003
Fig.22. World Ethanol Production; F.O.Licht (2004) World Ethanol and Biofuels Report.
53.