Embed Size (px)
Citation preview

INVESTIGATIONS INTO THE INTERACTIONS OF THE HIGH
MOBILITY GROUP BOX 1 PROTEIN AND THEIR TOXICOLOGICAL
RELEVANCE
Thesis submitted in accordance with the requirements of the University of Liverpool
for the degree of Doctor of Philosophy
By
Hannah Louise Aucott
January 2014

ii
DECLARATION
This thesis is the result of my own work. The material contained within this thesis
has not been presented, nor is currently being presented, either wholly or in part for
any other degree or qualification.
Hannah Louise Aucott
This research was carried out in the Department of Pharmacology and Therapeutics,
The University of Liverpool, UK.

iii
CONTENTS
SECTION PAGE
ABSTRACT iv
ACKNOWLEDGMENTS vi
PUBLICATIONS vii
ABBREVIATIONS viii
CHAPTER ONE: 1
General introduction
CHAPTER TWO: 30
Materials and methods
CHAPTER THREE: 64
Expression, purification and characterisation of recombinant HMGB1
and IL-1β proteins
CHAPTER FOUR: 100
In vitro characterisation of the interaction between HMGB1 and IL-1β
CHAPTER FIVE: 124
Biophysical analysis of the interaction between HMGB1 and IL-1β
CHAPTER SIX: 149
Concluding discussion
BIBLIOGRAPHY 162

iv
ABSTRACT
Drug Induced Liver Injury (DILI) is associated with high morbidity and mortality
rates. It is the leading cause of acute liver failure, accounting for 50% of all cases.
Moreover, DILI is the most frequent cause of post marketing drug withdrawal and is
often cited as a cause of compound attrition during the drug-development process.
The High Mobility Group Box 1 (HMGB1) protein is an important inflammatory
mediator which alters the immune system to tissue stress and injury. HMGB1 has
been implicated in the pathogenesis of multiple inflammatory diseases including
immune-mediated DILI. It has been identified as a potential biomarker of hepatic
injury and a target for therapeutic intervention. Research is required to elucidate the
pro-inflammatory role of HMGB1. HMGB1 has been reported to interact with a
diverse range of endogenous (IL-1, DNA, nucleosomes, CXCL12) and exogenous
(LPS) molecules to promote inflammation. However, the mechanisms responsible
for these synergistic interactions remain poorly defined and therefore, the overall aim
of this work was to characterise the interactions of HMGB1. Specifically, this work
has focused on the interaction with IL-1β, which is of particular interest since both
molecules often co-exist at the site of inflammation.
The interaction between HMGB1 and IL-1β was investigated using combined
cellular and Nuclear Magnetic Resonance (NMR) methodologies. LPS-free,
isotopically labelled recombinant HMGB1 (full length protein, amino acids 1-215)
and IL-1β proteins were expressed and purified from BL21 (DE3) cells. To facilitate
these studies, three additional HMGB1 mutants were sub-cloned from the HMGB1
plasmid: Δ30 (1-185), A box (1-85) and B box (89-163). The recombinant proteins
were characterised using Mass Spectrometry (MS) and NMR spectroscopy.
Synovial fibroblasts were isolated from synovial tissue obtained from rheumatoid
arthritis patients undergoing joint replacement surgery. Cells were treated with
HMGB1 (full length, Δ30, A box or B box) alone or combination with IL-1β. Cell
supernatants were collected after 24hr and IL-6 levels were quantified by ELISA.
Untreated fibroblasts or cells treated with any HMGB1 construct, or IL-1β alone had
no detectable IL-6 release (<9.375pg/mL). In contrast, full length HMGB1, the Δ30
and the B box domain (but not the A box domain) all acted in synergy with IL-1β to
substantially enhance IL-6 production. In one patient, HMGB1, Δ30 and the B box
in combination with IL-1β induced IL-6 levels of 28,473 ± 127pg/mL, 18,491 ±
2388pg/mL and 18,710 ± 2792pg/mL, respectively. The synergistic interaction was
mediated via the Interleukin-1 receptor (IL-1R) and could be inhibited when the cells
were pre-treated with 5µg/mL anakinra, a selective IL-1R antagonist but not
detoxified LPS, a TLR4 receptor antagonist.
To investigate if there is a direct interaction between HMGB1 and IL-1β, a
comprehensive biophysical analysis was performed using NMR methodologies.
However, despite performing the experiments in various ways, no evidence of a
direct interaction between IL-1β and either full length HMGB1, Δ30 or the B box
was detected. This suggests that the synergistic interaction between HMGB1 and IL-
1β is mediated via an alternative cellular mechanism in which HMGB1 is required.
In conclusion, the work presented in this thesis has identified that the B box domain
of HMGB1 is critical for the synergistic effect observed with IL-1β. However, this is
not due to the formation of a binary complex between HMGB1 and IL-1β. Instead, it

v
would appear that the synergistic effect is mediated via an alternative cellular
mechanism in which HMGB1 is required and additional proteins are involved.
Future work could focus on discovering what these other proteins might be. These
findings help to elucidate the pro-inflammatory role of HMGB1 and provide a novel
an insight into HMGB1 biology.
vi
ACKNOWLEDGMENTS
Firstly, I would like to thank my supervisors Dr Dominic Williams, Dr Daniel
Antoine, Prof Lu-Yun Lian and Prof Kevin Park for their continued advice, support
and encouragement. I would especially like to thank Dom for giving me the
opportunity to do this PhD and for his continued guidance throughout.
I am also very grateful to our collaborators at the Karolinska Institutet in Stockholm,
Sweden for all their help during my two placements. I would like to especially thank
Helena Erlandsson Harris, Ulf Andersson, Peter Lundbäck and Heidi Wähämaa for
their advice and technical expertise. Thank-you also to Dr Roz Jenkins and Dr Mark
Prescott for MS assistance. A special thanks to Luke Palmer, Phill Roberts and Pete
Metcalf for technical help. Of course, I must also say a huge thank-you to Dr Robert
Gibson and Dr Marie Phelan for their invaluable help, advice and friendship. I doubt
that I would have been able to complete this thesis without all of your prep talks and
it really is much appreciated. I would also like to acknowledge the financial support
received from the MCR ITTP.
I would like to thank all of the PhD students and post-docs in the CDSS, Biosciences
Lab C and the NMR Centre who I’ve become good friends with during my PhD.
There’s not room to name you all but hopefully you know who you are! A special
thanks to Jon, my HMGB1 buddy, for all of his help and support.
I would also like to say a big thank-you all of my friends and family outside of the
lab. Thanks to Jo, Bhav, Nicola, Lorna and Sam for some great sangria nights. A big
thanks to Emily for providing me with numerous cups of tea at any time of the day
or night, especially during this last year. A special thanks to the ‘Avignon 3’, Matt,
Phil and Catherine. Matt, thanks for some lovely ‘Come-Dine-with-Me’ nights and a
great trip to Avignon. Phil, thanks for educating me on the Cables, introducing me to
some ‘interesting’ pubs and being a great housemate for the last year. Of course
Catherine deserves a special mention for putting up with me for 3 years, listening to
all my moaning and helping to keep things in perspective. A special thanks also to
Emma, George, Katie, Matt, James and Sophie. You’ve kept me sane throughout and
I hope that I can see more of you all from now on.
Of course, I must also say a massive thank all of my family, especially my Auntie
Yasmin, Ryan and Natasha. However, the biggest thank-you must go to my mum for
her continued love and encouragement. I really couldn’t have finished this PhD
without your support.
Finally, this PhD is dedicated to my grandparents, my Auntie Rubina and my Auntie
Betty.

vii
PUBLICATIONS
ABSTRACTS
BTS, 2011 Development and optimisation of a suitable method to generate soluble
recombinant high mobility group box 1 protein (Toxicology, 2011; 290(s 2–3))
World Congress: HMGB1 Elucidating the interaction between HMGB1 and IL-1β
using combined cellular and NMR methodologies (J Mol. Med, 2013, Abstract
accepted)
PAPERS
Investigating the interaction between HMGB1 and IL-1β using combined cellular
and NMR methodologies (Manuscript in preparation)

viii
ABBREVIATIONS
ACN acetonitrile
ADR adverse drug reaction
ALT alanine aminotransferase
amu atomic mass units
APAP acetaminophen, paracetamol
APC antigen presenting cell
AST aspartate aminotransferase
ATP adenosine triphosphate
BMRB biological magnetic resonance biobank
13C carbon 13
1D one dimensional
2D two dimensional
3D three dimensional
D2O deuterium oxide, 2H2O
DAMP damage associated molecular pattern
dH2O distilled water
DILI drug-induced liver injury
DTT dithiothreitol
E.coli Escherichia coli
EDTA ethylenediaminetetraacetic acid
ELISA enzyme-linked immunosorbant assay
ESI-MS electrospray ionisation MS
EU endotoxin unit
FDA food and drug administration
FID free induction decay
FL forward long
FS forward short
His histidine
HIV human immuno-deficiency
HMGB1 high mobility group box 1
HSP heat shock protein
HSQC heteronuclear single quantum coherence
Hz hertz
ICE interleukin-1 converting enzyme
IEX ion exchange
IFN interferon
IL interleukin
IL-1R interleukin-1 receptor
IL-1RA IL-1R antagonist
IL-1RAcP IL-1R accessory protein
IP immunoprecipitation

ix
IPTG isopropyl β-D-1-thiogalactopyranoside
KC kupffer cell
kDa kilodalton
LB lysogeny broth
LC-ESI-MS/MS liquid chromatography ESI-MS/MS
LPC lysophosphatidylcholine
LPS lipopolysaccharide
MIP macrophage inflammatory protein
MHz mega hertz
MMP matrix metalloproteinase
MS mass spectrometry
MWCO molecular weight cut off
m/z mass-to-charge ratio
15
N nitrogen 15
NaCl sodium chloride
NAPQI N-acetyl-p-benzoquinonimine
NCBI national centre for biotechnology information
NCE new chemical entities
NEM N-ethylmaleimide
NES nuclear export signal
NF-κB nuclear factor-kappa B
NHS national health service
NK natural killer
NKT natural killer T cell
NLS nuclear localisation signal
NMR nuclear magnetic resonance
NS number of scans
OA osteoarthritis
PAMP pathogen associated molecular pattern
PBMC peripheral blood mononucleated cell
PBS phosphate buffered saline
PCR polymerase chain reaction
p-i pharmacological interaction
pI isoelectric point
PolyI:C polyinosinic: polycytidylic acid
ppm parts per million
PRR pattern recognition receptor
PTM post translational modification
RA rheumatoid arthritis
RAGE receptor for advanced glycation endproducts
RL reverse long
ROS reactive oxygen species
rpm revolutions per minute
RS reverse short

x
SD standard deviation
SDS-PAGE sodium dodecyl sulfate-polyacrylamide gel electrophoresis
SEM standard error of the mean
SF synovial fibroblast
SLIM site-directed ligase independent mutagenesis
SOB super optimal broth
SOC super optimal broth with catabolite repression
SPR surface plasmon resonance
TAE tris-acetic acid-EDTA
TBS tris-buffered saline
TEV tobacco etch virus
TIR toll/IL-1R
TLR toll-like receptor
TNF tumour necrosis factor α
V volts

CHAPTER ONE
GENERAL INTRODUCTION
Chapter 1
2
TABLE OF CONTENTS
1.1 INTRODUCTION ............................................................................................ 3
1.2 ADVERSE DRUG REACTIONS (ADRS) ...................................................... 4
1.3 DRUG INDUCED LIVER INJURY (DILI) .................................................... 5
1.4 MECHANISMS OF DILI ................................................................................ 6
1.5 IMMUNOLOGICAL RESPONSES IN DILI ................................................. 9
1.5.1. The role of innate immune responses in DILI ......................................... 10
1.5.1.1 Sterile inflammation and Damage Associated Molecular Pattern (DAMP)
molecules ............................................................................................... 10
1.5.1.2 The role of innate immunity as a promoter of DILI ................................ 12
1.5.2. The role of adaptive immune responses in DILI ..................................... 14
1.6. INTERLEUKIN-1 (IL-1) AS A CIRCULATING MEDIATOR OF
INFLAMMATION ....................................................................................... 15
1.7. INTERLEUKIN-6 (IL-6) AS A CIRCULATING MEDIATOR OF
INFLAMMATION ....................................................................................... 17
1.8. HIGH MOBILITY GROUP BOX-1 (HMGB1) AS A CIRCULATING
MEDIATOR OF INFLAMMATION ......................................................... .18
1.8.1. Discovery and function of HMGB1.....................................................18
1.8.2. The structure of the HMGB1 Protein......................................................20
1.8.3. Extracellular release of HMGB1..............................................................23
1.8.4. Receptors mediating HMGB1 activity.................................................25
1.8.4.1. Receptor for Advanced Glycation Endproducts (RAGE)........................ 25
1.8.4.2. Toll-Like Receptors (TLRs)................................................................... 26
1.8.5. HMGB1 as a pro-inflammatory cytokine mediator..................................26
1.9. AIMS OF THESIS ....................................................................................... 28

Chapter 1
3
1.1. INTRODUCTION
Adverse Drug Reactions (ADRs) are a major clinical problem impacting on patient
morbidity and mortality rates. In the US, ADRs rank between the 4th
and 6th leading
cause of death (Lazarou et al., 1998; Zou et al., 2009). A prospective study
conducted in UK found that 6.5% of all hospital admissions are directly related to an
ADR (Pirmohamed et al., 2004). ADRs are also a significant financial burden for the
pharmaceutical industry and are associated with high compound attrition and drug
withdrawal rates (Kola and Landis 2004).
ADRs can affect any organ system. However, the liver is highly susceptible to drug-
induced toxicity due to its central role in the metabolism and distribution of
xenobiotics. To date, nearly 1000 drugs have been linked to an adverse hepatic
reaction and Drug-Induced Liver Injury (DILI; hepatotoxicity) is the leading cause
of acute liver failure (Ostapowicz et al., 2002). Moreover, it is the most frequent
reason for post-marketing drug withdrawal and is often cited as a cause of compound
attrition during the drug development process (Kaplowitz 2005) (Lasser et al., 2002).
The cellular mechanisms leading to DILI are still not defined although two pathways
appear to be involved: direct hepatotoxicity and adverse immune reactions.
Chemically reactive drugs, or their metabolites, are able to damage cellular
macromolecules, including proteins, lipids and nuclei acids, leading to hepatic
cellular dysfunction and cell death. Emerging evidence suggests that hepatic cellular
damage leads to activation of both innate and adaptive immunological responses.
Inflammation, the first line innate immune response, has been identified as a key
process involved in the modulation of liver injury during drug toxicity. Damaged or
dying hepatocytes release proteins that are normally sequestered intracellularly into
the extracellular environment (Iyer et al., 2009). These danger signals are termed
Damage Associated Molecular Pattern Molecules (DAMPs) or alarmins. DAMPs
activate neighbouring immune cells, triggering the production of multiple pro- and
anti-inflammatory mediators. These mediators contribute to the progression of DILI
by recruiting further innate and adaptive immune cells to the site of injury. The
overall severity of the hepatic injury is determined by the balance of pro- and anti-
inflammatory mediators produced. To date, more than 20 DAMPs have been
identified including the High Mobility Group Box 1 (HMGB1) protein, the Heat
Shock Protein (HSP) family, DNA and ATP (Kubes and Mehal 2012).
Chapter 1
4
HMGB1 is a ubiquitous, non-histone chromatin binding protein released following
cell activation or cell death. Extracellular HMGB1 has a diverse range of biological
activities that promote inflammation and tissue repair. HMGB1 mediates cytokine
production (Andersson et al., 2000), chemotaxis (Orlova et al., 2007), cell
proliferation, dendritic cell and T-cell activation (Dumitriu et al., 2005), cell
differentiation (Melloni et al., 1995) and autophagy (Tang et al., 2010). HMGB1 has
been reported to have a pathogenic role in multiple inflammatory diseases and has
been implicated as a pro-inflammatory mediator of DILI. HMGB1 appears to
interact with a diverse range of endogenous (Interleukin-1 (IL-1), DNA,
nucleosomes and CXCL12) and exogenous (Lipopolysaccharide, LPS) molecules to
initiate and enhance inflammation. However, despite intense research the
mechanisms responsible for these synergistic interactions are still largely unknown.
Investigations into these mechanisms will clarify the pro-inflammatory role of
HMGB1 and may identify novel cellular pathways that can be targeted to reduce
inflammation during DILI.
1.2. ADVERSE DRUG REACTIONS (ADRs)
ADRs are a major public health concern impacting on both patient mortality and
morbidity rates (Lazarou et al., 1998; Moore et al., 2007). A prospective
observational study conducted at two large Merseyside hospitals between 2001 and
2002 concluded that 1225 (6.5%) out of 18,820 hospital admissions are due to an
ADR. This accounted for 4% of the total bed capacity and was projected to cost the
NHS up to £466 million per year (Pirmohamed et al., 2004). ADRs also contribute
significantly to high compound attrition and drug withdrawal rates within the
pharmaceutical industry (Kola and Landis 2004). Between 1975 and 1999, 548 New
Chemical Entities (NCEs) were approved by the US Food and Drug Administration
(FDA). 45 (8.2%) of these compounds were subsequently given a black box warning
and 16 (2.9%) were withdrawn from the market (Lasser et al., 2002).
ADRs can be categorised as ‘on’ or ‘off’ target reactions. ‘On target’ reactions are
predictable and are directly related to the primary or secondary pharmacology of the
drug. These reactions are dose-dependent and can be alleviated if the dose is reduced
or the drug is withdrawn. ‘On target’ reactions are not generally associated with high
mortality rates. An example of an ‘on target’ ADR is hemorrhage with
anticoagulants, such as warfarin. In contrast, ‘off target’ ADRs cannot be predicted

Chapter 1
5
as they are not related to the known pharmacological activity and are dose-
independent. ‘Off target’ ADRs are more commonly described as idiosyncratic
reactions as patients display marked inter-individual susceptibility. Idiosyncratic
reactions are less common than ‘on target’ ADRs but are more serious, normally
occurring at therapeutic concentrations, and associated with higher mortality rates.
These reactions usually occur after an initial delay or latency period which may
range from a few days to several months. An example of an idiosyncratic reaction is
hypersensitivity reactions with anticonvulsant drugs.
Any organ system is susceptible to ADRs. The liver is the central organ responsible
for the metabolism and distribution of all endogenous and exogenous compounds
and thus, the liver is a frequent target of drug-induced toxicity. A three year
prospective study conducted in France reported that the annual incidence of DILI
was 13.9 per 100,000 inhabitants (Sgro et al., 2002). Moreover, DILI is the most
frequently citied cause of post-marketing drug withdrawal (Kaplowitz 2005) and a
leading cause of compound attrition during the drug-development process.
1.3. DRUG INDUCED LIVER INJURY (DILI)
A prospective study conducted by the US Acute Liver Failure Study Group
concluded that DILI is responsible for more than 50% of all cases of acute liver
failure (Ostapowicz et al., 2002). It is associated with high morbidity and mortality
rates, with the survival rate in the absence of a liver transplant approximately 20%
(Bernal et al., 2009; Verma and Kaplowitz 2009). To date, nearly 1000 drugs have
been associated with DILI (Zimmerman 1999; Kaplowitz 2004). Acetaminophen
(paracetamol, APAP) overdose accounts for a significant proportion of all cases of
DILI (Ostapowicz et al., 2002) and is responsible for 200-500 deaths annually in the
UK (Hawton et al., 1995; Makin et al., 1995).
Idiosyncratic DILI is responsible for the majority of the remaining cases of acute
liver failure (Ostapowicz et al., 2002). The mechanisms mediating idiosyncratic
toxicities are largely unknown with a number of susceptibility factors implicated in
the progression of these reactions including age, gender, metabolism and pre-existing
inflammation. Idiosyncratic DILI reactions are rare and occur at a frequency of 1 in
every 1000 to 1 in every 10,000 patients (Lee 2003). Due to the infrequent

Chapter 1
6
occurrence of these reactions it is difficult to predict compounds that may cause
idiosyncratic DILI during drug development and preclinical testing.
Clinically, DILI can mimic various forms of naturally occurring liver disease
including hepatitis and cholestasis. Symptoms can vary from mild asymptomatic
biochemical changes to fulminant hepatic failure. It is difficult to predict and
diagnose DILI in the clinic due to the occurrence of pre-existing liver injury or
inflammation in some patients, an incomplete understanding of the underlying
mechanisms, particularly during cases of idiosyncratic drug toxicity, and a lack of
sensitive and informative clinical biomarkers that detect early liver injury. Currently,
measurement of serum and plasma levels of aminotransferases, such as Alanine
Amino-Transferase (ALT) and Aspartate Amino-Transferase (AST), is regarded as
the ‘gold standard’ method to detect DILI. However, these enzymes are not organ
specific and are only significantly elevated following overt liver damage.
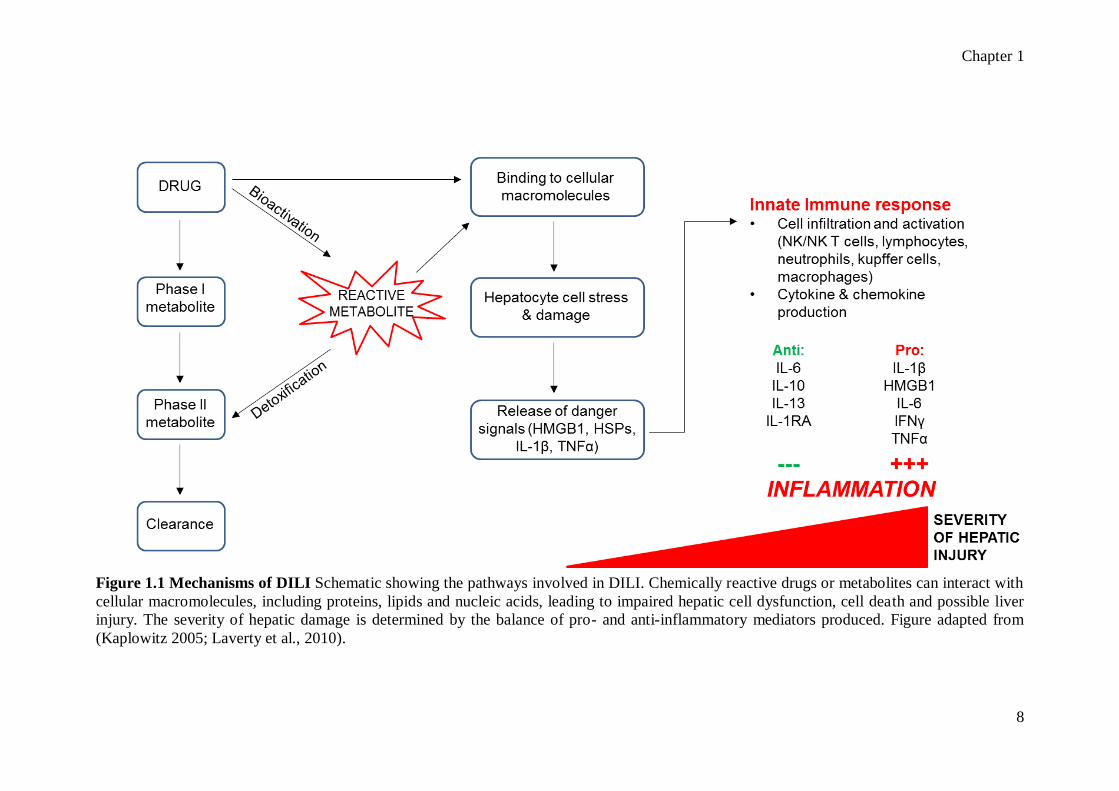
1.4. MECHANISMS OF DILI
The exact mechanisms mediating DILI are not fully understood, although it appears
that two pathways are involved: direct hepatotoxicity and immune-mediated damage
(Figure 1.1). Most xenobiotic compounds are metabolised in the liver and in some
instances, DILI can be initiated by the bioactivation of a drug to a chemically
reactive metabolite. Unless detoxified, the parent drug or reactive metabolite may
covalently bind to cellular macromolecules including proteins, lipids and nucleic
acids resulting in protein dysfunction, lipid peroxidation, DNA damage and
oxidative stress. Impaired hepatic cell function ultimately leads to cell death and
liver injury (Park et al., 2011).
APAP, a commonly used analgesic and antipyretic drug, is considered to be very
safe at therapeutic doses (4 g/day) but causes acute liver failure during overdose.
Metabolic activation has been demonstrated to be an essential pre-requisite for
APAP-induced hepatotoxicity (Mitchell et al., 1973). APAP is bioactivated to the
electrophilic intermediate N-acetyl-p-benzoquinonimine (NAPQI) (Dahlin et al.,
1984). The reactive NAPQI metabolite has been demonstrated to bind to a number of
target proteins including glutamine synthestase, glutamate dehydrogenase and
aldehyde dehydrogenase (Bulera et al., 1995; Halmes et al., 1996; Landin et al.,

Chapter 1
7
1996). APAP-induced hepatotoxicity has been widely studied and the APAP-mouse
model is routinely used as a tool to investigate DILI.
Hepatocyte cell stress and damage can trigger both innate and adaptive immune
responses. Stressed or dying hepatocytes release danger signals that activate local
cells, particularly those of the innate immune system including Natural Killer (NK)
cells, Natural Killer T (NKT) cells and kupffer cells (KCs). Prototypical danger
signals include Tumour Necrosis Factor α (TNFα), Interleukin-1β (IL-1β),
Interferons (IFNs), ATP and HMGB1 (Matzinger 1994; Gallucci and Matzinger
2001). The activation of local resident immune cells stimulates the release of
multiple pro- and anti-inflammatory cytokines and chemokine mediators. These
proteins activate and recruit further inflammatory cells to the liver with the overall
severity of the hepatic injury depending on the balance of pro- and anti-inflammatory
mediators produced. One type of cell recruited to the liver during DILI is the
neutrophil cell (You et al., 2006). Neutrophils are critical to host defence as they
phagocytose and digest foreign material. Depletion of these cells reduces
susceptibility to liver injury induced by some drugs (You et al., 2006).
Chapter 1
8
Figure 1.1 Mechanisms of DILI Schematic showing the pathways involved in DILI. Chemically reactive drugs or metabolites can interact with
cellular macromolecules, including proteins, lipids and nucleic acids, leading to impaired hepatic cell dysfunction, cell death and possible liver
injury. The severity of hepatic damage is determined by the balance of pro- and anti-inflammatory mediators produced. Figure adapted from
(Kaplowitz 2005; Laverty et al., 2010).

Chapter 1
9
1.5. IMMUNOLOGICAL RESPONSES IN DILI
The immune system is composed of innate immunity and adaptive immunity. Cells
of the innate immune system include macrophages, NK cells, NKT cells and
leukocytes. The innate immune response provides rapid, non-specific, first-line
defence to recognise and eliminate invading pathogens. Innate immune cells can also
function as Antigen Presenting Cells (APCs) to activate the adaptive immune
response, which is specific to the invading pathogen.
Regulated physiological immune responses are important for tissue repair and
regeneration. However, dysfunction of inflammatory pathways is associated with
excessive cytokine production, tissue damage and a pathogenic role in multiple liver
diseases. There is growing evidence to support the role of immune-mediated
reactions in DILI caused by some drugs, particularly during idiosyncratic toxicity.
Table 1.1 provides an overview of the drugs that cause idiosyncratic DILI with
evidence of immune involvement.
Table 1.1 Overview of drugs that cause idiosyncratic DILI with evidence of
immune involvement +Evidence for both allergic and non-allergic DILI reactions.
Table adapted from (Kaplowitz 2005; Laverty et al., 2010).
Drug class Drug name
Anaesthetic Halothane
Analgesic Diclofenac+
Sulindac
Antibiotic Amoxicillin
Rifampicin+
Nitrofluantoin
Minocycline
Erthromycins
Anti-convulsant Phenytoin
Phenothiazines
Anti-epileptic Carbamazepine+
Antihypertensive Dihydralazine
Methyldopa
Tienilic acid
Anti-thyroid Propylthiouracil
Antidepressant Tricyclic antidepressants
Gout Allopurinol
Hypertension ACE inhibitors

Chapter 1
10
1.5.1. THE ROLE OF INNATE IMMUNE RESPONSES IN DILI
1.5.1.1. Sterile inflammation and Damage Associated Molecular Pattern
(DAMP) molecules
Inflammation, the first line innate immune response to evading microbial pathogens,
is a physiological process that promotes tissue repair and regeneration. However, if
the inflammatory process is not tightly controlled, inflammation spreads and tissue
damage can occur (Nathan 2002). Recent reports have shown that inflammation can
occur in the absence of evading pathogens in response to necrotic cell death (Figure
1.2) (Chen et al., 2007; Hoque et al., 2013). This phenomenon is termed sterile
inflammation and can occur in all tissues. Hepatic cell necrosis is known to occur in
response to toxic insults (Grattagliano et al., 2002) and sterile inflammation has been
identified as a key process involved in DILI. Clinical features of inflammation
include redness, swelling, heat, neutrophil infiltration and tissue damage (Kubes and
Mehal 2012).
Damaged or dying hepatocytes release proteins that are normally sequestered
intracellularly into the extracellular environment (Figure 1.2). These host-derived
proteins are termed DAMP molecules or alarmins as their extracellular release alerts
the immune system to impending liver injury. HMGB1 (Scaffidi et al., 2002), ATP
(Mariathasan et al., 2006), DNA (Jahr et al., 2001), hyaluronic acid and HSPs
(Quintana and Cohen 2005) have all been identified as DAMPs that are able to
trigger an immune response. DAMPs are recognised by the Pattern Recognition
Receptors (PRRs), a group of highly conserved proteins that were initially identified
as receptors for evading Pathogen Associated Molecular Pattern (PAMPs) molecules
(e.g. LPS and polyinosinic: polycytidylic acid (poly: IC)). The most studied
members of PRR family are the Toll-Like Receptors (TLRs), which are a family of
transmembrane proteins expressed by cells of the innate immune system. Release
and recognition of DAMPs by PRRs activates neighbouring cells of the innate
immune system including macrophages, KCs, NK cells and NKT cells (Holt and Ju
2006). This triggers the activation of two interrelated cell signalling pathways that
up-regulate the production of multiple inflammatory mediators. The first pathway
activates Nuclear Factor-κB (NF-κB)-mediated gene expression resulting in the up-
regulation of the transcription of a number of genes encoding pro-inflammatory
cytokines, adhesion molecules, chemokines and growth factors (Siebenlist et al.,

Chapter 1
11
1994; Barnes and Karin 1997). Many of these newly transcribed proteins are
involved in the second pathway and contribute to the formation of the
inflammasome. The inflammasome is a cytosolic multi-protein complex, activated
following a second signal, which is critical for caspase-1 (also known as the
Interleukin-1 Converting Enzyme (ICE); (Alnemri et al., 1996)) dependent
processing and secretion of many inflammatory mediators including IL-1 and IL-18
(Martinon et al., 2002). Recent reports have demonstrated that the sterile
inflammatory response to necrotic cells is mediated via the Nalp3 inflammasome
(Iyer et al., 2009). Activated innate immune cells also secrete TNF, IFNγ, IL-6 and
multiple chemokine mediators (Blazka et al., 1995; Ishida et al., 2002; Masubuchi et
al., 2003). These proteins mediate the progression of DILI by promoting the
recruitment of further innate and adaptive immune cells to the site of injury.

Chapter 1
12
Figure 1.2 Overview of sterile inflammation and the effects of DAMPs on DILI
Necrotic hepatocytes passively release their intracellular contents (DAMPs;
HMGB1, HSPs, DNA & ATP) into the extracellular environment and blood,
triggering the activation of local innate immune cells including macrophages, KCs,
NK cells and NKT cells. Multiple inflammatory mediators, including HMGB1, are
up-regulated via two interrelated pathways, which involve NF-κB-mediated gene
transcription and inflammasome formation and activation. Inflammatory mediators
promote the recruitment of innate and adaptive immune cells, contributing to the
progression of inflammation and liver injury (Siebenlist et al., 1994; Barnes and
Karin 1997; Martinon et al., 2002; Scaffidi et al., 2002; Holt and Ju 2006).
1.5.1.2 The role of innate immunity as a promoter of DILI
Genetic and environmental factors are known to influence susceptibility to drug
toxicity. In particular, it has been hypothesised that cellular stress or inflammatory
responses due to concurrent or pre-existing infection may increase the risk of DILI
(the inflammatory stress hypothesis). There is clinical evidence to support this theory
with studies showing that patients infected with the Human Immuno-deficiency
Virus (HIV) or hepatitis C virus have an elevated risk of developing hepatic ADRs

Chapter 1
13
(Levy 1997; Nguyen et al., 2008). The mechanism is not completely understood but
it is known that cells of the innate immune system are activated during infection
leading to the production of multiple pro-inflammatory mediators. It is generally
believed that this lowers the threshold for drug toxicity, contributing to the
development of many idiosyncratic ADRs. Recent testing into this hypothesis has
resulted in the development of multiple animal models that appear to reproduce some
of the idiosyncratic drug toxicities observed in the clinic. Most of these models have
involved co-treating animals with non-toxic doses of LPS, a bacterial endotoxin, to
replicate pre-existing or concurrent inflammatory stress. LPS (Figure 1.3) is a major
component of the outer membrane of gram negative bacteria and a potent activator
of the immune response, inducing systemic inflammation and septic shock via
TLR4-mediated NF-κB signalling (Shakhov et al., 1990; Hoshino et al., 1999;
Beutler and Rietschel 2003). LPS has been extensively used by researchers to induce
and study inflammatory responses. Studies using rodent models have shown that co-
exposure to non-toxic doses of LPS increases the susceptibility to a number of
hepatotoxic agents (Table 1.2).
Figure 1.3 Structure of LPS The bacterial endotoxin, LPS, is present in the outer
cell membrane of gram negative bacteria and is composed of polysaccharide and
lipid moieties. (Hep, L-glycero-D-manno-heptose; KDO, 2-keto-3-deoxy-octulosonic
acid; P, phosphate; GlcN, D-glucosamine). Figure adapted from (Beutler and
Rietschel 2003).

Chapter 1
14
Table 1.2 Drugs with increased hepatotoxic activities in the presence of
moderate inflammatory stress. Compounds listed below had a reduced toxicity
threshold when co-administered with bacterial or viral products.
Hepatotoxin Drug Class/ Use Inflammagen(s) References
APAP Analgesic/
antipyretic LPS & reovirus (Maddox et al., 2010)
Chlorpromazine Antipsychotic LPS (Buchweitz et al.,
2002)
Diclofenac Analgesic LPS (Deng et al., 2006)
Halothane Anaesthetic LPS (Lind et al., 1984)
Ranitidine
Histamine-2 receptor
antagonist
(Indicated for gastric
disease)
LPS (Luyendyk et al.,
2003)
Sulindac Analgesic LPS (Zou et al., 2009)
Trovafloxacin
Antibiotic
(Restricted use due to
hepatotoxicity)
LPS (Waring et al., 2006;
Shaw et al., 2007)
1.5.2. THE ROLE OF ADAPTIVE IMMUNE RESPONSES IN DILI
Adaptive immunological responses have been implicated in DILI reactions caused
by some drugs including halothane, diclofenac and carbamazepine (Maddrey et al.,
2011). These reactions are often associated with fever, rash and eosinophilia,
typically occurring after a short latency period of around 1-8 weeks.
Despite intense research it is still not clear how drugs or their metabolites can
activate adaptive immune responses. Two hypotheses have been postulated: the
hapten hypothesis and the Pharmacological Interaction (p-i) hypothesis. The hapten
hypothesis proposes that chemically reactive drugs or metabolites covalently bind to
cellular proteins to form immunogenic drug-protein adducts. These adducts are
recognised as foreign and induce specific immune responses (Park et al., 1998).
Auto-antibodies directed towards drug-modified hepatic proteins have been detected
in the sera of some patients, supporting this hypothesis (Satoh et al., 1989; Bourdi et
al., 1994; Gunaratnam et al., 1995; Lecoeur et al., 1996). In contrast, the p-i
hypothesis proposed by Pichler suggests that some drugs are able to directly bind
and activate T cell receptors in the absence of drug metabolism or antigen
presentation (Zanni et al., 1998; Pichler et al., 2006).

Chapter 1
15
1.6. INTERLEUKIN-1 (IL-1) AS A CIRCULATING MEDIATOR OF
INFLAMMATION
The IL-1 sub-family consists of three proteins: Interleukin-1 alpha (Il-1α),
Interleukin-1 beta (IL-1β) and the endogenous Interleukin-1 Receptor antagonist (IL-
1RA). IL-1α and IL-1β are potent pleiotropic cytokines that regulate a diverse range
of biological activities including the pro-inflammatory response and hematopoiesis
(Dinarello 1996) (Table 1.3). Specifically, IL-1β is a critical mediator of the acute-
phase response to tissue injury or inflammation (Zheng et al., 1995). A pathogenic
role of IL-1β has been reported for many inflammatory diseases including
autoimmune diseases, such as rheumatoid arthritis, type 2 diabetes and heart failure
(Dinarello 2011).
Table 1.3 Overview of the biological activities of the IL-1 protein Table adapted
from (Dinarello 1991).
Biological effects of IL-1
Pyrogen
Promotes synthesis of hepatic acute-phase proteins
T-cell activation
B cell activation
Induces fibroblast differentiation
Endothelial cell activation
Modulation of gene expression:
Increased expression of IL-1, IL-6, TNFα and IL-8
Suppression of type 1 IL-1R and cytochrome P450
expression
The IL-1β protein is released by macrophages, monocytes and dendritic cells
(Iwamoto et al., 1989; Eder 2009). Two signals are required for the production,
processing and release of IL-1β. Firstly, PAMPs or DAMPs induce the transcription
of the IL-1β mRNA and the subsequent translational of the IL-1β protein. IL-1β is
initially synthesised as a 31kDa precursor protein (Pro-IL-1β) and a second signal is
required to activate the inflammasome and caspase-1 dependent processing and
release of mature IL-1β (17 kDa) (Kostura et al., 1989); (Thornberry et al., 1992).
The mechanism of IL-1β secretion is not well defined, however as IL-1β lacks a
secretory signal peptide it cannot be released via the classical ER-Golgi pathway.
Instead, it has been suggested that IL-1β may be released from secretory lysosomes

Chapter 1
16
or exosomes during exocytosis, by shredding of plasma membrane microvesicles or
by active transport using specialised membrane transporters (Eder 2009).
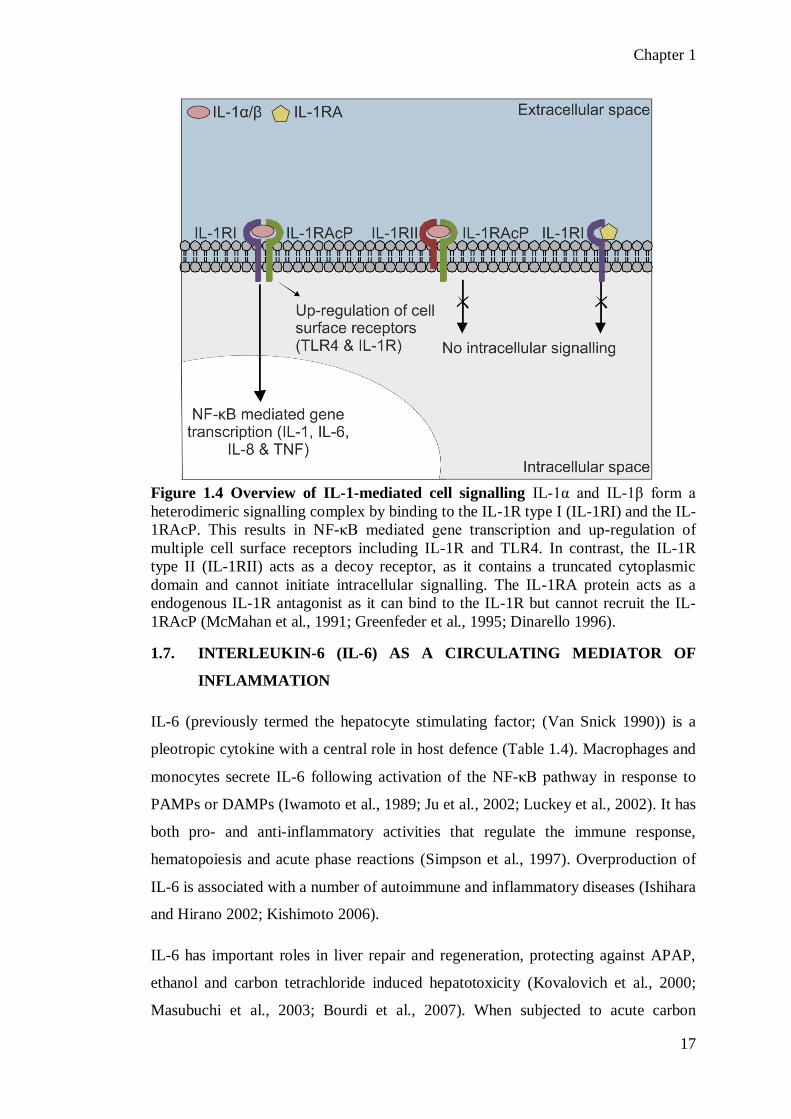
Extracellular IL-1 binds to the type I and II transmembrane IL-1 receptors (IL-1Rs)
(Figure 1.4). The type I IL-1R is predominantly expressed on fibroblasts, endothelial
cells, T cells and hepatocytes. IL-1 binds to the type 1 IL-1R and recruits the IL-1R
accessory protein (IL-1RAcP) leading to the formation of a pro-inflammatory
heterodimeric signalling complex (Greenfeder et al., 1995). The signalling complex
activates the NF-κB pathway to induce the expression of a wide variety of genes
including pro- and anti-inflammatory mediators (IL-1, IL-6, IL-8 and TNFα) and
multiple inflammatory receptors, including the IL-1R (Dinarello 1996). In contrast,
the type II IL-1R, located primarily on monocytes, neutrophils, B cells and bone
marrow cells (Kuno and Matsushima 1994), contains a truncated cytoplasmic
domain and cannot initiate intracellular signalling. Thus, the type II IL-1R acts as a
decoy receptor, sequestering IL-1 and regulating the biological activity of the protein
(McMahan et al., 1991). Furthermore, the endogenous IL-1RA can also bind to the
IL-1R but cannot recruit the IL-1RAcP and therefore cannot initiate cell signalling
and acts to regulate the pro-inflammatory activity of IL-1α and IL-1β (Arend et al.,
1990; Greenfeder et al., 1995).
Chapter 1
17
Figure 1.4 Overview of IL-1-mediated cell signalling IL-1α and IL-1β form a
heterodimeric signalling complex by binding to the IL-1R type I (IL-1RI) and the IL-
1RAcP. This results in NF-κB mediated gene transcription and up-regulation of
multiple cell surface receptors including IL-1R and TLR4. In contrast, the IL-1R
type II (IL-1RII) acts as a decoy receptor, as it contains a truncated cytoplasmic
domain and cannot initiate intracellular signalling. The IL-1RA protein acts as a
endogenous IL-1R antagonist as it can bind to the IL-1R but cannot recruit the IL-
1RAcP (McMahan et al., 1991; Greenfeder et al., 1995; Dinarello 1996).
1.7. INTERLEUKIN-6 (IL-6) AS A CIRCULATING MEDIATOR OF
INFLAMMATION
IL-6 (previously termed the hepatocyte stimulating factor; (Van Snick 1990)) is a
pleotropic cytokine with a central role in host defence (Table 1.4). Macrophages and
monocytes secrete IL-6 following activation of the NF-κB pathway in response to
PAMPs or DAMPs (Iwamoto et al., 1989; Ju et al., 2002; Luckey et al., 2002). It has
both pro- and anti-inflammatory activities that regulate the immune response,
hematopoiesis and acute phase reactions (Simpson et al., 1997). Overproduction of
IL-6 is associated with a number of autoimmune and inflammatory diseases (Ishihara
and Hirano 2002; Kishimoto 2006).
IL-6 has important roles in liver repair and regeneration, protecting against APAP,
ethanol and carbon tetrachloride induced hepatotoxicity (Kovalovich et al., 2000;
Masubuchi et al., 2003; Bourdi et al., 2007). When subjected to acute carbon
Chapter 1
18
tetrachloride treatment, IL-6 deficient mice have increased liver necrosis and
impaired liver regeneration compared to wild-type animals (Kovalovich et al., 2000).
Moreover, elevated IL-6 levels have been reported in animal models of APAP-
induced hepatotoxicity (James et al., 2003) and IL-6-/-
mice have an increased
susceptibility to APAP-induced hepatic injury (Masubuchi et al., 2003).
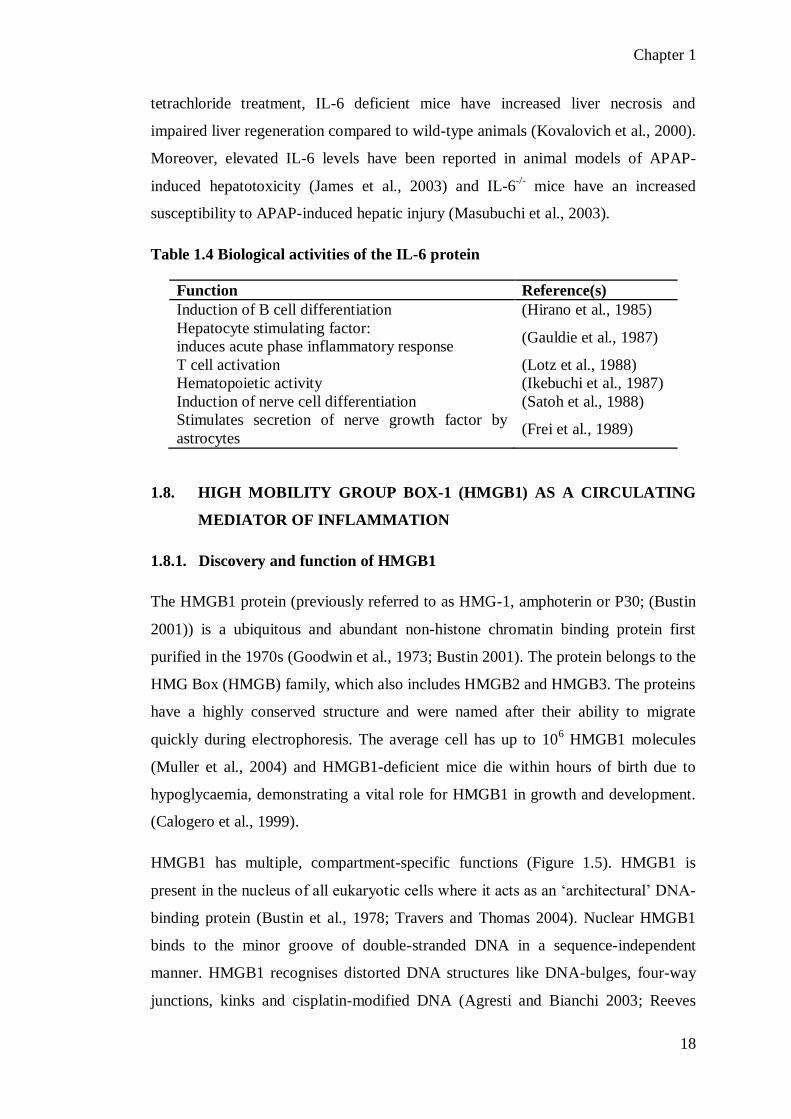
Table 1.4 Biological activities of the IL-6 protein
Function Reference(s)
Induction of B cell differentiation (Hirano et al., 1985)
Hepatocyte stimulating factor:
induces acute phase inflammatory response (Gauldie et al., 1987)
T cell activation (Lotz et al., 1988)
Hematopoietic activity (Ikebuchi et al., 1987)
Induction of nerve cell differentiation (Satoh et al., 1988)
Stimulates secretion of nerve growth factor by
astrocytes (Frei et al., 1989)
1.8. HIGH MOBILITY GROUP BOX-1 (HMGB1) AS A CIRCULATING
MEDIATOR OF INFLAMMATION
1.8.1. Discovery and function of HMGB1
The HMGB1 protein (previously referred to as HMG-1, amphoterin or P30; (Bustin
2001)) is a ubiquitous and abundant non-histone chromatin binding protein first
purified in the 1970s (Goodwin et al., 1973; Bustin 2001). The protein belongs to the
HMG Box (HMGB) family, which also includes HMGB2 and HMGB3. The proteins
have a highly conserved structure and were named after their ability to migrate
quickly during electrophoresis. The average cell has up to 106 HMGB1 molecules
(Muller et al., 2004) and HMGB1-deficient mice die within hours of birth due to
hypoglycaemia, demonstrating a vital role for HMGB1 in growth and development.
(Calogero et al., 1999).
HMGB1 has multiple, compartment-specific functions (Figure 1.5). HMGB1 is
present in the nucleus of all eukaryotic cells where it acts as an ‘architectural’ DNA-
binding protein (Bustin et al., 1978; Travers and Thomas 2004). Nuclear HMGB1
binds to the minor groove of double-stranded DNA in a sequence-independent
manner. HMGB1 recognises distorted DNA structures like DNA-bulges, four-way
junctions, kinks and cisplatin-modified DNA (Agresti and Bianchi 2003; Reeves
Chapter 1
19
2010). HMGB1 induces bends into the DNA structure (Onate et al., 1994; Agresti
and Bianchi 2003) which in turn facilitates the interaction between the DNA and
various proteins, including the NF-κB and p53 transcription factors (Jayaraman et
al., 1998; McKinney and Prives 2002; Rowell et al., 2012). HMGB1, therefore,
facilitates gene transcription and DNA replication (Czura et al., 2001; Reeves 2010).
Moreover, nuclear HMGB1 is also involved in cell replication, DNA repair and
nucleosome assembly (Lange et al., 2008; Celona et al., 2011).
Extracellular HMGB1 has a diverse range of biological activities that promote
inflammation and tissue repair. HMGB1 mediates cytokine production (Andersson et
al., 2000), chemotaxis (Orlova et al., 2007), cell proliferation, dendritic cell and T-
cell activation (Dumitriu et al., 2005), cell differentiation (Melloni et al., 1995) and
autophagy (Tang et al., 2010). HMGB1 has been reported to have a pathogenic role
in many diseases including arthritis (Kokkola et al., 2002), sepsis (Wang et al., 1999)
and cancer (Lotze and Tracey 2005; Sims et al., 2010).
HMGB1 has also been identified as an inflammatory mediator of liver injury.
Elevated HMGB1 levels have been reported in experimental models of hepatic
reperfusion injury and DILI (Ilmakunnas et al., 2008). Recent studies have identified
HMGB1 as a potential early and sensitive mechanistic biomarker of DILI, with
significant HMGB1 elevations reported during APAP-induced hepatotoxicity
(Antoine et al., 2009; Martin-Murphy et al., 2010). Moreover, HMGB1 has been
identified as a potential target for therapeutic intervention during DILI.
Administration of neutralising HMGB1 antibodies has been reported to be beneficial
in mice models of APAP-overdose and is associated with increased survival rates
(Antoine et al., 2010).

Chapter 1
20
Figure 1.5 Compartment-specific functions of the HMGB1 protein HMGB1 is a
multifunctional cytokine with a diverse range of intra- and extra-cellular activities.
HMGB1 is highly expressed in the nucleus where it acts as an architectural DNA-
binding protein that regulates gene transcription and chromatin structure. HMGB1 is
also present in the cytoplasm where it is involved in autophagy and inflammasome
activation. Membrane-bound HMGB1 promotes neurite outgrowth in cerebral
neurons and platelet activation. Additionally, HMGB1 is released into the
extracellular environment following cell activation (active secretion, requires
HMGB1 acetylation) or cell death (passive secretion). Extracellular HMGB1 is an
alarmin, promoting inflammation and tissue regeneration. Figure adapted from
(Yang et al., 2013).
1.8.2. The structure of the HMGB1 Protein
The gene encoding human HMGB1 is located on chromosome 13q12 (Ferrari et al.,
1996). HMGB1 is a 25 kDa protein containing 215 amino acids organised into a
tripartite domain structure consisting of 2 HMG box domains (Boxes A and B) and a
polyacidic negatively charged tail (Figure 1.6). The HMG domains are highly

Chapter 1
21
conserved DNA-binding motifs present in a variety of architectural proteins. The
HMGB1 protein is highly conserved between species with 99% homology in the
primary sequence of the rodent and human forms. The sequences differ in only 2
amino acid residues located within the c-terminal tail: the glutamic acid at position
189 and the aspartic acid at position 202 in human HMGB1 are substituted by
aspartic acid and glutamic acid residues respectively in the rodent protein.
Figure 1.6 Domain structure of HMGB1 HMGB1, a 25 kDa nuclear protein
consisting of 215 amino acid residues, has a tripartite domain structure comprising of
two highly conserved DNA-binding motifs (boxes A and B, residues 9-79 and 89-
163 respectively) and a polyacidic negatively charged tail (residues 186-215). The B
box confers the pro-inflammatory activity whilst the A box is anti-inflammatory in
vivo. The protein contains 2 NLS domains at residues 28-44 and 179-185 (as
indicated). There are also two CRM1-dependent NES domains.
Boxes A and B correspond to residues 9-79 and 89-163 respectively (Figure 1.7).
The boxes, which are connected by a short nine-residue linker region, have a low
sequence similarity (29%) but share a conserved global fold, consisting of three α-
helices arranged in an L-like structure (Weir et al., 1993; Hardman et al., 1995)
(Figure 1.8). A 21-residue, unstructured and flexible linker region connects Box B to
the 30-residue poly-acidic negatively charged tail. The tail is composed entirely of
aspartic and glutamic acid residues (Residues 185-215; Figure 1.7) and interacts with
the A and B boxes (Ramstein et al., 1999; Jung and Lippard 2003; Knapp et al.,
2004; Watson et al., 2007; Stott et al., 2010). The interaction is believed to shield the
boxes and has important functional implications. It modulates the interaction with
DNA (Sheflin et al., 1993; Štros et al., 1994; Lee and Thomas 2000; Muller et al.,
2001), is involved in the interaction with histones H1 and H3 (Cato et al., 2008;
Watson et al., 2013) and modulates HMGB1 protein acetylation by histone
acetyltransferases (Pasheva et al., 2004).

Chapter 1
22
Figure 1.7 Linear representation of the amino acid structure of HMGB1 The HMGB1 protein contains 215 amino acid residues organised
into three domains: the A (Blue) and B (Purple) boxes, at residues 9-79 and 89-163 respectively, and the negatively charged c-terminal tail
composed of 30 acidic amino acid residues (Red;186-215). Box A is anti-inflammatory and B box is pro-inflammatory, a 20-residue region
within the B box (89-108) represents the minimal region required for TNF activation. The TLR4 and RAGE binding sites are indicated. HMGB1
contains 43 lysine residues (20% of total amino acid content) and 8 of these, located within the NLS domains, are frequently acetylated in vivo
(K) to aid active protein secretion.

Chapter 1
23
Figure 1.8 3D structure of HMGB1 A and B box domains HMGB1 is composed
of 2 HMG boxes (Boxes A and B, also known as DNA-binding domains) and a
polyacidic negatively charged tail. The 3D structure of HMGB1 amino acids 1-167
has been solved by solution NMR and is shown above. Image was prepared in
PyMol using PDB entry 2YRQ (PyMoL).
HMGB1 also contains two Nuclear Localisation Signal (NLS) domains and two non-
classical Nuclear Export Signal (NES) domains which allow the protein to
continuously shuttle between the cell nucleus and cytoplasm.
1.8.3. Extracellular release of HMGB1
Under physiological conditions, HMGB1 is predominately localised to the nucleus
but following cell injury or death it is released into the extracellular environment
where it acts to initiate and amplify the inflammatory response. A number of
mechanisms are involved in the regulation of HMGB1 release (Figure 1.9). HMGB1
is constitutively expressed in all nucleated cells and can be passively released during
necrotic cell death following the loss of the cell membrane integrity (Figure 1.9A)
(Scaffidi et al., 2002; Rovere-Querini et al., 2004). In this context HMGB1 is
regarded as an early marker of cell death.
HMGB1 can also be actively secreted from innate immune cells in response to an
inflammatory stimulus and in this context HMGB1 is regarded as a late mediator of
cell activation (Figure 1.9B). Mouse macrophages stimulated with LPS, TNF or IL-1
secrete large amounts of HMGB1 (Wang et al., 1999). Similar to IL-1β, HMGB1
lacks a secretory signal peptide and cannot be secreted via the classical ER-Golgi
pathway (Bonaldi et al., 2003). In resting cells, HMGB1 continually shuttles
between the nucleus and cytoplasm. However, in activated macrophages and
monocytes HMGB1 is post-translationally modified, preventing re-entry into the

Chapter 1
24
nucleus and resulting in accumulation of HMGB1 into cytoplasmic vesicles (Bonaldi
et al., 2003; Cato et al., 2008). HMGB1 is acetylated at lysine residues within the
NLS domains, specifically lysine residues at positions 28, 29, 30, 180, 182, 183, 184
and 185 are frequently acetylated in vivo (Figure 1.7). Additionally, hyper-
phosphorylation of HMGB1 has also been reported to occur in macrophages and
monocytes (Youn and Shin 2006). The release of HMGB1 from the cytoplasmic
vesicles into the extracellular environment is triggered by lysophosphatidylcholine
(LPC) (Cato et al., 2008). LPC is a derived from phosphatidylcholine and is
generated at the site of inflammation several hours after monocyte activation. Recent
evidence suggests that active HMGB1 secretion from macrophages stimulated with
LPS or polyI:C is dependent on the inflammasome and capase-1 activation
(Lamkanfi et al., 2010; Lu et al., 2012).
Active secretion of HMGB1 has also been reported from a number of other cells
including neutrophils, dendritic cells, NK cells, pituicytes and hepatocytes (Wang et
al., 1999; Chen et al., 2004; Dumitriu et al., 2005; Semino et al., 2005; Tsung et al.,
2007). Further investigation is required to fully elucidate the mechanisms that drive
active release of HMGB1 from these cells. It has been reported that mono-
methylation of K42 may promote the cytoplasmic accumulation of HMGB1 in
neutrophils (Ito et al., 2007).
HMGB1 released from necrotic or activated cells, interacts with the TLRs and the
Receptor for Advanced Glycation Endproducts (RAGE) to elicit an inflammatory
response. It is not yet known if the different molecular forms activate distinct
signalling pathways. In contrast, HMGB1 released from apoptotic cells undergoing
secondary necrosis promotes immune tolerance (Figure 1.9C) (Kazama et al., 2008).
During apoptosis, Reactive Oxygen Species (ROS) produced by the mitochondria
oxidise HMGB1, at the C106 residue, preventing binding to the TLR4 and thereby
neutralising the cytokine-inducing activity (Kazama et al., 2008; Yang et al., 2010).
A study by Antoine et al illustrated the critical role of HMGB1 oxidation and
subsequent immune tolerance during APAP-induced hepatotoxicity (Antoine et al.,
2010). In the APAP-induced hepatotoxicity mouse model, diet restriction inhibited
caspase-driven apoptosis and prevented HMGB1 oxidation leading to enhanced
inflammation and increased mortality (Antoine et al., 2010).

Chapter 1
25
Figure 1.9 Mechanisms for the release of HMGB1 into the extracellular
environment HMGB1 is released into the extracellular environment following cell
death or injury where it may act to initiate and amplify the inflammatory response.
A) Hypo-acetylated HMGB1 is passively released by necrotic cells. B) Hyper-
acetylated HMGB1 is actively secreted from activated immune cells. Both molecular
forms can bind to the TLRs (TLR2, TLR4 and TLR9 have been implicated in
HMGB1 signalling) and the RAGE on the target cell to promote inflammation. In
contrast, oxidised HMGB1 released from apoptotic cells during secondary necrosis
promotes immune tolerance (C). Figure adapted from (Harris and Raucci 2006).
1.8.4. Receptors mediating HMGB1 activity
Extracellular HMGB1 interacts with multiple un-related receptors to mediate a
diverse range of biological responses. A number of receptors have been identified for
HMGB1 including RAGE, TLR2, TLR4, TLR9, Syndecan, Mac-1, and Siglec-10
(Salmivirta et al., 1992; Hori et al., 1995; Yu et al., 2006; Tian et al., 2007; Chen et
al., 2009; Gao et al., 2011).
1.8.4.1. Receptor for Advanced Glycation Endproducts (RAGE)
RAGE, a multi-ligand member of the immunoglobulin superfamily, was the first
receptor to be identified for HMGB1 (Hori et al., 1995). A recent study by Huttunen
et al, has mapped the RAGE binding site to residues 150-183 (Huttunen et al., 2002)

Chapter 1
26
(Figure 1.7). HMGB1-RAGE signalling mediates chemotaxis and cell growth,
differentiation of immune cells and the up-regulation of inflammatory cell signalling
receptors, including RAGE and TLR4 (Orlova et al., 2007; Andersson and Tracey
2011) (Figure 1.10).
1.8.4.2. Toll-Like Receptors (TLRs)
HMGB1 also interacts with TLR2, 4 and 9 (Figure 1.10) The interaction between
HMGB1 and TLR4 is critical for HMGB1-induced cytokine release (Yang et al.,
2010). Macrophages from TLR4-deficient mice do not release TNF, IL-6, IL-1β or
IL-10 when exposed to HMGB1 (Yang et al., 2010). In contrast, TLR2-/-
and RAGE-
/-macrophages secrete large amounts of cytokines in response to HMGB1 treatment,
suggesting that these receptors are dispensable during HMGB1-induced cytokine
production (Yang et al., 2010). Binding of HMGB1 to TLR4, activates the adaptor
protein MyD88 which promotes the nuclear translocation of NF-κB and results in the
up-regulation of multiple pro-inflammatory genes and inflammatory mediators (Park
et al., 2004). HMGB1 signalling through TLR4 mediates macrophage activation,
cytokine release and tissue injury (Andersson et al., 2000; Andersson and Tracey
2011). The interaction between HMGB1 and TLR4 has been studied in detail using
Surface Plasmon Resonance (SPR) and is mediated via the B box domain of
HMGB1 (Yang et al., 2010). Specifically, the C106 residue is critical for the
interaction and the C106A HMGB1 mutant does not bind to TLR4 and cannot
induce cytokine production in human macrophages (Yang et al., 2010).
1.8.5. HMGB1 as a pro-inflammatory cytokine mediator
One of the main functions of extracellular HMGB1 is to induce the release of pro-
inflammatory cytokines. Human monocytes exposed to HMGB1 release TNF, IL-1,
IL-6, IL-8, IL-1RA, Macrophage-Inflammatory Protein (MIP)-1α and MIP-1β
(Andersson et al., 2000). HMGB1-induced cytokine production is mediated via two
mechanisms of action. Firstly, HMGB1 is an endogenous cytokine mediator and
secondly, HMGB1 is also reported to act in synergy with multiple unrelated
molecules to promote and enhance inflammation (Figure 1.10).
HMGB1 has intrinsic cytokine-inducing activity, interacting with TLR4 to activate
NF-κB mediated gene transcription and cytokine production. Recent reports have

Chapter 1
27
shown that the redox status of the C23, C45 and C106 residues is critical for the
functional activity of HMGB1, with the pro-inflammatory molecular form requiring
a C23-C45 disulphide bond and a reduced C106 residue (Yang et al., 2011). In
contrast, fully reduced or fully oxidised HMGB1 does not induce cytokine-
production in human macrophages (Yang et al., 2011).
Figure 1.10 HMGB1 signalling pathways Extracellular HMGB1 activates multiple
signalling pathways to promote inflammation and tissue repair. HMGB1 induced
cytokine-production occurs via two mechanisms of action: 1) HMGB1 acts as an
endogenous cytokine mediator interacting with the TLR4/MD2 complex and 2)
HMGB1 acts in synergy with multiple endogenous (IL-1, CXCL12 and
nucleosomes) and exogenous (LPS and Pam3CSK4) ligands. It is generally believed
that HMGB1-partner molecules interactions signal via the partner molecule receptor.
HMGB1 also interacts with RAGE and CXCL12/CXCR4 to promote chemotaxis
and cell growth. The signalling pathway under investigation in this thesis is shown in
the boxed region. Figure adapted from (Harris et al., 2012).
HMGB1 has also been demonstrated to act in synergy with a variety of endogenous
and exogenous molecules to promote and enhance inflammation. Specifically,
HMGB1 has been reported to interact with IL-1β, IL-1α, CXCL12, nucleosomes,
LPS, CpG-DNA, Pam3CSK4 and lipoteichoic acid. A number of independent studies
have shown that these synergistic interactions result in an enhanced inflammatory

Chapter 1
28
response (Ivanov et al., 2007; Tian et al., 2007; Sha et al., 2008; Urbonaviciute et al.,
2008; Hreggvidsdottir et al., 2009; Qin et al., 2009; Cox et al., 2012; Schiraldi et al.,
2012). It has been proposed that these responses are mediated via the formation of
highly active inflammatory complexes that interact with the partner molecule
receptor. However, molecular studies are required to further characterise these
interactions and to elucidate the mechanism of action.
The first study to describe this mechanism was reported by Sha et al, in 2008. In this
study FLAG-tagged HMGB1 was expressed alone or in the presence of IL-1β.
Mouse macrophages exposed to HMGB1 cultured in the presence of IL-1β had
enhanced TNFα and MIP-2 production when compared to cells treated with HMGB1
alone (Sha et al., 2008). The authors proposed that this effect was mediated via the
formation of a highly active pro-inflammatory complex between HMGB1 and IL-1β.
To support this theory, they reported that FLAG-tagged HMGB1 and IL-1β could be
co-isolated using a pull down assay. Additionally, several recent publications from
independent groups support this hypothesis and demonstrate that HMGB1 and IL-1β
also significantly enhance cytokine production in synovial fibroblasts (SFs)
(Hreggvidsdottir et al., 2009; Ferhani et al., 2010; Garcia-Arnandis et al., 2010;
Wähämaa et al., 2011). Moreover, HMGB1 has recently been shown to form similar
complexes with CXCL12 and LPS (Schiraldi 2012, Youn 2008).
HMGB1 and IL-1β are circulating mediators of inflammation that often co-exist at
the site of inflammation and signal via a common pathway. Both proteins have been
implicated in the pathogenesis of DILI and thus, the synergistic interaction between
HMGB1 and IL-1β is of particular interest. However, detailed cellular and
biophysical studies characterising the interaction are lacking within the current
literature and this project will make extensive use of Nuclear Magnetic Resonance
(NMR) to probe the interactions between HMGB1 and IL-1β in the presence and
absence of LPS. Further details of the NMR method are given in Chapter 2.
1.9. AIMS OF THESIS
HMGB1 has been described as a pathogenic mediator of immune-mediated DILI. It
has been identified as a potential biomarker of hepatotoxicity and a target for
therapeutic intervention. Further investigations are required to elucidate the pro-
inflammatory role of HMGB1. HMGB1 interacts with a diverse range of unrelated
Chapter 1
29
molecules to enhance inflammation. However, despite considerable research the role
of HMGB1-partner molecule interactions in modulating the inflammatory response
remain poorly defined and further investigations are needed. The overall aim of the
work presented in this thesis was to characterise the interactions of HMGB1 using
combined cellular and NMR methodologies. Specifically, this work has focused on
the interaction with IL-1β, which is of particular interest, as both molecules often co-
exist at the site of inflammation and have been implicated in the pathogenesis of
DILI.
The specific aims of this work were to:
Develop and optimise methods for the expression, purification and
characterisation of LPS-free and isotopically labelled recombinant HMGB1
and IL-1β proteins (Chapter 1)
Characterise the cellular response to HMGB1/IL-1β synergy (Chapter 2):
Identify which domain(s) of HMGB1 mediates the interaction with
IL-1β
Explore the dynamics and kinetics of the HMGB1/IL-1β interaction
to establish the clinical relevance of HMGB1/IL-1β synergy
Test the hypothesis that HMGB1 and IL-1β directly interact to form a binary
complex and, if appropriate, identify the residue(s) involved in the binding
interaction (Chapter 3)
The findings from this work will help to elucidate the function of HMGB1 and will
provide a novel insight into the biology of the HMGB1 protein.

CHAPTER TWO
MATERIALS AND METHODS

Chapter 2
31
TABLE OF CONTENTS
2.1. MATERIALS ................................................................................................ 34
2.2. GENERAL MOLECULAR BIOLOGY METHODS .................................. 34
2.2.1. Amplification of full length human HMGB1 DNA by Polymerase Chain
Reaction (PCR) ...................................................................................... 34
2.2.2. Analysis of DNA products using agarose gel electrophoresis ................. 36
2.2.3. Construction of the pETM-11-HMGB1 plasmid ..................................... 36
2.2.4. Cloning of HMGB1 mutants using Site-Directed Ligase Independent
Mutagenesis (SLIM) .............................................................................. 38
2.2.5. Construction of the pETM-11-B box plasmid ......................................... 40
2.2.6. Amplification of the DNA encoding human IL-1β protein by PCR ........ 40
2.2.7. Construction of the pOPINf-IL-1β recombinant plasmid ........................ 41
2.2.8. Confirmation of gene insertion by DNA sequencing .............................. 42
2.3. PREPARATION OF RECOMBINANT PROTEINS FROM
ESCHERICHIA COLI (E.COLI); PROTEIN EXPRESSION AND
PURFICATION METHODS ....................................................................... 44
2.3.1. Preparation of chemically competent E.coli cells for the cloning and
expression of recombinant plasmids .........................................................44
2.3.2. Transformation of recombinant plasmids into competent E.coli cells.......44
2.3.3. Expression of recombinant HMGB1, HMGB1 mutants and IL-1β in
Lysogeny Broth (LB) media......................................................................45
2.3.4. Expression of 15N and/or 13C-labelled recombinant proteins in minimal
(M9) Media................................................................................................45
2.3.5. Lysis of bacterial cell pellets.....................................................................46
2.3.6. Purification of recombinant proteins by Ni2+
affinity chromatography.....46
2.3.7. SDS-PAGE gel electrophoresis analysis of protein samples.....................47

Chapter 2
32
2.3.8. Cleavage of the 6-his tag from HMGB1 and HMGB1 mutants using TEV
protease......................................................................................................47
2.3.9. Cleavage of the 6-his tag from IL-1β using 3C protease...........................48
2.3.10. Purification of recombinant proteins by Ion Exchange (IEX)
chromatography ........................................................................................48
2.3.11. Purification of recombinant proteins using size exclusion
chromatography.........................................................................................49
2.3.12. Removal of contaminating endotoxin from recombinant protein
preparations using the Triton-X114 protocol.............................................50
2.3.13. Determining the total molecular mass of recombinant HMGB1 and IL-1β
proteins using Electrospray Ionization Mass Spectrometry (ESI-MS)
analysis.......................................................................................................50
2.3.14. Western blot analysis of the recombinant HMGB1 protein.......................51
2.3.15. Determination of the redox status of HMGB1 using LC-ESI-
MS/MS.......................................................................................................51
2.3.16. Determination of the cytokine-inducing activity of rHMGB1 proteins on
Peripheral Blood Mononuclear Cell (PBMC) cultures..............................52
2.4. IN VITRO ASSAYS TO INVESTIGATE THE INTERACTIONS OF
HMGB1 ................................................................................................... .....53
2.4.1. Culturing of SFs isolated from Rheumatoid Arthritis (RA) patients.........53
2.4.2. Investigating the synergistic activity of HMGB1 and IL-1β in SFs..........54
2.4.3. HMGB1 and IL-1β dose response in SFs..................................................54
2.4.4. Investigating the kinetics of the synergistic interaction between HMGB1
and IL-1β in SFs......................................................................................54
2.4.5. Investigating the synergistic interaction between IL-1β and the different
HMGB1 domains (Full length HMGB1, Δ30, A box or B box)...............55
2.4.6. Determining if the synergy between HMGB1, Δ30 or B box and IL-1β is
mediated via the IL-1R or TLR4 receptor ...............................................55
Chapter 2
33
2.4.7. Investigating the effect of LPS on HMGB1 and IL-1β synergy................55
2.4.8. Quantification of IL-6 levels in synovial fibroblast cell supernatants by
ELISA..................................................................................................56
2.4.9. Statistical analysis...................................................................................56
2.5. NMR METHODS TO INVESTIGATE HMGB1 PROTEIN
INTERACTIONS ........................................................................................ .56
2.5.1. An Introduction to NMR spectroscopy .................................................. .56
2.5.2. Protein NMR spectroscopy: Types of experiments and their applications 57
2.5.3. Preparation of NMR samples ................................................................. 59
2.5.4. NMR data collection .............................................................................. 60
2.5.5. NMR data processing and analysis ......................................................... 60

Chapter 2
34
2.1. MATERIALS
The HMGB1 I.M.A.G.E full length cDNA clone was purchased from Imagenes
(Berlin, Germany) (Clone ID: IRAUp96H0588D). The I.M.A.G.E full length cDNA
clone for IL-1β was obtained from Source Biosciences (UK) (Clone ID:
IRATp970B129D). PCR primers used for cloning purposes were synthesised by
Sigma Aldrich (UK). All PCR reagents were purchased from New England BioLabs
(NEB, Hertfordshire, UK). XLI-blue E.coli cells were from Stratagene (San Diego,
USA) and BL21 (DE3) cells were from Novagen (Merck Chemicals Ltd,
Nottingham, UK). Kanamycin was purchased from Sigma Aldrich (UK) and used at
a final concentration of 32 μg/mL. Ampicillin was from Melford (UK) and was used
at a final concentration of 100 μg/mL. AKTA columns were from GE Healthcare
(Buckinghamshire, UK). All AKTA buffers were passed through a 0.22 μM filter
and de-gassed prior to use. SFs were cultured from synovial tissue isolated from
Rheumatoid Arthritis (RA) patients at the Karolinska Institute, Stockholm, Sweden.
Unless otherwise stated, all other reagents were purchased from Sigma Aldrich
(UK).
2.2. GENERAL MOLECULAR BIOLOGY METHODS
2.2.1. Amplification of full length human HMGB1 DNA by Polymerase Chain
Reaction (PCR)
The DNA sequence for the human HMGB1 protein (648 bp) was obtained from the
NCBI website (BC008492.1). Forward and reverse primers were designed to clone
the DNA encoding the full length protein from the I.M.A.G.E cDNA clone. Primer
sequences are detailed in Table 2.1; Nco1 and EcoR1 restriction sites were
incorporated into the forward and reverse primers respectively, as underlined. PCR
reactions were set up in a final volume of 50 µL and contained 750 ng cDNA
template, 1x polymerase buffer, 0.5 µM forward and reverse primers, 0.2 mM

Chapter 2
35
Table 2.1 Sequences and technical information of the PCR primers used for the cloning of the HMGB1, Δ30, A box and IL-1β DNA
from the respective cDNA clones Important features are underlined and include the Nco1 and EcoR1 restriction sites, added to the HMGB1
forward and reverse primers respectively, and the primer extension regions added to the IL-1β primers to aid the In-fusion cloning reaction.
Protein Primer Sequence (5’ to 3’) Melting
temperature (oC)
GC
content
HMGB1 Forward ATATCCATGGGCAAAGGAGATCCTAAGAAGCCGAGAG 78.8 48.7
Reverse TATAGAATTCTTATTCATCATCATCATCTTCTTCTTCATC 69.4 27.5
A box
FL GGAGACATGAAAGAAGTTCAAGGATCCCAATGCACCCAAGAG 82.7 47.7
FS CAAGGATCCCAATGCACCCAAGAG 73.1 54.2
RL AACTTCTTTCATGTCTCCCCTTTGGGAGGGATATAGGTTTTC 78.2 42.9
RS CCTTTGGGAGGGATATAGGTTTTC 65.3 45.9
Δ30
FL AAAAAGAAGTGAGAAGAGGAGGAAGATGAGGAAGATGAAGAG 76.3 40.5
FS GAGGAAGATGAGGAAGATGAAGAG 63.3 45.9
RL GTCAAGGCTGAAAAAAGCAAGAAAAAGAAGTGAGAAGAGGAG 77.8 40.5
RS GTCAAGGCTGAAAAAAGCAAGAAA 66.2 37.5
IL-1β Forward AAGTTCTGTTTCAGGGCCCGGCACCTGTACGATCACTGAAC 84.7 53.7
Reverse ATGGTCTAGAAAGCTTTATTAGGAAGACACAAATTGCAT 72.6 33.4

Chapter 2
36
dNTPs, 0.1 mM betaine and 0.5 units Phusion Hot Start polymerase. PCR reactions
were carried out in an Eppendorf Mastercycler® as described in Table 2.2.
Table 2.2 PCR cycling conditions used to amplify HMGB1 DNA for the
I.M.A.G.E cDNA clone
Step Temperature Time
1 Polymerase activation 98oC 2 min
2 Denaturation 98oC 20 sec
3 Annealing 55oC 30 sec
4 Extension 72oC 30 sec
Steps 2-4 were repeated for 24 cycles
2.2.2. Analysis of DNA products using agarose gel electrophoresis
PCR products were analysed using agarose gel electrophoresis. 0.6% or 1% (w/v)
agarose gels were prepared by dissolving 300 mg or 500 mg agarose respectively in
50 mL 1xTris-Acetic acid-EDTA (TAE) buffer (40mM Tris acetate, 20 mM Acetic
acid, 1 mM EDTA). The mixture was heated until the agarose had fully dissolved
and then allowed to cool to 40-50oC. Ethidium bromide to a final concentration of 1
µM was added; the gel was poured and left to set at room temperature. Agarose gels
were run in 1 x TAE buffer. For each sample, 5 µL of the PCR products were mixed
with 5 µL of loading buffer (30% glycerol, 0.25% bromophenol blue in dH2O). 5 µL
of the DNA ladder (1Kb ladder, NEB; N3232) and 10 µL of each sample was loaded
to the wells and the gel was run at 80V for approximately 40 min. DNA bands were
visualised under UV light.
2.2.3. Construction of the pETM-11-HMGB1 plasmid
PCR products were purified using the GenElute PCR Clean-Up Kit (Sigma Aldrich)
according to the manufacturer’s instructions. To obtain cut linear DNA the reaction
products were digested using 10 U NcoI and 10 U EcoRI in a total volume of 60 µL
dH2O supplemented with 1 x NEBuffer EcoRI (NEB, Hertfordshire, UK). Reactions
were allowed to proceed at 37oC for 1 h. Cut DNA was purified using the GenElute
PCR Clean-Up Kit. A purified and pre-cut pETM-11 expression vector was supplied
by Dr Robert Gibson, Institute of Integrative Biology, University of Liverpool.

Chapter 2
37
Ligation of HMGB1 DNA into the pETM-11 vector was carried out at an insert:
vector molar ratio of 5:1 at 20oC for 25 min using the T4 DNA ligase (Invitrogen,
UK) (Figure 2.1). Plasmid concentration was quantified using a ND-100
Spectrophotometer (NanoDrop®).
Figure 2.1 Schematic representation of the pETM-11-HMGB1 vector map HMGB1 was cloned into the pETM-11 plasmid at the NcoI and EcoRI restriction
enzyme sites, as indicated, generating a recombinant vector with 5989 bp. The DNA
for the Δ30, A box and B box mutants was cloned into the vector at the same sites
generating plasmids of 5902 bp, 5602 bp and 5575 bp respectively. The key features
of the plasmid are indicated and include the kanamycin resistance gene (KanR) and
the T7 promoter region. * indicates the position of the 6-residue his tag incorporated
into the N-terminus of all constructs for purification purposes. The vector map was
created using SnapGene®.

Chapter 2
38
2.2.4. Cloning of HMGB1 mutants using Site-Directed Ligase Independent
Mutagenesis (SLIM)
The A box (residues 1-85) and Δ30 (residues 1-185) HMGB1 mutants were sub-
cloned using the Site-directed Ligase Independent Mutagenesis (SLIM) method
described by Chiu and colleagues (Chiu et al., 2004). An overview of the technique
is shown in Figure 2.2. Briefly, SLIM comprises of a single inverse PCR reaction
that uses four primers (Forward Long [FL], Forward Short [FS], Reverse Long [RL]
and Reverse Short [RS]) to incorporate the desired substitution, insertion or deletion
into the target DNA and produce complementary overhangs. This results in the
generation of four PCR products and following subsequent denaturation and re-
annealing 16 different hybrids are formed; two of these hybrids contain the correct
complementary overhangs and can form stable, non-covalently joined DNA circles.
When transformed into Escherichia coli (E.coli), in this case XL1-blue cells, only
the circular DNA can produce colonies on the appropriate antibiotic selective agar
plate.
To generate the A box and Δ30 mutants a stop codon (TGA) was inserted into the
target DNA at positions 86 and 186 respectively. Sequences for the PCR primers
used to incorporate this mutation are given in Table 2.1. pETM-11-HMGB1 plasmid
DNA (prepared as previously described in Section 2.2.3) was used as the template
DNA for the PCR reactions. Reactions contained 5 ng DNA template, 0.2 mM
dNTPs, 100 mM betaine, 10 pmol of each primer, 1 x polymerase buffer and 0.5 U
Phusion Hot start Fidelity DNA polymerase (NEB, UK) in a total volume of 25 µL
dH2O. PCR reactions were carried out in an Eppendorf Mastercycler® as detailed in
Table 2.3.
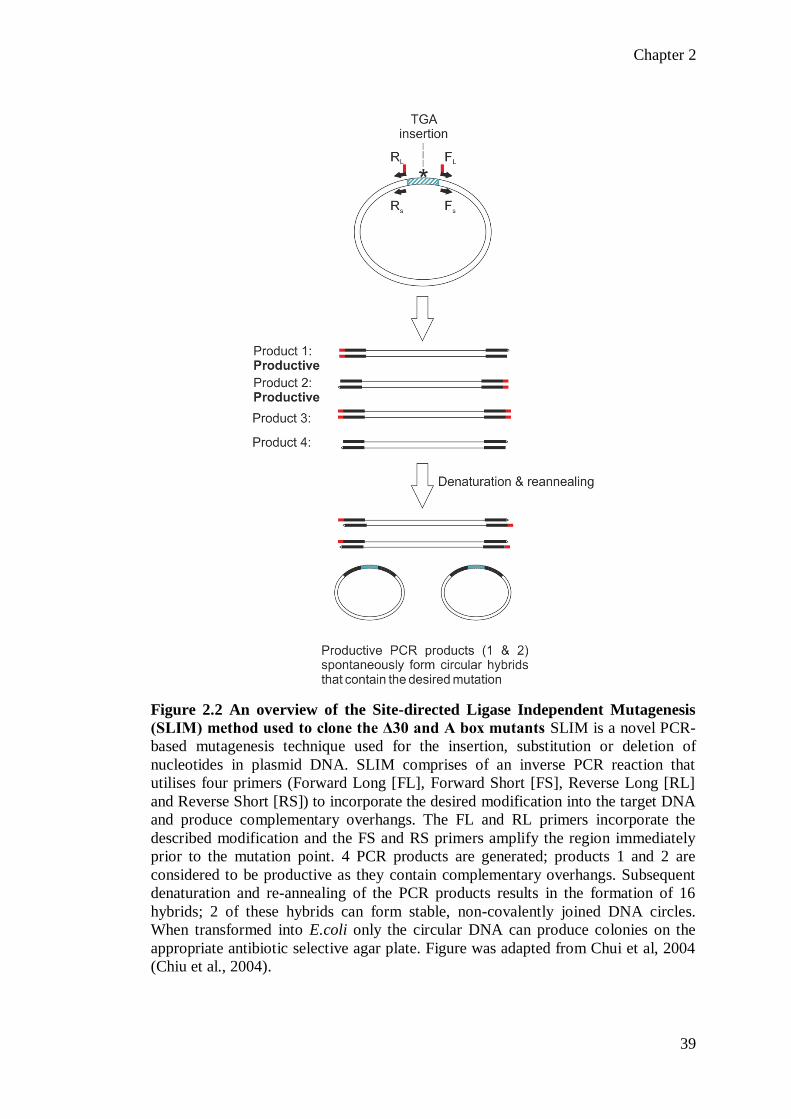
Chapter 2
39
Figure 2.2 An overview of the Site-directed Ligase Independent Mutagenesis
(SLIM) method used to clone the Δ30 and A box mutants SLIM is a novel PCR-
based mutagenesis technique used for the insertion, substitution or deletion of
nucleotides in plasmid DNA. SLIM comprises of an inverse PCR reaction that
utilises four primers (Forward Long [FL], Forward Short [FS], Reverse Long [RL]
and Reverse Short [RS]) to incorporate the desired modification into the target DNA
and produce complementary overhangs. The FL and RL primers incorporate the
described modification and the FS and RS primers amplify the region immediately
prior to the mutation point. 4 PCR products are generated; products 1 and 2 are
considered to be productive as they contain complementary overhangs. Subsequent
denaturation and re-annealing of the PCR products results in the formation of 16
hybrids; 2 of these hybrids can form stable, non-covalently joined DNA circles.
When transformed into E.coli only the circular DNA can produce colonies on the
appropriate antibiotic selective agar plate. Figure was adapted from Chui et al, 2004
(Chiu et al., 2004).

Chapter 2
40
Table 2.3 PCR conditions used to sub-clone the ∆30 and A box mutants from
the petM-11 plasmid DNA using Site-directed Ligase Independent Mutagenesis
(SLIM)
Step Temperature Time
1 Polymerase activation 98oC 2 min
2 Denaturation 95oC 25 sec
3 Annealing 50oC 30 sec
4 Extension 68oC 7 min
Steps 2-4 were repeated for 29 cycles
To remove the template DNA, PCR products were digested using Dpn1. 20 µl of the
PCR products were incubated with 10 U Dpn1 in 1 x NEB buffer 4 (B7004S, NEB,
Hertfordshire, UK) at 37oC for 1 h. The reaction was terminated using 30 µl of a
solution of 50 mM Tris HCl (pH 8), 300 mM NaCl and 20 mM EDTA. The products
were denatured at 99oC for 3 min. To anneal the complementary overhangs of the
DNA strands, thermo hybridisation was performed as described in Table 2.4. This
resulted in the formation of circular hybrids that contained the desired mutation.
Table 2.4 Thermocycler conditions used for the thermo hybridisation of the
linear Dpn1 digested pETM-11-Δ30 and pETM-11-A box PCR products
Step Temperature Time
1 99oC 3 min
2 65oC 5 min
3 30oC 15 min
Steps 2-3 were repeated for 3 cycles
2.2.5. Construction of the pETM-11-B box plasmid
The B box domain was synthesised and sub-cloned into the pETM-11 vector (at the
Nco1 and EcoR1 restriction sites) by GeneArt, Regensburg, Germany.
2.2.6. Amplification of the DNA encoding human IL-1β protein by PCR
The DNA sequence for the human IL-1β protein (459 bp) was obtained from the
NCBI website (BC008678.1). Forward and reverse primers were designed to amplify
the DNA from the I.M.A.G.E full length cDNA clone (Table 2.1). PCR reactions

Chapter 2
41
contained 100 ng of the template DNA, 1x polymerase buffer, 0.6 μM forward and
reverse primers, 0.2 mM dNTPs, 1 mM MgCl2 and 1 U of KOD polymerase in a
final volume of 50 μl. Reactions were carried out in an Eppendorf Mastercycler® as
outlined in Table 2.5.
Table 2.5 An overview of the PCR cycling conditions used to amplify IL-1β
DNA
Step Temperature Time
1 Polymerase activation 94oC 2 min
2 Denaturation 94oC 30 sec
3 Annealing 60oC 30 sec
4 Extension 68oC 2 min
Steps 2-4 were repeated for 29 cycles
5 Final elongation 72oC 2 min
PCR products were analysed using agarose gel electrophoresis as previously
described (Section 2.2.2).
2.2.7. Construction of the pOPINf-IL-1β recombinant plasmid
IL-1β DNA was expressed using the pOPINf vector system (Figure 2.3). The
pOPINf plasmid was prepared as follows: a commercial glycerol stock of the
plasmid was used to inoculate 5 mL of LB supplemented with 100 µg/mL ampicillin
and incubated overnight at 37oC in a shaking incubator at 200 rpm. The following
day the overnight culture was transferred to 100 mL ampicillin selective Lysogeny
Broth (LB) medium and returned to the incubator for a further 24 h. The plasmid was
purified using the GenElute™ HP Plasmid Midiprep kit (Sigma Aldrich) according
to the manufacturer’s instructions. Plasmid concentration was quantified using a ND-
1000 Spectrophotometer (NanoDrop®) and was only used when the A260:A280 ratio
was between 1.8-2.1.
To obtain cut linear plasmid DNA, 5 µg of DNA was incubated with 1 x BSA, 50 U
KpnI, 50 U HindIII and 1 x NEbuffer 2 (NEB, UK) in a total volume of 190 µL of
dH2O at 37oC for 2 h. The digested plasmid was purified using the GenElute PCR
Clean-Up Kit (Sigma Aldrich) according to the manufacturer’s instructions. The

Chapter 2
42
purity of the plasmid DNA was analysed using agarose gel electrophoresis as
described in Section 2.2.2.
Ligation of IL-1β DNA into the cut pOPINF vector was carried out using the In-
Fusion® HD Cloning Kit (Clontech, Saint Germain-en-Lave, France) according to
the manufacturer’s instructions at an insert: vector molar ratio of 7:1.
2.2.8. Confirmation of gene insertion by DNA sequencing
To confirm that the recombinant plasmids contained the correct gene of interest, 1
mL bacterial cell cultures were sent to Source Bioscience, UK, for forward and
reverse DNA strand sequencing using the T7 primer.
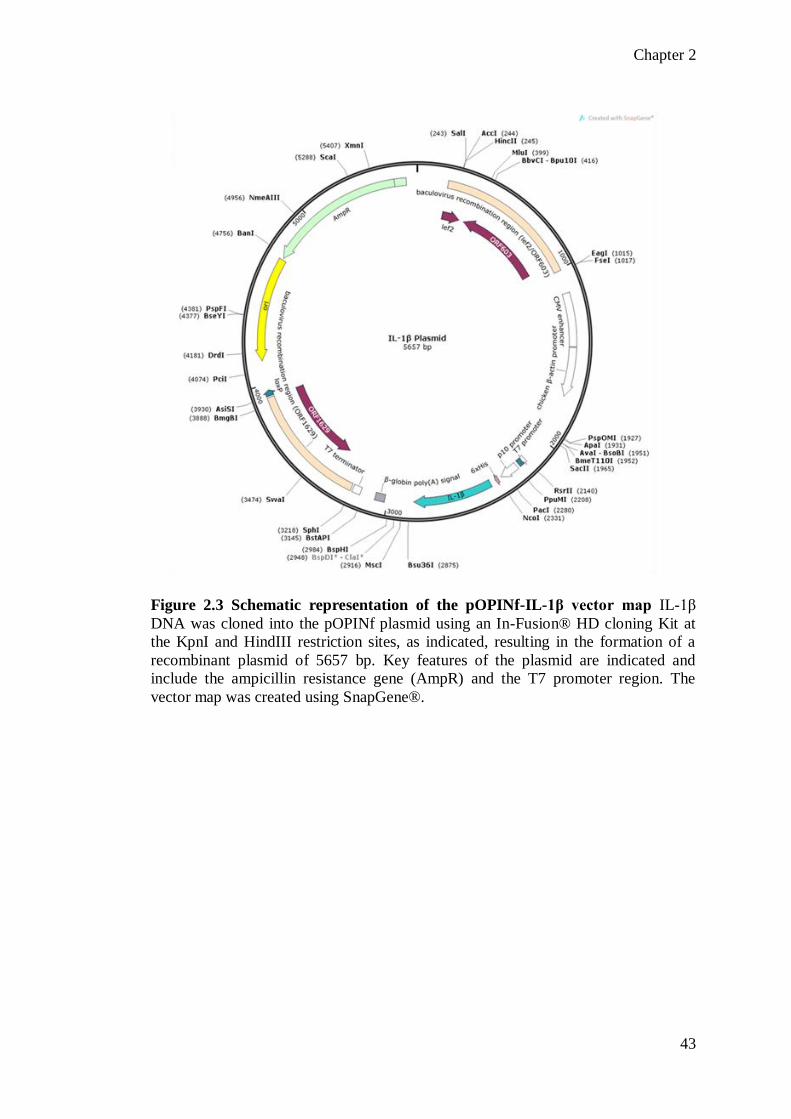
Chapter 2
43
Figure 2.3 Schematic representation of the pOPINf-IL-1β vector map IL-1β
DNA was cloned into the pOPINf plasmid using an In-Fusion® HD cloning Kit at
the KpnI and HindIII restriction sites, as indicated, resulting in the formation of a
recombinant plasmid of 5657 bp. Key features of the plasmid are indicated and
include the ampicillin resistance gene (AmpR) and the T7 promoter region. The
vector map was created using SnapGene®.
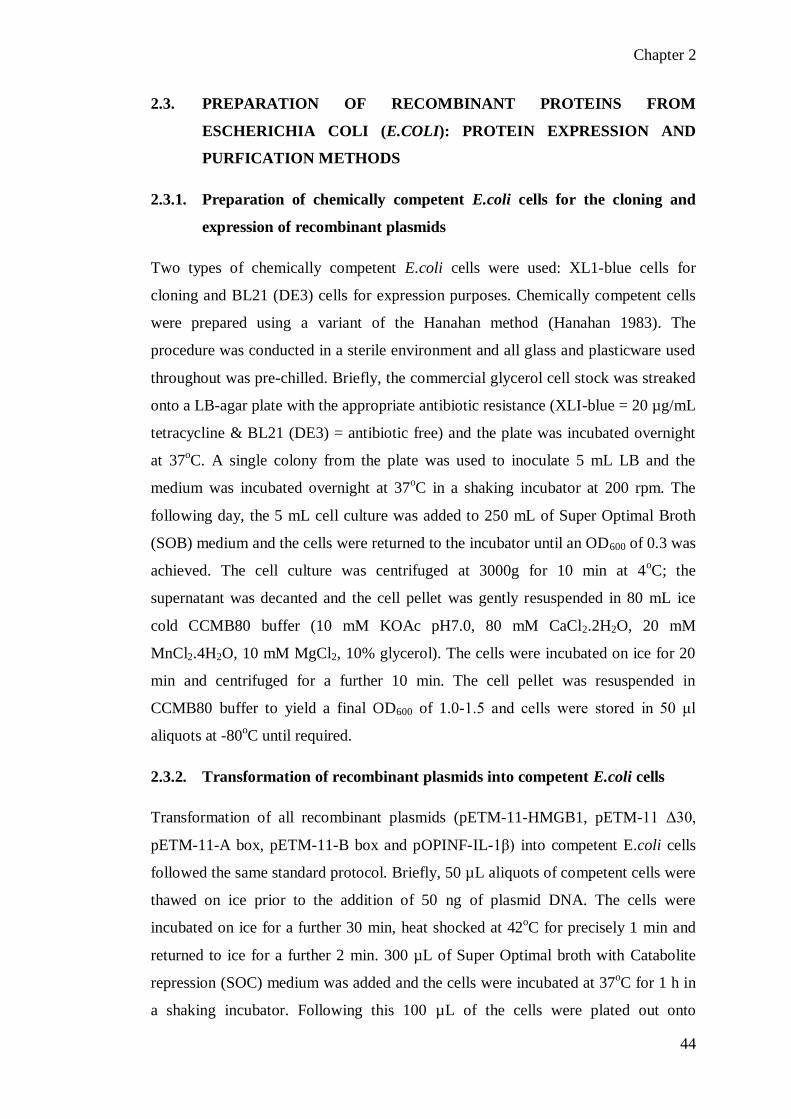
Chapter 2
44
2.3. PREPARATION OF RECOMBINANT PROTEINS FROM
ESCHERICHIA COLI (E.COLI): PROTEIN EXPRESSION AND
PURFICATION METHODS
2.3.1. Preparation of chemically competent E.coli cells for the cloning and
expression of recombinant plasmids
Two types of chemically competent E.coli cells were used: XL1-blue cells for
cloning and BL21 (DE3) cells for expression purposes. Chemically competent cells
were prepared using a variant of the Hanahan method (Hanahan 1983). The
procedure was conducted in a sterile environment and all glass and plasticware used
throughout was pre-chilled. Briefly, the commercial glycerol cell stock was streaked
onto a LB-agar plate with the appropriate antibiotic resistance (XLI-blue = 20 µg/mL
tetracycline & BL21 (DE3) = antibiotic free) and the plate was incubated overnight
at 37oC. A single colony from the plate was used to inoculate 5 mL LB and the
medium was incubated overnight at 37oC in a shaking incubator at 200 rpm. The
following day, the 5 mL cell culture was added to 250 mL of Super Optimal Broth
(SOB) medium and the cells were returned to the incubator until an OD600 of 0.3 was
achieved. The cell culture was centrifuged at 3000g for 10 min at 4oC; the
supernatant was decanted and the cell pellet was gently resuspended in 80 mL ice
cold CCMB80 buffer (10 mM KOAc pH7.0, 80 mM CaCl2.2H2O, 20 mM
MnCl2.4H2O, 10 mM MgCl2, 10% glycerol). The cells were incubated on ice for 20
min and centrifuged for a further 10 min. The cell pellet was resuspended in
CCMB80 buffer to yield a final OD600 of 1.0-1.5 and cells were stored in 50 μl
aliquots at -80oC until required.
2.3.2. Transformation of recombinant plasmids into competent E.coli cells
Transformation of all recombinant plasmids (pETM-11-HMGB1, pETM-11 Δ30,
pETM-11-A box, pETM-11-B box and pOPINF-IL-1β) into competent E.coli cells
followed the same standard protocol. Briefly, 50 µL aliquots of competent cells were
thawed on ice prior to the addition of 50 ng of plasmid DNA. The cells were
incubated on ice for a further 30 min, heat shocked at 42oC for precisely 1 min and
returned to ice for a further 2 min. 300 µL of Super Optimal broth with Catabolite
repression (SOC) medium was added and the cells were incubated at 37oC for 1 h in
a shaking incubator. Following this 100 µL of the cells were plated out onto

Chapter 2
45
kanamycin or ampicillin selective agar plates and were incubated overnight at 37oC
in a non-shaking incubator. Colonies on the plate represented bacteria with antibiotic
resistant that were successfully transformed with the desired plasmid.
2.3.3. Expression of recombinant HMGB1, HMGB1 mutants and IL-1β in LB
media
Single discrete colonies were cultured overnight in 50 mL LB, supplemented with
the appropriate antibiotic, at 37oC in a shaking incubator at 200 rpm. The overnight
culture was used to inoculate 500 mL LB to give a starting OD600 between 0.07-0.1.
The cells were incubated at 37oC at 200 rpm until an OD600 between 0.8-1.0 was
achieved. Protein expression was induced with the addition of Isopropyl β-D-1-
thiogalactopyranoside (IPTG) and cells were incubated at 200 rpm, as outlined in
Table 2.6. Induced cells were harvested by centrifugation at 3000g for 15 min at 4oC;
the cell pellet was retained and stored at -80oC prior to protein purification.
Table 2.6: An overview of the expression conditions used for the production of
recombinant proteins in E.coli Recombinant plasmids were transformed into BL21
(DE3) cells and cultured in antibiotic selective LB or M9 media. Protein expression
was induced using Isopropyl β-D-1-thiogalactopyranoside (IPTG) as indicated.
Construct Antibiotic
resistance
IPTG final
concentration (mM)
Incubation
conditions
HMGB1 Kanamycin 0.5 37oC, 4 h
∆30 HMGB1 Kanamycin 1 18oC, overnight
A box Kanamycin 1 24oC, overnight
B box Kanamycin 1 24oC, overnight
IL-1β Ampicillin 1 37oC, 4 h
2.3.4. Expression of 15
N and/or 13
C-labelled recombinant proteins in minimal
(M9) Medium
15N and/or
13C enriched proteins were prepared in minimal medium (also referred to
as M9 media) using 15
N ammonium chloride and/or 13
C glucose as the sole sources
of nitrogen and carbon respectively. Proteins were expressed as described in Section
2.3.3 with the following modifications: the M9 medium consisted of 88 mM
Na2HPO4 and 55 mM KH2PO4 adjusted to pH7.2 and supplemented with 22 mM

Chapter 2
46
13C-labelled glucose, 18 mM
15NH4Cl, 1 mM MgSO2.7H2O, 140 µM CaCl2.2H20
and 30 µM thiamine HCl. Discrete colonies were incubated in 2 mL LB, with the
appropriate antibiotic, for 5 h at 37oC in a shaking incubator set at 200 rpm. Cells
were centrifuged at 3000g for 10 min and the cell pellet was re-suspended in 500 µL
M9 media. 50 mL of M9 media, supplemented with the appropriate antibiotic, was
inoculated with 250 µL of the resuspended cells and incubated overnight at 37oC at
200 rpm. The following day, cells were centrifuged at 3000g for 10 min; the cell
pellet was retained and re-suspended in 3-5 mL M9 media and used to inoculate 500
mL M9 media to give a starting OD600 between 0.07-0.1. Protein expression was
induced as previously described (Table 2.6) with the following exemption; IL-1β
was induced overnight at 18oC.
2.3.5. Lysis of bacterial cell pellets
The bacterial cell pellets were allowed to gently thaw on ice and re-suspended in 10
mL of lysis buffer per 1 g of cell pellet. The lysis buffer consisted of 25 mM Tris
HCl pH7.8, 350 mM NaCl, 250 mM sucrose, 0.5 mg/mL lysosyme and 0.1% (v/v)
Triton X100. 12.5 µg/mL DNase 1 from bovine pancreas was added to the
resuspended cells. The pellets were incubated on ice for 15-30 min prior to the
addition an equal volume of 25 mM Tris HCl (pH7.8) supplemented with 350 mM
NaCl. The cells were returned to the ice for a further 5 min. Cells were lysed using a
Pressure Cell Homogeniser (Stansted Fluid Power Ltd, UK) at 1 bar. Lysed cells
were centrifuged at 23-24,000g for 30 min at 4oC to remove the bacterial debris and
the lysate was retained and passed through a 0.22 µM syringe filter.
2.3.6. Purification of recombinant proteins by Ni2+
affinity chromatography
A cleavable 6 residue histidine (His) tag was incorporated into the N-terminus of all
protein constructs for purifications purposes. His-tagged proteins were purified using
a variation of the method originally described by Hochuli and colleagues (Hochuli et
al., 1988) on a ÄKTApurifier system equipped with a P-960 sample pump and a
frac-920 fraction collector. A 5 mL HisTrap HP column pre-charged with Ni2+
Sepharose beads was equilibrated with 15 mL buffer A (25 mM Tris HCl, 350 mM
NaCl and 20 mM imidazole, pH7.8) at a constant flow rate of 3.5 mL/min. The
lysate was loaded onto the column and the column was washed with a further 25 mL

Chapter 2
47
of buffer A to remove any proteins that had formed non-specific interactions with the
Ni2+
resin. Proteins of interest, interacted specifically with the Ni2+
mediumand were
eluted using an increasing concentration of buffer B (25 mM Tris HCl, 250 mM
NaCl and 0.5 M imidazole, pH7.8) delivered by a linear gradient over 90 mL (or 18
column volumes). Proteins were collected in 5 mL fractions and analysed using SDS
gel electrophoresis as described in 2.3.7. Fractions containing the protein of interest
were pooled and subjected to further purification.
All recombinant proteins were purified using Ni2+
affinity chromatography as
described above with the following exception: for the IL-1β purification, buffers A
and B consisted of 50 mM Tris HCl, 350 mM NaCl, 20 mM imidazole, pH 8.0 and
50 mM Tris HCl, 350 mM NaCl, 0.5 M imidazole pH 8.0 respectively.
2.3.7. SDS-PAGE gel electrophoresis analysis of protein samples
SDS-PAGE gel electrophoresis was used to analyse the purity of bacterially
expressed recombinant proteins. Proteins were resolved on 12.5% (HMGB1 and
Δ30) and 15% (A box, B box and IL-β) bis-acrylamide SDS-PAGE gels using the
standard method described by Laemmli (Laemmli 1970) in a Bio-Rad gel
electrophoresis system. Gel samples were prepared as indicated using a 4x SDS-
PAGE loading buffer (200 mM Tris-HCl, pH6.8 supplemented with 400 mM DTT,
8% SDS, 0.4% bromophenol blue and 40% glycerol). Gels were run at 100 V for 10
min to allow the samples to stack evenly and then at 180 V for 45-60 min or until the
loading dye had reached the bottom of the gel plate.
SDS-PAGE gels were stained using Coomassie R250 stain (0.25% [w/v] Coomassie
R250 stain, 45% methanol and 10% acetic acid in dH2O) at room temperature for 30
min. Stained gels were placed in a solution of 40% methanol, 10% acetic acid until
the background was completely de-stained.
2.3.8. Cleavage of the 6-his tag from HMGB1 and HMGB1 mutants using
TEV protease
The 6 residue poly-histidine tag, which was incorporated into the N-terminus of all
HMGB1 constructs for purification purposes, was cleaved following the Ni2+
affinity
chromatography using the Tobacco Etch Virus (TEV) protease. For optimal TEV
cleavage, the protein was desalted into 25 mM Tris HCl, 50 mM NaCl, pH 7.8 using

Chapter 2
48
a HiPrep 26 10 desalting column (GE Healthcare, Buckinghamshire, UK) according
to the manufacturer’s instructions. Incubations were conducted overnight at 4oC at a
TEV: protein ratio of 1:20 (w/w).
The cleaved protein was isolated by “reverse” Ni2+
affinity chromatography. Protein
samples were adjusted to 300 mM NaCl and loaded onto a pre-equilibrated 5 mL
HisTrap HP column at 3.5 mL/min. The flow through, containing the cleaved protein
was retained. The cleaved his-tag and his-tagged TEV protease, which interacted
specifically with the Ni2+
beads were eluted using 25 mM Tris HCl, 250 mM NaCl
and 0.5 M imidazole, pH 7.8.
2.3.9. Cleavage of the 6-his tag from IL-1β using 3C protease
The 6 residue poly-histidine tag, incorporated into the N-terminus of the IL-1β
protein, was cleaved after the Ni2+
affinity chromatography, using the 3C protease.
The protease, produced in-house and kindly provided by Dr Thomas Zacharchenko,
recognised the LEVLFQ-GP sequence and specifically cleaved between the
glutamine (Q) and glycine (G) residues. For optimal cleavage, the protein was
desalted into 50 mM TrisHCl, 50 mM NaCl, pH 8 using a HiPrep 26 10 desalting
column (GE Healthcare, Buckinghamshire, UK) according to the manufacturer’s
instructions. Incubations were conducted overnight at 4oC at a 3C: protein ratio of
1:25 (w/w).
The cleaved protein was isolated by “reverse” Ni2+
affinity chromatography. Protein
samples were adjusted to 300 mM NaCl and loaded onto a pre-equilibrated 5 mL
HisTrap HP column at a flow rate of 3.5 mL/min. The flow through, containing the
cleaved protein was retained. The cleaved his-tag and his-tagged 3C protease bound
specifically to the Ni2+
beads and were eluted using 50 mM Tris HCl, 350 mM NaCl
and 0.5 M imidazole, pH 7.8.
2.3.10. Purification of recombinant proteins by Ion Exchange (IEX)
chromatography
All recombinant proteins were subjected to Ion Exchange (IEX) chromatography
following the reverse affinity purification. IEX chromatography separates molecules
by exploiting the difference in their overall net surface charge. A protein has no net
charge at a pH equivalent to its Isoelectric Point (pI). However, at a pH greater than

Chapter 2
49
its pI a protein will have a negative net charge and will interact with positively
charged medium or an anion exchanger (HiTrap Q FF column). At a pH lower than
its pI a protein will have a positive net charge and interact with negatively charged
medium or a cation exchanger (HiTrap S FF column).
The HMGB1 protein had a pI of 5.62 and was purified using anion exchange on a 5
mL HiTrap Q FF column (GE Healthcare, Buckinghamshire, UK). To allow optimal
binding, the protein was desalted into buffer A (25 mM Tris HCl, 50 mM NaCl, pH
7.8) prior to IEX purification, using a HiPrep 26 10 desalting column (GE
Healthcare, Buckinghamshire, UK) according to the manufacturer’s instructions. The
HiTrap Q FF column was pre-equilibrated with buffer A and the sample was loaded
at constant flow rate of 3.5 mL/min. The protein was eluted using an increasing
concentration of buffer B (25 mM Tris HCl, 1 M NaCl, pH 7.8) delivered over 90
mL (or 18 column volumes) and collected in 5 mL fraction. Fractions were analysed
using SDS gel electrophoresis as described previously (Section 2.3.7). Fractions
containing the protein of interest were pooled and purified further using size
exclusion chromatography.
The cleaved IL-1β protein had a pI of 5.91 and was purified using anion exchange as
described above but using the following buffers; Buffer A: 50 mM Tris HCl, 50 mM
NaCl, pH 8.5 and buffer B contained 50 mM Tris HCl, 0.5 M NaCl, pH 8.5.
The cleaved Δ30, A box and B box had pI values of 9.87, 9.67 and 9.38 respectively
and were purified by cation exchange using a 5 mL HiTrap S FF column, as
described above but with the following modifications; Buffer A consisted of 50 mM
potassium phosphate, 50 mM NaCl, pH 6.5 and buffer B contained 50 mM
potassium phosphate, 1 M NaCl, pH 6.5.
2.3.11. Purification of recombinant proteins using size exclusion
chromatography
The fractions retained from the IEX chromatography were subjected to size
exclusion purification. Proteins were concentrated to approximately 5-8 mL using 6
or 20 mL Vivaspin centrifugal concentrators with a 5 kDa Molecular Weight Cut Off
(MWCO) according to the manufacturer’s instructions (Sigma Aldrich, UK).

Chapter 2
50
The sample was loaded onto a Superdex 75 26 10 column (GE Healthcare,
Buckinghamshire, UK), which was pre-equilibrated with PBS pH 7.2.
The column was washed with 320 mL (or 1 column volume) of PBS, delivered at
constant flow rate of 1 mL/min and the protein was collected in 5 mL fractions. The
retention time was determined by the size of the molecule. Proteins were analysed
using SDS gel electrophoresis as described in Section 2.3.7.
Purified proteins were concentrated to an appropriate working concentration using
the Vivaspin centrifugal concentrators according to the manufacturer’s instructions.
2.3.12. Removal of contaminating endotoxin from recombinant protein
preparations using the Triton-X114 protocol
Contaminating LPS was removed from bacterially expressed recombinant protein
preparations using the Triton-X114 two phase extraction protocol originally
described by Aida and Pabst (Aida and Pabst 1990). Briefly, Triton-X114 was added
to the proteins at a final concentration of 1% (v/v) and the solution was gently
inverted to ensure thorough mixing. Tubes were rotated at 4oC for 30 min, heated to
37oC for 10 min and centrifuged at 18,000g at 25
oC for 10 min. This resulted in the
formation of a bi-layer and the top layer, containing the protein, was carefully
aspirated into a sterile tube. The entire process was repeated 3 times. After the final
spin, the samples were passed through a 0.22 µM syringe filter.
Protein aliquots (10 g/mL) were sent to the Karolinska Institute in Stockholm,
Sweden for endotoxin level quantification using the chromogenic LAL endotoxin
assay. Proteins used for experiments had LPS levels of less than 5 Endotoxin Unit
(EU)/mL.
2.3.13. Determining the total molecular mass of recombinant HMGB1 and IL-
1β proteins using Electrospray Ionization Mass Spectrometry (ESI-MS)
analysis
Recombinant proteins were prepared at 1 pg/μL in dH2O for Electrospray Ionization
Mass Spectrometry (ESI-MS) analysis. Samples were kindly analysed by Dr Mark
Prescott at the Institute of Integrative Biology, University of Liverpool. Samples
were analysed using a Waters Micromass Quadrupole Time of Flight (QToF) mass

Chapter 2
51
spectrometer operated in the positive ion electrospray mode. The samples were
dissolved in 50% aqueous acetonitrile (ACN), and infused into the mass
spectrometer via a syringe pump. The mass range scanned was: m/z 2-80 kDa. Data
were analysed using Waters MassLynx MS software.
2.3.14. Western blot analysis of the recombinant HMGB1 protein
5 µl of 4 x SDS-PAGE loading buffer was added to 1 µg of the recombinant
HMGB1 protein in a final volume of 20 µl dH2O. Proteins were resolved on a 10%
bis-acrylamide SDS-PAGE gel using the standard method described by Laemmli
(Laemmli 1970) in a Bio-Rad gel electrophoresis system. Gels were run at 100 V
for 10 min to allow the samples to stack evenly and then at 180 V for 45-60 min or
until the loading dye had reached the bottom of the gel plate. The proteins were
transferred onto nitrocellulose membrane (Hybond ECL, GE Healthcare) in ice-cold
transfer buffer (25 mM Tris base, 200 mM Glycine and 20% methanol in dH2O) at
100 V for 1 h. The membrane was blocked in 10% milk (Bio-Rad, Hertfordshire,
UK) for 30 min at room temperature. The membrane was washed four times using
Tween-TBS buffer (0.1% Tween in 1 x TBS buffer. 1 x TBS buffer contained 20
mM Tris base and 137 mM NaCl). The membrane was incubated with a polyclonal
rabbit anti-HMGB1 antibody (Abcam, UK) for 1 h at room temperature. The anti-
HMGB1 antibody was diluted 1/5000 in 2% milk. The membrane was washed four
times using Tween-TBS buffer. The membrane was incubated with an anti-rabbit
IgG antibody (Sigma, A0545) for 1 h at room temperature. The anti-rabbit antibody
was diluted 1/1000 in 2% milk. Protein bands were visualised using the Western
Lightning™ Chemiluminescence Plus-ECL reagent (Perkin Elmer, UK) according to
the manufacturer’s instructions.
2.3.15. Determination of the redox status of HMGB1 using LC-ESI-MS/MS
100 μg of his-tagged HMGB1 was incubated with 50 μl of Ni2+
affinity beads for 15
min at room temperature. The beads were centrifuged at 13,000 rpm for 1 min; the
pellet was retained and washed with PBS. The beads were re-suspended in 55 mM
iodoacetamide (Figure 2.4A) and incubated at room temperature for a further 15 min.
The beads were centrifuged at 13,000 rpm for 1 min; the pellet was retained and
washed with PBS. The beads were re-suspended in 1 mM DTT and incubated for a
further 15 min. The beads were centrifuged at 13,000 rpm for 1 min; the pellet was

Chapter 2
52
retained and re-suspended in 20 mM N-ethylmaleimide (NEM; Figure 2.4B). The
beads were incubated for a further 15 min at room temperature. The beads were
centrifuged at 13,000 rpm for 1 min; the pellet was retained and washed with PBS.
The his-tagged HMGB1 protein was digested on the Ni2+
beads using Glu-c (NEB,
Hertfordshire, UK) at a final protein: Glu-c ratio of 1:100. The mixture was
incubated for 16 h at 25oC in a total volume of 100 μl in PBS. The following day, the
beads were centrifuged at 13,000 rpm for 1 min and the supernatant was retained.
The peptides were dried down using a speed vac and re-suspended in 20 μl 0.1%
TFA. The peptides were purified using ZipTip C18 pipette tips (Millipore, UK)
according to the manufacturer’s instructions. Briefly, 1 µl 1% TFA was added to 10
µl of the peptides and the sample was vortexed. The C18 ZipTip was washed twice
with 100% ACN and three times with 0.1% TFA. The sample was loaded onto the
column and the tip was washed five times with 0.1% TFA. Peptides were eluted in
10 µl 0.1% TFA/60% ACN.
Figure 2.4 Chemical structures of (A) NEM and (B) iodoacetamide
Samples were kindly analysed using LC-ESI-MS/MS by Dr Rosalind Jenkins in the
Centre for Drug Safety Science at the University of Liverpool. The alkylation with
iodoacetamide generated a carboxyamidomethyl adduct resulting in a mass shift of
57 amu (atomic mass units). The alkylation with NEM yielded a mass shift of 125
amu.
2.3.16. Determination of the cytokine-inducing activity of rHMGB1 proteins on
Peripheral Blood Mononuclear Cell (PBMC) cultures
PBMCs were purified using Ficoll centrifugation (Ficoll-Paque Plus, GE Healthcare)
from the blood of a healthy volunteer drawn into sodium heparin tubes. Briefly, 18
mL of blood was collected and added to an equal volume of PBS along with 8 mL of
Ficoll reagent. The mixture was immediately centrifuged at 440g for 20 min at 20oC.

Chapter 2
53
The PBMC layer was retained and cells were washed using 40-45 mL PBS. Cells
were centrifuged at 300g for a further 7 min. The pellet was retained and the wash
was repeated. Cells were counted and the viability with assessed using trypan blue;
cells were only used when the viability > 95%.
Cells were plated at 100,000 cells/mL in a 96-well plate in OPTIMEM supplemented
with 100 U/mL Penicillin and 100 μg/mL streptomycin and cultured at 37oC with
5% CO2. Cells cultures were stimulated with HMGB1, Δ30, A box and B box at a
final concentration of 0, 0.625, 1.25, 2.5, 5 and 10 μg/mL for 16 h. Cell supernatants
were collected and stored at -20oC. IL-6 levels were quantified by ELISA as
described in Section 2.4.8.
2.4. IN VITRO ASSAYS TO INVESTIGATE THE INTERACTIONS OF
HMGB1
2.4.1. Culturing of SFs isolated from RA patients
SFs were cultured from synovial tissue isolated from arthritic patients undergoing
joint replacement surgery at the Karolinska Institute, Stockholm, Sweden as
previously described (Wahamaa 2011). Cells were cultured in DMEM supplemented
with 10% heat-inactivated FCS (PAA Laboratories, Linz, Austria), 100U/mL
penicillin, 100 µg/mL streptomycin and 1 x HEPES (Life Technologies, Paisley,
Scotland, UK) at 37oC with 5% CO2.
Cells were sub-cultured when they were 80% confluent using 0.05% trypsin-EDTA
(Gibco, UK). Briefly, cells were washed twice with PBS before 0.05% trypsin-
EDTA was added (4 and 2 mL trypsin solution was added to T175 and T75 flasks
respectively) and cells were incubated at room temperature for approximately 5 min
or until all the cells had detached from the flask. The detached cells were diluted to
15 mL using DMEM medium and were centrifuged at 300g for 5 min at room
temperature. The cell pellet was retained and re-suspended in DMEM. Cell viability
was assessed using trypan blue (Merck, Darmstadt, Germany) and was between 95-
100%. As a general rule, cells were sub-cultured at a ratio of 1:3.

Chapter 2
54
2.4.2. Investigating the synergistic activity of HMGB1 and IL-1β in SFs
SFs were plated at 6,000 cells/well in a 96-well plate and allowed to rest for 15-17 h.
The medium was discarded and the cells were washed with OPTIMEM (Invitrogen,
UK), supplemented with 100 U/mL penicillin and 100 µg/mL streptomycin
(Invitrogen, UK). Cells were treated with a final concentration of 100 ng/mL
HMGB1 and 0.5 ng/mL or 0.05 ng/mL IL-1β. Proteins were pre-incubated as a 50 x
stock solution in PBS (without CaCl2 and MgCl2, pH7.2; Invitrogen, UK) for 16 h at
4oC prior to the experiment. For the simultaneous addition the diluted HMGB1 and
IL-1β stocks were incubated separately overnight at 4oC and were combined
immediately prior to dosing. The proteins were diluted in OPTIMEM immediately
prior to cell treatment to provide the final indicated concentrations. Cells were dosed
for 24 h and the cell supernatants were collected and stored at -80oC until analysis.
2.4.3. HMGB1 and IL-1β dose response in SFs
SFs were plated at 6,000 cells/well in a 96-well plate and allowed to rest for 15-17 h.
The medium was discarded and the cells were washed with OPTIMEM (Invitrogen,
UK), supplemented with 100 U/mL penicillin and 100 µg/mL streptomycin
(Invitrogen, UK). HMGB1 and IL-1β were prepared as a 50 x stock solution and
incubated for 16 h at 4oC. Proteins were diluted in OPTIMEM immediately prior to
cell dosing to provide a final concentration of 3.25-100 ng/mL HMGB1 and 0.5
ng/mL IL-1β. Cells were dosed for 34 h and the cell supernatants were collected and
stored at -80oC until analysis.
2.4.4. Investigating the kinetics of the synergistic interaction between
HMGB1 and IL-1β in SFs
SFs were plated at 6,000 cells/well in a 96-well plate and allowed to rest for 15-17 h.
The medium was discarded and the cells were washed with OPTIMEM (Invitrogen,
UK), supplemented with 100 U/mL penicillin and 100 µg/mL streptomycin
(Invitrogen, UK). Fibroblasts were treated with a final concentration of 100 ng/mL
HMGB1 and 0.5 ng/mL IL-1β. The proteins were prepared as 50 x stock solutions
using freshly made dilutions and pre-incubated at 4oC, room temperature or 37
oC for
0-24 h. Stock solutions were diluted in OPTIMEM immediately prior to cell dosing.

Chapter 2
55
Cells were dosed for 24 h and the cell supernatants were collected and stored at -
80oC until analysis.
2.4.5. Investigating the synergistic interaction between IL-1β and the
different HMGB1 domains (Full length HMGB1, Δ30, A box or B box)
SFs were plated at 6,000 cells/well in a 96-well plate and allowed to rest for 15-17 h.
The medium was discarded and the cells were washed with OPTIMEM (Invitrogen,
UK), supplemented with 100 U/mL penicillin and 100 µg/mL streptomycin
(Invitrogen, UK). Cells were treated with HMGB1, Δ30, A box or B box in
combination with IL-1β. Proteins were prepared as a 50 x stock solution and
incubated for 16 h at 4oC. Stock solutions were diluted in OPTIMEM immediately
prior to dosing to provide a final concentration of 100 ng/mL HMGB1, 86 ng/mL
Δ30, 40 ng/mL A box or 35 ng/mL B box with 0.05 or 0.5 ng/mL IL-1β. Different
concentrations of the HMGB1 constructs were used to maintain the same molar ratio
(1:137 or 1:1370, IL-1β: HMGB1/Δ30/A box or B box). Cells were dosed for 24 h,
the supernatants were collected and stored at -80oC until analysis.
2.4.6. Determining if the synergy between HMGB1, Δ30 or B box and IL-1β
is mediated via the IL-1R or TLR4 receptor
SFs were plated at 6,000 cells/well in a 96-well plate and allowed to rest for 15-17 h.
The medium was discarded and the cells were washed with OPTIMEM (Invitrogen,
UK), supplemented with 100 U/mL penicillin and 100 µg/mL streptomycin
(Invitrogen, UK). Cells were pre-treated with 5 µg/mL anakinra (Kineret®; a
synthetic IL-1R antagonist) or 10 µg/mL detoxified LPS for 1-2 h. The cells were
treated with HMGB1, Δ30, A box or B box in combination with IL-1β. Proteins
were prepared as described in Section 2.4.5. Cells were dosed for 24 h, the
supernatants were collected and stored at -80oC until analysis.
2.4.7. Investigating the effect of LPS on HMGB1 and IL-1β synergy
SFs were plated at 6,000 cells/well in a 96-well plate and allowed to rest for 15-17 h.
The medium was discarded and the cells were washed with OPTIMEM (Invitrogen,
UK), supplemented with 100 U/mL penicillin and 100 µg/mL streptomycin
(Invitrogen, UK). The HMGB1, IL-1β and LPS used to dose the cells were prepared
as 50 x stock solutions. 5 µg/mL HMGB1 was pre-incubated with 1.25 ng/mL LPS

Chapter 2
56
for 1 h at 4oC. 25 ng/mL IL-1β was added to the mixture and the proteins were
incubated for a further 16 h at 4oC. The proteins were diluted in OPTIMEM
immediately prior to cell dosing. Additionally, 5 µg/mL HMGB1 and 25 ng/mL IL-
1β were incubated for 16 h at 4oC. Following the overnight incubation, 1.25 ng/mL
LPS was added to the proteins for 2, 1, 0.5 or 0 h. The stock solutions were diluted
1/50 in OPTIMEM immediately prior to cell stimulations to provide a final cellular
concentration of 100 ng/mL HMGB1, 0.5 ng/mL and 25 pg/mL LPS. Cells were
dosed for 24 h; supernatants were collected and stored at -80oC until analysis.
2.4.8. Quantification of IL-6 levels in synovial fibroblast cell supernatants by
ELISA
IL-6 cytokine levels were quantified using the Human IL-6 DuoSet ELISA kit (R &
D systems) according to the manufacturer’s instructions. The limit of quantification
was 9.37 pg/mL and samples below this limit were assigned a value of 0.1 for
statistical analysis.
2.4.9. Statistical analysis
All data are provided as absolute IL-6 values ± SD, with the following exception: for
Figure 4.2, data are expressed as mean IL-6 value ± SEM. The limit of quantification
for the IL-6 ELISA was 9.37 pg/mL and samples below this limit were assigned a
value of 0.10 for statistical analysis. Data were analysed for normality using a
Shapiro Wilk test. For normal data statistical significance was determined using a T-
test. Non-normal data were analysed using a Kruskal Wallis one-way ANOVA on
ranks test.
2.5. NMR METHODS TO INVESTIGATE HMGB1 PROTEIN
INTERACTIONS
2.5.1. An Introduction to NMR spectroscopy
(The following references were used throughout this section (Cavanagh et al., 2006;
Muskett 2011; Takeda and Kainosho 2011)).
In 1957, Saunders et al recorded the first 1H NMR spectrum for the pancreatic
ribonuclease protein using a 40 MHz spectrometer (Saunders et al., 1957). Since
then, NMR tools have developed considerably with the introduction of two-

Chapter 2
57
dimensional (2D) spectroscopy in the 1970s allowing for the study of multiple nuclei
within a single experiment.
All molecules are composed of atoms, which in turn consist of a nucleus that
contains protons and neutrons and is surrounded by orbital negatively charged
electrons. Nuclei have an intrinsic quantum mechanical property known as the
nuclear spin angular momentum, which is defined by the nuclear spin quantum
number (I). As a result, when certain atomic nuclei are exposed to a strong magnetic
field they will align parallel to the applied field. It is important to note that nuclei
with I = ½ are commonly studied by NMR spectroscopy. This includes the 1H,
15N
and 13
C isotopes, which have a natural abundance of 99.99%, 0.37% and 1.11%
respectively. As such, enrichment of the 15
N and 13
C isotopes is required for the
production of labelled proteins for heteronuclear NMR experiments.
NMR experiments utilise a stable magnetic field and when the sample is placed into
the spectrometer the nuclei align to this resting state. During the experiment,
radiofrequency pulses perturb the alignment and the resulting signal is detected. The
signal is measured until the nuclei have re-aligned to the magnetic field (resting
state). The amplified and digitised signal is known as the Free Induction Decay
(FID) signal and is a measurement of the intensity of the signal over time (intensity
vs. time). The FID signal must be processed prior to data analysis and this is
achieved using a mathematical process known as Fourier transformation. The FID
signal is converted from a plot of the intensity vs. time to intensity vs. frequency
(frequency may also be referred to as chemical shift), with the frequency measured
in MHz. However, the MHz signal is dependent upon the magnetic field strength and
is not a standardised measurement across different spectrometers. To compensate for
this, the signal is converted to parts per million (ppm) and expressed relative to a
reference peak and the final NMR spectrum is a plot of the chemical shift (ppm) vs.
intensity.
2.5.2. Protein NMR spectroscopy: Types of experiments and their applications
Protein NMR spectroscopy has many practical applications; it can be employed to
elucidate three dimensional (3D) protein structures and can be used to investigate
and characterise macromolecular interactions. For the work described within this
thesis, standard 1D, 2D and 3D experiments were employed. One dimensional (1D)

Chapter 2
58
1H NMR spectroscopy can provide vital information about a protein; for example it
can be used to determine if the protein of interest is correctly folded and to identify
any small molecule contaminants. 2D Heteronuclear Single Quantum Coherence
(HSQC) experiments are used to obtain more detailed information about the protein
of interest. HSQC experiments measure the chemical shift of both the proton and the
heteronuclear atom (15
N or 13
C). They are used to obtain one-bond correlation
spectra and each peak on a HSQC spectrum is a plot of the proton frequency (direct
dimension) vs. the frequency of the corresponding heteronuclei (indirect dimension).
2D HSQC experiments are an extremely useful tool for investigating protein
interactions. If two macromolecules interact to form a binary complex then the
electronic environment of the atoms involved or affected by the interaction will be
changed and the peaks on the HSQC spectrum will be perturbed. For the purpose of
this work, protein NMR spectroscopy has been utilised to investigate HMGB1
interactions. Specifically, this work was performed to determine if a direct
interaction occurs between HMGB1 and IL-1β.
A combination of 2D and 3D NMR experiments were performed for the assignment
of the A box domain of HMGB1. Standard HSQC-based 3D triple resonance (1H,
15N and
13C) experiments were used to assign the backbone residues (Clubb et al.,
1992; Grzesiek and Bax 1992; Grzesiek and Bax 1992). Briefly, 3D HNCO and
HNCACO experiments were used to sequentially assign the backbone NH via the
carboxyl group and CBCACONH and HNCACB experiments were used to assign
the backbone NH via the backbone Cα and side-chain Cβ groups (Figure 2.5).

Chapter 2
59
Figure 2.5 Overview of the experiments carried out for the assignment of the A
box domain of HMGB1 Standard HSQC-based 3D triple resonance experiments
were used to assign the backbone NH groups of the A box domain. A) HNCO and
HNCACO spectra were used to sequentially assign the backbone NH via the
carboxyl group. B) CBCACONH and HNCACB experiments were used to assign
the backbone NH via the backbone Cα and side-chain Cβ groups. Circled nuclei
represent resonances assigned using each experiment via i NH root resonances.
2.5.3. Preparation of NMR samples
For NMR analysis 15
N and/or 13
C-labelled recombinant proteins were expressed in
minimal medium and purified as previously described in Section 2.3. Detailed
information on the samples used for NMR experiments is provided in Table 2.7. As
a general rule, NMR samples were prepared at 10-100 μM in PBS, pH 7.2, and
contained a final concentration of 10% D2O (Deuterium oxide, 2H2O). For NMR
experiments, the samples were placed in either standard 5 mm NMR tubes (Sample
Chapter 2
60
volumes of >500 μL; Goss Scientific, UK) or Shigemi reduced volume NMR tubes
(Sample volume between 300-500 μL; Sigma Aldrich, UK). Between samples, NMR
tubes were cleaned using 100% nitric acid overnight and washed thoroughly with
ultrapure water prior to use.
2.5.4. NMR data collection
All NMR spectra were collected on Bruker Avance II 600 or 800 MHz spectrometers
equipped with triple (TCI) resonance cryoprobes at 25oC (298 K) unless otherwise
stated.
2.5.5. NMR data processing and analysis
All NMR data were processed using Topspin 3.1 (Bruker) and analysed using CCPN
analysis.

Chapter 2
61
Table 2.7 An overview of the NMR sample preparation and experimental acquisition parameters NMR spectra were collected on 600MHz
or 800MHz Bruker Advance spectrometers equipped with triple resonance cryoprobes at 25oC (298K) unless stated otherwise. All samples
contained a final concentration of 10% D20. (PBS; 8.06mM Na2HPO4.7H2O, 1.47mM KH2PO4, 137.93mM NaCl and 2.67mM KCl, pH7.2)
Thesis
figure(s)
Sample LPS Free
(<0.05EU/
mL)
Buffer/pH Field
strength
(MHz)
Number of
scans (NS)
T1
Increments
Resolution in
the indirect
dimension
(Hz)
3.4 23 μM unlabelled HMGB1
Yes PBS, pH 7.2 600 512 - -
3.6 100 μM 15
N his-tagged Δ30
Yes PBS, pH 7.2 600 64 160 18.24
3.7 50 μM 15
N A box
Yes PBS, 10 mM DTT, pH 7.2 800 16 150 21.80
3.8
10 μM 15
N B box Yes PBS, pH 7.2 800 192 256 15.80
3.9
25 μM 15
N IL-1β Yes PBS, pH 7.2 600 32 160 21.00
3.11
100 μM 15
N A box
pH titration from 5.5 to 7.2
No 20 mM potassium phosphate,
100 mM potassium chloride
and 10 mM DTT, pH 5.5
to7.2
800 8 150 21.09
3.13
50 μM 15
NA box ± 10 mM DTT Yes PBS, pH 7.2 800 16 150 21.08

Chapter 2
62
3.14 Pre-LPS removal: 40 µM 15
N his-
tagged Δ30
Post-LPS removal 100 µM 15
N his-
tagged Δ30
No
Yes
PBS, pH 7.2 600 64 160 18.24
3.15 Pre-LPS removal: 77 µM 15
N A
box
Post-LPS removal 50 µM 15
N A
box
No
Yes
PBS, 10 mM DTT, pH 7.2 800 16 150 21.08
3.16 Pre-LPS removal: 10 µM 15
N B
box
Post-LPS removal 10 µM 15
N B
box
No
Yes
PBS, pH 7.2 800 192 256 15.80
5.1 & 5.2 25 μM IL-1β (Apo)
12.5 μM 15
N IL-1β ± 11.5 μM
HMGB1 (IL-1β: HMGB1 1:1)
Yes PBS, pH 7.2 600 32 160 21.00
5.3 & 5.4 100 μM 15
N IL-1β (Apo)
50 μM 15
N IL-1β ± 195 μM
HMGB1 (IL-1β: HMGB1 1:4)
Yes PBS, pH 7.2 600
10oC
(283 K)
64
256
250
384
12.67
12.67
5.6 10 μM 15
N his-tagged Δ30 ± 90 μM
IL-1β
(Δ30: IL-1β ratio = 1:9)
Yes PBS, pH 7.2 800 192 256 15.80
5.7 100 μM 15
N IL-1β ± 300 μM Δ30 Yes 20 mM Phosphate, 100 mM
potassium chloride, 10 mM
DTT, pH 6.8
800 4 210 16.99
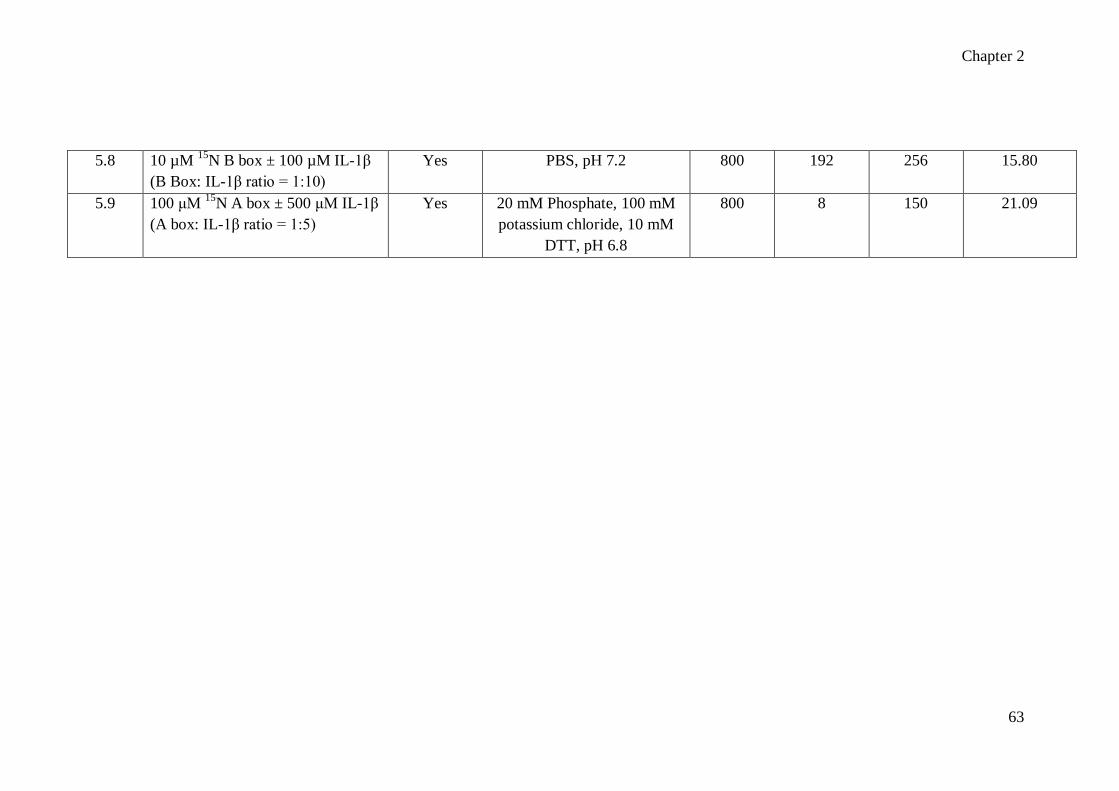
Chapter 2
63
5.8 10 µM 15
N B box ± 100 µM IL-1β
(B Box: IL-1β ratio = 1:10)
Yes PBS, pH 7.2 800 192 256 15.80
5.9 100 μM 15
N A box ± 500 μM IL-1β
(A box: IL-1β ratio = 1:5)
Yes 20 mM Phosphate, 100 mM
potassium chloride, 10 mM
DTT, pH 6.8
800 8 150 21.09
CHAPTER THREE
EXPRESSION, PURIFICATION AND CHARACTERISATION OF
RECOMBINANT HMGB1AND IL-1β PROTEINS

Chapter 3
65
TABLE OF CONTENTS
3.1. INTRODUCTION ........................................................................................ 66
3.2. MATERIALS AND METHODS ................................................................. 69
3.3. RESULTS ..................................................................................................... 70
3.3.1. Production of recombinant human HMGB1 proteins from E.coli ........... 70
3.3.2. Production of recombinant human IL-1β from E.coli ............................. 72
3.3.3. Removal of LPS from recombinant protein preparations ........................ 74
3.3.4. NMR characterisation of recombinant proteins....................................... 75
3.3.4.1. 1D NMR characterisation of full length HMGB1.....................................75
3.3.4.2. 2D NMR characterisation of Δ30, A box, B box and IL-1β proteins........78
3.3.4.3. Characterisation of the 1H-
15N HSQC spectrum for the reduced A box
domain of HMGB1....................................................................................84
3.3.4.4. NMR characterisation of the oxidised and reduced A box domain...........88
3.3.4.5. Investigating the effect of LPS removal on the NMR spectra for Δ30, A
box and B box............................................................................................90
3.3.5. Analysis of the cytokine-inducing activity of the recombinant HMGB1
proteins ................................................................................................ ..94
3.3.6. LC-ESI-MS/MS characterisation of the redox state of the C23, C45 and
C106 residues in full length HMGB1 .................................................... .95
3.4. DISCUSSION ............................................................................................... 97

Chapter 3
66
3.1. INTRODUCTION
HMGB1 was first isolated from calf thymus in 1973 by Goodwin and colleagues
(Goodwin et al., 1973). Originally HMGB1 was discovered as a nuclear protein that
is involved in the regulation of protein transcription (Travers and Thomas 2004).
However, subsequent studies have demonstrated that HMGB1 has multiple distinct
functions in the nucleus and cytoplasm (Figure 1.5).
Increasingly, HMGB1 is reported to be an important cytokine mediator in both
sterile and infectious inflammation. Studies have identified HMGB1 as a pathogenic
mediator of sepsis, autoimmune diseases including arthritis, pancreatitis, respiratory
disorders, gastrointestinal inflammation, ischemia-reperfusion injury and cancer
(Andersson and Tracey 2011). Additionally, HMGB1 has been identified as an
important inflammatory mediator in animal and clinical studies of DILI (Antoine et
al., 2009; Antoine et al., 2010; Craig et al., 2011; Antoine et al., 2012). Recently, a
study by Antoine and colleagues has identified acetylated HMGB1 as a prognostic
indicator of acute liver injury during acetaminophen hepatotoxicity (Antoine et al.,
2012).
To initiate and enhance inflammation, HMGB1 signals alone or via an unidentified
mechanism to act in synergy with other endogenous or exogenous molecules. The
overall aim of this thesis was to investigate and characterise the molecular
interaction between HMGB1 and IL-1β using both cellular and NMR methodologies.
To facilitate these studies, this chapter describes the development and optimisation
of methods for the expression, purification and characterisation of the human
HMGB1 and IL-1β proteins. This chapter also reports the successful sub-cloning of
three human HMGB1 mutants (Table 3.1). The individual A and B box domains
(corresponding to residues 1-85 and 89-163 respectively) and the Δ30 protein, which
contains residues 1-185 and does not incorporate the 30-residue C-terminal
polyacidic tail. The different HMGB1 domains will be used to further investigate the
cellular and biophysical interaction between HMGB1 and IL-1β and to identify
which domain(s) of HMGB1 is critical for the synergistic response.

Chapter 3
67
Table 3.8 Domain structure of recombinant HMGB1, Δ30, A box and B box
proteins produced in this thesis.
As discussed in Section 1.8.2, HMGB1 is a 25 kDa protein consisting of 215 amino
acid residues organised into a tripartite domain structure (Figure 1.6 & Figure 1.7).
The expression and purification of recombinant cytokine-inducing rat HMGB1 in
E.coli has been previously reported and is associated with low protein yields
(Bianchi 1991; Li et al., 2003). A further complication associated with the
production of recombinant HMGB1 proteins is the presence of LPS contaminants in
the purified protein sample. LPS is a major component of the outer membrane of
gram negative bacteria and a potent activator of the innate immune system. LPS
induces septic shock in humans and studies have demonstrated that LPS-treated
macrophages release large quantities of TNF (Beutler et al., 1985). HMGB1 and LPS
both signal via the TLR4 to increase nuclear translocation of NF-KB (Andersson and
Tracey 2011). It has been reported that HMGB1 and LPS act synergistically to
enhance the inflammatory response and it is proposed that this is mediated via the
formation of a highly active pro-inflammatory complex (Youn et al., 2008;
Hreggvidsdottir et al., 2009). Efficient removal of LPS contaminants is essential
(Wakelin et al., 2006) particularly since HMGB1 is reported to have a high affinity
for LPS (Youn et al., 2008). A number of removal methods have been described
including Triton-X 114 phase extraction, polymyxin B treatment and anion-exchange
purification (Petsch and Anspach 2000).

Chapter 3
68
The production of isotopically labelled recombinant proteins is required for
heteronuclear NMR experiments and backbone assignment. For the purpose of this
work, the proteins were uniformly labelled using the 15
N and/or 13
C isotopes. Isotope
labelling increases the sensitivity and peak resolution and additionally helps to
simplify the complexity of the NMR spectra (Lian and Middleton 2001). The
production of isotopically labelled HMGB1 constructs has been previously reported.
However, published NMR studies have not considered the effect of LPS
contaminants and their removal. An additional aim of this work was to investigate
the effect of LPS removal on the NMR spectra for the HMGB1 proteins.
This chapter describes the development and optimisation of methods for the
expression, purification and characterisation of LPS-free and isotopically labelled
recombinant human HMGB1 and IL-1β proteins.
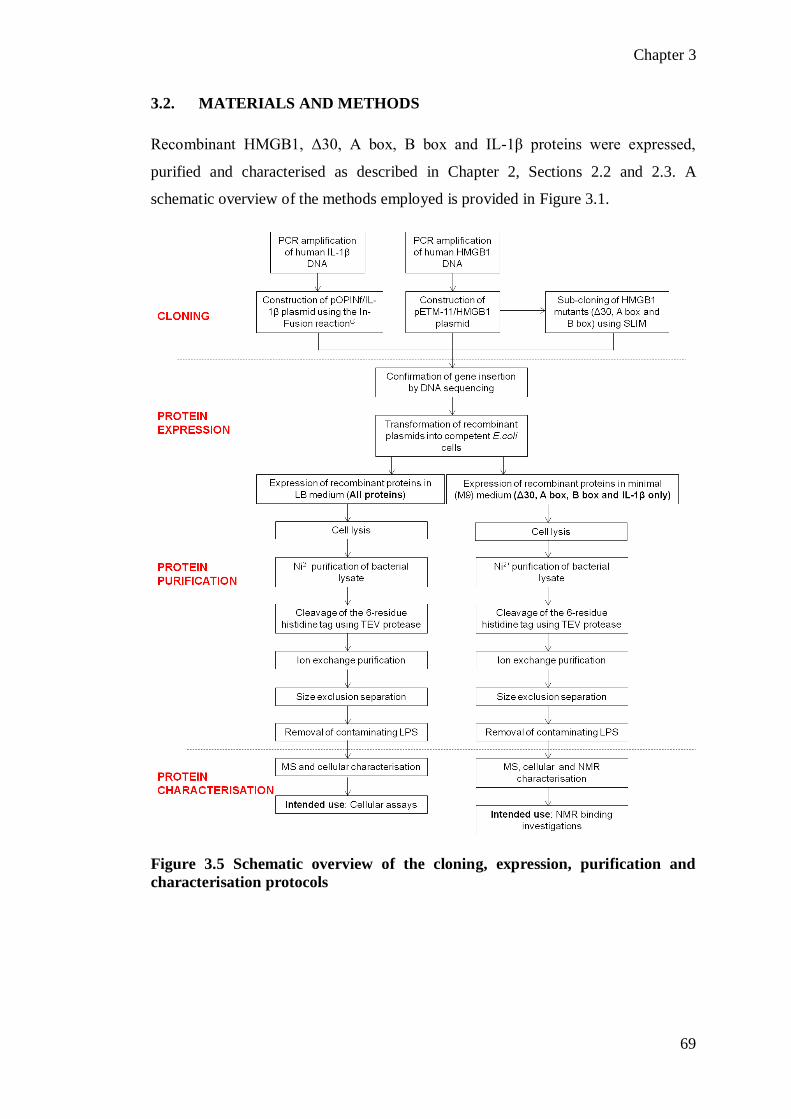
Chapter 3
69
3.2. MATERIALS AND METHODS
Recombinant HMGB1, Δ30, A box, B box and IL-1β proteins were expressed,
purified and characterised as described in Chapter 2, Sections 2.2 and 2.3. A
schematic overview of the methods employed is provided in Figure 3.1.
Figure 3.5 Schematic overview of the cloning, expression, purification and
characterisation protocols

Chapter 3
70
3.3. RESULTS
3.3.1. Production of recombinant human HMGB1 proteins from E.coli
The pETM-11/HMGB1 plasmid was transformed into E.coli BL21 (DE3) cells and
the protein was expressed in LB medium at 37oC for 4 h, as this was determined to
be the optimal expression conditions. The bacterial cell lysate was initially purified
using Ni2+
affinity chromatography and SDS-PAGE gel electrophoresis analysis of
the purification fractions identified two over expressed protein bands (Figure 3.2A).
The two bands were successfully separated using anion exchange chromatography
(Figure 3.2B), which exploited the difference in the overall net surface charge. ESI
MS analysis determined that the upper band had a molecular weight (MW) of 28.03
kDa (Figure 3.2C). The predicted MW of his-tagged HMGB1 was 28.02 kDa and the
MS analysis confirmed that the upper band was full length HMGB1. Furthermore,
western blot analysis confirmed this finding (Figure 3.2D). The lower band was
found to have a MW of 25.80 kDa by ESI-MS and represented a C-terminal
truncated HMGB1 protein (Figure 3.2C). Predicted MW data suggests that the final
18 residues of the polyacidic C-terminal tail are absent in the truncated HMGB1
protein (corresponding to residues 198-215; EEEEDEEDEDEEEDDDDE).
In future preparations, the 6 residue poly-his tag was cleaved using TEV protease
prior to the ion-exchange purification as described in Section 2.3.8. Additionally, to
increase the purity the HMGB1 protein was further purified using size exclusion
chromatography (as described in Section 2.3.11). Purified HMGB1 was visualised as
a single band on a SDS-PAGE gel. In LB medium, the final yield of purified protein
was approximately 0.75 – 1 mg/L. Due to the low protein yield, full length HMGB1
was not expressed in minimal medium.
The Δ30, A box and B box proteins were sub-cloned from the pETM-11/HMGB1
plasmid using SLIM as described in Chapter 2, Section 2.2.4. Recombinant plasmids
were transformed into BL21 (DE3) cells and the proteins were expressed in LB and
minimal medium. The purification protocol used for the mutants was identical to the
HMGB1 purification strategy. Purified proteins were visualised as a single band on a
SDS-PAGE gel. In comparison to HMGB1 the yields of protein obtained for the
mutants were significantly higher (Table 3.2).

Chapter 3
71
Figure 3.6 Production of recombinant human HMGB1 in BL21 (DE3) cells The
pETM-11/HMGB1 plasmid was transformed into BL21 (DE3) cells and expressed in
LB medium at 37oC for 4 h. The cell lysate (lane 2) was purified using Ni
2+ affinity
chromatography and the fractions of interest (lanes 4-9) were analysed on a 12.5%
SDS-PAGE gel (A). Two over-expressed protein bands were detected (lanes 8 & 9)
and were separated using anion exchange chromatography (lower band lanes 3-7,
upper band lanes 11-12) (B). ESI-MS analysis confirmed that the upper band
corresponded to the full length HMGB1 and the lower band was a C-terminal
truncated HMGB1 protein (C). Western blot analysis confirmed that the upper
HMGB1 band was HMGB1 (D).

Chapter 3
72
Table 3.9 Typical yields of LPS-free proteins obtained from BL21 (DE3) cells
expressed in 1L of LB or minimal medium*
Construct LB medium (mg/L) Minimal medium (mg/L)
HMGB1 0.75 - 1 -
Δ30 3 - 5 1.5 – 2.5
A box 8 - 10 4 – 5
B box 8 - 10 4 – 5
IL-1β 36 20
3.3.2. Production of recombinant human IL-1β from E.coli
The DNA for the human IL-1β protein was sub-cloned into the pOPINF vector using
the In-Fusion® reaction. A 6-residue his tag was incorporated into the N-terminus
for purification purposes (Figure 2.3). The pOPINF/IL-1β plasmid was transformed
into BL21 (DE3) cells and the protein was expressed in LB medium at 37oC for 4 h.
The bacterial cell lysate was purified using Ni2+
affinity chromatography and the
fractions were analysed using SDS-PAGE gel electrophoresis (Figure 3.3B). A high
yield of the IL-1β protein was obtained and contaminating proteins were removed
using anion exchange chromatography (Figure 3.3C). ESI-MS analysis confirmed
that the IL-1β protein had a total molecular weight of 19.39 kDa (predicted
molecular weight = 19.5 kDa).
In future preparations, the 6 residue poly-his tag was cleaved using the 3C protease
prior to the ion-exchange purification as described in Section 2.3.9. For NMR
experiments, the protein was further purified using size exclusion separation.
Purified IL-1β was visualised as a single band on a SDS-PAGE gel. In LB medium,
the final yield of purified protein was approximately 36 mg/L of cell culture (Table
3.2). For the production of 15
N-labelled IL-1β, transformed E.coli cells were grown
in minimal medium to an OD of 0.8-1.0 and after induction with IPTG, protein
expression was carried out overnight at 18oC. The purification of labelled proteins
was identical to the protocols used for the purification of LB expressed proteins.
Approximately 20 mg of purified IL-1β protein was obtained from 1L of minimal
medium.
* For a description of the LPS removal see Section 3.3.3

Chapter 3
73
Figure 3.7 Production of recombinant IL-1β from BL21 (DE3) cells DNA for the
human IL-1β protein was cloned into the pOPINF vector. A cleavable 6-residue his
tag was incorporated into the construct for purification purposes (A). The plasmid
was transformed into BL21 (DE3) cells and the protein was expressed in LB medium
at 37oC for 4 h. The cell lysate (lane 3) was purified using Ni
2+ purification and the
fractions of interest (lane 5-14) were analysed using SDS-PAGE gel electrophoresis
(B). Protein contaminants were removed using anion exchange chromatography
(lanes 2-12) over an increasing salt concentration (C). For NMR experiments, the
protein was further purified using size exclusion separation. ESI-MS analysis
confirmed that the total molecular weight of his-tagged IL-1β protein was 19.39 kDa
(D).

Chapter 3
74
3.3.3. Removal of LPS from recombinant protein preparations
LPS is a major component of the outer membrane of gram negative bacteria and a
potent stimulator of the TLR4. Contaminating LPS was removed from protein
preparations using a Triton X-114-based two-phase extraction protocol (Aida and
Pabst 1990). It has previously been shown that this method is more effective at
removing LPS from recombinant HMGB1 preparations than polymyxin B
purification (Li et al., 2004). LPS levels in protein preparations were determined
before and after Triton-X114 purification. LPS molecules vary considerably between
different species and strains of bacteria (Erridge et al., 2002) and to account for this
variation the LPS levels are expressed as EU/mg of protein (EU/mg). This is a
standardised measurement that describes the biological activity or potency.
The level of LPS in bacterially expressed recombinant full length HMGB1 was
typically greater than 500 EU/mg (Table 3.3). Considerably less LPS was detected in
the Δ30 (approx. 126 EU/mg) and A box (Approx. 52 EU/mg) preparations. The
LPS content in the B box preparation before LPS removal was not determined but
previous studies have demonstrated that both HMG boxes have a similar affinity for
LPS (Li et al., 2004). Importantly, the LPS content after the Triton X-114
purification in all protein preparations was consistently less than 5 EU/mg.
Recombinant IL-1β protein preparations were also subjected to Triton X-114
extraction and consistently exhibited levels of less than 5 EU/mg after purification.
Table 3.10 Typical LPS content in recombinant protein preparations before and
after Triton X-114 purification (LPS levels are expressed as Endotoxin Units per
mg of protein (EU/mg). 1EU/mg is approximately equal to 100 pg endotoxin)
Construct Typical LPS before (EU/mg) Typical LPS after (EU/mg)
HMGB1 > 500 < 5
Δ30 Approx. 126 < 5
A box Approx. 52 < 5
B box - < 5
IL-1β - < 5

Chapter 3
75
3.3.4. NMR characterisation of recombinant proteins
3.3.4.1. 1D NMR characterisation of full length HMGB1
The full length HMGB1 protein was characterised using 1D NMR analysis. A 1
H
NMR spectrum was collected on a 23 µM unlabelled HMGB1 sample in PBS at pH
7.2 using a 600 MHz Bruker Avance II spectrometer at 25oC (Figure 3.4). Peaks
were detected between 0.5 to 10 ppm and the spectral dispersion is characteristic of a
folded protein (Figure 3.4). As previously described, LPS contaminants were
removed using a Triton-X114 two phase extraction protocol and residual Triton-
X114 impurities were identified in the 1H HMGB1 spectrum.
The 1H spectrum for full length HMGB1 was compared with the
1H spectrum for the
15N-labelled Δ30 and B box proteins. As indicated in Figure 3.5, conserved peaks
were identified in the different spectra and, as expected, all three constructs appear to
express proteins with folded regions, rather than being random coil.

Chapter 3
76
Figure 3.8 1H NMR spectrum for full length HMGB1 The NMR spectrum was
collected on a 23 µM HMGB1 sample on a 600 MHz Bruker spectrometer equipped
with triple resonance cryoprobes at 25oC (298 K) in PBS, pH 7.2. The full
1H
spectrum for HMGB1 is presented with typical 1H chemical shifts highlighted (A).
An expanded section of the amide region is shown in (B) and an expanded section of
the aliphatic region is displayed in (C). For (B) and (C) the spectrum was baseline
corrected using the auto-correct spectra range function between -1–3 ppm and 6-10
ppm to reduce the effect of water suppression.

Chapter 3
77
Figure 3.9 Comparison
of 1H NMR spectra for
full length HMGB1,
Δ30 and B box An
expanded section of the
aliphatic region is
presented for full length
HMGB1 (A), Δ30 (B)
and B box (C). An
example of a conserved
peak is shown (---).
Based on the line-
widths of the peaks all
three domains appear to
contain folded regions.

Chapter 3
78
3.3.4.2. 2D NMR characterisation of Δ30, A box, B box and IL-1β proteins
The HMGB1 constructs were characterised using 2D NMR analysis. 1H-
15N HSQC
spectra were collected for 15
N-labelled LPS-free Δ30, A box and B box proteins in
PBS, pH 7.2 at 25oC. The number of expected peaks for each spectrum was
calculated as follows: number of backbone amides (total number of residues with
proline deducted) plus the number of asparagine and glutamine side-chain amides
(Table 3.4). Under these conditions, 159 peaks were detected on the 1H-
15N HSQC
spectrum for the 15
N-labelled his-tagged Δ30 (Figure 3.6). The peaks were well
dispersed and resolved and the spectrum was indicative of a folded protein.
However, 22% of the expected peaks were missing from the spectrum, probably due
to the fast chemical exchange with the solvent, as expected from the pH used for the
solution.
On the 1H-
15N HSQC spectrum for the reduced
15N-labelled A box 67 out of 84
predicted peaks were detected (Figure 3.7). The peaks were well resolved and the
spectral dispersion indicated that the protein was folded.
On the 1H-
15N HSQC spectrum for the
15N-labelled B box, 69 out of 73 expected
peaks were detected (5% missing) (Figure 3.8). The peaks were well resolved and
dispersed. The spectrum indicated that the protein was folded.
The IL-1β protein was also characterised using 2D NMR analysis. A 1H-
15N HSQC
spectrum was collected on a 25 µM LPS-free 15
N-labelled Il-1β protein in PBS, pH
7.2 at 25oC. The spectral dispersion was indicative of a folded protein and the peaks
were well resolved. In total, 161 peaks were resolved out of an expected 168 (4%
missing).

Chapter 3
79
Table 3.11 Number of peaks detected on the 1H-
15N HSQC spectra for the Δ30,
A box, B box and IL-1β proteins at pH 7.2 NMR spectra were collected in PBS,
pH 7.2. The number of predicted peaks was calculated as follows: No of backbone
amides (total residues with proline deducted) plus Asn and Gln side-chain amides.
Construct Predicted peaks No of resolved peaks % of peaks missing
His-Δ30 204 159 22
A box 84 67 20
B box 73 69 5
IL-1β 168 161 4

Chapter 3
80
Figure 3.10 1H-
15N HSQC
spectrum for 100 µM LPS-
free his-tagged Δ30 at pH
7.2 A 1H-
15N HSQC
spectrum was collected for
100 µM LPS-free 15
N-
labelled his-tagged Δ30
protein in PBS at pH 7.2 at
25oC. The spectrum was
recorded on a 600 MHz
spectrometer using 64 scans
with 160 increments and
with a resolution in the
indirect dimension of 18.24
Hz. Under these conditions
159 peaks were identified
(22% of predicted peaks
were absent). The well
resolved and dispersed
peaks indicate a folded
protein.

Chapter 3
81
Figure 3.11 1H-
15N
HSQC spectrum for
50 µM 15
N-labelled
A box at pH 7.2 The 1H-
15N HSQC
spectrum for 50 µM 15
N-labelled A box
was collected in PBS,
10 mM DTT at pH
7.2. The spectrum
was collected on an
800 MHz
spectrometer using 16
scans and 150
increments with a
resolution in the
indirect dimension of
21.80 Hz. Under
these conditions 67 of
the 84 predicted
peaks were detected
(20% missing). All of
the peaks were well
resolved and
dispersed and the
spectrum is indicative
of a folded protein.

Chapter 3
82
Figure 3.12 1H-
15N HSQC
spectrum for B box The 1H-
15N
HSQC spectrum for 10 µM LPS-
free B box was collected in PBS
at pH 7.2 using a 800 MHz
spectrometer. The spectrum was
recorded at 25oC using 192 scans
with 256 increments and with a
resolution in the indirect
dimension of 15.80 Hz. Under
these conditions 69 out of 73
predicted peaks were detected
(5% missing). All peaks were
well resolved and dispersed and
the spectrum is indicative of a
folded protein.

Chapter 3
83
Figure 3.13 1H-
15N
HSQC spectrum for
25 µM 15
N-labelled
IL-1β at pH 7.2 The 1H-
15N HSQC
spectrum for 25 µM
LPS-free 15
N-labelled
IL-1β protein was
collected in PBS at pH
7.2. The spectrum was
collected on an 600
MHz spectrometer at
25oC using 32 scans
with 160 increments
and with a resolution
in the indirect
dimensional of 21.00
Hz. Under these
conditions 161 of 168
predicted peaks were
detected (4% missing).
All peaks were well
resolved and dispersed
and the spectrum is
indicative of a folded
protein.

Chapter 3
84
3.3.4.3. Characterisation of the 1H-
15N HSQC spectrum for the reduced A box
domain of HMGB1
A partial assignment of the A box domain of HMGB1 was performed using a
combination of 2D and 3D experiments. Spectra were collected on a 350 µM 15
N-
13C-labelled A box sample in 20 mM potassium phosphate, 100 mM potassium
chloride and 10 mM DTT at pH 6.8. In total, it was predicted that there should be 84
peaks observed on the 1H-
15N HSQC spectrum (82 backbone and 2 side-chain
amides). Under these conditions, 70 peaks were detected and 63 residues were
assigned (Figure 3.10).
1H-
15N HSQC spectra were collected on a 100 µM A box sample in 20 mM
potassium phosphate, 100 mM potassium chloride and 10 mM DTT at a pH range of
5.5 to 7.2. Spectra were acquired on an 800 MHz Bruker spectrometer at 25oC using
comparable NMR parameters (8 scans with 150 increments at a resolution in the
indirect dimension of 21.08 Hz).
An overlay of the spectra is presented in Figure 3.11. At pH 5.5 83 of the 84 peaks
were detected. However, up to 20% of the peaks disappeared with increasing pH
conditions (Table 3.5) and as previously noted at pH 7.2 only 67 of the 84 peaks
were detected. It was possible to identify 8 of the 17 residues that are missing from
the spectrum at pH 7.2 using the partial A box assignment as M1, G2, G4, D5, S35,
V36, A54 and K55. As shown in Figure 3.12, these residues are surface exposed and
are dispersed across the molecule.
Table 3.12 Percentage of peaks missing from the A box 1H-
15N HSQC spectra at
pH 5.5-7.2 NMR spectra were collected on a 100 µM A box sample in 20 mM
potassium phosphate, 100 mM potassium chloride and 10 mM DTT at pH 5.5 – 7.2.
Expected peaks were calculated as follows: number of backbone amides (total
number of residues with proline deducted) plus the number of asparagine and
glutamine side-chain amides. 84 peaks were expected for the A box.
pH No of peaks % of peaks missing
5.5 83 1
6.0 78 7
6.5 75 11
6.8 70 17
7.2 67 20

Chapter 3
85
Figure 3.14 Chemical Shift Index (CSI) for A box assignment The A box domain (residues 1 -85) was assigned using sequential assignment.
A change from the random coil chemical shift provides information on the structural identify of each amino acid residue. Based on the partial
assignment, the majority of the secondary structure is alpha helical. (Black = assigned residues, Blue = residue not assigned).

Chapter 3
86
Figure 3.15 1H-
15N HSQC
spectra for reduced A
box at pH 5.5 to 7.2
Spectra were collected on a
100 µM A box sample in
20 mM potassium
phosphate, 100 mM
potassium chloride and 10
mM DTT on a 800 MHz
spectrometer at 25oC using
comparable NMR
acquisition parameters.
Spectra were recorded at
pH 5.5 (black), 6.0 (pink),
6.5 (blue), 6.8 (green) and
7.2 (red). For clarity an
expanded section of the
amine region is presented.
No significant chemical
shift perturbations were
observed from some
residues (S17). Some
residues were not detected
at every pH (S37). Some
residues exhibited
significant chemical
perturbations at every pH
point (*).

Chapter 3
87
Figure 3.16 3D structure of A box highlighting the residues that disappear from
the 1H-
15N HSQC spectrum at pH 7.2 At pH 7.2 20% of the predicted peaks are
missing from the 1H-
15N HSQC spectrum for
15N-labelled A box. A partial backbone
assignment of the A box domain has identified 8 (M1, G2, G4, D5, S35, V36, A54
and K55) of these residues and these are highlighted on the 3D structure of A box.
The V36 residue is not visible at this angle. Image was produced in PyMOL
(PyMoL) using PDB entry 2YRQ.

Chapter 3
88
3.3.4.4. NMR characterisation of the reduced and un-treated A box domain
1H-
15N HSQC spectra were recorded for the reduced and un-treated A box domain.
NMR spectra were recorded on an 800 MHz spectrometer at 25oC in 20 mM
potassium phosphate and 100 mM potassium chloride at pH 6.8. Spectra were
collected in the absence and presence of 10 mM DTT using identical acquisition
parameters; 16 scans with 150 increments and with a resolution in the indirect
dimension of 21.08 Hz. As can be seen in Figure 3.13, the spectra for reduced and
non-reduced A box differ considerably with significant chemical shift perturbations
observed in the majority of peaks following the addition of 10 mM DTT. The
formation of a di-sulphide bond between the C23 and C45 residues has been
previously reported and is critical for TLR4 receptor binding (Yang et al., 2010;
Yang et al., 2011). Using the partial A box assignment it was possible to identify
these two residues in the reduced A box spectra (Figure 3.13).

Chapter 3
89
Figure 3.17 1H-
15N
HSQC spectra for
reduced and non-treated
A box Spectra were
recorded for a 50 μM A
box sample in PBS, pH
7.2, with (black) and
without (red) 10 mM
DTT. Samples were
analysed on a Bruker
Avance II 800 MHz
spectrometer at 25oC (298
K) using identical NMR
parameters: 16 scans with
150 increments with a
resolution in the indirect
dimension of 21.08 Hz.
Following the addition of
DTT significant chemical
shift perturbations were
observed for some
residues (For example,
K52 & F62), while no or
minor perturbations were
observed for some
residues (S17 & K5). The
C23 and C45 in reduced
A box are also indicated.
Chapter 3
90
3.3.4.5. Investigating the effect of LPS removal on the NMR spectra for Δ30, A
box and B box
As discussed previously, LPS contaminants were successfully removed using Triton-
X114 purification (Section 3.3.3). To ensure that this process did not alter the NMR
spectra, 1H-
15N HSQC spectra were collected for
15N-labelled HMGB1 proteins
before and after LPS removal. Overlays of the spectra for 15
N-labelled Δ30, A box
and B box are presented in Figure 3.14, Figure 3.15 and Figure 3.16, respectively.
Prior to purification, the levels of LPS in the Δ30 and A box proteins were
approximately 126 EU/mg and 52 EU/mg. The LPS content after the Triton-X114
purification in all protein preparations was consistently less than 5 EU/mg. No
significant chemical shift perturbations were detected for any of the proteins
following LPS removal although some minor perturbations were observed in the 1H-
15N HSQC spectra for the B box (Figure 3.16).

Chapter 3
91
Figure 3.18 Effect of LPS
removal on the Δ30 1H-
15N
HSQC spectra A 1H-
15N
HSQC spectrum was
collected on a 40 µM 15
N-
labelled his-tagged Δ30
sample before the sample was
subjected to Triton-X114
purification to remove
contaminating LPS (Black).
A 1H-
15N HSQC spectrum
was collected on a 100 µM 15
N-labelled his-tagged Δ30
sample after (red)
purification. The spectra were
collected in PBS at pH 7.2 on
an 600 MHz spectrometer
using 64 scans with 160
increments and with a
resolution in the indirect
dimension of 18.24 Hz. The
LPS level was approximately
126 EU/mL before LPS
removal and < 3 EU/mL after
removal. No significant
chemical shift perturbations
were detected.

Chapter 3
92
Figure 3.19 Effect of LPS
removal on the A box 1H-
15N HSQC spectra
1H-
15N
HSQC spectra were
collected on a 50 μM A box
sample in PBS with 10 mM
DTT, pH 7.2 at 25oC (298
K) on a Bruker Avance II
800 MHz spectrometer using
identical acquisition
parameters (NS = 16,
increments = 150 and 15
N
resolution = 21.08). HSQC
spectra were collected before
(black) and after (red) the
sample was subjected to a
specific LPS removal step
using a Triton-X114 based
two phase extraction
protocol. The LPS content in
the sample was > 50 EU/mL
before LPS removal and < 3
EU/mL after removal. No
significant chemical shift
perturbations were detected.

Chapter 3
93
Figure 3.20 Effect of
LPS removal on the B
box 1H-
15N HSQC
spectra 1H-
15N HSQC
spectra were collected
on a 10 μM B box
sample in PBS, pH 7.2
at 25oC (298 K) on a
Bruker Avance II 800
MHz spectrometer
using identical NMR
parameters (NS = 192,
increments = 256 and 15
N resolution = 15.80).
Spectra were collected
before (black) and after
(red) the sample was
subjected to a specific
LPS removal step using
a Triton-X114 based
two phase extraction
protocol. Some minor
chemical shift
perturbations were
observed.

Chapter 3
94
3.3.5. Analysis of the cytokine-inducing activity of the recombinant HMGB1
proteins
The cytokine-inducing activity of the recombinant HMGB1 proteins was assessed in
PBMCs isolated from a healthy volunteer. Un-induced cells or cells treated with PBS
(vehicle control) had minimal IL-6 release. 10 µg/mL recombinant HMGB1, Δ30, A
box or B box also failed to induce IL-6 production in the PBMCS with low or un-
detectable IL-6 levels recorded (< 154 pg/mL). However, the positive control, a
recombinant HMGB1 with known cytokine-inducing activity, (supplied by Peter
Lundbäck, Karolinska Institute, Stockholm, Sweden) induced IL-6 levels of 27,612 ±
836 pg/mL.
Figure 3.21 Induction of IL-6 release in PBMCs by bacterially expressed
rHMGB1 constructs Cells were isolated from a healthy volunteer and treated with
PBS (Vehicle control), HMGB1, Δ30, A box or B box at a final concentration of 10
µg/mL. Cell supernatants were collected after 16 h and IL-6 levels were quantified
by ELISA. Recombinant HMGB1 with known cytokine-inducing activity was used
as a positive control (n = 1 experiment performed in triplicate wells). +VE control =
recombinant HMGB1 with known cytokine-inducing activity.

Chapter 3
95
3.3.6. LC-ESI-MS/MS characterisation of the redox state of the C23, C45
and C106 residues in full length HMGB1
Recent evidence has shown that the redox status of the three cysteine residues (23,
45 and 106) in HMGB1 is critical for the interaction with the TLR4 (Yang et al.,
2010; Yang et al., 2011). The redox status of the three residues was determined using
LC-ESI- MS/MS analysis. Reduced cysteine residues within his-tagged HMGB1
were initially capped using iodoacetamide. The alkylation with iodoacetamide
generates a carboxyamidomethyl adduct resulting in a mass shift of 57 amu (atomic
mass units). Next, the protein was incubated with 1 mM DTT and newly reduced
cysteine residues were capped using NEM. The alkylation with NEM yields a mass
shift of 125 amu. The protein was digested using Glu-C and peptides were analysed
using LC-ESI-MS/MS analysis. A thiol-capped NEM adduct was detected in the
peptide containing residues 2-26 (Figure 3.18A). This corresponded to the C23
residue. The same adduct was detected in a second peptide which contained residues
17-26 (Figure 3.18B). A thiol-capped NEM adduct, corresponding to the C45
residue, was detected in the peptide containing amino acids 41-47 (Figure 3.18C).
Furthermore, in a peptide comprising residues 103-108 a thiol-capped NEM adduct
was detected that corresponded to the C106 residue. Collectively, these results show
that all three cysteine residues were oxidised in the E.coli expressed his-tagged
HMGB1 protein, prior to the addition of DTT.

Chapter 3
96
Figure 3.22 Mass spectrometric identification of C23, C45 and C106 redox state LC-MS/MS spectra of Glu-C-derived peptides confirming that the C23 (A and B),
C45 (C) and C106 (D) residues in his-tagged HMGB1 are all oxidised.

Chapter 3
97
3.4. DISCUSSION
For the purpose of this work, human HMGB1 and three HMGB1 domains were
expressed in E.coli BL21 (DE3) cells. Approximately 0.75-1 mg of full length
human HMGB1 protein was obtained from 1 L of LB medium. Expression of
recombinant HMGB1 in bacterial cells has been previously associated with low
protein yields (Bianchi 1991; Lee et al., 1998; Li et al., 2003). This has been partially
attributed to the toxicity of the 30-residue C-terminal polyacidic tail, which is
composed entirely of repeating aspartic and glutamic acid residues. Additionally, it
has been reported previously that the HMGB1 protein may be toxic to the E.coli
cells and may interact with the bacterial DNA (Bianchi 1991). Degradation of
HMGB1 by bacterial cells has been previously reported (Bianchi 1991) and a C-
terminal truncated HMGB1 protein was also over expressed in the BL21 (DE3) cell
cultures (Figure 3.2). Li et al demonstrated that both full length and truncated
HMGB1 can induce comparable TNF-release in mouse macrophages (Li et al.,
2003). Three recombinant HMGB1 mutants, Δ30, A box and B box, were also
generated for use in the cellular assays and NMR characterisation. In comparison to
the full length protein, the yields of protein obtained for the HMBG1 domains and
truncated mutant were considerably higher (Table 3.2). Typically 3-5 mg of Δ30 and
8-10 mg of the A and B box proteins was obtained for 1 L of LB medium. All of the
proteins were visualised as a single band on a SDS-PAGE gel.
Efficient removal of LPS contaminants from recombinant protein preparations was
of critical importance as contaminating LPS can activate TLR4 and induce a similar
biological response to HMGB1 (Hoshino et al., 1999). Until recently, it was believed
that the Heat Shock Protein (HSP) 60 and HSP70 induced TNF secretion and APC
activation via the TLR4. However, it has now been demonstrated that these effects
were in fact a direct result of low amounts of endotoxin contamination (Bausinger et
al., 2002; Gao and Tsan 2003; Gao and Tsan 2003). In comparison to other proteins,
HMGB1 is reported to have a high affinity for LPS, binding to both the
polysaccharide and lipid-A moieties (Youn et al., 2011). Additionally, HMGB1 and
LPS have been demonstrated to act synergistically to enhance cytokine production in
SFs and it is proposed that this effect is mediated via the formation of a highly active
pro-inflammatory complex (Hreggvidsdottir et al., 2009; Wähämaa et al., 2011).
Consequently, in agreement with previous findings bacterially expressed HMGB1

Chapter 3
98
had high levels of contaminating LPS (<500 EU/mL) (Bianchi 1991). In comparison,
the HMGB1 mutants had considerably less LPS contamination. This suggests that
the C-terminal tail of HMGB1 is involved in the interaction and that the HMGB1
mutants have a reduced affinity for LPS (Table 3.2). LPS contaminants were
successfully removed using a two-phase Triton-X114 extraction protocol which
consistently reduced LPS levels to less than 3 EU/mg of protein.
The work presented in this chapter also describes the NMR characterisation of the
recombinant HMGB1 and IL-1β proteins. Uniformly 15
N and/or 13
C -labelled
proteins were expressed and purified in minimal media with final yields of
approximately half of that obtained from LB media (Table 3.2). 1H-
15N HSQC
spectra were collected for the 15
N-labelled Δ30, A box, B box and IL-1β proteins.
All of the peaks were well resolved and the spectral dispersions were indicative of
folded proteins. However, up to 22% of the predicted peaks were missing from the
spectrum at pH 7.2 (Table 3.4) due to chemical exchange of the amide protons with
water. The removal of contaminating LPS did not alter the Δ30, A box and B box
NMR spectra and no significant chemical shift perturbations were observed
following Triton-X114 purification (Figure 3.14, Figure 3.15 and Figure 3.16).
Further NMR characterisation was performed for the A box domain and a partial
assignment of the 1H-
15N HSQC spectrum was undertaken. A pH titration was
conducted and NMR spectra were collected at pH 5.5 to 7.2. A total of 84 peaks
were expected on the 1H-
15N HSQC spectrum and at pH 5.5 only 1% of the peaks
were undetectable. In comparison, at pH 7.2 20% of the peaks were missing from the
spectrum (Figure 3.11 and Table 3.5). These residues were dispersed across the
protein and did not cluster to a specific region. Future NMR spectra were collected at
pH 7.2 as this is more physiologically relevant. Additionally, Li et al have
previously reported that at pH 6.0 the cytokine-inducing activity of HMGB1 is
inhibited (Li et al., 2004).
Previous studies have reported conflicting results on the intrinsic pro-inflammatory
activity of HMGB1 (Andersson et al., 2000; Rouhiainen et al., 2007; Sha et al.,
2008). Recently, Yang et al have demonstrated that the redox status of the C23, C45
and C106 residues is critical for the functional activity of the protein. The pro-
inflammatory molecular form requires a C23-C45 disulphide bond and a reduced
Chapter 3
99
C106 residue, with other forms of HMGB1 unable to induce cytokine-production
(Yang et al., 2011). LC-ESI-MS/MS characterisation of the bacterially expressed
recombinant his-tagged HMGB1 protein identified that the C23, C45 and C106
residues were all oxidised (Figure 3.18). However, it was not possible to deduce the
specific cysteine modification using this method. HMGB1 expressed in BL21 (DE3)
cells is unlikely to contain any post-translational modifications and it can be
assumed that the oxidation occurred during the purification procedure.
Consequently, the recombinant HMGB1 proteins did not induce IL-6 cytokine
production in PBMCs (Figure 3.17). However, evidence within the literature also
supports the hypothesis that HMGB1 acts synergistically with endogenous and
exogenous molecules to initiate and amplify the inflammatory response and
emerging evidence suggests that this mechanism may be independent of the
oxidation state (Wähämaa et al., 2011; Leclerc et al., 2013). The synergistic potential
of the recombinant HMGB1 has not been examined within this chapter but will be
the focus of future experiments.
In conclusion, this chapter describes the successful optimisation of methods to
express, purify and characterise recombinant HMGB1, Δ30, A box, B box and IL-1β
proteins in E.coli. The recombinant proteins contain minimal endotoxin
contamination (< 5 EU/mg of protein) and the NMR characterisation has indicated
that they are well folded. However, the recombinant HMGB1 proteins did not induce
IL-6 cytokine production in PBMCs and this requires further investigation. Previous
studies have suggested that HMGB1 and IL-1β act synergistically to promote
inflammation. It is proposed that this response is mediated by the formation of a
highly active pro-inflammatory complex in which HMGB1 and IL-1β directly
interact. However, the molecular interaction between the two proteins requires
further investigation; the folded, purified and LPS-free proteins generated in this
chapter will be used to elucidate the cellular and biophysical interaction between
HMGB1 and IL-1β.

CHAPTER FOUR
IN VITRO CHARACTERISATION OF THE INTERACTION BETWEEN
HMGB1 AND IL-1β

Chapter 4
101
TABLE OF CONTENTS
4.1 INTRODUCTION ...................................................................................... 102
4.2 MATERIALS AND METHODS ............................................................... 104
4.3 RESULTS ................................................................................................... 105
4.3.1 HMGB1 and IL-1β act in synergy to increase pro-inflammatory cytokine
levels in SFs ......................................................................................... 105
4.3.2 HMGB1 enhances the cytokine-stimulating activity of IL-1β in a dose-
dependent manner ................................................................................ 110
4.3.3 Investigating the kinetics of the synergistic interaction between HMGB1
and IL-1β ............................................................................................. 112
4.3.4 The Δ30 and B box proteins act in synergy with IL-1β to increase IL-6
secretion from SFs but the A box does not interact with IL-1β ............. 114
4.3.5 The synergistic activity of HMGB1, Δ30 or the B box with IL-1β is
mediated via the IL-1 receptor.............................................................. 116
4.3.6 HMGB1/IL-1β synergy can be inhibited using sub-optimal concentrations
of LPS.................................................................................................. 118
4.4 DISCUSSION ............................................................................................. 120

Chapter 4
102
4.1. INTRODUCTION
In 1999, Wang and colleagues identified HMGB1 as a late cytokine mediator of
lethal endotoxemia (Wang et al., 1999). Subsequent studies have demonstrated that
HMGB1 has a board range of immunological activities. Extracellular HMGB1
promotes inflammation and tissue regeneration by mediating the production of
multiple cytokine mediators from macrophages and monocytes, chemotaxis,
angiogenesis, cell proliferation and autophagy (Andersson et al., 2000; Orlova et al.,
2007; Tang et al., 2010; Andersson and Tracey 2011).
As discussed in Section 1.8.5, human monocytes exposed to recombinant HMGB1
secrete multiple cytokine mediators including TNFα, IL-1α, IL-1β, IL-1RA, IL-6,
IL-8 and the MIP (Andersson et al., 2000). It has been proposed that HMGB1
induced cytokine production is mediated via the formation of highly active pro-
inflammatory complexes with both endogenous and exogenous molecules (Figure
1.10) (Ivanov et al., 2007; Tian et al., 2007; Sha et al., 2008; Urbonaviciute et al.,
2008; Youn et al., 2008; Hreggvidsdottir et al., 2009; Schiraldi et al., 2012).
Specifically, HMGB1 has been shown to act in synergy with IL-1β and LPS to
enhance NF-κB-mediated cytokine production (Hreggvidsdottir et al., 2009; Garcia-
Arnandis et al., 2010; Wähämaa et al., 2011).
The synergistic effect of HMGB1 with IL-1β is of particular interest since both
molecules are regarded as classical cytokine mediators that activate related
intracellular signalling pathways to mediate a similar range of biological responses.
Moreover, the HMGB1 and IL-1β proteins often co-exist at the site of injury or
infection, with both danger signals secreted by activated immune cells in response to
hepatocyte cell stress or damage.
HMGB1 and IL-1β synergy is not well defined and the molecular mechanism
mediating the synergistic response is unknown. In 2008, Sha and colleagues reported
that FLAG-tagged HMGB1 expressed in the presence of IL-1β has enhanced pro-
inflammatory activity compared to HMGB1 alone. In this study, macrophage and
neutrophil cells treated with HMGB1, expressed in the presence of IL-1β, had
enhanced pro-inflammatory cytokine production (Sha et al., 2008). Subsequent
studies confirmed this finding with HMGB1 and IL-1β also shown to act
synergistically on SFs isolated from RA and osteoarthritis (OA) patients

Chapter 4
103
(Hreggvidsdottir et al., 2009; Garcia-Arnandis et al., 2010; Wähämaa et al., 2011).
To date, it has been reported that HMGB1 and IL-1β act synergistically to enhance
the production of multiple inflammatory mediators including IL-6, IL-8, TNF and
MIP (Sha et al., 2008; Hreggvidsdottir et al., 2009; Garcia-Arnandis et al., 2010;
Wähämaa et al., 2011). These mediators contribute to the immune response with IL-
6, in particular, known to have multiple biological activities that promote hepatic
acute phase inflammatory responses and tissue regeneration.
Although HMGB1 and IL-1β have been shown to act synergistically, there are no
detailed studies investigating the effects of this interaction within the current
literature. Therefore, the overall aim of this chapter was to characterise the cellular
response to HMGB1 and IL-1β synergy. This was investigated by addressing the
following points:
1. Accessing the synergistic activity of bacterially expressed recombinant
HMGB1 and IL-1β proteins.
2. Investigating the dynamics of the synergistic interaction. Specifically,
determining the minimal incubation time and optimal conditions required to
enhance the inflammatory response
3. Investigating the kinetics of the synergy; do different ratios of HMGB1/ IL-
1β show similar synergistic responses?
4. Identifying which domain(s) of HMGB1 mediates the synergistic activity
with IL-1β. This was achieved by investigating whether the three HMGB1
mutants (Δ30, A box and B box proteins) act synergistically with IL-1β.
5. Confirming that HMGB1/IL-1β synergy is mediated by the IL-1R
6. Determining if LPS inhibits the synergistic interaction with IL-1β

Chapter 4
104
4.2. MATERIALS AND METHODS
LPS-free recombinant HMGB1 (Full length, Δ30, A box and B box) and IL-1β
proteins were expressed and purified from E.coli as described in Chapter 2, Sections
2.2 and 2.3. Proteins were characterised as detailed in Chapter 3. The LPS content in
all proteins was <5 EU per mg of protein.
SFs were used as a model cell system to investigate HMGB1-IL-1β synergy. Cells
were cultured from synovial tissue isolated from arthritic patients undergoing joint
replacement surgery at the Karolinska Institute, Stockholm, Sweden, as described in
Chapter 2, Section 2.4. Cell experiments were performed as described in Chapter 2,
Sections 2.4.2 to 2.4.7. IL-6 cytokine levels were quantified by ELISA (Chapter 2,
Section 2.4.8). All results are expressed as absolute IL-6 content ± SD, with the
exception of Figure 4.2 where data are expressed as mean IL-6 content ± SEM. Data
were analysed as described in Chapter 2, Section 2.4.9.
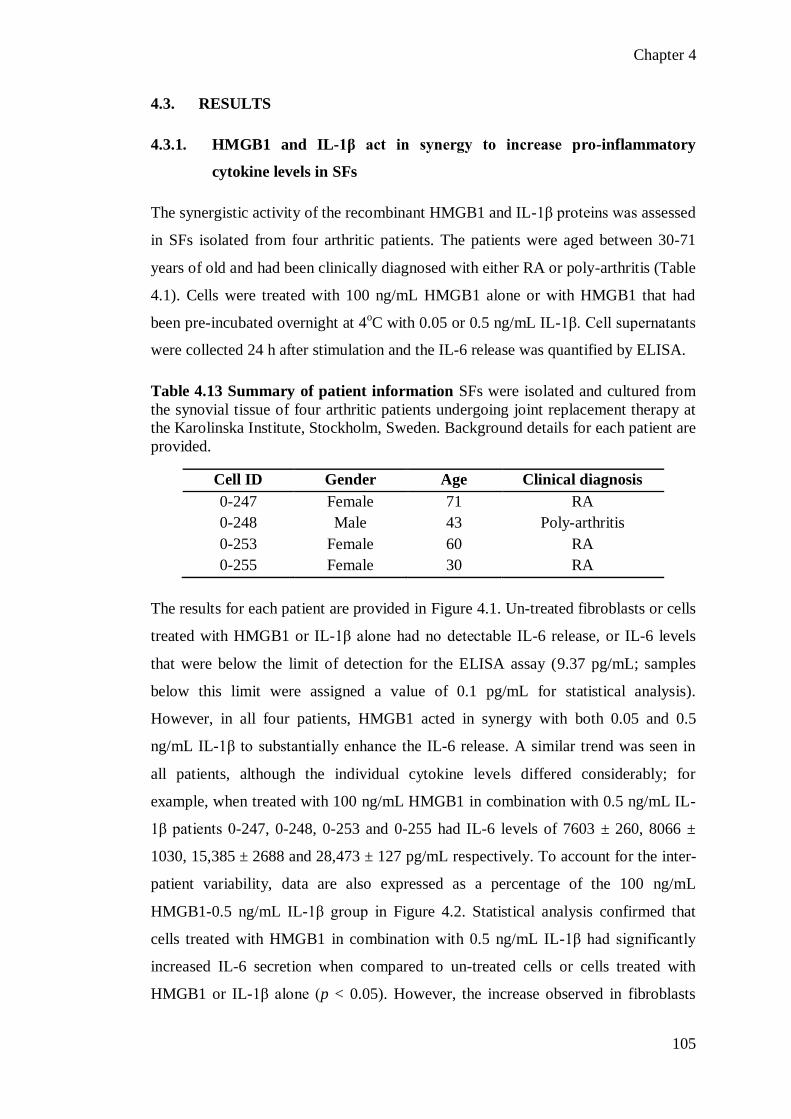
Chapter 4
105
4.3. RESULTS
4.3.1. HMGB1 and IL-1β act in synergy to increase pro-inflammatory
cytokine levels in SFs
The synergistic activity of the recombinant HMGB1 and IL-1β proteins was assessed
in SFs isolated from four arthritic patients. The patients were aged between 30-71
years of old and had been clinically diagnosed with either RA or poly-arthritis (Table
4.1). Cells were treated with 100 ng/mL HMGB1 alone or with HMGB1 that had
been pre-incubated overnight at 4oC with 0.05 or 0.5 ng/mL IL-1β. Cell supernatants
were collected 24 h after stimulation and the IL-6 release was quantified by ELISA.
Table 4.13 Summary of patient information SFs were isolated and cultured from
the synovial tissue of four arthritic patients undergoing joint replacement therapy at
the Karolinska Institute, Stockholm, Sweden. Background details for each patient are
provided.
Cell ID Gender Age Clinical diagnosis
0-247 Female 71 RA
0-248 Male 43 Poly-arthritis
0-253 Female 60 RA
0-255 Female 30 RA
The results for each patient are provided in Figure 4.1. Un-treated fibroblasts or cells
treated with HMGB1 or IL-1β alone had no detectable IL-6 release, or IL-6 levels
that were below the limit of detection for the ELISA assay (9.37 pg/mL; samples
below this limit were assigned a value of 0.1 pg/mL for statistical analysis).
However, in all four patients, HMGB1 acted in synergy with both 0.05 and 0.5
ng/mL IL-1β to substantially enhance the IL-6 release. A similar trend was seen in
all patients, although the individual cytokine levels differed considerably; for
example, when treated with 100 ng/mL HMGB1 in combination with 0.5 ng/mL IL-
1β patients 0-247, 0-248, 0-253 and 0-255 had IL-6 levels of 7603 ± 260, 8066 ±
1030, 15,385 ± 2688 and 28,473 ± 127 pg/mL respectively. To account for the inter-
patient variability, data are also expressed as a percentage of the 100 ng/mL
HMGB1-0.5 ng/mL IL-1β group in Figure 4.2. Statistical analysis confirmed that
cells treated with HMGB1 in combination with 0.5 ng/mL IL-1β had significantly
increased IL-6 secretion when compared to un-treated cells or cells treated with
HMGB1 or IL-1β alone (p < 0.05). However, the increase observed in fibroblasts

Chapter 4
106
treated with HMGB1 and 0.05 ng/mL IL-1β was not found to be statistically
significant from the control cells. Additionally, the synergistic activity of HMGB1
with 15
N-labelled-IL-1β was tested and the results were found to be consistent with
the data obtained for the un-labelled proteins (Figure 4.25).

Chapter 4
107
Figure 4.23 HMGB1 and IL-
1β act synergistically to
enhance the inflammatory
response in SFs: Individual
patient data SFs were isolated
from four arthritic patients and
treated with HMGB1 alone or
HMGB1 in combination with
IL-1β for 24 h. IL-6 cytokine
levels were quantified by
ELISA. A), B), C) & D) show
data for patients 0-247, 0-248,
0-253 and 0-255 respectively.
Untreated fibroblasts or cells
treated with HMGB1 or IL-1β
alone had minimal or no
detectable IL-6 release (<9.37
pg/mL; SD values < 7.00
pg/mL). However, treatment
with 100 ng/mL HMGB1 that
was pre-incubated with 0.5
ng/mL IL-1β enhanced the IL-6
cytokine levels. n = 1
experiment/patient performed
in triplicate wells; data are
expressed as absolute IL-6 level
± SD.

Chapter 4
108
Figure 4.24 HMGB1 and IL-1β act synergistically to enhance the inflammatory
response in SFs; combined patient data SFs were isolated from four arthritic
patients and treated with 100 ng/mL HMGB1 alone or in combination with IL-1β for
24 h. IL-6 cytokine levels were quantified by ELISA. Un-treated, IL-1β- and
HMGB1-treated cells had no detectable IL-6 release (IL-6 levels were below the
limit of detection (9.37 pg/mL) and were assigned a value of 0.1 pg/mL for statistical
analysis; SEM values for these groups were <0.1%). To account for inter-patient
variability, data are expressed as a % of the HMGB1/0.5 ng/mL IL-1β group ± SEM.
Data were analysed for statistical significance using a Kruskal Wallis one-way
ANOVA on ranks test. Cells treated with HMGB1 in combination with IL-1β had
significantly increased IL-6 levels (p <0.05). n = four experiments performed in
triplicate wells.

Chapter 4
109
Figure 4.25 HMGB1 acts in synergy with 15
N-labelled IL-1β to enhance the IL-6
release from SFs SFs were isolated from two RA patients (0-247 and 0-248) and
treated with 100 ng/mL HMGB1 or 0.05/0.5 ng/mL IL-1β alone or following 16 h
co-incubation. Un-treated, IL-1β- and HMGB1-treated cells had no detectable IL-6
release (IL-6 levels were below the limit of detection (9.37 pg/mL) and were
assigned a value of 0.1 pg/mL for statistical analysis; SD values for these groups =
0). n = two experiments performed in triplicate wells. Data are expressed as IL-6
level ± SD.

Chapter 4
110
4.3.2. HMGB1 enhances the cytokine-stimulating activity of IL-1β in a dose-
dependent manner
Previous studies reporting the synergistic interaction between HMGB1 and IL-1β
have utilised an excess of the HMGB1 protein in comparison to IL-1β and in the
previous expeirment the final molar ratio of HMGB1:IL-1β in the cells was 137:1 or
1370:1, respectively. The aim of this experiment was to determine if HMGB1
enhances the activity of the IL-1β protein in a dose-dependent manner and to
investigate whether the synergistic interaction is still relevant at lower molar ratios.
SFs, isolated from two RA patients (0-253 and 0-255), were treated with increasing
concentrations of HMGB1 (0-100 ng/mL) that had been pre-incubated with 0.5
ng/mL IL-1β for 16 h at 4oC. This provided a molar ratio range of from 4:1 to 137:1
(HMGB1: IL-1β). Cells were stimulated for 24 h and the IL-6 content was quantified
by ELISA. As previously observed, un-treated cells or cells treated with the
recombinant proteins alone had minimal or un-detectable IL-6 levels (Figure 4.4).
Additionally, fibroblasts treated with 3.25-25 ng/mL HMGB1 together with 0. 5
ng/mL IL-1β (4:1 to 34:1; HMGB1: IL-1β) had low IL-6 cytokine levels (<12
pg/mL). In contrast, cells from both patients had increased IL-6 levels when treated
with 50 or 100 ng/mL HMGB1 in combination with I-1β. However, the relationship
between the molar ratio used and the IL-6 release did not appear to be linear; for
example, 100 ng/mL HMGB1 with 0.5 ng/mL IL-1β resulted in IL-6 levels of
10,332 ± 6.25 and 12,983 ± 9.90 pg/mL in patients 0-253 and 0-255, respectively. In
contrast, treatment with 50 ng/mL HMGB1/ 0.5 ng/mL IL-1β induced IL-6 levels of
178 ± 0.20 and 145 ± 0.05 pg/mL in patients 0-253 and 0-255, respectively.

Chapter 4
111
Figure 4.26 The effect of HMGB1 concentration on the synergistic interaction
with IL-1β SFs isolated from two RA patients (0-253 and 0-255) were treated with
increasing concentrations of HMGB1 (0-100 ng/mL) in complex with 0.5 ng/mL IL-
1β. No detectable IL-6 secretion was detected in cells treated with IL-1β alone.
However, treatment with IL-1β in combination with HMGB1 increased IL-6 levels
considerably in a dose-dependent manner. n = 1 experiment per patient, performed in
triplicate wells. Data are expressed as IL-6 value ± SD with all SD values < 10
pg/mL.

Chapter 4
112
4.3.3. Investigating the kinetics of the synergistic interaction between
HMGB1 and IL-1β
It has been previously reported that pre-incubation of HMGB1 and IL-1β for 16 h at
4oC is an important prerequisite for the synergistic interaction (Hreggvidsdottir et al.,
2009; Wähämaa et al., 2011). However, Garcia-Arnandis et al (2010) reported that
simultaneous protein addition also results in enhanced cytokine production.
Therefore, the aim of this experiment was to determine if pre-incubation of HMGB1
and IL-1β is necessary for the cellular response and if so, to identify the minimal
incubation time required.
SFs from two patients (0-253 and 0-255) were stimulated with HMGB1 that had
been pre-incubated with IL-1β for 0-24 h prior to cell stimulation. To determine the
physiological relevance of the interaction, the proteins were incubated at 4oC, room
temperature and 37oC. Cell supernatants were collected after 24 h and the IL-6
release was quantified by ELISA. As can be seen in Figure 4.27, pre-incubation of
HMGB1 and IL-1β is not required for the synergistic response and the IL-6
induction was not dependent upon the incubation time. Additionally, in this
experiment simultaneous addition of HMGB1 and IL-1β induced an enhanced
cellular response resulting in IL-6 levels of 2,796 ± 2.17 pg/mL and 2,785 ± 1.56
pg/mL, in patients 0-253 and 0-255, respectively.

Chapter 4
113
Figure 4.27 The effect of pre-incubation on the synergistic interaction between
HMGB1 and IL-1β SFs from two patients (0-253 (A) and 0-255 (B)) were
stimulated with 100 ng/mL HMGB1 that had been pre-incubated with 0.5 ng/mL IL-
1β for 0-24 h at 4oC, room temperature or 37
oC. Cells were stimulated for 24 h,
supernatants were collected and the extracellular IL-6 release was quantified by
ELISA. Data are expressed as absolute IL-6 value ± SD. n = 1 experiment performed
in triplicate wells. All SD values were < 13 pg/mL. Note: Proteins were incubated as
a 50 x stock solution (5 µg/mL HMGB1 and 25 ng/mL IL-1β) and diluted in
OPTIMEM immediately prior to dosing.

Chapter 4
114
4.3.4. The Δ30 and B box proteins act in synergy with IL-1β to increase IL-6
secretion from SFs but the A box does not interact with IL-1β
To determine which domain of HMGB1 is critical for the synergistic activity
observed between HMGB1 and IL-1β, SFs from two RA patients (0-253 and 0-255)
were treated for 24 h with four different HMGB1 constructs – full length HMGB1,
Δ30, A box or B box - in combination with either 0.05 or 0.5 ng/mL IL-1β. Different
concentrations of the four constructs were used (100 ng/mL HMGB1, 86 ng/mL
Δ30, 40 ng/mL A box and 35 ng/mL B box) to maintain the same molar ratio across
all of the treatment groups (1 IL-1β: 137 HMGB1 or 1 IL-1β: 1370 HMGB1).
As previously observed, no detectable IL-6 secretion was seen in the supernatants
obtained from untreated cells. Additionally, all of the recombinant proteins –
HMGB1, Δ30, A box, B box and IL-1β – failed to elicit a cellular response alone.
However, full length HMGB1, Δ30 and the B box all acted in synergy with IL-1β to
noticeably enhance cytokine production in both patients. In SFs isolated from patient
0-255 treatment with HMGB1, Δ30 or the B box in combination with 0.5 ng/mL IL-
1β resulted in IL-6 cytokine levels of 28,473 ± 127 pg/mL, 18,491 ± 2388 pg/mL
and 18,710 ± 2792 pg/mL, respectively. A similar response was observed with cells
isolated from patient 0-253 although to a lesser extent.
Interestingly, the A box did not act synergistically with either concentration of IL-1β
and in both patients, treatment with 35 ng/mL A box in combination with 0.5 or 0.05
ng/mL IL-1β failed to induce detectable IL-6 production. This data would suggest
that whilst the B box is critical for the interaction between HMGB1 and IL-1β, the A
box does not contribute to the synergistic activity.

Chapter 4
115
Figure 4.28 HMGB1, Δ30 and B box act in synergy with IL-1β to enhance
cytokine production in SFs but the A box does not. SFs were treated with
HMGB1, Δ30, A box or B box in combination with 0.5 or 0.05 ng/mL IL-1β for 24 h
and IL-6 levels were analysed by ELISA (Note: Different concentrations of the
HMGB1 constructs were used to maintain the same molar ratio). The HMGB1, Δ30
and B box constructs acted in synergy with IL-1β to increase IL-6 secretion in both
patients (Black = Patient 0-253 and red = Patient 0-255) but the A box did not,
indicating that the interaction between HMGB1 and IL-1β is specific to the B box
domain. Data are expressed as IL-6 value ± SD. n = two experiments, performed in
triplicate wells.

Chapter 4
116
4.3.5. The synergistic activity of HMGB1, Δ30 or the B box with IL-1β is
mediated via the IL-1 receptor
To determine if the synergy between HMGB1 and IL-1β is mediated by the IL-1R,
the previous experiment (described in Section 4.3.4) was repeated in the presence of
anakinra (Kineret®, a synthetic IL-1RA). SFs from patients 0-253 and 0-255 were
pre-treated with 5 μg/mL anakinra for 1-2 h prior to cell stimulation. As previously
observed, in the absence of anakinra, full length HMGB1, Δ30 and the B box all
acted in synergy with IL-1β to promote an increase in IL-6 levels. However, pre-
treatment with anakinra inhibited the synergistic effect and resulted in minimal or
un-detectable cytokine levels (Figure 4.7).
Additionally, cells from patient 0-253 were pre-treated for 1-2 h with detoxified
LPS, a TLR4 antagonist, and stimulated with 100 ng/mL HMGB1 pre-incubated
with 0.5 ng/mL IL-1β. Detoxified LPS did not inhibit the enhanced cytokine release
induced by HMGB1/IL-1β and in the absence and presence of detoxified LPS, SFs
had IL-6 levels of 10,332 ± 6.25 and 10,498 ± 1.40 pg/mL, respectively.
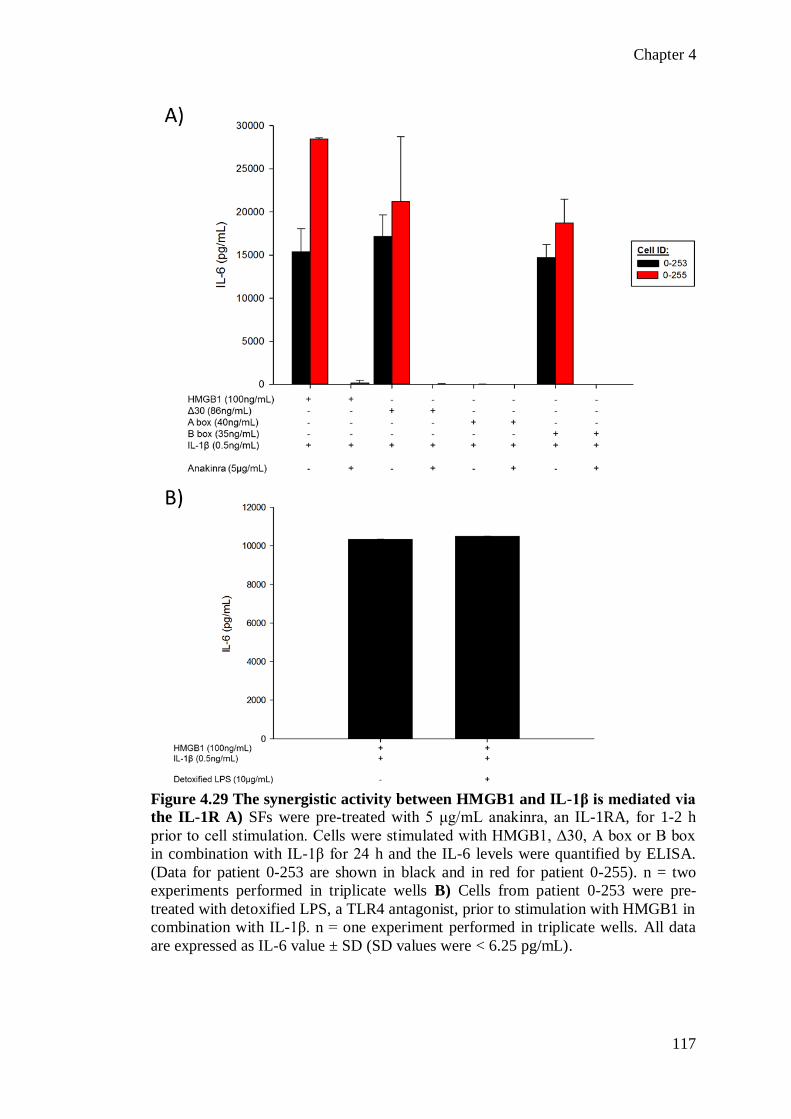
Chapter 4
117
Figure 4.29 The synergistic activity between HMGB1 and IL-1β is mediated via
the IL-1R A) SFs were pre-treated with 5 μg/mL anakinra, an IL-1RA, for 1-2 h
prior to cell stimulation. Cells were stimulated with HMGB1, Δ30, A box or B box
in combination with IL-1β for 24 h and the IL-6 levels were quantified by ELISA.
(Data for patient 0-253 are shown in black and in red for patient 0-255). n = two
experiments performed in triplicate wells B) Cells from patient 0-253 were pre-
treated with detoxified LPS, a TLR4 antagonist, prior to stimulation with HMGB1 in
combination with IL-1β. n = one experiment performed in triplicate wells. All data
are expressed as IL-6 value ± SD (SD values were < 6.25 pg/mL).

Chapter 4
118
4.3.6. HMGB1/IL-1β synergy can be inhibited using sub-optimal
concentrations of LPS
HMGB1 is reported to form pro-inflammatory complexes with both IL-1β and LPS
and it was hypothesised that LPS may inhibit the synergistic interaction. As
previously observed, un-treated fibroblasts and cells treated with HMGB1 or IL-1β
alone had minimal or no detectable IL-6 release (Figure 4.30). Additionally, the sub-
optimal LPS concentration used in this experiment (25 pg/mL) did not enhance IL-6
levels alone or in combination with HMGB1 or IL-1β. To determine if LPS could
prevent the interaction with IL-1β, 100 ng/mL HMGB1 was pre-incubated with LPS
for 1 h prior to the addition of 0.5 ng/mL IL-1β. Pre-incubation with LPS partially
inhibited the HMGB1/IL-1β induced IL-6 release. In the absence of LPS, HMGB1
and IL-1β induced IL-6 levels of 15,385 ± 2688 pg/mL and 28,473 ± 127 pg/mL in
patients 0-253 and 0-255, respectively. However, this was reduced to 7371 ± 444.7
pg/mL and 6370 ± 753.1 pg/mL in the presence of LPS. Additionally, LPS was
added to HMGB1/IL-1β combinations for 0-2 h post overnight incubation to
determine if LPS could disrupt the synergistic interaction. In patient 0-253, LPS was
not able to inhibit HMGB1/IL-1β induced IL-6 release. In cells treated with HMGB1
and IL-1β that had been incubated with LPS for 1 h post overnight incubation IL-6
levels of 17,753 ± 809 pg/mL were detected. Inconsistent results were recorded for
patient 0-255 and IL-6 levels of 14,728 ± 279 pg/mL were detected following the
addition of LPS for 1 h post overnight incubation with similar results recorded for 2,
0.5 and 0 h post incubation. These levels were considerably lower than the 28,473 ±
127 pg/mL IL-6 detected with HMGB1/IL-1β.

Chapter 4
119
Figure 4.30 Pre-incubation of HMGB1 with sub-optimal concentrations of LPS
partially inhibits the synergistic response with IL-1β 100 ng/mL HMGB1 was
pre-incubated with 25 pg/mL LPS before (1 h) and addition (0-2 h) the addition of
0.5 ng/mL IL-1β and overnight incubation at 4oC. The HMGB1/IL-1β/LPS
combinations were used to stimulate SFs from two patients (0-253 and 0-255) for 24
h. Cell supernatants were collected and IL-6 levels were quantified by ELISA. n =
two experiments performed in triplicate wells. Data are expressed as absolute IL-6
value ± SD.
Chapter 4
120
4.4. DISCUSSION
The overall aim of the work presented in this chapter was to characterise the cellular
response to the synergistic interaction between HMGB1 and IL-1β. The recombinant
HMGB1 and IL-1β proteins were shown to act synergistically on SFs to enhance
cytokine production. Fibroblasts treated with 100 ng/mL HMGB1 that had been pre-
incubated with 0.5 ng/mL IL-1β had significantly increased IL-6 release compared to
un-treated fibroblasts or cells treated with HMGB1 or IL-1β alone (p < 0.05) (Figure
4.23 and Figure 4.24). These results are agreement with the findings published by
Hreggvidsdottir et al (2009). Moreover, recent studies have reported that HMGB1
and IL-1β also act synergistically to promote PGE2 biosynthesis and to enhance IL-8,
TNF, and Matrix Metalloproteinase (MMP) production from SFs (Wähämaa et al.,
2011; Leclerc et al., 2013).
Previous studies investigating the synergistic interaction between HMGB1 and IL-1β
have utilised an excess of the HMGB1 protein in comparison to IL-1β (1:137
HMGB1: IL-1β) (Hreggvidsdottir et al., 2009; Wähämaa et al., 2011). To determine
if the synergistic activity was dose-dependent, SFs were treated with increasing
concentrations of HMGB1 (0-100 ng/mL) and IL-1β (0.5 ng/mL). The results
suggest that an excess of the HMGB1 protein may be required for the synergistic
interaction, with no or minimal IL-6 production detected in cells treated with low
levels of HMGB1 (3.25-25 pg/mL) and IL-1β (Figure 4.4). In contrast, both 50 and
100 ng/mL HMGB1 acted in synergy with IL-1β to enhance IL-6 production,
although this increase was not linear. When the concentration of HMGB1 was
halved, from 100 to 50 ng/mL, the IL-6 secretion was reduced by up 89-fold (Figure
4.4). Overall this data suggests that HMGB1 and IL-1β only act synergistically
during injury or infection, when HMGB1 levels are significantly elevated.
It has previously been reported that pre-incubation of HMGB1 and IL-1β, for up to
16 h, may be an important prerequisite for the synergistic response. However,
simultaneous protein addition to cell cultures has generated conflicting results and
one of the aims of this chapter was to determine if pre-incubation is required.
Initially, in agreement with the findings of Hreggvidsdottir et al (2009) and
Wähämaa et al (2011), simultaneous protein addition induced minimal or no-
detectable IL-6 secretion (Figure 4.2). However, in the time course, simultaneous

Chapter 4
121
addition of HMGB1 and IL-1β resulted in extracellular IL-6 levels of up to 2800
pg/mL (Figure 4.5). This data is concordant with the results reported by García-
Arnandis et al (2010) and suggests that pre-incubation of HMGB1 and IL-1β is not
required for the synergistic activity. The inconsistent results between experiments
might, in part, be due to subtle differences in the experimental set up. Initially, the
stock proteins were diluted and incubated overnight at 4oC prior to cell addition.
However, in subsequent experiments the stock solutions were diluted immediately
prior to cell treatment and this may have been an important factor given the
relatively low concentrations that were used in these studies (Li et al., 2004).
The next aim was to determine which domain of HMGB1 is critical for the
synergistic activity and SFs were treated with the individual HMGB1 constructs in
combination with IL-1β. Full length HMGB1, Δ30 and the B box all acted in
synergy with IL-1β to substantially enhance IL-6 release in both patients (Figure
4.28): in patient 0-255 this resulted in IL-6 levels of 28,473 ±127 pg/mL, 18,490 ±
2337 pg/mL and 18,710 ± 2797 pg/mL respectively, and a similar trend was
observed for patient 0-253. Previous studies have shown that the B box mediates the
pro-inflammatory activity of full length HMGB1 and these results demonstrate, for
the first time, that the B box domain is also critical for the synergistic interaction
with IL-1β. Li et al identified that the amino acids at positions 89-108 are
indispensable for HMGB1 induced macrophage activation and TNF release (Li et al.,
2003) and further investigation is required to determine if this region also mediates
the synergistic interaction with IL-1β. Additionally, these results imply that the c-
terminal acidic tail may also contribute to the interaction as treatment with Δ30 in
combination IL-1β induced lower levels of IL-6 than HMGB1 in combination IL-1β.
The acidic tail has been previously shown to modulate the acetylation of HMGB1
(Pasheva et al., 2004) and the interactions with DNA (Sheflin et al., 1993; Stros et
al., 1994; Muller et al., 2001) and nucleosomes (Bonaldi et al., 2002). These results
also demonstrate that the A box domain is not required for the synergistic interaction
and fibroblasts treated with the A box in combination with IL-1β had low IL-6
secretion, with 7.1 ± 0.9 pg/mL and 23.8 ± 4.2 pg/mL IL-6 detected in patients 0-253
and 0-255, respectively (Figure 4.28). This is not an unexpected finding, previous
work has shown that the A box domain is anti-inflammatory and that it can
competitively inhibit the pro-inflammatory activity of the full length protein.

Chapter 4
122
Treatment with recombinant A box has been demonstrated to be beneficial in animal
models of sepsis, arthritis, pancreatitis, ischemia-reperfusion injury, stroke and
transplantation (Yang et al., 2004; Huang et al., 2007; Andrassy et al., 2008;
Muhammad et al., 2008; Yuan et al., 2009; Ostberg et al., 2010). The mode of action
for the A box inhibition is still not defined and it is not known yet if the A box can
inhibit the synergistic interaction between HMGB1 and IL-1β.
Anakinra is a synthetic mimic of the endogenous IL-1RA, which can bind to the IL-
1R but cannot recruit the IL-1RAcP, an essential co-factor, and does not initiate
intracellular signalling (Figure 1.4) (Arend et al., 1990; Greenfeder et al., 1995). In
Figure 4.7 it was demonstrated that the synergistic interaction between HMGB1,
Δ30 or the B box with IL-1β can be inhibited using anakinra pre-treatment,
indicating that the cellular response is mediated via the IL-1R. In patient 0-255, in
the absence of anakinra, 35 ng/mL B box with 0.5 ng/mL IL-1β resulted in IL-6
levels of 18,710 ± 2,791 pg/mL, but in the presence of anakinra this was reduced by
99% to 12.4 ± 3.5 pg/mL. This finding is in agreement with recently published data
which indicates that the synergistic activities of HMGB1 are mediated by the partner
molecule receptor (Hreggvidsdottir et al., 2011). Additionally, it has been previously
shown that HMGB1 and IL-1β do not act synergistically on PBMCs, which express
low levels of the IL-1R (Hreggvidsdottir et al., 2009; Leclerc et al., 2013).
Furthermore, pre-treatment with detoxified LPS, a competitive TLR4 antagonist,
failed to inhibit the synergistic interaction and cells treated with HMGB1/IL-1β in
the absence and presence of detoxified LPS had IL-6 levels of 10,332 ± 6.25 pg/mL
and 10,498 ± 1.40 pg/mL, respectively.
HMGB1 is also reported to act in synergy with LPS. It has been reported that
HMGB1 acts as an alternative LPS binding protein, transferring LPS monomers to
the CD14 molecule to initiate TLR4-mediated pro-inflammatory responses (Youn et
al., 2008). Recent investigations have identified two potential LPS-binding sites in
the HMGB1 protein with boxes A and B reported to bind to the polysaccharide and
lipid moieties of LPS, respectively (Hreggvidsdottir et al., 2009; Youn et al., 2011).
Consequently, it was hypothesised that suboptimal concentrations of LPS (25
pg/mL) may inhibit the synergistic interaction with IL-1β. Pre-incubation of
HMGB1 with LPS inhibited HMGB1/IL-1β induced IL-6 release by up to 52%
(Figure 4.30). However, LPS was not able to inhibit HMGB1/IL-1β-induced IL-6

Chapter 4
123
production when added after the overnight incubation (Figure 4.8). These findings
support the hypothesis previously proposed, which suggests that HMGB1 and IL-1β
promote inflammation by forming a highly active pro-inflammatory complex.
Moreover, this data suggests that IL-1β and LPS may compete for the same binding
site on the HMGB1 protein and that the interaction with LPS may block the IL-1β
binding site and vice versa.
In conclusion, the work presented within this chapter demonstrates that HMGB1 and
IL-1β act in synergy, via the IL-1R, to enhance cytokine production from SFs. For
the first time, these results identify that the B box domain of HMGB1 is critical for
this interaction. Previous studies have proposed that HMGB1 and IL-1β form a
binary pro-inflammatory complex that initiates and promotes inflammation and,
collectively, the findings from this chapter support that hypothesis. However,
biophysical analysis of the interaction between HMGB1 and IL-1β is lacking within
the current literature and further investigations are required to elucidate the
mechanism of action.
CHAPTER FIVE
BIOPHYSICAL ANALYSIS OF THE INTERACTION BETWEEN HMGB1
AND IL-1β
Chapter 5
125
TABLE OF CONTENTS
5.1 INTRODUCTION ...................................................................................... 126
5.2 MATERIAL AND METHODS ................................................................. 128
5.3 RESULTS ................................................................................................... 129
5.3.1. Investigating the intermolecular interaction between HMGB1 and IL-1β
..................................................................................................................129
5.3.2. Investigating the intermolecular interaction between ∆30 and IL-1β. ....136
5.3.3. Investigating the intermolecular interaction between the B box and IL-
1β..............................................................................................................140
5.3.4. Investigating the intermolecular interaction between the A box domain of
HMGB1 and IL-1β ............................................................................... 142
5.4 DISCUSSION ............................................................................................. 144

Chapter 5
126
5.1. INTRODUCTION
HMGB1 and IL-1β have been shown to act synergistically to enhance inflammation
(Sha et al., 2008; Hreggvidsdottir et al., 2009; Garcia-Arnandis et al., 2010;
Wähämaa et al., 2011) and it has been proposed that this synergistic activity is
mediated by the formation of a highly active pro-inflammatory complex in which
HMGB1 and IL-1β directly interact. This hypothesis is supported by previous
studies which have demonstrated that HMGB1 is able to interact with a diverse
range of endogenous and exogenous molecules to mediate a range of biological
activities (Dintilhac and Bernués 2002; Ivanov et al., 2007; Tian et al., 2007;
Urbonaviciute et al., 2008; Youn et al., 2008; Schiraldi et al., 2012). Additionally,
two independent groups have reported that an interaction between HMGB1 and IL-
1β can be detected using immunoprecipitation (IP) methods (Sha et al., 2008;
Ferhani et al., 2010). However, a detailed biophysical analysis of the molecular
relationship between HMGB1 and IL-1β is not available within the current literature.
Protein NMR spectroscopy is a powerful biophysical technique that can be used to
obtain physical, chemical and electronic information about proteins in solution. It is
routinely used to characterise intermolecular interactions and can be used to identify
the specific residues involved in a binding interaction. Protein NMR has been
previously used to investigate the interactions of the HMGB1 protein. The
interaction between the A and B boxes with the c-terminal acidic tail has been
elucidated (Watson et al., 2007; Stott et al., 2010). Additionally, the binding to DNA
and linker histones, which is essential for the physiological role of HMGB1, has
been extensively characterised using this technique (Stott et al., 2006; Cato et al.,
2008). Furthermore, Schiraldi et al have recently reported that HMGB1 forms a
heterocomplex with the chemokine, CXCL12. They proposed a model in which one
molecule of HMGB1 binds to two molecules of CXCL12 via the A and B boxes.
The complex was shown to have enhanced binding to the CXCR4 receptor and
increased cell infiltration (Schiraldi et al., 2012).
Evidence within the literature suggests that HMGB1 may form a similar complex
with IL-1β. Therefore, the aim of this chapter was to conduct a comprehensive
biophysical analysis of the interaction between HMGB1 and IL-1β using NMR
methodologies. Specifically, this work was performed to test the hypothesis that

Chapter 5
127
HMGB1 and IL-1β directly interact to form a binary complex and to identify the
residue(s) involved in the binding interaction. The choice of using NMR for these
studies is based on the fact that the method is able to detect interactions over a wide
range of binding affinities. Furthermore, if binding is detected, the binding interface
between HMGB1 and IL-1 can be determined since the resonance assignments of
both proteins are available.
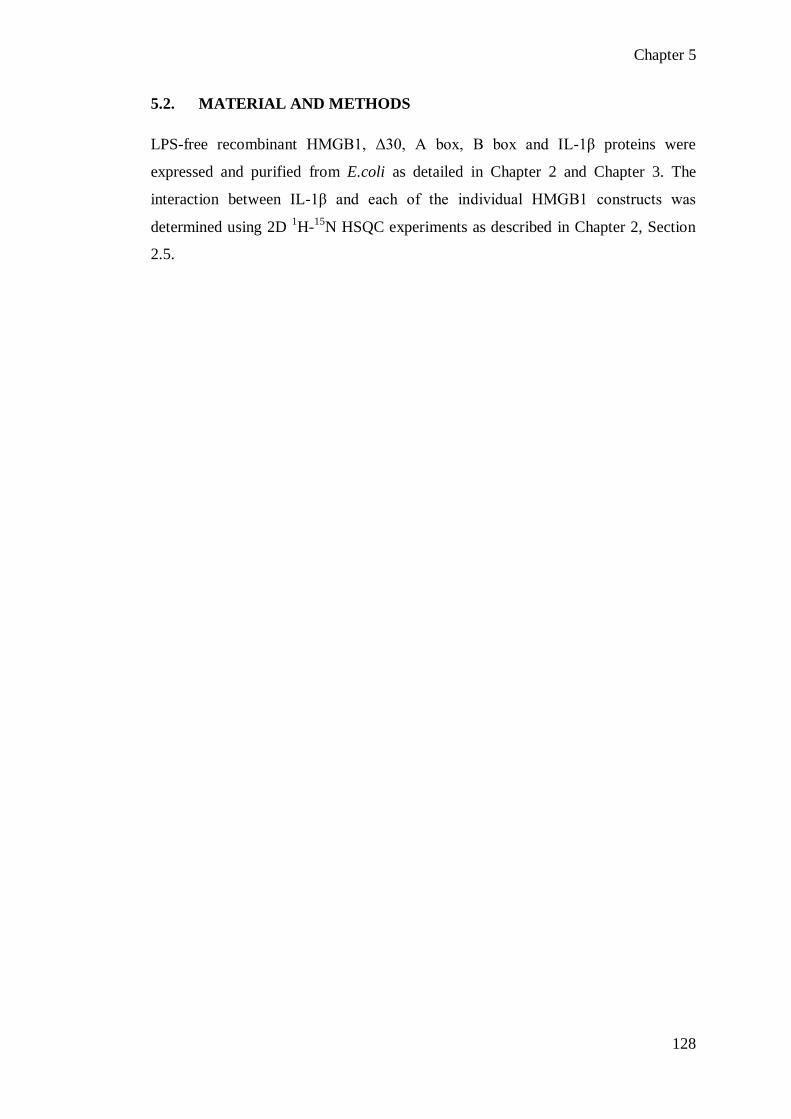
Chapter 5
128
5.2. MATERIAL AND METHODS
LPS-free recombinant HMGB1, Δ30, A box, B box and IL-1β proteins were
expressed and purified from E.coli as detailed in Chapter 2 and Chapter 3. The
interaction between IL-1β and each of the individual HMGB1 constructs was
determined using 2D 1H-
15N HSQC experiments as described in Chapter 2, Section
2.5.

Chapter 5
129
5.3. RESULTS
5.3.1. Investigating the intermolecular interaction between HMGB1 and IL-
1β
Firstly, the interaction between full length HMGB1 and IL-1β was examined using
NMR spectroscopy. 1H-
15N HSQC spectra were collected on a 600 MHz Bruker
Avance II spectrometer equipped with triple resonance cryoprobes. To allow a direct
comparison to be made, the spectra were collected using identical acquisition
parameters: 32 scans with 160 increments at a resolution in the indirect dimension of
21.00 Hz. To reproduce the conditions used in the cellular experiments (described in
Chapter 4) the NMR spectra were collected in PBS at pH 7.2 and the HMGB1 and
IL-1β proteins were incubated for 16 h at 4oC prior to the experimental analysis.
Initially, a 1H-
15N HSQC spectrum was collected on a 25 μM
15N-labelled IL-1β
sample in the absence of HMGB1 at 25oC. The peaks on the spectrum were well
resolved and dispersed and indicate that the IL-1β protein was well folded (Figure
5.31; black spectrum). Next, a 12.5 µM aliquot of the IL-1β protein was incubated
overnight with 11.5 µM HMGB1; this resulted in a molar ratio of approximately 1:1
IL-1β: HMGB1. The HSQC spectrum was recorded again and an overlay of the
spectra for IL-1β alone and in the presence of HMGB1 is presented in Figure 5.31.
No interaction between HMGB1 and IL-1β was detected, under the conditions
employed in this experiment, since there were no significant chemical shift
perturbations for the IL-1β residues following the addition of HMGB1. This is
illustrated more clearly in Figure 5.32, where a section of the amide region is shown
in greater detail.
Next, the IL-1β and HMGB1 proteins were concentrated and the experiment was
repeated at 10oC (or 283 K) using a higher concentration of protein. A HSQC
spectrum was collected for 100 μM 15
N-IL-1β in the absence of HMGB1 (Figure
5.33; black spectrum) using 64 scans with 250 increments at a resolution in the
indirect dimension of 12.65 Hz. A 50 µM 15
N-IL-1β sample was then incubated
overnight with 195 µM HMGB1 (1:4 molar ratio) and the spectrum were recorded
again using 256 scans with 384 increments at a resolution in the indirect dimension
of 12.67 Hz (Figure 5.33; red spectrum). For clarity an expanded section of the
amide region of the spectra is also provided in Figure 5.4. Small chemical shift

Chapter 5
130
perturbations were observed for five of the IL-1β residues in the presence of an
excess of HMGB1. The deposited NMR spectra for IL-1β was obtained from the
Biological Magnetic Resonance Bank (BMRB) database (BMRB accession number
434 (Driscoll et al., 1990; Ulrich et al., 2008)) and it was possible to identify two of
the residues that displayed small chemical perturbations as histidine 30 (H30) and
asparagine 129 (N129). Further analysis revealed that these two residues are both
surface exposed and are in close physical proximity to each other (Figure 5.35).
However, the identity of the other three residues could not be determined as it was
not possible to transfer the complete IL-1β assignment from the deposited data to the
current spectra. This was due to differences in the ionic strength and pH between IL-
1β in PBS and in 100 mM sodium acetate-d3 pH 5.4, the conditions under which the
assignment was deposited in the BMRB.

Chapter 5
131
Figure 5.31 1H-
15N
HSQC spectra for 15
N-
IL-1β in the presence
and absence of full
length HMGB1 1H-
15N
HSQC spectra were
recorded for 15
N-labelled
IL-1β in the absence and
presence of HMGB1 on
a 600 MHz Bruker
Avance II spectrometer
at 25oC (298 K) using
identical acquisition
parameters (15
N res =
21.00 Hz). Spectra were
recorded on a 25 μM 15
N-labelled IL-1β alone
(black) and for a 12.5
μM 15
N-IL-1β sample in
the presence of 11.5 μM
HMGB1 (red). No
significant chemical shift
changes were noted in
the presence of HMGB1.

Chapter 5
132
Figure 5.32 An expanded
view of the amide region
of the 1H-
15N IL-1β HSQC
spectra in the presence
and absence of full length
HMGB1 1H-
15N HSQC
spectra were recorded for 15
N-IL-1β in the absence
and presence of HMGB1 on
a 600 MHz Bruker Avance
II at 25oC (298 K) using
identical acquisition
parameters (15
N res =
21.00 Hz). Spectra were
recorded on a 25 μM 15
N-
labelled IL-1β alone (black)
and for a 12.5 μM 15
N-IL-
1β sample in the presence
of 11.5 μM HMGB1 (red).
For clarity an expanded
section of the backbone
amide region is shown. No
significant chemical shift
changes were detected
following the addition of
HMGB1.

Chapter 5
133
Figure 5.33 Full 1H-
15N
HSQC spectra
recorded for 15
N-
labelled IL-1β at 10oC
in absence and
presence of HMGB1 HSQC spectra were
recorded on a 600 MHz
Bruker Avance II
spectrometer at 10oC
(283 K) in PBS, pH 7.2,
using an identical
resolution in the indirect
dimension of 12.67 Hz.
Spectra were recorded
for 100 μM IL-1β alone
(black) and for 50 μM
IL-1β in the presence of
195 μM HMGB1 (red;
1:4 molar ratio). Minor
changes in the chemical
shift of five peaks were
observed (as indicated)
and two of these
residues could be
assigned as H30 and
N129.

Chapter 5
134
Figure 5.34 An
expanded view of the
amide region of the 1H-
15N IL-1β HSQC
spectra in the presence
and absence of full
length HMGB1
recorded at 10oC HSQC
spectra were recorded on
a 600 MHz Bruker
Avance II spectrometer
at 10oC (283 K) in PBS,
pH 7.2, using an
resolution in the indirect
dimension of 12.67 Hz.
The black spectra show
100 µM IL-1β alone and
the red spectra
correspond to 50 µM IL-
1β with 195 µM
HMGB1. An expanded
region is shown for
clarity with perturbations
in the chemical shifts of
two unassigned residues
observed within this
region (as indicated in
the boxed regions).
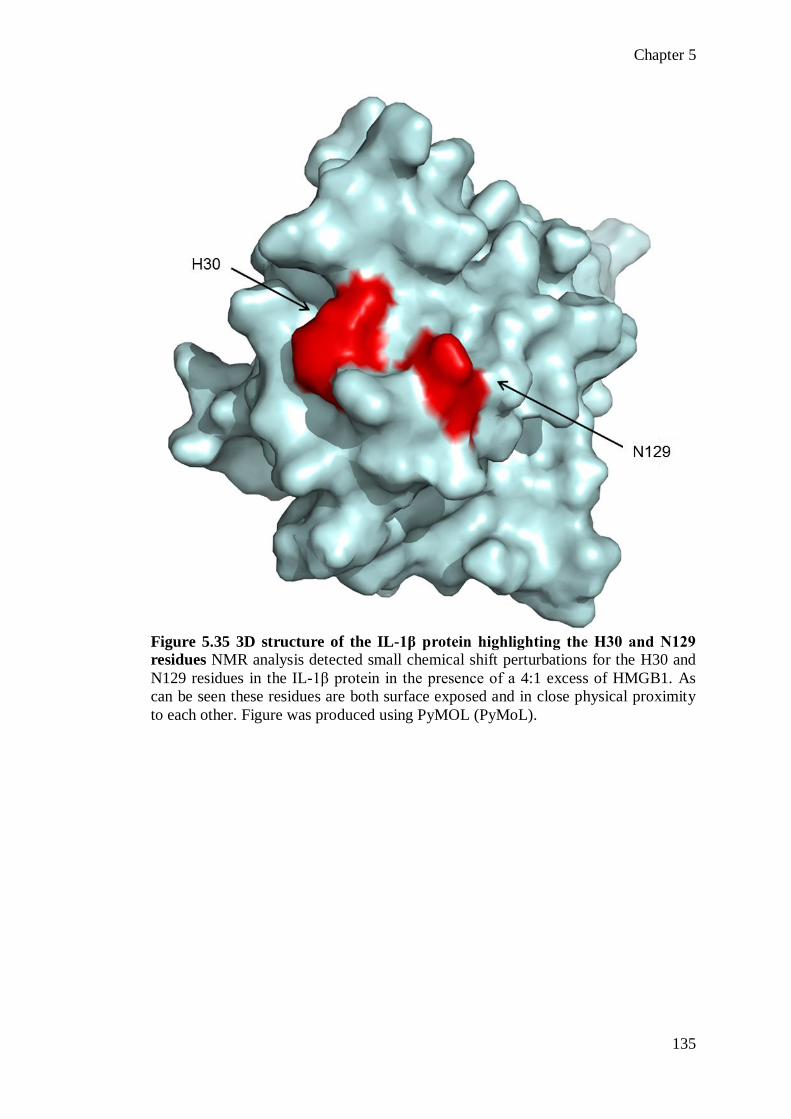
Chapter 5
135
Figure 5.35 3D structure of the IL-1β protein highlighting the H30 and N129
residues NMR analysis detected small chemical shift perturbations for the H30 and
N129 residues in the IL-1β protein in the presence of a 4:1 excess of HMGB1. As
can be seen these residues are both surface exposed and in close physical proximity
to each other. Figure was produced using PyMOL (PyMoL).

Chapter 5
136
5.3.2. Investigating the intermolecular interaction between ∆30 and IL-1β
Due to the acidic nature of the C-terminal tail (residues 185-215) it was decided that
further investigations into the interaction between HMGB1 and IL-1β would be
carried out using the more stable Δ30 construct. In Chapter 4, it was demonstrated
that the Δ30 protein acted in synergy with IL-1β to enhance IL-6 release in SFs
(Chapter 4, Section 4.2.4). NMR spectra were collected on a 10 μM 15
N-labelled Δ30
sample in the absence and presence of 90 μM unlabelled IL-1β (1:9 molar ratio) on
an 800 MHz Avance II Bruker spectrometer at 25oC (298 K) in PBS at pH 7.2. To
allow a direct comparison to be made between the spectra, identical acquisition
parameters were used: 192 scans with 256 increments at a resolution in the indirect
dimension of 15.80 Hz. An overlay of the 1H-
15N HSQC spectra is presented in
Figure 5.36. The ∆30 protein appeared to be well folded as the peaks on the HSQC
spectra were well resolved and dispersed. When an excess of the IL-1β protein was
added to the sample no significant changes in the chemical shift of the peaks was
observed. It may appear that some small peaks disappear from spectrum following
the addition of IL-β, however this is not the case as all of the peaks are present when
the contour levels are increased. The reduction in the intensity is an unavoidable
result of dilution effects. For increased clarity and to reduce the background noise
levels the spectra are presented at reduced contour levels.
Next, the reverse experiment was conducted with 1H-
15N HSQC spectra recorded for
100 μM IL-1β in the absence and presence of a three-fold excess of unlabelled ∆30
protein. The experiment was performed on an 800 MHz Bruker Avance II
spectrometer in 20 mM phosphate, 100mM potassium chloride, and 10 mM DTT at
pH 6.8 using comparable acquisition parameters: 4 scans with 210 increments at a
resolution in the indirect dimension of 16.99 Hz. As shown in Figure 5.7 and Figure
5.8 minor chemical shift perturbations were observed for a number of the IL-1β
residues; however, this did not appear to be a specific effect as most of the residues
on the spectrum displayed some small perturbation. As observed previously (Figure
5.3), the H30 and N129 residues displayed the greatest chemical perturbations.
However, it was difficult to replicate these results in subsequent experiments.

Chapter 5
137
Figure 5.36 Effect of IL-1β
on the 15
N-HSQC spectra of
Δ30 1H-
15N HSQC spectra
were collected using a 800
MHz Bruker Avance II
spectrometer at 25oC (298 K)
on a 10 μM 15
N-labelled his-
tagged Δ30 sample in PBS,
pH 7.2. Spectra were
recorded for Δ30 alone
(black) and in the presence of
90 μM IL-1β (red) using
identical acquisition
parameters: NS = 192,
increments = 256 and 15
N res
= 15.80 Hz. No significant
changes in the chemical shifts
of the peaks were observed in
the presence of IL-1β. From
the spectra presented it would
appear that some of peaks
disappear following the
addition of IL-1β. However,
this was due the low
concentration of the 15
N B
box protein and all peaks
were present when the
contour levels were increased.
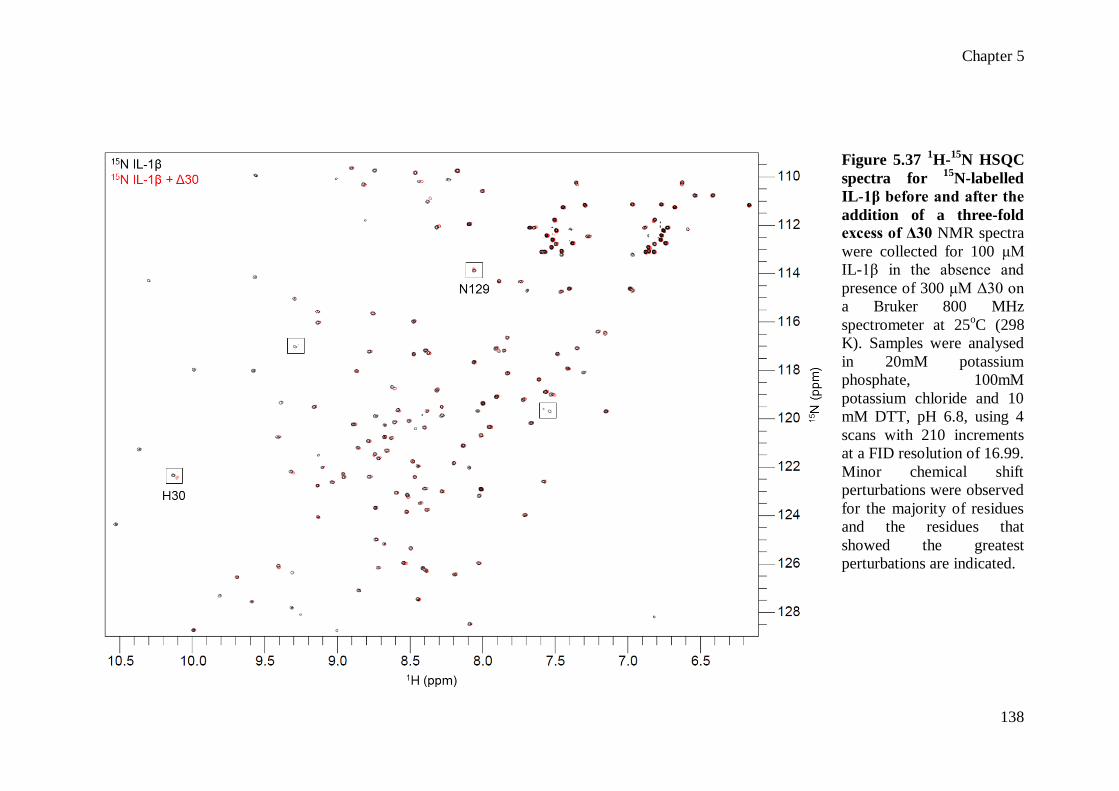
Chapter 5
138
Figure 5.37 1H-
15N HSQC
spectra for 15
N-labelled
IL-1β before and after the
addition of a three-fold
excess of Δ30 NMR spectra
were collected for 100 μM
IL-1β in the absence and
presence of 300 μM Δ30 on
a Bruker 800 MHz
spectrometer at 25oC (298
K). Samples were analysed
in 20mM potassium
phosphate, 100mM
potassium chloride and 10
mM DTT, pH 6.8, using 4
scans with 210 increments
at a FID resolution of 16.99.
Minor chemical shift
perturbations were observed
for the majority of residues
and the residues that
showed the greatest
perturbations are indicated.

Chapter 5
139
Figure 5.38 An
expanded view of the
amide region of the 1H-
15N HSQC spectra
for 15
N-labelled IL-1β
in the absence and
presence of Δ30 NMR
spectra were collected
for 100 μM IL-1β in
the absence and
presence of 300 μM
Δ30 on a Bruker 800
MHz spectrometer at
25oC (298 K). Samples
were analysed in 20
mM potassium
phosphate, 100 mM
potassium chloride and
10 mM DTT, pH 6.8,
using 4 scans with 210
increments at a
resolution in the
indirect dimension of
16.99 Hz. Minor
chemical shift
perturbations were
observed.

Chapter 5
140
5.3.3. Investigating the intermolecular interaction between the B box and IL-
1β
In Chapter 4 it was demonstrated that the B box domain of HMGB1 is critical for the
synergistic interaction with IL-1β. The association between the B box and IL-1β was
investigated using 2D NMR analysis, to determine if a direct interaction could be
detected. NMR spectra were collected on an 800 MHz Bruker Avance II
spectrometer equipped with triple resonance cryoprobes at 25oC (298 K) using
identical acquisition parameters: 192 scans with 256 increments at a resolution in the
indirect dimension of 15.80 Hz. 1H-
15N HSQC spectra were collected on a 10 μM
15N-labelled B box sample before and after the addition of 100 μM IL-1β (B box: IL-
1β ratio of 1:10). Samples were analysed in PBS at pH 7.2 to replicate the cellular
buffer conditions.
An overlay of the two spectra is presented in Figure 5.9. In both cases the peaks are
well defined and dispersed and the spectra are indicative of a folded B box protein.
Following the addition of an excess of un-labelled IL-1β the HSQC spectra showed
little variation; no significant change in the chemical shift of the peaks was observed.
From Figure 5.9 it would appear that some of peaks disappear from the spectrum
after the addition of IL-1β. However, this was due to the dilution effects of the 15
N-B
box protein used in the experiment and all of the peaks were present when the
contour levels were increased. However, the spectra are presented at reduced contour
levels in the Figure for increased clarity as the background noise levels also
increased significantly.

Chapter 5
141
Figure 5.39 1H-
15N HSQC spectra
for the 15
N-labelled B box domain
in the presence and absence of
IL-1β 1H-
15N HSQC spectra were
collected on a 10 µM 15
N B box
sample in PBS, pH 7.2 at 25oC (298
K) in the absence (Black) and
presence (red) of 100 μM IL-1β
(15
N B box: IL-1β ratio of 1:10).
NMR spectra were collected on a
Bruker Avance II 800 MHz
spectrometer using identical
experimental parameters (NS =
192, increments = 256 and 15
Nres =
15.80 Hz). In the presence of IL-1β,
no significant change in the
chemical shift of the peaks was
observed. From the spectra it would
appear that some of peaks disappear
following the addition of IL-1β.
However, this was due the low
concentration of the 15
N B box
protein and all peaks were present
when the contour levels were
increased.
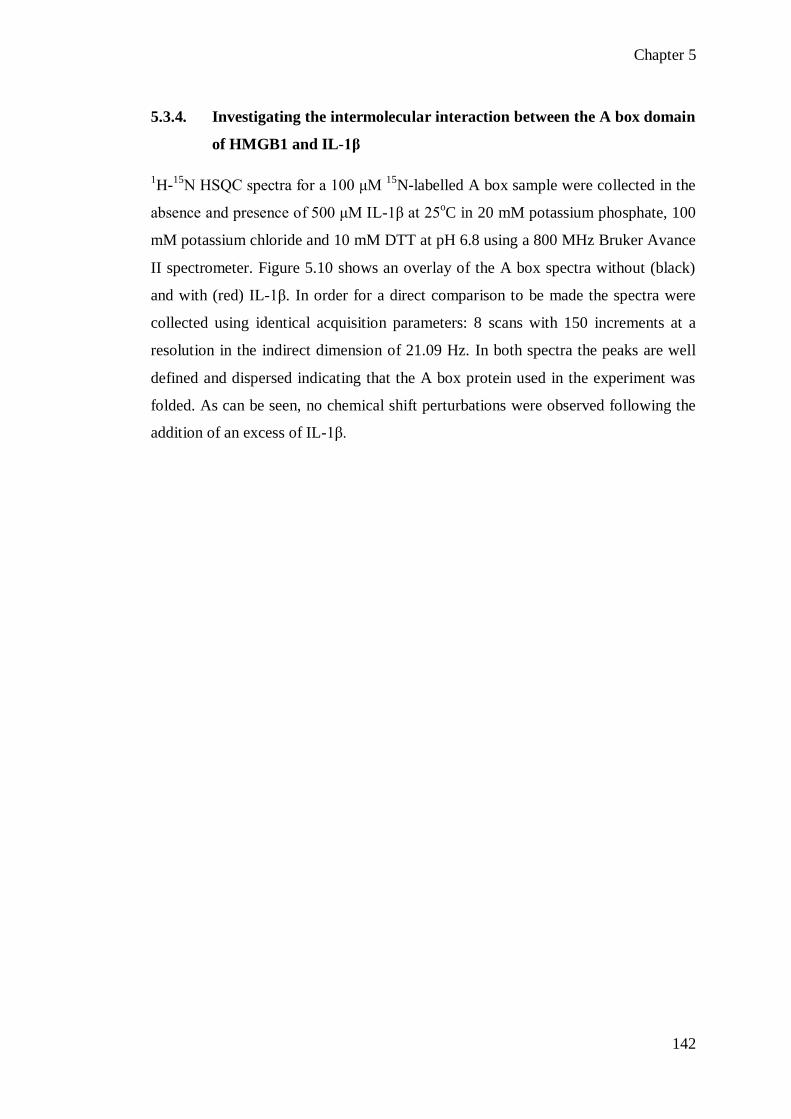
Chapter 5
142
5.3.4. Investigating the intermolecular interaction between the A box domain
of HMGB1 and IL-1β
1H-
15N HSQC spectra for a 100 μM
15N-labelled A box sample were collected in the
absence and presence of 500 μM IL-1β at 25oC in 20 mM potassium phosphate, 100
mM potassium chloride and 10 mM DTT at pH 6.8 using a 800 MHz Bruker Avance
II spectrometer. Figure 5.10 shows an overlay of the A box spectra without (black)
and with (red) IL-1β. In order for a direct comparison to be made the spectra were
collected using identical acquisition parameters: 8 scans with 150 increments at a
resolution in the indirect dimension of 21.09 Hz. In both spectra the peaks are well
defined and dispersed indicating that the A box protein used in the experiment was
folded. As can be seen, no chemical shift perturbations were observed following the
addition of an excess of IL-1β.

Chapter 5
143
Figure 5.40
Investigating the
intermolecular
interaction between 15
N A box and IL-1β 1H-
15N HSQC spectra
were collected for a
100 μM 15
N-labelled
A box sample in the
absence (black) and
presence (red) of 500
μM IL-1β at 25oC
(298 K) in 20 mM
potassium phosphate,
100 mM potassium
chloride and 10 mM
DTT, pH 6.8, on a
800 MHz Bruker
Avance II
spectrometer. No
significant chemical
shift changes were
observed in the
presence of IL-1β.

Chapter 5
144
5.4. DISCUSSION
It has been previously demonstrated that HMGB1 and IL-1β act in synergy to
amplify the inflammatory response and it has been postulated that this effect is
mediated by the formation of a highly active pro-inflammatory complex in which
HMGB1 and IL-1β directly interact (Sha et al., 2008; Ferhani et al., 2010; Wähämaa
et al., 2011). However, there is currently limited evidence to prove that a direct
association occurs, although it is known that HMGB1 can complex with a diverse
range of endogenous and exogenous molecules. Two independent groups have
demonstrated that HMGB1 and IL-1β can be co-purified using IP: in 2008, Sha and
colleagues reported that IL-1β could be detected along with FLAG-tagged HMGB1
following FLAG-affinity IP purification (Sha et al., 2008). Additionally, in 2010,
Ferhani et al (2010) reported that HMGB1/IL-1β complexes could be isolated from
macrophages treated with recombinant HMGB1 and IL-1β proteins. However, the
published data for this later study did not include an IL-1β positive control and it is
possible that the IL-1β protein interacted non-specifically with the anti-HMGB1
antibody used in the experiment. Therefore, the work presented in this chapter was
performed to elucidate the molecular interaction between E.coli expressed and
purified recombinant HMGB1 and IL-1β, and to test the hypothesis that these
proteins directly interact to form a binary complex that enhances the inflammatory
response.
The first experiment was designed to investigate the intermolecular interaction
between 15
N-labelled IL-1β and unlabelled full length HMGB1. The specific batch
of proteins used in this experiment had been previously demonstrated to act
synergistically on SFs to enhance the release of IL-6 in cells isolated from two RA
patients (Figure 4.3). Neither protein induced detectable IL-6 secretion alone but
they acted synergistically to induce IL-6 levels of up to 13,486 ± 2055 pg/mL. The
NMR experiments performed in this chapter were designed to replicate the cellular
experimental conditions as closely as possible: the HSQC spectra were collected in
PBS and the proteins were incubated overnight at 4oC prior to sample analysis, as it
has been previously reported this was a prerequisite for the synergistic activity (Sha
et al., 2008; Hreggvidsdottir et al., 2009; Wähämaa et al., 2011) although the results

Chapter 5
145
from Chapter 4 indicate that pre-incubation may not be necessary. Initially, the
experiment was conducted at 25oC (298 K) and under the conditions examined in
this thesis no direct protein-protein interaction was detected between IL-1β and
HMGB1 with no chemical shift perturbations observed for any of the IL-1β residues,
suggesting that the cellular response is not mediated by the formation of a highly
active binary complex (Figure 5.31 and Figure 5.32). Somewhat different results
were obtained when the experiment was repeated at 10oC (283 K) as minor chemical
shift perturbations were observed for five IL-1β residues (Figure 5.3 and Figure 5.4).
Two of these residues, H30 and N129, were surface exposed and in close proximity
to each other (Figure 5.35). However, given such small and limited chemical shifts,
and the difficulties in replicating the results, it is likely that these small perturbations
are not caused by a direct binding interaction but are the result of subtle pH
differences, which are likely to affect charged residues.
In Chapter 4 the Δ30 protein was shown to act synergistically with IL-1β to enhance
the inflammatory response (Section 4.2.4) and experiments were designed to
determine if this effect was due to the formation of a binary complex. Initially, 1H-
15N HSQC spectra were collected for a
15N-labelled Δ30 sample in the absence and
presence of a 9-fold excess of unlabelled IL-1β protein. No chemical shift
perturbations for the Δ30 residues were observed following the addition of IL-1β
(Figure 5.36) indicating that a detectable binary complex was not formed under the
conditions utilised in this experiment. It should be noted that it was not practical to
reproduce the 1:137 (IL-1β: HMGB1 protein) molar ratio used in the cellular
experiments within the NMR studies. However, the total concentration of the
HMGB1 constructs used in the NMR experiments exceeds the concentration used in
the cellular assays. Additionally, an excess of the unlabelled protein was required for
the experiments and this resulted in an excess of the IL-1β protein being used when
spectra were collected for 15
N-labelled HMGB1 proteins. However, the reverse
experiment was also performed with 1H-
15N HSQC spectra recorded for
15N-labelled
IL-1β in the presence of a three-fold excess of Δ30 protein (Figure 5.7 and Figure
5.8). Under these conditions minor chemical shift perturbations were observed for
several of the IL-1β residues, including once again the H30 and N129 peaks. It is
unlikely that these small chemical shift perturbations are due to a specific binding
interaction since minor changes were detected for many of the residues. Moreover,

Chapter 5
146
the chemical shift of the H30 residue, a charged amino acid, is particularly
susceptible to pH changes and once again it is likely that the perturbations were due
to a subtle pH change following the addition of the Δ30 protein.
Subsequently, NMR experiments were conducted to investigate the interaction
between IL-1β and the individual A and B box domains. Despite structural
similarities, the two HMG boxes have opposing functions in vivo: the B box is
essential for the pro-inflammatory activity of HMGB1 (Li et al., 2003; Yang et al.,
2010) whilst the A box is anti-inflammatory and has been shown to neutralise the
inflammatory activity of the full length HMGB1 protein in experimental animal
models (Yang et al., 2004; Andrassy et al., 2008; Yuan et al., 2009; Ostberg et al.,
2010). It was previously observed that the B box is critical for the synergistic
interaction with IL-1β and that the A box is not required (Chapter 4, Section 4.2.4).
Therefore, as predicted, the formation of a complex between 15
N-labelled A box and
IL-1β was not detected, with no chemical shift perturbations observed in the A box
spectrum (Figure 5.10). Additionally, no chemical shift perturbations were observed
in the 1H-
15N HSQC spectrum for the
15N-labelled B box protein following the
addition of a 10-fold excess of IL-1β (Figure 5.9), despite the fact that this
combination of proteins induced increased IL-6 secretion in vitro (Figure 4.6). Once
again, this implies that HMGB1 and IL-1β do not directly interact to form a binary
complex under the conditions used in these experiments.
From the NMR data presented within this chapter it would appear that the synergistic
interaction observed between HMGB1 and IL-1β is not mediated by the formation of
a pro-inflammatory binary complex. Rather, an alternative cellular mechanism is
needed in which HMGB1 is involved and additional co-factor(s) may be required.
The HMGB1 and IL-1β proteins signal via a common pathway to initiate
inflammation, binding to the TLR4 and IL-1R, respectively (Figure 5.11). Both
receptors belong to the Toll/IL-1R (TIR) family, which is split into three sub-
families: the TLR family, the IL-1 family and the MyD88 family. All of the
members of the TIR family share a common, highly conserved cytoplasmic motif
(Gay and Keith 1991), the TIR domain which is essential for the initiation of
intracellular signalling (Leung et al., 1994). The synergistic interaction between
HMGB1 and IL-1β is mediated via the IL-1R (Chapter 4; Hreggvidsdottir et al.,
2011). The IL-1R subfamily contains 10 proteins including the type I and II IL-R’s

Chapter 5
147
and the IL-1RAcP, a co-factor that is essential for the initiation of intracellular
signalling. The type I IL-1R and IL-1RAcP are composed of an extracellular region
made of three immunoglobulin-like domains, a transmembrane domain and a
cytoplasmic TIR domain, which contains approximately 215 residues (Sims et al.,
1989). The type II IL-1R has a truncated 29-residue TIR domain, cannot initiate cell
signalling and acts as a decoy receptor for IL-1 (McMahan et al., 1991).
IL-1 signalling is mediated by the MyD88/IRAK/TRAF6 pathway and the TIR
domains play a central role in initiating the cellular response (Figure 5.11). IL-1
binds to the type I IL-1R and recruits the IL-1RAcP resulting in the formation of a
heterodimeric signalling complex (Greenfeder et al., 1995). The TIR domains within
the IL-1R and the IL-1RAcP interact, inducing a conformational change (Martin and
Wesche 2002) leading to the recruitment of the MyD88 and Tollip/IRAK proteins
(Muzio et al., 1997). Under normal conditions, the activity of IRAK-1 is sequestered
by the Tollip protein; this association is lost when IRAK-1 is recruited to receptor
complex (Burns et al., 2000). IRAK-1 is phosphorylated (Burns et al., 2000; Kollewe
et al., 2004) and released into the cytoplasm, where it associates with the TAB2 and
TRAF6 proteins (Jiang et al., 2002). TRAF6 is poly-ubiquitinated and active TRAF6
can interact with the TAK-1, which in turn activates the NF-κB, p38 and c-JNK
pathways (Wang et al., 2001). NF-κB activates a diverse range of pro-inflammatory
genes including the IL-6 gene (Libermann and Baltimore 1990). Our findings
suggest that additional molecules may be involved in mediating HMGB1/IL-1β
synergy. There is currently no evidence within the literature to suggest that HMGB1
can directly bind to and activate the IL-1R. However, HMGB1 and IL-1β may form
a tertiary complex with the IL-1R or IL-1RAcP to enhance intracellular signalling
and future studies will investigate this hypothesis.
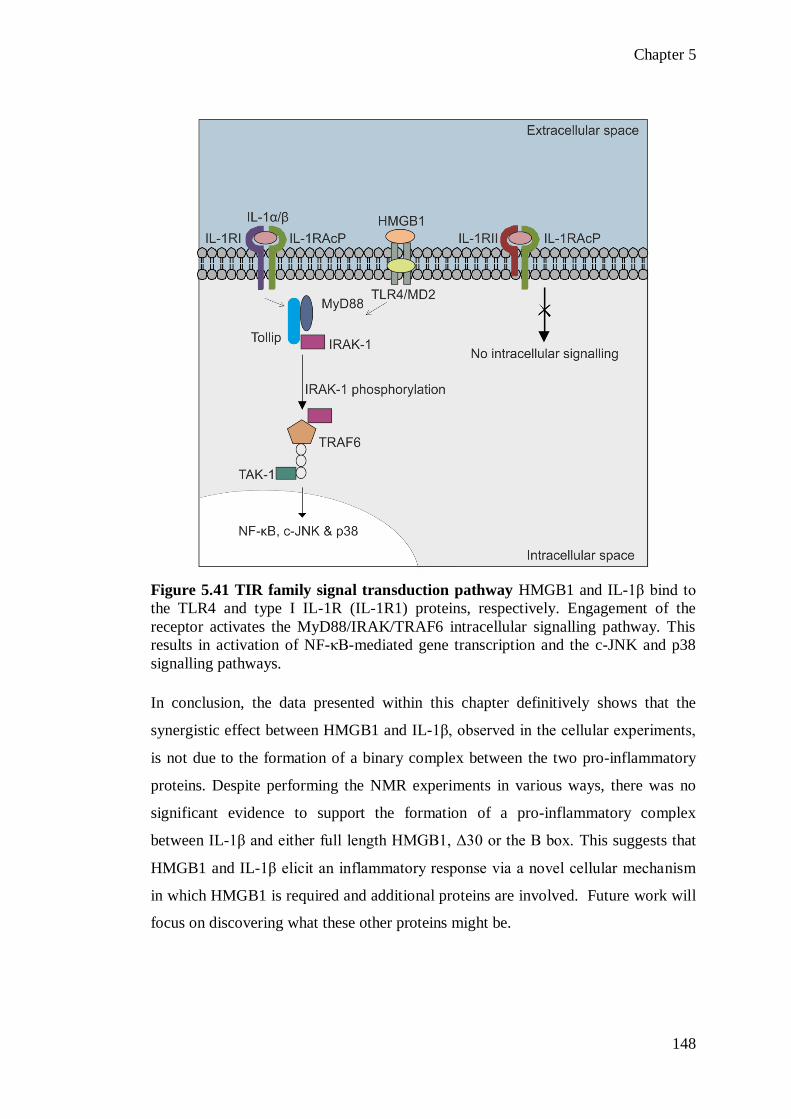
Chapter 5
148
Figure 5.41 TIR family signal transduction pathway HMGB1 and IL-1β bind to
the TLR4 and type I IL-1R (IL-1R1) proteins, respectively. Engagement of the
receptor activates the MyD88/IRAK/TRAF6 intracellular signalling pathway. This
results in activation of NF-κB-mediated gene transcription and the c-JNK and p38
signalling pathways.
In conclusion, the data presented within this chapter definitively shows that the
synergistic effect between HMGB1 and IL-1β, observed in the cellular experiments,
is not due to the formation of a binary complex between the two pro-inflammatory
proteins. Despite performing the NMR experiments in various ways, there was no
significant evidence to support the formation of a pro-inflammatory complex
between IL-1β and either full length HMGB1, Δ30 or the B box. This suggests that
HMGB1 and IL-1β elicit an inflammatory response via a novel cellular mechanism
in which HMGB1 is required and additional proteins are involved. Future work will
focus on discovering what these other proteins might be.

CHAPTER SIX
CONCLUDING DISCUSSION

Chapter 6
150
TABLE OF CONTENTS
6.1. BACKGROUND ........................................................................................ 151
6.2. HMGB1 AS AN INFLAMMATORY MEDIATOR OF DILI .................. 152
6.3. DIFFERENT MOLECULAR FORMS OF HMGB1 PRESENT DURING
DILI AND THEIR SYNERGISTIC INTERACTIONS ........................... 155
6.4. EXPLORING THE INTERACTION BETWEEN HMGB1 AND IL-1Β 158
6.5. FUTURE INVESTIGATIONS; ELUCIDATING THE MECHANISM OF
ACTION FOR HMGB1/IL-1Β SYNERGY .............................................. 158
6.6. CONCLUDING REMARKS ..................................................................... 160

Chapter 6
151
6.1. BACKGROUND
HMGB1 is an important mediator of inflammation which acts to alert the immune
system to tissue stress and injury. It mediates cytokine production (Andersson et al.,
2000), chemotaxis (Orlova et al., 2007), cell proliferation, dendritic cell and T-cell
activation (Dumitriu et al., 2005), cell differentiation (Melloni et al., 1995) and
autophagy (Tang et al., 2010). HMGB1 has been implicated in the pathogenesis of
multiple inflammatory diseases including immune-mediated DILI, where it is a
potential mechanistic biomarker and a target for therapeutic intervention. However,
despite intense research the pro-inflammatory role of HMGB1 remains unresolved.
Several studies have demonstrated that HMGB1 interacts with multiple unrelated
ligands to enhance the inflammatory response, although currently these interactions
are poorly defined. The overall aim of the work presented in this thesis was to
specifically characterise the interaction between HMGB1 and IL-1β. This was
achieved by:
Developing and optimising methods for the production of LPS-free and
isotopically-labelled recombinant HMGB1, Δ30, A box, B box and IL-1β
proteins. The characterisation of these proteins in Chapter 3 enabled their use
in further studies in Chapters 4 and 5, where a dual cellular and biophysical
strategy was employed to study the synergistic response between HMGB1
and IL-1β.
Performing an extensive cellular characterisation of the interaction between
HMGB1 and IL-1β using established cell assays. In Chapter 4, SFs were used
as a model cell system to investigate the cellular response to HMGB1 and IL-
1β. These studies identified which domain of HMGB1 mediates the
interaction and investigated the clinical relevance of the synergy by exploring
the dynamics and kinetics of the response.
Conducting an extensive biophysical analysis of the interaction between
HMGB1 and IL-1β using NMR methodologies. The experiments described in
Chapter 5 were undertaken to test the hypothesis that HMGB1 and IL-1β
directly interact to form a binary pro-inflammatory complex. These are the
first biophysical studies to investigate the interaction between HMGB1 and
IL-1β.

Chapter 6
152
The findings from these studies help to clarify the pro-inflammatory function of
HMGB1 and are relevant to multiple inflammatory diseases where HMGB1 has been
implicated as a pathogenic mediator.
6.2. HMGB1 AS AN INFLAMMATORY MEDIATOR OF DILI
There is an ever increasing awareness of the involvement of innate immunological
responses during DILI. It is now widely accepted that DAMPs are released as a
direct consequence of hepatic cellular dysfunction and death in response to a toxic
insult. Amongst all DAMPs, HMGB1 is the most studied protein. HMGB1 drives
inflammation during tissue injury or infection and is increasingly being identified as
a pathogenic mediator of immune-mediated DILI, with elevated levels of up to 100
ng/mL reported during clinical APAP-induced hepatotoxicity (Antoine et al., 2012;
Antoine et al., 2013). Additionally, HMGB1-targeted therapies have been reported to
be beneficial in experimental animal models of DILI. Neutralising HMGB1
antibodies reduce hepatic inflammation and increase survival during APAP-induced
DILI (Antoine et al., 2010), although the clinical potential of HMGB1-inhibition in
hepatotoxicity is, as yet, unknown.
The renewed interest in HMGB1 biology has driven the need for a large quantity of
recombinant HMGB1 protein. To facilitate this work, Chapter 3 describes the
development and optimisation of methods for the production of recombinant
HMGB1, Δ30, A box, B box and IL-1β proteins. To enable further cellular and
biophysical studies in Chapters 4 and 5, the recombinant proteins were both LPS free
and isotopically-labelled. To our knowledge, at the start of this work no other study
had considered both of these factors when producing recombinant HMGB1 proteins.
Extracellular HMGB1 has been reported to act in synergy with multiple un-related
endogenous and exogenous molecules to modulate the inflammatory response (Table
6.14). These interactions are ligand-specific as HMGB1 does not act synergistically
with TNFα, RANKL, IL-18 or PolyI:C (Hreggvidsdottir et al., 2009). HMGB1
interactions with IL-1β, IL-1α, LPS and CpG-ODN are pro-inflammatory promoting
the production and release of multiple cytokine mediators including IL-6, IL-8, TNF
and MMP (Hreggvidsdottir et al., 2009; Wähämaa et al., 2011).
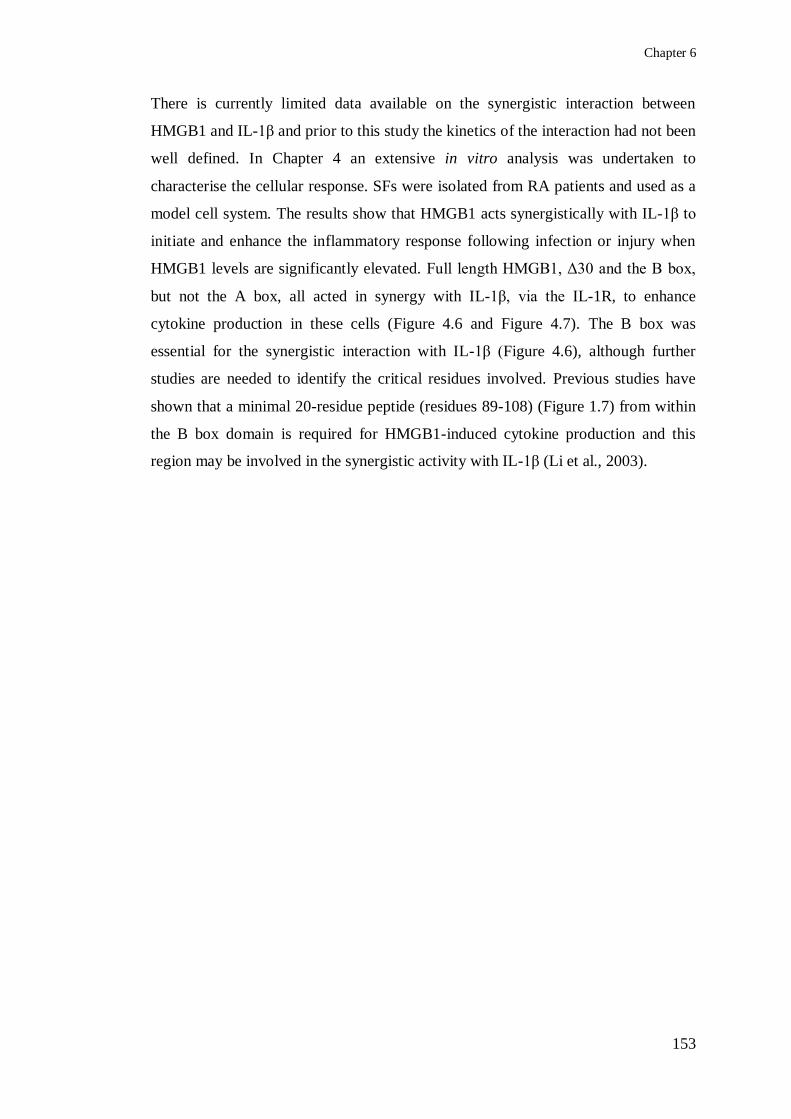
Chapter 6
153
There is currently limited data available on the synergistic interaction between
HMGB1 and IL-1β and prior to this study the kinetics of the interaction had not been
well defined. In Chapter 4 an extensive in vitro analysis was undertaken to
characterise the cellular response. SFs were isolated from RA patients and used as a
model cell system. The results show that HMGB1 acts synergistically with IL-1β to
initiate and enhance the inflammatory response following infection or injury when
HMGB1 levels are significantly elevated. Full length HMGB1, Δ30 and the B box,
but not the A box, all acted in synergy with IL-1β, via the IL-1R, to enhance
cytokine production in these cells (Figure 4.6 and Figure 4.7). The B box was
essential for the synergistic interaction with IL-1β (Figure 4.6), although further
studies are needed to identify the critical residues involved. Previous studies have
shown that a minimal 20-residue peptide (residues 89-108) (Figure 1.7) from within
the B box domain is required for HMGB1-induced cytokine production and this
region may be involved in the synergistic activity with IL-1β (Li et al., 2003).

Chapter 6
154
Table 6.14 Overview of the key synergistic interactions of the HMGB1 protein HMGB1 interacts with multiple molecules to modulate the
inflammatory response. The main findings from the work presented in this thesis are shown in the boxed region.
Partner molecule Key findings Receptor Relevance of
PTMs Key reference(s)
PRO-INFLAMMATORY
LPS Enhances cytokine production
LPS interacts with A and B boxes
Alternative LBP-binding protein
TLR4 (Youn et al., 2008;
Hreggvidsdottir et al.,
2009; Wähämaa et al.,
2011; Youn et al., 2011)
IL-1β Enhances cytokine production
B box domain of HMGB1 is critical
Not due to the formation of a pro-
inflammatory binary complex
Mediated via an alternative cellular
mechanism
IL-1R Redox independent Chapter 4 & 5
(Hreggvidsdottir et al.,
2009; Hreggvidsdottir et
al., 2011; Wähämaa et
al., 2011)
IL-1α Enhances cytokine production IL-1R (Wähämaa et al., 2011)
CXCL12 Promotes the recruitment of inflammatory
cells to damaged tissue
HMGB1 forms a heterocomplex with
CXCL12 as shown by NMR
CXCR4 CXCL12 binds
fully reduced
HMGB1
(Schiraldi et al., 2012)
Nucleosomes Enhance cytokine production
Increases expression of co-stimulatory
molecules on macrophages and dendritic cells
TLR2 (Urbonaviciute et al.,
2008)
Nucleic acids Enhances cytokine production TLR9 (Ivanov et al., 2007)
ANTI-INFLAMMATORY
CD24/Siglec-10 Ternary complex (HMGB1/CD24/Siglec-10)
Negatively regulates HMGB1-induced NF-κB
activation and cytokine production
CD24/Siglec-10 (Chen et al., 2009)
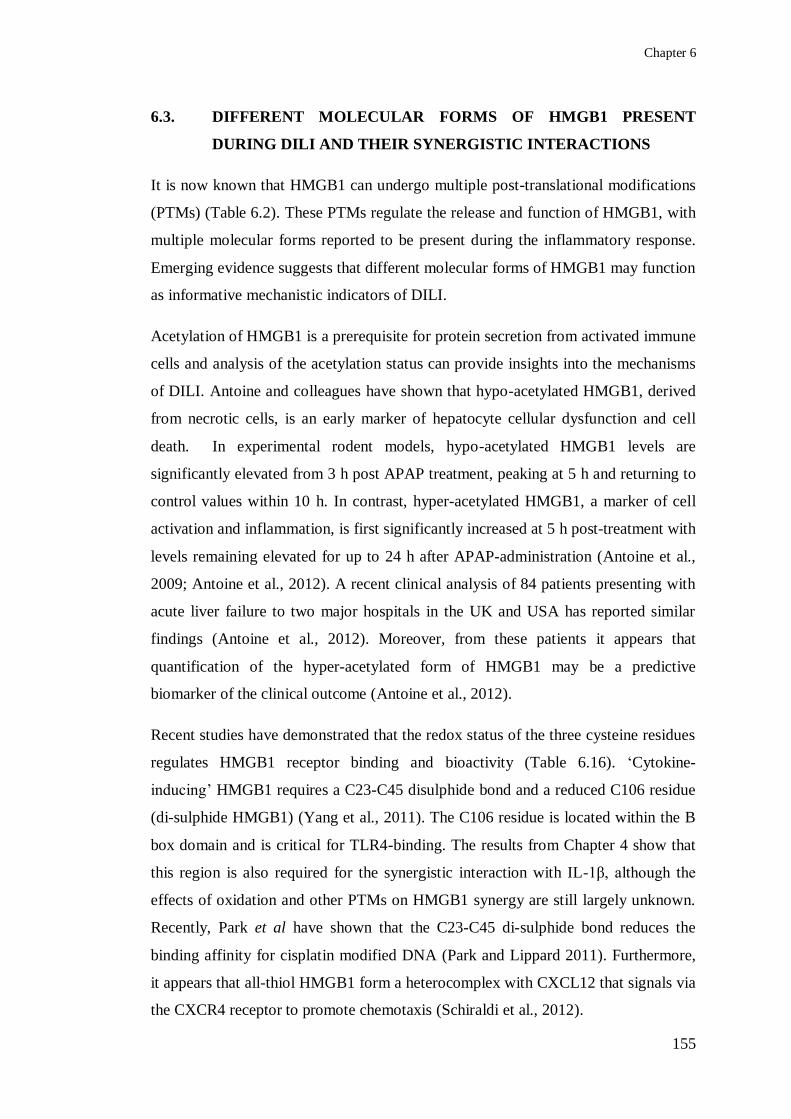
Chapter 6
155
6.3. DIFFERENT MOLECULAR FORMS OF HMGB1 PRESENT
DURING DILI AND THEIR SYNERGISTIC INTERACTIONS
It is now known that HMGB1 can undergo multiple post-translational modifications
(PTMs) (Table 6.2). These PTMs regulate the release and function of HMGB1, with
multiple molecular forms reported to be present during the inflammatory response.
Emerging evidence suggests that different molecular forms of HMGB1 may function
as informative mechanistic indicators of DILI.
Acetylation of HMGB1 is a prerequisite for protein secretion from activated immune
cells and analysis of the acetylation status can provide insights into the mechanisms
of DILI. Antoine and colleagues have shown that hypo-acetylated HMGB1, derived
from necrotic cells, is an early marker of hepatocyte cellular dysfunction and cell
death. In experimental rodent models, hypo-acetylated HMGB1 levels are
significantly elevated from 3 h post APAP treatment, peaking at 5 h and returning to
control values within 10 h. In contrast, hyper-acetylated HMGB1, a marker of cell
activation and inflammation, is first significantly increased at 5 h post-treatment with
levels remaining elevated for up to 24 h after APAP-administration (Antoine et al.,
2009; Antoine et al., 2012). A recent clinical analysis of 84 patients presenting with
acute liver failure to two major hospitals in the UK and USA has reported similar
findings (Antoine et al., 2012). Moreover, from these patients it appears that
quantification of the hyper-acetylated form of HMGB1 may be a predictive
biomarker of the clinical outcome (Antoine et al., 2012).
Recent studies have demonstrated that the redox status of the three cysteine residues
regulates HMGB1 receptor binding and bioactivity (Table 6.16). ‘Cytokine-
inducing’ HMGB1 requires a C23-C45 disulphide bond and a reduced C106 residue
(di-sulphide HMGB1) (Yang et al., 2011). The C106 residue is located within the B
box domain and is critical for TLR4-binding. The results from Chapter 4 show that
this region is also required for the synergistic interaction with IL-1β, although the
effects of oxidation and other PTMs on HMGB1 synergy are still largely unknown.
Recently, Park et al have shown that the C23-C45 di-sulphide bond reduces the
binding affinity for cisplatin modified DNA (Park and Lippard 2011). Furthermore,
it appears that all-thiol HMGB1 form a heterocomplex with CXCL12 that signals via
the CXCR4 receptor to promote chemotaxis (Schiraldi et al., 2012).
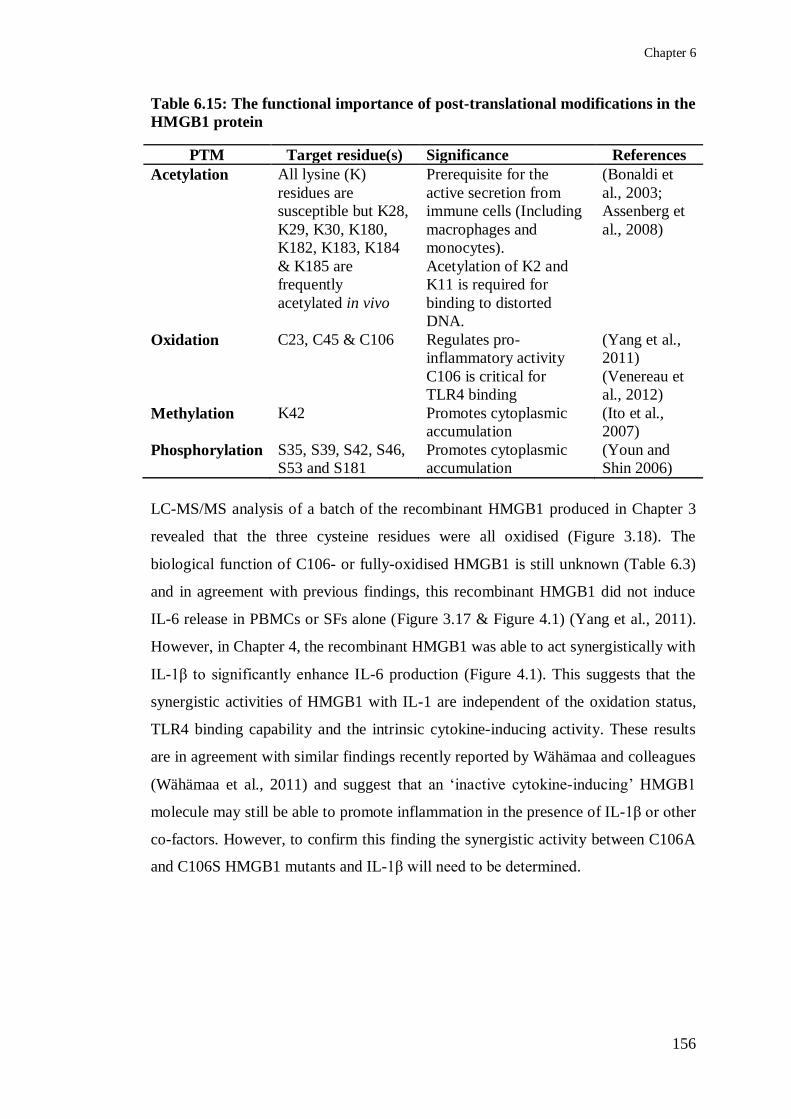
Chapter 6
156
Table 6.15: The functional importance of post-translational modifications in the
HMGB1 protein
PTM Target residue(s) Significance References
Acetylation All lysine (K)
residues are
susceptible but K28,
K29, K30, K180,
K182, K183, K184
& K185 are
frequently
acetylated in vivo
Prerequisite for the
active secretion from
immune cells (Including
macrophages and
monocytes).
Acetylation of K2 and
K11 is required for
binding to distorted
DNA.
(Bonaldi et
al., 2003;
Assenberg et
al., 2008)
Oxidation C23, C45 & C106 Regulates pro-
inflammatory activity
C106 is critical for
TLR4 binding
(Yang et al.,
2011)
(Venereau et
al., 2012)
Methylation K42 Promotes cytoplasmic
accumulation
(Ito et al.,
2007)
Phosphorylation S35, S39, S42, S46,
S53 and S181
Promotes cytoplasmic
accumulation
(Youn and
Shin 2006)
LC-MS/MS analysis of a batch of the recombinant HMGB1 produced in Chapter 3
revealed that the three cysteine residues were all oxidised (Figure 3.18). The
biological function of C106- or fully-oxidised HMGB1 is still unknown (Table 6.3)
and in agreement with previous findings, this recombinant HMGB1 did not induce
IL-6 release in PBMCs or SFs alone (Figure 3.17 & Figure 4.1) (Yang et al., 2011).
However, in Chapter 4, the recombinant HMGB1 was able to act synergistically with
IL-1β to significantly enhance IL-6 production (Figure 4.1). This suggests that the
synergistic activities of HMGB1 with IL-1 are independent of the oxidation status,
TLR4 binding capability and the intrinsic cytokine-inducing activity. These results
are in agreement with similar findings recently reported by Wähämaa and colleagues
(Wähämaa et al., 2011) and suggest that an ‘inactive cytokine-inducing’ HMGB1
molecule may still be able to promote inflammation in the presence of IL-1β or other
co-factors. However, to confirm this finding the synergistic activity between C106A
and C106S HMGB1 mutants and IL-1β will need to be determined.

Chapter 6
157
Table 6.16 Redox-state dependent functions of HMGB1 released during DILI Table adapted from (Yang et al., 2013).
Molecular form
Role in DILI
Source Schematic representation
Cytokine-
inducing
(TLR4 binding)
Chemoattractant
activity
All-thiol HMGB1
Promotes resolution
and regeneration
Necrosis
No Yes
Di-sulphide
HMGB1
Promotes
Inflammation
Necrosis and
pyroptosis
Yes No
C106-oxidised
HMGB1
Unknown function Apoptosis
No No
Fully-oxidised
HMGB1
Unknown function Apoptosis
No No

Chapter 6
158
6.4. EXPLORING THE INTERACTION BETWEEN HMGB1 AND IL-1Β
Biophysical analysis of the interaction between HMGB1 and IL-1β is not available
within the current literature, although several publications have alluded to the
formation of a pro-inflammatory binary complex. Protein NMR spectroscopy is a
powerful technique used to investigate intermolecular interactions. In Chapter 5, an
extensive biophysical analysis of the interaction between HMGB1 and IL-1β was
conducted using NMR methodologies. The NMR findings conclusively show that
HMGB1 and IL-1β do not directly interact to form a binary complex, under the
conditions employed in these experiments. Despite the fact that the full length
HMGB1, Δ30 and B box proteins had all been shown to act synergistically with IL-
1β in the cellular assays described in Chapter 4 (Figure 4.6). This suggests that
HMGB1 and IL-1β act via an alternative mode of action to synergistically enhance
cytokine production during inflammation, although further studies are required to
identify this pathway. Moreover, the results indicate that additional proteins involved
in IL-1 signalling may be required for the synergistic interaction
6.5. FUTURE INVESTIGATIONS; ELUCIDATING THE MECHANISM
OF ACTION FOR HMGB1/IL-1Β SYNERGY
Future studies will investigate alternative mechanisms that may mediate the
synergistic activity between HMGB1 and IL-1β. The findings presented in this thesis
suggest that the interaction may require additional proteins. One possibility is that
HMGB1 may form a ternary complex with IL-1β and the IL-1R or IL-1RAcP
(Figure 6.42). It has recently been reported that HMGB1 forms a similar trimolecular
complex with CD24, a glycosylated GDP-anchored membrane protein, and Siglec10
(or the mouse homologue Siglec-G), an inhibitory membrane receptor (Chen et al.,
2009). It has been proposed that HMGB1 and CD24 first form a binary complex
which, in turn, interacts with Siglec10. Chen et al have shown that the B box domain
of HMGB1 is critical for this interaction. However, further biophysical experiments
are needed to elucidate the specific binding site. In contrast, to the synergy between
HMGB1 and IL-1β the ternary complex with CD24 and Siglec10 is anti-
inflammatory, with the CD24 and Siglec10 proteins suppressing HMGB1-mediated
NF-κB activation. Recent studies have shown that the HMGB1/CD24/Siglec10
pathway protects against DILI and sepsis with CD24 and SiglecG knockout mice

Chapter 6
159
displaying an increased susceptibility to APAP-induced hepatotoxicity (Chen et al.,
2009; Chen et al., 2011). This appears to be due to enhanced intracellular signalling
in the absence of CD24 and SiglecG and administration of HMGB1-antibodies is
beneficial in these models. This demonstrates a critical role for CD24 and Siglec10
in dampening the immune response to HMGB1. In contrast, a similar ternary
complex between HMGB1, IL-1β and the IL-1R or IL-1RAcP would be pro-
inflammatory, promoting inflammation in response to a toxic insult.
Additionally, it is also possible that HMGB1 may form a ternary complex with an
alternative cellular protein prior to the interaction with the IL-1R receptor (Figure
6.42). This may result in enhanced intra-cellular signalling when compared IL-1β
signalling alone. However, further experiments are required to test these hypotheses.

Chapter 6
160
Figure 6.42 Overview of the potential mechanisms that may mediate the
synergistic activity between HMGB1 and IL-1β The potential mechanism that has
been investigated in this work is shown in the red box region. Based on the findings
presented in this thesis, this mechanism can be excluded. Future experiments will
investigate alternative mechanisms of action as outlined in the black box regions.
6.6. CONCLUDING REMARKS
In summary, the work presented in this thesis has used combined cellular and NMR
methodologies to characterise the synergistic interaction between HMGB1 and IL-
1β. The results show that the two proteins act synergistically to enhance cytokine
production during the inflammatory response. Furthermore, these findings
demonstrate that the B box domain of HMGB1 is critical for this effect. However,
this is not due to the formation of a binary complex between HMGB1 and IL-1β, as
shown by the NMR experiments. Instead, it appears that this occurs via an
alternative cellular mechanism in which HMGB1 is required and other molecules
may be involved. Future work will focus on identifying these other proteins. Overall

Chapter 6
161
these studies help to clarify the pro-inflammatory role of extracellular HMGB1
released from stressed or dying hepatocytes during DILI. Moreover, these findings
are relevant to multiple inflammatory diseases, where HMGB1 has been implicated
as an important pathogenic mediator.

BIBLIOGRAPHY
Bibliography
163
Agresti, A. and Bianchi, M. E. (2003). "HMGB proteins and gene expression." Curr
Opin Genet Dev 13(2): 170-178.
Aida, Y. and Pabst, M. J. (1990). "Removal of endotoxin from protein solutions by
phase separation using Triton X-114." J Immunol Methods 132(2): 191-195.
Alnemri, E. S., Livingston, D. J., Nicholson, D. W., Salvesen, G., Thornberry, N. A.,
Wong, W. W. and Yuan, J. (1996). "Human ICE/CED-3 protease
nomenclature." Cell 87(2): 171.
Andersson, U. and Tracey, K. J. (2011). "HMGB1 is a therapeutic target for sterile
inflammation and infection." Annu Rev Immunol 29: 139-162.
Andersson, U., Wang, H., Palmblad, K., Aveberger, A. C., Bloom, O., Erlandsson-
Harris, H., Janson, A., Kokkola, R., Zhang, M., Yang, H. and Tracey, K. J.
(2000). "High mobility group 1 protein (HMG-1) stimulates proinflammatory
cytokine synthesis in human monocytes." J Exp Med 192(4): 565-570.
Andrassy, M., Volz, H. C., Igwe, J. C., Funke, B., Eichberger, S. N., Kaya, Z., Buss,
S., Autschbach, F., Pleger, S. T., Lukic, I. K., Bea, F., Hardt, S. E., Humpert,
P. M., Bianchi, M. E., Mairbäurl, H., Nawroth, P. P., Remppis, A., Katus, H.
A. and Bierhaus, A. (2008). "High-Mobility Group Box-1 in Ischemia-
Reperfusion Injury of the Heart." Circulation 117(25): 3216-3226.
Antoine, D. J., Dear, J. W., Lewis, P. S., Platt, V., Coyle, J., Masson, M.,
Thanacoody, R. H., Gray, A. J., Webb, D. J., Moggs, J. G., Bateman, D. N.,
Goldring, C. E. and Park, B. K. (2013). "Mechanistic biomarkers provide
early and sensitive detection of acetaminophen-induced acute liver injury at
first presentation to hospital." Hepatology 58(2): 777-787.
Antoine, D. J., Jenkins, R. E., Dear, J. W., Williams, D. P., McGill, M. R., Sharpe,
M. R., Craig, D. G., Simpson, K. J., Jaeschke, H. and Park, B. K. (2012).
"Molecular forms of HMGB1 and keratin-18 as mechanistic biomarkers for
mode of cell death and prognosis during clinical acetaminophen
hepatotoxicity." J Hepatol 56(5): 1070-1079.
Antoine, D. J., Williams, D. P., Kipar, A., Jenkins, R. E., Regan, S. L., Sathish, J. G.,
Kitteringham, N. R. and Park, B. K. (2009). "High Mobility Group Box-1
protein and Keratin-18, circulating serum proteins informative of
acetaminophen-induced necrosis and apoptosis in vivo." Toxicol. Sci.:
kfp235.
Antoine, D. J., Williams, D. P., Kipar, A., Laverty, H. and Park, B. K. (2010). "Diet
restriction inhibits apoptosis and HMGB1 oxidation and promotes
inflammatory cell recruitment during acetaminophen hepatotoxicity." Mol
Med 16(11-12): 479-490.
Arend, W. P., Welgus, H. G., Thompson, R. C. and Eisenberg, S. P. (1990).
"Biological properties of recombinant human monocyte-derived interleukin 1
receptor antagonist." J Clin Invest 85(5): 1694-1697.

Bibliography
164
Assenberg, R., Webb, M., Connolly, E., Stott, K., Watson, M., Hobbs, J. and
Thomas, J. O. (2008). "A critical role in structure-specific DNA binding for
the acetylatable lysine residues in HMGB1." Biochem J 411(3): 553-561.
Barnes, P. J. and Karin, M. (1997). "Nuclear factor-kappaB: a pivotal transcription
factor in chronic inflammatory diseases." N Engl J Med 336(15): 1066-1071.
Bausinger, H., Lipsker, D., Ziylan, U., Manie, S., Briand, J. P., Cazenave, J. P.,
Muller, S., Haeuw, J. F., Ravanat, C., de la Salle, H. and Hanau, D. (2002).
"Endotoxin-free heat-shock protein 70 fails to induce APC activation." Eur J
Immunol 32(12): 3708-3713.
Bernal, W., Cross, T. J., Auzinger, G., Sizer, E., Heneghan, M. A., Bowles, M.,
Muiesan, P., Rela, M., Heaton, N., Wendon, J. and O'Grady, J. G. (2009).
"Outcome after wait-listing for emergency liver transplantation in acute liver
failure: a single centre experience." J Hepatol 50(2): 306-313.
Beutler, B., Milsark, I. W. and Cerami, A. C. (1985). "Passive immunization against
cachectin/tumor necrosis factor protects mice from lethal effect of
endotoxin." Science 229(4716): 869-871.
Beutler, B. and Rietschel, E. T. (2003). "Innate immune sensing and its roots: the
story of endotoxin." Nat Rev Immunol 3(2): 169-176.
Bianchi, M. E. (1991). "Production of functional rat HMG1 protein in Escherichia
coli." Gene 104(2): 271-275.
Blazka, M. E., Wilmer, J. L., Holladay, S. D., Wilson, R. E. and Luster, M. I. (1995).
"Role of proinflammatory cytokines in acetaminophen hepatotoxicity."
Toxicol Appl Pharmacol 133(1): 43-52.
Bonaldi, T., Langst, G., Strohner, R., Becker, P. B. and Bianchi, M. E. (2002). "The
DNA chaperone HMGB1 facilitates ACF/CHRAC-dependent nucleosome
sliding." EMBO J 21(24): 6865-6873.
Bonaldi, T., Talamo, F., Scaffidi, P., Ferrera, D., Porto, A., Bachi, A., Rubartelli, A.,
Agresti, A. and Bianchi, M. E. (2003). "Monocytic cells hyperacetylate
chromatin protein HMGB1 to redirect it towards secretion." EMBO J 22(20):
5551-5560.
Bourdi, M., Eiras, D. P., Holt, M. P., Webster, M. R., Reilly, T. P., Welch, K. D. and
Pohl, L. R. (2007). "Role of IL-6 in an IL-10 and IL-4 double knockout
mouse model uniquely susceptible to acetaminophen-induced liver injury."
Chem Res Toxicol 20(2): 208-216.
Bourdi, M., Tinel, M., Beaune, P. H. and Pessayre, D. (1994). "Interactions of
dihydralazine with cytochromes P4501A: a possible explanation for the
appearance of anti-cytochrome P4501A2 autoantibodies." Mol Pharmacol
45(6): 1287-1295.
Buchweitz, J. P., Ganey, P. E., Bursian, S. J. and Roth, R. A. (2002). "Underlying
endotoxemia augments toxic responses to chlorpromazine: is there a
relationship to drug idiosyncrasy?" J Pharmacol Exp Ther 300(2): 460-467.

Bibliography
165
Bulera, S. J., Birge, R. B., Cohen, S. D. and Khairallah, E. A. (1995). "Identification
of the mouse liver 44-kDa acetaminophen-binding protein as a subunit of
glutamine synthetase." Toxicol Appl Pharmacol 134(2): 313-320.
Burns, K., Clatworthy, J., Martin, L., Martinon, F., Plumpton, C., Maschera, B.,
Lewis, A., Ray, K., Tschopp, J. and Volpe, F. (2000). "Tollip, a new
component of the IL-1RI pathway, links IRAK to the IL-1 receptor." Nat Cell
Biol 2(6): 346-351.
Bustin, M. (2001). "Revised nomenclature for high mobility group (HMG)
chromosomal proteins." Trends in Biochemical Sciences 26(3): 152-153.
Bustin, M., Hopkins, R. B. and Isenberg, I. (1978). "Immunological relatedness of
high mobility group chromosomal proteins from calf thymus." J Biol Chem
253(5): 1694-1699.
Calogero, S., Grassi, F., Aguzzi, A., Voigtlander, T., Ferrier, P., Ferrari, S. and
Bianchi, M. E. (1999). "The lack of chromosomal protein Hmg1 does not
disrupt cell growth but causes lethal hypoglycaemia in newborn mice." Nat
Genet 22(3): 276-280.
Cato, L., Stott, K., Watson, M. and Thomas, J. O. (2008). "The Interaction of
HMGB1 and Linker Histones Occurs Through their Acidic and Basic Tails."
Journal of Molecular Biology 384(5): 1262-1272.
Cato, L., Stott, K., Watson, M. and Thomas, J. O. (2008). "The interaction of
HMGB1 and linker histones occurs through their acidic and basic tails." J
Mol Biol 384(5): 1262-1272.
Cavanagh, J., Fairbrother, W. J. and Palmer, A. G., III (2006). Protein NMR
Spectroscopy : Principles and Practice. Burlington, MA, USA, Academic
Press.
Celona, B., Weiner, A., Di Felice, F., Mancuso, F. M., Cesarini, E., Rossi, R. L.,
Gregory, L., Baban, D., Rossetti, G., Grianti, P., Pagani, M., Bonaldi, T.,
Ragoussis, J., Friedman, N., Camilloni, G., Bianchi, M. E. and Agresti, A.
(2011). "Substantial histone reduction modulates genomewide nucleosomal
occupancy and global transcriptional output." PLoS Biol 9(6): e1001086.
Chen, C. J., Kono, H., Golenbock, D., Reed, G., Akira, S. and Rock, K. L. (2007).
"Identification of a key pathway required for the sterile inflammatory
response triggered by dying cells." Nat Med 13(7): 851-856.
Chen, G.-Y., Chen, X., King, S., Cavassani, K. A., Cheng, J., Zheng, X., Cao, H.,
Yu, H., Qu, J., Fang, D., Wu, W., Bai, X.-F., Liu, J.-Q., Woodiga, S. A.,
Chen, C., Sun, L., Hogaboam, C. M., Kunkel, S. L., Zheng, P. and Liu, Y.
(2011). "Amelioration of sepsis by inhibiting sialidase-mediated disruption of
the CD24-SiglecG interaction." Nat Biotech 29(5): 428-435.
Chen, G., Li, J., Ochani, M., Rendon-Mitchell, B., Qiang, X., Susarla, S., Ulloa, L.,
Yang, H., Fan, S., Goyert, S. M., Wang, P., Tracey, K. J., Sama, A. E. and
Wang, H. (2004). "Bacterial endotoxin stimulates macrophages to release

Bibliography
166
HMGB1 partly through CD14- and TNF-dependent mechanisms." J Leukoc
Biol 76(5): 994-1001.
Chen, G. Y., Tang, J., Zheng, P. and Liu, Y. (2009). "CD24 and Siglec-10
selectively repress tissue damage-induced immune responses." Science
323(5922): 1722-1725.
Chiu, J., March, P. E., Lee, R. and Tillett, D. (2004). "Site-directed, Ligase-
Independent Mutagenesis (SLIM): a single-tube methodology approaching
100% efficiency in 4 h." Nucleic Acids Research 32(21): e174.
Clubb, R. T., Thanabal, V. and Wagner, G. (1992). "A constant-time three-
dimensional triple-resonance pulse scheme to correlate intraresidue 1HN,
15N, and 13C′ chemical shifts in 15N 13C-labelled proteins." Journal of
Magnetic Resonance (1969) 97(1): 213-217.
Cox, K. H., Cox, M. E., Woo-Rasberry, V. and Hasty, D. L. (2012). "Pathways
involved in the synergistic activation of macrophages by lipoteichoic acid
and hemoglobin." PLoS One 7(10): e47333.
Craig, D. G., Lee, P., Pryde, E. A., Masterton, G. S., Hayes, P. C. and Simpson, K. J.
(2011). "Circulating apoptotic and necrotic cell death markers in patients
with acute liver injury." Liver Int 31(8): 1127-1136.
Czura, C. J., Wang, H. and Tracey, K. J. (2001). "Dual roles for HMGB1: DNA
binding and cytokine." J Endotoxin Res 7(4): 315-321.
Dahlin, D. C., Miwa, G. T., Lu, A. Y. and Nelson, S. D. (1984). "N-acetyl-p-
benzoquinone imine: a cytochrome P-450-mediated oxidation product of
acetaminophen." Proc Natl Acad Sci U S A 81(5): 1327-1331.
Deng, X., Stachlewitz, R. F., Liguori, M. J., Blomme, E. A., Waring, J. F.,
Luyendyk, J. P., Maddox, J. F., Ganey, P. E. and Roth, R. A. (2006). "Modest
inflammation enhances diclofenac hepatotoxicity in rats: role of neutrophils
and bacterial translocation." J Pharmacol Exp Ther 319(3): 1191-1199.
Dinarello, C. A. (1991). "Interleukin-1 and interleukin-1 antagonism." Blood 77(8):
1627-1652.
Dinarello, C. A. (1996). "Biologic basis for interleukin-1 in disease." Blood 87(6):
2095-2147.
Dinarello, C. A. (2011). "Interleukin-1 in the pathogenesis and treatment of
inflammatory diseases." Blood 117(14): 3720-3732.
Dintilhac, A. and Bernués, J. (2002). "HMGB1 Interacts with Many Apparently
Unrelated Proteins by Recognizing Short Amino Acid Sequences." Journal
of Biological Chemistry 277(9): 7021-7028.
Driscoll, P. C., Clore, G. M., Marion, D., Wingfield, P. T. and Gronenborn, A. M.
(1990). "Complete resonance assignment for the polypeptide backbone of
interleukin 1.beta. using three-dimensional heteronuclear NMR
spectroscopy." Biochemistry 29(14): 3542-3556.

Bibliography
167
Dumitriu, I. E., Baruah, P., Valentinis, B., Voll, R. E., Herrmann, M., Nawroth, P.
P., Arnold, B., Bianchi, M. E., Manfredi, A. A. and Rovere-Querini, P.
(2005). "Release of High Mobility Group Box 1 by Dendritic Cells Controls
T Cell Activation via the Receptor for Advanced Glycation End Products."
The Journal of Immunology 174(12): 7506-7515.
Eder, C. (2009). "Mechanisms of interleukin-1beta release." Immunobiology 214(7):
543-553.
Erridge, C., Bennett-Guerrero, E. and Poxton, I. R. (2002). "Structure and function
of lipopolysaccharides." Microbes Infect 4(8): 837-851.
Ferhani, N., Letuve, S., Kozhich, A., Thibaudeau, O., Grandsaigne, M., Maret, M.,
Dombret, M. C., Sims, G. P., Kolbeck, R., Coyle, A. J., Aubier, M. and
Pretolani, M. (2010). "Expression of high-mobility group box 1 and of
receptor for advanced glycation end products in chronic obstructive
pulmonary disease." Am J Respir Crit Care Med 181(9): 917-927.
Ferrari, S., Finelli, P., Rocchi, M. and Bianchi, M. E. (1996). "The Active Gene That
Encodes Human High Mobility Group 1 Protein (HMG1) Contains Introns
and Maps to Chromosome 13." Genomics 35(2): 367-371.
Frei, K., Malipiero, U. V., Leist, T. P., Zinkernagel, R. M., Schwab, M. E. and
Fontana, A. (1989). "On the cellular source and function of interleukin 6
produced in the central nervous system in viral diseases." Eur J Immunol
19(4): 689-694.
Gallucci, S. and Matzinger, P. (2001). "Danger signals: SOS to the immune system."
Curr Opin Immunol 13(1): 114-119.
Gao, B. and Tsan, M. F. (2003). "Endotoxin contamination in recombinant human
heat shock protein 70 (Hsp70) preparation is responsible for the induction of
tumor necrosis factor alpha release by murine macrophages." J Biol Chem
278(1): 174-179.
Gao, B. and Tsan, M. F. (2003). "Recombinant human heat shock protein 60 does
not induce the release of tumor necrosis factor alpha from murine
macrophages." J Biol Chem 278(25): 22523-22529.
Gao, H. M., Zhou, H., Zhang, F., Wilson, B. C., Kam, W. and Hong, J. S. (2011).
"HMGB1 acts on microglia Mac1 to mediate chronic neuroinflammation that
drives progressive neurodegeneration." J Neurosci 31(3): 1081-1092.
Garcia-Arnandis, I., Guillen, M. I., Gomar, F., Pelletier, J. P., Martel-Pelletier, J. and
Alcaraz, M. J. (2010). "High mobility group box 1 potentiates the pro-
inflammatory effects of interleukin-1beta in osteoarthritic synoviocytes."
Arthritis Res Ther 12(4): R165.
Gauldie, J., Richards, C., Harnish, D., Lansdorp, P. and Baumann, H. (1987).
"Interferon beta 2/B-cell stimulatory factor type 2 shares identity with
monocyte-derived hepatocyte-stimulating factor and regulates the major
acute phase protein response in liver cells." Proc Natl Acad Sci U S A 84(20):
7251-7255.

Bibliography
168
Gay, N. J. and Keith, F. J. (1991). "Drosophila Toll and IL-1 receptor." Nature
351(6325): 355-356.
Goodwin, G. H., Sanders, C. and Johns, E. W. (1973). "A new group of chromatin-
associated proteins with a high content of acidic and basic amino acids." Eur
J Biochem 38(1): 14-19.
Grattagliano, I., Portincasa, P., Palmieri, V. O. and Palasciano, G. (2002). "Overview
on the mechanisms of drug-induced liver cell death." Ann Hepatol 1(4): 162-
168.
Greenfeder, S. A., Nunes, P., Kwee, L., Labow, M., Chizzonite, R. A. and Ju, G.
(1995). "Molecular cloning and characterization of a second subunit of the
interleukin 1 receptor complex." J Biol Chem 270(23): 13757-13765.
Grzesiek, S. and Bax, A. (1992). "Correlating backbone amide and side chain
resonances in larger proteins by multiple relayed triple resonance NMR."
Journal of the American Chemical Society 114(16): 6291-6293.
Grzesiek, S. and Bax, A. (1992). "An efficient experiment for sequential backbone
assignment of medium-sized isotopically enriched proteins." Journal of
Magnetic Resonance (1969) 99(1): 201-207.
Gunaratnam, N. T., Benson, J., Gandolfi, A. J. and Chen, M. (1995). "Suspected
isoflurane hepatitis in an obese patient with a history of halothane hepatitis."
Anesthesiology 83(6): 1361-1364.
Halmes, N. C., Hinson, J. A., Martin, B. M. and Pumford, N. R. (1996). "Glutamate
dehydrogenase covalently binds to a reactive metabolite of acetaminophen."
Chem Res Toxicol 9(2): 541-546.
Hanahan, D. (1983). "Studies on transformation of Escherichia coli with plasmids." J
Mol Biol 166(4): 557-580.
Hardman, C. H., Broadhurst, R. W., Raine, A. R., Grasser, K. D., Thomas, J. O. and
Laue, E. D. (1995). "Structure of the A-domain of HMG1 and its interaction
with DNA as studied by heteronuclear three- and four-dimensional NMR
spectroscopy." Biochemistry 34(51): 16596-16607.
Harris, H. E., Andersson, U. and Pisetsky, D. S. (2012). "HMGB1: a multifunctional
alarmin driving autoimmune and inflammatory disease." Nat Rev Rheumatol
8(4): 195-202.
Harris, H. E. and Raucci, A. (2006). "Alarmin(g) news about danger." Embo Reports
7(8): 774-778.
Hawton, K., Ware, C., Mistry, H., Hewitt, J., Kingsbury, S., Roberts, D. and Weitzel,
H. (1995). "Why patients choose paracetamol for self poisoning and their
knowledge of its dangers." BMJ 310(6973): 164.
Hirano, T., Taga, T., Nakano, N., Yasukawa, K., Kashiwamura, S., Shimizu, K.,
Nakajima, K., Pyun, K. H. and Kishimoto, T. (1985). "Purification to
homogeneity and characterization of human B-cell differentiation factor
(BCDF or BSFp-2)." Proc Natl Acad Sci U S A 82(16): 5490-5494.

Bibliography
169
Hochuli, E., Bannwarth, W., Dobeli, H., Gentz, R. and Stuber, D. (1988). "Genetic
Approach to Facilitate Purification of Recombinant Proteins with a Novel
Metal Chelate Adsorbent." Nat Biotech 6(11): 1321-1325.
Holt, M. P. and Ju, C. (2006). "Mechanisms of drug-induced liver injury." AAPS J
8(1): E48-54.
Hoque, R., Farooq, A. and Mehal, W. Z. (2013). "Sterile inflammation in the liver
and pancreas." J Gastroenterol Hepatol 28 Suppl 1: 61-67.
Hori, O., Brett, J., Slattery, T., Cao, R., Zhang, J., Chen, J. X., Nagashima, M.,
Lundh, E. R., Vijay, S., Nitecki, D. and et al. (1995). "The receptor for
advanced glycation end products (RAGE) is a cellular binding site for
amphoterin. Mediation of neurite outgrowth and co-expression of rage and
amphoterin in the developing nervous system." J Biol Chem 270(43): 25752-
25761.
Hoshino, K., Takeuchi, O., Kawai, T., Sanjo, H., Ogawa, T., Takeda, Y., Takeda, K.
and Akira, S. (1999). "Cutting edge: Toll-like receptor 4 (TLR4)-deficient
mice are hyporesponsive to lipopolysaccharide: evidence for TLR4 as the
Lps gene product." J Immunol 162(7): 3749-3752.
Hreggvidsdottir, H. S., Lundberg, A. M., Aveberger, A. C., Klevenvall, L.,
Andersson, U. and Harris, H. E. (2011). "HMGB1-partner molecule
complexes enhance cytokine production by signaling through the partner
molecule receptor." Mol Med.
Hreggvidsdottir, H. S., Ostberg, T., Wahamaa, H., Schierbeck, H., Aveberger, A. C.,
Klevenvall, L., Palmblad, K., Ottosson, L., Andersson, U. and Harris, H. E.
(2009). "The alarmin HMGB1 acts in synergy with endogenous and
exogenous danger signals to promote inflammation." J Leukoc Biol 86(3):
655-662.
Huang, Y., Yin, H., Han, J., Huang, B., Xu, J., Zheng, F., Tan, Z., Fang, M., Rui, L.,
Chen, D., Wang, S., Zheng, X., Wang, C. Y. and Gong, F. (2007).
"Extracellular Hmgb1 Functions as an Innate Immune-Mediator Implicated
in Murine Cardiac Allograft Acute Rejection." American Journal of
Transplantation 7(4): 799-808.
Huttunen, H. J., Fages, C., Kuja-Panula, J., Ridley, A. J. and Rauvala, H. (2002).
"Receptor for advanced glycation end products-binding COOH-terminal
motif of amphoterin inhibits invasive migration and metastasis." Cancer Res
62(16): 4805-4811.
Ikebuchi, K., Wong, G. G., Clark, S. C., Ihle, J. N., Hirai, Y. and Ogawa, M. (1987).
"Interleukin 6 enhancement of interleukin 3-dependent proliferation of
multipotential hemopoietic progenitors." Proc Natl Acad Sci U S A 84(24):
9035-9039.
Ilmakunnas, M., Tukiainen, E. M., Rouhiainen, A., Rauvala, H., Arola, J., Nordin,
A., Makisalo, H., Hockerstedt, K. and Isoniemi, H. (2008). "High mobility
group box 1 protein as a marker of hepatocellular injury in human liver
transplantation." Liver Transpl 14(10): 1517-1525.

Bibliography
170
Ishida, Y., Kondo, T., Ohshima, T., Fujiwara, H., Iwakura, Y. and Mukaida, N.
(2002). "A pivotal involvement of IFN-gamma in the pathogenesis of
acetaminophen-induced acute liver injury." FASEB J 16(10): 1227-1236.
Ishihara, K. and Hirano, T. (2002). "IL-6 in autoimmune disease and chronic
inflammatory proliferative disease." Cytokine Growth Factor Rev 13(4-5):
357-368.
Ito, I., Fukazawa, J. and Yoshida, M. (2007). "Post-translational methylation of high
mobility group box 1 (HMGB1) causes its cytoplasmic localization in
neutrophils." J Biol Chem 282(22): 16336-16344.
Ivanov, S., Dragoi, A. M., Wang, X., Dallacosta, C., Louten, J., Musco, G., Sitia, G.,
Yap, G. S., Wan, Y., Biron, C. A., Bianchi, M. E., Wang, H. and Chu, W. M.
(2007). "A novel role for HMGB1 in TLR9-mediated inflammatory
responses to CpG-DNA." Blood 110(6): 1970-1981.
Iwamoto, G. K., Monick, M. M., Burmeister, L. F. and Hunninghake, G. W. (1989).
"Interleukin 1 release by human alveolar macrophages and blood
monocytes." Am J Physiol 256(5 Pt 1): C1012-1015.
Iyer, S. S., Pulskens, W. P., Sadler, J. J., Butter, L. M., Teske, G. J., Ulland, T. K.,
Eisenbarth, S. C., Florquin, S., Flavell, R. A., Leemans, J. C. and Sutterwala,
F. S. (2009). "Necrotic cells trigger a sterile inflammatory response through
the Nlrp3 inflammasome." Proc Natl Acad Sci U S A 106(48): 20388-20393.
Jahr, S., Hentze, H., Englisch, S., Hardt, D., Fackelmayer, F. O., Hesch, R. D. and
Knippers, R. (2001). "DNA fragments in the blood plasma of cancer patients:
quantitations and evidence for their origin from apoptotic and necrotic cells."
Cancer Res 61(4): 1659-1665.
James, L. P., McCullough, S. S., Lamps, L. W. and Hinson, J. A. (2003). "Effect of
N-acetylcysteine on acetaminophen toxicity in mice: relationship to reactive
nitrogen and cytokine formation." Toxicol Sci 75(2): 458-467.
Jayaraman, L., Moorthy, N. C., Murthy, K. G., Manley, J. L., Bustin, M. and Prives,
C. (1998). "High mobility group protein-1 (HMG-1) is a unique activator of
p53." Genes Dev 12(4): 462-472.
Jiang, Z., Ninomiya-Tsuji, J., Qian, Y., Matsumoto, K. and Li, X. (2002).
"Interleukin-1 (IL-1) receptor-associated kinase-dependent IL-1-induced
signaling complexes phosphorylate TAK1 and TAB2 at the plasma
membrane and activate TAK1 in the cytosol." Mol Cell Biol 22(20): 7158-
7167.
Ju, C., Reilly, T. P., Bourdi, M., Radonovich, M. F., Brady, J. N., George, J. W. and
Pohl, L. R. (2002). "Protective role of Kupffer cells in acetaminophen-
induced hepatic injury in mice." Chem Res Toxicol 15(12): 1504-1513.
Jung, Y. and Lippard, S. J. (2003). "Nature of full-length HMGB1 binding to
cisplatin-modified DNA." Biochemistry 42(9): 2664-2671.

Bibliography
171
Kaplowitz, N. (2004). "Drug-induced liver injury." Clin Infect Dis 38 Suppl 2: S44-
48.
Kaplowitz, N. (2005). "Idiosyncratic drug hepatotoxicity." Nat Rev Drug Discov
4(6): 489-499.
Kazama, H., Ricci, J. E., Herndon, J. M., Hoppe, G., Green, D. R. and Ferguson, T.
A. (2008). "Induction of immunological tolerance by apoptotic cells requires
caspase-dependent oxidation of high-mobility group box-1 protein."
Immunity 29(1): 21-32.
Kishimoto, T. (2006). "Interleukin-6: discovery of a pleiotropic cytokine." Arthritis
Res Ther 8 Suppl 2: S2.
Knapp, S., Muller, S., Digilio, G., Bonaldi, T., Bianchi, M. E. and Musco, G. (2004).
"The long acidic tail of high mobility group box 1 (HMGB1) protein forms
an extended and flexible structure that interacts with specific residues within
and between the HMG boxes." Biochemistry 43(38): 11992-11997.
Kokkola, R., Sundberg, E., Ulfgren, A. K., Palmblad, K., Li, J., Wang, H., Ulloa, L.,
Yang, H., Yan, X. J., Furie, R., Chiorazzi, N., Tracey, K. J., Andersson, U.
and Harris, H. E. (2002). "High mobility group box chromosomal protein 1: a
novel proinflammatory mediator in synovitis." Arthritis Rheum 46(10): 2598-
2603.
Kola, I. and Landis, J. (2004). "Can the pharmaceutical industry reduce attrition
rates?" Nat Rev Drug Discov 3(8): 711-715.
Kollewe, C., Mackensen, A. C., Neumann, D., Knop, J., Cao, P., Li, S., Wesche, H.
and Martin, M. U. (2004). "Sequential autophosphorylation steps in the
interleukin-1 receptor-associated kinase-1 regulate its availability as an
adapter in interleukin-1 signaling." J Biol Chem 279(7): 5227-5236.
Kostura, M. J., Tocci, M. J., Limjuco, G., Chin, J., Cameron, P., Hillman, A. G.,
Chartrain, N. A. and Schmidt, J. A. (1989). "Identification of a monocyte
specific pre-interleukin 1 beta convertase activity." Proc Natl Acad Sci U S A
86(14): 5227-5231.
Kovalovich, K., DeAngelis, R. A., Li, W., Furth, E. E., Ciliberto, G. and Taub, R.
(2000). "Increased toxin-induced liver injury and fibrosis in interleukin-6-
deficient mice." Hepatology 31(1): 149-159.
Kubes, P. and Mehal, W. Z. (2012). "Sterile inflammation in the liver."
Gastroenterology 143(5): 1158-1172.
Kuno, K. and Matsushima, K. (1994). "The IL-1 receptor signaling pathway." J
Leukoc Biol 56(5): 542-547.
Laemmli, U. K. (1970). "Cleavage of structural proteins during the assembly of the
head of bacteriophage T4." Nature 227(5259): 680-685.
Lamkanfi, M., Sarkar, A., Vande Walle, L., Vitari, A. C., Amer, A. O., Wewers, M.
D., Tracey, K. J., Kanneganti, T. D. and Dixit, V. M. (2010).

Bibliography
172
"Inflammasome-dependent release of the alarmin HMGB1 in endotoxemia."
J Immunol 185(7): 4385-4392.
Landin, J. S., Cohen, S. D. and Khairallah, E. A. (1996). "Identification of a 54-kDa
mitochondrial acetaminophen-binding protein as aldehyde dehydrogenase."
Toxicol Appl Pharmacol 141(1): 299-307.
Lange, S. S., Mitchell, D. L. and Vasquez, K. M. (2008). "High mobility group
protein B1 enhances DNA repair and chromatin modification after DNA
damage." Proc Natl Acad Sci U S A 105(30): 10320-10325.
Lasser, K. E., Allen, P. D., Woolhandler, S. J., Himmelstein, D. U., Wolfe, S. M. and
Bor, D. H. (2002). "Timing of new black box warnings and withdrawals for
prescription medications." JAMA 287(17): 2215-2220.
Laverty, H. G., Antoine, D. J., Benson, C., Chaponda, M., Williams, D. and Kevin
Park, B. (2010). "The potential of cytokines as safety biomarkers for drug-
induced liver injury." Eur J Clin Pharmacol 66(10): 961-976.
Lazarou, J., Pomeranz, B. H. and Corey, P. N. (1998). "Incidence of adverse drug
reactions in hospitalized patients: a meta-analysis of prospective studies."
JAMA 279(15): 1200-1205.
Leclerc, P., Wahamaa, H., Idborg, H., Jakobsson, P. J., Harris, H. E. and Korotkova,
M. (2013). "IL-1beta/HMGB1 complexes promote The PGE2 biosynthesis
pathway in synovial fibroblasts." Scand J Immunol 77(5): 350-360.
Lecoeur, S., Andre, C. and Beaune, P. H. (1996). "Tienilic acid-induced autoimmune
hepatitis: anti-liver and-kidney microsomal type 2 autoantibodies recognize a
three-site conformational epitope on cytochrome P4502C9." Mol Pharmacol
50(2): 326-333.
Lee, K. B., Brooks, D. J. and Thomas, J. O. (1998). "Selection of a cDNA clone for
chicken high-mobility-group 1 (HMG1) protein through its unusually
conserved 3'-untranslated region, and improved expression of recombinant
HMG1 in Escherichia coli." Gene 225(1-2): 97-105.
Lee, K. B. and Thomas, J. O. (2000). "The effect of the acidic tail on the DNA-
binding properties of the HMG1,2 class of proteins: insights from tail
switching and tail removal." J Mol Biol 304(2): 135-149.
Lee, W. M. (2003). "Drug-induced hepatotoxicity." N Engl J Med 349(5): 474-485.
Leung, K., Betts, J. C., Xu, L. and Nabel, G. J. (1994). "The cytoplasmic domain of
the interleukin-1 receptor is required for nuclear factor-kappa B signal
transduction." J Biol Chem 269(3): 1579-1582.
Levy, M. (1997). "Role of viral infections in the induction of adverse drug
reactions." Drug Saf 16(1): 1-8.
Li, J., Kokkola, R., Tabibzadeh, S., Yang, R., Ochani, M., Qiang, X., Harris, H. E.,
Czura, C. J., Wang, H., Ulloa, L., Warren, H. S., Moldawer, L. L., Fink, M.
P., Andersson, U., Tracey, K. J. and Yang, H. (2003). "Structural basis for

Bibliography
173
the proinflammatory cytokine activity of high mobility group box 1." Mol
Med 9(1-2): 37-45.
Li, J., Wang, H., Mason, J. M., Levine, J., Yu, M., Ulloa, L., Czura, C. J., Tracey, K.
J. and Yang, H. (2004). "Recombinant HMGB1 with cytokine-stimulating
activity." J Immunol Methods 289(1-2): 211-223.
Li, J., Wang, H., Mason, J. M., Levine, J., Yu, M., Ulloa, L., Czura, C. J., Tracey, K.
J. and Yang, H. (2004). "Recombinant HMGB1 with cytokine-stimulating
activity." Journal of Immunological Methods 289(1-2): 211-223.
Lian, L.-Y. and Middleton, D. A. (2001). "Labelling approaches for protein
structural studies by solution-state and solid-state NMR." Progress in
Nuclear Magnetic Resonance Spectroscopy 39(3): 171-190.
Libermann, T. A. and Baltimore, D. (1990). "Activation of interleukin-6 gene
expression through the NF-kappa B transcription factor." Mol Cell Biol
10(5): 2327-2334.
Lind, R. C., Gandolfi, A. J., Sipes, I. G. and Brown, B. R., Jr. (1984). "The
involvement of endotoxin in halothane-associated liver injury."
Anesthesiology 61(5): 544-550.
Lotz, M., Jirik, F., Kabouridis, P., Tsoukas, C., Hirano, T., Kishimoto, T. and
Carson, D. A. (1988). "B cell stimulating factor 2/interleukin 6 is a
costimulant for human thymocytes and T lymphocytes." J Exp Med 167(3):
1253-1258.
Lotze, M. T. and Tracey, K. J. (2005). "High-mobility group box 1 protein
(HMGB1): nuclear weapon in the immune arsenal." Nat Rev Immunol 5(4):
331-342.
Lu, B., Nakamura, T., Inouye, K., Li, J., Tang, Y., Lundback, P., Valdes-Ferrer, S. I.,
Olofsson, P. S., Kalb, T., Roth, J., Zou, Y., Erlandsson-Harris, H., Yang, H.,
Ting, J. P., Wang, H., Andersson, U., Antoine, D. J., Chavan, S. S.,
Hotamisligil, G. S. and Tracey, K. J. (2012). "Novel role of PKR in
inflammasome activation and HMGB1 release." Nature 488(7413): 670-674.
Luckey, S. W., Taylor, M., Sampey, B. P., Scheinman, R. I. and Petersen, D. R.
(2002). "4-hydroxynonenal decreases interleukin-6 expression and protein
production in primary rat Kupffer cells by inhibiting nuclear factor-kappaB
activation." J Pharmacol Exp Ther 302(1): 296-303.
Luyendyk, J. P., Maddox, J. F., Cosma, G. N., Ganey, P. E., Cockerell, G. L. and
Roth, R. A. (2003). "Ranitidine treatment during a modest inflammatory
response precipitates idiosyncrasy-like liver injury in rats." J Pharmacol Exp
Ther 307(1): 9-16.
Maddox, J. F., Amuzie, C. J., Li, M., Newport, S. W., Sparkenbaugh, E., Cuff, C. F.,
Pestka, J. J., Cantor, G. H., Roth, R. A. and Ganey, P. E. (2010). "Bacterial-
and viral-induced inflammation increases sensitivity to acetaminophen
hepatotoxicity." J Toxicol Environ Health A 73(1): 58-73.

Bibliography
174
Maddrey, W., Schiff, E. R. and Sorrell, M. F. (2011). Schiff's Diseases of the Liver.
Hoboken, NJ, USA, Wiley.
Makin, A. J., Wendon, J. and Williams, R. (1995). "A 7-year experience of severe
acetaminophen-induced hepatotoxicity (1987-1993)." Gastroenterology
109(6): 1907-1916.
Mariathasan, S., Weiss, D. S., Newton, K., McBride, J., O'Rourke, K., Roose-Girma,
M., Lee, W. P., Weinrauch, Y., Monack, D. M. and Dixit, V. M. (2006).
"Cryopyrin activates the inflammasome in response to toxins and ATP."
Nature 440(7081): 228-232.
Martin-Murphy, B. V., Holt, M. P. and Ju, C. (2010). "The role of damage associated
molecular pattern molecules in acetaminophen-induced liver injury in mice."
Toxicol Lett 192(3): 387-394.
Martin, M. U. and Wesche, H. (2002). "Summary and comparison of the signaling
mechanisms of the Toll/interleukin-1 receptor family." Biochim Biophys Acta
1592(3): 265-280.
Martinon, F., Burns, K. and Tschopp, J. (2002). "The inflammasome: a molecular
platform triggering activation of inflammatory caspases and processing of
proIL-beta." Mol Cell 10(2): 417-426.
Masubuchi, Y., Bourdi, M., Reilly, T. P., Graf, M. L., George, J. W. and Pohl, L. R.
(2003). "Role of interleukin-6 in hepatic heat shock protein expression and
protection against acetaminophen-induced liver disease." Biochem Biophys
Res Commun 304(1): 207-212.
Matzinger, P. (1994). "Tolerance, danger, and the extended family." Annu Rev
Immunol 12: 991-1045.
McKinney, K. and Prives, C. (2002). "Efficient specific DNA binding by p53
requires both its central and C-terminal domains as revealed by studies with
high-mobility group 1 protein." Mol Cell Biol 22(19): 6797-6808.
McMahan, C. J., Slack, J. L., Mosley, B., Cosman, D., Lupton, S. D., Brunton, L. L.,
Grubin, C. E., Wignall, J. M., Jenkins, N. A., Brannan, C. I. and et al. (1991).
"A novel IL-1 receptor, cloned from B cells by mammalian expression, is
expressed in many cell types." EMBO J 10(10): 2821-2832.
Melloni, E., Sparatore, B., Patrone, M., Pessino, A., Passalacqua, M. and Pontremoli,
S. (1995). "Extracellular release of the 'differentiation enhancing factor', a
HMG1 protein type, is an early step in murine erythroleukemia cell
differentiation." FEBS Lett 368(3): 466-470.
Mitchell, J. R., Jollow, D. J., Potter, W. Z., Davis, D. C., Gillette, J. R. and Brodie,
B. B. (1973). "Acetaminophen-induced hepatic necrosis. I. Role of drug
metabolism." J Pharmacol Exp Ther 187(1): 185-194.
Moore, T. J., Cohen, M. R. and Furberg, C. D. (2007). "Serious adverse drug events
reported to the Food and Drug Administration, 1998-2005." Arch Intern Med
167(16): 1752-1759.

Bibliography
175
Muhammad, S., Barakat, W., Stoyanov, S., Murikinati, S., Yang, H., Tracey, K. J.,
Bendszus, M., Rossetti, G., Nawroth, P. P., Bierhaus, A. and Schwaninger,
M. (2008). "The HMGB1 receptor RAGE mediates ischemic brain damage."
J Neurosci 28(46): 12023-12031.
Muller, S., Bianchi, M. E. and Knapp, S. (2001). "Thermodynamics of HMGB1
interaction with duplex DNA." Biochemistry 40(34): 10254-10261.
Muller, S., Ronfani, L. and Bianchi, M. E. (2004). "Regulated expression and
subcellular localization of HMGB1, a chromatin protein with a cytokine
function." J Intern Med 255(3): 332-343.
Muskett, F. W. (2011). Protein NMR Spectroscopy : Practical Techniques and
Applications. L. Y. Lian and G. Roberts. Hoboken NJ, USA, Wiley.
Muzio, M., Ni, J., Feng, P. and Dixit, V. M. (1997). "IRAK (Pelle) Family Member
IRAK-2 and MyD88 as Proximal Mediators of IL-1 Signaling." Science
278(5343): 1612-1615.
Nathan, C. (2002). "Points of control in inflammation." Nature 420(6917): 846-852.
Nguyen, G. C., Sam, J. and Thuluvath, P. J. (2008). "Hepatitis C is a predictor of
acute liver injury among hospitalizations for acetaminophen overdose in the
United States: a nationwide analysis." Hepatology 48(4): 1336-1341.
Onate, S. A., Prendergast, P., Wagner, J. P., Nissen, M., Reeves, R., Pettijohn, D. E.
and Edwards, D. P. (1994). "The DNA-bending protein HMG-1 enhances
progesterone receptor binding to its target DNA sequences." Mol Cell Biol
14(5): 3376-3391.
Orlova, V. V., Choi, E. Y., Xie, C., Chavakis, E., Bierhaus, A., Ihanus, E.,
Ballantyne, C. M., Gahmberg, C. G., Bianchi, M. E., Nawroth, P. P. and
Chavakis, T. (2007). "A novel pathway of HMGB1-mediated inflammatory
cell recruitment that requires Mac-1-integrin." EMBO J 26(4): 1129-1139.
Ostapowicz, G., Fontana, R. J., Schiodt, F. V., Larson, A., Davern, T. J., Han, S. H.,
McCashland, T. M., Shakil, A. O., Hay, J. E., Hynan, L., Crippin, J. S., Blei,
A. T., Samuel, G., Reisch, J. and Lee, W. M. (2002). "Results of a
prospective study of acute liver failure at 17 tertiary care centers in the
United States." Ann Intern Med 137(12): 947-954.
Ostberg, T., Kawane, K., Nagata, S., Yang, H., Chavan, S., Klevenvall, L., Bianchi,
M. E., Harris, H. E., Andersson, U. and Palmblad, K. (2010). "Protective
targeting of high mobility group box chromosomal protein 1 in a spontaneous
arthritis model." Arthritis Rheum 62(10): 2963-2972.
Park, B. K., Laverty, H., Srivastava, A., Antoine, D. J., Naisbitt, D. and Williams, D.
P. (2011). "Drug bioactivation and protein adduct formation in the
pathogenesis of drug-induced toxicity." Chem Biol Interact 192(1-2): 30-36.
Park, B. K., Pirmohamed, M. and Kitteringham, N. R. (1998). "Role of drug
disposition in drug hypersensitivity: a chemical, molecular, and clinical
perspective." Chem Res Toxicol 11(9): 969-988.

Bibliography
176
Park, J. S., Svetkauskaite, D., He, Q., Kim, J. Y., Strassheim, D., Ishizaka, A. and
Abraham, E. (2004). "Involvement of toll-like receptors 2 and 4 in cellular
activation by high mobility group box 1 protein." J Biol Chem 279(9): 7370-
7377.
Park, S. and Lippard, S. J. (2011). "Redox state-dependent interaction of HMGB1
and cisplatin-modified DNA." Biochemistry 50(13): 2567-2574.
Pasheva, E., Sarov, M., Bidjekov, K., Ugrinova, I., Sarg, B., Lindner, H. and Pashev,
I. G. (2004). "In vitro acetylation of HMGB-1 and -2 proteins by CBP: the
role of the acidic tail." Biochemistry 43(10): 2935-2940.
Petsch, D. and Anspach, F. B. (2000). "Endotoxin removal from protein solutions." J
Biotechnol 76(2-3): 97-119.
Pichler, W. J., Beeler, A., Keller, M., Lerch, M., Posadas, S., Schmid, D., Spanou,
Z., Zawodniak, A. and Gerber, B. (2006). "Pharmacological interaction of
drugs with immune receptors: the p-i concept." Allergol Int 55(1): 17-25.
Pirmohamed, M., James, S., Meakin, S., Green, C., Scott, A. K., Walley, T. J.,
Farrar, K., Park, B. K. and Breckenridge, A. M. (2004). "Adverse drug
reactions as cause of admission to hospital: prospective analysis of 18 820
patients." BMJ 329(7456): 15-19.
PyMoL.The PyMOL Molecular Graphics System.Version 1.5.0.4.Schrödinger, LLC.
Qin, Y. H., Dai, S. M., Tang, G. S., Zhang, J., Ren, D., Wang, Z. W. and Shen, Q.
(2009). "HMGB1 enhances the proinflammatory activity of
lipopolysaccharide by promoting the phosphorylation of MAPK p38 through
receptor for advanced glycation end products." J Immunol 183(10): 6244-
6250.
Quintana, F. J. and Cohen, I. R. (2005). "Heat shock proteins as endogenous
adjuvants in sterile and septic inflammation." J Immunol 175(5): 2777-2782.
Ramstein, J., Locker, D., Bianchi, M. E. and Leng, M. (1999). "Domain-domain
interactions in high mobility group 1 protein (HMG1)." Eur J Biochem
260(3): 692-700.
Reeves, R. (2010). "Nuclear functions of the HMG proteins." Biochim Biophys Acta
1799(1-2): 3-14.
Rouhiainen, A., Tumova, S., Valmu, L., Kalkkinen, N. and Rauvala, H. (2007).
"Pivotal advance: analysis of proinflammatory activity of highly purified
eukaryotic recombinant HMGB1 (amphoterin)." J Leukoc Biol 81(1): 49-58.
Rovere-Querini, P., Capobianco, A., Scaffidi, P., Valentinis, B., Catalanotti, F.,
Giazzon, M., Dumitriu, I. E., Muller, S., Iannacone, M., Traversari, C.,
Bianchi, M. E. and Manfredi, A. A. (2004). "HMGB1 is an endogenous
immune adjuvant released by necrotic cells." Embo Reports 5(8): 825-830.
Rowell, John P., Simpson, Kathryn L., Stott, K., Watson, M. and Thomas, Jean O.
(2012). "HMGB1-Facilitated p53 DNA Binding Occurs via HMG-Box/p53

Bibliography
177
Transactivation Domain Interaction, Regulated by the Acidic Tail." Structure
(London, England : 1993) 20(12): 2014-2024.
Salmivirta, M., Rauvala, H., Elenius, K. and Jalkanen, M. (1992). "Neurite growth-
promoting protein (amphoterin, p30) binds syndecan." Exp Cell Res 200(2):
444-451.
Satoh, H., Martin, B. M., Schulick, A. H., Christ, D. D., Kenna, J. G. and Pohl, L. R.
(1989). "Human anti-endoplasmic reticulum antibodies in sera of patients
with halothane-induced hepatitis are directed against a trifluoroacetylated
carboxylesterase." Proc Natl Acad Sci U S A 86(1): 322-326.
Satoh, T., Nakamura, S., Taga, T., Matsuda, T., Hirano, T., Kishimoto, T. and
Kaziro, Y. (1988). "Induction of neuronal differentiation in PC12 cells by B-
cell stimulatory factor 2/interleukin 6." Mol Cell Biol 8(8): 3546-3549.
Saunders, M., Wishnia, A. and Kirkwood, J. G. (1957). "THE NUCLEAR
MAGNETIC RESONANCE SPECTRUM OF RIBONUCLEASE1." Journal
of the American Chemical Society 79(12): 3289-3290.
Scaffidi, P., Misteli, T. and Bianchi, M. E. (2002). "Release of chromatin protein
HMGB1 by necrotic cells triggers inflammation." Nature 418(6894): 191-
195.
Schiraldi, M., Raucci, A., Munoz, L. M., Livoti, E., Celona, B., Venereau, E.,
Apuzzo, T., De Marchis, F., Pedotti, M., Bachi, A., Thelen, M., Varani, L.,
Mellado, M., Proudfoot, A., Bianchi, M. E. and Uguccioni, M. (2012).
"HMGB1 promotes recruitment of inflammatory cells to damaged tissues by
forming a complex with CXCL12 and signaling via CXCR4." J Exp Med
209(3): 551-563.
Semino, C., Angelini, G., Poggi, A. and Rubartelli, A. (2005). "NK/iDC interaction
results in IL-18 secretion by DCs at the synaptic cleft followed by NK cell
activation and release of the DC maturation factor HMGB1." Blood 106(2):
609-616.
Sgro, C., Clinard, F., Ouazir, K., Chanay, H., Allard, C., Guilleminet, C., Lenoir, C.,
Lemoine, A. and Hillon, P. (2002). "Incidence of drug-induced hepatic
injuries: a French population-based study." Hepatology 36(2): 451-455.
Sha, Y., Zmijewski, J., Xu, Z. and Abraham, E. (2008). "HMGB1 develops enhanced
proinflammatory activity by binding to cytokines." J Immunol 180(4): 2531-
2537.
Shakhov, A. N., Collart, M. A., Vassalli, P., Nedospasov, S. A. and Jongeneel, C. V.
(1990). "Kappa B-type enhancers are involved in lipopolysaccharide-
mediated transcriptional activation of the tumor necrosis factor alpha gene in
primary macrophages." J Exp Med 171(1): 35-47.
Shaw, P. J., Hopfensperger, M. J., Ganey, P. E. and Roth, R. A. (2007).
"Lipopolysaccharide and trovafloxacin coexposure in mice causes
idiosyncrasy-like liver injury dependent on tumor necrosis factor-alpha."
Toxicol Sci 100(1): 259-266.

Bibliography
178
Sheflin, L. G., Fucile, N. W. and Spaulding, S. W. (1993). "The specific interactions
of HMG 1 and 2 with negatively supercoiled DNA are modulated by their
acidic C-terminal domains and involve cysteine residues in their HMG 1/2
boxes." Biochemistry 32(13): 3238-3248.
Siebenlist, U., Franzoso, G. and Brown, K. (1994). "Structure, regulation and
function of NF-kappa B." Annu Rev Cell Biol 10: 405-455.
Simpson, R. J., Hammacher, A., Smith, D. K., Matthews, J. M. and Ward, L. D.
(1997). "Interleukin-6: structure-function relationships." Protein Sci 6(5):
929-955.
Sims, G. P., Rowe, D. C., Rietdijk, S. T., Herbst, R. and Coyle, A. J. (2010).
"HMGB1 and RAGE in inflammation and cancer." Annu Rev Immunol 28:
367-388.
Sims, J. E., Acres, R. B., Grubin, C. E., McMahan, C. J., Wignall, J. M., March, C. J.
and Dower, S. K. (1989). "Cloning the interleukin 1 receptor from human T
cells." Proceedings of the National Academy of Sciences 86(22): 8946-8950.
Stott, K., Tang, G. S. F., Lee, K.-B. and Thomas, J. O. (2006). "Structure of a
Complex of Tandem HMG Boxes and DNA." Journal of Molecular Biology
360(1): 90-104.
Stott, K., Watson, M., Howe, F. S., Grossmann, J. G. and Thomas, J. O. (2010).
"Tail-Mediated Collapse of HMGB1 Is Dynamic and Occurs via Differential
Binding of the Acidic Tail to the A and B Domains." Journal of Molecular
Biology 403(5): 706-722.
Stros, M., Stokrova, J. and Thomas, J. O. (1994). "DNA looping by the HMG-box
domains of HMG1 and modulation of DNA binding by the acidic C-terminal
domain." Nucleic Acids Res 22(6): 1044-1051.
Štros, M., Štokrová, J. and Thomas, J. O. (1994). "DNA looping by the HMG-box
domains of HMG1 and modulation of DNA binding by the acidic C-terminal
domain." Nucleic Acids Research 22(6): 1044-1051.
Takeda, M. and Kainosho, M. (2011). Protein NMR Spectroscopy : Practical
Techniques and Applications. L. Y. Lian and G. Roberts. Hoboken NJ, USA,
Wiley.
Tang, D., Kang, R., Livesey, K. M., Cheh, C. W., Farkas, A., Loughran, P., Hoppe,
G., Bianchi, M. E., Tracey, K. J., Zeh, H. J., 3rd and Lotze, M. T. (2010).
"Endogenous HMGB1 regulates autophagy." J Cell Biol 190(5): 881-892.
Thornberry, N. A., Bull, H. G., Calaycay, J. R., Chapman, K. T., Howard, A. D.,
Kostura, M. J., Miller, D. K., Molineaux, S. M., Weidner, J. R., Aunins, J.
and et al. (1992). "A novel heterodimeric cysteine protease is required for
interleukin-1 beta processing in monocytes." Nature 356(6372): 768-774.
Tian, J., Avalos, A. M., Mao, S. Y., Chen, B., Senthil, K., Wu, H., Parroche, P.,
Drabic, S., Golenbock, D., Sirois, C., Hua, J., An, L. L., Audoly, L., La Rosa,
G., Bierhaus, A., Naworth, P., Marshak-Rothstein, A., Crow, M. K.,

Bibliography
179
Fitzgerald, K. A., Latz, E., Kiener, P. A. and Coyle, A. J. (2007). "Toll-like
receptor 9-dependent activation by DNA-containing immune complexes is
mediated by HMGB1 and RAGE." Nat Immunol 8(5): 487-496.
Travers, A. A. and Thomas, J. O. (2004). Chromosomal HMG-box proteins
Chromatin Structure and Dynamics: State-of-the-Art. J. Zlatanova and S. H.
Leuba. The Netherlands, Elsevier: 103-133
Tsung, A., Klune, J. R., Zhang, X., Jeyabalan, G., Cao, Z., Peng, X., Stolz, D. B.,
Geller, D. A., Rosengart, M. R. and Billiar, T. R. (2007). "HMGB1 release
induced by liver ischemia involves Toll-like receptor 4 dependent reactive
oxygen species production and calcium-mediated signaling." J Exp Med
204(12): 2913-2923.
Ulrich, E. L., Akutsu, H., Doreleijers, J. F., Harano, Y., Ioannidis, Y. E., Lin, J.,
Livny, M., Mading, S., Maziuk, D., Miller, Z., Nakatani, E., Schulte, C. F.,
Tolmie, D. E., Kent Wenger, R., Yao, H. and Markley, J. L. (2008).
"BioMagResBank." Nucleic Acids Research 36(suppl 1): D402-D408.
Urbonaviciute, V., Furnrohr, B. G., Meister, S., Munoz, L., Heyder, P., De Marchis,
F., Bianchi, M. E., Kirschning, C., Wagner, H., Manfredi, A. A., Kalden, J.
R., Schett, G., Rovere-Querini, P., Herrmann, M. and Voll, R. E. (2008).
"Induction of inflammatory and immune responses by HMGB1-nucleosome
complexes: implications for the pathogenesis of SLE." J Exp Med 205(13):
3007-3018.
Van Snick, J. (1990). "Interleukin-6: an overview." Annu Rev Immunol 8: 253-278.
Venereau, E., Casalgrandi, M., Schiraldi, M., Antoine, D. J., Cattaneo, A., De
Marchis, F., Liu, J., Antonelli, A., Preti, A., Raeli, L., Shams, S. S., Yang, H.,
Varani, L., Andersson, U., Tracey, K. J., Bachi, A., Uguccioni, M. and
Bianchi, M. E. (2012). "Mutually exclusive redox forms of HMGB1 promote
cell recruitment or proinflammatory cytokine release." J Exp Med 209(9):
1519-1528.
Verma, S. and Kaplowitz, N. (2009). "Diagnosis, management and prevention of
drug-induced liver injury." Gut 58(11): 1555-1564.
Wähämaa, H., Schierbeck, H., Hreggvidsdottir, H. S., Palmblad, K., Aveberger, A.
C., Andersson, U. and Harris, H. E. (2011). "High mobility group box protein
1 in complex with lipopolysaccharide or IL-1 promotes an increased
inflammatory phenotype in synovial fibroblasts." Arthritis research &
therapy 13(4).
Wakelin, S. J., Sabroe, I., Gregory, C. D., Poxton, I. R., Forsythe, J. L., Garden, O. J.
and Howie, S. E. (2006). ""Dirty little secrets"--endotoxin contamination of
recombinant proteins." Immunol Lett 106(1): 1-7.
Wang, C., Deng, L., Hong, M., Akkaraju, G. R., Inoue, J. and Chen, Z. J. (2001).
"TAK1 is a ubiquitin-dependent kinase of MKK and IKK." Nature
412(6844): 346-351.

Bibliography
180
Wang, H., Bloom, O., Zhang, M., Vishnubhakat, J. M., Ombrellino, M., Che, J.,
Frazier, A., Yang, H., Ivanova, S., Borovikova, L., Manogue, K. R., Faist, E.,
Abraham, E., Andersson, J., Andersson, U., Molina, P. E., Abumrad, N. N.,
Sama, A. and Tracey, K. J. (1999). "HMG-1 as a late mediator of endotoxin
lethality in mice." Science 285(5425): 248-251.
Wang, H., Vishnubhakat, J. M., Bloom, O., Zhang, M., Ombrellino, M., Sama, A.
and Tracey, K. J. (1999). "Proinflammatory cytokines (tumor necrosis factor
and interleukin 1) stimulate release of high mobility group protein-1 by
pituicytes." Surgery 126(2): 389-392.
Waring, J. F., Liguori, M. J., Luyendyk, J. P., Maddox, J. F., Ganey, P. E.,
Stachlewitz, R. F., North, C., Blomme, E. A. and Roth, R. A. (2006).
"Microarray analysis of lipopolysaccharide potentiation of trovafloxacin-
induced liver injury in rats suggests a role for proinflammatory chemokines
and neutrophils." J Pharmacol Exp Ther 316(3): 1080-1087.
Watson, M., Stott, K., Fischl, H., Cato, L. and Thomas, J. O. (2013).
"Characterization of the interaction between HMGB1 and H3--a possible
means of positioning HMGB1 in chromatin." Nucleic Acids Res.
Watson, M., Stott, K. and Thomas, J. O. (2007). "Mapping Intramolecular
Interactions between Domains in HMGB1 using a Tail-truncation Approach."
Journal of Molecular Biology 374(5): 1286-1297.
Weir, H. M., Kraulis, P. J., Hill, C. S., Raine, A. R., Laue, E. D. and Thomas, J. O.
(1993). "Structure of the HMG box motif in the B-domain of HMG1." EMBO
J 12(4): 1311-1319.
Yang, H., Antoine, D. J., Andersson, U. and Tracey, K. J. (2013). "The many faces
of HMGB1: molecular structure-functional activity in inflammation,
apoptosis, and chemotaxis." J Leukoc Biol 93(6): 865-873.
Yang, H., Hreggvidsdottir, H. S., Palmblad, K., Wang, H., Ochani, M., Li, J., Lu, B.,
Chavan, S., Rosas-Ballina, M., Al-Abed, Y., Akira, S., Bierhaus, A.,
Erlandsson-Harris, H., Andersson, U. and Tracey, K. J. (2010). "A critical
cysteine is required for HMGB1 binding to Toll-like receptor 4 and
activation of macrophage cytokine release." Proc Natl Acad Sci U S A.
Yang, H., Lundback, P., Ottosson, L., Erlandsson-Harris, H., Venereau, E., Bianchi,
M. E., Al-Abed, Y., Andersson, U., Tracey, K. J. and Antoine, D. J. (2011).
"Redox modification of cysteine residues regulates the cytokine activity of
HMGB1." Mol Med.
Yang, H., Ochani, M., Li, J., Qiang, X., Tanovic, M., Harris, H. E., Susarla, S. M.,
Ulloa, L., Wang, H., DiRaimo, R., Czura, C. J., Wang, H., Roth, J., Warren,
H. S., Fink, M. P., Fenton, M. J., Andersson, U. and Tracey, K. J. (2004).
"Reversing established sepsis with antagonists of endogenous high-mobility
group box 1." Proceedings of the National Academy of Sciences 101(1): 296-
301.

Bibliography
181
You, Q., Cheng, L., Reilly, T. P., Wegmann, D. and Ju, C. (2006). "Role of
neutrophils in a mouse model of halothane-induced liver injury." Hepatology
44(6): 1421-1431.
Youn, J. H., Kwak, M. S., Wu, J., Kim, E. S., Ji, Y., Min, H. J., Yoo, J. H., Choi, J.
E., Cho, H. S. and Shin, J. S. (2011). "Identification of lipopolysaccharide-
binding peptide regions within HMGB1 and their effects on subclinical
endotoxemia in a mouse model." Eur J Immunol 41(9): 2753-2762.
Youn, J. H., Oh, Y. J., Kim, E. S., Choi, J. E. and Shin, J. S. (2008). "High mobility
group box 1 protein binding to lipopolysaccharide facilitates transfer of
lipopolysaccharide to CD14 and enhances lipopolysaccharide-mediated TNF-
alpha production in human monocytes." J Immunol 180(7): 5067-5074.
Youn, J. H. and Shin, J. S. (2006). "Nucleocytoplasmic shuttling of HMGB1 is
regulated by phosphorylation that redirects it toward secretion." J Immunol
177(11): 7889-7897.
Yu, M., Wang, H., Ding, A., Golenbock, D. T., Latz, E., Czura, C. J., Fenton, M. J.,
Tracey, K. J. and Yang, H. (2006). "HMGB1 signals through toll-like
receptor (TLR) 4 and TLR2." Shock 26(2): 174-179.
Yuan, H., Jin, X., Sun, J., Li, F., Feng, Q., Zhang, C., Cao, Y. and Wang, Y. (2009).
"Protective effect of HMGB1 a box on organ injury of acute pancreatitis in
mice." Pancreas 38(2): 143-148.
Zanni, M. P., von Greyerz, S., Schnyder, B., Brander, K. A., Frutig, K., Hari, Y.,
Valitutti, S. and Pichler, W. J. (1998). "HLA-restricted, processing- and
metabolism-independent pathway of drug recognition by human alpha beta T
lymphocytes." J Clin Invest 102(8): 1591-1598.
Zheng, H., Fletcher, D., Kozak, W., Jiang, M., Hofmann, K. J., Conn, C. A.,
Soszynski, D., Grabiec, C., Trumbauer, M. E., Shaw, A. and et al. (1995).
"Resistance to fever induction and impaired acute-phase response in
interleukin-1 beta-deficient mice." Immunity 3(1): 9-19.
Zimmerman, H. (1999). Hepatotoxicity: the adverse effects of drugs and other
chemicals on the liver. Philadelphia: , Lippincott, Williams & Wilkins.
Zou, W., Devi, S. S., Sparkenbaugh, E., Younis, H. S., Roth, R. A. and Ganey, P. E.
(2009). "Hepatotoxic interaction of sulindac with lipopolysaccharide: role of
the hemostatic system." Toxicol Sci 108(1): 184-193.