Embed Size (px)
Citation preview

Biomechanical gait analysis of pigsThe present Ph.D. thesis was part of a larger research project entitled: “Floor quality and design: Signifi cance to the health and welfare of swine”, funded by The Danish Ministry of Food, Agriculture and Fisheries.
The overall purposes of this thesis were to characterize the gait of pigs bio-mechanically and to examine the effect of fl oor condition on the pigs’ gait. These objectives were achieved via morphometric studies of the body segment parameters and joint rotation axes of pigs’ limbs, and not least a biomechanical analysis of walking pigs. By combining data from these studies through inverse dynamics the joint loads in the limbs of walking pigs were calculated.
More specifi cally the present thesis aimed fi rstly to measure the body segment parameters and determine the joint rotation axes of pigs’ limbs (paper I).
Secondly, to characterize the walk of pigs on dry solid concrete fl oor, evaluate whether pigs modify their gait according to fl oor condition, and suggest a co-effi cient of friction that ensures pigs safe walking on solid concrete fl oors (pa-per II).
Finally, to calculate the net joint forces and moments of the fore- and hindlimb joints of pigs walking on solid concrete fl oor and examine the effect of fl oor condition on the net joint reaction forces and joint moments (paper III).
Ph.D. thesis byVivi Mørkøre Thorup
Ph.D. thesis
Biomechanical gait analysis of pigs
Vivi M
ørkøre Thorup
ISBN: 87-91771-13-7
Department of Exercise and Sport SciencesFaculty of Science, University of Copenhagen, DenmarkandDepartment of Animal Health, Welfare and NutritionFaculty of Agricultural Sciences, University of Aarhus, Denmark

BIOMECHANICAL GAIT ANALYSIS OF PIGS © Vivi Mørkøre Thorup, M.Sc. Department of Exercise and Sport Sciences Faculty of Science, University of Copenhagen, Denmark and Department of Animal Health, Welfare and Nutrition Faculty of Agricultural Sciences, University of Aarhus, Denmark Ph.D. thesis Submitted May 31st 2007 Defended October 5th 2007 Evaluation committee: Professor John Rasmussen, Ph.D., The AnyBody Group, Department of Mechanical Engineering, Faculty of Engineering, Science and Medicine, Aalborg University, Denmark Professor Stig Drevemo, Ph.D., Department of Anatomy, Physiology and Biochemistry, Faculty of Veterinary Medicine and Animal Science, Swedish University of Agricultural Sciences, Sweden Assoc. Professor Kurt Jørgensen, Dr. scient., Department of Exercise and Sport Sciences, Faculty of Science, University of Copenhagen, Denmark (Chairman of evaluation committee) Supervisors: Assoc. Professor Bente Rona Jensen, Ph.D., Department of Exercise and Sport Sciences, Faculty of Science, University of Copenhagen, Denmark Head of Research Unit Birte Lindstrøm Nielsen, Ph.D., Department of Animal Health, Welfare and Nutrition, Faculty of Agricultural Sciences, University of Aarhus, Denmark Bente Jørgensen, Ph.D., formerly at the Danish Institute of Agricultural Sciences, Denmark Cover layout: Simon Schierbeck Layout: Vivi Mørkøre Thorup Printed by: Det Samfundvidenskabelige Fakultets ReproCenter ISBN: 87-91771-13-7

BIOMECHANICAL GAIT ANALYSIS OF PIGS
Ph.D. thesis by
Vivi Mørkøre Thorup
Department of Exercise and Sport Sciences
Faculty of Science, University of Copenhagen, Denmark
and
Department of Animal Health, Welfare and Nutrition
Faculty of Agricultural Sciences, University of Aarhus, Denmark
2007
PREFACE
PREFACE
This Ph.D.-thesis is submitted to the Department of Exercise and Sport Sciences, Faculty of
Science, University of Copenhagen, Denmark. The study was carried out in periods from
2002 to 2007, mainly at the Department of Animal Health, Welfare and Nutrition, Faculty of
Agricultural Sciences, University of Aarhus, Denmark.
The thesis is part of a larger research project (no. 3412-04-00114) entitled: “Gulvkvalitet og
gulvudformning: Betydning for svins sundhed og velfærd” (Floor quality and design:
Significance to the health and welfare of swine), commonly known as “Gulvprojektet”. The
project was initiated by Bente Jørgensen seconded by the head of research unit, Karin
Hjelholt Jensen, at the former Danish Institute of Agricultural Sciences, Research Centre
Foulum. Gulvprojektet and the present thesis were funded by The Danish Ministry of Food,
Agriculture and Fisheries. Being interdisciplinary this Ph.D.-project has presented many
challenges to me, as the worlds of biomechanics, agriculture and biology had to meet. It has
been exciting, difficult, long, but also very educating. Moreover, due to the various disciplines
involved, I have tried to keep the language relatively non-specialised, so that a broad audience
may understand it. I truly hope that the research presented here will be useful to other
researchers in these areas and not least of benefit to pigs in future pig production.
I appreciate my supervisors: Bente Rona Jensen, Department of Exercise and Sport Sciences,
University of Copenhagen; Bente Jørgensen, formerly at the Danish Institute of Agricultural
Sciences (supervisor Nov. 2002 to Feb. 2007); and Birte Lindstrøm Nielsen, Department of
Animal Health, Welfare and Nutrition, University of Aarhus (supervisor Dec. 2006 to May
2007) for their support and guidance. Further, my sincerest thanks to my additional co-authors
Frede Aa. Tøgersen, Department of Genetics and Biotechnology, University of Aarhus and
Bjarne Laursen, National Institute of Public Health, University of Southern Denmark for
being incredible patient and helpful.
I am grateful to my colleagues at the Faculty of Agricultural Sciences, who have contributed
with their technical skills, knowledge and encouragement. In particular I would like to
mention: Mette Lindstrøm Bech, Anton Steen Jensen, Jens Peder Nørgaard Nielsen, Erik
Decker, Hugo Christensen, Holger Thrane and Erik Jørgensen. Also I would like to thank
fellow students and colleagues at the Faculty of Science for help at programming, discussions
PREFACE
on biomechanics and other things, in particular Pia Melcher, Jesper Sandfeld, Peter K. Larsen
and Tine Alkjær.
I would also like to thank Perstrup Beton Industri A/S, Kolind, Denmark for supplying the
floor material.
Furthermore my deepest appreciation to my friends for their support, especially Bodil M.
Hjarvard for among many other things sharing the struggle of writing a Ph.D.-thesis, to my
family for having faith in me, and not least to Tommy for his endless love and encouragement
and for being a fantastic wizard of computers and digital printing.
Finally, I am grateful to all the four-legged creatures, both pets and production animals that
crossed my path during this thesis and contributed to making my life funnier and more
diverse.
In the thesis all photos were taken by me, unless otherwise mentioned.
Vivi Mørkøre Thorup
Foulum, May 2007

TABLE OF CONTENTS
TABLE OF CONTENTS
Preface
Table of contents
Summary …………………………………………………………………………………..7
Summary in Danish……………………………………………………………………….9
Abbreviations………………………………………………………………….……...….11
List of papers………………………………………………………………….………….12
1. General introduction…………………………………………………….………….13
Background…………………………………………………………………….……..…..13
Gait analysis…………………………………………………………………….…..….…16
Friction………………………………………………………………………….………...19
Aims………………………………………………………………………………………21
Outline…………………………………………………………………….…………...….21
2. Methods……………………………………………………………….…...…………23
Animals…………………………………………………………………….…………......23
Experimental set-ups and procedures…....………………………………….……………23
Data processing…………………………………………………………….……………..28
Statistical analysis………………………………………………………….……………..30
3. Results………………………………………………………………….…………….32
Morphometrics……………………………………………………………….…………...32
Gait analysis………………………………………………………………….…………...34
Floor friction……………………………………………………………………………...40
4. General discussion…………………………………………………………………..41
Comparative morphometrics……………………………………………………………...41
Morphometric method considerations…………………………………………………....43
Gait characteristics……………………………………………………………………......44
Floor condition effects on gait…………………………………………………………....46
Friction…………………………………………………………………………………....47
Ethical considerations………………………………………………………………….....48
5. Conclusions and perspectives……………………………………………………....49
Conclusions……………………………………………………………………………......49
Perspectives……………………………………………………………………………......49
6. References…………………………………………………………………………...51

TABLE OF CONTENTS
Appendices…………………………………………………………………………….....58
I. Paper I……………………………………………………………………………….....58
II. Paper II………………………………………………………………………………....71
III. Paper III………………………………………………………………………………..81

SUMMARY
7
SUMMARY
Leg problems are a burden to both the pigs and the farmers in modern pig production, because
leg problems decrease the welfare of the pigs, they are highly prevalent and one of the main
reasons for removing the pigs prematurely from production. One of the principal causes of leg
problems is the pig pen floor, or rather inappropriate floors. Especially inadequate frictional
properties leading to slippery floor conditions may contribute to these leg problems. Until
now the effect of floor condition on the gait of pigs has not been characterised scientifically.
The overall objectives of the present thesis were to characterize the gait of pigs
biomechanically and to examine the effect of floor condition on the pigs’ gait. These
objectives were achieved via two types of studies, namely morphometric studies of the body
segment parameters and joint rotation axes of pigs’ limbs, and a biomechanical analysis of
walking pigs. By combining the data from these studies through inverse dynamics the joint
loads in the limbs of walking pigs can be calculated. The thesis is based on three papers which
more specifically aimed to: 1) Measure the body segment parameters and determine the joint
rotation axes of pigs’ limbs; 2) Characterize the walk of pigs on dry solid concrete floor,
evaluate whether pigs modify their gait according to floor condition, and suggest a coefficient
of friction that ensures pigs safe walking on solid concrete floors; 3) Calculate the net joint
forces and moments of the fore- and hindlimb joints of pigs walking on solid concrete floor
and examine the effect of floor condition on the net joint reaction forces and joint moments.
The results showed that the joint rotation axes were located mainly at or near the attachment
site of the lateral collateral ligament of the joints. The body segment parameters revealed that
the pigs’ forelimb was lighter and shorter than their hindlimb. Furthermore, the biomechanical
analysis showed that on wet and greasy floor conditions the pigs lowered the walking speed
and the peak utilized coefficient of friction compared to dry floor. Moreover, the pigs
shortened the progression length, i.e. step length, and prolonged the stance phase duration on
greasy floor. The inverse dynamics revealed that the forelimb peak horizontal joint reaction
force and the hindlimb minimum horizontal joint reaction force were lowest on greasy floor.
Also the forelimb joint moments were displaced to a lower level on greasy floor compared to
dry and wet floors. In addition the gait analysis showed that during walk the forelimbs carried
more body weight and received higher peak ground reaction forces than the hindlimbs.
Finally the hindlimb stance phase was shorter than the stance phase of the forelimbs.

SUMMARY
8
In conclusion this thesis presents the first experimental data on the joint rotation axes and
body segment parameters of pigs’ limbs. The locations of the joint rotation axes were
described relative to bony landmarks and may serve as skin marker positions in kinematics.
Furthermore the quantification of the body segment parameters enables inverse dynamic
analysis of the locomotion of pigs. Moreover, the biomechanical analysis showed that floor
condition did affect the pigs’ gait in several ways. Among other things the pigs lowered their
walking speed and peak utilized coefficient of friction, shortened their steps and prolonged
their stance phase duration on greasy and potentially slippery floor. The inverse dynamics
revealed that, as a consequence of these gait adaptations, numerous joint parameters were
affected by floor condition, especially in the forelimbs. Overall, greasy floor appeared the
most slippery condition to the pigs, whereas wet floor was intermediate of dry and greasy
conditions. The gait analysis also revealed some biomechanical differences between the
limbs, as the forelimbs carried more weight and had longer stance phases than the hindlimbs,
consequently the pigs’ forelimb joints responded more markedly to floor condition than their
hindlimb joints. Finally the gait analysis indicated that a high static coefficient of friction is
needed to prevent pigs from slipping on dry concrete floors.

SAMMENDRAG (SUMMARY IN DANISH)
9
SAMMENDRAG
Benproblemer er en byrde for både grisene og producenterne i moderne svineproduktion,
fordi benproblemer nedsætter grisenes velfærd, forekommer meget hyppigt og er en af de
vigtigste årsager til at fjerne grisene fra produktionen før tid. En af hovedårsagerne til
benproblemer er gulvet i svinestien, eller rettere uhensigtsmæssige gulve. Især upassende
friktionsegenskaber, der medfører glatte gulve, kan bidrage til disse benproblemer. Hidtil er
gulvtilstandens effekt på grises gang ikke blevet videnskabeligt beskrevet.
De overordnede formål med den foreliggende afhandling var, at karakterisere grises gang
biomekanisk, samt at undersøge effekten af gulvtilstand på grisenes gang. Disse mål blev
opnået gennem to typer af studier, nemlig morfometriske studiee af kropssegmentparametre
og ledrotationsakser for griseben, samt en biomekanisk analyse af gående grise. Ved at
kombinere data fra disse studier i invers dynamik kan ledbelastningerne i benene på gående
grise beregnes. Denne afhandling er baseret på tre artikler, som mere specifikt havde til
formål at: 1) Måle kropssegment-parametrene og bestemme ledrotationsakserne for griseben;
2) Karakterisere grises gang på tørt fast betongulv, undersøge om grise tilpasser deres gang
efter gulvtilstand, samt foreslå en friktionskoefficient, som tillader grisene at gå sikkert på
faste betongulve; 3) Beregne netto ledreaktionskræfterne og ledmomenterne i for- og bagben
på grise, der går på fast betongulv, samt undersøge gulvtilstandens effekt på netto
ledreaktionskræfterne og ledmomenterne.
Resultaterne viste, at ledrotationsakserne var placeret ved eller nær vedhæftningspunktet for
leddenes laterale colaterale ligamenter. Kropssegmentparametrene viste, at grisenes forben
var kortere og lettere end deres bagben. Endvidere viste den biomekaniske ganganalyse, at på
våde og fedtede gulve sænkede grisene ganghastigheden og den maksimale anvendte
friktionskoefficent sammenlignet med tørt gulv. Desuden afkortede grisene den tilbagelagte
afstand pr. skridt, dvs. skridtlængden, og øgede standfasevarigheden på fedtet gulv. Den
inverse dynamik afslørede, at forbenets maksimale horisontale ledreaktionskraft og bagbenets
minimale horisontale ledreaktionskraft var lavest på fedtet gulv, endvidere var forbenets
ledmomenter forskudt til et lavere niveau på fedtet gulv i sammenligning med tørre og våde
gulve. I tilgift viste ganganalysen, at under gang bar forbenene mere af kropsvægten og
modtog større maksimale underlagsreaktionskræfter end bagbenene. Endelig var bagbenenes
standfase kortere end forbenenes.

SAMMENDRAG (SUMMARY IN DANISH)
10
Det kan konkluderes, at denne afhandling præsenterer de første eksperimentelle data på
ledrotationsakser og kropssegmentparametre på griseben. Ledrotationsaksernes placering blev
beskrevet relativt i forhold til knoglefremspring og kan fungere som hudmarkørplaceringer i
kinematiske analyser. Desuden muliggør kvantificeringen af kropssegmentparametrene en
invers dynamisk analyse af grises bevægelse. Den biomekaniske ganganalyse viste, at
gulvtilstanden påvirkede grisenes gang på adskillige måder. Bl.a. sænkede grisene
ganghastigheden og den maksimale anvendte friktionskoefficent, samt afkortede skridtene og
øgede standfasevarigheden på fedtet, og dermed potentielt glat, gulv. Den inverse dynamiske
analyse viste, at som følge af disse gangtilpasninger var mange ledparametre påvirket af
gulvtilstanden, især i forbenene. Generelt syntes fedtet gulvtilstand at være den glatteste,
mens vådt gulv var mellemliggende i forhold til tørre og fedtede gulve. Ganganalysen
afslørede også, at benene adskilte sig biomekanisk på flere måder, idet forbenene bar mere
vægt og havde længere standfase end bagbenene, hvilket førte til tydeligere responser på
gulvtilstand i forbensleddene end i bagbensleddene. Endelig indikerede ganganalysen, at en
høj statisk friktionskoefficent er nødvendig for at sikre grisene mod udskridninger på tørre
betongulve.

ABBREVIATIONS
11
ABBREVIATIONS
a: constant acceleration
α: angular acceleration
BSP: body segment parameter
BW: body weight
COF: coefficient of friction (µ) dCOF: dynamic COF
sCOF: static COF
uCOF: utilized COF
COM: centre of mass
COMrel: relative position of the COM calculated as the dprox in percent of segment length
dprox: distance from COM to proximal segment end
D(YL): offspring from Duroc boars crossed with Yorkshire × Danish Landrace sows
F: force Ff: frictional force
Fn: normal force
g: gravitational acceleration
GRF: ground reaction force GRFap: ante-posterior horizontal GRF
GRFml: medio-lateral horizontal GRF
GRFv: vertical GRF
Inertia: moment of inertia or rotational inertia
ICOM: moment of inertia around the COM
Iprox: moment of inertia around the proximal segment end
JAR: joint axis of rotation
JRF: joint reaction force JRFh: horizontal JRF
JRFv: vertical JRF
M: moment or torque
ml: external load mass
n: number of observations
rt: turntable radius
s.d.: standard deviation
s.e.: standard error
sp: distance between photocells
tl: load drop time

LIST OF PAPERS
12
LIST OF PAPERS
Paper I
Vivi Mørkøre Thorup, Frede Aakman Tøgersen, Bente Jørgensen and Bente Rona Jensen
(2007a). Joint axes of rotation and body segment parameters of pig limbs, Acta
Veterinaria Scandinavica 49:20. 10 pp. (doi: 10.1186/1751-0147-49-20). Provisional pdf
reprinted with kind permission from BioMed Central Ltd.
Paper II
Vivi Mørkøre Thorup, Frede Aakman Tøgersen, Bente Jørgensen and Bente Rona Jensen
(2007b). Biomechanical gait analysis of pigs walking on solid concrete floor, Animal 1:
708-715. Reprinted with kind permission from The Animal Consortium.
Paper III
Vivi Mørkøre Thorup, Bjarne Laursen and Bente Rona Jensen. Net joint kinetics in the
limbs of pigs walking on concrete floor during dry and contaminated conditions,
manuscript submitted to Journal of Animal Science.

GENERAL INTRODUCTION
13
1. GENERAL INTRODUCTION
Background
In modern pig production leg problems are extremely common and constitute a major welfare
problem in the slaughter pig population as well as in the breeding stock. The term ‘leg
problems’ is not an exact diagnosis, as it covers: locomotor disturbances; claw disorders; and
joint disorders like osteochondrosis and osteoarthrosis (Jørgensen, 2003). Locomotor
difficulties range from shortened strides to severe lameness during which the animal refuses
to bear weight on the affected limb and is unwilling or unable to stand (Hill, 1992). Other
signs of leg weakness are e.g. buck-kneed forelimbs, upright pasterns, turned-out limbs, and
standing-under-position in the hindlimbs (Jørgensen, 2003), Figure 1.1.
Figure 1.1: Multiple leg disorders in a pig (left): Standing-under position in the hindlimbs.
The forelimbs are standing wide apart, are turned-out and buck-kneed (photo by Bente
Jørgensen). A pig without leg disorders (right) is shown for comparison.
A pig claw consists of a soft skin covered heel bulb and a hard keratinous sole at the toe
(Webb, 1984), Figure 1.2. Examples of leg problems related to the claws are overgrowth and
lesions (cracks or erosions) in the wall, sole and/or bulb (Mouttotou et al., 1997; Jørgensen,
2000).

GENERAL INTRODUCTION
14
Figure 1.2: The volar surface of a pig’s
foot showing the two main claws and
partly one of the accessory claws. The dark
area indicated by the white ring is an
example of heel erosion (photo by Bente
Jørgensen).
Table 1.1: Frequencies of pigs affected by leg problems as reported in literature.
No. of studied pigs Affected (%) Diagnosis Study Breeding animals culled prematurely
172 Danish sows from herds with mortality>10% 72 Locomotor disorders (Kirk et al., 2005) 1372 Danish sows from 37 herds 59 Leg problems
(Vestergaard et al., 2004)
272 North American sows from herds with mortality>12% 44 Locomotor problems (Irwin et al., 2000) 263 Danish sows randomly selected at slaughterhouse 29 Leg weakness
(Christensen et al., 1995)
67 boars from random Norwegian breeding stations 24 Leg weakness (Grøndalen, 1974)
Pigs slaughtered at normal time
246 Danish boars and gilts from housing experiment 13; 19; 9
Leg weakness; osteochondral changes; claw disorders (Jørgensen, 2003)
3988 boars from Danish breeding stations (examined in vivo at 93 kg) 21 Leg weakness
(Jørgensen and Andersen, 2000)
3974 English pigs from convenience selected herds 94 Foot lesions
(Mouttotou et al., 1997)
2000 Hungarian pigs 85 Claw disorders (Kovacs and Beer, 1979)
373 Norwegian boars and gilts from feeding experiments 48 Leg weakness (Grøndalen, 1974) 3195 English pigs randomly selected at slaughterhouse 65 Foot lesions (Penny et al., 1963)
The prevalence of leg problems is high and has been for years (Table 1.1). More than 22
million slaughter pigs were produced in 2005 in Denmark (Anonymous, 2006). Even a low
sole heel bulb

GENERAL INTRODUCTION
15
estimate of 13% affected animals would mean that at least 2.86 million slaughter pigs
suffered from leg weakness in 2005. In addition to reduced welfare of the affected animal leg
problems cause economic losses to farmers due to reduced growth performance, decreased
carcass quality, and lost breeding potential as both replacement animals as well as breeding
animals are slaughtered prematurely (Kroes and van Male, 1979; Hill, 1992). Moreover, lame
sheep (Ley et al., 1989) and lame cows (Whay et al., 1997) displayed an increased sensitivity
to a mechanical noxious stimuli, indicating that these animals were in a hyperalgesic state.
Furthermore administering an anti-inflammatory drug to lame cows improved their gait
(Weary and Flower, 2006). These findings strongly indicate that lameness is associated with
pain in the affected animals, and it is reasonable to speculate that the association is similar in
swine.
Figure 1.3: Schematic presentation of the multiple causes of leg problems.
The causes of leg problems are multi factorial, possible causal agents are: inappropriate floors
(Jørgensen, 2003); genetics (Jørgensen and Andersen, 2000); infections (Hill, 1992);
nutrition; and lack of exercise caused by small pens and/or high stocking densities (Jørgensen,
2003), Figure 1.3. The pig pen floor has several properties affecting the animals housed on
them, e.g. friction; abrasiveness; surface profile, i.e. edges or grooves; hardness; dimension,
i.e. slat to gap ratio or percentage drainage; and durability, i.e. resistance to wear (Webb and
Nilsson, 1983; Baxter, 1984; McKee and Dumelow, 1995). Floors with too low friction may
cause slips damaging the joints due to overexertion and falls which may cause burns, impact
Leg problems
Genetics
Infections
Lack of exercise
Inappropriate nutrition
Floor properties

GENERAL INTRODUCTION
16
injuries and ultimately can result in fractured legs. Hard floors, as opposed to yielding floors,
do not reduce mechanical pressure on claws or other contacting surfaces by redistributing the
load over a wider area and can cause bruising and swollen joints from lying on the floor. Too
abrasive floors cause excessive wear of the claws and skin lesions whereas too little
abrasiveness leads to overgrown claws (McKee and Dumelow, 1995). Moreover, slippery
floors can potentially make animals adopt abnormal movement patterns, which may have
adverse effects on the limbs.
Already decades ago knowledge of what constitutes a good floor and measurements of
foot/floor interactions to quantify the biological consequences of the physical floor properties
was called for (Webb and Clark, 1981a). In addition, Danish legislation (Anonymous, 2000)
states that in new pig houses for slaughter pigs one third of the floor must be solid or drained,
but in spite of the legislation the effect of floor type on the locomotion of pigs is unknown.
However, to consider all the physical floor properties is beyond the scope of this project,
which focused on the frictional property of the floor in relation to pig gait. Pigs are mainly
housed on slatted or partly slatted floors but normal gait on solid floor has to be characterized,
before the effect of different slatted floors on the gait of pigs can be established.
Gait analysis
Biomechanics
Traditionally, the assessment of pig locomotion, or more precisely gait, has been done
subjectively by judging the pigs clinically and scoring them on a scale from normal to severe
changes (Jørgensen and Vestergaard, 1990). However, technological advances in the field of
biomechanics have made it possible to undertake objective and more advanced, yet non-
invasive studies of gait. The most commonly applied methods of biomechanical gait analysis
are kinematics and kinetics. Kinematics analyses the displacement of body segments, or joint
axes of rotations (JARs), over time usually by video recordings. Kinetics analyses the forces
causing the displacement or movement, for instance by measuring ground reaction forces
(GRFs) with a force plate.
Both kinetics and kinematics have been widely applied in the study of humans (Simonsen et
al., 1997; Alkjær et al., 2001) and domestic animals. Especially horses have been subjected to

GENERAL INTRODUCTION
17
gait analysis (Drevemo et al., 1980; Merkens and Schamhardt, 1988; Martinez-del Campo et
al., 1991; Gustås et al., 2007), but also the gaits of dogs (Budsberg et al., 1987; Hottinger et
al., 1996), cows (Herlin and Drevemo, 1997; van der Tol et al., 2003; Flower et al., 2007) and
chickens (Corr et al., 2003) have been studied biomechanically. In pigs however,
biomechanical gait analysis is sparse and not very detailed. Thus Webb and Clark were, to my
knowledge, the first to show examples of GRF and pressure measurements of a walking pig,
but their study did not quantify any variables (Webb and Clark, 1981a; Webb and Clark,
1981b). Furthermore, in a kinematic study eight pigs weighing 32 to 41kg were filmed as they
walked across wet concrete floors of differing friction (Applegate et al., 1988). In that study
the stance phase duration of the hindlimbs was 9% shorter compared to the forelimbs. Further
the pigs’ forelimbs slipped more and longer and showed more angular changes compared to
the hindlimbs. The floor friction affected the displacement (slip) variables significantly, but
not variables like e.g. the stride (step) length and stride velocity (walking speed). The floors
were however exposed to the pigs for 22 hours prior to testing, which increased the initial
friction considerably in five cases and decreased it in one case, and since the mean of the
friction before and after testing was used for the statistics, this may have confounded the
results. A few kinematic studies of treadmill walking pigs also exist (Calabotta et al., 1982;
Barczewski et al., 1990), however these studies did not focus much on gait related
measurements, but rather on measurements related to structural soundness (i.e. conformation),
such as the torso length, distance between the hocks, and the angle of the pastern segments
relative to horizontal.
Inverse dynamic modeling
Kinematics and kinetics do not describe the internal forces in the limbs. Nevertheless internal
forces can be calculated using a linked segment model, which consists of rigid segments
linked to each other at the joints. The input for the linked segment model consists of
kinematic and kinetic data from moving animals along with measurements of their body
segment parameters (BSPs). In Figure 1.4 the tree types of input are shown with thick lines.
Together with knowledge of the BSPs, i.e. the segment masses, moments of inertia and
centers of mass, usually obtained from cadaver studies, an inverse dynamic solution is used to
calculate the net joint forces and moments. Net joint forces describe the resultant of all the
forces acting across a joint, i.e. bone, ligament and muscular forces (Vaughan et al., 1999).
Correspondingly net joint moments, which are produced by forces acting through a moment

GENERAL INTRODUCTION
18
arm resulting in rotary motion of a segment, describe the resultant moment of force or torque
produced by the muscles, tendons and ligaments, thus giving information about the amount of
muscle activity and whether the joints are dominated by a flexor or extensor moment.
Figure 1.4: Schematic presentation of applied inverse dynamics. Modified after Vaughan and
colleagues (Vaughan et al., 1999).
BSPs for inverse dynamic modeling have been reported for various species, such as horses
(van den Bogert, 1989; Buchner et al., 1997) and dogs (Nielsen et al., 2003). Also the JAR
locations of horses (Colahan et al., 1988) and dogs (Arnoczky et al., 1977) have been
examined. To my knowledge, neither the BSPs nor the JAR locations have been studied in
pigs.
Over the last decade inverse dynamic solutions have been used to describe the joint moments
in the limbs of walking horses (Colborne et al., 1998; Clayton et al., 2000; Clayton et al.,
2001) and dogs (Nielsen et al., 2003; Colborne et al., 2005). The tibio-femoral joint contact
Body segment parameters: mass, length &
moment of inertia
Inverse dynamics model (equations of motion)
Body segment displacements (kinematics)
Ground reaction forces (kinetics)
Net joint forces & moments
Measurements of body segments
Angular velocities, accelerations & angles

GENERAL INTRODUCTION
19
forces in surgically operated sheep have also been described using inverse dynamics (Taylor
et al., 2006), but neither the joint reaction forces nor the joint moments have been analysed in
pigs.
Friction
As mentioned earlier pigs reared under intensive production systems may have limited
exercise possibilities caused by the generally small pens and/or high stocking densities. Lack
of exercise reduces muscle weight and bone strength in sows (Marchant and Broom, 1996)
and it reduces bone development in growing pigs (Weiler et al., 2006). Thus the floor in the
part of the pig pen, which is meant for feeding, drinking, dunging and moving around (i.e. not
the resting area) should not, by being slippery, further restrain the pigs from exercising or
restrict their normal behavioural repertoire, such as play behaviour or settling of dominance
relationship.
In relation to slipperiness the main factor involved is the coefficient of friction (COF) of the
floor, which is a measurement of the force generated between the contacting surfaces of two
materials or objects, e.g. the floor and the foot. The COF, represented by the symbol µ, is a
constant, which is measured as the ratio between the frictional force (Ff), meaning the force
parallel to the sliding surface, and the normal force (Fn), which is always perpendicular to the
normal force (Young and Freedman, 2004). This relationship is shown in Equation 1.1:
µ = Ff / Fn (1.1)
Two frictional measurements are used, depending on whether the contacting surfaces are
motionless, i.e. static, in which case the static COF (sCOF) is used. If one or both of the
surfaces are in motion, the dynamic COF (dCOF) is used. By measuring the ratio between the
Ff and Fn just before sliding starts, the sCOF is obtained, whereas the dCOF is measured once
sliding has started. The dCOF is usually lower than the sCOF (Young and Freedman, 2004). It
is the actual contact area on a microscopic level between the two surfaces, not the total area
that determines the COF, therefore the roughness and hardness of the two contacting surfaces
influence the COF. Furthermore the COF can be influenced by the presence of contaminant
fluids on the floor surface (Redfern and Bidanda, 1994) and by contact pressure, velocity,
type of test equipment and test conditions (Baxter, 1984; Redfern et al., 2001).

GENERAL INTRODUCTION
20
Walking safely depends on a proper COF between a subject’s foot and the floor. When
determining the slip propensity of a subject walking on a particular floor, the COF required by
the walking subject is typically compared with the sCOF or dCOF available at the foot/floor
interface. The required or utilized coefficient of friction (uCOF) is defined as the ratio
between the resultant horizontal and vertical ground reaction forces at the subject-floor
interface. In theory, a slip occurs when the uCOF produced during foot-floor contact exceeds
the available COF (Redfern et al., 2001). In this way the relationship between the utilized and
the available COF expresses the risk of slipping. In walking humans anticipating a slippery
floor postural and temporal gait adaptations reduced the peak uCOF (Cham and Redfern,
2002). Furthermore, the peak uCOF has been shown to increase with increased walking speed
(Powers et al., 2002). In cows the locomotion has been investigated during dry, wet and
slurry-covered floor conditions (Phillips and Morris, 2000). Moreover the slips of cows on
dry and slurry-covered solid floors have been studied (Albutt et al., 1990), and the uCOFs
produced by cows performing three different locomotor behaviours have also been examined
(van der Tol et al., 2005). Additionally, in cows increasing the sCOF showed a rapid decrease
in slipping according to results rearranged by Webb and Nilsson (Webb and Nilsson, 1983).
In pigs, however, biomechanical analyses studying the effects of floor condition on
locomotion are few despite the high prevalence of leg problems. As mentioned, one study
kinematically analysed the gait of pigs on floors with different friction coefficients (Applegate
et al., 1988), however no GRFs were measured. Another study measured the GRFs of young
pigs walking on sailcloth, for which the authors only estimated the COF (Webb and Clark,
1981a). Slips occur considerably more often in sows manoeuvring on a smooth metal floor
compared to a ridged plastic floor (Leonard et al., 1997) and a rubber mat (Boyle et al.,
2000). In these studies the slipperiness of the floors, unfortunately, was not measured. Hence,
it has so far not been studied kinetically whether pigs adapt their gait according to the floor
condition. In addition the floor of a pig pen is often wet, dirty or greasy from water, urine and
faeces, consequently it is important to examine the floors under similar, so-called
contaminated, yet standardized conditions.

GENERAL INTRODUCTION
21
Aims
The purposes of this project were to:
• Characterize the walk of healthy pigs on concrete solid floor
• Examine if pigs modify their gait according to floor condition
• Suggest a safe COF, i.e. a minimum threshold, for solid concrete floors
• Measure the body segment parameters (i.e. mass, COM and moment of inertia) of
pigs’ limbs
• Determine the rotation axes of the joints of pigs’ limbs
• Calculate the net reaction forces and moments of the fore- and hindlimb joints of pigs
walking on solid concrete floor
• Examine the effect of floor condition on the net joint reaction forces and joint
moments
Outline
In chapter 2 the materials and methods are summarised, followed by the results in chapter 3.
Chapter 4 is a general discussion of the results presented in this thesis. Conclusions and
perspectives are given in chapter 5. Chapter 6 is a list of the references used through chapters
1 to 5. The thesis is based on three papers referred to by Roman numerals. An overview of the
measured variables and where they are reported is given in Table 1.2.
GENERAL INTRODUCTION
22
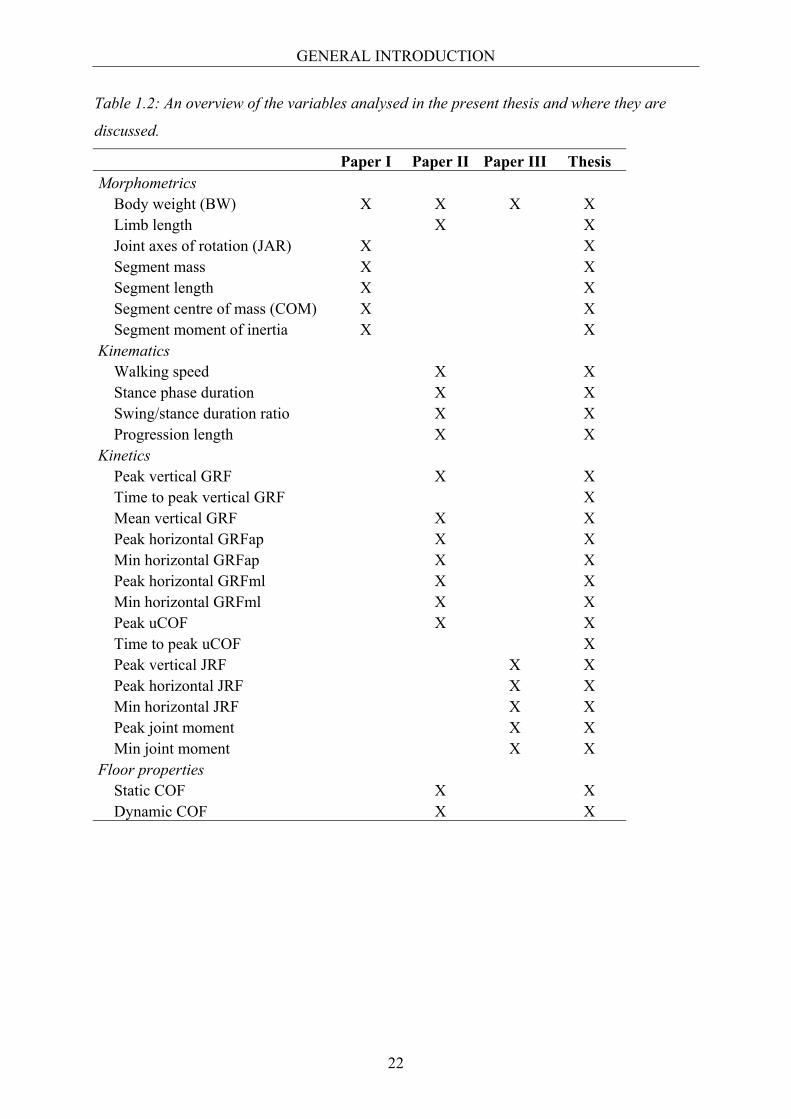
Table 1.2: An overview of the variables analysed in the present thesis and where they are
discussed.
Paper I Paper II Paper III Thesis Morphometrics Body weight (BW) X X X X Limb length X X Joint axes of rotation (JAR) X X Segment mass X X Segment length X X Segment centre of mass (COM) X X Segment moment of inertia X X Kinematics Walking speed X X Stance phase duration X X Swing/stance duration ratio X X Progression length X X Kinetics Peak vertical GRF X X Time to peak vertical GRF X Mean vertical GRF X X Peak horizontal GRFap X X Min horizontal GRFap X X Peak horizontal GRFml X X Min horizontal GRFml X X Peak uCOF X X Time to peak uCOF X Peak vertical JRF X X Peak horizontal JRF X X Min horizontal JRF X X Peak joint moment X X Min joint moment X X Floor properties Static COF X X Dynamic COF X X

METHODS
23
2. METHODS
Animals
Two groups of pigs without visual abnormalities on the limbs were used for the morphometric
studies described in Paper I. To locate the JARs six castrates and six gilts were used. Their
average body weight (BW) immediately after slaughtering, thus corresponding to live BW
was 77+7kg (range 64 to 85kg). To establish the BSPs one castrate and four gilts with an
average BW of 69+5kg (range 63 to 73kg) were used.
The pigs used for the gait analysis described in Paper II and III were 30 gilts or castrates from
17 different sows. The pigs’ average BW was 75+6kg (range 64 to 86kg). They showed no
signs of lameness, i.e. they walked without limping when allowed to walk freely on solid
floor outside their home pen.
All of the 42 pigs studied in the present thesis were Duroc × Yorkshire × Landrace, i.e. D(YL)
crossbreeds. They were fed ad libitum and housed on partly slatted concrete at the Faculty of
Agricultural Sciences (the former Research Centre Foulum), University of Aarhus.
Experimental set-ups and procedures
Morphometrics
To establish the JARs the right fore- and hindlimbs were removed from the slaughtered pigs,
and the skin and muscles were removed from the limbs without disarticulating the joints. The
eight joints examined were the shoulder (scapulohumeral), elbow (humeroradial), carpal
(carpal complex), forefetlock (metacarpophalangeal), hip (coxofemoral), stifle (femorotibial),
hock (tarsal) and hindfetlock (metatarsophalangeal), Figure 3.1. With the bones lying on the
medial side digital photos were taken of each joint in extended, neutral and flexed position
around the mediolateral axis, see Figure 2.1 for an example of the shoulder joint. The JARs
were calculated from the photos by drawing bisecting lines parallel to the proximal-to-distal
axis of the bone at fixed landmarks and locating the intersection (Leach and Dyson, 1988).
For alignment of the photos two reference points were placed at distinct landmarks on one
bone of the joint, and on the other bone two reference points defined a bisecting line parallel

METHODS
24
to the proximal-to-distal axis of that bone. The intersection of the three lines marked the JAR.
The results are described qualitatively in relation to bony landmarks palpable on the skin.
Figure 2.1 Locating the shoulder joint (lateral view). Photos of extended (bottom layer),
relaxed (middle) and flexed (top) positions are overlaid. Layers are aligned after two large
dots on the humerus. Two small dots on the scapula define the bisecting lines parallel to the
proximal-to-distal bone axis. The average of the intersection points is the JAR.
Figure 2.2 Schematic representation of the
experimental set-up for measurement of the
segmental moment of inertia. The turntable
is shown unloaded, i.e. without a segment.
Unloaded turntable
Photocell
Photocell
External load

METHODS
25
For the study of the BSPs the right fore- and hind limbs were separated from the trunks of the
slaughtered and exsanguinated pigs and cooled. The chilled limbs were dissected into
segments along craniocaudal lines as close as possible to the identified JARs, after which the
segments were frozen in horizontal position with the lateral side up. The ten segments
investigated were the: humerus, radius/ulna, metacarpus, forepastern (proximal and middle
phalanges), foretoe (distal phalanges), femur, tibia, metatarsus, hindpastern (proximal and
middle phalanges), and hindtoe (distal phalanges). The mass; the length; the distance between
the center of mass (COM) and the proximal segment end (dprox); and the moment of inertia
were measured on the frozen segments. The sagittal plane COM was located by balancing the
segments transversely and longitudinally with the lateral side up. The moment of inertia was
measured by strapping the segments onto a custom made low-friction horizontal turntable. An
external load connected to the turntable was dropped, made the turntable turn and passed
between two photocells measuring the drop time of the load. The experimental set-up for
measuring the moment of inertia is shown in Figure 2.2. The equations used for calculating
the moment of inertia are given later in the section regarding data processing.
Gait analysis
For the gait analysis the pigs walked individually on the test floor along a 0.5m wide and 6m
long aisle. The test floor was solid concrete (flagstone, Perstrup Concrete Industry A/S,
Kolind, Denmark) with a rough and absorbing surface (Figure 2.6 left). Three floor
conditions: Dry, wet (tap water) and greasy (rape seed oil) conditions were tested with 10 pigs
each. Bony landmarks were palpated and seven markers placed on the right limbs of the pigs
(Figure 2.3). The marker set-up can be found on page 2 showing a pig during gait analysis.
Furthermore, the marker set-up is described and shown schematically in Paper III, Figure 1.
Kinematic and kinetic data were collected simultaneously from the pigs, as they walked at a
self-selected, steady speed. Three to four successful trials for both the fore- and hindlimbs
were obtained.

METHODS
26
Figure 2.3: Marker placement. The bony landmark of the hip is palpated (left) and the marker
is placed (right) using acrylic painting (photos by Anton S. Jensen).
The GRFs and moments were recorded at 1KHz from a 0.20×0.30m2 force plate (MU2030,
Bertec Corporation, Columbus, OH) embedded in the central part of the aisle. The force plate
was mounted with the test floor on it, invisible to the pigs. A digital video camera (NV-
DS30EG, Panasonic Denmark, Glostrup, Denmark) recorded the central 1.4m of the aisle
from the right side in the sagittal plane at 50Hz. The camera shutter speed was set to 1/500s
and 150W lamp ensured sufficient illumination of the pigs’ markers. As a pig stepped on the
force plate a light emitting diode (LED) within the camera field, but above the view of the
pigs, went on to synchronize kinetic and kinematic data. The force data collection, turning on
and off the LED, and turning off the camera was done by custom-made software (SideStepper
version 1.3b, TA, Aalborg, Denmark). The experimental gait analysis set-up is shown in
Figure 2.4. The object field of the aisle was calibrated using a rectangular frame with four
points that encompassed the field of analysis.
The force plate coordinate system (schematically shown in Figure 2.5) was defined so that the
vertical GRFs (GRFv) were positive during the stance phase. The anteposterior horizontal
GRFs (GRFap) were defined as positive in the direction of movement. The horizontal
mediolateral forces (GRFml) were positive when directed laterally (outwards).

METHODS
27
Figure 2.4: The experimental set-up for the gait analysis. From this angle the solid test floor
in the aisle is hardly visible.
Figure 2.5: The force plate coordinate
system with the positive GRFv, GRFap
and GRFml directions indicated. The
ground reaction forces are shown as
reaction-oriented.
Floor friction
The COFs of the dry, greasy and wet floor conditions were measured1 using an Instron 5569
drag device (Figure 2.6). The drag device had a polyether urethane material (Elastollan
1185A, Elastogran GmbH, Lemförde, Germany) on the measuring surface (area:
0.064×0.064m2; weight: 5kg), which was dragged across the test surface at a speed of
0.002m/s. The sCOF was defined as the peak occurring at the onset of movement, and the
dCOF as the mean of measurements made over a distance of approximately 0.1m. The
average sCOFs and dCOFs were calculated from 10 measurements.
1 At The Danish Technological Institute, Gregersensvej 1, DK-2630 Taastrup, Denmark
video camera
force plate
filmed section of aislecupboard with pc
LED
walking directon
GRFv (Fz)
GRFap
GRFml (Fx)
+
+
+

METHODS
28
Figure 2.6: Left: The experimental set-up
for the floor friction measurements. Right:
A close-up of the concrete floor with the
dragging device (Photos by Søren
Pedersen, Danish Technological Institute).
Data processing
In the morphometric studies regarding the JARs, minor uncertainty in placing the reference
points at landmarks usually generated three points of intersection in the photos, therefore an
arithmetic average of the three points was calculated (Figure 2.1).
To obtain the BSPs, the relative position of the COM was calculated as the dprox in percent of
the total segment length. The calculation of the moment of inertia was based on well-known
laws of physics and will be explained in the following. A load dropped vertically over a
distance s will fall or move with a constant linear acceleration a for the time t (equation 2.1):
s = ½ a • t2 a = 2 s/t2 (2.1)
Further, the angular acceleration α can be calculated from the a and from the radius of the
turntable rt according to equation 2.2:

METHODS
29
α = a/rt (2.2)
Substituting equation 2.1 into equation 2.2 yields equation 2.3:
α = (2s/t2)/rt = 2s/(t2 • rt) (2.3)
Then the moment M of the load affecting the turntable was calculated from the radius rt and
the force F (equation 2.4). Here F was calculated from the mass of the load ml and the
gravitational acceleration g according to Newton’s second law, the law of acceleration.
M = F • rt = ml • g • rt (2.4)
By applying Newton’s second law to rotational motion, i.e. the relationship between M and α,
the moment of inertia of the system Isys could be calculated according to equation 2.5:
M = Isys • α Isys = M/α (2.5)
By substituting equations 2.3 and 2.4 into 2.5, thus yielding equation 2.6, the Isys could be
calculated from the mass of the external load ml (0.203kg); the gravitational acceleration g
(9.82m/s2); the radius of the turntable rt (0.15m); the distance between the two photocells sp
(1.317m); and the load drop time tl:
Isys = ((ml • g • rt) • (tl2 • rt))/2s = (ml • g • rt
2 • tl2)/2sp (2.6)
Finally, the segment moment of inertia was calculated by subtracting the moment of inertia of
the unloaded turntable from the moment of inertia of the turntable loaded with the segment.
The metacarpal, metatarsal, pastern and toe segments were too light to have their moment of
inertia measured with the described set-up, thus their moment of inertia was estimated from
their mass, length and circumference according to equation 2.7, assuming that the segments
were cylindrical (Vaughan et al., 1999). Furthermore the toe segments could not be balanced,
therefore their COM and moment of inertia were approximated.

METHODS
30
moment of inertia = mass/12 • (length2 + 0.076 • circumference2) (2.7)
The video sequences from the gait analysis were digitized using Pinnacle Studio (version 8,
Pinnacle Systems, Inc., Mountain View, CA), 2-dimensional coordinates were constructed
and digitally low-pass filtered by a fourth order Butterworth filter with a cut-off frequency of
8Hz using APAS (Ariel Dynamics Inc, Trabuco Canyon, CA). The kinetic data were
downsampled to 50Hz to fit the sampling frequency of the kinematic data. Furthermore the
kinetic data were normalized in magnitude by body mass to enable comparisons between
individuals of different body mass. To compensate for differences in stance phase durations
all data were normalized in time by interpolating data points to form 100 samples for each
stance phase.
The kinematic data, kinetic data and the BSPs were combined in an inverse dynamic solution
using a linked segment model (Quanbury et al., 1975). Assumptions to the model were that
segments were rigid, that the joints were ideal hinge joints, and that movement was pure
rotation around a fixed axis (Winter, 2004). Positive joint moments were defined such that
counterclockwise moments acting on a segment distal to the joint were positive, whereas
clockwise moments were negative (Winter, 2004). The extensor side was the cranial (anterior)
side for the elbow, hip, and tarsal joints, and the caudal (posterior) side for the other joints
(Paper III Figure 1).
All calculations made for the project were programmed in MATLAB (2002, The MathWorks
Inc, Natick, MA, USA).
Statistical analysis
In Paper I the locations of JARs were described anatomically and the BSPs were measured.
The results were presented as means + standard deviations (s.d.).
For Paper II statistical comparisons of floor conditions and of the limbs were made using a
two-way ANOVA test. The kinematic and kinetic variables were tested separately in a
repeated measurement model. Floor condition and limb were the systematic effects. The
random effects were the sow (i.e. kinship); the residual error term; and the repeated effect of

METHODS
31
trials (within pig limb), which was incorporated into the model under the assumption that
neighbouring trials were more correlated than those farther apart. With three floor conditions,
ten pigs per condition, two limbs per pig and four trials per limb, this yielded a maximum
number of observations of 240 for each variable. However, some trials were discarded upon
close inspection, mainly due to incomplete force data at the beginning or end of the stance
phase.
Differences in body parameters, meaning the BW and limb length between pigs from the
three floor conditions were tested in a SAS GLM procedure (2001, SAS Institute Inc, Cary,
NC). The sCOF and dCOF of the floor conditions were tested using a paired t-test.
In Paper III comparisons of the floor conditions and of the joints were performed using a two-
way ANOVA test. All the kinematic and kinetic variables were tested separately in a repeated
measurement model. Floor condition and joint were the systematic effects. The random effect
was the residual error term and the repeated effect of joint (within pig limb), which was
incorporated in the model under the assumption that adjacent joints were more correlated than
those farther apart. The trials were averaged per limb, furthermore differences between joints
were compared within limbs only. The three floor conditions, ten pigs per condition and five
joints per pig yielded a maximum number of observations of 150 for each variable.
The SAS MIXED procedure (2001, SAS Institute Inc, Cary, NC) was used for the ANOVA
tests. A level of significance of 5% was used throughout unless otherwise mentioned.

RESULTS
32
3. RESULTS
Morphometrics
The average and the individual JAR locations are shown in Figure 3.1 in which they are scaled to
the fore- and hindlimbs of one pig. The JARs were primarily located at or near the attachment
sites of the lateral collateral joint ligaments.
Figure 3.1: The average (crosses) and individual (dots) JAR locations of 12 pigs related to one
animal. Lateral view. Top: Forelimb with the shoulder (1F), elbow (2F), carpal (3F) and fetlock
(4F) JARs. Bottom: Hindlimb with the hip (1H), stifle (2H), tarsal (3H) and fetlock (4H) JARs.
For scaling purposes a measuring stick with black and white fields of 1cm was placed next to the
bones.

RESULTS
33
The average weight decrease due to blood loss and water evaporation from the whole carcasses
was 5.2% BW. The relative BSPs reported in Table 3.1 were the values used for the
biomechanical model described in Paper III. In Paper I, Table 1 the absolute BSPs were reported
in addition to the relative values. The COM ranged from 31 to 50% of the segment length
measured from the proximal segment end, meaning that the COM was located proximally in all
segments. The segment mass as well as the moment of inertia decreased with increasing distance
from the trunk, thus the proximal segments were the heaviest and had the largest moments of
inertia.
Table 3.1: The relative BSPs: the segment mass (% BW); the COM (distance from the proximal
segment end to the COM in % of segment length); and the moment of inertia around the
proximal segment end (Iprox, % BW×segment length2) for the right fore- and hindlimb segments
from slaughtered animals. Values are means (s.d.) of five pigs.
Mass COM Iprox
% % %
Forelimb
Humerus 1.94 (0.12) 46 (2) 0.00813 (0.00094)
Radius/ulna 1.05 (0.04) 31 (3) 0.00264 (0.00040)
Metacarpus 0.18 (0.03) 49 (2) 0.00061 (0.00011)T
Pastern 0.15 (0.01) 45 (2) 0.00050 (0.00002)T
Toe 0.04 (0.00) 50A 0.0001A
Hindlimb
Femur 6.50 (0.22) 50 (5) 0.01376 (0.00147)
Tibia 1.44 (0.07) 40 (4) 0.00385 (0.00040)
Metatarsus 0.42 (0.03) 32 (6) 0.00092 (0.00015)T
Pastern 0.16 (0.01) 40 (6) 0.00044 (0.00007)T
Toe 0.04 (0.01) 50A 0.0001A AApproximated; TThree pigs.

RESULTS
34
Gait analysis
Kinematics
The pigs walked with a four-beat gait characterized by alternating two and three limb support
phases. The fore- and hindlimbs differed kinematically (Table 3.2.), thus the stance phase
duration of the forelimbs was longer compared to the hindlimbs, and the swing to stance phase
ratio was lower on the forelimbs than on the hindlimbs. Floor condition affected the kinematics
(Table 3.2), as the pigs’ walking speed was faster on dry condition compared to contaminated
conditions. In addition the progression length was longer on dry condition compared to greasy
condition, whereas wet condition was intermediate. Furthermore the stance phase lasted longer
on greasy condition compared to dry and wet conditions.
Table 3.2: The kinematic gait variables for the floor conditions and/or limbs reported as least
square means (s.e.).
Floor condition Limb
n Dry Wet Greasy Fore Hind
Walking speed (m/s) 192 0.88 (0.03)a 0.79 (0.03)b 0.74 (0.03)b
Progression length (m) 192 0.75 (0.01)a 0.73 (0.01)ab 0.70 (0.01)b
Swing/stance phase ratio 192 0.62 (0.02)A 0.70 (0.02)B
Stance phase duration (s) 226 0.60 (0.02)a 0.63 (0.02)a 0.69 (0.02)b 0.69 (0.02)A 0.59 (0.02)B
Different superscripts denote significant differences at the levels: a,b 0.001<P<0.01; A,B P<0.001.
Table 3.3: The vertical ground reaction force (GRFv) and utilized coefficient of
friction (uCOF) variables reported as least square means (s.e.).
n Condition Forelimb Hindlimb
Mean GRFv (N/Kg) 226 3.76 (0.04)a 3.22 (0.04)b
Peak GRFv (N/Kg) 233 5.63 (0.06)a 4.43 (0.06)b
PeakTime GRFv (%) 226 59 (2)a 34 (2)b
Peak uCOF 224 Dry 0.48 (0.02)a
Wet 0.42 (0.02)b
Greasy 0.32 (0.02)c
PeakTime uCOF (%) 224 6 (4)a 23 (4)b a, bDifferent superscripts denote significant differences at P<0.001.

RESULTS
35
GRFs and utilized friction
The vertical GRF time course followed a two-humped pattern with the second maximum
typically being higher than the first maximum in the forelimb. In the hindlimb the vertical GRF
time course was also two-humped, but the first maximum was typically the highest (Figure 3.2).
The time course of the GRFap was approximately sinusoidal, and the GRFml was mostly
negative during the stance phase (Figure 3.2). The mean and peak GRFv were higher in the
forelimbs than in the hindlimbs (Table 3.3).
Figure 3.2: A typical example of the vertical (GRFv), anteposterior horizontal (GRFap) and
mediolateral horizontal (GRFml) ground reaction forces exerted by the forelimb (left curves)
followed by the hindlimb (right curves) of a pig walking on dry floor.
For both limbs the uCOF was highest at the beginning and towards the end of the stance phase
with a minimum around mid stance (Paper II, Figure 2). The peak uCOF was lower on greasy
floor compared to wet floor, which again was lower compared to dry floor (Table 3.3). The
timing variables of the peak vertical GRF (PeakTime GRFv) and of the peak uCOF (PeakTime
uCOF) were not normally distributed, thus their corresponding P-values should be interpreted
with caution, nevertheless the time to peak GRFv was longer in the forelimbs compared to the
-1
0
1
2
3
4
5
6
0.0 0.2 0.4 0.6 0.8 1.0 1.2 1.4
Time (s)
Forc
e (N
/Kg)
Forelimb Hindlimb
GRFv
GRFap GRFap
GRFml
GRFml

RESULTS
36
hindlimbs, whereas the time to peak uCOF was shorter in the forelimbs than in the hindlimbs
(Table 3.3).
Regarding the horizontal GRFs there were differences between the limbs and between the floor
conditions (Paper II, Table 2). The floor effects are evident from Figure 3.3. Thus the forelimb
peak GRFap was lower on greasy floor compared to the other conditions. In the hindlimbs the
peak GRFap was higher on wet floor compared to dry and greasy conditions and the minimum
GRFap was more negative on dry floor than on contaminated floors. Further the peak GRFml in
the hindlimbs was higher on dry floor compared to the contaminated conditions. The limbs
differed (Paper II, Table 2) in the following ways: The peak GRFaps on the contaminated
conditions were lowest in the forelimbs. On dry floor the hindlimb minimum GRFap was more
negative than on the contaminated conditions. The hindlimbs exerted higher peak GRFml than
the forelimbs, whereas the minimum GRFml was most negative in the forelimbs.
Figure 3.3: The peak and minimum horizontal GRFs (N/kg) for both limbs. White bars: dry
condition; Black bars: wet condition; Grey bars: greasy condition. Top row: Anteposterior (ap)
forces. Bottom row: Mediolateral (ml) forces. Values are least square means, n=227. Error bars
are s.e. A star indicates that the condition concerned differs significantly from the two others.
-1-0.8
-0.6-0.4
-0.2
0
0.20.4
0.6
0.8
1
GRF
ap (N
/kg)
-1-0.8
-0.6-0.4
-0.2
00.2
0.40.6
0.8
1
GRF
ap (N
/kg)
-0.8
-0.6
-0.4
-0.2
0
0.2
0.4
GRF
ml (
N/k
g)
-0.8
-0.6
-0.4
-0.2
0
0.2
0.4
GRF
ml (
N/k
g)
Hindlimb Forelimb
D W G GWD

RESULTS
37
Joint kinetics
The time courses of the vertical and horizontal JRFs (Paper III, Figure 3) were similar to those of
their respective GRFs (Figure 3.2), further the peak vertical JRF was approximately 8 times
higher than the peak horizontal JRF (Table 3.4). Greasy floor condition decreased the peak
horizontal forelimb JRF compared to dry condition, whereas wet condition was intermediate
(Table 3.4a). Moreover the minimum horizontal hindlimb JRF was smaller (i.e. less negative) on
contaminated conditions compared to dry condition (Figure 3.4). The peak vertical JRF was not
affected by floor condition in any of the limbs (Table 3.4a).
Table 3.4a: The peak and minimum JRFs (N/kg×10-2) and joint moments (Nm/kg×10-2) of the
fore- and hindlimbs for the three floor conditions. Values are least square means (s.e.) across all
joints, n=150.
Condition
Dry Wet Greasy P
Forelimb
Peak JRFv (N/kg×10-2) 549 (10) 557 (10) 562 (10)
Peak JRFh (N/kg×10-2) 77 (4)a 67 (4)ab 60 (4)b *
Min JRFh (N/kg×10-2) -77 (5) -75 (5) -80 (5)
Peak M (Nm/kg×10-2) 23.2 (1.2)a 23.0 (1.2)a 18.4 (1.2)b **
Min M (Nm/kg×10-2) -9.1 (0.9)a -9.1 (0.9)a -11.9 (0.9)b *
Hindlimb
Peak JRFv (N/kg×10-2) 427 (8) 433 (8) 424 (8)
Peak JRFh (N/kg×10-2) 77 (3)ab 83 (3)a 75 (3)b <0.1
Min JRFh (N/kg×10-2) -89 (3)a -76 (3)b -74 (3)b ***
Peak M (Nm/kg×10-2) 20.9 (1.2) 22.0 (1.2) 20.5 (1.2)
Min M (Nm/kg×10-2) -5.9 (0.5) -5.4 (0.5) -5.8 (0.5) a, b Within a row condition means that do not have a common superscript differ significantly (* P < 0.05; ** P <
0.01; *** P < 0.001).
The peak vertical JRFs were highest in the distal joints and lessened with decreased distance
from the trunk (Table 3.4b). The elbow and shoulder joints differed from each other, moreover
they exerted both higher peak horizontal JRFs and more negative minimum horizontal JRFs than

RESULTS
38
the other forelimb joints. The hip exerted higher peak horizontal JRFs as well as more negative
minimum horizontal JRFs compared to the other hindlimb joints (Table 3.4b).
Figure 3.4: The peak and minimum horizontal JRFs (N/kg) for the three floor conditions. White
bars: dry condition; Black bars: wet condition; Grey bars: greasy condition. Values are least
square means, n=150. Error bars are s.e. Stars indicate that min JRFh hindlimb dry condition is
significantly most negative, and that peak JRFh forelimb dry and greasy conditions differ.
Table 3.4b: The peak and minimum JRFs (N/kg×10-2) and joint moments (Nm/kg×10-2) of the
fore- and hindlimb joints. Values are least square means (s.e.) across all floor conditions,
n=150.
Joint
Coffin Fetlock Carpal/Tarsal Elbow/stifle Shoulder/hip
Forelimb
Peak JRFv (N/kg×10-2) 566 (6)a 565 (6)b 563 (6)c 552 (6)d 534 (6)e
Peak JRFh (N/kg×10-2) 70 (2)a 70 (2)a 70 (2)a 66 (2)b 64 (2)c
Min JRFh (N/kg×10-2) -75 (3)a -75 (3)a -76 (3)a -77 (3)b -83 (3)c
Peak M (Nm/kg×10-2) 15.8 (0.9)a 21.6 (0.9)b 22.8 (0.9)b 34.5 (0.9)c 12.8 (0.9)d
Min M (Nm/kg×10-2) -1.0 (0.7)a -0.9 (0.7)a -2.3 (0.7)a -8.4 (0.7)b -37.6 (0.7)c
Hindlimb
Peak JRFv (N/kg×10-2) 447 (4)a 446 (4)a 441 (4)b 429 (4)c 377 (4)d
Peak JRFh (N/kg×10-2) 78 (2)a 77 (2)a 76 (2)a 76 (2)a 85 (2)b
Min JRFh (N/kg×10-2) -77 (2)a -77 (2)a -78 (2)a -79 (2)a -88 (2)b
Peak M (Nm/kg×10-2) 14.3 (0.9)a 22.2 (0.9)b 32.9 (0.9)c 11.0 (0.9)d 25.2 (0.9)e
Min M (Nm/kg×10-2) -0.9 (0.5)a -0.5 (0.5)a -1.4 (0.5)a -15.4 (0.5)b -10.3 (0.5)c a, b Within a row joint means with differing superscripts differ significantly at P<0.001.
-1-0.8-0.6-0.4-0.2
00.20.40.60.8
1
Hor
izon
tal j
oint
forc
e (N
/kg)
-1-0.8-0.6-0.4-0.2
00.20.40.60.8
1
Hor
izon
tal j
oint
forc
e (N
/kg)
Hindlimb Forelimb
D DW G W G

RESULTS
39
The joint moment time courses were similar across all floor conditions, but differed between
joints (Paper III, Figure 2). The shoulder moment had a small flexor dominated peak around 16%
stance phase, then shifted to extensor domination with a large negative minimum around 76%
stance. The elbow moment increased quickly towards an extensor dominated peak around 26%
stance, then declined to flexor domination having a negative minimum at 95% stance. The carpal
joint was entirely flexor dominated. The flexor dominated fore- and hindfetlock joint moments
had similar patterns rising moderately towards the peaks around 73% and 62%, respectively. The
flexor dominated fore- and hindcoffin joint moment patterns were also alike, with slow increases
until peaking at approximately 78% stance. The mainly extensor dominated hip moment peaked
around 38% stance with only a short flexor dominated period with a minimum at 90% stance.
The stifle moment was initially small with a flexor dominated peak around 18% stance, it then
shifted to extensor domination with a negative minimum around 80% stance. The entirely
extensor dominated tarsal joint moment peaked around 37% stance. A timing pattern was
present, as the peak moment occurred early in proximal joints and later the more distal the joint.
Floor condition caused different forelimb joint moment magnitudes. Thus in the forelimb greasy
condition lowered the peak moment by 21% compared to dry and wet conditions, moreover the
minimum moment was 24% more negative on greasy than on dry and wet conditions (Table 3.4a
and Figure 3.5).
Figure 3.5: The peak and minimum joint moments (Nm/kg). White bars: dry condition; Black
bars: wet condition; Grey bars: greasy condition. Values are least square means, n=150. Error
bars are s.e. Stars indicate that in the forelimb greasy condition differs significantly from the
other conditions with respect to both peak and min joint moments.
-0.2
-0.1
0
0.1
0.2
0.3
Join
t m
om
ent
(Nm
/kg
)
-0.2
-0.1
0
0.1
0.2
0.3
Join
t mom
ent (
Nm
/kg)
Hindlimb Forelimb
D DW G W G

RESULTS
40
The majority of the joints differed with regard to both peak and minimum moments (Table 3.4b).
Thus the highest moment amplitudes (i.e. the range between the peak and minimum moments) in
the forelimb were in the shoulder and elbow joints. In the shoulder the large range was caused by
a highly negative moment, whereas in the elbow the range was due to a very high positive
moment. In the hindlimbs the highest joint moment amplitudes were in the hip and tarsal joints,
which both showed considerable peak and minimum moments.
Floor friction
In general the dynamic COFs tended to be lower than the static COFs (Figure 3.6), although the
only significant difference between the sCOF and dCOF was on greasy floor. As expected the
dCOF was lowest on greasy floor, surprisingly however the sCOF was unaffected by floor
condition.
Figure 3.6: The static (S) and dynamic (D) COFs (dimensionless) for the three floor conditions.
Values are means of 10 measurements. Error bars are s.d. The star indicates that greasy
condition dCOF is significantly lower than the other measurements.
0.00
0.20
0.40
0.60
0.80
COF
(dim
ensio
nles
s)
Dry S Dry D Wet S Wet D Greasy S Greasy D

GENERAL DISCUSSION
41
4. GENERAL DISCUSSION
Comparative morphometrics
The location of the JARs around the attachment sites of the lateral collateral ligament of the joints
(Paper I) were consistent with findings in which the rotation axes of the shoulder, elbow, carpal,
forefetlock, stifle, hock, and hindfetlock joints of anaesthetized horses were radiographed (Leach
and Dyson, 1988) and with findings for the forefetlock JAR, where dead horses had Steinman pins
inserted and were radiographed (Colahan et al., 1988). It was also coherent with marker placement
in large-breed dogs (Hottinger et al., 1996), where the greater trochanter was used for
representation of the hip JAR in a kinematic gait analysis, and by radiography which located the
stifle JAR on the condyle of the femur in dead dogs (Arnoczky et al., 1977).
When comparing the pigs’ BSPs (Paper I, Table 1) to those of dogs, ponies and horses reported in
the literature (Table 4.1) a general pattern was found. Here the pigs’ pastern and toe segments
together correspond to the digit segment in the other species. Thus the segment mass and ICOM both
decreased with increasing distance from the trunk in all species. The relatively heavy trunk and light
limbs has previously been stated to be a global design in quadrupeds that facilitates fast limb
movements without large inertial forces (Schamhardt, 1998), and is caused by the majority of the
hindlimb muscle mass being located proximal to the ankle joint (van Ingen Schenau and Bobbert,
1993), meaning the tarsal joint in the pigs. In further detail the pigs, with an average BW of 69kg,
had a weight distribution in the limb segments more similar to ponies of 203kg (van den Bogert,
1989) than to mixed-breed dogs of 25kg (Nielsen et al., 2003) or to horses of approximately 500kg
(Sprigings and Leach, 1986; Buchner et al., 1997). Furthermore the relative segment masses of the
pigs’ distal segments, i.e. the radius/ulna, metacarpus, foredigit, metatarsus and hinddigit were the
lowest among the species compared, whereas the pigs’ proximal segments, i.e. the humerus, femur
and tibia segments of the hindlimb were the second heaviest. Thus the global design with light
distal segments relative to the heavy proximal segments seems to be very pronounced in pigs, and
may be due to extensive breeding for more meat on the trunk and proximal limb parts.

GEN
ERA
L D
ISC
USS
ION
42
Tabl
e 4.
1: T
he b
ody
segm
ent p
aram
eter
s and
bod
y w
eigh
t of d
ogs a
nd h
orse
s fro
m o
ther
stud
ies.
The
segm
ent m
ass (
% B
W; C
OM
rel (
the
dist
ance
from
the
prox
imal
segm
ent e
nd to
the
CO
M in
% o
f seg
men
t len
gth;
I CO
M (k
g*m
2 *10-3
) and
ave
rage
BW
+ s.
d. (k
g) o
f six
dog
s, fiv
e
poni
es, t
hree
Tho
roug
hbre
d ho
rses
and
six
Dut
ch W
arm
bloo
d ho
rses
, res
pect
ivel
y. T
he d
igits
com
pris
e th
e pa
ster
n an
d to
e se
gmen
ts.
Spec
ies
Mix
ed-b
reed
dog
s1 Po
nies
2 Th
orou
ghbr
eds3
Dut
ch W
arm
bloo
ds4
Ave
rage
BW
+ s.
d.25
.3 +
2.5
kg
203
+ 30
kg
473
+ 67
kg
538k
g
M
ass
CO
Mre
lI C
OM
M
ass
CO
Mre
l I C
OM
M
ass
CO
Mre
l M
ass
CO
Mre
lI C
OM
%
BW
%
kg
•m2 •1
0-3%
BW
%
kg
•m2 •1
0-3
% B
W
%
% B
W
%
kg•m
2 •10-3
Fore
limb
H
umer
us
2.99
46
.9
5.5
1.8
44.7
27
-
- 1.
60
51.0
11
0
R
adiu
s/ul
na
1.26
41
.0
1.4
1.1
35.0
22
1.
40
43.0
1.
25
35.0
12
9
M
etac
arpu
s 0.
38
47.1
0.
14
0.29
47
.1
3.4
0.43
50
.3
0.30
44
.0
14.6
Fo
redi
git
0.32
50
.0
0.08
0.
30
- -
0.45
58
.1
0.34
92
.0
9.1
Hin
dlim
b
Fe
mur
-
- -
6.0
50.9
16
0 6.
7 47
.5
3.46
59
.0
340
Ti
bia
- -
- 1.
2 48
.0
18.3
1.
4 39
.5
1.54
37
.9
145
M
etat
arsu
s -
- -
0.49
35
.6
11.4
0.
6 38
.0
0.53
32
.0
50
H
indd
igit
- -
- 0.
28
- -
0.4
51.9
0.
35
92.0
10
.1
1 Nie
lsen
et a
l., 2
003;
2 van
den
Bog
ert,
1989
; 3 Sprig
ings
and
Lea
ch, 1
986;
4 Buc
hner
et a
l., 1
997.

GENERAL DISCUSSION
43
Morphometric method considerations
The JAR locating method assumed that all movement was in the sagittal plane, however the spread
locations of the hip and elbow JARs suggested that slight movement occurred in other planes as
well (Paper I), as argued for the elbow joint of horses (Leach and Dyson, 1988). Besides, muscle
and skin was removed from the bones to expose the bony landmarks and avoid errors introduced by
skin movement (van Weeren et al., 1992). This removal may, however, have allowed the joints to
deviate slightly from their anatomical sagittal plane.
Although performed by one experienced technician the dissection procedure may have contributed
to the inter-individual variation of the BSPs, which was somewhat larger than the variation of the
BW (Paper I). Another likely explanation for the BSP variation in pigs of similar BW could be
conformational differences between the pigs.
The COM and the moment of inertia of the pigs' toe segments were approximated, as these
segments could not be balanced and were too light to have their moment of inertia measured (Paper
I). However, considering the small mass of the toe segments, the moment of inertia would be
negligible therefore it was approximated as the lowest possible input value for the biomechanical
model. The moments of inertia are used for calculating the net joint moments only, and during the
stance phase the contributions from the inertial parameters to the net joint moments are very small
because the velocity and acceleration of the limb segments are low (Vaughan et al., 1999). In
horses’ forelimb the sensitivity of inverse dynamics to segmental inertial parameter errors has been
studied during the swing phase of trot (Lanovaz and Clayton, 2001). That study concluded that
mass errors produced larger net moment errors than segmental COM location errors, while moment
of inertia errors had the least effect. Further inertial parameter errors affected the distal segments
more than the proximal segments. Thus using estimated moments of inertia rather than measured
ones in the present thesis is likely not to have introduced serious errors.
The BSPs were measured on segments from exsanguinated and frozen carcasses, which meant
lower segment weights due to an average blood loss and water evaporation of 5.2% of live BW
(Paper I). Others have reported a blood loss of 7.3 to 13.7% for ponies (van den Bogert, 1989) and a
blood, water and saw loss of 2.4% on Dutch Warmbloods (Buchner et al., 1997). However, the
distribution of blood and water cannot be assumed to be uniform across segments, because the distal
segments have a higher ratio of bone to muscle and thus less blood than the proximal segments,

GENERAL DISCUSSION
44
therefore the segment masses were not corrected. For the inverse dynamic analysis (Paper III) this
may have caused a small underestimation of the proximal segment masses and an even larger
underestimation of the moment of inertia due to the second power proportionality between the mass
and the moment of inertia.
Gait characteristics
At low speeds the typical gait chosen by most mammals is the walk, during which the animal
moves its feet with an alternating two and three limb support phases (Schamhardt, 1998), which has
been confirmed for dogs, sheep, cows and horses (Jayes and Alexander, 1978; Nunamaker and
Blauner, 1985; Hottinger et al., 1996; Hodson et al., 2001; Flower et al., 2005). This thesis showed
that at the walk the pig, too, has alternating two and three limb stance phases, and that the swing
phases are shorter than the stance phases with the difference being largest in the forelimbs (Paper
II). Furthermore, pigs that are allowed to walk unrestrictedly on dry floor walk at a self-selected
speed of 0.88m/s during which they progress 0.75m per step and the stance phases last 0.69s and
0.59s for the fore- and hindlimbs, respectively (Paper II). The speed reported for the pigs in this
thesis agrees very well another study of pigs using a treadmill speed of 0.9m/s at which the pigs
were reported to be walking comfortably (Calabotta et al., 1982).
In a quietly standing quadruped a gravitational force corresponding to approximately one quarter of
the body mass will be acting on each limb (Schamhardt, 1998). Furthermore, as the pig is an even-
toed ungulate, each limb carries the weight on the tips of only two digits of a foot, namely the third
and fourth digits (Figure 1.2). During walk the time course of the GRFv showed two peaks with a
dip in between (Paper II). In the forelimbs the second peak was higher than the first, while in the
hindlimbs the opposite was true. The time course of the horizontal GRFap was approximately
sinusoidal reflecting the braking action of the pigs’ feet during the first part of the stance phase,
whereas during the second part of the stance phase the positive force reflected the pigs’ propulsive
action. The pigs’ GRF time courses were very similar to those of walking horses (Hodson et al.,
2000; Hodson et al., 2001), but also to a biped like humans (Simonsen et al., 1997). Moreover the
range or amplitude of the pigs’ GRFv standardized to BW reached 4-6N/kg, depending on which
limb was measured. The pigs’ range was less than that of humans, which typically reaches 10 N/kg
at normal walk. This is a consequence of the number of limbs supporting the weight, as walking
humans have alternating one and two stance phases, as opposed to the two and three limb stance
phases in walking quadrupeds mentioned earlier. The horizontal GRFs were much smaller, as the

GENERAL DISCUSSION
45
range of the GRFap was only about a third of the range of the GRFv, and the even smaller GRFml
range was less than a tenth compared to that of the GRFv. The GRF ranges of the pigs were very
similar to other those of other quadrupeds, such as horses (Merkens et al., 1985) and dogs (Nielsen
et al., 2003). Several kinetic and kinematic variables are highly influenced by speed because the
limbs are accelerated more at higher walking speeds, which should be considered when comparing
variables both within and across studies. For instance faster walking speed is associated with longer
stride and shorter stance time duration in horses (Khumsap et al., 2002). Further, the vertical GRFs
increase significantly with faster walking speeds in both dogs and horses (Riggs et al., 1993;
Khumsap et al., 2001).
The time courses and ranges of the JRFs (Paper III) were similar those of their respective GRFs
(Paper II). The peak vertical JRFs lessened with decreased distance from the trunk, as a
consequence of lower accelerations and less weight above the joint in the more proximal joints.
During stance phase the joint moments serve mainly to resist the GRFs, as the moments needed to
act against gravity and to accelerate the limb can be considered negligible (Lanovaz and Clayton,
2001). Further a joint moment is associated directly with the combination of forces acting across the
joint, and being a quadruped with four multijointed limbs the pigs can redistribute its joint moments
in several ways without visual changes (van den Bogert, 1998). Therefore the time courses of the
pigs’ joint moments were much more complicated than their corresponding JRFs and differed
considerably between the joints. However, compared to other quadrupeds the joint moment patterns
of the pigs (Paper III) were more or less similar to those of dogs and horses (Colborne et al., 1998;
Clayton et al., 2000; Clayton et al., 2001; Nielsen et al., 2003). The differences between the species
in joint moment magnitudes may be caused by different body size, limb anatomy, walking speed
and/or modeling approaches (Paper III).
From the results it became evident that the fore- and hindlimbs differed with respect to numerous
variables. Pigs carried most weight by their forelimbs (Paper II), which, taken together with the
finding that, the forelimbs were lightest (Paper I), may explain why leg problems occur more
frequently in the forelimbs than in the hindlimbs (Jørgensen et al., 1995). It may also explain why
the forelimbs kinetically responded more pronounced to floor condition than did the hindlimbs
(Paper III).

GENERAL DISCUSSION
46
In pigs joint disorders occur in several joints (Nakano et al., 1987), however the most frequent site
of osteochondrotic lesions in the forelimbs is the elbow (Grøndalen, 1974; Jørgensen, 2000;
Jørgensen and Andersen, 2000). In the hindlimbs the stifle, and to a lesser extent the hip, are
frequent sites of osteocondrotic lesions (Grøndalen, 1974; Jørgensen et al., 1995). In the present
thesis high joint moment amplitudes were found in the shoulder, elbow, hip and tarsal joints (Paper
III), which may help explain why joint diseases occur more frequently in the proximal than the
distal joints.
Humans suffering from moderate osteoarthritis in the knee have a reduced net joint flexion moment
at the knee during early stance phase compared to a control group without osteoarthritis (Landry et
al., 2007). Thus it could be hypothesized that net joint moments in pigs suffering from joint
disorders are lowered as well. Moreover biomechanical gait analysis could be applied as a
diagnostic tool in pigs, parallel to what increasingly is being done in horses, dogs and cows
(Khumsap et al., 2003; Trumble et al., 2005; Rajkondawar et al., 2006). Analyzing lame pigs was,
however, outside the scope of this thesis.
Floor condition effects on gait
Floor condition influenced the pigs’ gait in numerous ways, as especially the greasy condition
seemed to affect the gait biomechanics. Regarding the kinematic variables (Paper II) the pigs
reduced their walking speed and progression length; the pigs also prolonged their stance phase on
greasy floor. The effect of greasy floor on the pigs’ walking speed and progression length agreed
well with a study on cows, which were found to walk more slowly on a floor contaminated by
slurry compared to a dry floor (Phillips and Morris, 2000), and with humans, who shortened their
step length when anticipating a slippery floor (Cham and Redfern, 2002; Lockhart et al., 2007).
Floor condition had no effect on the vertical GRF, but it did affect the magnitude of the horizontal
GRFs (Paper II). Thus hindlimb braking forces (Min GRFap) decreased on contaminated floors to
the same level as the braking force in the forelimbs, and on contaminated floors the forelimb
propulsive forces (Peak GRFap) decreased. Furthermore contaminated floors lowered the medially
directed movements (Peak GRFml) in the hindlimbs. Because the uCOF is calculated from the
GRFs, floor condition also affected the peak uCOF (Paper II), most markedly the greasy condition.
The size of the reduction in the pigs’ Peak uCOF on contaminated floors was very alike the
reduction observed in humans anticipating slippery floors (Cham and Redfern, 2002; Lockhart et

GENERAL DISCUSSION
47
al., 2007). Seeing that the uCOF is positively correlated with walking speed (Powers et al., 2002),
the reduced Peak uCOF was partly explained by the pigs’ lowered speed when walking on
contaminated floors.
Floor condition did not affect the time courses of the joint kinetics, but the greasy and potentially
more slippery floor did, however, affect several variables compared to dry floor. The magnitude of
decrease in the pigs’ joint moments as a response to greasy floor concurred well with findings in
humans in whom the anticipation of slippery floors lowered the peak ankle, knee and hip moments
by 24-30% (Cham and Redfern, 2002). Also in walking humans a more powerful muscular knee
and ankle activity when expecting a slippery surface has been shown (Chambers and Cham, 2007).
Thus it is reasonable to speculate that the muscle co-contraction in the pigs walking on greasy floor
was high despite the lowered peak and minimum net joint moments observed (Paper III).
As the BW and limb length of the pigs were similar across floor conditions (Paper II), the effects of
floor condition were not caused by different body sizes. Rather the effects of the contaminated
floors on the gait biomechanics of the pigs were consequences of gait adaptations, as the pigs
reacted to contaminated conditions in a way that minimized their risk of slipping on a potentially
slippery surface.
It could be argued that the pigs should have walked on all three floor conditions in a randomized
study design, thus using each pig as its’ own control for the effect of floor condition. Nevertheless,
we decided against this design, as this would have required changing between floor conditions in
one day or testing the same pigs over several days. However, changing from greasy or wet
conditions to either of the other conditions could not be done within one day. Testing the pigs over
several days would have introduced errors from the repeatability of repositioning the markers
(Kadaba et al., 1989) and from the development of the animal. Slaughter pigs gain about 1 kg/day,
the onset of leg problems starts around 75 kg, and healthy animals were required for the
establishment of the normative dataset presented here.
Friction
From a safety point of view the two most critical phases for level walking humans are the initial
heel contact and the toe off (Grönqvist et al., 2001). Of these phases the heel contact is the most
challenging (Redfern et al., 2001). The pattern of the uCOF presented in this thesis (Paper II)

GENERAL DISCUSSION
48
confirmed this to be true in pigs as well. Furthermore the results indicated that the pigs’ forelimbs
were at the risk of slipping earlier than their hindlimbs (Table 3.4). In the present thesis (Paper II) a
minimum COF threshold of 0.63 was suggested to ensure safe walking on a dry concrete surface.
This threshold is considerably higher than the recommendations found in literature for animal
housing (Bähr and Türpitz, 1976; Kovacs and Beer, 1979; Nilsson, 1988; Phillips and Morris,
2001). These recommendations were, however, given for the entire pen floor, which comprises
areas for locomotion, resting and feeding, whereas this thesis focused on floor areas meant for
locomotion only.
The dual composition of the pig’s foot (Figure 1.2) makes it difficult to simulate with artificial
materials. However, in terms of frictional property pigs’ claws are best considered as elastomers
(McKee and Dumelow, 1995). Polyethylene material has previously been used to substitute a pig
foot during measurements of floor COF (Kovacs and Beer, 1979; Nilsson, 1988). In the present
thesis an infrared spectroscope (FTIR) test1 showed great similarity between polyether urethane and
polyethylene, as a consequence we chose polyether urethane to simulate a pig claw in the COF
measurements. Furthermore a load of 5kg was chosen for the COF measurements, as this load was
close to the load measured during the initial stance phase of walking pigs (Paper II, Figure 1). The
sCOF and dCOFs were measured at a speed of 0.002m/s, which may have been too low to mimic
the walk of a pig. A speed 5 times higher (with a load of 0.2kg) was tried, but produced vibrations.
Certainly, measuring the COF is not a trivial matter.
Ethical considerations
Healthy pigs with no signs of lameness were used throughout the experiments of this thesis. The
pigs used for the morphometric studies were slaughtered according to a method commonly applied
in Danish commercial slaughterhouses according to which the pigs were CO2 stunned followed by
exsanguination. Furthermore, the pigs walking on contaminated floors were not subjected to a floor
condition more extreme than what animals in normal intensive pig production may experience.
Finally, the results of this thesis will potentially benefit the welfare of many pigs in intensive
production systems by emphasizing how important the physical floor properties in pig pens are.
1 At The Danish Technological Institute, Gregersensvej 1, DK-2630 Taastrup, Denmark

CONCLUSIONS AND PERSPECTIVES
49
5. CONCLUSIONS AND PERSPECTIVES
Conclusions
Firstly, the morphometric studies offered the first experimental data on the JARs and BSPs of
pigs’ limbs. The JAR locations were described relative to bony landmarks and may serve as
skin marker positions in kinematics. The results of the BSPs revealed that the pigs’ forelimb
was lighter and shorter than the hindlimb, and in comparison to dogs, ponies and horses the
pigs’ limbs were very light relative to the trunk. Furthermore the quantification of the BSPs
enabled inverse dynamic analysis of the locomotion of pigs.
Secondly, the biomechanical analysis showed that floor condition did affect the pigs’ gait.
Hence the pigs adapted to contaminated floor conditions by lowering the walking speed and
the peak uCOF. Moreover, the pigs shortened the progression length and prolonged the stance
phase duration on greasy floor. The inverse dynamics revealed that, as a consequence of the
gait adaptations, the forelimb peak horizontal JRFs and the hindlimb minimum horizontal
JRFs were lowest on greasy floor. Further, the forelimb joint moments were displaced to a
lower level on greasy floor compared to dry and wet floors. Overall, greasy floor appeared the
most slippery condition to the pigs, whereas wet floor was intermediate of dry and greasy
conditions.
Thirdly the gait analysis revealed several biomechanical differences between the fore- and
hindlimbs, as the forelimbs carried most weight and received highest peak ground reaction
forces. As a consequence of this weight distribution the pigs’ forelimb joints responded more
obviously to floor condition than their hindlimb joints. Furthermore the hindlimb stance phase
was shorter than the stance phase of the forelimbs.
Finally the gait analysis indicated that even on a dry concrete floor a high sCOF is needed to
prevent pigs from slipping.
Perspectives
The basic biomechanical characterization of the gait of healthy pigs from a homogenous
population provided in this thesis presents a normative benchmark to compare with data from
lame pigs or pigs that have had operation or surgical implants. Additionally this thesis

CONCLUSIONS AND PERSPECTIVES
50
quantifies the biomechanical effects of floor condition on the gait of pigs walking on wet and
greasy floor conditions relative to dry floor.
Future studies should further elucidate the effect of floor condition by quantifying the slip
distances on different floor conditions and by investigating further biomechanical measures
like foot velocities, which may play important roles in joint loading.
Furthermore, as the level of muscle activity may be high on greasy floor despite of the
lowered peak joint forces and moments observed, future studies should seek to quantify the
level of muscle activity. Using EMG in combination with an experimental set-up described
for the gait analysis in this thesis would enable a quantification of the intensity of muscle
activity across a joint, which is a more precise expression of the joint load.
Much more data were collected during the course of this thesis than presented here. Ten
floors; one solid and 9 slatted floors of different materials (Pedersen and Levring, 2005) were
examined during dry, wet and greasy conditions using 10 pigs per condition. Moreover a
second camera filmed the pigs from behind in the mediolateral plane. Thus kinematic data in
two planes were obtained from a total of 300 pigs. However, due to the very time consuming
data processing only 10% of the pigs were analyzed for this thesis, focusing at the stance
phase biomechanics. Much more work is needed before general guidelines for pig pen floors
can be suggested.

REFERENCES
51
6. REFERENCES
Albutt, R.W., Dumelow, J., Cermak, J.P., and Owens, J.E. (1990) Slip-resistance of solid concrete floors in cattle buildings. Journal of Agricultural Engineering Research 45, 137-147.
Alkjær, T., Simonsen, E.B., and Dyhre-Poulsen, P. (2001) Comparison of inverse dynamics calculated by two- and three-dimensional models during walking. Gait and Posture 13, 73-77.
Anonymous (2000). Lov om indendørs hold af smågrise, avls- og slagtesvin. The Danish Ministry of Justice. Act no. 104.
Anonymous (2006). Dansk landbrug i tal 2006. Landøkonomisk oversigt. Dansk Landbrug, Axelborg, 184 pp.
Applegate, A.L., Curtis, S.E., Groppel, J.L., McFarlane, J.M., and Widowski, T.M. (1988) Footing and gait of pigs on different concrete surfaces. Journal of Animal Science 66, 334-341.
Arnoczky, S.P., Torzilli, P.A., and Marshall, J.L. (1977) Biomechanical evaluation of anterior cruciate ligament repair in the dog: An analysis of the instant center of motion. Journal of the American Animal Hospital Association 13, 553-558.
Barczewski, R.A., Kornegay, E.T., Notter, D.R., Veit, H.P., and Wright, M.E. (1990) Effects of feeding restricted energy and elevated calcium and phosphorus during growth on gait characteristics of culled sows and those surviving three parities. Journal of Animal Science 68, 3046-3055.
Baxter, S. (1984) Floors, injuries and discomfort. In Intensive Pig Production: Environmental Management and Design pp. 255-316. Granada Publishing, Toronto, Canada.
Boyle, L.A., Regan, D., Leonard, F.C., Lynch, P.B., and Brophy, P. (2000) The effect of mats on the welfare of sows and piglets in the farrowing house. Animal Welfare 9, 39-48.
Buchner, H.H.F., Savelberg, H.H.C.M., Schamhardt, H.C., and Barneveld, A. (1997) Inertial properties of Dutch warmblood horses. Journal of Biomechanics 30, 653-658.
Budsberg, S.C., Verstraete, M.C., and Soutas-Little, R.W. (1987) Force plate analysis of the walking gait in healthy dogs. American Journal of Veterinary Research 48, 915-918.
Bähr, H. and Türpitz, L. (1976) Die Trittsicherheit von Stallfussböden und der Einflussfaktor Reibwiderstand. Agrartechnik 5, 241-243.
Calabotta, D.F., Kornegay, E.T., Thomas, H.R., Knight, J.W., Notter, D.R., Veit, H.P., and Wright, M.E. (1982) Restricted energy intake and elevated calcium and phosphorus intake for gilts during growth. II. Gait characteristics analyzed from 16-mm motion picture photography. Journal of Animal Science 55, 1395-1404.

REFERENCES
52
Cham, R. and Redfern, M.S. (2002) Changes in gait when anticipating slippery floors. Gait and Posture 15, 159-171.
Chambers, A.J. and Cham, R. (2007) Slip-related muscle activation patterns in the stance leg during walking. Gait and Posture 25, 565-572.
Christensen, G., Vraa-Andersen, L., and Mousing, J. (1995) Causes of mortality among sows in Danish pig herds. Veterinary Record 137, 395-399.
Clayton, H.M., Hodson, E., and Lanovaz, J.L. (2000) The forelimb in walking horses: 2. Net joint moments and joint powers. Equine Veterinary Journal 32, 295-299.
Clayton, H.M., Hodson, E., Lanovaz, J.L., and Colborne, G.R. (2001) The hindlimb in walking horses: 2. Net joint moments and joint powers. Equine Veterinary Journal 33, 44-48.
Colahan, P., Piotrowski, G., and Poulus, P. (1988) Kinematic analysis of the instant centers of rotation of the equine metacarpophalangeal joint. American Journal of Veterinary Research 49, 1560-1565.
Colborne, G.R., Innes, J.F., Comerford, E.J., Owen, M.R., and Fuller, C.J. (2005) Distribution of power across the hind limb joints in Labrador Retrievers and Greyhounds. American Journal of Veterinary Research 66, 1563-1571.
Colborne, G.R., Lanovaz, J.L., Sprigings, E.J., Schamhardt, H.C., and Clayton, H.M. (1998) Forelimb joint moments and power during the walking stance phase of horses. American Journal of Veterinary Research 59, 609-614.
Corr, S.A., McCorquodale, C.C., McGovern, R.E., Gentle, M.J., and Bennett, D. (2003) Evaluation of ground reaction forces produced by chickens walking on a force plate. American Journal of Veterinary Research 64, 76-82.
Drevemo, S., Dalin, G., Fredricson, I., and Hjertén, G. (1980) Equine locomotion: 1. The analysis of linear and temporal stride characteristics of trotting Standardbreds. Equine Veterinary Journal 12, 60-65.
Flower, F.C., de Passillé, A.M., Weary, D.M., Sanderson, D., and Rushen, J. (2007) Softer, higher-friction flooring improves gait of cows with and without sole ulcers. Journal of Dairy Science 90, 1235-1242.
Flower, F.C., Sanderson, D.J., and Weary, D.M. (2005) Hoof pathologies influence kinematic measures of dairy cow gait. Journal of Dairy Science 88, 3166-3173.
Grøndalen, T. (1974) Leg weakness in pigs. I. Incidence and relationship to skeletal lesions, feed level, protein and mineral supply, exercise and exterior conformation. Acta Veterinaria Scandinavica 15, 555-573.
Grönqvist, R., Chang, W.R., Courtney, T.K., Leamon, T.B., Redfern, M.S., and Strandberg, L. (2001) Measurement of slipperiness: Fundamental concepts and definitions. Ergonomics 44, 1102-1117.

REFERENCES
53
Gustås, P., Johnston, C.J., and Drevemo, S. (2007) Ground reaction force and hoof deceleration patterns on two different surfaces at the trot. Equine and Comparative Exercise Physiology 3, 209-216.
Herlin, A.H. and Drevemo, S. (1997) Investigating locomotion of dairy cows by use of high speed cinematography. Equine Veterinary Journal suppl. 23, 106-109.
Hill, M.A. (1992) Skeletal system and feet. In Diseases of swine (Eds.: Leman, A.D., Straw, B.E., Mengeling, W.L., D'Allaire, S., and Taylor, D.J.) pp. 163-195. Wolfe, London.
Hodson, E., Clayton, H.M., and Lanovaz, J.L. (2000) The forelimb in walking horses: 1. Kinematics and ground reaction forces. Equine Veterinary Journal 32, 287-294.
Hodson, E., Clayton, H.M., and Lanovaz, J.L. (2001) The hindlimb in walking horses: 1. Kinematics and ground reaction forces. Equine Veterinary Journal 33, 38-43.
Hottinger, H.A., DeCamp, C.E., Olivier, N.B., Hauptman, J.G., and Soutas-Little, R.W. (1996) Noninvasive kinematic analysis of the walk in healthy large-breed dogs. American Journal of Veterinary Research 57, 381-388.
Irwin, C.K., Geiger, J.O., Pretzer, S., and Henry, S. (2000) Identifying causes of sow mortality. In Proceedings of the 16th International Pig Veterinary Society Congress, Melbourne, Australia, p. 290.
Jayes, A.S. and Alexander, R.M. (1978) Mechanics of locomotion of dogs (Canis familiaris) and sheep (Ovis aries). Journal of Zoology 185, 289-308.
Jørgensen, B. (2000) Osteochondrosis / Osteoarthrosis and claw disorders in sows, associated with leg weakness. Acta Veterinaria Scandinavica 41, 123-138.
Jørgensen, B. (2003) Influence of floor type and stocking density on leg weakness, osteochondrosis and claw disorders in slaughter pigs. Animal Science 77, 439-449.
Jørgensen, B. and Andersen, S. (2000) Genetic parameters for osteochondrosis in Danish Landrace and Yorkshire boars and correlations with leg weakness and production traits. Animal Science 71, 427-434.
Jørgensen, B., Arnbjerg, J., and Aaslyng, M. (1995) Pathological and radiological investigations on osteochondrosis in pigs, associated with leg weakness. Journal of Veterinary Medicine A-Physiology Pathology Clinical Medicine 42, 489-504.
Jørgensen, B. and Vestergaard, T. (1990) Genetics of leg weakness in boars at the Danish pig breeding stations. Acta Agricultura Scandinavica 40, 59-69.
Kadaba, M.P., Ramakrishnan, H.K., Wootten, M.E., Gainey, J., Gorton, G., and Cochran, G.V.B. (1989) Repeatability of kinematic, kinetic, and electromyographic data in normal adult gait. Journal of Orthopaedic Research 7, 849-860.

REFERENCES
54
Khumsap, S., Clayton, H.M., and Lanovaz, J.L. (2001) Effect of walking velocity on ground reaction force variables in the hind limb of clinically normal horses. American Journal of Veterinary Research 62, 901-906.
Khumsap, S., Clayton, H.M., Lanovaz, J.L., and Bouchey, M. (2002) Effect of walking velocity on forelimb kinematics and kinetics. Equine Veterinary Journal suppl. 34, 325-329.
Khumsap, S., Lanovaz, J.L., Rosenstein, D.S., Byron, C., and Clayton, H.M. (2003) Effect of induced unilateral synovitis of distal intertarsal and tarsometatarsal joints on sagittal plane kinematics and kinetics of trotting horses. American Journal of Veterinary Research 64, 1491-1495.
Kirk, R.K., Svensmark, B., Ellegaard, L.P., and Jensen, H.E. (2005) Locomotive disorders associated with sow mortality in Danish pig herds. Journal of Veterinary Medicine A-Physiology Pathology Clinical Medicine 52, 423-428.
Kovacs, A.B. and Beer, G.Y. (1979) The mechanical properties and qualities of floors for pigs in relation to limb disorders. The Pig Veterinary Society Proceedings 5, 99-104.
Kroes, Y. and van Male, J.P. (1979) Reproductive lifetime of sows in relation to economy of production. Livestock Production Science 6, 179-183.
Landry, S.C., McKean, K.A., Hubley-Kozey, C.L., Stanish, W.D., and Deluzio, K.J. (2007) Knee biomechanics of moderate OA patients measured during gait at a self-selected and fast walking speed. Journal of Biomechanics 40, 1754-1761.
Lanovaz, J.L. and Clayton, H.M. (2001) Sensitivity of forelimb swing phase inverse dynamics to inertial parameter errors. Equine Veterinary Journal suppl. 33, 27-31.
Leach, D.H. and Dyson, S. (1988) Instant centres of rotation of equine limb joints and their relationship to standard skin marker locations. Equine Veterinary Journal suppl. 6, 113-119.
Leonard, F.C., O'Connell, J.M., and Lynch, P.B. (1997) Behaviour, skin and foot lesions in sows and piglets on different farrowing house floors. In Proceedings of the 5th International Livestock Environment Symposium, Bloomington, Minnesota, USA, pp. 242-249.
Ley, S.J., Livingston, A., and Waterman, A.E. (1989) The effect of chronic clinical pain on thermal and mechanical thresholds in sheep. Pain 39, 353-357.
Lockhart, T.E., Spaulding, J.M., and Park, S.H. (2007) Age-related slip avoidance strategy while walking over a known slippery floor surface. Gait and Posture 26, 142-149.
Marchant, J.N. and Broom, D.M. (1996) Effects of dry sow housing conditions on muscle weight and bone strength. Animal Science 62, 105-113.
Martinez-del Campo, L.J., Kobluk, C.N., Greer, N., Trent, A.M., Stoner, L.J., Wickstrom, L., and Loch, D. (1991) The use of high-speed videography to generate angle-time and

REFERENCES
55
angle-angle diagrams for the study of equine locomotion. Veterinary Comparative Orthopaedics and Traumatology 4, 120-131.
McKee, C.I. and Dumelow, J. (1995) A review of the factors involved in developing effective non-slip floors for pigs. Journal of Agricultural Engineering Research 60, 35-42.
Merkens, H.W., Schamhardt, H.C., Hartman, W., and Kersjes, A.W. (1985) Ground reaction force patterns of Dutch Warmblood horses at normal walk. Equine Veterinary Journal 18, 207-214.
Merkens, H.W. and Schamhardt, H.C. (1988) Evaluation of equine locomotion during degrees of experimentally induced lameness I: Lameness model and quantification of ground reaction force patterns of the limbs. Equine Veterinary Journal suppl. 6, 99-106.
Mouttotou, N., Hatchell, F.M., Lundervold, M., and Green, L.E. (1997) Prevalence and distribution of foot lesions in finishing pigs in South-West England. Veterinary Record 141, 115-120.
Nakano, T., Brennan, J.J., and Aherne, F.X. (1987) Leg weakness and ostechondrosis in swine: A review. Canadian Journal of Animal Science 67, 883-901.
Nielsen, C., Stover, S.M., Schulz, K.S., Hubbard, M., and Hawkins, D.A. (2003) Two-dimensional link-segment model of the forelimb of dogs at a walk. American Journal of Veterinary Research 64, 609-617.
Nilsson, C. (1988) Floors in animal houses. PhD Thesis. Swedish University of Agricultural Sciences, report no. 61, 39 pp. plus 6 subreports.
Nunamaker, D.M. and Blauner, P.D. (1985) Normal and abnormal gait. In Textbook of small animals orthopaedics (Ed.: Burgower, W.) pp. 1083-1095. J.B. Lippincott Co., Philadelphia.
Pedersen, S. and Levring, M. (2005) Svinestaldgulves skridsikkerhed og stødabsorptionsevne. DJF Intern rapport nr. 224, 22 pp.
Penny, R.H.C., Osborne, A.D., and Wright, A.I. (1963) The causes and incidence of lameness in store and adult pigs. Veterinary Record 75, 1225-1240.
Phillips, C.J.C. and Morris, I.D. (2000) The locomotion of dairy cows on concrete floors that are dry, wet, or covered with a slurry of excreta. Journal of Dairy Science 83, 1767-1772.
Phillips, C.J.C. and Morris, I.D. (2001) The locomotion of dairy cows on floor surfaces with different frictional properties. Journal of Dairy Science 84, 623-628.
Powers, C.M., Burnfield, J.M., Lim, P., Brault, J.M., and Flynn, J.E. (2002) Utilized coefficient of friction during walking: Static estimates exceed measured Values. Journal of Forensic Sciences 47, 1-6.

REFERENCES
56
Quanbury, A.O., Winter, D.A., and Reimer, G.D. (1975) Instantaneous power and power flow in body segments during walking. Journal of Human Movement Studies 1, 59-67.
Rajkondawar, P.G., Liu, M., Dyer, R.M., Neerchal, N.K., Tasch, U., and Lefcourt, A.M. (2006) Comparison of models to identify lame cows based on gait and lesion scores, and limb movement variables. Journal of Dairy Science 89, 4267-4275.
Redfern, M.S. and Bidanda, B. (1994) Slip resistance of the shoe-floor interface under biomechanically relevant conditions. Ergonomics 37, 511-524.
Redfern, M.S., Cham, R., Gielo-Perczak, K., Grönqvist, R., Hirvonen, M., Lanshammar, H., Marpet, M., and Pai, C.Y. (2001) Biomechanics of slips. Ergonomics 44, 1138-1166.
Riggs, C.M., DeCamp, C.E., Soutas-Little, R.W., Braden, T.D., and Richter, M.A. (1993) Effects of subject velocity on force plate-measured ground reaction forces in healthy Greyhounds at the trot. American Journal of Veterinary Research 54, 1523-1526.
Schamhardt, H.C. (1998) The mechanics of quadrupedal locomotion. How is the body propelled by muscles? European Journal of Morphology 36, 272-279.
Simonsen, E.B., Dyhre-Poulsen, P., Voigt, M., Aagaard, P., and Fallentin, N. (1997) Mechanisms contributing to different joint moments observed during human walking. Scandinavian Journal of Medicine and Science in Sports 7, 1-13.
Sprigings, E.J. and Leach, D. (1986) Standardised technique for determining the centre of gravity of body and limb segments of horses. Equine Veterinary Journal 18, 43-49.
Taylor, W.R., Ehrig, R.M., Heller, M.O., Schell, H., Seebeck, P., and Duda, G.N. (2006) Tibio-femoral joint contact forces in sheep. Journal of Biomechanics 39, 791-798.
Trumble, T.N., Billinghurst, R.C., Bendele, A.M., and McIlwraith, C.W. (2005) Evaluation of changes in vertical ground reaction forces as indicators of meniscal damage after transection of the cranial cruciate ligament in dogs. American Journal of Veterinary Research 66, 156-163.
van den Bogert, A.J. (1989) Computer simulation of locomotion in the horse. PhD Thesis. University of Utrecht, 151 pp.
van den Bogert, A.J. (1998) Computer-assisted gait analysis in equine orthopaedic practice: the case for inverse dynamic analysis. Equine Veterinary Journal 30, 362-363.
van der Tol, P.P.J., Metz, J.H.M., Noordhuizen-Stassen, E.N., Back, W., Braam, C.R., and Weijs, W.A. (2003) The vertical ground reaction force and the pressure distribution on the claws of dairy cows while walking on a flat substrate. Journal of Dairy Science 86, 2875-2883.
van der Tol, P.P.J., Metz, J.H.M., Noordhuizen-Stassen, E.N., Back, W., Braam, C.R., and Weijs, W.A. (2005) Frictional forces required for unrestrained locomotion in dairy cattle. Journal of Dairy Science 88, 615-624.

REFERENCES
57
van Ingen Schenau, G.J. and Bobbert, M.F. (1993) The global design of the hindlimb in quadrupeds. Acta Anatomica 146, 103-108.
van Weeren, P.R., van den Bogert, A.J., and Barneveld, A. (1992) Correction models for skin displacement in equine kinematic gait analysis. Journal of Equine Veterinary Science 12, 178-192.
Vaughan, C.L., Davis, B.L., and O'Connor, J.C. (1999) Dynamics of human gait. Kiboho Publishers, Cape Town, 141 pp.
Vestergaard, K., Christensen, G., Pedersen, L.B., and Wachmann, H. (2004) Afgangsårsager hos søer - samt obduktionsfund hos aflivede og selvdøde søer. Landsudvalget for Svin, Danske Slagterier. Meddelelse nr. 656, 14 pp.
Weary, D.M. and Flower, F.C. (2006) Effects of pain due to lameness on cow gait: A dose-dependent response to Ketoprofen. In Proceedings of the 14th International Symposium and 6th Conference on Lameness in Ruminants, Colonia, Uruguay, p. 225.
Webb, N.G. (1984) Compressive stresses on, and the strength of, the inner and outer digits of pigs' feet, and the implications for injury and floor design. Journal of Agricultural Engineering Research 30, 71-80.
Webb, N.G. and Clark, M. (1981a) Livestock foot-floor interactions measured by force and pressure plate. Farm Building Progress 66, 23-36.
Webb, N.G. and Clark, M. (1981b) Livestock limb-floor biomechanics. In Commission Internationale de Günie Rural (CIGR). Scottish Farm Buildings Investigation Unit, Aberdeen, Scotland, pp. 335-342.
Webb, N.G. and Nilsson, C. (1983) Flooring and injury - an overview. In Farm animal housing and welfare (Eds.: Baxter, S.H., Baxter, M.R., and McCormack, J.A.D.) pp. 226-259. Martinus Nijhoff Publishers, The Hague.
Weiler, U., Abi Salloum, B., and Claus, R. (2006) Influence of short-term confinement and exercise on tibia development in growing pigs. Journal of Veterinary Medicine A-Physiology Pathology Clinical Medicine 53, 450-455.
Whay, H.R., Waterman, A.E., and Webster, A.J.F. (1997) Associations between locomotion, claw lesions and nociceptive threshold in dairy heifers during the peri-partum period. The Veterinary Journal 154, 155-161.
Winter, D.A. (2004) Biomechanics and motor control of human movement. John Wiley & Sons, Inc., Hoboken, 325 pp.
Young, H.D. and Freedman, R.A. (2004) Applying Newton’s laws. In University physics with modern physics. Addison Wesley, San Francisco.

APPENDIX I – PAPER I
58
PAPER I
Joint axes of rotation and body segment parameters of pig limbs

This Provisional PDF corresponds to the article as it appeared upon acceptance. Copyedited andfully formatted PDF and full text (HTML) versions will be made available soon.
Joint axes of rotation and body segment parameters of pig limbs
Acta Veterinaria Scandinavica 2007, 49:20 doi:10.1186/1751-0147-49-20
Vivi M Thorup ([email protected])Frede AA Togersen ([email protected])Bente Jorgensen ([email protected])
Bente R Jensen ([email protected])
ISSN 1751-0147
Article type Brief communication
Submission date 20 April 2007
Acceptance date 6 September 2007
Publication date 6 September 2007
Article URL http://www.actavetscand.com/content/49/1/20
This peer-reviewed article was published immediately upon acceptance. It can be downloaded,printed and distributed freely for any purposes (see copyright notice below).
Articles in Acta Veterinaria Scandinavica are listed in PubMed and archived at PubMed Central.
For information about publishing your research in Acta Veterinaria Scandinavica or any BioMedCentral journal, go to
http://www.actavetscand.com/info/instructions/
For information about other BioMed Central publications go to
http://www.biomedcentral.com/
Acta Veterinaria Scandinavica
© 2007 Thorup et al., licensee BioMed Central Ltd.This is an open access article distributed under the terms of the Creative Commons Attribution License (http://creativecommons.org/licenses/by/2.0),
which permits unrestricted use, distribution, and reproduction in any medium, provided the original work is properly cited.

Page 1
Joint axes of rotation and body segment parameters of pig limbs
Vivi M. Thorup1,2*
, Frede Aa. Tøgersen3, Bente Jørgensen
1 and Bente R. Jensen
2
1Department of Animal Health, Welfare and Nutrition, Faculty of Agricultural Sciences, University
of Aarhus, Research Centre Foulum, Blichers Allé 20, PO Box 50, DK-8830 Tjele, Denmark
2Department of Exercise and Sport Sciences, Faculty of Science, University of Copenhagen, Panum
Institute/IFI, Blegdamsvej 3, DK-2200 Copenhagen N, Denmark
3Department of Genetics and Biotechnology, Faculty of Agricultural Sciences, University of
Aarhus, Research Centre Foulum, Blichers Allé 20, PO Box 50, DK-8830 Tjele, Denmark
Email: Vivi M. Thorup* - [email protected]; Frede Aa. Tøgersen -
[email protected]; Bente Jørgensen - [email protected]; Bente R. Jensen -
*Corresponding author
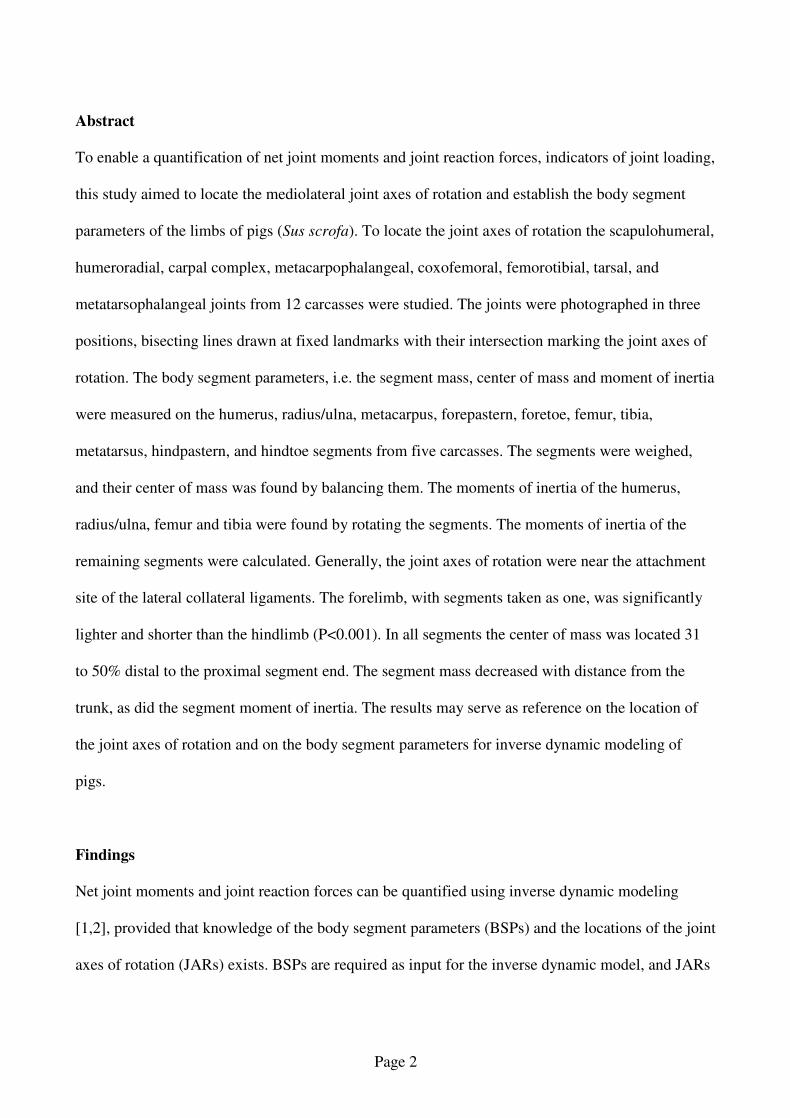
Page 2
Abstract
To enable a quantification of net joint moments and joint reaction forces, indicators of joint loading,
this study aimed to locate the mediolateral joint axes of rotation and establish the body segment
parameters of the limbs of pigs (Sus scrofa). To locate the joint axes of rotation the scapulohumeral,
humeroradial, carpal complex, metacarpophalangeal, coxofemoral, femorotibial, tarsal, and
metatarsophalangeal joints from 12 carcasses were studied. The joints were photographed in three
positions, bisecting lines drawn at fixed landmarks with their intersection marking the joint axes of
rotation. The body segment parameters, i.e. the segment mass, center of mass and moment of inertia
were measured on the humerus, radius/ulna, metacarpus, forepastern, foretoe, femur, tibia,
metatarsus, hindpastern, and hindtoe segments from five carcasses. The segments were weighed,
and their center of mass was found by balancing them. The moments of inertia of the humerus,
radius/ulna, femur and tibia were found by rotating the segments. The moments of inertia of the
remaining segments were calculated. Generally, the joint axes of rotation were near the attachment
site of the lateral collateral ligaments. The forelimb, with segments taken as one, was significantly
lighter and shorter than the hindlimb (P<0.001). In all segments the center of mass was located 31
to 50% distal to the proximal segment end. The segment mass decreased with distance from the
trunk, as did the segment moment of inertia. The results may serve as reference on the location of
the joint axes of rotation and on the body segment parameters for inverse dynamic modeling of
pigs.
Findings
Net joint moments and joint reaction forces can be quantified using inverse dynamic modeling
[1,2], provided that knowledge of the body segment parameters (BSPs) and the locations of the joint
axes of rotation (JARs) exists. BSPs are required as input for the inverse dynamic model, and JARs

Page 3
define the boundaries of the model segments. To the best of our knowledge neither BSPs nor JARs
have been studied in pigs, therefore this study aimed to locate the mediolateral JARs and establish
the BSPs of segments from fore- and hindlimbs of healthy pigs.
To locate the JARs 12 Duroc-Yorkshire-Landrace crossbred (D(YL)) pigs were studied: six
castrates and six gilts without clinical limb abnormalities. Their body weight (BW) at slaughter was
77+7 kg. Right fore- and hindlimbs were removed without disarticulating the joints. The eight joints
examined were the: scapulohumeral (shoulder, 1F); humeroradial (elbow, 2F); carpal complex
(carpal, 3F); metacarpophalangeal (forefetlock, 4F); coxofemoral (hip, 1H); femorotibial (stifle,
2H); tarsal (hock, 3H) and metatarsophalangeal joint (hindfetlock, 4H) (Fig. 1). With the bones
lying on the medial side digital photos were taken of each joint in extended, neutral and flexed
position around the mediolateral axis. JARs were calculated according to the Realeaux-technique
previously applied to the equine limbs [3]. The photos were aligned by two distinct landmarks on
one bone of the joint. On the other bone the JAR was located as the intersection of the mid-
perpendicular lines of the displacement vectors of two distinct landmarks at consecutive joint
positions. Usually, three points of intersection were generated therefore an arithmetic average of the
points was calculated. Results were described qualitatively in relation to bony landmarks palpable
on the skin surface. Measured on a test object (five measurements of three JAR positions repeated
on two days) the JAR technique absolute error was 0.31+0.09 cm, calculated as the mean distance
of the estimated JARs from the known JARs. The variable error was 0.05+0.03 cm, calculated as
the mean distance between pairs of the estimated JARs. An ANOVA revealed no significant
differences between days, neither in absolute error (F=2.63; P=0.14) nor in variable error (F=1.60;
P=0.24).

Page 4
To establish the BSPs five D(YL) crossbred pigs were used: one castrate and four gilts without
clinical limb abnormalities. Their live BW was 69+5 kg. After exsanguination the right fore- and
hindlimbs were separated from the trunk and cooled lying horizontally. The day after slaughter the
carcasses including limbs were weighed. Blood and water loss summed to 5.2+0.2% BW. The
chilled limbs were dissected into segments along cranio-caudal lines running through the JARs
identified above. The ten segments investigated were the: humerus; radius/ulna; metacarpus;
forepastern (proximal and middle phalanges); foretoe (distal phalanges); femur; tibia; metatarsus;
hindpastern; and hindtoe. The segments were frozen lying horizontally. Mass, length, distance
(dprox) from center of mass (COM) to proximal segment end, and moment of inertia (hereafter
referred to as inertia) were measured on the frozen segments. Sagittal plane COM was located by
balancing the segments transversely and longitudinally on a sharp edge. A line of balance was
drawn in each direction, the intersection thus marking the COM. The relative position of the COM
(COMrel) was calculated as the dprox in percent of segment length. The inertia was measured by
strapping the segments onto a custom made low-friction horizontal turntable; an external load
connected to the turntable was dropped and turned the turntable. The external load passed between
two photocells. Photocell data were converted (Data Translation 9800 A/D converter) and sampled
at 1 kHz, thus measuring drop time. The inertia was calculated from load drop time (tl) according to
formula 1:
inertia = (ml • g • rt2 • tl
2)/2sp (1),
in which external load mass (ml) was 0.203 kg, gravitational acceleration (g) was 9.82 m/s2,
turntable radius (rt) was 0.15 m, and distance between photocells (sp) was 1.317 m. Segment inertia
was calculated by subtracting the inertia of the unloaded turntable from the inertia of the loaded
turntable. The humerus, radius/ulna, and tibia were placed with the proximal segment end aligned
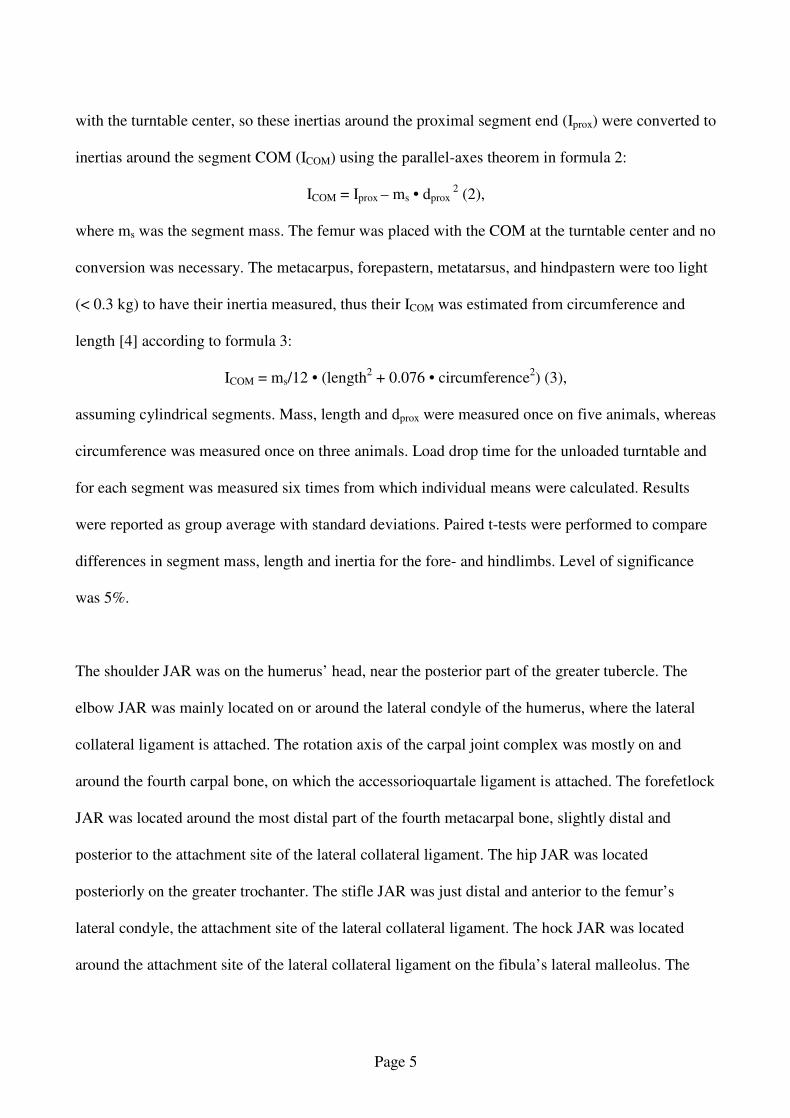
Page 5
with the turntable center, so these inertias around the proximal segment end (Iprox) were converted to
inertias around the segment COM (ICOM) using the parallel-axes theorem in formula 2:
ICOM = Iprox – ms • dprox 2
(2),
where ms was the segment mass. The femur was placed with the COM at the turntable center and no
conversion was necessary. The metacarpus, forepastern, metatarsus, and hindpastern were too light
(< 0.3 kg) to have their inertia measured, thus their ICOM was estimated from circumference and
length [4] according to formula 3:
ICOM = ms/12 • (length2 + 0.076 • circumference
2) (3),
assuming cylindrical segments. Mass, length and dprox were measured once on five animals, whereas
circumference was measured once on three animals. Load drop time for the unloaded turntable and
for each segment was measured six times from which individual means were calculated. Results
were reported as group average with standard deviations. Paired t-tests were performed to compare
differences in segment mass, length and inertia for the fore- and hindlimbs. Level of significance
was 5%.
The shoulder JAR was on the humerus’ head, near the posterior part of the greater tubercle. The
elbow JAR was mainly located on or around the lateral condyle of the humerus, where the lateral
collateral ligament is attached. The rotation axis of the carpal joint complex was mostly on and
around the fourth carpal bone, on which the accessorioquartale ligament is attached. The forefetlock
JAR was located around the most distal part of the fourth metacarpal bone, slightly distal and
posterior to the attachment site of the lateral collateral ligament. The hip JAR was located
posteriorly on the greater trochanter. The stifle JAR was just distal and anterior to the femur’s
lateral condyle, the attachment site of the lateral collateral ligament. The hock JAR was located
around the attachment site of the lateral collateral ligament on the fibula’s lateral malleolus. The

Page 6
hindfetlock JAR was distal to the lateral condyle on the fourth metatarsal bone. The 12 individual
JARs and their averages scaled to the fore- and hindlimb of one randomly chosen pig are shown in
Fig. 1.
For palpation purposes the JARs were mainly at or near the attachment site of the lateral collateral
joint ligaments, thus allowing movements without excessive ligament strain. The JAR locating
method assumed that all joints were revolute, however the spread locations of JARs suggested that,
for instance in the hip and stifle joints, slight cranio-caudal translation may also have occurred.
Besides, the removal of muscle and skin to expose bony landmarks and to avoid skin movement
errors may have allowed the joints to deviate slightly from their anatomical sagittal plane.
Nevertheless, large joint rotations were performed between consecutive positions to minimize JAR
estimation errors [5,6].
Adding all limb segments the forelimb and hindlimb weighed 3.3+0.2% BW and 8.6+0.2% BW,
respectively; the forelimb length was 40.6+1.5 cm and the hindlimb measured 52.9+1.6 cm, thus the
forelimb was significantly lighter and shorter than the hindlimb (P<0.001). These differences were
mainly caused by the relatively heavy and long femur, tibia and metatarsus (Table 1). The COMrel
was in the proximal part of all segments. Segment mass and inertia decreased with increasing
distance from the trunk, thus proximal segments were the heaviest and had the largest inertias.
The BW of the pigs in the BSP study varied 7% between individuals, whereas the BSPs varied
more, e.g. the inter-individual coefficient of variations of the measured inertia were: humerus 14%;
radius/ulna 31%; femur 7% and tibia: 28%. These variations were in line with those reported for
horses [7,8] and dogs [2]. Although the dissection procedure was performed by the same

Page 7
experienced technician this may have contributed to the variation. Furthermore the variation
between body segments from pigs of similar BW may be explained by conformation differences,
e.g. the large variation of the metacarpus was mainly caused by a very short (5.0 cm) and light
(0.091 kg) segment in one pig.
The COM and inertia of the toe segments were approximated, as these segments could not be
balanced and were too light to have their inertia measured. However considering their small masses,
their inertia will be negligible therefore it was approximated as the lowest reasonable input value
for the inverse dynamics model, based on resolution limits. In inverse dynamics the inertias are
used for calculating net joint moments only, and during the stance phase contributions from inertial
parameters to net joint moments are very small because the angular accelerations of the limb
segments are low [4]. Furthermore measuring the BSPs on exsanguinated and frozen segments
resulted in lower masses due to the 5.2% BW blood loss and water evaporation. However the
distribution of blood and water cannot be assumed to be uniform across segments, because distal
segments have a higher bone to muscle ratio and thus less blood than proximal segments, which
should be accounted for in inverse dynamic modeling.
This investigation offers the first experimental data on the JARs and BSPs of pigs’ limbs, thus
enabling a quantification of net joint forces and moments.
Competing interests
The authors declare that they have no competing interests.
Authors’ contributions

Page 8
VMT participated in the study design, carried out the experiments and drafted the manuscript. FAT
calculated the JAR locations. BJ and BRJ designed the experiments and helped drafting the
manuscript. All authors read and approved the final manuscript.
Acknowledgement
This project (no. 3412-04-00114) was funded by The Danish Ministry of Food, Agriculture and
Fisheries.
References
1. Colborne GR, Lanovaz JL, Sprigings EJ, Schamhardt HC, Clayton HM: Forelimb joint
moments and power during the walking stance phase of horses. Am J Vet Res 1998,
59:609-614.
2. Nielsen C, Stover SM, Schulz KS, Hubbard M, Hawkins DA: Two-dimensional link-
segment model of the forelimb of dogs at a walk. Am J Vet Res 2003, 64:609-617.
3. Leach DH, Dyson S: Instant centres of rotation of equine limb joints and their
relationship to standard skin marker locations. Equine Vet J 1988, suppl. 6:113-119.
4. Vaughan CL, Davis BL, O'Connor JC: Dynamics of human gait. Cape Town: Kiboho
Publishers; 1999.
5. Challis JH: Estimation of the finite center of rotation in planar movements. Medical
Engineering and Physics 2001, 23:227-233.
6. Panjabi MM: Centers and angles of rotation of body joints: A study of errors and
optimization. J Biomech 1979, 12:911-920.
7. Buchner HHF, Savelberg HHCM, Schamhardt HC, Barneveld A: Inertial properties of
Dutch Warmblood horses. J Biomech 1997, 30:653-658.

Page 9
8. van den Bogert AJ: Computer simulation of locomotion in the horse. PhD Thesis.
University of Utrecht; 1989.
Figure legends
Figure 1: The joint axes of rotation of the pigs’ limbs
The fore- and hindlimbs with the average (crosses) and individual JARs (dots) of 12 pigs related to
one animal. Top: Forelimb with the shoulder (1F), elbow (2F), carpal (3F) and fetlock (4F) JARs.
Bottom: Hindlimb with the hip (1H), stifle (2H), hock (3H) and fetlock (4H) JARs. The lateral side
of the bones is up. For scaling purposes a measuring stick with black and white fields of 1 cm was
placed next to the bones.
Tables
Table 1: The body segment parameters of the right limbs of five pigs
The segment mass, kg and % BW; segment length, cm; segment COMrel, the distance from the
proximal segment end to the COM in % of segment length; and segment ICOM, kg•m2•10
-3, are
presented as average+s.d.
Mass Length COMrel ICOM
kg % BW cm % kg•m2•10
-3
Forelimb
Humerus 1.333+0.126 1.94+0.12 12.7+0.2 46.1+1.9 4.42+1.07
Radius/ulna 0.726+0.073 1.05+0.04 14.5+1.2 31.5+3.0 2.32+0.70
Metacarpus 0.125+0.021 0.18+0.03 6.4+0.8 49.3+2.1 0.06+0.03b
Forepastern 0.100+0.008 0.15+0.01 4.9+0.1 44.5+2.1 0.04+0.00b

Page 10
Foretoe 0.030+0.003 0.04+0.00 2.2+0.1 50a 0.0002
a
Hindlimb
Femur 4.466+0.207 6.50+0.22 18.3+1.0 50.3+5.1 31.50+2.37
Tibia 0.991+0.056 1.44+0.07 16.0+0.9 40.4+3.6 2.52+1.00
Metatarsus 0.291+0.035 0.42+0.03 10.4+0.8 32.3+5.6 0.34+0.07b
Hindpastern 0.111+0.010 0.16+0.01 5.9+0.6 40.0+5.5 0.06+0.01b
Hindtoe 0.029+0.003 0.04+0.01 2.3+0.1 50a 0.0002
a
a approximated;
b calculated.

Figure 1

APPENDIX II – PAPER II
71
PAPER II
Biomechanical gait analysis of pigs walking on solid concrete floor

APPENDIX II – PAPER II
72
Erratum to Paper II, p. 713 -714
The following correct sentences should replace the corresponding ones in the published paper,
in which the terms “braking” and “propulsion” were switched by mistake.
“Compared with dry condition the contaminated floors caused large differences in peak
propulsive force between the limbs of the pigs, suggesting that propulsion was equally
divided between the limbs on dry floor, but decreased on the forelimbs, and thus shifted
propulsion to the hindlimbs on contaminated floors. Braking on dry floor was largest on the
hindlimbs, whereas on greasy and wet floors braking was equally divided between fore- and
hindlimbs.”

Biomechanical gait analysis of pigs walking on solidconcrete floor
V. M. Thorup1,2†, F. Aa. Tøgersen3, B. Jørgensen1 and B. R. Jensen2
1Department of Animal Health, Welfare and Nutrition, Faculty of Agricultural Sciences, University of Aarhus, Research Centre Foulum, Blichers Alle 20, PO Box 50,DK-8830 Tjele, Denmark; 2Department of Exercise and Sport Sciences, Faculty of Science, University of Copenhagen, Panum Institute/IFI, Blegdamsvej 3, DK-2200Copenhagen N, Denmark; 3Department of Genetics and Biotechnology, Faculty of Agricultural Sciences, University of Aarhus, Research Centre Foulum, BlichersAlle 20, PO Box 50, DK-8830 Tjele, Denmark
(Received 30 October 2006; Accepted 26 February 2007)
Inappropriate floors in pig pens and slippery floor conditions may cause leg problems that reduce animal welfare. Therefore theobjectives of the present study were to characterise the walk of pigs on dry concrete solid floor, to evaluate whether pigs modifytheir gait according to floor condition, and to suggest a coefficient of friction (COF) that ensures safe walking on solid concretefloors for pigs. Kinematic (50 Hz video recordings in the sagittal plane) and kinetic (1 KHz force plate measuring threeperpendicular ground reaction forces) data were collected from four strides of both the fore- and hindlimbs of 30 healthy pigswalking on dry, greasy and wet concrete floor with 10 pigs on each floor condition. The COF of the floor conditions were tested ina drag-test. The results from the gait analysis showed that the pigs adapted their gait to potentially slippery floors by loweringtheir walking speed and reducing their peak utilised COF on greasy and wet (contaminated) floors compared with dry floors.Moreover, the pigs shortened their progression length and prolonged their stance phase duration on greasy floor compared withdry and wet floors. Thus the greasy floor appeared the most slippery condition to the pigs, whereas the wet floor wasintermediate to the other two conditions. The pigs walked with a four-beat gait, and the limbs differed biomechanically, as theforelimbs carried more load, received higher peak vertical forces and had longer lasting stance phases than did the hindlimbs. Theutilised COF from the gait analysis indicated that a high floor COF (.0.63) is needed to prevent pigs from slipping and thus toensure safe walking on dry concrete floors.
Keywords: animal welfare, floor type, friction, gait, pigs
Introduction
In modern intensive pig production leg problems constitutea common welfare problem in pig herds. The term ‘legproblems’ covers many ailments: locomotion disturbances;leg weakness; joint disorders and claw disorders (Jørgen-sen, 2003). The prevalence of leg problems is high, thus inDenmark 13% of the slaughter pigs suffer from leg weak-ness, 19% from joint disorders and 9% from claw disorders(Jørgensen, 2003). Among the adult breeding animals legweakness caused the death or euthanasia of 29% sowsand gilts delivered to a rendering plant (Christensen et al.,1995). Furthermore, in sow herds with a mortality of 10%(Danish average) or higher as many as 72% sows werekilled because of leg problems (Kirk et al., 2005).
Leg problems may occur for several reasons, and one ofthe major environmental factors is the pig pen floor. Floors
with too low friction may cause slips damaging the jointsdue to overexertion and falls which may cause impact inju-ries and ultimately can result in fractured legs; hard floorscause bruising and swollen joints from lying on the floor;too abrasive floors cause excessive wear of the claws andskin lesions whereas too little abrasiveness leads to over-grown claws (McKee and Dumelow, 1995). Moreover, slip-pery floors can potentially make animals adopt abnormalmovement patterns, which may have adverse effects onthe limbs.
Normal gait and the effect of floor condition have beenwidely analysed in humans. Thus when anticipating a slip-pery floor postural and temporal gait adaptations reducedthe peak utilised coefficient of friction (COF; Cham andRedfern, 2002), where the utilised COF (uCOF) was definedas the ratio of the shear (the resultant of the anteposteriorand mediolateral horizontal forces) and the vertical GRFsgenerated by the foot during walk. Furthermore, the peak† E-mail: [email protected]
Animal (2007), 1: pp. 708–715 Q The Animal Consortium 2007doi: 10.1017/S1751731107736753
animal
708

uCOF has been shown to increase with increased walkingspeed (Powers et al., 2002). In cows the locomotion hasbeen investigated under dry, wet and slurry-covered floorconditions (Phillips and Morris, 2000). Moreover the slipsof cows on dry and slurry-covered solid floors have beenstudied (Albutt et al., 1990), and the uCOF produced bycows performing three different locomotor behaviours havealso been examined (Van der Tol et al., 2005). In pigs,however, biomechanical gait analysis and studies of theeffects of floor condition on locomotion are sparse despitethe high prevalence of leg problems. Thus, one studykinematically analysed the gait of pigs on wet concretefloors with different friction coefficients (Applegate et al.,1988), however no ground reaction forces (GRFs) weremeasured. Another study measured the GRFs of youngpigs walking on sailcloth, for which they only estimatedthe COF (Webb and Clark, 1981). Hence, it has so far notbeen studied kinetically whether pigs adapt their gaitaccording to the floor condition. In the present study it ishypothesised that pigs do modify their gait in response tochanges in the floor condition.
Pigs are mainly housed on slatted or partly slatted floorshowever normal gait on solid floor has to be characterised,before the effect of different slatted floors on the gait ofpigs can be established. In addition the floor of a pig penis often wet, dirty or greasy from water, urine and faeces,therefore it is important to examine the floors under similaryet standardised conditions. Furthermore pigs reared underintensive production systems may have limited exercisepossibilities caused by the generally small pens and/or highstocking densities. Lack of exercise reduces muscle weightand bone strength in sows (Marchant and Broom, 1996),additionally it reduces bone development in growing pigs(Weiler et al., 2006). Thus the frictional property of thefloor in the part of the pig pen meant for feeding, drinking,dunging and moving around (i.e. not the resting area)should not further restrict the pigs from exercising.
Slips occur considerably more often in sows manoeuvr-ing on a smooth metal floor compared with a ridgedplastic floor (Leonard et al., 1997) and a rubber mat (Boyleet al., 2000). In these studies the slipperiness of the floors,unfortunately, was not measured. Traditionally the COF isused as an indicator of the slipperiness of a floor. Two fric-tional measurements are used to characterise floors,namely the static COF (sCOF) and the dynamic COF(dCOF), which can be influenced by the floor condition, i.e.the absence or presence of contaminant fluids. Theoreti-cally, a slip occurs when the uCOF produced during foot-floor contact exceeds the sCOF of the floor. Thus, in cowsincreasing the sCOF showed a rapid decrease in slippingaccording to results rearranged by Webb and Nilsson(1983). The present study investigates the uCOF producedby the pigs during walk relative to the sCOF and the dCOFduring dry and contaminated floor conditions.
The purposes of this study were to characterise the walkof healthy pigs on concrete solid floor biomechanically, toexamine if pigs modify their gait according to the floor
condition, and to suggest a safe COF for solid concretefloors.
Material and methods
AnimalsThirty Duroc £ Yorkshire £ Landrace (D(YL)) crossbredpigs from 17 different sows were studied. The pigs wereeither gilts or castrates that were 135 ^ 9 days old (range119 to 150 days). They were housed on partly slatted con-crete, and they showed no signs of lameness, i.e. theywalked without limping when allowed to walk on solidfloor outside their home pen.
All procedures involving animals were approved by theDanish Animal Experiments Inspectorate in accordancewith the Danish Ministry of Justice Law no. 382 and Acts333, 726 and 1016.
ProceduresPrior to the gait analysis some body parameters weremeasured. Firstly, the pigs were weighed. Secondly, thelength of their limbs were measured; the forelimb from thelateral condyle of the humerus to the ground and the hind-limb from the lateral condyle of the femur to the ground,respectively.
The pigs were tested individually on the test floor alonga 0.5 m wide and 6 m long aisle. The test floor was solidconcrete (flagstone, Perstrup Concrete Industry A/S, Kolind,Denmark), which had a rough and absorbing surface. Dry,wet and greasy floor conditions were tested with threedifferent groups including 10 pigs each, since in the pre-sent experiment we wanted the pigs to be free of previousexperiences with the test floor. The pigs were assigned ran-domly to floor condition groups. During wet condition thefloor of the entire aisle was wetted with tap water,whereas the greasy condition was obtained with a thinlayer of rapeseed oil (Coop X-tra, Coop A/S, Albertslund,Denmark). Kinematic and kinetic data were collected simul-taneously from the pigs, as they walked at a self-selected,steady speed.
KinematicsOn the pigs’ right side markers were painted on the spi-nous tuber of the scapula for measuring general walkingspeed and progression length, and centrally at the mostdistal edge of the lateral fore- and hindclaws for measuringswing phase duration. A digital video camera (PanasonicNV-DS30EG, Panasonic Denmark, Glostrup, Denmark)recorded the central 1.4 m of the aisle from the right sidein the sagittal plane at 50 Hz.
KineticsThree GRFs (vertical, anteposterior and mediolateral hori-zontal components) were recorded from a 0.20 £ 0.30 m2
force plate (Bertec Corporation, Columbus, OH). The forceplate was mounted invisibly to the pigs in the central partof the aisle with test floor on it. The analog force signals
Biomechanical gait analysis of walking pigs
709

(range ^5 V and maximum load 5 kN) were sampled at1 KHz, A/D-converted using a 16 bit PCI-DAS6035 card(Measurement Computing, Middleboro, MA) and recordedon a personal computer. The resolution of the vertical andhorizontal force signals were 0.15 N per bit and 0.08 N perbit, respectively. As a pig stepped on the force plate a lightemitting diode (LED) within the camera field, but abovethe view of the pigs, went on to synchronise kinetic andkinematic data. The force data collection, turning on andoff the LED, and turning off the camera was done bycustom-made software (SideStepper version 1.3b, TA,Aalborg, Denmark). A successful trial was defined by a pigkeeping a steady pace without stopping or running andplacing its’ forefoot or hindfoot or both feet, but separatedin time, entirely on the force plate. Three to four successfultrials for both fore- and hindlimb were obtained. Thenumber of times a pig had to walk through the aisleranged from five to 36 times, which was achieved withinmaximum 1 hour per pig.
Data processingThe video sequences were digitised using Pinnacle Studio(version 8, Pinnacle Systems, Inc., Mountain View, CA),and two-dimensional coordinates were constructed (bydirect linear transformation) and digitally low-pass filteredby a fourth order Butterworth filter with a cut-off frequencyof 8 Hz using APAS (Ariel Dynamics Inc, Trabuco Canyon,CA). The cut-off frequency was determined based on afrequency analysis. All gait variables were calculated usingMATLABw (2002, The MathWorks Inc, Natick, MA, USA).Moreover, the video sequences were visually inspected forthe occurrence of slips.
The kinematic variables calculated were the: walkingspeed; progression length, i.e. the distance between twoconsecutive initial ground contacts of the same foot; andswing to stance phase duration ratio (values , 1 signifythat swing phase is shorter than stance phase). The kineticvariables calculated from the GRFs were the: stance phaseduration; mean vertical force (mean GRFv); peak verticalforce (Peak GRFv); peak and minimum horizontal antepos-terior forces (peak GRFap and minimum GRFap); peak andminimum horizontal mediolateral forces (peak GRFml andminimum GRFml). All GRFs were normalised to body weightand therefore expressed in N/kg.
The instantaneous uCOF was calculated throughout thestance phase, which for the uCOF was defined as the partof the stance phase where the GRFv was above 10% ofthe peak GRFv exerted by the limb. The value of 10% waschosen to avoid the very early and late stance phase partsduring which spurious maxima occur due to division bysmall values of vertical forces (Powers et al., 2002). Fur-thermore, the boundary ensured that at least 5% of thebody weight was on the limb, corresponding to the defi-nition by Hanson et al. (1999). The number of force datadiffered between stance phases due to differences in thepigs’ walking speed, thus to normalise the lengths of thestance phases, data were smoothed by a cubic spline filter
resulting in 100 equidistant values of uCOF for each stancephase, after which the peak uCOF was found.
Floor frictionThe frictions of the concrete floor in dry, greasy and wetconditions were measured (at the Danish TechnologicalInstitute†) using an Instron 5569 drag device. The dragdevice had a polyether urethane material (Elastollanw
1185A, Elastogran GmbH, Lemforde, Germany) on themeasuring surface (area: 0.064 £ 0.064 m2; weight: 5 kg),which was dragged across the test surface. The sCOF wasdefined as the peak occurring at the onset of movement,and the dCOF was defined as the mean of measurementsover a distance of 0.05 to 0.1 m. Ten measurements weremade at different places, and the average sCOFs anddCOFs were calculated from these 10 measurements.
Statistical analysisThe kinematic and kinetic variables were tested separatelyin the following repeated measurement model:
Yijkl ¼ mþ coni þ limbj þ ðcon £ limbÞij þ SOWk
þ LIMBðPIGlÞj þ 1ijkl
where the response variable Y was the gait variable of theijklth observation; m was the overall mean; coni the sys-tematic effect of floor condition (i ¼ dry; wet; greasy);limbj was the systematic effect of limb ( j ¼ forelimb;hindlimb); SOWk was the random effect of sow or kinship(k ¼ 17); LIMB(PIGl)m was the random effect of limbwithin pig (l ¼ 30); and 1ijk1 was the random residualerror term associated with the ijklth observation. All ran-dom terms in the models were considered independent,and data were checked for normality. In a backward elimin-ation procedure the two-way interactions with the largestP-values were removed one at the time, leaving only sig-nificant variables in the model. The SASw PROC MIXEDprocedure was used (2001, Statistical Analysis SystemsInstitute Inc., Cary, NC) with the Kenward-Roger degree-of-freedom procedure due to unbalanced data as a result ofmissing observations (Littel et al., 2002). Plotting theresiduals against the predicted values fulfilled the hom-ogeneity of variance assumption.
The body parameters were tested separately in a SASw
PROC GLM procedure (2001, SAS Institute Inc, Cary, NC)using floor condition as the explanatory variable. The sCOFand dCOF were tested using a paired t-test. A significancelevel of P , 0.05 was used throughout.
Results
Body parametersThe body weights and limb lengths for the pigs from thethree floor conditions are reported in Table 1. There wereno significant differences between the floor conditions.
† Gregersensvej 1, DK-2630 Taastrup, Denmark
Thorup, Tøgersen, Jørgensen and Jensen
710

Furthermore, preliminary analyses showed that sex had noeffect on any of the gait variables.
KinematicsThe walk of the pigs was a four-beat gait characterised byalternating two- and three-limb support phases. The pigs’walking speed was significantly faster on dry floor com-pared with greasy and wet conditions. The progressionlength was significantly longer on dry floor compared withgreasy condition, whereas wet condition was intermediate.The stance phase duration was significantly longer ongreasy floor compared with dry and wet conditions. More-over the stance phase duration was significantly longer onthe forelimbs compared with the hindlimbs. The swing tostance phase ratio was significantly lower on the forelimbsthan on the hindlimbs. The significant effects of floor con-dition and limb on the gait variables are given in Table 2.
KineticsRepresentative tracings of the three GRFs for the forelimband the hindlimb of a pig walking on dry floor are shown
in Figure 1. The forelimb GRFv followed a two-humped pat-tern with the second maximum being higher than the firstmaximum, a pattern, which most often was reversed in thehindlimb. In both limbs there was typically a short periodduring the initial stance phase with minor deflectionsbefore the vertical force went into a steady rise.
The time course of the GRFap was approximately sinusoi-dal with an initial decline to a negative maximum, whenbackward forces acted on the foot of the pig, followed bya rise to a positive maximum, when forward forces actedon the foot of the pig. This force component also showedminor deflections during initial stance phase. In addition,the range of the GRFap was less than half the range of thevertical force. The pattern of the GRFml was less consistentand very different between limbs, but was negative duringmost of the stance phase, meaning that the foot of the pigwas pushing outward in lateral direction. The range (i.e.the amplitude) of the GRFml was the smallest of the threeGRFs (Figure 1).
The mean GRFv and peak GRFv exerted by the forelimbswere significantly higher than the force exerted by thehindlimbs (Table 2). The peak GRFap was significantlylower on the forelimbs compared with the hindlimbs forthe greasy and wet conditions, whereas on dry floor thelimbs did not differ significantly, moreover the forelimbsexerted significantly less force on greasy floor comparedwith the other conditions. The Min GRFap on dry floor wassignificantly more negative on the hindlimbs comparedwith the forelimbs, whereas on greasy and wet the limbsdid not differ significantly. As for the peak GRFml the hind-limbs exerted significantly higher force than the forelimbs,moreover the hindlimb forces were significantly higher on
Table 2 The significant effects of floor condition and limb on the gait variables (least square means (s.e.))†
Floor condition Limb
n Dry Wet Greasy Significance Fore Hind Significance
KinematicsWalking speed (m/s) 192 0.88 (0.03)a 0.79 (0.03)b 0.74 (0.03)b **Progression length (m) 192 0.75 (0.01)a 0.73 (0.01)ab 0.70 (0.01)b **Swing/stance phase ratio 192 0.62 (0.02)a 0.70 (0.02)b ***Stance phase duration (s) 226 0.60 (0.02)a 0.63 (0.02)a 0.69 (0.02)b ** 0.69 (0.02)a 0.59 (0.02)b ***
KineticsMean GRFv (N/kg) 226 3.76 (0.04)a 3.22 (0.04)b ***Peak GRFv (N/kg) 233 5.63 (0.06)a 4.43 (0.06)b ***Peak GRFap (N/kg) 227 F 0.80 (0.04)bc 0.72 (0.04)b 0.61 (0.04)a ***
H 0.76 (0.04)b 0.87 (0.04)c 0.75 (0.04)b
Min GRFap (N/kg) 227 F 20.75 (0.04)b 20.77 (0.04)ab 20.78 (0.04)ab *H 20.87 (0.04)a 20.72 (0.04)b 20.71 (0.04)b
Peak GRFml (N/kg) 227 F 0.07 (0.01)a 0.05 (0.01)a 0.06 (0.01)a **H 0.20 (0.01)b 0.14 (0.01)c 0.12 (0.01)c
Min GRFml (N/kg) 227 20.59 (0.02)a 20.29 (0.02)b **Utilised COF
Peak uCOF 224 0.48 (0.02)a 0.42 (0.02)b 0.32 (0.02)c ***
a,b,c Different superscripts denote significant differences *0.01,P , 0.05;**0.001,P 0.01; ***P , 0.001.† F ¼ forelimb; H ¼ hindlimb; GRF ¼ ground reaction force; v ¼ vertical; ap ¼ anteposterior horizontal; ml ¼ mediolateral horizontal; uCOF ¼ utilizedcoefficient of friction. In case of interaction between floor condition and limb, the limbs are reported separately for each condition.
Table 1 The body parameters of the pigs from the three floor con-ditions (least square means (s.d.), n ¼ 10)
Floor condition
Dry Greasy Wet
Body weight (kg) 75.0 (6.0) 74.3 (4.3) 72.4 (5.5)Length (m)
Forelimb 0.285 (0.015) 0.295 (0.015) 0.290 (0.010)Hindlimb 0.360 (0.015) 0.365 (0.015) 0.370 (0.020)
Biomechanical gait analysis of walking pigs
711

dry floor compared with greasy and wet conditions. Themin GRFml was significantly more negative in the forelimbscompared with the hindlimbs.
Utilised COFThe average uCOF for the fore- and the hindlimbs areshown for the three floor conditions in Figure 2. For bothlimbs the uCOF was highest at the beginning and towardsthe end of the stance phase with a minimum around midstance. Deviations from the dry condition were largestduring initial and final stance phase during which theuCOF of the greasy and wet conditions were lower thanthat of the dry condition. Moreover, the visual inspectionof the video sequences revealed slips in 1% of the stepson dry floor (one slip out of 77 steps), 11% on wet floor(eight out of 76) and 13% on greasy floor (nine out of 67).
The frequency distributions of the peak uCOFs for thepigs on the three floor conditions are shown in Figure 3.Looking at all three floor conditions the peak uCOF rangedfrom 0.18 to 0.82, however on greasy floor the highestpeak uCOF measured was only 0.59 (Figure 3). The meanpeak uCOF was significantly lower on greasy floor com-pared with wet floor, which again was significantly lowercompared with dry floor (Table 2). The 99% confidencelimit of the peak uCOF for dry floor (n ¼ 10) was 0.63,
calculated according to formula 1:
99% confidence limit ¼average uCOF
þ ð2:58 £ s:d:Þð1Þ
in which the s.d. was calculated from the s.e. and n(Table 2) according to formula 2:
s:d: ¼ s:e: £ffiffi
np
ð2Þ
Floor frictionIn general the dynamic COFs were lower than the staticCOFs, and the sCOF was highest on the dry floor (Table 3).However, only the dCOF of the greasy floor was signifi-cantly lower than the dCOFs of the dry and wet floors andall three sCOFs (P , 0.001). The lowest COF (greasy floordCOF) was higher than the average uCOF during the entirestance phase (Figure 2), however as the Peak uCOF rangedup to 0.82, both the sCOFs and dCOFs were exceeded inseveral steps.
Discussion
The main finding of this study confirmed the hypothesisthat pigs adapt their walk to potentially slippery surfaces.The pigs reacted to the greasy and wet (i.e. contaminated)floors by lowering their walking speed and peak uCOF.Moreover, the pigs reduced their progression length andincreased their stance phase duration on greasy floor com-pared with dry floor. Furthermore, the forelimbs and hind-limbs of the pigs differed biomechanically, as the forelimbsreceived higher peak vertical forces as well as higher meanvertical forces than did the hindlimbs. The body weightand limb length of the pigs were similar for all floor con-ditions (Table 1), thus the effects of floor condition werenot caused by different body sizes.
The pigs reduced their walking speed by 16% and theirprogression length by 7% from dry to greasy floor, andsimultaneously the pigs prolonged the stance phase by
Dry Wet Greasy
0.40.30.20.1
uCO
F
0 20 40 60 80 100
0 20 40 60 80 100
Forelimb Hindlimb
Normalised time ( % stance phase )
Figure 2 The average uCOF (dimensionless) of the forelimb (left part offigure) and the hindlimb (right part) of pigs walking on dry, wet andgreasy floor conditions.
–1
0
1
2
3
4
5
6
0.0 0.2 0.4 0.6 0.8 1.0 1.2 1.4
Time (s)
For
ce (
N/K
g)
Forelimb Hindlimb
Figure 1 A typical example of the vertical (GRFv: full line), anteposteriorhorizontal (GRFap: crosses) and mediolateral horizontal (GRFml: dottedline) ground reaction forces exerted by the forelimb (left curves) followedby the hindlimb (right curves) of a pig walking on a dry floor.
0
10
20
30
40
50
0.01-
0.10
0.11-
0.20
0.21-
0.30
0.31-
0.40
0.41-
0.50
0.51-
0.60
0.61-
0.70
0.71-
0.80
0.81-
0.90
0.91-
1.00
Peak uCOF
No.
of o
bser
vatio
ns
Figure 3 The frequency distribution of the peak uCOF (dimensionless) ofpigs walking on dry (grey bars), wet (white bars) and greasy (black bars)floor conditions (n ¼ 224).
Thorup, Tøgersen, Jørgensen and Jensen
712

15%. The reduced speed and progression length of thepigs on greasy floor was in agreement with a study oncows, which walked slowest and took shortest steps onthe floor with the lowest friction (Telezhenko and Bergsten,2005). Correspondingly, cows walked more slowly on afloor contaminated by slurry compared with dry floor (Phil-lips and Morris, 2000). Moreover the increased number ofslips on the contaminated floors by the pigs in the presentstudy was in accordance with the finding of more slips onslurry-covered than on dry concrete floor in walking cows(Albutt et al., 1990).
The relative mean GRFv showed 54% of the bodyweight to be carried by the pigs’ forelimbs, thus reflectingthat the centre of gravity was relatively closer to theforelimbs. This uneven weight distribution in the pigs wassimilar to the one found in cows (Webb and Clark, 1981).Thus, leg problems owing to high loads and impacts shouldbe expected to occur more frequently in the forelimbs com-pared with the hindlimbs, as supported by the work of Jør-gensen et al. (1995). The peak GRFv of the pigs walking at, 0.8 m/s was unevenly distributed with 56% of the loadreceived by the forelimbs. The magnitude of these peakloads were comparable to those found in dogs of approxi-mately 30 kg and walking at 1 m/s (Roush and McLaughlinJr, 1994), but not to those experienced by a cow of 630 kg(Van der Tol et al., 2005) or humans weighing 69 kg onaverage (Cham and Redfern, 2002). The latter differencesmay be attributed to different walking speeds in thesestudies.
The lowered peak uCOF on the contaminated floors inthe present study showed that the pigs adapted their gaitin a way that minimised their risk of slipping on a poten-tially slippery surface, whereas pigs on dry floor produceda high Peak uCOF by walking more confidently. Thus thepigs reduced their peak uCOF by 33% from dry to greasycondition and from dry to wet condition by 12%, whichwas very similar to the reduction in the uCOF produced byhumans anticipating slippery floors (Cham and Redfern,2002). Part of the explanation for the reduced peak uCOFwas the pigs’ lowered speed when walking on contami-nated floors, which was supported by the finding of othersthat the uCOF is positively correlated with walking speed(Powers et al., 2002). In cows, the uCOF was 0.54 whenwalking straight and 0.83 in single cases of a cow walkinga curved path (Van der Tol et al., 2005). In humans theuCOF was around 0.30 on a high friction surface(Kulakowski et al., 1989). Further, a value of 0.23 for
different groups of people at level walking was reported(Burnfield et al., 2005). Therefore, in comparison withother species pigs walking on a dry floor utilised thefrictional floor property to a greater extent than humansbut slightly less than cows.
In the present study the 99% confidence limit of theuCOF on the dry floor was 0.63, and one slip out of a totalof 77 steps was registered on the dry floor by visualinspection. Assuming that the pigs on dry floor walked nor-mally, whereas the lowered peak uCOF on the contami-nated floors was an expression of restricted gait, then the0.63 can be considered as a COF threshold, which ensuressafe walking on a dry concrete surface. This threshold isconsiderably higher than the differing recommendations,which have been suggested for the minimum COF of floorsfor animal housing and human walk ways i.e. a dCOF of0.35 for group-housed slaughter pigs on solid floors wassuggested (Bahr and Turpitz, 1976) and has been sup-ported by others (Kovacs and Beer, 1979; Nilsson, 1988).Moreover, a COF of 0.4 to 0.5 was recommended, becausecows walked slower, made longer strides and had largerrange of motion when the sCOF of the floor increased(Phillips and Morris, 2001). In a study of walking humanssome individuals exceeded the threshold recommendationof sCOF .0.5 which several North American states give toensure safe floors (Burnfield et al., 2005). Moreover, com-paring the uCOF from the gait analysis of the presentstudy with the greasy floor dCOF indicated that a highdCOF, higher than the 0.51 tested, is needed to ensurepigs safe walking on contaminated concrete floors. How-ever, although a high COF might give a good walking sur-face this may not be suitable for lying, as the abrasivenessmay cause skin lesions (Boyle et al., 2000), thus high-fric-tion surfaces should not be used in the resting area of thepig pen, moreover additional work should investigate thelong-term effects of housing pigs on a high-friction surface.
The propulsion/braking patterns, expressed by the peakGRFap and min GRFap respectively, showed that mainlybraking occurred during the first half, and propulsionduring the last half of the stance phase for both the fore-and hindlimbs of the pigs. However, small disturbanceshappened during the first 0.04 s after foot impact. Thesedisturbances have also been found in sheep and dogs andhave been attributed to the high forward velocity of thefoot during impact (Jayes and Alexander, 1978). Comparedwith dry condition the contaminated floors caused largedifferences in peak braking force between the limbs of the
Table 3 The static and dynamic COFs of the three floor conditions (means (s.d.) and ranges, n ¼ 10)
Dry Wet Greasy
sCOF dCOF sCOF dCOF sCOF dCOF
Mean 0.67 (0.06)a 0.65 (0.05)a 0.64 (0.03)a 0.63 (0.03)a 0.64 (0.03)a 0.51 (0.02)b
Range 0.57–0.77 0.59–0.73 0.58–0.68 0.57–0.66 0.59–0.69 0.47–0.54
a,b Different superscripts denote significant differences (P , 0.05).
Biomechanical gait analysis of walking pigs
713

pigs, suggesting that braking was equally divided betweenthe limbs on dry floor, but decreased on the forelimbs, andthus shifted braking to the hindlimbs on contaminatedfloors. Propulsion on dry floor was largest on thehindlimbs, whereas on greasy and wet floors propulsionwas equally divided between fore- and hindlimbs. Themovements made to stabilise the travel direction,expressed by the peak and min GRFml, showed that in thepigs the hindlimbs made inward corrections two to threetimes greater than the forelimbs with the difference beingmost pronounced on dry floor, suggesting that contami-nated conditions restricted the medially directed stabilisingmovements.
The alternating two and three limb support phasepattern displayed by the pigs in the present study wascomparable to the walk described for dogs (Hottinger et al.,1996), dogs and sheep (Jayes and Alexander, 1978), dairycows (Flower et al., 2005) and horses (Hodson et al.,2001). The stance phase of the hindlimbs was 14% shortercompared with the stance phase of the forelimbs. This wasalso reflected in the swing/stance phase ratio being 11%higher in the hindlimbs, thus confirming the findings inpigs half the weight (Applegate et al., 1988) of the ones inthe present study.
Sex had no influence on any of the measured variablesin the present study, although in slaughter pigs of about105 kg the sex affects some leg problems (Jørgensen,2003), therefore when studying D(YL) pigs at 75 kg, giltsand castrates were comparable. This was in agreementwith another study using castrates males and femaleslaughter pigs (Jørgensen, 1994) and can probably beascribed to a combination of the young age and the use ofcastrated males in the present study.
Healthy pigs with no signs of lameness were used inthis non-invasive study. Furthermore, the pigs walking onwet or greasy floors were not subjected to a floorcondition more extreme than what animals in normalintensive pig production may experience. Moreover, thepresent study will potentially benefit the welfare of manypigs by highlighting the importance of the physical floorproperties in pig pens and their interactions with theanimals, as called for by Webb and Nilsson (1983).
In conclusion, the pigs adapted their gait according tofloor condition to avoid slipping on contaminated andpotentially slippery floors compared with dry floor. The pigscompensated by lowering their walking speed and theirpeak uCOF. Moreover, the pigs’ progression length wasshortened and stance phase duration prolonged only ongreasy floor, thus greasy floor appeared the most slipperycondition to the pigs, whereas wet floor was intermediate.The pigs walked with a four-beat gait during which thefore- and hindlimbs differed biomechanically, as theforelimbs carried 54% of the body weight and receivedpeak forces corresponding to 56% the body weight. TheuCOF from the gait analysis indicated that a high floorsCOF (.0.63) is needed to prevent pigs from slipping andthus ensure safe walking on dry concrete floors. Moreover,
comparing the uCOF from the gait analysis with the greasyfloor dCOF indicated that a high dCOF is important toensure pigs safe walking on contaminated concrete floors.Future studies should further elucidate the effect of floorcondition by quantifying the slip distances on differentfloor conditions and by investigating further biomechanicalmeasures like foot velocities and joint moments, whichmay play important roles in joint loading.
Acknowledgement
This work was part of a project (no. 3412-04-00 114) fundedby The Danish Ministry of Food, Agriculture and Fisheries.
References
Albutt RW, Dumelow J, Cermak JP and Owens JE 1990. Slip-resistance ofsolid concrete floors in cattle buildings. Journal of Agricultural EngineeringResearch 45, 137-147.
Applegate AL, Curtis SE, Groppel JL, McFarlane JM and Widowski TM 1988.Footing and gait of pigs on different concrete surfaces. Journal of AnimalScience 66, 334-341.
Bahr H and Turpitz L 1976. Die Trittsicherheit von Stallfussboden und der Ein-flussfaktor Reibwiderstand. Agrartechnik 5, 241-243.
Boyle LA, Regan D, Leonard FC, Lynch PB and Brophy P 2000. The effect ofmats on the welfare of sows and piglets in the farrowing house. Animal Wel-fare 9, 39-48.
Burnfield JM, Tsai YJ and Powers CM 2005. Comparison of utilized coefficientof friction during different walking tasks in persons with and without a dis-ability. Gait and Posture 22, 82-88.
Cham R and Redfern MS 2002. Changes in gait when anticipating slipperyfloors. Gait and Posture 15, 159-171.
Christensen G, Vraa-Andersen L and Mousing J 1995. Causes of mortalityamong sows in Danish pig herds. The Veterinary Record 137, 395-399.
Flower FC, Sanderson DJ and Weary DM 2005. Hoof pathologies influencekinematic measures of dairy cow gait. Journal of Dairy Science 88, 3166-3173.
Hanson JP, Redfern MS and Mazumdar M 1999. Predicting slips and falls con-sidering required and available friction. Ergonomics 42, 1619-1633.
Hodson E, Clayton HM and Lanovaz JL 2001. The hindlimb in walkinghorses: 1. Kinematics and ground reaction forces. Equine Veterinary Journal.33, 38-43.
Hottinger HA, DeCamp CE, Olivier NB, Hauptman JG and Soutas-Little RW1996. Noninvasive kinematic analysis of the walk in healthy large-breed dogs.American Journal of Veterinary Research 57, 381-388.
Jayes AS and Alexander RM 1978. Mechanics of locomotion of dogs (Canisfamiliaris) and sheep (Ovis aries). Journal of Zoology 185, 289-308.
Jørgensen B 1994. Effect of different energy and protein levels on leg weak-ness and osteochondrosis in pigs. Livestock Production Science 41, 171-181.
Jørgensen B 2003. Influence of floor type and stocking density on leg weak-ness, osteochondrosis and claw disorders in slaughter pigs. Animal Science77, 439-449.
Jørgensen B, Arnbjerg J and Aaslyng M 1995. Pathological and radiologicalinvestigations on osteochondrosis in pigs, associated with leg weakness. Jour-nal of Veterinary Medicine A 42, 489-504.
Kirk RK, Svensmark B, Ellegaard LP and Jensen HE 2005. Locomotive disordersassociated with sow mortality in Danish pig herds. Journal of Veterinary Medi-cine A 52, 423-428.
Kovacs AB and Beer GY 1979. The mechanical properties and qualities offloors for pigs in relation to limb disorders. The Pig Veterinary Society Pro-ceedings 5, 99-104.
Kulakowski BT, Buczek FL Jr, Cavanagh PR and Pradhan P 1989. Evaluation ofperformance of three slip resistance testers. Journal of Testing and Evaluation17, 234-240.
Leonard FC, O’Connell JM and Lynch PB 1997. Behaviour, skin and footlesions in sows and piglets on different farrowing house floors. In Livestock
Thorup, Tøgersen, Jørgensen and Jensen
714

Environment 5, fifth international symposium, Bloomington, Minnesota, May29–31, 1997 (ed. RW Bottcher and SJ Hoff). Transactions of theAmerican Society of Agricultural Engineers 1, 242-249.
Littel RC, Stroup WW and Freund RJ 2002. SAS for linear models. SASInstitute Inc., Cary, NC.
Marchant JN and Broom DM 1996. Effects of dry sow housing conditions onmuscle weight and bone strength. Animal Science 62, 105-113.
McKee CI and Dumelow J 1995. A review of the factors involved in develop-ing effective non-slip floors for pigs. Journal of Agricultural EngineeringResearch 60, 35-42.
Nilsson C 1988. Floors in animal houses. Thesis, Swedish Department of Agri-cultural Sciences, Department of Farm Buildings, Division of Agricultural Build-ing Technology. Lund.
Phillips CJC and Morris ID 2000. The locomotion of dairy cows on concretefloors that are dry, wet, or covered with a slurry of excreta. Journal of DairyScience 83, 1767-1772.
Phillips CJC and Morris ID 2001. The locomotion of dairy cows on floorsurfaces with different frictional properties. Journal of Dairy Science 84,623-628.
Powers CM, Burnfield JM, Lim P, Brault JM and Flynn JE 2002. Utilizedcoefficient of friction during walking: static estimates exceed measuredvalues. Journal of Forensic Sciences 47, 1303-1308.
Roush JK and McLaughlin RM Jr 1994. Effects of subject stance time andvelocity on ground reaction forces in clinically normal Greyhounds at thewalk. American Journal of Veterinary Research 55, 1672-1676.
Telezhenko E and Bergsten C 2005. Influence of floor type on the locomotionof dairy cows. Applied Animal Behaviour Science 93, 183-197.
Van der Tol PPJ, Metz JHM, Noordhuizen-Stassen EN, Back W, Braam CR andWeijs WA 2005. Frictional forces required for unrestrained locomotion in dairycattle. Journal of Dairy Science 88, 615-624.
Webb NG and Clark M 1981. Livestock foot-floor interactions measured byforce and pressure plate. Farm Building Progress 66, 23-36.
Webb NG and Nilsson C 1983. Flooring and injury – an overview. In Farmanimal housing and welfare (ed. SH Baxter, MR Baxter and JAD McCormack),pp. 226-259. Martinus Nijhoff Publishers, The Hague.
Weiler U, Abi Salloum B and Claus R 2006. Influence of short-term confine-ment and exercise on tibia development in growing pigs. Journal of VeterinaryMedicine A 53, 450-455.
Biomechanical gait analysis of walking pigs
715

APPENDIX III – PAPER III
81
PAPER III
Net joint kinetics in the limbs of pigs
walking on concrete floor during dry and contaminated conditions
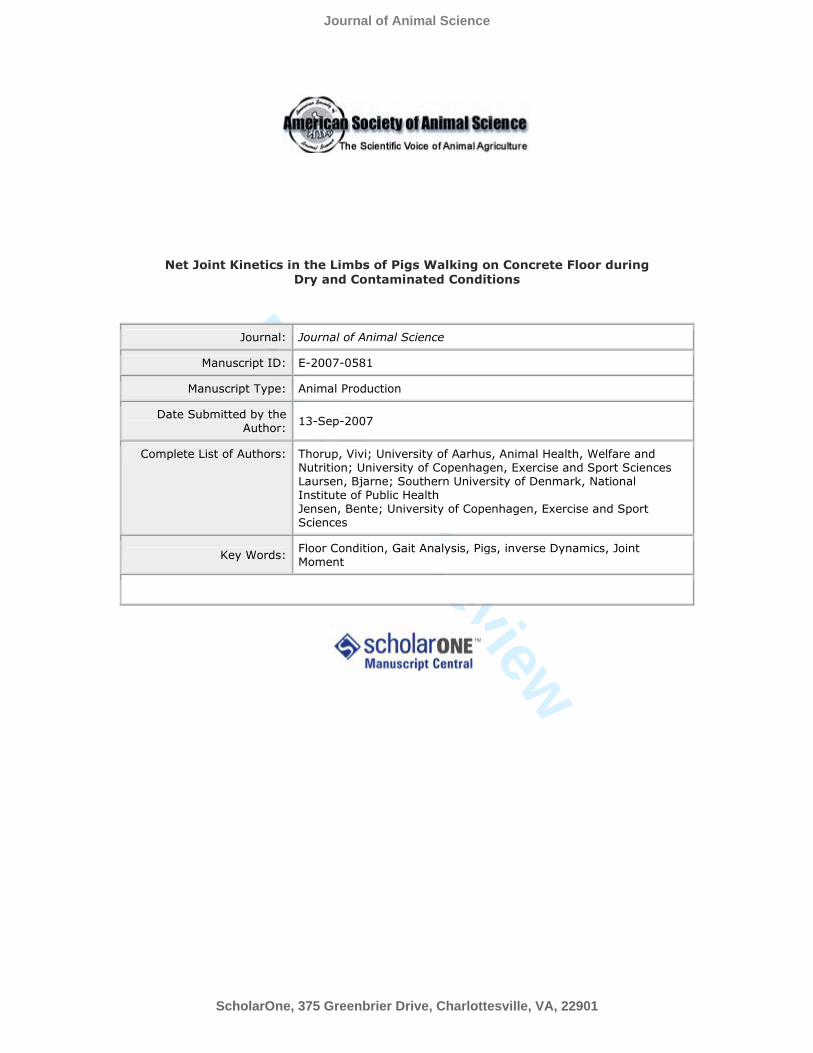
For Peer ReviewNet Joint Kinetics in the Limbs of Pigs Walking on Concrete Floor during
Dry and Contaminated Conditions
Journal: Journal of Animal Science
Manuscript ID: E-2007-0581
Manuscript Type: Animal Production
Date Submitted by the Author:
13-Sep-2007
Complete List of Authors: Thorup, Vivi; University of Aarhus, Animal Health, Welfare and Nutrition; University of Copenhagen, Exercise and Sport Sciences Laursen, Bjarne; Southern University of Denmark, National Institute of Public Health Jensen, Bente; University of Copenhagen, Exercise and Sport Sciences
Key Words:Floor Condition, Gait Analysis, Pigs, inverse Dynamics, Joint Moment
ScholarOne, 375 Greenbrier Drive, Charlottesville, VA, 22901
Journal of Animal Science

For Peer Review
page 1 of 20
Net Joint Kinetics in Walking Pigs1
2
Net Joint Kinetics in the Limbs of Pigs Walking on Concrete Floor during Dry and 3
Contaminated Conditions14
5
V. M. Thorup∗† 2, B. Laursen‡, and B. R. Jensen†6
7
∗Department of Animal Health, Welfare and Nutrition, Faculty of Agricultural Sciences, University 8
of Aarhus, Dk-8830 Tjele, Denmark, †Department of Exercise and Sport Sciences, Faculty of 9
Science, University of Copenhagen, Dk-2200 Copenhagen N, Denmark, and ‡National Institute of 10
Public Health, University of Southern Denmark, Dk-1399 Copenhagen K, Denmark11
12
1This study was part of project no. 3412-04-00114 funded by The Danish Ministry of Food, Agriculture and Fisheries. We thank our colleagues at the University of Aarhus B. Jørgensen for conceiving the project, F. Aa. Tøgersen for statistical advice, and B. L. Nielsen for comments on the manuscript. 2Corresponding author: [email protected], phone: +45 89 99 15 28, fax: +45 89 99 15 00
Page 1 of 23
ScholarOne, 375 Greenbrier Drive, Charlottesville, VA, 22901
Journal of Animal Science

For Peer Review
page 2 of 20
ABSTRACT13
14
In pigs (Sus scrofa) joint disorders are frequent leg problems, and inappropriate floors in pig pens 15
and slippery floor conditions may contribute to these problems. Therefore, this study firstly aimed 16
to quantify the net joint kinetics (net joint moments and net joint reaction forces) in the forelimbs17
and hindlimbs of healthy pigs walking on solid concrete floor. Secondly, this study aimed to18
examine the effect of floor condition on the net joint kinetics. Kinematic (50 Hz video recordings) 19
and kinetic data (1 KHz force plate measurements) were collected from 30 pigs and combined with 20
body segment parameters from a cadaver study. Net joint kinetics were calculated using a two-21
dimensional inverse dynamic solution. Inverse dynamics have, to the best of our knowledge, not22
been applied in pigs before. Dry, greasy and wet floor conditions were tested with 10 pigs each. In 23
the forelimbs the peak horizontal joint reaction force was lower (P < 0.05) on the greasy floor 24
condition (0.60 + 0.04 N/kg) compared to the dry condition (0.77 + 0.04 N/kg). Moreover the peak 25
joint moment was lower (P < 0.01) on greasy (0.184 + 0.012 Nm/kg) than on dry (0.232 + 0.012 26
Nm/kg) and wet (0.230 + 0.012 Nm/kg) conditions. Additionally, the minimum moment was more 27
negative (P < 0.05) on greasy (-0.119 + 0.009 Nm/kg) than on dry and wet (both -0.091 + 0.009 28
Nm/kg) conditions. In the hindlimbs the minimum horizontal joint reaction force was less negative29
(P < 0.001) on greasy (-0.74 + 0.03 Nm/kg) and wet (-0.76 + 0.03 Nm/kg), i.e., contaminated 30
conditions compared to dry condition (-0.89 + 0.03 Nm/kg). In addition, the greatest (P < 0.001) 31
joint moments occurred in the shoulder (-0.376 + 0.007 Nm/kg), elbow (0.345 + 0.009 Nm/kg), hip 32
(0.252 + 0.009 Nm/kg), and tarsal (0.329 + 0.009 Nm/kg) joints, which may be related to the higher 33
incidence of joint diseases in some of these joints. In conclusion, the pigs’ forelimb joints 34
responded more markedly to floor condition than the hindlimb joints, probably because the 35
forelimbs carry more weight. In particular between dry and greasy floor conditions the joint loading 36
differed, most likely caused by the pigs adapting to a potentially slippery surface.37
Page 2 of 23
ScholarOne, 375 Greenbrier Drive, Charlottesville, VA, 22901
Journal of Animal Science

For Peer Review
page 3 of 20
38
Key Words: Floor Condition, Gait Analysis, inverse Dynamics, Joint Moment, Pigs39
40
INTRODUCTION41
42
In modern pig production leg problems, including joint diseases and locomotor disorders, form a 43
severe and frequent welfare issue often exacerbated by inappropriate floors (Jørgensen, 2003). 44
Many leg problems are related to the loading or internal forces acting on the involved structures, 45
thus joint degeneration has been associated with abnormal joint loading (Radin and Paul, 1971). 46
Additionally, cartilage and bone overloading seem to trigger the development of osteochondrosis 47
and osteoarthrosis in the joints of sows (Grøndalen, 1974b). 48
49
Through inverse dynamics joint moments and joint reaction forces (JRF) can be quantified. Net 50
joint moments describe the net torque produced by muscles, tendons and ligaments. 51
Correspondingly, net JRF describes the net force acting across a joint. The joint moments and JRF 52
are calculated using an inverse dynamic model taking kinematic and kinetic data from moving 53
animals and body segment parameters as input. In quadrupeds inverse dynamics have been applied 54
to quantify joint moments of walking horses (Colborne et al., 1998; Clayton et al., 2000, 2001). 55
Furthermore joint moments in the forelimbs of walking dogs (Nielsen et al., 2003) and in dogs with 56
and without hip replacements (Dogan et al., 1991) have been calculated. In pigs however, neither 57
joint moments nor JRF have been quantified. This paper fills that gap. 58
59
Pigs adapt their gait to potentially slippery floors by lowering their walking speed and reducing 60
their peak utilized coefficient of friction on greasy and wet (contaminated) floors compared to dry 61
floor. Moreover, pigs shorten their progression length and prolong their stance phase duration on 62
Page 3 of 23
ScholarOne, 375 Greenbrier Drive, Charlottesville, VA, 22901
Journal of Animal Science

For Peer Review
page 4 of 20
greasy floor compared to dry and wet floors (Thorup et al., 2007a). We hypothesize that floor 63
condition also affects the net joint kinetics in pigs. 64
65
This study aimed to 1) quantify net joint moments and JRF in healthy pigs walking on solid 66
concrete floor and 2) examine the effect of floor condition on the net joint kinetics.67
68
MATERIALS AND METHODS69
70
Animals and Procedures71
The pigs and procedures have been described previously (Thorup et al., 2007a). In short 30 healthy 72
Duroc × Yorkshire × Landrace crossbred pigs were used. They weighed 75 + 6 kg and showed no 73
signs of lameness. The pigs walked individually and at a self-selected, steady speed on the solid 74
concrete floor (flagstone, Perstrup Concrete Industry A/S, Kolind, Denmark) along a narrow aisle. 75
Dry, wet (water) and greasy (rape seed oil) floor conditions were tested with three different groups 76
of 10 pigs each, because we wanted the pigs to be free of previous experience with the test floor. 77
From the right limbs of each pig three to four successful measurements were obtained during which 78
kinematic and kinetic data were collected simultaneously.79
80
The study complied with national rules for animal experiments, further it was non-invasive and did 81
not subject any pigs to floor conditions more extreme than those occurring in normal intensive pig 82
production. 83
84
Recording Techniques85
At 50Hz a digital video camera (Panasonic NV-DS30EG, Panasonic Denmark, Glostrup, Denmark) 86
recorded the central 1.4 m of the aisle from the right side in the sagittal plane. Seven markers on 87
Page 4 of 23
ScholarOne, 375 Greenbrier Drive, Charlottesville, VA, 22901
Journal of Animal Science

For Peer Review
page 5 of 20
each right limb, approximately 13 mm in diameter, were painted with white acrylic paint on the pigs 88
(Figure 1). The location of the joint axes of rotation of the shoulder, elbow, carpal complex, 89
forefetlock, hip, stifle, tarsal, and hindfetlock joints were established in a previous study (Thorup et 90
al., 2007b), which formed the basis of the marker placement. 91
92
[insert Figure 1 about here]93
94
The kinetic protocol has been described in detail (Thorup et al., 2007a). Briefly, t hree perpendicular 95
ground reaction forces (vertical, anteposterior horizontal, mediolateral horizontal) and their 96
corresponding moments were sampled at 1 KHz from a 0.20 × 0.30 m2 force plate (MU2030, Bertec 97
Corporation, Columbus, OH). The force plate was mounted in the central part of the aisle with test 98
floor on it, invisible to the pigs. The resolution of the moment signal was 0.02 Nm/bit. 99
100
Inverse Dynamics101
The kinematic and kinetic data were combined with the mass; length; relative center of mass 102
location; and moment of inertia of the limb segments from a previous study (Thorup et al., 2007b). 103
Joint kinetics (net joint moments and net joint reaction forces) were calculated using a two-104
dimensional (2D) inverse dynamic linked segment model. Thus far inverse dynamics have not been 105
applied in pigs. Each limb was modeled consisting of six segments, thus the forelimb consisted of 106
the foot; pastern; metacarpus; radius/ulna and humerus, and the hindlimb consisted of the hindfoot; 107
hindpastern; metatarsus; tibia and femur, thus assuming that movement occurring in the pastern 108
joint was negligible (Meershoek and van den Bogert, 2001). Assumptions to the model were that 109
segments were rigid, that the joints linking the segments were ideal hinge joints, and that movement 110
was pure rotation around a fixed axis (Winter, 2004). Positive joint moments were defined such that 111
counterclockwise moments acting on a segment distal to the joint were positive, whereas clockwise 112
Page 5 of 23
ScholarOne, 375 Greenbrier Drive, Charlottesville, VA, 22901
Journal of Animal Science

For Peer Review
page 6 of 20
moments were negative. The extensor side was the cranial (anterior) side for the elbow, hip, and 113
tarsal joints, and the caudal (posterior) side for the other joints (Figure 1). 114
115
Data Processing116
The video sequences were digitized using Pinnacle Studio (version 8, Pinnacle Systems, Inc., 117
Mountain View, CA), and 2D coordinates were constructed and digitally low-pass filtered by a 118
fourth order Butterworth filter with a cut-off frequency of 8 Hz using APAS (Ariel Dynamics Inc, 119
Trabuco Canyon, CA). The filter cut-off frequency was determined based on a frequency analysis. 120
Positional data were used to calculate: 1) linear velocities (first derivative) and accelerations 121
(second derivative) of segment end points, and 2) segment angles, defined as the angle between the 122
segment and horizontal. Angular velocities and accelerations were then determined by the first and 123
second derivates, respectively. Kinetic data were downsampled to 50 Hz and normalized in 124
magnitude by body mass. All data were normalized in time by interpolating data points to form 100 125
samples for each stance phase by fitting a cubic spline to the data. All calculations were made using 126
MATLAB (2002, The MathWorks Inc, Natick, MA, USA). 127
128
The peak joint moment (Nm/kg), minimum joint moment (Nm/kg), peak vertical JRF (Peak JRFv,129
N/kg), peak anteposterior horizontal JRF (Peak JRFh, N/kg), and minimum anteposterior horizontal 130
JRF (Min JRFh, N/kg) were calculated for all joints. 131
132
Statistical Analysis133
Comparisons between floor conditions and between joints were made in a two-way ANOVA test. 134
All variables were tested separately in a repeated measurement model using the SAS PROC 135
MIXED procedure (2001, SAS Institute Inc, Cary, NC). Floor condition and joint were modeled as 136
systematic effects. The random effects were the residual error term along with a repeated effect 137
Page 6 of 23
ScholarOne, 375 Greenbrier Drive, Charlottesville, VA, 22901
Journal of Animal Science

For Peer Review
page 7 of 20
accounting for the correlations between joints for each pig. All random terms were considered 138
independent. Residual analysis was used to verify the assumptions regarding normality of data and 139
variance homogeneity. The three to four trials per limb per pig were averaged. Furthermore 140
differences between joints were compared within limbs only. The three floor conditions, ten pigs 141
per condition and five joints per pig amounted to 150 observations per limb for each variable. The 142
results are presented as least square means with standard errors. A level of significance of 5% is 143
used throughout unless otherwise mentioned. 144
145
RESULTS146
147
Net Joint Moments148
The joint moment time course patterns were similar across the floor conditions (Figure 2). The 149
shoulder moment had a small flexor dominated peak around 16% stance phase, then shifted to 150
extensor domination with a large negative minimum around 76% stance. The elbow moment 151
increased quickly towards an extensor dominated peak around 26% stance, then declined to flexor 152
domination having a negative minimum at 95% stance. The carpal joint was entirely flexor 153
dominated. The flexor dominated fore- and hindfetlock joint moments had similar patterns rising 154
moderately towards the peaks around 73% and 62%, respectively. The flexor dominated fore- and 155
hindcoffin joint moment patterns were also alike, with slow increases until peaking at 156
approximately 78% stance. The mainly extensor dominated hip moment peaked around 38% stance 157
with only a short flexor dominated period with a minimum at 90% stance. The stifle moment was 158
initially small with a flexor dominated peak around 18% stance, it then shifted to extensor 159
domination with a negative minimum around 80% stance. The entirely extensor dominated tarsal 160
joint moment peaked around 37% stance. 161
162
Page 7 of 23
ScholarOne, 375 Greenbrier Drive, Charlottesville, VA, 22901
Journal of Animal Science

For Peer Review
page 8 of 20
[insert Figure 2 about here]163
164
Floor condition affected the forelimb joint moment magnitudes (Figure 2). Thus in the forelimbs 165
greasy condition lowered the peak moment significantly (by 21%) compared to dry and wet 166
conditions, moreover the minimum moment was significantly more negative on greasy condition 167
(24%) compared to dry and wet conditions (Table 1a). 168
169
[insert Table1a about here]170
171
The majority of the joints differed significantly with regard to both peak and minimum moments 172
(Table 1b). Thus the greatest moment amplitudes (i.e., the range between the peak and minimum 173
moments) in the forelimb were in the shoulder and elbow joints. In the shoulder the large range was 174
caused by a very negative moment, whereas in the elbow the range was due to a very high peak 175
moment. In the hindlimbs the greatest joint moment amplitudes were in the hip and tarsal joints,176
which both showed considerable peak and minimum moments. 177
178
[insert Table 1b about here]179
180
Net Joint Reaction Forces181
The horizontal JRF patterns were similar in all joints of a limb, i.e., the negative JRF in the first half 182
of the stance phase was approximately equal to the positive JRF during the last half of the stance 183
phase, therefore only the most distal and proximal joints of each limb are shown in Figure 3. Greasy 184
floor decreased (by 22%) the peak horizontal JRF significantly in the forelimb joints compared to 185
dry floor, whereas wet floor was intermediate (Table 1a and Figure 3). Floor condition did not 186
affect the minimum horizontal JRF in the forelimbs, whereas in the hindlimbs the minimum 187
Page 8 of 23
ScholarOne, 375 Greenbrier Drive, Charlottesville, VA, 22901
Journal of Animal Science

For Peer Review
page 9 of 20
horizontal JRF was significantly smaller on contaminated floors compared to dry floor (Table 1a 188
and Figure 3). 189
190
[insert Figure 3 about here]191
192
The vertical JRF tended to follow a two-humped time course pattern with a dip in between (Figure 193
3). In the forelimb the second maximum was usually the greatest, whereas in the hindlimb the first 194
maximum was usually the greatest. The peak vertical JRF was approximately 8 times greater than 195
the peak horizontal JRF. Floor condition did not affect the peak vertical JRF significantly (Table 196
1a). 197
198
Most of the JRF differed significantly within limb (Table 1b). Thus the peak vertical JRF was 199
greatest in the distal joints and decreased significantly when moving proximally. The elbow and 200
shoulder joints differed significantly from each other, moreover they exerted significantly greater 201
peak horizontal JRF and significantly more negative minimum horizontal JRF compared to the 202
other forelimb joints. The hip exerted a significantly greater peak horizontal JRF and more negative 203
minimum horizontal JRF than the other hindlimb joints. 204
205
DISCUSSION206
207
The main findings of this study confirmed the hypothesis that floor condition affects the net joint 208
kinetics in walking pigs. Furthermore the forelimbs responded more clearly to floor condition than 209
the hindlimbs. 210
211
Page 9 of 23
ScholarOne, 375 Greenbrier Drive, Charlottesville, VA, 22901
Journal of Animal Science

For Peer Review
page 10 of 20
The pigs’ overall walking patterns were similar on the three floor conditions with regard to the joint 212
kinetics. Nevertheless the greasy, and potentially more slippery, floor displaced several dynamic 213
features compared to dry floor. Thus the forelimb peak horizontal JRF and the peak moment 214
decreased and the minimum moment was more negative on greasy than on dry condition. In the 215
hindlimbs only the minimum horizontal JRF decreased on contaminated conditions compared to dry 216
condition. The magnitude of decrease in the pigs’ joint moments as a response to greasy floor 217
agreed well with findings in humans. Thus in walking humans the anticipation of slippery floors 218
lowered the peak ankle, knee and hip moments by 24 to 30% (Cham and Redfern, 2002). 219
Furthermore as reported elsewhere (Thorup et al., 2007a) the pigs reacted to contaminated 220
conditions by walking slower than they did on dry condition, moreover pigs walking on greasy 221
floor reduced their peak utilized coefficient of friction and took shorter steps compared to pigs 222
walking on dry floor. Hence the displaced joint moments and horizontal JRF reported here were 223
most likely consequences of the gait adaptations made by the pigs walking on greasy floor. 224
225
Compared to other quadrupeds the net joint moment patterns of the pigs in this study were to some 226
extent similar to those of horses (Colborne et al., 1998; Clayton et al., 2000, 2001), except that 227
Colborne and colleagues defined the flexor side of the fetlock to be on the cranial joint side, thus 228
resulting in the horses’ fetlock joint being dominated by an extensor moment. Further the hip 229
moment of the pigs was more extensor dominated than that of the horses’. Comparing the pigs’ 230
fetlock, carpal and elbow joint moments to the corresponding joints of dogs, similarities are also 231
evident (Nielsen et al., 2003). Although being normalized to body weight, the net joint moment 232
magnitudes of the pigs in the present study were smaller than those reported for horses (Colborne et 233
al., 1998; Clayton et al., 2000, 2001), which may be caused by differences in body c onformation 234
and limb anatomy. The deviating magnitudes may, however also be caused by different modeling 235
approaches. In the present study a 2D data acquisition was used, in which some out-of-plane 236
Page 10 of 23
ScholarOne, 375 Greenbrier Drive, Charlottesville, VA, 22901
Journal of Animal Science

For Peer Review
page 11 of 20
movement occurs, that would have been captured by the 3D approach used in the equine studies. 237
Nevertheless, a comparison of 2D versus 3D approaches in human walking showed that the joint 238
moment patterns were identical, although differences in peak and minimum values occurred 239
(Alkjær et al., 2001). Therefore we wer e convinced that the simpler 2D solution was adequate for a 240
biomechanical quantification of the gait pattern in walking pigs. 241
242
In pigs joint disorders occur in several joints (Nakano et al., 1987), however the most frequent site 243
of osteochondrotic lesions in the forelimbs is the elbow (Grøndalen, 1974a; Jørgensen, 2000; 244
Jørgensen and Andersen, 2000). In the hindlimbs the stifle and to a less extent the hip are frequent 245
sites of osteocondrotic lesions (Grøndalen, 1974a; Jørgensen et al., 1995). This study f ound high246
net joint moment amplitudes in the shoulder, elbow, hip and tarsal joints, which may help explain 247
why joint diseases occur more frequently in the proximal than the distal joints. However, as the net 248
joint moments only represent a summation of all muscles acting across a joint, it is impossible to 249
distinguish which muscle groups are creating the joint moment or to calculate the level of muscle 250
activity (Winter, 1987). To make this distinction a partitioning of the individual muscle forces is 251
needed, for instance by measuring electromyography as done by Chambers and Cham (2007), who 252
in walking humans demonstrated a more powerful muscular knee and ankle activity when the test 253
person expected a slippery surface. Thus it is possible that the muscle activity of the pigs walking 254
on greasy floor was high despite the lowered peak and minimum net joint moments observed in this 255
study. Likewise, the net JRF based on inverse dynamics, does not include forces caused by muscle 256
co-contraction, therefore the total joint reaction force may be underestimated. 257
258
The pigs in the present study were more affected by floor property in their forelimbs than in their 259
hindlimbs. This was in agreement with a study of younger pigs walking on differing wet concrete 260
floors (Applegate et al., 1988) in which pigs’ forelimbs slipped more and longer and showed more 261
Page 11 of 23
ScholarOne, 375 Greenbrier Drive, Charlottesville, VA, 22901
Journal of Animal Science

For Peer Review
page 12 of 20
changes in angular measurements compared to their hindlimbs. In addition the pigs carried 54% of 262
the load on their forelimbs as reported elsewhere (Thorup et al., 2007a). Thu s their larger load may 263
explain why the forelimbs kinetically responded more clearly to floor condition than did the 264
hindlimbs. 265
266
The kinematic part of this study was based on skin markers, which were subject to movement over 267
the skeletal structures, movements that may potentially have introduced measurement errors. Skin 268
displacements in the proximal (van Weeren et al., 1990) and distal limb parts (van Weeren et al., 269
1988) of walking horses have been quantified. Moreover, correction models for skin displacement 270
in horses have been presented (van Weeren et al., 1992). These equine studies showed that skin 271
displacement was larger in the more proximal joints than in the distal joints, larger in the fore- than 272
in the hindlimb, and that displacement took place mainly during the swing phase. In pigs the skin 273
displacement has not been investigated, and the correction model for horses could not be used, as 274
the anatomy of the horse and pig differ to some extent, therefore the effect of skin displacement on 275
the findings of the present study remains unclear. Nevertheless, this study reported stance phase 276
results only, during which errors arising from skin displacement presumably are negligible. 277
278
The present study provided a basic characterization of the physiological loading of the fore- and 279
hindlimb joints in healthy pigs from a homogenous population walking on different floor 280
conditions. In horses peak vertical ground reaction forces have been shown to differ between breeds 281
(Back et al., 2007). Further the forelimb bon e lengths and muscle weights in Duroc pigs were 282
affected by selection for leg weakness (Draper et al., 1988). Joint kinetics may, too, depend on 283
breed, which should be taken into account in future biomechanical studies of pigs differing from the 284
breed used here. Our study furthermore presented a normative benchmark to compare with data 285
Page 12 of 23
ScholarOne, 375 Greenbrier Drive, Charlottesville, VA, 22901
Journal of Animal Science

For Peer Review
page 13 of 20
from lame pigs or pigs that have had operation or surgical implants, as pigs are increasingly used as 286
model animals for humans. 287
288
In conclusion, this study showed that greasy floor condition caused significant changes in gait 289
biomechanics when comparing with pigs walking on dry floor, whereas wet condition seemed more 290
intermediate. As a consequence of adapting to a potentially slippery surface the forelimb peak 291
horizontal JRF and the hindlimb minimum horizontal JRF were lowest in pigs walking on greasy 292
floor, further the forelimb joint moments were displaced to a lower level on greasy floor compared 293
to dry and wet floors. The pigs’ forelimb joints responded more obviously to floor condition than 294
their hindlimb joints, probably because the forelimbs carry more weight. Future studies should seek 295
to quantify the level of muscle activity, which may be high on greasy floor despite the lowered peak 296
JRF and joint moments observed in this study. 297
298
LITERATURE CITED299
300
Alkjær, T., E. B. Simonsen, and P. Dyhre-Poulsen. 2001. Comparison of inverse dynamics 301
calculated by two- and three-dimensional models during walking. Gait Posture 13:73-77.302
Applegate, A. L., S. E. Curtis, J. L. Groppel, J. M. McFarlane, and T. M. Widowski. 1988. Footing 303
and gait of pigs on different concrete surfaces. J. Anim. Sci. 66:334-341.304
Back, W., C. G. MacAllister, M. C. Van Heel, M. Pollmeier, and P. D. Hanson. 2007. Vertical 305
frontlimb ground reaction forces of sound and lame Warmbloods differ from those in Quarter 306
horses. J. Equine Vet. Sci. 27:123-129.307
Cham, R. and M. S. Redfern. 2002. Changes in gait when anticipating slippery floors. Gait Posture 308
15:159-171.309
Page 13 of 23
ScholarOne, 375 Greenbrier Drive, Charlottesville, VA, 22901
Journal of Animal Science

For Peer Review
page 14 of 20
Chambers, A. J. and R. Cham. 2007. Slip-related muscle activation patterns in the stance leg during 310
walking. Gait Posture 25:565-572.311
Clayton, H. M., E. Hodson, and J. L. Lanovaz. 2000. The forelimb in walking horses: 2. Net joint 312
moments and joint powers. Equine Vet. J. 32:295-299.313
Clayton, H. M., E. Hodson, J. L. Lanovaz, and G. R. Colborne. 2001. The hindlimb in walking 314
horses: 2. Net joint moments and joint powers. Equine Vet. J. 33:44-48.315
Colborne, G.R., J. L. Lanovaz, E. J. Sprigings, H. C. Schamhardt, and H. M. Clayton. 1998.316
Forelimb joint moments and power during the walking stance phase of horses. Am. J. Vet. Res.317
59:609-614.318
Dogan, S., P. A. Manley, R. Vanderby Jr., S. S. Kohles, L. M. Hartman, and A. A. McBeath. 1991.319
Canine intersegmental hip joint forces and moments before and after cemented total hip320
replacement. J. Biomech. 24:397-407.321
Draper, D. D., M. F. Rothschild, and L. L. Christian. 1988. Effects of divergent selection on 322
muscle, tendon, and bone characteristics of three lines of Duroc swine with differing degrees of leg 323
weakness. Anat. Histol. Embryol. 17:365. (Abstr.)324
Grøndalen, T. 1974a. Leg weakness in pigs. I. Incidence and relationship to skeletal lesions, feed 325
level, protein and mineral supply, exercise and exterior conformation. Acta Vet. Scand. 15:555-573.326
Grøndalen, T. 1974b. Osteochondrosis and arthrosis in pigs. IV. Effect of overloading on the distal 327
epiphyseal plate of the ulna. Acta Vet. Scand. 15:53-60.328
Jørgensen, B. 2000. Osteochondrosis / Osteoarthrosis and claw disorders in sows, associated with 329
leg weakness. Acta Vet. Scand. 41:123-138.330
Page 14 of 23
ScholarOne, 375 Greenbrier Drive, Charlottesville, VA, 22901
Journal of Animal Science

For Peer Review
page 15 of 20
Jørgensen, B. 2003. Influence of floor type and stocking density on leg weakness, osteochondrosis 331
and claw disorders in slaughter pigs. Anim. Sci. 77:439-449.332
Jørgensen, B. and S. Andersen. 2000. Genetic parameters for osteochondrosis in Danish Landrace 333
and Yorkshire boars and correlations with leg weakness and production traits. Anim. Sci. 71:427-334
434.335
Jørgensen, B., J. Arnbjerg, and M. Aaslyng. 1995. Pathological and radiological investigations on 336
osteochondrosis in pigs, associated with leg weakness. J. Vet. Med. A 42:489-504.337
Meershoek, L. S. and A. J. van den Bogert. 2001. Mechanical analysis of locomotion. Pages 305-338
326 in Back, W. and Clayton, H.M. (Eds.) Equine locomotion. W.B. Saunders, London.339
Nakano, T., J. J. Brennan, and F. X. Aherne.1987. Leg weakness and ostechondrosis in swine: A 340
review. Can. J. Anim. Sci. 67:883-901.341
Nielsen, C., S. M. Stover, K. S. Schulz, M. Hubbard, and D. A. Hawkins. 2003. Two-dimensional 342
link-segment model of the forelimb of dogs at a walk. Am. J. Vet. Res. 64: 609-617.343
Radin, E. L. and I. L. Paul. 1971. Response of joints to impact loading. Arthritis Rheum. 14:356-344
362.345
Thorup, V. M., F. Aa. Tøgersen, B. Jørgensen, and B. R. Jensen. 2007a. Biomechanical gait 346
analysis of pigs walking on solid concrete floor. Animal 1:708-715.347
Thorup, V. M., F. Aa. Tøgersen, B. Jørgensen, and B. R. Jensen. 2007b. Joint rotation axes and 348
body segment parameters of pig limbs. Acta Vet. Scand. 49:20. (doi: 10.1186/1751-0147-49-20)349
Page 15 of 23
ScholarOne, 375 Greenbrier Drive, Charlottesville, VA, 22901
Journal of Animal Science

For Peer Review
page 16 of 20
van Weeren, P. R., A. J. van den Bogert, and A. Barneveld. 1988. Quantification of skin 350
displacement near the carpal, tarsal and fetlock joints of the walking horse. Equine Vet. J. 20:203-351
208.352
van Weeren, P. R., A. J. van den Bogert, and A. Barneveld. 1990. Quantification of skin 353
displacement in the proximal parts of the limbs of the walking horse. Equine Vet. J.(Suppl. 9):110-354
118.355
van Weeren, P. R., A. J. van den Bogert, and A. Barneveld. 1992. Correction models for skin 356
displacement in equine kinematic gait analysis. J. Equine Vet. Sci. 12:178-192.357
Winter, D. A. 1987. Mechanical power in human movement: Generation, absorption and transfer. 358
Med. Sport Sci. 25:34-45.359
Winter, D. A. 2004. Biomechanics and motor control of human movement. Pages 1-326 in John 360
Wiley & Sons, Inc., Hoboken.361
Page 16 of 23
ScholarOne, 375 Greenbrier Drive, Charlottesville, VA, 22901
Journal of Animal Science

For Peer Review
page 17 of 20
TABLES362
363
Table 1a. Peak and minimum JRFv1, JRFh2 (N/kg), and net joint moments (Nm/kg) of the fore- and 364
hindlimbs for the three floor conditions3365
Condition
Dry Wet Greasy P
Forelimb
Peak JRFv 5.49 + 0.10 5.57 + 0.10 5.62 + 0.10
Peak JRFh 0.77 + 0.04a 0.67 + 0.04ab 0.60 + 0.04b *
Min JRFh -0.77 + 0.05 -0.75 + 0.05 -0.80 + 0.05
Peak Joint Moment 0.232 + 0.012a 0.230 + 0.012a 0.184 + 0.012b **
Min Joint Moment -0.091 + 0.009a -0.091 + 0.009a -0.119 + 0.009b *
Hindlimb
Peak JRFv 4.27 + 0.08 4.33 + 0.08 4.24 + 0.08
Peak JRFh 0.77 + 0.03 0.83 + 0.03 0.75 + 0.03
Min JRFh -0.89 + 0.03a -0.76 + 0.03b -0.74 + 0.03b ***
Peak Joint Moment 0.209 + 0.012 0.220 + 0.012 0.205 + 0.012
Min Joint Moment -0.059 + 0.005 -0.054 + 0.005 -0.058 + 0.005
a, b Within a row condition means that do not have a common superscript differ significantly (* P < 0.05; ** P < 0.01; 366
*** P < 0.001). 367
1 JRFv: vertical net joint reaction force368
2 JRFh: horizontal net joint reaction force369
3 Values are least square means + SE across all joints, n=150370
371
Page 17 of 23
ScholarOne, 375 Greenbrier Drive, Charlottesville, VA, 22901
Journal of Animal Science

For Peer Review
page 18 of 20
Table 1b. Peak and minimum JRFv1, JRFh2 (N/kg), and net joint moments (Nm/kg) of the fore- and hindlimb joints3372
Joint
Coffin Fetlock Carpal/Tarsal Elbow/stifle Shoulder/hip
Forelimb
Peak JRFv 5.66 + 0.06a 5.65 + 0.06b 5.63 + 0.06c 5.52 + 0.06d 5.34 + 0.06e
Peak JRFh 0.70 + 0.02a 0.70 + 0.02a 0.70 + 0.02a 0.66 + 0.02b 0.64 + 0.02c
Min JRFh -0.75 + 0.03a -0.75 + 0.03a -0.76 + 0.03a -0.77 + 0.03b -0.83 + 0.03c
Peak Joint Moment 0.158 + 0.009a 0.216 + 0.009b 0.228 + 0.009b 0.345 + 0.009c 0.128 + 0.009d
Min Joint Moment -0.010 + 0.007a -0.009 + 0.007a -0.023 + 0.007a -0.084 + 0.007b -0.376 + 0.007c
Hindlimb
Peak JRFv 4.47 + 0.04a 4.46 + 0.04a 4.41 + 0.04b 4.29 + 0.04c 3.77 + 0.04d
Peak JRFh 0.78 + 0.02a 0.77 + 0.02a 0.76 + 0.02a 0.76 + 0.02a 0.85 + 0.02b
Min JRFh -0.77 + 0.02a -0.77 + 0.02a -0.78 + 0.02a -0.79 + 0.02a -0.88 + 0.02b
Peak Joint Moment 0.143 + 0.009a 0.222 + 0.009b 0.329 + 0.009c 0.110 + 0.009d 0.252 + 0.009e
Min Joint Moment -0.009 + 0.005a -0.005 + 0.005a -0.014 + 0.005a -0.154 + 0.005b -0.103 + 0.005c
a, b Within a row joint means that do not have a common superscript differ significantly (P < 0.001). 373
1 JRFv: vertical net joint reaction force374
2 JRFh: horizontal net joint reaction force 375
Page 18 of 23
ScholarOne, 375 Greenbrier Drive, Charlottesville, VA, 22901
Journal of Animal Science

For Peer Review
page 19 of 20
3 Values are least square means + SE across all floor conditions, n=150376
377
Page 19 of 23
ScholarOne, 375 Greenbrier Drive, Charlottesville, VA, 22901
Journal of Animal Science

For Peer Review
page 20 of 20
378
FIGURE CAPTIONS379
380
Figure 1. Marker locations and joint names on the pigs. F: forelimb, H: hindlimb. F1: spinous tuber 381
of scapula, F2: caudal part of major tubercle (shoulder), F3: condyle of humerus (elbow), F4: carpal 382
bone IV (carpal complex), F5: distal on metacarpal bone IV (fetlock), F6: coronary band (coffin),383
F7: distal on claw wall of the distal phalanx of fourth digit, H1: tuber coxae; H2: caudal part of 384
major trochanter (hip), H3: lateral condyle of femur (stifle), H4: distal part of calcaneus (tarsal), H5: 385
distal on metatarsal bone IV (fetlock), H6: coronary band (coffin), H7: distal on claw wall of the 386
distal phalanx of fourth digit. Joint flexion side is indicated by arrows. 387
388
Figure 2. Net joint moments (Nm/kg) of the hindlimb (left column) and forelimb (right column) for 389
the three floor conditions. Asterisks indicate significant differences between the greasy (G) versus 390
the dry (D) and wet (W) floor conditions.391
392
Figure 3. Net joint reaction forces (JRF; N/kg) of the coffin ( cof) and hip joints of the hindlimb 393
and of the cof and shoulder (sho) joints of the forelimb on dry and greasy floors. Top: stick figures 394
showing two consecutive gait cycles from a pig walking on dry floor. First toe contact, 395
corresponding to 0% stance phase, of the second stance phase is indicated by a bold line. Middle: 396
vertical JRF. Bottom: horizontal JRF. Asterisks indicate significant differences between dry (D) and 397
greasy (G) floor conditions.398
Page 20 of 23
ScholarOne, 375 Greenbrier Drive, Charlottesville, VA, 22901
Journal of Animal Science
For Peer Review
H1
Hip, H2
Stifle, H3
Tarsal, H4
Fetlock, H5
Coffin, H6
H7
F1
Shoulder, F2
Elbow, F3
Carpal, F4
Fetlock, F5Coffin, F6
F7
Figure 1, manuscript no.
Page 21 of 23
ScholarOne, 375 Greenbrier Drive, Charlottesville, VA, 22901
Journal of Animal Science

For Peer Review
Hindlimb
-0.2
0
0.2
0.4
1 21 41 61 81
Hip
mom
ent,
Nm
/kg
-0.2
0
0.2
0.4
1 21 41 61 81
Stifl
e m
omen
t, N
m/k
g
Extension = +
Flexion = +
-0.2
0
0.2
0.4
1 21 41 61 81
Tar
sal m
omen
t, N
m/k
g
Extension = +
-0.2
0
0.2
0.4
1 21 41 61 81
Fetlo
ck m
omen
t, N
m/k
g
Flexion = +
-0.2
0
0.2
0.4
1 21 41 61 81
Time (% stance)
Cof
fin
mom
ent,
Nm
/kg
D W G
Flexion = +
Forelimb
-0.4
-0.2
0
0.2
1 21 41 61 81
Shou
lder
mom
ent,
Nm
/kg
Flexion = +
-0.2
0
0.2
0.4
1 21 41 61 81
Elb
ow m
omen
t, N
m/k
g
Extension = +
-0.2
0
0.2
0.4
1 21 41 61 81
Car
pal m
omen
t, N
m/k
gFlexion = +
-0.2
0
0.2
0.4
1 21 41 61 81
Fetlo
ck m
omen
t, N
m/k
g
Flexion = +
-0.2
0
0.2
0.4
1 21 41 61 81
T ime (% stance)
Cof
fin
mom
ent,
Nm
/kg
D W G
Flexion = +
Figure 2, manuscript no.
Page 22 of 23
ScholarOne, 375 Greenbrier Drive, Charlottesville, VA, 22901
Journal of Animal Science

For Peer Review
Hindlimb Forelimb
-2
0
2
4
6
1 21 41 61 81
Ver
tical
JR
F, N
/kg
-1.0
-0.5
0.0
0.5
1.0
1 21 41 61 81
Time (% stance)
Hor
izon
tal J
RF,
N/k
g
D cof D hip G cof G hip
-2
0
2
4
6
1 21 41 61 81
Ver
tical
JR
F, N
/kg
-1.0
-0.5
0.0
0.5
1.0
1 21 41 61 81
Time (% stance)
Hor
izon
tal J
RF,
N/k
g
D cof D sho G cof G sho
Figure 3, manuscript no.
Page 23 of 23
ScholarOne, 375 Greenbrier Drive, Charlottesville, VA, 22901
Journal of Animal Science