Embed Size (px)
Citation preview
TheSTATE of TRANSIT in NEW ORLEANSTen YearsAfter Katrina WO R L D C L AS S T R A N S I T F O R N E W O R L E A N S

Ten years post-Katrina, New Orleans’ transit recovery remains uneven. Bus service remains down 65% while there are now more streetcars making more trips than were offered in 2005. Ridership gains have slowed in recent years, likely due to the lack of frequent transit service. While streetcars remain an historic and iconic part of our transit system, they are costly to install and inflexible in providing service. Federal monies and local bond sales have financed a massive streetcar expansion project which has not been well-integrated into the existing network of bus routes and has actually worsened commutes for some bus riders by forcing them to transfer to the new streetcar to complete their trip.
By narrowly focusing our capital investment on streetcar expansion, we are missing the opportunity to pursue other game-changing transit modes that can provide high quality, rapid transit to housing and job centers across our region. And by expending increasingly larger shares of our operating budget on streetcars, we are selling bus riders short.
Our uneven transit recovery can be partially attributed to the lack of a true, comprehensive transit master plan to guide the New Orleans Regional Transit Authority’s (NORTA) investments and decision-making. The absence of a well-defined vision, clearly established goals, and a plan that is developed in coordination with community members has led to ad hoc decision-making and a haphazard service recovery. We at Ride New Orleans were discouraged when TransDev, the private company that manages NORTA’s day-to-day operations, presented a 20-year capital plan to the NORTA Board of Commissioners because it presents a massive streetcar expansion plan instead of balancing the need for quality transit options using multiple modes. The plan was created behind closed doors with no public input and offers no framework for evaluating tradeoffs and investments. We are heartened that the NORTA Board has not endorsed this plan because we are optimistic about the future of transit in New Orleans.
The financial situation of the agency has significantly improved: NORTA is no longer looking over the edge of a fiscal cliff. The NORTA Board seized on the opportunity to strengthen their position when renewing their contract with TransDev. Through the new agreement, the agency will realize significant cost savings, service improvements, and greater authority over their contracted staff, and will be able to make better use of their improved financial position. The NORTA Board has worked hard over the last few years to bring the agency to a stable financial and institutional position, making it easier to achieve future improvements.
We now call upon the NORTA Board of Directors to set the long term vision for the organization through a comprehensive, publicly vetted master plan.
Ride New Orleans’ Board would like to thank our Executive Director, Rachel Heiligman, for her tireless efforts in analyzing data, writing this report, and coordinating the review process. Ride New Orleans received help in this effort from Vivek Shah and Peter Bennett, researchers from the Ride New Orleans’ Policy Committee; and our committee of outside reviewers. We thank all of those who assisted for their efforts. Finally, we would like to thank all of the riders of the New Orleans Regional Transit Authority. Without you, there would be no vision for the future. Sincerely,
From the Board of Ride New Orleans
1WO R L D C L AS S T R A N S I T F O R N E W O R L E A N S
Ride New Orleans - The State of Transit in New Orleans: Ten Years After Katrina
President, Ride New OrleansJacquelyn Dadakis
About Our OrganizationRide New Orleans is an independent non-profit organization. Our vision is a world class, multi-modal transportation system that promotes a vibrant, healthy and sustainable New Orleans region. Our mission is to enhance the quality of life in the New Orleans region by promoting safe, convenient, and affordable transportation options.
Visit http://rideneworleans.org for more information.
Board of Directors Jacquelyn Dadakis - President Alexandra Miller - TreasurerFred Neal Jr. - SecretaryTrevor Theunissen - Immediate Past President Samuel Cook IIIRafe RabalaisJeffrey SchwartzPhilip Stelly
StaffRachel Heiligman - Executive DirectorMatthew Hendrickson - Advocacy Program Coordinator
Report ContributorsJeffrey Goodman - Graphic DesignerPeter Duffy Bennett - GIS Analyst
2WO R L D C L AS S T R A N S I T F O R N E W O R L E A N S
Ride New Orleans - The State of Transit in New Orleans: Ten Years After Katrina
WO R L D C L AS S T R A N S I T F O R N E W O R L E A N S
A Special Thanks to our Funders
TABLE OF CONTENTS
1
2
4
78
9
11
121316
21222627
28
29
30
Page
3WO R L D C L AS S T R A N S I T F O R N E W O R L E A N S
Ride New Orleans - The State of Transit in New Orleans: Ten Years After Katrina
From the Board of Ride New Orleans
About Our Organization
Executive Summary
Part I: Progress 1. More Service for More People
NeighborhoodsAcrosstheCityBenefitfromRecentServiceAdditions IncreasedFrequencyLeadstoMoreConvenientService
2. Board of Commissioners Steers Agency to Stability A Better Contract AStrongerFinancialOutlook AnnualTrainingBegins EmpoweredCommunityVoices
3. Public Transit Lies At The Heart Of New City Policy Initiatives
Part II: A Long Way to Go 1. Since Katrina, Only 45% of Service Has Returned 2. An Uneven Recovery: Streetcars Prioritized Over Buses
StreetcarOperationsAreDisproportionatelyFunded CapitalBudgetsFavorInefficientService
Part III: A Way Forward 1. A Real Transit Master Plan 2. Immediate Operations Improvements 3. Make It Easier to Travel Across Parish Borders
Conclusion
Action Steps
Appendix - Methodology + Definitions
Since RIDE New Orleans released its inaugural “State of Transit in New Orleans” report in July 2014, the New Orleans Regional Transit Authority (NORTA) has made significant progress adding transit service, controlling costs and strengthening the agency’s financial and management oversight positions. But overall, our transit recovery continues to lag; ten years after Katrina, just 45% of our overall transit service has returned.
Following Katrina, streetcars have risen to a new level of prominence, commanding a significantly larger share of NORTA’s operating expenses. In fact, NORTA has fully restored pre-Katrina levels of streetcar service, but just 35% of bus service. Given that existing streetcar lines serve only select neighborhoods, this uneven recovery has left many neighborhoods across the city with poor-quality transportation choices.
NORTA is no longer at a point where the agency is simply recovering from post-Katrina devastation. Instead, the agency has moved beyond recovery and is actively expanding streetcar infrastructure. Yet NORTA’s planning efforts have been limited to fragmented studies and plans. The agency still lacks an integrated vision, guided by community priorities, and a framework with which to evaluate investment outcomes among competing interests for limited resources. The time has come for the NORTA Board of Commissioners (NORTA Board), together with New Orleans and regional community leaders, businesses and elected officials, to develop a stakeholder-led transit master plan, deploy immediate operations improvements, and make it easier to travel across parish boundary lines. In order for this planning effort to be successful, NORTA must work collaboratively with City leaders to ensure the transit master plan is integrated with City of New Orleans’ policy initiatives and anticipated growth and development patterns.
The first part of this report examines progress made by NORTA in the last three years. The second part shows that NORTA still has a long way to go in its efforts to provide high-quality transit service and provides key data points on our uneven transit recovery. In the final part, RIDE New Orleans calls for NORTA to work alongside the City and its many stakeholders towards a new direction.
Executive SummaryThe July 2014 report highlighted New
Orleans transit recovery through 2012.
Relying on a number of data indicators,
we revealed that our city had recovered
just 36% of its pre-Katrina transit service,
though our population had rebounded
to 86% of pre-Katrina levels over that
same time period. We also found that the
greatest declines in available transit service
had occurred disproportionately in low-
income neighborhoods, communities of
color, and areas where fewer households
had access to personal vehicles. Finally,
we found that the costs of the New
Orleans Regional Transit Authority
(NORTA) were significantly higher than
peer transit agencies and that the agency
was on an unsustainable spending path
that could further jeopardize our continued
transit recovery.
4WO R L D C L AS S T R A N S I T F O R N E W O R L E A N S
Ride New Orleans - The State of Transit in New Orleans: Ten Years After Katrina
Part I. ProgressIn 2014, NORTA committed $5 million to annual service improvements, restoring bus routes that were cut following Katrina and adding frequency throughout the system. These improvements have benefitted neighborhoods across the city. What’s more, the NORTA Board has steered the agency to stability, successfully negotiating for cost savings, service improvements and more authority over senior level hires in their new contract with operator and manager TransDev (formerly, Veolia Transportation). Moreover, the agency’s financial forecasts have improved dramatically thanks to rapidly rising sales tax revenues. At the same time, the City of New Orleans’ leaders have created a favorable policy climate that values integrated land use, workforce and transportation policies, opening the door for NORTA and the City to advance holistic improvements to our public transit service and infrastructure.
Part II. A Long Way to GoDespite recent service increases, New Orleans still has significantly less transit service available ten years after Katrina. Before Katrina, NORTA buses and streetcars made more than 17,000 trips each week. By 2015, that number had fallen to just 7,813. This represents a 55% decline in available transit service.
NORTA’s lagging transit service recovery can be explained in large part by a significant decrease in operating funds available to the agency since Katrina. In 2004, NORTA reported operating funds of $143 million. By 2013, its budget had fallen to just $88 million - nearly $55 million less.
Streetcar infrastructure has dominated NORTA’s capital investments, with an extensive expansion in streetcar service currently underway. With the addition of the Loyola-Union Passenger Terminal (Loyola-UPT) streetcar line in January 2013, NORTA now offers more (103%) weekly streetcar trips than it did in 2005. However, even with recent service additions, only 35% of weekly bus trips have been restored, leaving New Orleanians with less frequent service in the many neighborhoods not served by streetcar routes. Yet, TransDev leaders have called for nearly $1 billion in additional capital funding to continue laying new tracks without studying the potential for investment in other high-quality transit modes that would serve more people.
Part III. A Way ForwardAfter Katrina, there was no roadmap to transit recovery and the NORTA Board deserves credit for their commitment to serving our community. But the recovery has been uneven, because it has been the result of a series of ad-hoc decisions. NORTA is beyond simply recovering from post-Katrina devastation. Yet, the agency still lacks an integrated vision, guided by community priorities. It is missing a framework with which to evaluate and weigh investment outcomes among competing interests for limited resources.
NORTA should act immediately to develop a truly comprehensive transit master plan, together with their many stakeholders. With the City preparing to embark on an update of the Master Plan, NORTA and City leaders must work collaboratively to ensure that transit service seamlessly supports anticipated developments and growth while connecting people to economic opportunity throughout New Orleans and the surrounding region.
5WO R L D C L AS S T R A N S I T F O R N E W O R L E A N S
Ride New Orleans - The State of Transit in New Orleans: Ten Years After Katrina
Here are five key reasons we must act now:• New Orleans residents depend on high quality transit to access opportunity. • Progressive businesses are calling for better workforce transit connections. • Defining a collective vision for our transit future makes us more competitive for federal grants
and local fundraising.• The New Orleans city and region changed dramatically following Katrina, but the transit system
has not kept pace.• Regional workforce opportunities can address long-standing poverty but only with better transit
connections.
In addition to conducting a system-wide planning process, NORTA should also seize on immediate opportunities to improve transit service using new technology, design, and operating approaches to weed out inefficiencies. Improvements range from speeding up the boarding process through new fare technologies to giving transit vehicles traffic signal priority. These are standard practices throughout the country, and these improvements can result in faster, more reliable transit service for riders and cost savings for NORTA.
Finally, NORTA must embrace the “regional” in their name and work to overcome political hurdles that prevent truly regional transit service needed to support the Greater New Orleans economy. NORTA must develop partnerships with neighboring transit systems to coordinate a regional fare structure, and provide regional, rapid-transit routes.
Methodology In this report, we rely on data self-reported by NORTA to the National Transit Database in addition to data obtained directly from the NORTA on the availability of transit service. We also dive into the current state of financial affairs at the NORTA; our financial analysis is based on annual NORTA budget documentation that RIDE New Orleans received through Freedom of Information Act requests. More detailed information on data, methodology, and selection of comparable transit agencies can be found in the Appendix.
NORTA should act immediately to develop a truly comprehensive, transit master plan,
together with their many stakeholders
6WO R L D C L AS S T R A N S I T F O R N E W O R L E A N S
Ride New Orleans - The State of Transit in New Orleans: Ten Years After Katrina
Part I: Progress
In July 2014, RIDE New Orleans released our inaugural “The State of Transit in New Orleans” report, highlighting New Orleans transit recovery through 2012. Relying on a number of data indicators, we revealed that our city had recovered just 36% of our pre-Katrina transit service, though our population had rebounded to 86% of pre-Katrina levels over that same time period. We also found that the greatest declines in available transit service had occurred disproportionately in low-income neighborhoods, communities of color, and areas where fewer households had access to personal vehicles. Finally, we found that NORTA’s costs were significantly higher than peer transit agencies and that the agency was on an unsustainable spending path that could further jeopardize our continued transit recovery.
Our updated report finds that NORTA has made significant progress adding transit service, controlling costs and strengthening the agency’s financial and management oversight positions. These efforts have resulted in more transit service available throughout the city and an empowered NORTA Board better positioned to lead the agency into the future. Simultaneously, leaders with the City of New Orleans have advanced initiatives and land use strategies that create a favorable policy climate to advance holistic improvements to our public transit service and infrastructure.
NORTA has made significant progress adding transit service, controlling costs and
strengthening the agency’s financial and management oversight positions.
7WO R L D C L AS S T R A N S I T F O R N E W O R L E A N S
Ride New Orleans - The State of Transit in New Orleans: Ten Years After Katrina
1. More Service for More People
Since we last reported, NORTA began operations on the newly constructed Loyola-UPT streetcar line. In September 2014, NORTA increased its operating expenses by $5 million annually to expand bus service to: (1) restore two pre-Katrina bus routes serving Gentilly and the West Bank, (2) extend existing routes to provide service to the Treme and the Desire-Upper 9th Ward neighborhoods, and (3) add frequency to existing bus routes across the city.
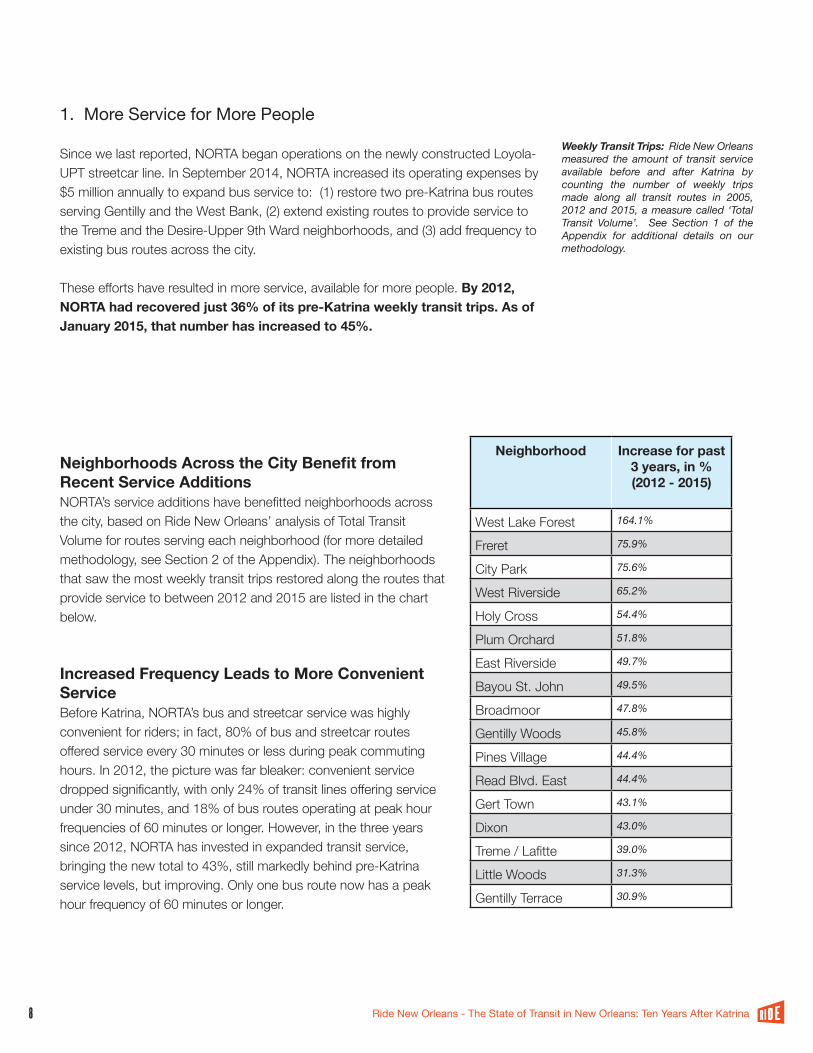
These efforts have resulted in more service, available for more people. By 2012, NORTA had recovered just 36% of its pre-Katrina weekly transit trips. As of January 2015, that number has increased to 45%.
Weekly Transit Trips: RideNewOrleansmeasured the amountof transit serviceavailable before and after Katrina bycounting the number of weekly tripsmade along all transit routes in 2005,2012and2015,ameasurecalled ‘TotalTransit Volume’. See Section 1 of theAppendix for additional details on ourmethodology.
Neighborhood Increase for past 3 years, in % (2012 - 2015)
West Lake Forest 164.1%
Freret 75.9%
City Park 75.6%
West Riverside 65.2%
Holy Cross 54.4%
Plum Orchard 51.8%
East Riverside 49.7%
Bayou St. John 49.5%
Broadmoor 47.8%
Gentilly Woods 45.8%
Pines Village 44.4%
Read Blvd. East 44.4%
Gert Town 43.1%
Dixon 43.0%
Treme / Lafitte 39.0%
Little Woods 31.3%
Gentilly Terrace 30.9%
Neighborhoods Across the City Benefit from Recent Service AdditionsNORTA’s service additions have benefitted neighborhoods across the city, based on Ride New Orleans’ analysis of Total Transit Volume for routes serving each neighborhood (for more detailed methodology, see Section 2 of the Appendix). The neighborhoods that saw the most weekly transit trips restored along the routes that provide service to between 2012 and 2015 are listed in the chart below.
Increased Frequency Leads to More Convenient ServiceBefore Katrina, NORTA’s bus and streetcar service was highly convenient for riders; in fact, 80% of bus and streetcar routes offered service every 30 minutes or less during peak commuting hours. In 2012, the picture was far bleaker: convenient service dropped significantly, with only 24% of transit lines offering service under 30 minutes, and 18% of bus routes operating at peak hour frequencies of 60 minutes or longer. However, in the three years since 2012, NORTA has invested in expanded transit service, bringing the new total to 43%, still markedly behind pre-Katrina service levels, but improving. Only one bus route now has a peak hour frequency of 60 minutes or longer.
8WO R L D C L AS S T R A N S I T F O R N E W O R L E A N S
Ride New Orleans - The State of Transit in New Orleans: Ten Years After Katrina
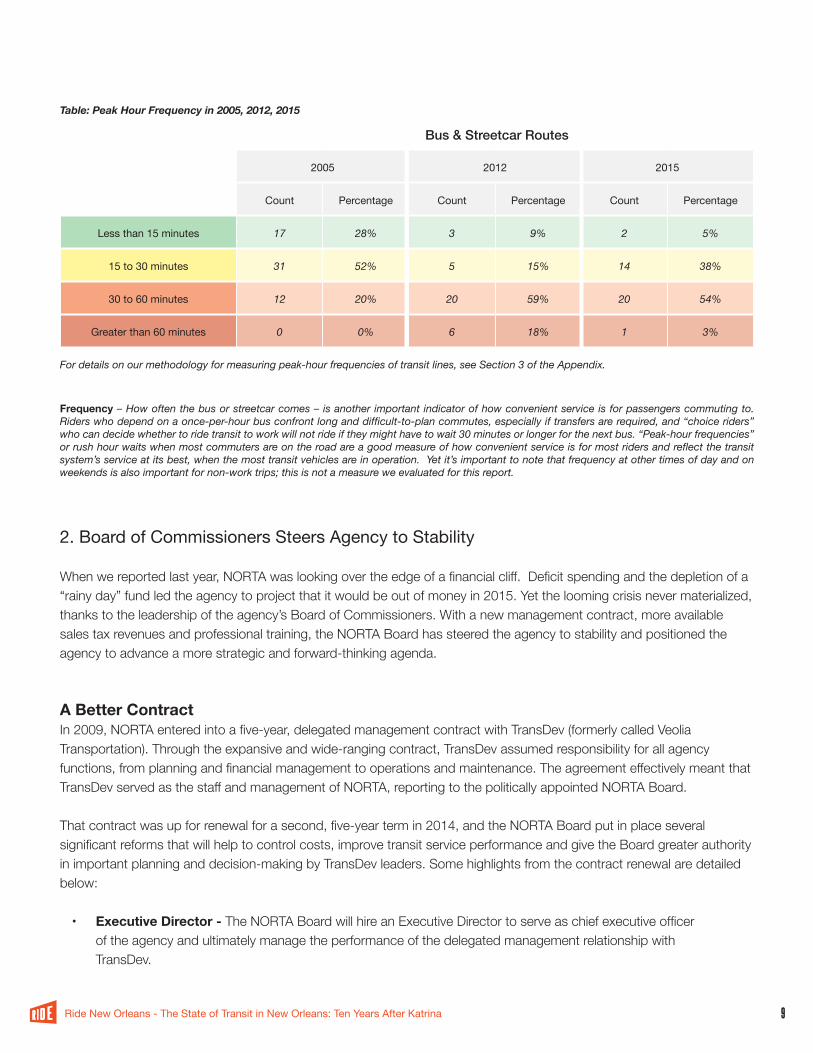
Bus & Streetcar Routes
2005 2012 2015
Count Percentage Count Percentage Count Percentage
Less than 15 minutes 17 28% 3 9% 2 5%
15 to 30 minutes 31 52% 5 15% 14 38%
30 to 60 minutes 12 20% 20 59% 20 54%
Greater than 60 minutes 0 0% 6 18% 1 3%
Table: Peak Hour Frequency in 2005, 2012, 2015
Fordetailsonourmethodologyformeasuringpeak-hourfrequenciesoftransitlines,seeSection3oftheAppendix.
2. Board of Commissioners Steers Agency to Stability
When we reported last year, NORTA was looking over the edge of a financial cliff. Deficit spending and the depletion of a “rainy day” fund led the agency to project that it would be out of money in 2015. Yet the looming crisis never materialized, thanks to the leadership of the agency’s Board of Commissioners. With a new management contract, more available sales tax revenues and professional training, the NORTA Board has steered the agency to stability and positioned the agency to advance a more strategic and forward-thinking agenda.
A Better Contract In 2009, NORTA entered into a five-year, delegated management contract with TransDev (formerly called Veolia Transportation). Through the expansive and wide-ranging contract, TransDev assumed responsibility for all agency functions, from planning and financial management to operations and maintenance. The agreement effectively meant that TransDev served as the staff and management of NORTA, reporting to the politically appointed NORTA Board.
That contract was up for renewal for a second, five-year term in 2014, and the NORTA Board put in place several significant reforms that will help to control costs, improve transit service performance and give the Board greater authority in important planning and decision-making by TransDev leaders. Some highlights from the contract renewal are detailed below:
• Executive Director - The NORTA Board will hire an Executive Director to serve as chief executive officer of the agency and ultimately manage the performance of the delegated management relationship with TransDev.
Frequency–Howoftenthebusorstreetcarcomes–isanotherimportantindicatorofhowconvenientserviceisforpassengerscommutingto.Riderswhodependonaonce-per-hourbusconfrontlonganddifficult-to-plancommutes,especiallyiftransfersarerequired,and“choiceriders”whocandecidewhethertoridetransittoworkwillnotrideiftheymighthavetowait30minutesorlongerforthenextbus.“Peak-hourfrequencies”orrushhourwaitswhenmostcommutersareontheroadareagoodmeasureofhowconvenientserviceisformostridersandreflectthetransitsystem’sserviceatitsbest,whenthemosttransitvehiclesareinoperation.Yetit’simportanttonotethatfrequencyatothertimesofdayandonweekendsisalsoimportantfornon-worktrips;thisisnotameasureweevaluatedforthisreport.
9WO R L D C L AS S T R A N S I T F O R N E W O R L E A N S
Ride New Orleans - The State of Transit in New Orleans: Ten Years After Katrina
• Senior Managers - The NORTA Board has reserved the authority to approve TransDev’s hiring of all senior manager positions. They also now have the ability to direct TransDev to terminate persons holding senior management positions that do not meet the Board’s expectations.
• Annual Contribution - TransDev has agreed to contribute $375,000 to NORTA’s budget annually.• Capping Revenues - Any costs that Transdev incurs that aren’t related to operating the public transit
system cannot exceed 5 percent of its revenues. • Performance Incentives and Disincentives - TransDev must meet baseline performance standards.
If TransDev exceeds the baseline by a set amount, a bonus payment is granted on a quarterly basis. If TransDev falls below the baseline by a set amount, a quarterly damage payment is assessed. These incentives range from on-time performance, fleet maintenance, system usage (ridership), preventable accidents and customer service.
• Capital Planning - TransDev must submit one-year, five-year and 20-year capital improvement plans once every annual budget cycle.
A Stronger Financial OutlookWhen NORTA put together their five-year financial projections in 2012, the agency was looking over the edge of a financial cliff. NORTA was already deficit-spending and projecting that their deficit would grow to $20 million annually by 2016, and was covering their annual expenses by spending down an “unrestricted reserves” fund. By 2015, NORTA was projecting that the fund would be fully expended, leaving the agency unable to cover their operating expenses.
In a significant turn of events, the booming success of retail growth in New Orleans has led to the 1-cent sales tax dedicated to public transportation yielding unexpected revenues for NORTA. In NORTA’s most recent five-year financial projection (2015 – 2019), the agency still anticipates deficit spending in the coming years, peaking in 2016 at just under $9 million. These annual deficits will continue to deplete the unrestricted reserves fund; by 2019, NORTA forecasts just $3 million remaining in the reserves fund, revealing that despite an improved outlook, the agency must continue to contain costs and explore new revenue options to ensure long-term financial sustainability.
Annual Training BeginsDuring the 2014 Louisiana legislative session, Speaker Pro Tempore and Representative for New Orleans District 91, Walt Leger, III, carried through legislation (Act No. 676) requiring all regional transit agency board members throughout Louisiana to receive six hours of professional development and training opportunities to ensure all board members have a thorough understanding of the agency’s policies, legal and fiscal responsibilities, federal compliance regulations and stay current with innovative practices. Eligible training topics include: transit planning, financing, operations and design best practices, parliamentary procedure, public hearing procedure, cultural sensitivity, ethics, workforce and labor issues, public engagement, transit agency governance, and Americans with Disabilities Act requirements.
In July 2014, the NORTA Board underwent their first training workshop, working with transit leaders from Charlotte, NC and Rochester, NY to explore national best practices and success stories in effective and efficient transit management, and exploring frameworks for making decisions in transit agency operations.
10WO R L D C L AS S T R A N S I T F O R N E W O R L E A N S
Ride New Orleans - The State of Transit in New Orleans: Ten Years After Katrina
Empowered Community VoicesThe NORTA Board adopted a transformative community engagement policy in January 2014, paving the way for the creation of a Transit Riders’ Advisory Committee to weigh in on agency policy, planning and investment decision-making. In July 2015, the NORTA Board convened the first meeting of the Transit Riders’ Advisory Committee, who identified the desire to receive training on how transit is funded, managed and operated and to develop guidance on everything from real-time GPS transit tracking to coordinated transit service with area schools and after-school programming. The NORTA Board’s commitment to community engagement will ensure that the agency can be more responsive to community identified needs and priorities.
3. Public transit lies at the heart of new City policy initiatives
The City of New Orleans (City) and key agency partners have developed a series of major policy initiatives, all of which highlight the potential for improved transit connectivity throughout the city and region to achieve a more equitable, inclusive and resilient New Orleans.
Through the Livable Claiborne Communities study, the City engaged diverse communities to evaluate the potential for interdependent land use and transportation strategies to connect people to opportunity and create a vibrant and healthy communities in the heart the New Orleans. Out of this effort, the Network for Economic Opportunity was born, to implement key policy recommendations including creating better access to jobs and opportunities through enhanced transportation choices.
With the 2010 adoption of “The Plan for the 21st Century” more commonly referred to as the Master Plan, came the passage of a future land use map a robust transportation chapter that calls for fast and efficient mass transit supported by transit-oriented development. With the subsequent adoption of a new Comprehensive Zoning Ordinance in 2015, the City’s new land use strategy is now being implemented, creating a development road map for future public transit expansion to support New Orleans’ growth.
As the the 10th anniversary of Katrina approaches, the City and the New Orleans Redevelopment Authority are preparing the ‘Resilience Strategy’ that envisions a modern, efficient, and predictable regional transit system that connects people to opportunities and fulfilling, prosperous, and healthy lives.
It is clear that City leadership recognizes the value of integrated land use, workforce and transportation policies, and this favorable policy climate creates new opportunities for advancing holistic improvements to our public transit service and infrastructure.
Leaders with the City of New Orleans have advanced initiatives and land use strategies that
create a favorable policy climate to advance holistic improvements to our public transit
service and infrastructure.11
WO R L D C L AS S T R A N S I T F O R N E W O R L E A N S
Ride New Orleans - The State of Transit in New Orleans: Ten Years After Katrina
Part II: A Long Way to Go
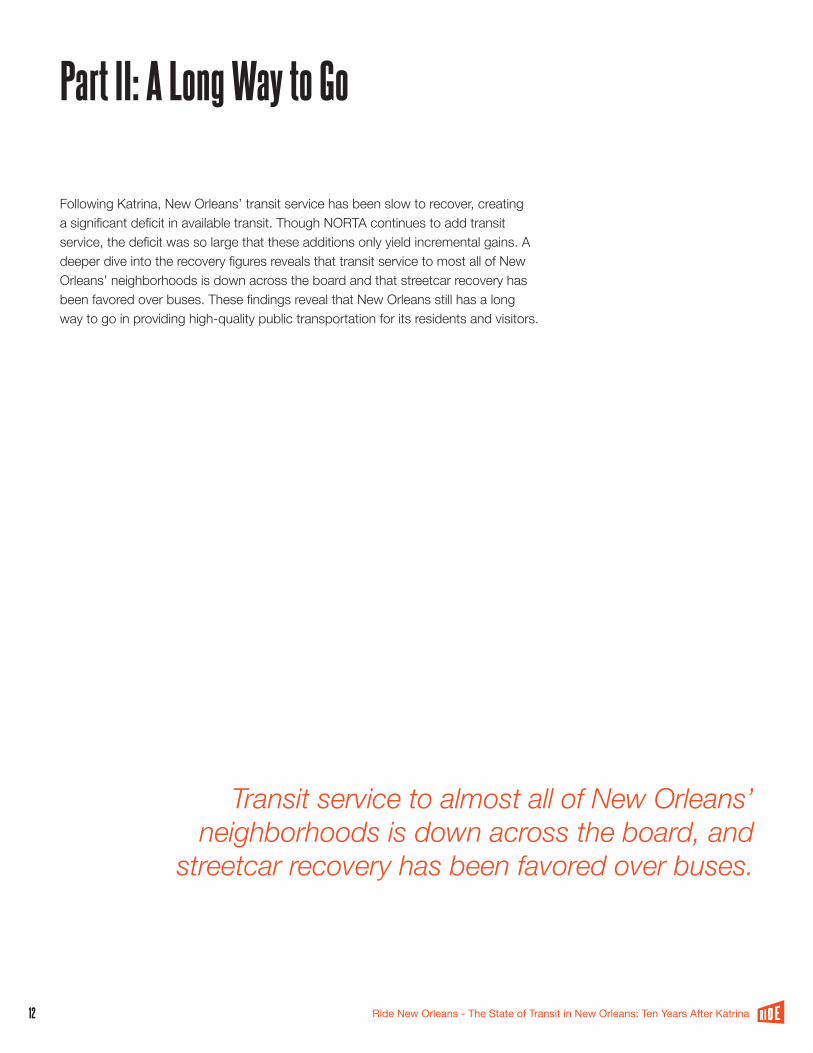
Following Katrina, New Orleans’ transit service has been slow to recover, creating a significant deficit in available transit. Though NORTA continues to add transit service, the deficit was so large that these additions only yield incremental gains. A deeper dive into the recovery figures reveals that transit service to most all of New Orleans’ neighborhoods is down across the board and that streetcar recovery has been favored over buses. These findings reveal that New Orleans still has a long way to go in providing high-quality public transportation for its residents and visitors.
Transit service to almost all of New Orleans’ neighborhoods is down across the board, and
streetcar recovery has been favored over buses.
12WO R L D C L AS S T R A N S I T F O R N E W O R L E A N S
Ride New Orleans - The State of Transit in New Orleans: Ten Years After Katrina
Viavant/Venetian Isles
Village de l'est
Little Woods
Desire
Old Aurora
New Aurora/English Turn
City Park
Audubon
Read Blvd East
Mid-City
Lakeview
Behrman
Bywater
Filmore
St. Roch
Dillard
Tall Timbers/Brechtel
Central City
Lake Terrace & Oaks
Leonidas
Pines Village
St. Claude
Milan
Lower Ninth Ward
West Riverside
Holy Cross
Uptown
Navarre
Lakeshore/Lake Vista
Milneburg
Fairgrounds
Plum Orchard
Touro
Read Blvd West
West End
Lakewood
Seventh Ward
Whitney
Gentilly Terrace
West Lake Forest
Gert Town
Irish Channel
Hollygrove
St. Anthony
Pontchartrain Park
Treme'/Lafitte
Lower Garden District
Broadmoor
Gentilly Woods
Central Business District
Tulane/Gravier
U.S. Naval Support Area
French Quarter
McDonogh
Black Pearl
Dixon
Marigny
Algiers Point
Freret
Bayou St. John
Marlyville/Fontainebleau
Florida Area
East Carrollton
B.W. Cooper
St. Bernard Area
East Riverside
Fischer Dev
Garden DistrictSt. Thomas Development
Iberville
Florida Dev
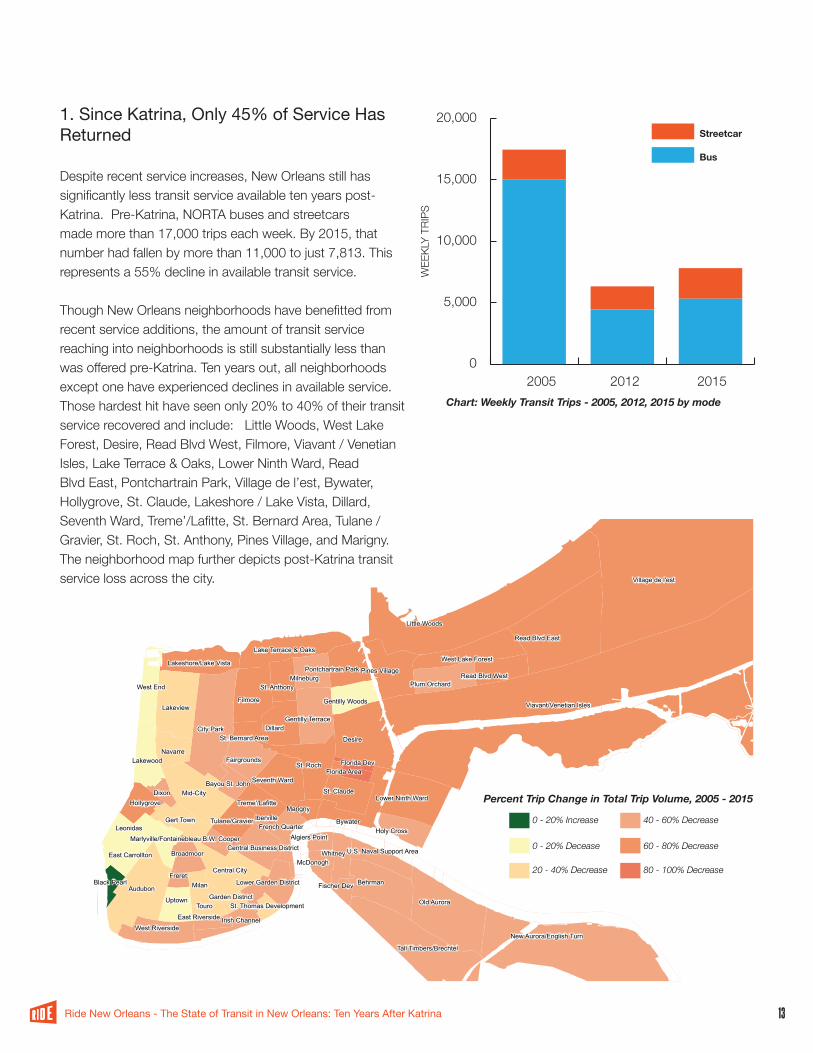
Chart: Weekly Transit Trips - 2005, 2012, 2015 by mode
1. Since Katrina, Only 45% of Service Has Returned
Despite recent service increases, New Orleans still has significantly less transit service available ten years post-Katrina. Pre-Katrina, NORTA buses and streetcars made more than 17,000 trips each week. By 2015, that number had fallen by more than 11,000 to just 7,813. This represents a 55% decline in available transit service.
Though New Orleans neighborhoods have benefitted from recent service additions, the amount of transit service reaching into neighborhoods is still substantially less than was offered pre-Katrina. Ten years out, all neighborhoods except one have experienced declines in available service. Those hardest hit have seen only 20% to 40% of their transit service recovered and include: Little Woods, West Lake Forest, Desire, Read Blvd West, Filmore, Viavant / Venetian Isles, Lake Terrace & Oaks, Lower Ninth Ward, Read Blvd East, Pontchartrain Park, Village de l’est, Bywater, Hollygrove, St. Claude, Lakeshore / Lake Vista, Dillard, Seventh Ward, Treme’/Lafitte, St. Bernard Area, Tulane / Gravier, St. Roch, St. Anthony, Pines Village, and Marigny. The neighborhood map further depicts post-Katrina transit service loss across the city.
WEE
KLY
TRIP
S
0
5,000
10,000
15,000
20,000
2005 2012 2015
Streetcar
Bus
0
5,000
10,000
15,000
20,000
2005 2012 2015
Streetcar
Bus
0 - 20% Increase
0 - 20% Decease
20 - 40% Decrease
40 - 60% Decrease
60 - 80% Decrease
80 - 100% Decrease
Percent Trip Change in Total Trip Volume, 2005 - 2015
13WO R L D C L AS S T R A N S I T F O R N E W O R L E A N S
Ride New Orleans - The State of Transit in New Orleans: Ten Years After Katrina
2005
2015
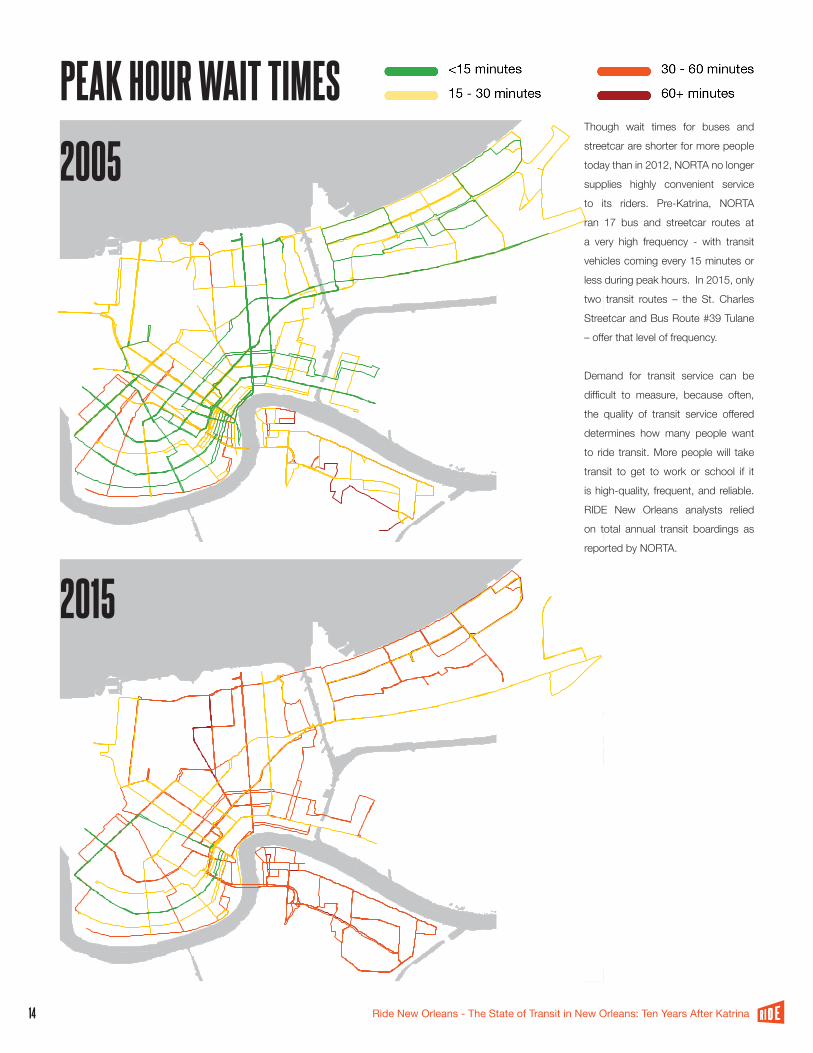
PEAK HOUR WAIT TIMES
14WO R L D C L AS S T R A N S I T F O R N E W O R L E A N S
Ride New Orleans - The State of Transit in New Orleans: Ten Years After Katrina
Though wait times for buses and
streetcar are shorter for more people
today than in 2012, NORTA no longer
supplies highly convenient service
to its riders. Pre-Katrina, NORTA
ran 17 bus and streetcar routes at
a very high frequency - with transit
vehicles coming every 15 minutes or
less during peak hours. In 2015, only
two transit routes – the St. Charles
Streetcar and Bus Route #39 Tulane
– offer that level of frequency.
Demand for transit service can be
difficult to measure, because often,
the quality of transit service offered
determines how many people want
to ride transit. More people will take
transit to get to work or school if it
is high-quality, frequent, and reliable.
RIDE New Orleans analysts relied
on total annual transit boardings as
reported by NORTA.
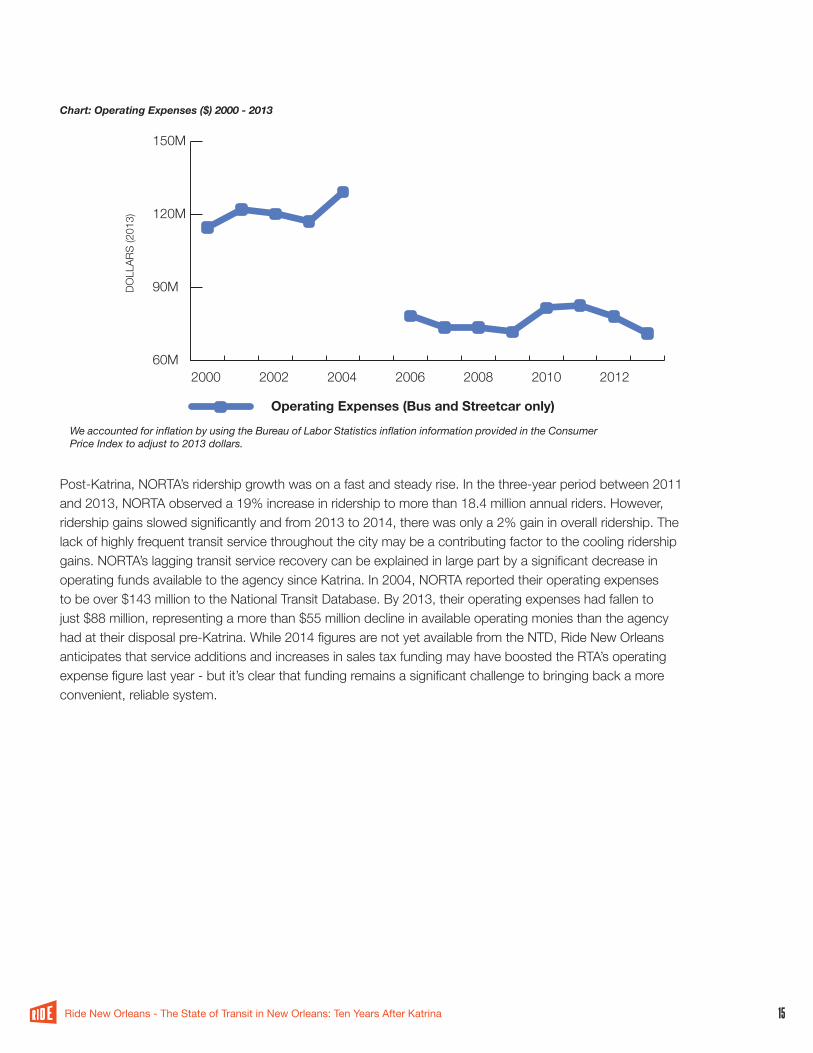
WeaccountedforinflationbyusingtheBureauofLaborStatisticsinflationinformationprovidedintheConsumerPriceIndextoadjustto2013dollars.
60M2000 2002 2004 2006 2008 2010 2012
90M
120M
150M
Operating Expenses (Bus and Streetcar only)
Chart: Operating Expenses ($) 2000 - 2013
Post-Katrina, NORTA’s ridership growth was on a fast and steady rise. In the three-year period between 2011 and 2013, NORTA observed a 19% increase in ridership to more than 18.4 million annual riders. However, ridership gains slowed significantly and from 2013 to 2014, there was only a 2% gain in overall ridership. The lack of highly frequent transit service throughout the city may be a contributing factor to the cooling ridership gains. NORTA’s lagging transit service recovery can be explained in large part by a significant decrease in operating funds available to the agency since Katrina. In 2004, NORTA reported their operating expenses to be over $143 million to the National Transit Database. By 2013, their operating expenses had fallen to just $88 million, representing a more than $55 million decline in available operating monies than the agency had at their disposal pre-Katrina. While 2014 figures are not yet available from the NTD, Ride New Orleans anticipates that service additions and increases in sales tax funding may have boosted the RTA’s operating expense figure last year - but it’s clear that funding remains a significant challenge to bringing back a more convenient, reliable system.
DOLL
ARS
(201
3)
15WO R L D C L AS S T R A N S I T F O R N E W O R L E A N S
Ride New Orleans - The State of Transit in New Orleans: Ten Years After Katrina
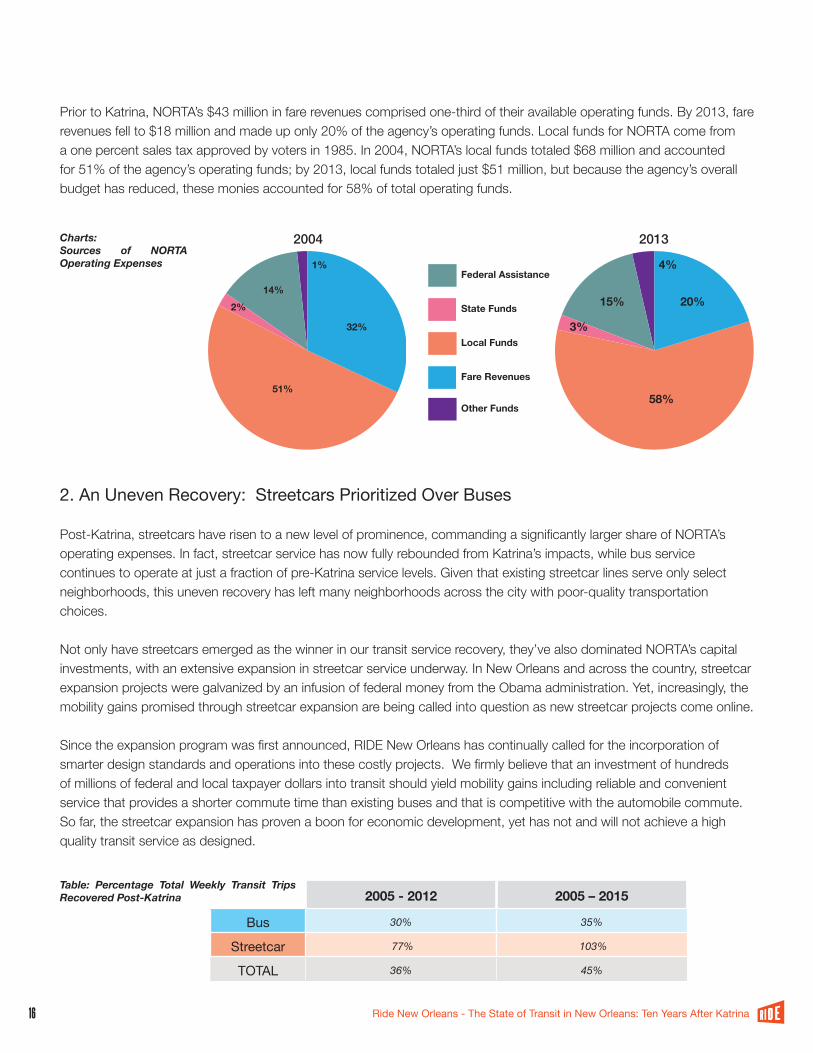
2. An Uneven Recovery: Streetcars Prioritized Over Buses
Post-Katrina, streetcars have risen to a new level of prominence, commanding a significantly larger share of NORTA’s operating expenses. In fact, streetcar service has now fully rebounded from Katrina’s impacts, while bus service continues to operate at just a fraction of pre-Katrina service levels. Given that existing streetcar lines serve only select neighborhoods, this uneven recovery has left many neighborhoods across the city with poor-quality transportation choices.
Not only have streetcars emerged as the winner in our transit service recovery, they’ve also dominated NORTA’s capital investments, with an extensive expansion in streetcar service underway. In New Orleans and across the country, streetcar expansion projects were galvanized by an infusion of federal money from the Obama administration. Yet, increasingly, the mobility gains promised through streetcar expansion are being called into question as new streetcar projects come online.
Since the expansion program was first announced, RIDE New Orleans has continually called for the incorporation of smarter design standards and operations into these costly projects. We firmly believe that an investment of hundreds of millions of federal and local taxpayer dollars into transit should yield mobility gains including reliable and convenient service that provides a shorter commute time than existing buses and that is competitive with the automobile commute. So far, the streetcar expansion has proven a boon for economic development, yet has not and will not achieve a high quality transit service as designed.
2005 - 2012 2005 – 2015
Bus 30% 35%
Streetcar 77% 103%
TOTAL 36% 45%
Table: Percentage Total Weekly Transit Trips Recovered Post-Katrina
20132004
Other Funds
Federal Assistance
State Funds
Local Funds
Fare Revenues
32%
51%
2%14%
1%
Other Funds
Federal Assistance
State Funds
Local Funds
Fare Revenues
20%
58%
3%
15%
4%
Prior to Katrina, NORTA’s $43 million in fare revenues comprised one-third of their available operating funds. By 2013, fare revenues fell to $18 million and made up only 20% of the agency’s operating funds. Local funds for NORTA come from a one percent sales tax approved by voters in 1985. In 2004, NORTA’s local funds totaled $68 million and accounted for 51% of the agency’s operating funds; by 2013, local funds totaled just $51 million, but because the agency’s overall budget has reduced, these monies accounted for 58% of total operating funds.
Charts: Sources of NORTA Operating Expenses
16WO R L D C L AS S T R A N S I T F O R N E W O R L E A N S
Ride New Orleans - The State of Transit in New Orleans: Ten Years After Katrina
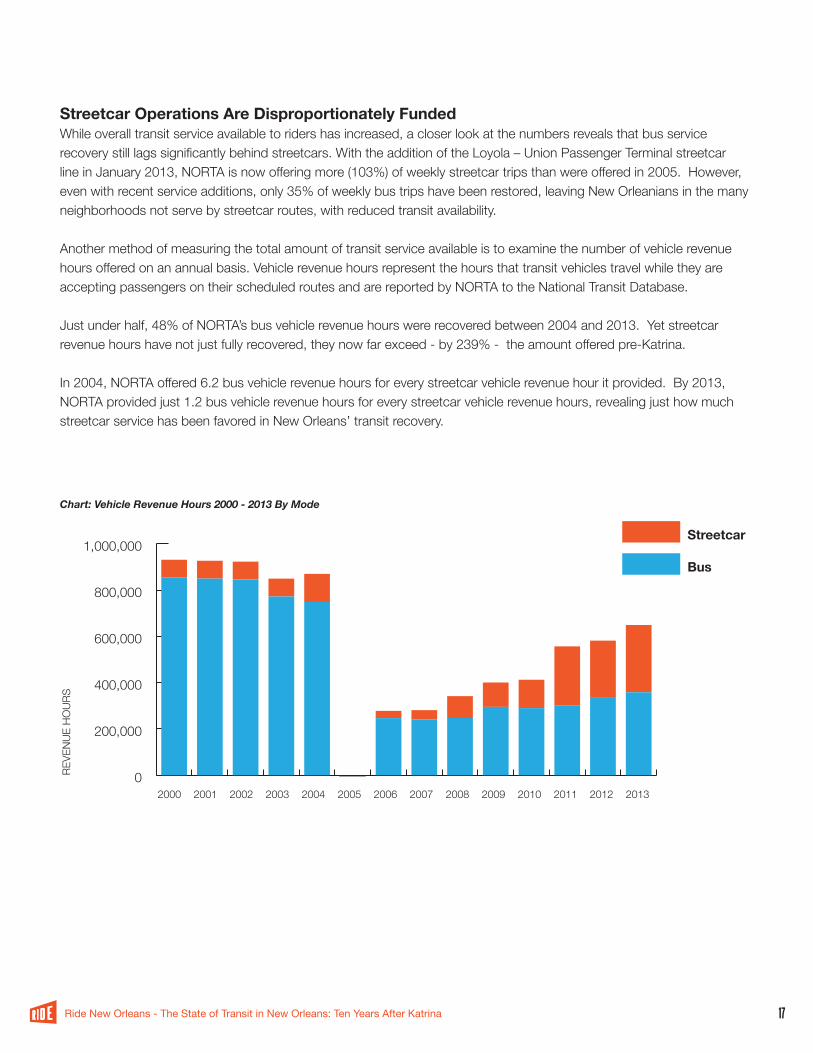
Streetcar Operations Are Disproportionately FundedWhile overall transit service available to riders has increased, a closer look at the numbers reveals that bus service recovery still lags significantly behind streetcars. With the addition of the Loyola – Union Passenger Terminal streetcar line in January 2013, NORTA is now offering more (103%) of weekly streetcar trips than were offered in 2005. However, even with recent service additions, only 35% of weekly bus trips have been restored, leaving New Orleanians in the many neighborhoods not serve by streetcar routes, with reduced transit availability.
Another method of measuring the total amount of transit service available is to examine the number of vehicle revenue hours offered on an annual basis. Vehicle revenue hours represent the hours that transit vehicles travel while they are accepting passengers on their scheduled routes and are reported by NORTA to the National Transit Database.
Just under half, 48% of NORTA’s bus vehicle revenue hours were recovered between 2004 and 2013. Yet streetcar revenue hours have not just fully recovered, they now far exceed - by 239% - the amount offered pre-Katrina.
In 2004, NORTA offered 6.2 bus vehicle revenue hours for every streetcar vehicle revenue hour it provided. By 2013, NORTA provided just 1.2 bus vehicle revenue hours for every streetcar vehicle revenue hours, revealing just how much streetcar service has been favored in New Orleans’ transit recovery.
0
200,000
400,000
600,000
800,000
1,000,000Streetcar
Bus
2005 2008 2010 2011 2012 20132000 20022001 2003 2004 2006 2007 2009
Chart: Vehicle Revenue Hours 2000 - 2013 By Mode
REVE
NUE
HOUR
S
17WO R L D C L AS S T R A N S I T F O R N E W O R L E A N S
Ride New Orleans - The State of Transit in New Orleans: Ten Years After Katrina
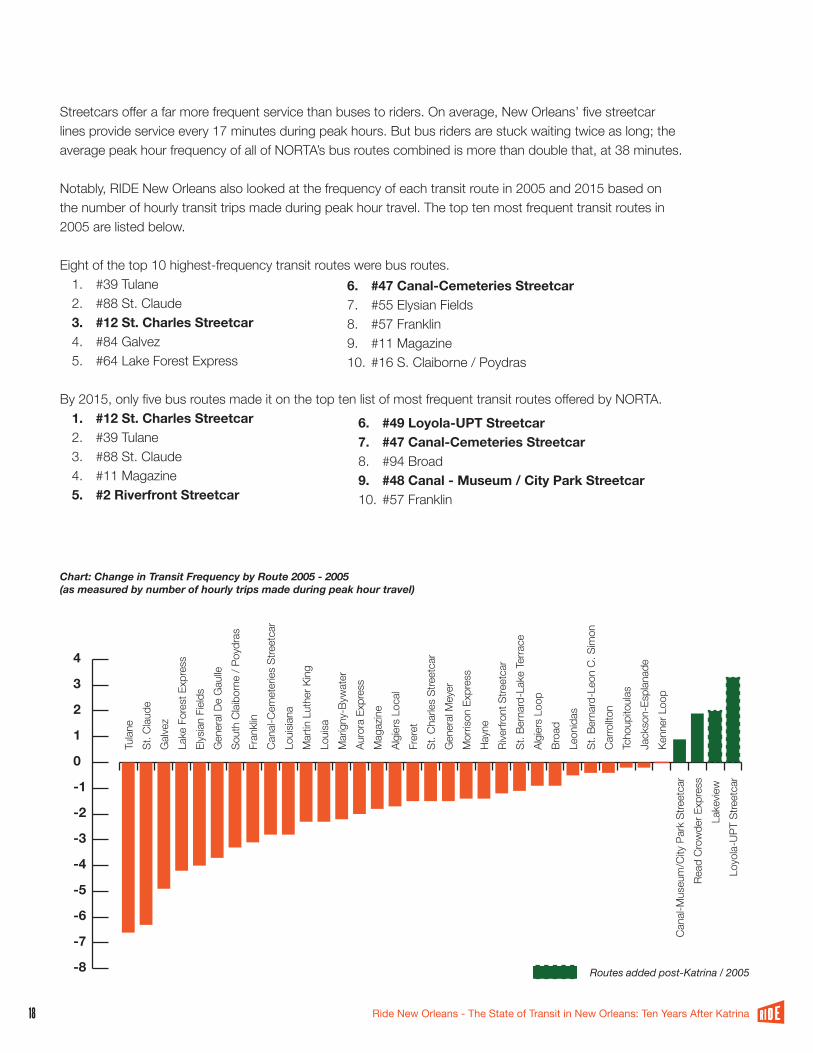
Streetcars offer a far more frequent service than buses to riders. On average, New Orleans’ five streetcar lines provide service every 17 minutes during peak hours. But bus riders are stuck waiting twice as long; the average peak hour frequency of all of NORTA’s bus routes combined is more than double that, at 38 minutes.
Notably, RIDE New Orleans also looked at the frequency of each transit route in 2005 and 2015 based on the number of hourly transit trips made during peak hour travel. The top ten most frequent transit routes in 2005 are listed below.
Eight of the top 10 highest-frequency transit routes were bus routes.1. #39 Tulane2. #88 St. Claude3. #12 St. Charles Streetcar4. #84 Galvez5. #64 Lake Forest Express
By 2015, only five bus routes made it on the top ten list of most frequent transit routes offered by NORTA.1. #12 St. Charles Streetcar2. #39 Tulane3. #88 St. Claude4. #11 Magazine 5. #2 Riverfront Streetcar
-8
-7
-6
-5
-4
-3
-2
-1
0
1
2
3
4
Loyo
la-UP
T St
reet
car
Lake
view
Re
ad C
row
der E
xpre
ssCa
nal-M
useu
m/C
ity P
ark
Stre
etca
rKe
nner
Loo
pJa
ckso
n-Es
plan
ade
Tcho
upito
ulas
Carro
llton
St. B
erna
rd-L
eon
C. S
imon
Leon
idas
Broa
dAl
gier
s Lo
opSt
. Ber
nard
-Lak
e Te
rrace
Rive
rfron
t Stre
etca
rHa
yne
Mor
rison
Exp
ress
Gen
eral
Mey
erSt
. Cha
rles
Stre
etca
rFr
eret
Algi
ers
Loca
lM
agaz
ine
Auro
ra E
xpre
ssM
arig
ny-B
ywat
erLo
uisa
Mar
tin L
uthe
r Kin
gLo
uisia
naCa
nal-C
emet
eries
Stre
etca
rFr
ankli
nSo
uth
Claib
orne
/ Po
ydra
sG
ener
al De
Gau
lleEl
ysian
Fiel
dsLa
ke F
ores
t Exp
ress
Galv
ezSt
. Clau
deTu
lane
-8 -7 -6 -5 -4 -3 -2 -1 0 1 2 3 4
Loyola-UPT StreetcarLakeview
Read Crowder ExpressCanal-Museum/City Park Streetcar
Kenner LoopJackson-EsplanadeTchoupitoulasCarrolltonSt. Bernard-Leon C. SimonLeonidasBroadAlgiers LoopSt. Bernard-Lake TerraceRiverfront StreetcarHayneMorrison ExpressGeneral MeyerSt. Charles StreetcarFreretAlgiers LocalMagazineAurora ExpressMarigny-BywaterLouisaMartin Luther KingLouisianaCanal-Cemeteries StreetcarFranklinSouth Claiborne / PoydrasGeneral De GaulleElysian FieldsLake Forest ExpressGalvezSt. ClaudeTulane
6. #49 Loyola-UPT Streetcar7. #47 Canal-Cemeteries Streetcar8. #94 Broad9. #48 Canal - Museum / City Park Streetcar10. #57 Franklin
6. #47 Canal-Cemeteries Streetcar7. #55 Elysian Fields8. #57 Franklin9. #11 Magazine10. #16 S. Claiborne / Poydras
Chart: Change in Transit Frequency by Route 2005 - 2005(as measured by number of hourly trips made during peak hour travel)
18WO R L D C L AS S T R A N S I T F O R N E W O R L E A N S
Ride New Orleans - The State of Transit in New Orleans: Ten Years After Katrina
Routesaddedpost-Katrina/2005
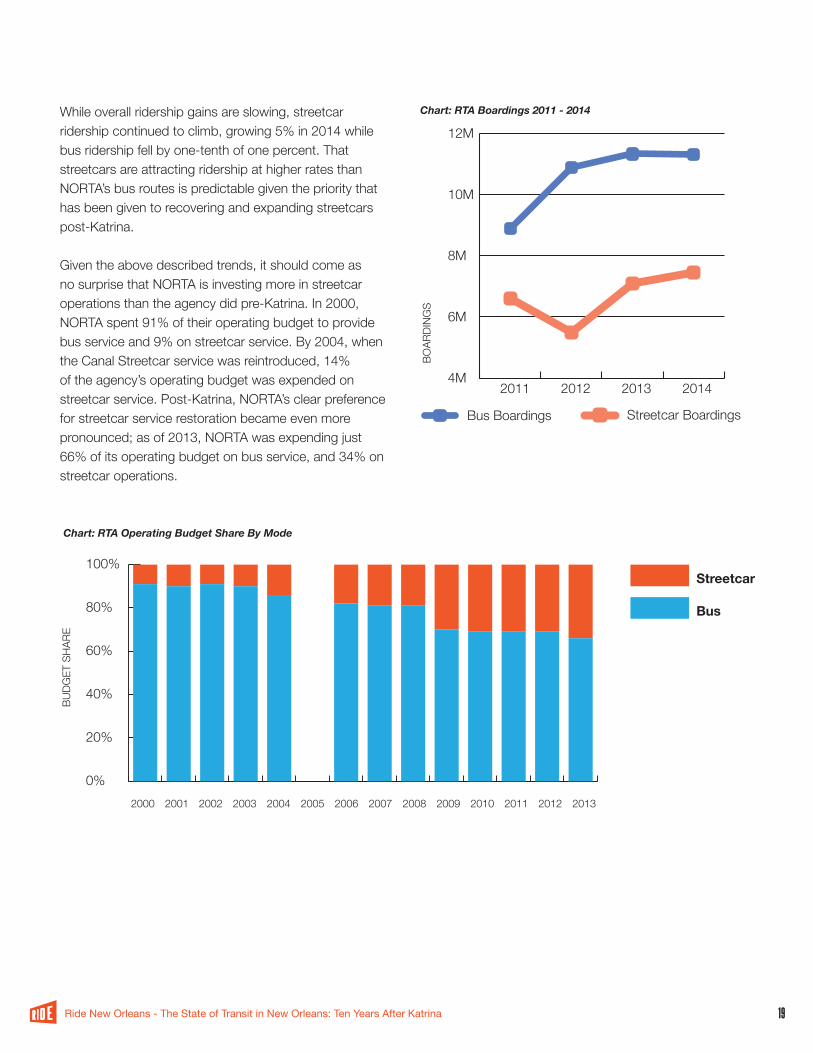
While overall ridership gains are slowing, streetcar ridership continued to climb, growing 5% in 2014 while bus ridership fell by one-tenth of one percent. That streetcars are attracting ridership at higher rates than NORTA’s bus routes is predictable given the priority that has been given to recovering and expanding streetcars post-Katrina.
Given the above described trends, it should come as no surprise that NORTA is investing more in streetcar operations than the agency did pre-Katrina. In 2000, NORTA spent 91% of their operating budget to provide bus service and 9% on streetcar service. By 2004, when the Canal Streetcar service was reintroduced, 14% of the agency’s operating budget was expended on streetcar service. Post-Katrina, NORTA’s clear preference for streetcar service restoration became even more pronounced; as of 2013, NORTA was expending just 66% of its operating budget on bus service, and 34% on streetcar operations.
4M2011 2012 2013 2014
6M
8M
10M
12M
Bus Boardings Streetcar Boardings
0%
20%
40%
60%
80%
100%Streetcar
Bus
2005 2008 2010 2011 2012 20132000 20022001 2003 2004 2006 2007 2009
Chart: RTA Boardings 2011 - 2014
Chart: RTA Operating Budget Share By Mode
BOAR
DING
S
BUDG
ET S
HARE
19WO R L D C L AS S T R A N S I T F O R N E W O R L E A N S
Ride New Orleans - The State of Transit in New Orleans: Ten Years After Katrina
Capital Budgets Favor Inefficient Service Early in New Orleans transit recovery, plans for an extensive streetcar expansion program took shape. Without a transit master plan in place, the decision by NORTA to aggressively pursue federal funding and to raise revenue through a local bond sale committed the agency to a streetcar vision for New Orleans. Because NORTA does not have a transit master plan, the streetcar expansion program began, without a comprehensive evaluation of the viability for other transit modes, such as bus rapid transit and light rail, to serve the city and region.
The first phase brought streetcar tracks along Loyola Avenue in the Central Business District between Union Passenger Terminal and Canal Street. The project cost $52 million of which the federal government granted NORTA a $45 million U.S. Department of Transportation TIGER (aka Transportation Investment Generating Economic Recovery) grant.
The second phase of expansion is underway and will bring streetcar tracks along N. Rampart Street and St. Claude Avenue. Funded by a $75 million local bond sale held by NORTA in 2010, the project is on track to be completed in 2016.
In 2014, TransDev unveiled an even more ambitious streetcar expansion plan that would come with an estimated total price tag just under $1 billion. Included in the plan are:
• Rampart / St. Claude - Press to Poland: estimated cost of project $62,010,000.00 • Rampart / St. Claude – Poland to the Refinery Rd.: estimated cost of project $226,643,000.00 • Elysian Fields – St. Claude to Riverfront Line: estimated cost of project $37,206,000.00 • Elysian Fields – St. Claude to UNO: estimated cost of project $266,643,000.00 • South Carrollton - Canal to Claiborne (3.6TM) estimated cost of project $120,000,000.00 • Loyola – Howard to Convention Center Blvd and Riverfront line(4.4TM) estimate of project 130,000,00.00 • Poydras – Claiborne to Loyola (1.8)TM estimated cost of project $62,010,000.00
Though this overall vision has not yet been formally endorsed by the NORTA Board, TransDev and the NORTA Board continue to make repeated requests for additional federal monies to continue with streetcar expansion along Howard Avenue, St. Claude Avenue to Press Street and the riverfront.
In January 2013, NORTA began service on the new Loyola-UPT streetcar line. In conjunction with beginning that service, NORTA made changes to three bus lines serving Uptown neighborhoods, combining the #28 Martin Luther King and #24 Napoleon bus routes into one, and terminating the newly expanded #28 Martin Luther King and #15 Freret buses at Union Passenger Terminal. Previously, these routes continued to run service all the way to Canal Street along Loyola Avenue. Now, to reach Canal Street, a major regional transit transfer point where more than 20 transit lines converge, riders on these bus routes found themselves having to transfer to the newly opened Loyola-UPT streetcar line. This change made for a far less convenient commute aboard multiple transit vehicles while requiring passengers to purchase a more expensive fare. Not surprisingly, ridership on the #15 Freret bus fell by 42% from 2012 to 2014.
Learning from this experience, TransDev has adjusted their approach for the second phase of the streetcar expansion. According to TransDev’s current operating plans, the #57 Franklin bus that currently serves the corridor will be re-routed to N. Claiborne and the #88 St. Claude bus will continue to serve the corridor, but will operate as an express bus with no stops where it overlaps with the new streetcar line. There has not been any mention of plans for the #91 Jackson-Esplanade bus.
20WO R L D C L AS S T R A N S I T F O R N E W O R L E A N S
Ride New Orleans - The State of Transit in New Orleans: Ten Years After Katrina
Part III: A Way Forward
After Katrina, the NORTA Board had to recover and replace the agency’s entire fleet of vehicles, rebuild its headquarters and navigate complicated negotiations with federal agencies, all while rapidly deploying remaining assets to areas where population was returning – a constantly changing variable. There was no roadmap to recovery and the NORTA Board deserves credit for their commitment to serving our community.
But the recovery has been uneven, because it has been the result of a series of ad-hoc decisions. NORTA is beyond simply recovering from post-Katrina devastation. Yet, NORTA’s planning efforts have been limited to a handful of capital and operations studies and plans. The agency still lacks an integrated vision, guided by community priorities. It is missing a framework with which to evaluate and weigh investment outcomes among competing interests for limited resources.
The “20-year plan” Transdev presented to the NORTA Board in July 2014 does not pass muster. The NORTA Board has neither formally adopted nor endorsed it, the public had zero opportunity to participate in its development and it therefore lacks community buy-in. It provides no framework for prioritizing projects, and finally, its’ financial forecasts are wildly unrealistic. For example, the “20-year plan”envisions that in 2022, NORTA will allocate $218 million of their general fund to capital projects. To put it this estimate in context, NORTA’s entire annual budget is typically less than $100 million.
Yet opportunities abound for the NORTA Board to envision a new transit future for the City and region. With key support in place across multiple City policy initiatives, the time has come for the NORTA Board to:
• Develop a community stakeholder-driven transit master plan;• Immediately improve operations to optimize transit service
performance; and • Make it easier to travel across parish boundary lines by collaborating
with neighboring transit providers.
21WO R L D C L AS S T R A N S I T F O R N E W O R L E A N S
Ride New Orleans - The State of Transit in New Orleans: Ten Years After Katrina
1. A Real Transit Master Plan
NORTA should act immediately to develop a truly comprehensive transit master plan. With the City preparing to embark on an update of the Master Plan, NORTA and City leaders must work collaboratively to ensure that transit service works seamlessly to support anticipated developments and growth and to connect people to economic opportunity throughout New Orleans and the surrounding region. Here are five key reasons we must act now:
1. New Orleans residents depend on high quality transit. According to the 2013 American Community Survey, 19% of New Orleans households do not have access to a household vehicle. This figure is more than twice the national rate of 9%. Simply put, high quality transit choices are vital to the success of New Orleans’ families.
2. Progressive businesses are calling for improved workforce transit connections. The workforce for New Orleans’ thriving hospitality and healthcare industries need better early morning late night transit options.
3. Defining a collective vision for transit future makes us more competitive for federal grants and local fundraising. In its evaluation of applicants for the competitive TIGER grant, the U.S. Department of Transportation rewards projects that “demonstrate strong collaboration among a broad range of stakeholders, and (are) the product of a robust, inclusive planning process”. Competition for these funds is growing nationally.
4. New Orleans and the surrounding region have changed dramatically after Katrina; the transit system is not keeping pace. Our city and region were undergoing a transformation long before the its flooding of our city. Yet the transit service that has been restored post-Katrina has largely followed the same routes that have been in place for several decades.
5. Regional workforce opportunities can address long-standing poverty but only with better transit connections. Though NORTA only serves Orleans Parish and the City of Kenner, NORTA can act as a leader, setting a vision for regional collaboration for workforce transit connectivity. In the River Parish region, an unprecedented job boom is underway. According to a report by The Data Center”, more than 42,000 jobs are being created in the energy sector - the majority of which will be available to jobseekers with just a high school degree. These well paying jobs cannot be accessed without a car. With a strong transit connection, these jobs could help to solve New Orleans long-standing poverty and unemployment issues. According to a report by the Lindy Boggs National Center for Community Literacy, 52% of African-American males in New Orleans are not working. A survey targeting this population conducted by Mayor Landrieu’s administration revealed that more than half of this population does not have a car, and that 28.4% are riding transit on a daily or weekly basis. Lack of transportation options is a contributing factor to this high unemployment rate.
22WO R L D C L AS S T R A N S I T F O R N E W O R L E A N S
Ride New Orleans - The State of Transit in New Orleans: Ten Years After Katrina
What is a Transit Master Plan?A transit master plan serves as a detailed roadmap to guide investment in service and expansion today and into the future. Transit master plans are developed through a stakeholder-led, outcome-focused and data-driven process that, if effectively implemented, will result in broad consensus and community support.
Two overarching principles should guide the transit master plan:
• Prioritize quality transit service over nostalgia. The technology used by a particular transit route - whether bus, streetcar, bus rapid transit or light rail - matters far less than the quality of service provided on the route. Quality service runs frequently, provides fast travel times and provides service throughout the day and night. Commuters will be most attracted to a system that is designed to provide high-quality service - regardless of whether it is a bus or a streetcar. We therefore must re-examine current plans for extensive streetcar expansion over all other modes to ensure that our limited public resources make the most impact on mobility.
• Design transit routes based on where people live and want to travel to. New Orleans’ transit routes have remain largely unchanged over the past several decades. Routes from all parts of the city converge in the Central Business District, even if that may not be the final destination for many of the system’s riders. This system design forces riders to transfer in the CBD while running all bus routes through the most heavily trafficked part of our city, slowing down the transit system’s performance. The unlikely cities of Houston, TX and Omaha, NE offer recent models for transit master planning. In both cities, the transit agencies wiped their existing, outdated routes off the map and designed new transit routes to serve the population and economic activity centers that exist today, recognizing that their cities’ development patterns have changed dramatically since their bus routes were originally drawn. By approaching transit route design in this way, each city was able to realize significant cost savings and provide a higher quality transit service to get riders more quickly and reliable to and from their destinations.
23WO R L D C L AS S T R A N S I T F O R N E W O R L E A N S
Ride New Orleans - The State of Transit in New Orleans: Ten Years After Katrina
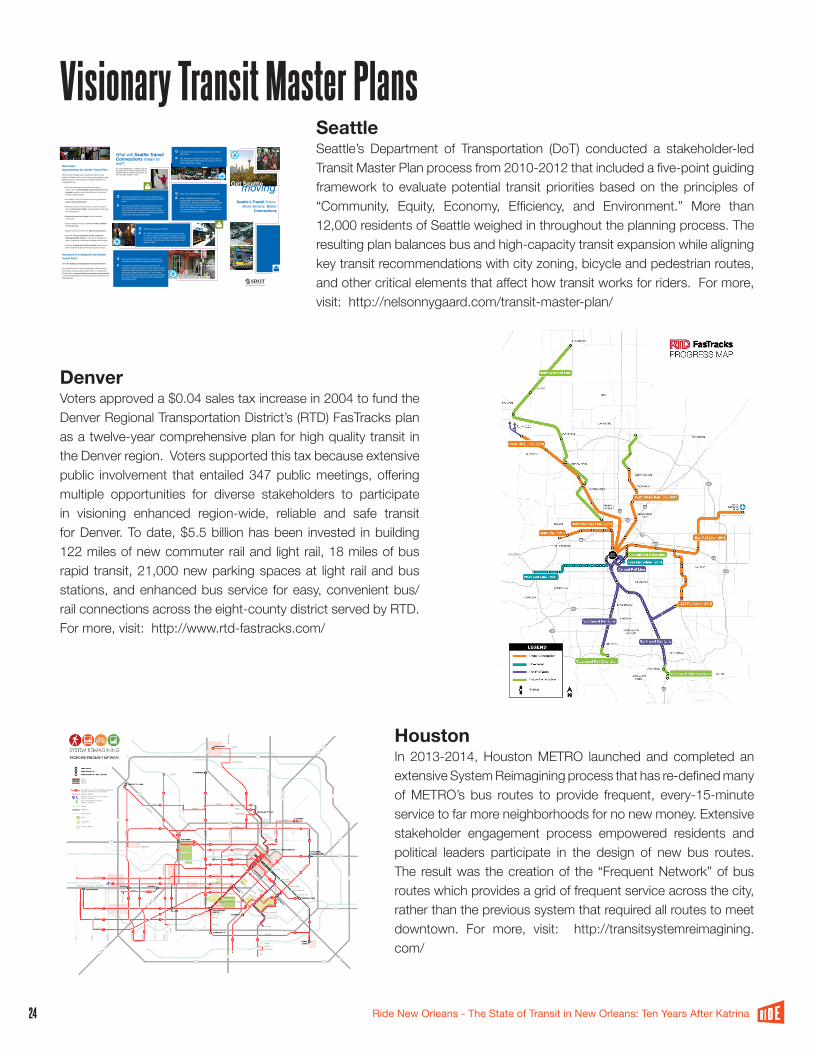
HoustonIn 2013-2014, Houston METRO launched and completed an extensive System Reimagining process that has re-defined many of METRO’s bus routes to provide frequent, every-15-minute service to far more neighborhoods for no new money. Extensive stakeholder engagement process empowered residents and political leaders participate in the design of new bus routes. The result was the creation of the “Frequent Network” of bus routes which provides a grid of frequent service across the city, rather than the previous system that required all routes to meet downtown. For more, visit: http://transitsystemreimagining.com/
DenverVoters approved a $0.04 sales tax increase in 2004 to fund the Denver Regional Transportation District’s (RTD) FasTracks plan as a twelve-year comprehensive plan for high quality transit in the Denver region. Voters supported this tax because extensive public involvement that entailed 347 public meetings, offering multiple opportunities for diverse stakeholders to participate in visioning enhanced region-wide, reliable and safe transit for Denver. To date, $5.5 billion has been invested in building 122 miles of new commuter rail and light rail, 18 miles of bus rapid transit, 21,000 new parking spaces at light rail and bus stations, and enhanced bus service for easy, convenient bus/rail connections across the eight-county district served by RTD. For more, visit: http://www.rtd-fastracks.com/
SeattleSeattle’s Department of Transportation (DoT) conducted a stakeholder-led Transit Master Plan process from 2010-2012 that included a five-point guiding framework to evaluate potential transit priorities based on the principles of “Community, Equity, Economy, Efficiency, and Environment.” More than 12,000 residents of Seattle weighed in throughout the planning process. The resulting plan balances bus and high-capacity transit expansion while aligning key transit recommendations with city zoning, bicycle and pedestrian routes, and other critical elements that affect how transit works for riders. For more, visit: http://nelsonnygaard.com/transit-master-plan/
24WO R L D C L AS S T R A N S I T F O R N E W O R L E A N S
Ride New Orleans - The State of Transit in New Orleans: Ten Years After Katrina
Visionary Transit Master Plans
moving
Next steps: Implementing the Seattle Transit Plan
While the City of Seattle doesn’t operate the different transit systems in Seattle, we can make sure they work together to keep Seattle moving. In moving forward, the Seattle Department of Transportation will:
• Work with other agencies to find new sources of revenue for the estimated $50 million of transit service we need annually to fund “Seattle Transit Connections” between neighborhoods.
• Use Seattle Transit Connections phasing priorities to target transit investments.
• Make the best use of transit service, using all available tools to keep transit reliable, including traffic signals that give transit priority.
• Develop the key transit hubs that offer seamless connections.
• Achieve Seattle’s strategy to create a livable, walkable 24/7 Center City.
• Support Central and North Link light rail construction.
• Work with King County Metro, Sound Transit and Washington State Ferries on their future development plans to maximize investments for Seattle and the region.
• Continue to gather your input and ideas, particularly as SDOT implements improvements in priority corridors.
Interested in reading the full Seattle Transit Plan?
Visit www.seattle.gov/transportation/transitnetwork.htm
For more information on how to get people in Seattle moving on all modes of transportation please read our Transportation Strategic Plan at www.seattle.gov/transportation/tsphome.htm or call the Seattle Department of Transportation with questions at (206) 684-8542.
Get Seattle
Seattle’s Transit Future: More Service, Better
Connections
SDOTSeattle Department of Transportation
Q Will I be able to get from my home in Greenwood to my favorite restaurant in the University District without a car?
A Yes. Because Seattle Transit Connections is avail-able 18 hours a day, including weekends, future transit service will quickly take you east to a transit center where you can make a seamless connection to light rail to the University District.
Q Can I get home to Columbia City on transit if I work late hours?
A Yes. Whether it’s light rail, streetcar or bus, service will be provided at least every 15 minutes until mid-night, seven days a week.
Q What if my neighborhood isn’t served by light rail?
A Most of Seattle will be living, working and playing within a quarter-mile distance of Seattle Connections. The system will connect most Seattle
neighborhoods to the light rail lines and to each other with frequent and reliable service. When you live outside an urban village, local bus service will still connect you to the network.
Q Will my bus get stuck in traffic?
A No. SDOT is making improvements to our streets to make sure bus travel time is competitive with car travel time. We’ll use ongoing monitoring to confirm the system is working and make sure buses aren’t stuck in traffic.
Q How will the combination of the bus, light rail and monorail service impact Seattle’s expected growth?
A All Seattle Connections transit investments are expected to attract development that creates livable, walkable neighborhoods that are not reliant on cars, particularly around transit centers. These centers are where riders can make easy connections to light rail, buses, streetcars, ferries, as well as pedestrian and bicycle paths.
What will Seattle Transit Connections mean to me?For most Seattleites, it means you will be within a five-minute walk to transit service that runs every 15 minutes, 18 hours a day, 7 days a week.
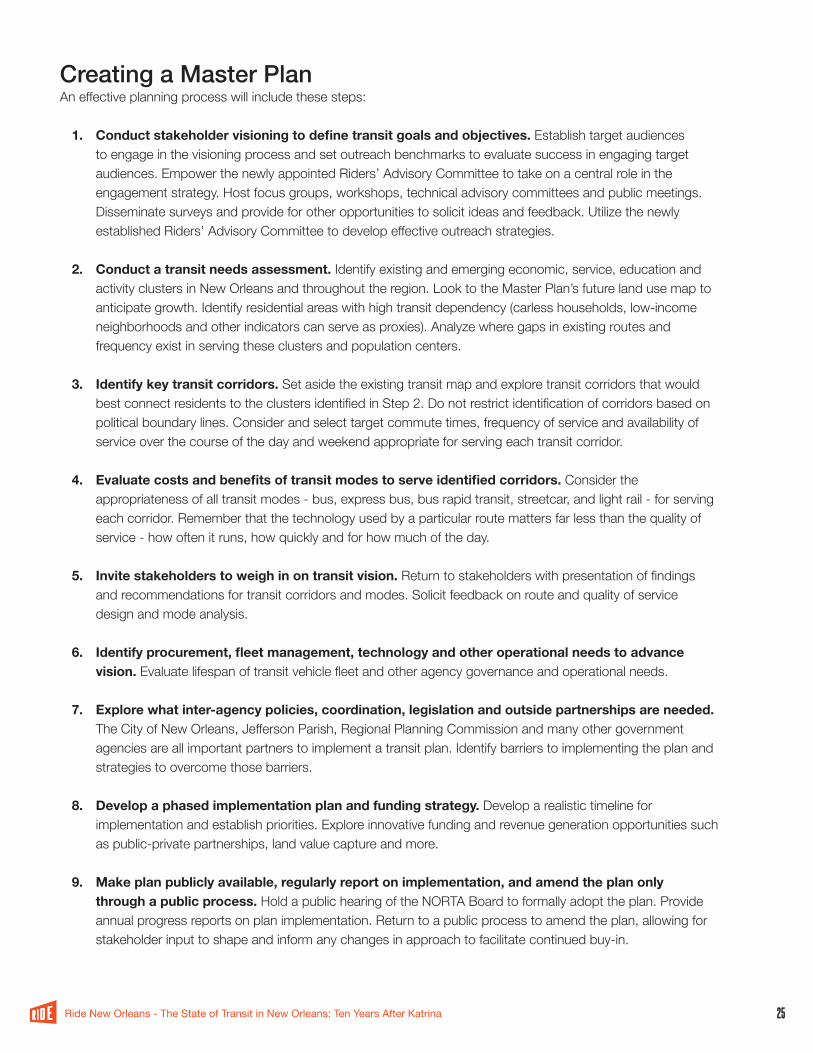
Creating a Master PlanAn effective planning process will include these steps:
1. Conduct stakeholder visioning to define transit goals and objectives. Establish target audiences to engage in the visioning process and set outreach benchmarks to evaluate success in engaging target audiences. Empower the newly appointed Riders’ Advisory Committee to take on a central role in the engagement strategy. Host focus groups, workshops, technical advisory committees and public meetings. Disseminate surveys and provide for other opportunities to solicit ideas and feedback. Utilize the newly established Riders’ Advisory Committee to develop effective outreach strategies.
2. Conduct a transit needs assessment. Identify existing and emerging economic, service, education and activity clusters in New Orleans and throughout the region. Look to the Master Plan’s future land use map to anticipate growth. Identify residential areas with high transit dependency (carless households, low-income neighborhoods and other indicators can serve as proxies). Analyze where gaps in existing routes and frequency exist in serving these clusters and population centers.
3. Identify key transit corridors. Set aside the existing transit map and explore transit corridors that would best connect residents to the clusters identified in Step 2. Do not restrict identification of corridors based on political boundary lines. Consider and select target commute times, frequency of service and availability of service over the course of the day and weekend appropriate for serving each transit corridor.
4. Evaluate costs and benefits of transit modes to serve identified corridors. Consider the appropriateness of all transit modes - bus, express bus, bus rapid transit, streetcar, and light rail - for serving each corridor. Remember that the technology used by a particular route matters far less than the quality of service - how often it runs, how quickly and for how much of the day.
5. Invite stakeholders to weigh in on transit vision. Return to stakeholders with presentation of findings and recommendations for transit corridors and modes. Solicit feedback on route and quality of service design and mode analysis.
6. Identify procurement, fleet management, technology and other operational needs to advance vision. Evaluate lifespan of transit vehicle fleet and other agency governance and operational needs.
7. Explore what inter-agency policies, coordination, legislation and outside partnerships are needed. The City of New Orleans, Jefferson Parish, Regional Planning Commission and many other government agencies are all important partners to implement a transit plan. Identify barriers to implementing the plan and strategies to overcome those barriers.
8. Develop a phased implementation plan and funding strategy. Develop a realistic timeline for implementation and establish priorities. Explore innovative funding and revenue generation opportunities such as public-private partnerships, land value capture and more.
9. Make plan publicly available, regularly report on implementation, and amend the plan only through a public process. Hold a public hearing of the NORTA Board to formally adopt the plan. Provide annual progress reports on plan implementation. Return to a public process to amend the plan, allowing for stakeholder input to shape and inform any changes in approach to facilitate continued buy-in.
25WO R L D C L AS S T R A N S I T F O R N E W O R L E A N S
Ride New Orleans - The State of Transit in New Orleans: Ten Years After Katrina
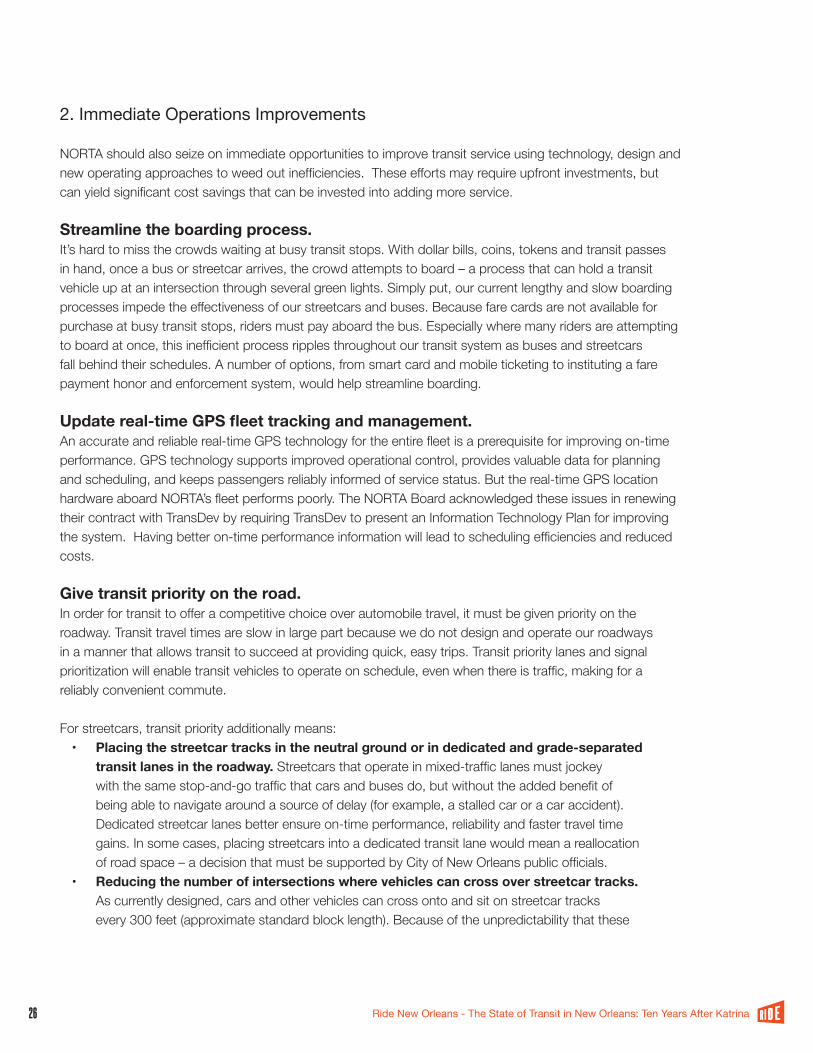
2. Immediate Operations Improvements
NORTA should also seize on immediate opportunities to improve transit service using technology, design and new operating approaches to weed out inefficiencies. These efforts may require upfront investments, but can yield significant cost savings that can be invested into adding more service.
Streamline the boarding process.It’s hard to miss the crowds waiting at busy transit stops. With dollar bills, coins, tokens and transit passes in hand, once a bus or streetcar arrives, the crowd attempts to board – a process that can hold a transit vehicle up at an intersection through several green lights. Simply put, our current lengthy and slow boarding processes impede the effectiveness of our streetcars and buses. Because fare cards are not available for purchase at busy transit stops, riders must pay aboard the bus. Especially where many riders are attempting to board at once, this inefficient process ripples throughout our transit system as buses and streetcars fall behind their schedules. A number of options, from smart card and mobile ticketing to instituting a fare payment honor and enforcement system, would help streamline boarding.
Update real-time GPS fleet tracking and management.An accurate and reliable real-time GPS technology for the entire fleet is a prerequisite for improving on-time performance. GPS technology supports improved operational control, provides valuable data for planning and scheduling, and keeps passengers reliably informed of service status. But the real-time GPS location hardware aboard NORTA’s fleet performs poorly. The NORTA Board acknowledged these issues in renewing their contract with TransDev by requiring TransDev to present an Information Technology Plan for improving the system. Having better on-time performance information will lead to scheduling efficiencies and reduced costs.
Give transit priority on the road.In order for transit to offer a competitive choice over automobile travel, it must be given priority on the roadway. Transit travel times are slow in large part because we do not design and operate our roadways in a manner that allows transit to succeed at providing quick, easy trips. Transit priority lanes and signal prioritization will enable transit vehicles to operate on schedule, even when there is traffic, making for a reliably convenient commute.
For streetcars, transit priority additionally means:• Placing the streetcar tracks in the neutral ground or in dedicated and grade-separated
transit lanes in the roadway. Streetcars that operate in mixed-traffic lanes must jockey with the same stop-and-go traffic that cars and buses do, but without the added benefit of being able to navigate around a source of delay (for example, a stalled car or a car accident). Dedicated streetcar lanes better ensure on-time performance, reliability and faster travel time gains. In some cases, placing streetcars into a dedicated transit lane would mean a reallocation of road space – a decision that must be supported by City of New Orleans public officials.
• Reducing the number of intersections where vehicles can cross over streetcar tracks. As currently designed, cars and other vehicles can cross onto and sit on streetcar tracks every 300 feet (approximate standard block length). Because of the unpredictability that these
26WO R L D C L AS S T R A N S I T F O R N E W O R L E A N S
Ride New Orleans - The State of Transit in New Orleans: Ten Years After Katrina
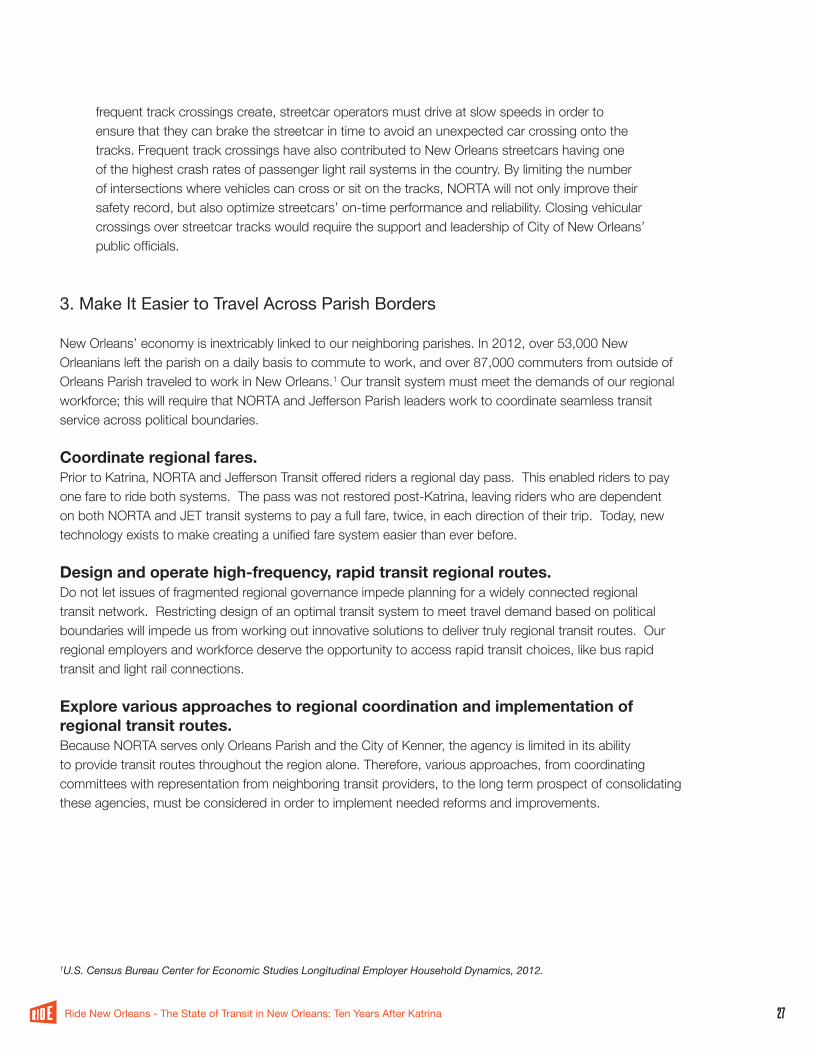
frequent track crossings create, streetcar operators must drive at slow speeds in order to ensure that they can brake the streetcar in time to avoid an unexpected car crossing onto the tracks. Frequent track crossings have also contributed to New Orleans streetcars having one of the highest crash rates of passenger light rail systems in the country. By limiting the number of intersections where vehicles can cross or sit on the tracks, NORTA will not only improve their safety record, but also optimize streetcars’ on-time performance and reliability. Closing vehicular crossings over streetcar tracks would require the support and leadership of City of New Orleans’ public officials.
3. Make It Easier to Travel Across Parish Borders
New Orleans’ economy is inextricably linked to our neighboring parishes. In 2012, over 53,000 New Orleanians left the parish on a daily basis to commute to work, and over 87,000 commuters from outside of Orleans Parish traveled to work in New Orleans.1 Our transit system must meet the demands of our regional workforce; this will require that NORTA and Jefferson Parish leaders work to coordinate seamless transit service across political boundaries.
Coordinate regional fares.Prior to Katrina, NORTA and Jefferson Transit offered riders a regional day pass. This enabled riders to pay one fare to ride both systems. The pass was not restored post-Katrina, leaving riders who are dependent on both NORTA and JET transit systems to pay a full fare, twice, in each direction of their trip. Today, new technology exists to make creating a unified fare system easier than ever before.
Design and operate high-frequency, rapid transit regional routes.Do not let issues of fragmented regional governance impede planning for a widely connected regional transit network. Restricting design of an optimal transit system to meet travel demand based on political boundaries will impede us from working out innovative solutions to deliver truly regional transit routes. Our regional employers and workforce deserve the opportunity to access rapid transit choices, like bus rapid transit and light rail connections.
Explore various approaches to regional coordination and implementation of regional transit routes.Because NORTA serves only Orleans Parish and the City of Kenner, the agency is limited in its ability to provide transit routes throughout the region alone. Therefore, various approaches, from coordinating committees with representation from neighboring transit providers, to the long term prospect of consolidating these agencies, must be considered in order to implement needed reforms and improvements.
1U.S.CensusBureauCenterforEconomicStudiesLongitudinalEmployerHouseholdDynamics,2012.
27WO R L D C L AS S T R A N S I T F O R N E W O R L E A N S
Ride New Orleans - The State of Transit in New Orleans: Ten Years After Katrina
ProgressRIDE New Orleans’ analysis in this report reveals that NORTA continues to make progress restoring transit service in a manner that benefits neighborhoods and residents across the city. In addition, the NORTA Board has taken important and necessary steps to steer the agency to stability, controlling costs and strengthening the agency’s financial and management oversight positions. City leaders are advancing key initiatives that require integrated land use, workforce and transportation policies, and this favorable policy climate creates new opportunities for advancing holistic improvements to our public transit service and infrastructure.
A Long Way to GoYet ten years out from the devastation of the flooding that followed Hurricane Katrina in 2005, just 45% of our overall transit service has returned. NORTA no longer supplies the highly frequent service that makes it easy and convenient to ride transit to its riders. These realities can be explained in large part by a significant decrease in operating funds available for transit since Katrina. In 2004, NORTA reported their operating expenses to be over $129 million; by 2013, their operating expenses had fallen to just $71 million.
Streetcars are the clear winner of New Orleans’ transit recovery. NORTA leaders are directing a larger share of their limited operating funds to expand streetcar service. In 2004, NORTA expended 14% on streetcar service, by 2013 that number had climbed to 34%. Not surprisingly, streetcar service has now fully rebounded from Katrina’s impacts, while bus service is running at 65% of pre-Katrina service levels. Given that existing streetcar lines serve only select neighborhoods, this uneven recovery has left many neighborhoods across the city with poor-quality transportation choices.
Simultaneously, an extensive streetcar expansion program is underway with a new streetcar route now operating on Loyola Avenue and tracks being laid along N. Rampart Street and St. Claude Avenue, and TransDev leaders have called for nearly $1 billion in additional capital funding to continue to lay new tracks. Yet New Orleanians are calling into question these projects and the mobility gains promised from new streetcar tracks.
A New DirectionNORTA is no longer at a point where the agency is simply recovering from post-Katrina devastation. Instead, the agency has moved beyond recovery to adding new streetcar tracks. Yet NORTA’s planning efforts have been limited to fragmented studies and piecemeal plans. The agency still lacks an integrated vision, guided by community priorities, and a framework with which to evaluate and weigh investment outcomes among competing interests for limited resources.
Conclusions
28WO R L D C L AS S T R A N S I T F O R N E W O R L E A N S
Ride New Orleans - The State of Transit in New Orleans: Ten Years After Katrina
Develop a real transit master plan. RIDE New Orleans is calling for the NORTA Board to work collaboratively with City leaders to to develop a stakeholder-led transit master plan that dovetails into the City’s Master Plan update. Through community visioning sessions, NORTA should work to set long-term goals and priorities and develop a multi-modal operating and capital investment plan that optimizes existing transit services while envisioning a system expansion that supports businesses and workers in our local and regional economy to thrive. We have nothing to gain by waiting any longer to create a truly comprehensive, transit master plan.
Act on immediate operations improvements to optimize transit service performance. NORTA should also seize on immediate opportunities to improve transit service using technology, design and new operating approaches to weed out inefficiencies. Improvements range from speeding up the boarding process through new fare technologies to giving transit vehicles traffic signal priority and can result in faster, more reliable transit service for riders and cost savings for NORTA.
Make it easier to travel across parish boundary lines. Finally, NORTA must embrace the “regional” in their name and work to overcome political hurdles that prevent the truly regional transit service needed to support our regional economy. NORTA must develop partnerships with neighboring transit systems to coordinate a regional fare structure, and provide new regional transit routes that are not limited by parish boundary lines.
Action Steps
29WO R L D C L AS S T R A N S I T F O R N E W O R L E A N S
Ride New Orleans - The State of Transit in New Orleans: Ten Years After Katrina
SECTION 1: TRANSIT RECOVERYRide New Orleans measured the amount of transit service available before and after Katrina in several different ways, including the number of weekly trips, the number of “vehicle revenue miles,” and the number of “vehicle revenue hours.”
• Trips: A “trip” is a single round trip made by a single vehicle, like a bus or streetcar, from the time it leaves its first station until it returns to that station at the end of its route. Ride New Orleans’ analysts relied on the RTA’s maps and schedules from 2005, 2012 and 2015 to count total weekly trips on each route. We added all the routes together to get the “weekly trip volume” or total number of weekly trips available in a normal week during 2005 and 2012. Our trip volume analysis does not include paratransit trips; it focuses on the scheduled service available to the majority of transit riders.
• Vehicle Revenue Hours: Pulled from the National Transit Database, this represents the hours that transit vehicles travel while they are accepting passengers on their scheduled routes. This statistic does not count any travel time that occurs when vehicles are out of service.
SECTION 2: NEIGHBORHOOD ANALYSISIn this section, Ride New Orleans used the 72 neighborhood statistical area boundaries and names as defined by the New Orleans City Planning Commission to examine which bus and streetcar routes provided service to each neighborhood. Routes were deemed to serve a neighborhood if they: 1) ran through the neighborhood; 2) ran along a boundary street for the neighborhood; or 3) dead-ended or turned around at a boundary street for the neighborhood. In the following instances, we made exceptions to this policy:
• According to the way that the New Orleans City Planning Commission assigned neighborhood statistical area boundaries, the French Quarter and Iberville Development neighborhoods are bounded to the southwest by Iberville Street. We opted to use Canal Street as the southwestern boundary instead, based on the many transit lines serving the French Quarter and Iberville that turn around at or run along Canal Street that would not have been counted under our regular methodology.
• Where transit routes run on interstates and offer no local stops within a neighborhood, we did not count those routes as “serving” that neighborhood. Once we understood the transit routes that served each neighborhood, we then added together the total number of weekly bus and streetcar trips for the routes serving each neighborhood.
A special note about methodology changes: In addition to evaluating NORTA’s transit service, we incorporated transit lines offered by neighboring Jefferson Transit and St. Bernard Parish that enter into or abut Orleans Parish into our analysis. This slightly alters the analysis from our previous report released in July 2014 and entitled “The State of Transit in New Orleans: The need for a more efficient, equitable and sustainable system.” The neighborhoods impacted by this slight change in methodology include:
• 2005: Hollygrove, Leonidas, Dixon, Lakewood, West End, Navarre, Iberville, Mid-City, Tulane/Gravier, Central Business District, French Quarter, Read Blvd East, Read Blvd West, Viavant/Venetian Isles
• 2012 and 2015: Hollygrove, Leonidas, Dixon, Lakewood, West End, Navarre, Mid-City, Tulane/Gravier, Central Business District
Appendix - Methodology + Definitions
30WO R L D C L AS S T R A N S I T F O R N E W O R L E A N S
Ride New Orleans - The State of Transit in New Orleans: Ten Years After Katrina
SECTION 3. PEAK HOUR FREQUENCY For our frequency analysis of the RTA’s 2005 and 2015 transit service, we looked at the headway – or number of minutes wait between transit trips – offered on each bus and streetcar route during morning peak hours between 6:30AM and 10:00AM and evening peak hours between 3:30PM and 7:00PM. These figures are based on official RTA schedules. We divided routes into these categories: less than 15 minutes’ headway at peak hours; 15 to 30 minutes; 30 to 60 minutes; and greater than 60 minutes (see Table 1.B) in both 2005 and 2015.
SECTION 4. RIDERSHIPRTA ridership data is reported by NORTA and represents the number of passenger boardings per all of the agency’s transit vehicle over the course of a year.
31WO R L D C L AS S T R A N S I T F O R N E W O R L E A N S
Ride New Orleans - The State of Transit in New Orleans: Ten Years After Katrina
P O B o x 1 9 2 3 1 , N e w O r l e a n s , L A . 7 0 1 7 9
( 5 0 4 ) 3 4 5 - 8 3 6 0
w w w . r i d e n e w o r l e a n s . o r g
i n f o @ r i d e n e w o r l e a n s . o r g
WO R L D C L AS S T R A N S I T F O R N E W O R L E A N S