Embed Size (px)
Citation preview
THE STUDENT DUST COUNTER ON THE NEW HORIZONS
MISSION
M. HORANYI, V. HOXIE, D. JAMES#, A. POPPE#, C. BRYANT#, B.GROGAN∗, B. LAMPRECHT, J. MACK, F. BAGENAL, S. BATISTE,N. BUNCH∗, T. CHANTANOWICH∗, F. CHRISTENSEN∗, M.COLGAN∗, T. DUNN∗, G. DRAKE, A. FERNANDEZ#, T. FINLEY#,G. HOLLAND#, A. JENKINS∗, C. KRAUSS#, E. KRAUSS∗, O.KRAUSS∗, M. LANKTON, C. MITCHELL#, M. NEELAND∗, T. RESSE,K. RASH∗, G. TATE, C. VAUDRIN∗, J. WESTFALLLaboratory for Atmosperic and Space Physics, University of Colorado, Boulder, CO,80309-0392, USA ([email protected])∗ undergraduate student# graduate student
Received ; accepted
Abstract. The Student Dust Counter (SDC) experiment of the New Horizons Missionis an impact dust detector to map the spatial and size distribution of dust along thetrajectory of the spacecraft across the solar system. The sensors are thin, permanentlypolarized polyvinylidene fluoride (PVDF) plastic films that generate an electrical signalwhen dust particles penetrate their surface. SDC is capable of detecting particles withmasses m > 10−12 g, and it has a total sensitive surface area of about 0.1 m2, pointingmost of the time close to the ram direction of the spacecraft. SDC is part of the Educationand Public Outreach (EPO) effort of this mission. The instrument was designed, built,tested, integrated, and now is operated by students.
Keywords: interplanetary dust, instrumentation, education and public outreach
1. Introduction
The Student Dust Counter (SDC) is an impact dust detector on board theNew Horizons Mission. It is designed to map the spatial and size distribu-tion of interplanetary dust particles in order to verify the existence of thepredicted structures in our dust disk, the Zodiacal cloud. Five spacecrafthave carried dust detectors beyond the asteroid belt: Pioneers 10 and 11(Humes, 1980), Ulysses, Galileo (Grun et al., 1993), and Cassini (Sramaet al., 2004). SDC will provide the first dust measurements beyond 18AU, where the Pioneer sensors stopped working. After the Pluto-Charonfly-by, SDC will continue to measure dust on into the Kuiper Belt. Theseobservations will advance our understanding of the origin and evolution ofour own solar system, and allow for comparative studies of planet formationin dust disks around other stars.
c© 2006 Springer Science + Business Media. Printed in the USA.
SDCpaper.tex; 13/11/2006; 9:23; p.1

2 HORANYI ET AL.
SDC is part of the Education and Public Outreach (EPO) effort of theNew Horizons mission and is the first science instrument on a planetarymission to be designed, built, tested and operated by students. The SDCproject had an unusual history. A similar professional dust instrument waspart of a competing proposal to New Horizons in a parallel Phase A study.After the selection of New Horizons, motivated by the potential scientificcontribution of a dust instrument, the idea emerged to redirect some of thefunds from traditional EPO activities, and to involve a group of studentsto try their hands on building space hardware. The advanced state of therest of the New Horizons payload, and the risk of involving unexperiencedstudents made this request difficult. With the strong support of the missionPI, the NASA EPO board agreed to try the ‘SDC experiment’.
To minimize the risk SDC might pose to the mission, all quality assuranceinspections and the final flight assembly was done by NASA certified per-sonnel, and student activities were supervised by professionals. However, thestudent team, consisting of up to 20 engineering and physics undergraduateand graduate students, was responsible for the work done in all phases ofthis project, including presentations at all NASA milestone reviews. SDCwas built and tested to the same NASA engineering standards as every otherflight instrument. Due to the long duration of the New Horizons mission,generations of future students will continue to be involved, handing overtheir skills to the groups that follow them.
After 6 months of successful operations in space the SDC instrument wasrenamed, and the dedication reads:
New Horizons, the first mission to Pluto and the Kuiper Belt, is proudto announce that the student instrument (SDC) aboard our spacecraft ishereby named “The Venetia Burney Student Dust Counter” in honor ofMs. Venetia Burney Phair, who at age of eleven nominated the namePluto for our solar system’s ninth planet. May “Venetia” inspire a newgeneration of students to explore our solar system, to make discoverieswhich challenge the imagination, and to pursue learning all through theirlives.
2. Science background
The interplanetary dust particle (IDP) population reflects a complex bal-ance between sources, transport, and sinks which are all functions of thedust particle sizes and their positions in the solar system. IDPs are createdprimarily in asteroid-asteroid collisions, from the disintegration of cometsnear the Sun, from collisions between Kuiper Belt objects (KBOs), andthe continuous meteoroid bombardment of the moons, rings, asteroids andKBOs. Data from near-Earth and deep space missions suggest five distinct
SDCpaper.tex; 13/11/2006; 9:23; p.2

Student Dust Counter 3
IDP populations (Divine, 1993). While this model makes predictions for IDPpopulations throughout the solar system, it has not been validated by directmeasurements beyond 18 AU.
Beginning at about 3 AU from the Sun, the Pioneer 10 and 11 obser-vations of particles larger than about 10 µm in radius showed a constantspatial density (number of particles per unit volume) out to 18 AU (Humes,1980). At this distance, the argon and nitrogen gas mixture in the Pioneerpressurized detector cells froze and no further measurements could be made.
IDPs born on the outskirts of the solar system slowly lose orbital energydue to Poynting-Robertson drag and migrate toward the Sun. A 10 µmradius grain born at 50 AU reaches the inner solar system in about 6.5 My.However, the continuous migration can significantly slow down or come to ahalt due to mean motion resonances with the planets (Liou and Zook, 1999;Martin and Malhotra, 2002; Martin and Malhotra, 2003). Grains can alsoget ejected from the solar system via close encounters with the planets (Liouet al., 1996). Orbital integrations find that Neptune prolongs the lifetime ofthe inwardly migrating dust grains outside its orbit, imprinting its resonancestructure on the spatial density of dust in the Kuiper Belt.
Jupiter, on the other hand, acts as a gate-keeper and keeps the inner partof our solar system relatively dust free by ejecting up to 80% of the particlesthat would cross its orbit. The nature of the inner planets effect on dustdistribution is largely hidden due to dust production from active comets.
SDC measurements made as New Horizons crosses the solar system willhelp to understand the generation, the transport, and the loss processesof IDPs. The measurements of the density variations outside the orbit ofJupiter will allow for estimating the rate of dust production in the KuiperBelt, the collisional history of the region, and the mass distribution of theprimordial KBO population (Stern, 1996).
3. Instrument description
The SDC instrument (Figure 1) consists of a set of polyvinylidene fluoride(PVDF) film impact sensors, carried on a detector support panel, mountedon the exterior of the New Horizons spacecraft. It is outside the spacecraftmulti-layer insulating (MLI) blanket, facing the ram direction. Signals fromthe sensors are collected through an intra-harness that runs from the detec-tor assembly into the spacecraft interior to the instrument electronics boxmounted opposite the detector panel.
The measurement requirements of the SDC instrument were establishedby estimating the particle mass detection limit needed to resolve the ex-pected features of the dust distribution. The characteristic width of thepredicted resonance structures is on the order of 1 AU, hence a spatial
SDCpaper.tex; 13/11/2006; 9:23; p.3

4 HORANYI ET AL.
Figure 1. The Student Dust Counter provides ∼0.1 m2 of sensitive area. It wasdesigned to measure the mass of IDPs in the range of 10−12 to 10−9 g. It continuesregistering the impacts of bigger dust particles without the ability to determinetheir mass. It weighs 1.6 kg and consumes 5.1 watts of average power.
resolution of ≈0.1 AU assures adequate sampling. With the characteristicspacecraft speed, during cruise, of ≈13 km/s, this is equivalent to an in-tegration period of one week. Based on the current models (Divine, 1993)outside of dust structures, a detector, with a lower mass detection limit ofabout 10−12 g and 0.1 m2 surface area, is predicted to have on the order of1 IDP hit per week. SDC was designed to resolve the mass of IDPs in therange of 10−12 < m < 10−9 g within factors of < 2, covering an approximatesize range of 1 − 10 µm in particle radius. Bigger grains are also recordedwithout the ability of resolving their mass.
3.1. Sensor Design
SDCs dust impact detection is based on the use of permanently polarizedPVDF films. An impacting particle causes a depolarization charge when itpenetrates the film. PVDF sensors require no bias voltage, they are simple,inexpensive, reliable, electrically and thermally stable, mechanically rugged,radiation resistant, and do not respond to energetic ions or electrons. PVDFdust detectors have been extensively tested and calibrated in laboratoryexperiments (Simpson et al., 1989a; Simpson et al., 1989b; Simpson andTuzzolino, 1985; Tuzzolino, 1992; Tuzzolino, 1996) and have an excellenttrack record in space experiments. PVDF sensors were flown on the VEGA1 and 2, Stardust, Cassini, and ARGOS missions (Tuzzolino et al., 2001;Tuzzolino et al., 2003; Srama et al., 2004).
SDCpaper.tex; 13/11/2006; 9:23; p.4

Student Dust Counter 5
3.1.1. PVDF Signal GenerationThe magnitude of the PVDF depolarization charge depends on particlemomentum as well as whether the particle penetrates into or through thefilm (Simpson and Tuzzolino, 1985). SDC uses 28 µm thick PVDF filmswhich have been shown to stop particles up to 10−10 g and speeds up to20 km/s (Simpson and Tuzzolino, 1985). For particles stopped in the film,the number of electrons (e) generated is given by (Simpson and Tuzzolino,1985)
Ne = 3.8 × 10¹⁷m[g]1.3v[km/s]3.0, (1)
where m is particle mass, in grams, and v is the impacting velocity inkm/s. The speed of long resident dust grains following circular Kepler orbitsin the outer solar system is much less than the velocity of the spacecraft,hence we take v in Eq. 1 to be the spacecraft velocity.
For charge sensing amplifiers, the noise floor is proportional to the de-tector capacitance (Spieler, 2005) which is a function of the detector area,the material permittivity and the thickness (C = ǫ0ǫr A/d). The relativepermittivity of PVDF, like many polymers, changes dramatically with tem-perature varying from ǫr = 11 at 25 ◦C to 2.5 at -120 ◦C. For a giventhickness of PVDF, and a given operating temperature, the required lowerlimit of detectable impact-induced charge determines the maximum allow-able area of a single sensor. From Eq. 1 the SDC mass threshold of 10−12
g (sub-micron radius) requires a signal threshold of 6 × 10⁶ e. To ensure afalse detection rate of less than 1 per month, a signal-to-noise ratio (SNR)greater than 5 is required for an RMS noise level of ≈1 × 10⁵ e. Giventhe characteristics of the charge sensitive amplifier design used (see section3.3.1) the maximum allowable capacitance per sensor was determined to be∼30 nF for an equivalent area of ≈80 cm2.
To achieve a total sensitive area of 0.1 m2 SDC is composed of 12 sensorpatches, each 14.2 cm x 6.5 cm, mounted onto the top surface of a supportpanel. In addition, there are two reference sensor patches mounted on theback side of the detector support panel, protected from any dust impacts.These reference sensors, identical to the top surface sensors, are used tomonitor the various background noise levels, from mechanical vibrations orcosmic ray hits of our electronics, for example.
3.1.2. Sensor ConstructionThe SDC detectors (Figure 2) are based on similar instruments from theUniversity of Chicago. The PVDF film used by SDC is manufactured with1000 A of Al/Ni electrode material on the top and bottom surfaces. The filmis bonded between a pair of G-10 fiberglass frames and electrical contact tothe PVDF is made through signal wires running around the interior of theframe apertures and bonded to the electrode material with conductive silver
SDCpaper.tex; 13/11/2006; 9:23; p.5

6 HORANYI ET AL.
Figure 2. Exploded view of a single SDC PVDF detector. The detector is me-chanically bonded with structural epoxy. Electrical connection from the PVDFmetalization to the signal wires is through silver filled epoxy. The signal wiresare soldered to miniature coaxial cables leading to the system electronics. Threemounting screws tie the space charging frame and the detector to the underlyinghoneycomb support panel.
filled epoxy. The signal wires are routed to connection tabs where a miniaturecoaxial cable is attached.
3.2. Mechanical design
The detector assembly of SDC is built on a ∼1 cm thick aluminum com-posite honeycomb panel which provides mounting and support for the thedust sensors onto the exterior spacecraft deck. The panel is attached to thespacecraft with a three point compliant mount formed by titanium flexures.The flexures are sized to accommodate the thermal expansion mismatchbetween the spacecraft deck and detector assembly. Sensor wiring on thedetector assembly is routed in a harness channel designed to withstand dustimpacts.
3.2.1. Thermal DesignThe thermal design of the SDC detector assembly was driven largely bythe requirement that the detector panel be able to maintain passive ther-mal control while in view of the sun during early mission maneuvers. ThePVDF sensor film itself has poor thermo-optical properties, and is prone tooverheating when exposed to direct sunlight. PVDF will undergo permanentdepolarization at temperatures over 85 ◦C (Simpson and Tuzzolino, 1985).To maintain the PVDF temperature below a design target of 65◦C, a highemissivity polyimide tape is applied to the backside of the PVDF film toradiatively couple it to the honeycomb support panel below. The panel
SDCpaper.tex; 13/11/2006; 9:23; p.6

Student Dust Counter 7
14.75 MHz
EMI/EMC Filter
In-rush Limiter
4Meg X 8 Flash RAM
32k X 8 SRAM
32k X 8 PROM
Analog MUX
+
-
+
-
+ -
Tx
Rx
PPS
RS-422 Interface with Spacecraft
Data
Address
Interrupt
RS-422
ADC
FPGA Actel RT54SX72S
-Address Decoder -Housekeeping Data -Interrupt Controller -Watchdog Timer -IEM Switching -Science Data Collection
Microcontroller Atmel 80C32E
-Communication -Command Execution -Data Handling -Flash Management
SDC Digital Board
N e w
H o
r i z o
n s
S p a
c e c r
a f t
I E
M
+30V Supply
SDC Analog Board
Analog MUX
Analog MUX
Peak Hold
Shaper
CSA
Peak Hold
Shaper
CSA
Peak Hold
Shaper
CSA
Stimulus
DeMUX
Hold Reset
Channel Select
Science Data
Stimulus Trigger
Stimulus Select Housekeeping Signals
±5V Converter
Reset
ADC Control
ADC ADC
. . .
Level Shifter
Level Shifter
S D
C D
e t e c t o r P a n e l
Figure 3. SDC Electronics block diagram. Signals from each PVDF detector arerouted to individual analog electronics chains. Under FPGA control the scienceand housekeeping data are collected and passed to the system microprocessorwhich manages long term storage of data into flash memory. The FPGA alsoacts as a switch between the redundant spacecraft communications lines and themicroprocessor.
facesheet spreads out the heat from beneath the detectors. The top surfaceis covered with silverized Teflon tape that reflects 90% of the incident solarenergy, preventing the panel itself from overheating. The detector supportpanel area was sized analytically to provide adequate radiating area aroundthe 12 PVDF sensor patches.
3.3. Electrical design
The SDC electronics are carried on two multilayer printed wiring assemblies(PWA) housed in the SDC electronics box. Signals from the detectors comethrough the Intra-harness onto the analog PWA where they are amplified,conditioned and converted to digital data. The digital data are collected toregisters in the field programmable gate array (FPGA) on the digital PWA(Figure 3) and from there to the microprocessor which adds time-stampsto the data and stores them in long term non-volatile memory. The digitalPWA also contains the power supply, system health monitoring circuitryand interface electronics for spacecraft communications.
SDCpaper.tex; 13/11/2006; 9:23; p.7

8 HORANYI ET AL.
Figure 4. Each of the 14 analog signal chains contains a JFET input charge sensitiveamplifiers followed by a two stage CR-RC shaper circuit. The first stage shaperincludes a logarithmic gain term supporting a 2×10⁵ to 5×10¹⁰ electron input range.The shaper output is captured in a peak-hold stage long enough to be sampled bya scanning analog to digital converter circuit.
3.3.1. Analog Signal ChainGiven the large capacitance of the PVDF detectors care was taken to simul-taneously minimize the noise floor and to maximize the signal-to-noise ratio.Analysis showed that SNR is maximized when detector capacitance is equalto the input capacitance of the charge sensitive amplifier’s (CSA) JFET(junction field effect transistor) (Radeka, 1974; Spieler, 2005). To addressthe problems of matching JFETs to very large capacitance detectors workhad previously been done (Bertolaccini et al., 1988) to develop a processthat produces high capacitance JFETs with good transconductance.
A by-product of the specific JFET design is an increased gate volumesensitive to energetic particle charge deposition. A CRME96 radiation anal-ysis using the gate dimensions and a critical deposited charge of 1 × 10⁶ egives 2.3 × 10⁻⁷ events s−1 during solar max and roughly doubles duringsolar min. In the nominal case the upset rate is well below the one permonth science requirement. Using an ordinary solar flare model with meancomposition, the upset rate rises to 1.1 × 10⁻⁵ event s−1, suggesting thathigher than expected event rates should be checked against possible spaceweather effects.
The CSA output is routed to the two stage CR-RC shaper circuit (Figure4). Using the given CSA design values, theoretical noise limits can be calcu-lated (Spieler, 2005), allowing for the selection of an optimal shaper peakingtime τ = 10 µs. Measured SNR values from prototype circuits agree withthe predicted values and show a SNR > 10 for 106 electron input signals.
To accommodate signals over the ≈ 4 orders of magnitude required, thefirst stage of the shaper includes a logarithmic compression. In order tokeep the circuit size small the temperature dependence is uncompensatedand must be corrected in post-processing.
Following the shaper section each analog signal chain has a peak holdcircuit that retains the shaper pulse maximum for sampling by the analogto digital converters (ADC). The fourteen peak-hold outputs are divided into
SDCpaper.tex; 13/11/2006; 9:23; p.8

Student Dust Counter 9
two groups of seven with each group routed to its own analog multiplexer(MUX) and 16 bit ADC. A side effect of the signal chain electronics is thatlow level signals produce a digital output number (DN) of ∼65000 withincreasing magnitude analog signals producing decreasing DN values.
The response curve of a representative analog chain through the ADCis shown in Figure 5. The gain shift in the upper size range (lower right ofthe plot) is from the temperature sensitivity of the diodes in the logarithmiccompression term of the first stage shaper. This temperature dependencywas characterized during pre-launch calibration (see Section 3.5.2) and thetemperatures driving this shift are monitored during flight by temperaturesensors on the shaper circuits. Additionally the thermal environment of theSDC electronics box is expected to be stable over long time scales.
3.3.2. On-board StimulusTo track changes in the gain of the signal chains during flight the SDCelectronics includes stimulus circuitry that can inject selectable charge quan-tities into any of the signal chains at the JFET gates. The responses to thesestimuli are collected in the same manner as science data and reported alongwith a measurement of the stimulus voltage. The nominal injection levelsare shown on Figure 5.
3.3.3. Digital Control ElectronicsThe two analog MUX and ADC sets are controlled in parallel by the FPGAon the digital PWA. The ADC conversion values from each channel arestored to registers and compared against individually programmable thresh-old values in the FPGA. Upon a valid event detection the FPGA executesone additional scan of every channel, to assure the shaper pulse has timeto peak, then it stops scanning, leaving each channel’s peak value in theFPGA registers. An interrupt is sent to the microprocessor to indicate thatthe science data is ready. The FPGA provides a control register which canbe set to prevent any given channel from generating interrupts.
The system has a radiation tolerant 8032 microcontroller, 32 kbyte anti-fuse PROM for program storage, 32 kbyte Rad-hard SRAM and 4 Mbytenon-volatile flash RAM. The data retention time of the flash memory, ratedat 10 years, is extended by providing circuitry to power it on only whenthe system is accessing it. The SDC flight software resides in ∼24 kbyte ofthe 32 kbyte PROM. The system can be configured to load code from flashmemory into SRAM and run it from there, supporting in-flight updates ifnecessary.
SDCpaper.tex; 13/11/2006; 9:23; p.9

10 HORANYI ET AL.
Figure 5. A typical SDC charge to DN response curve. Temperature dependentchanges in gain are characterized during calibration. In-flight temperature moni-toring and charge injection (the 8 onboard stimulus levels are indicated as verticaldashed lines) support post-processing correction for gain curve shifts.
3.4. Software design
For most of the long journey to Pluto, the New Horizons payload will bein “hibernation”, with the exception of SDC, which was designed for stan-dalone operations. Much of the SDC flight software is related to managingitself during these long periods extending up to 500 days. In addition todata collection and storage, the software continuously executes a set of pro-grammable ‘autonomy’ rules that allow the instrument to adjust for manyoff-nominal conditions.
When SDC is turned on it immediately starts taking science data. Groundcommands are required only to perform calibrations or reconfigure settings.The ground can also turn channels off or on, erase the flash memory, andrequest telemetry packets. SDC provides several data packet types includingscience data, housekeeping information, calibration results, memory dumps,and message logs. Communications, as defined by the spacecraft, is limitedto one command sent per second, and one telemetry packet received persecond. A telemetry packet can contain up to 1024 data bytes.
SDCpaper.tex; 13/11/2006; 9:23; p.10

Student Dust Counter 11
3.4.1. Data ManagementWhenever a science interrupt occurs the software compares each channel’svalue from the FPGA against that channel’s current threshold value. For anychannel exceeding its threshold the channel number, the measured value,and the threshold value are stored to flash memory along with the missionelapsed time (MET).
In addition to science data, flash memory is used for storing systemhousekeeping data and maintaining system critical variables, all of whichare stored in triplicate. A simple majority vote is used to correct any cor-rupted values. A health check is performed on the flash memory everydayto ensure it can be written to and erased. Flight software maintains a tableof ill-performing flash memory blocks.
3.4.2. Autonomy RulesThe 4 Mbyte of flash memory is much larger than the total expected SDCdata volume. However, it is possible for elevated noise levels to be mis-identified as science and potentially fill up the flash memory, leaving noroom for real science. A high rate of noise events can also cause the softwareto hang while trying to process all the interrupts it receives. To mitigatethe risk of filling-up flash memory during the long periods of unattendedoperation, the software has two sets of autonomy rules to control the datarate from the channels. Set A monitors the number of interrupts receivedfrom each channel every second. Whenever a channel generates 3 interruptsin a second (the maximum reasonable interrupt rate) that channel is blockedat the FPGA from generating further interrupts for some programmableperiod, typically one hour. These rules accommodate transient noise periods,like spacecraft maneuvers.
Set B monitors the number of interrupts received from each channel ina day. If a channel reaches the daily limit, by default 20, that channel’sthreshold is changed to a previously selected, less sensitive level. There isa table of three decreasingly sensitive threshold values for each channel,the values of which can be changed by ground command. The threshold ofeach channel can be increased twice, and if it remains in violation of Set B,then the channel is blocked from generating interrupts for a longer period,typically 30 days. After this time the channel is turned on at its originalthreshold and allowed to go through the table one more time. Upon reachingthe end of the threshold table a second time the channel is permanentlyblocked from generating interrupts until enabled by ground command. Theintent of this rule set is to autonomously adjust the instruments sensitivityto permanent changes in the noise environment, such as degradation of theelectronics. The time-out period of rule A and all of the rule B default valuesare adjustable by ground command.
SDCpaper.tex; 13/11/2006; 9:23; p.11

12 HORANYI ET AL.
3.4.3. In-Flight Calibration FunctionsThe flight software manages the setup and data collection of the StimulusTest (3.3.2). In addition it can perform a Noise Floor calibration. Thisconsists of temporarily suspending the autonomy rule set B and changingthe thresholds of all the channels to a series of levels sensitive enough thatelectronics noise is detectable. By counting the number of science interruptsobtained at each threshold over specified times, the statistical distributionof the noise on each channel can be calculated. The flight software allows forup to five levels and test times. The test thresholds are configurable fromthe ground, but the durations are permanently set. At the completion of atest set, autonomy rule B is re-enabled and the channel thresholds are resetto their initial values.
3.5. Instrument Calibration
3.5.1. PVDF Sensor CharacterizationIn the summer of 2003 and 2006 a set of SDC / PVDF sensors were taken tothe dust accelerator facility at Max Planck Institute for Nuclear Physics inHeidelberg, Germany to verify that they show similar response to hyperve-locity dust impacts (Figure 6) as has been published for previous instrumentsutilizing PVDF (Simpson and Tuzzolino, 1985).
More than 80 iron dust particle impacts where collected from 4 sep-arate prototype sensors (Figure 7). At the lower particle sizes accuratemeasurements of CSA response was difficult. With these points excluded, themeasured slope is close to that of Simpson and Tuzzolino (Eq. 1) but with anoffset. This offset could be due to differences in the thickness of the metalliclayers, their exact composition, and/or differences in the manufacturing ofthe PVDF, including its level of polarization. The fit to our calibration data(using the same notation as in Eq.1)
Ne = 5.63 × 10¹⁷m[g]1.3v[km/s]3.0, (2)
3.5.2. Electronics CalibrationThe gain curve shown in Figure 5 illustrates that the system response tosensor produced charges is highly non-linear. A calibration function is neededto identify: a) the compression stage gain variation with electronics boxtemperature; and b) the possible change in CSA gain due to temperaturedriven changes in PVDF capacitance. The calibration equation then becomesQ(DN, Tb, Cdet(Td)), where Q in the measured charge, DN is the reportedvalue, Tb is the temperature of the electronics box and Cdet(Td) is thecapacitance of the PVDF detector as a function of detector temperature,Td.
PVDF detectors are very sensitive to acoustics and mechanical vibrations,making them impractical to use during calibration. From characterization
SDCpaper.tex; 13/11/2006; 9:23; p.12

Student Dust Counter 13
Figure 6. Example of output pulse from a PVDF sensor to a 3.1 × 10⁻¹¹ g ironparticle impacting at 4.52 km/sec. The top trace is from the accelerator chargeinduction tube (100 mm, 6.1V/pC), the middle trace is the output of the shaper(1.47×10⁻⁵ mV/e) and the bottom trace is from the CSA (7.3×10⁻⁷ mV/e) (note:gains are not flight values).
of PVDF sensor capacitance over temperature, fixed capacitor values wereselected to represent the detector capacitance, Cdet, at 25, -30, and -100◦C. A range of reference charge pulses were generated with a standardcalibrated charge injection circuit, and the electronics box temperature wascollected from SDC telemetry points, measured at the shaper circuitry (thesame measurements that are reported in flight). The measured electronicstemperatures, Tb, were 50, 40, 34, and -7 ◦C.
For each electronics box temperature and Cdet value, 21 different ampli-tude charges were injected 100 times into each of the 14 channels. For eachcharge pulse injected the resulting DN value and accompanying Tb werecollected from the SDC telemetry. The pre-launch baseline calibration func-tion for each channel, Qch(DN, Tb), was produced by fitting that channel’sdata with a 10th order polynomial. Cdet was dropped as a parameter to thecalibration function after analysis showed that CSA gain changes due tovariations in detector capacitance were insignificant.
4. Data analysis
When SDC data is received on Earth, it is sent to the New Horizons missionoperations center at the Johns Hopkins’ University Applied Physics Labora-
SDCpaper.tex; 13/11/2006; 9:23; p.13

14 HORANYI ET AL.
Figure 7. Dust impacts on SDC prototype PVDF sensors. Plot of ratio N/v3 vsprojectile mass. N (electrons) is the measured detector signal and v (km/s) isprojectile velocity reported by the dust accelerator.
tory. The SDC data, as well as several ancillary spacecraft data packets, arealso sent to SDCs home institution, LASP, via the Ground System Equip-ment Operating System (GSEOS). Simultaneously, it is also received at theTombaugh Science Operations Center (TSOC) of the Southwest ResearchInstitute (SwRI) in Boulder.
The data are sent through “levels” of processing software that progres-sively decode more of the packets and send the decoded data to the database.
− Level 0 software extracts the data packets out of the GSEOS files.
− Level 1 software separates the data by packet type, such as Science,Housekeeping, Calibration, flash and SRAM memory dumps, and de-commutates the type specific data into the Level 1 database.
− Level 2 software generates charge values from Level 1 DN values usingQch(DN, Tb) from section 3.5.2
− Level 3 software uses Eq. 2 to convert charge to equivalent mass
− Level 4 software removes noise using the reference detectors and othercoincident events to produce validated IDP impact rates as function ofdust mass.
SDCpaper.tex; 13/11/2006; 9:23; p.14

Student Dust Counter 15
The data products from Levels 0 through 2 are produced both at TSOC,as well as at LASP, using identical source controlled software. Data productsfrom levels 3 and 4 are only produced at LASP.
5. Initial results
5.1. Initial Turn-on and Checkout
On March 2, 2006, SDC was powered-on and commanded to report backa full set of housekeeping values. With receipt of fully nominal values, aseries of commands were sent instructing the instrument to initiate a set ofStimulus Tests (ST) (section 3.3.2) and Noise Floor calibrations (NFC) (sec-tion 3.4.3). All tests ran successfully and the results showed that SDC hadsurvived the rigors of launch. Both ST and NFC were repeated several timesover the next few months to better characterize the post-launch behavior ofthe instrument.
5.2. In flight calibration
5.2.1. Stimulus CalibrationST results were compared to pre-launch baseline tests. Figure 8 shows thechange in stimulus responses for one of the channels. As of the time of thetest, with the exception of channel 11, all of the stimulus test results wereholding steady within the variation expected from ground testing. Some timebetween instrument delivery to the spacecraft and launch, the detector onchannel 11 began exhibiting symptoms of degraded electrical contacts to thePVDF. As a result, channel 11 is expected to have a reduced sensitivity.
5.2.2. Noise Floor CalibrationWith the sensitivity of the PVDF detectors to acoustics and and mechanicalvibrations, the in-flight NFC was the first good measure of SDC systematicnoise. For each channel the average noise rate (noise events collected dividedby collection period) versus threshold is calculated. The logarithm of therates is used to fit a second degree polynomial to characterize the noiseprofile of that channel. The threshold value where the fit crosses the onehit per month rate, is the lowest of the three thresholds for that channelto support autonomy rule B (section 3.4.2). Figure 9 displays Noise Floorcalibration data for a single channel and illustrates the threshold correctioncalculation.
A corrected set of thresholds were uploaded in late June 2006 and sub-sequently used for science collection through the fall. Two or three morerounds of calibrations are scheduled before entering cruise phase, duringwhich the instrument must operate autonomously for up to 500 days.
SDCpaper.tex; 13/11/2006; 9:23; p.15

16 HORANYI ET AL.
Figure 8. Stimulus tests of channel 4 performed in April and August, 2006, and thepre-flight calibration curve.
5.3. Dust measurements
SDC was designed to take advantage of the quiet state of the spacecraftduring cruise phase. Various active spacecraft operations cause mechanicalshocks that are picked up by the PVDF sensors and registered by SDC asscience events. This is particularly true during three-axis pointing and activespin mode when the spacecraft frequently fires short bursts of the attitudethrusters. Level four data reduction (section 4) is used to filter out any hitsthat appear within a second of any thruster firing, thereby allowing sciencerecovery between firings. However because the thruster induced events areoften frequent enough to violate the autonomy rule B (section 3.4.2 ), duringspacecraft manuvers many SDC detector channels switch off for prolongedperiods. During the first six months of flight, there are several periods, someweeks or months long, where SDC was completely off.
In spite of the initial difficulties of collecting science data, SDC doesroutinely take science during the short quiet periods available. As an exam-
SDCpaper.tex; 13/11/2006; 9:23; p.16

Student Dust Counter 17
Figure 9. SDC channel 4 noise collected in April and August of 2006 using the NoiseFloor calibration routine (section 3.4.3). The curves are fits to the collected ratesat five separate thresholds (marked on the upper horizontal axis). The new sciencecollection thresholds (lower vertical lines labeled 1, 2, and 3) are also indicated.
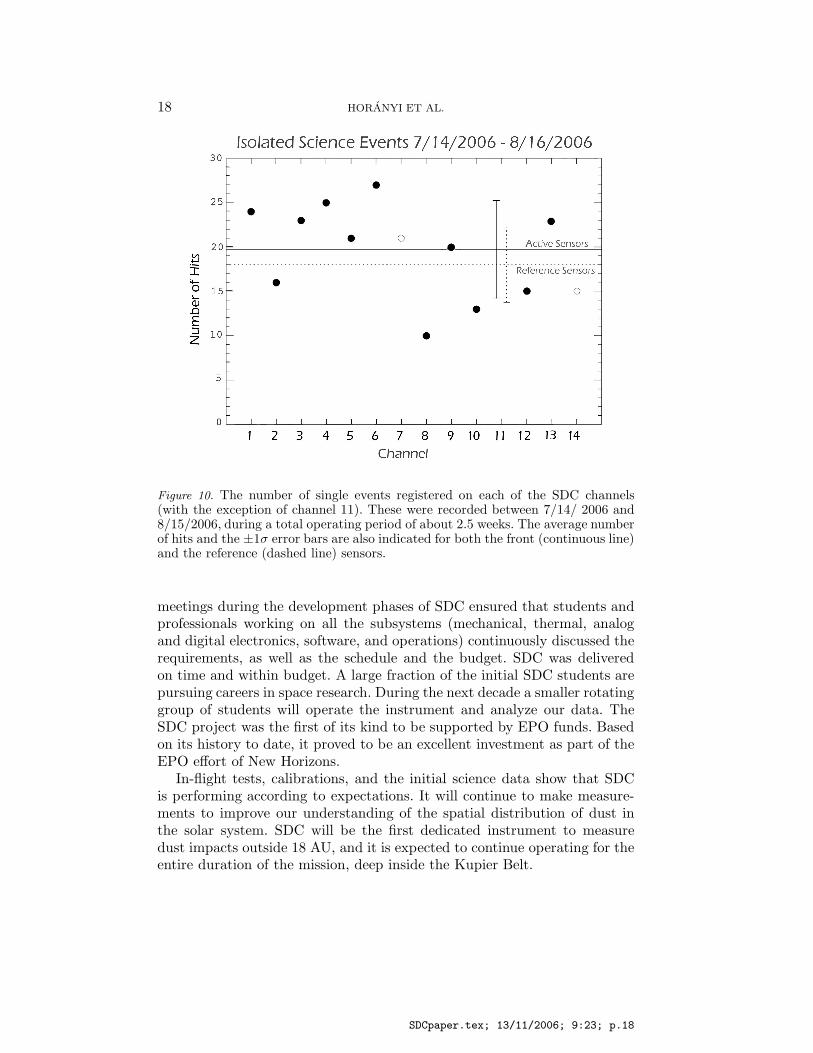
ple, Figure 10 shows the number of events recorded on each channel duringsegmented periods between July 14 and August 16, 2006, totaling 2.5 weeks.Events that were coincident between channels were removed, and channel 11was excluded in this analysis. The average number of hits on the front sensorswas 19.7±5.4, and on the reference sensors it was 18.0±4.2. The differenceof these are taken to be real dust hits of 1.73±6.9 during this period, ap-proximately consistent with our expectations of about 1 hit/week. The hugeerror bar is a consequence of the ongoing activities with other instrumentson the spacecraft. Following the Jupiter encounter in February 2007, allother instruments will hibernate between scheduled yearly checkouts. SDCwill stay on and start making measurements without interference.
6. Conclusions
As part of the Education and Outreach effort of this mission, SDC provideda unique, hands-on opportunity for a group of undergraduate and gradu-ate students to learn about building space hardware. Frequent ‘all-hands’
SDCpaper.tex; 13/11/2006; 9:23; p.17
18 HORANYI ET AL.
Figure 10. The number of single events registered on each of the SDC channels(with the exception of channel 11). These were recorded between 7/14/ 2006 and8/15/2006, during a total operating period of about 2.5 weeks. The average numberof hits and the ±1σ error bars are also indicated for both the front (continuous line)and the reference (dashed line) sensors.
meetings during the development phases of SDC ensured that students andprofessionals working on all the subsystems (mechanical, thermal, analogand digital electronics, software, and operations) continuously discussed therequirements, as well as the schedule and the budget. SDC was deliveredon time and within budget. A large fraction of the initial SDC students arepursuing careers in space research. During the next decade a smaller rotatinggroup of students will operate the instrument and analyze our data. TheSDC project was the first of its kind to be supported by EPO funds. Basedon its history to date, it proved to be an excellent investment as part of theEPO effort of New Horizons.
In-flight tests, calibrations, and the initial science data show that SDCis performing according to expectations. It will continue to make measure-ments to improve our understanding of the spatial distribution of dust inthe solar system. SDC will be the first dedicated instrument to measuredust impacts outside 18 AU, and it is expected to continue operating for theentire duration of the mission, deep inside the Kupier Belt.
SDCpaper.tex; 13/11/2006; 9:23; p.18

Student Dust Counter 19
Acknowledgements
We are grateful to A. Stern for inviting SDC on the New Horizons Mission,and to NASA for accepting the risk of a student built flight hardware aspart of EPO. We thank APL for accommodating SDC as a late addition.We acknowledge significant initial help from A. Tuzzolino at the Universityof Chicago. We thank E. Grun and R. Srama for their contributions anduse of the Dust Accelerator Facility at the Max Planck Institute for NuclearPhysics in Heidelberg, Germany. At LASP, R. Arnold, J. Johnson, P. Sicken,and J. Tracy assembled the flight version of SDC, and G. Lawrence guidedthe initial design of our electronics. M.H. acknowledges the support andhospitality of G. Morfill at the Max Planck Institute for ExtraterrestrialPhysics in Garching, Germany.
References
Bertolaccini, M. et al.: 1988, Nuclear. Inst. Meth., A264, 399–406.Divine, N.: 1993, J. Geophys. Res., 98, 17029–17051.Grun, E. et al.: 1993, Nature, 362, 428–430.Humes, D. H.: 1980, J. Geophys. Res., 85, 5841–5852.Jewitt, D.: 1999, Annu. Rev. Earth. Planet. Sci., 27, 287–312.Liou, J. C., Zook, H. A., Dermott, S. F.: 1996, Icarus, 124, 429–440.Liou, J. C., Zook, H. A., Jackson, A. A.: 1999, Icarus, 141, 13–28.Liou, J. C., Zook, H. A.: 1999, Astron. J., 118, 580–590.Moro-Martın, A., Malhotra, R.: 2002, Astron. J., 124, 2305–2321.Moro-Martın, A., Malhotra, R.: 2003, Astron. J., 124, 2255-2265..Radeka, V.: 1974, Signal, Noise and resolution in position-sensitive detectors. IEEE Trans.
Nucl. Sci., NS-21, 51–64.Simpson, J.A., Rabinowitz, D., Tuzzolino, A. J.: 1989. Nuclear Inst. Meth., A279, 611–
624.Simpson, J. A., Rabinowitz, D., Tuzzolino, A.J.: 1989, Nuclear Inst. Meth., A279, 625–
639.Simpson, J. A., Tuzzolino, A. J.: 1985, Nuclear Inst. Meth., A236, 187–202.Spieler, H.: 2005, Semiconductor Detector Systems. Oxford University Press, New York
U.S.A, ISBN-0-19-852784-5Srama, R. et al.: 2004, Space Sci. Rev., 114, 465–518.Stern, A.: 1996, Astron. Astrophys., 310, 999–1010.Tuzzolino, A. J.: 1983, Nuclear Inst. Meth., 212, 505–516.Tuzzolino, A. J.: 1992, Nuclear Inst. Meth., A316, 223–237.Tuzzolino, A. J.: 1996, Adv. Space Res., 17, 123–131.Tuzzolino, A.J., McKibben, R.B., Simpson, J.A., BenZvi, S., Voss, H.D., Gursky, H.: 2001,
Planetary and Space. Sci., 49, 689-703.Tuzzolino, A. J., et al.: 2003, JGR, 108, doi: 10.1029/2003JE002086.
SDCpaper.tex; 13/11/2006; 9:23; p.19

SDCpaper.tex; 13/11/2006; 9:23; p.20