Embed Size (px)
Citation preview
Hindawi Publishing CorporationInternational Journal of MicrobiologyVolume 2011, Article ID 753758, 22 pagesdoi:10.1155/2011/753758
Research Article
The Sulfate-Rich and Extreme SalineSediment of the Ephemeral Tirez Lagoon:A Biotope for Acetoclastic Sulfate-Reducing Bacteriaand Hydrogenotrophic Methanogenic Archaea
Lilia Montoya,1, 2 Irma Lozada-Chavez,3 Ricardo Amils,2, 4
Nuria Rodriguez,4 and Irma Marın2
1 Biologıa Molecular de Plantas, Instituto Potosino de Investigacion Cientıfica y Tecnologica, Camino a la Presa San Jose 2055,Lomas 4a Seccion, 78216 San Luis Potosı, SLP, Mexico
2 Centro de Biologıa Molecular, CSIC Universidad Autonoma de Madrid, Cantoblanco, 28049 Madrid, Spain3 Interdisciplinary Center for Bioinformatics and Department of Computer Science, University of Leipzig, 04107 Leipzig, Germany4 Centro de Astrobiologıa, INTA, 28855 Torrejon de Ardoz, Spain
Correspondence should be addressed to Lilia Montoya, [email protected]
Received 16 April 2011; Accepted 23 June 2011
Academic Editor: Haichun Gao
Copyright © 2011 Lilia Montoya et al. This is an open access article distributed under the Creative Commons Attribution License,which permits unrestricted use, distribution, and reproduction in any medium, provided the original work is properly cited.
Our goal was to examine the composition of methanogenic archaea (MA) and sulfate-reducing (SRP) and sulfur-oxidizing (SOP)prokaryotes in the extreme athalassohaline and particularly sulfate-rich sediment of Tirez Lagoon (Spain). Thus, adenosine-5′-phosphosulfate (APS) reductase α (aprA) and methyl coenzyme M reductase α (mcrA) gene markers were amplified given thatboth enzymes are specific for SRP, SOP, and MA, respectively. Anaerobic populations sampled at different depths in flooded anddry seasons from the anoxic sediment were compared qualitatively via denaturing gradient gel electrophoresis (DGGE) fingerprintanalysis. Phylogenetic analyses allowed the detection of SRP belonging to Desulfobacteraceae, Desulfohalobiaceae, and Peptococ-caceae in ∂-proteobacteria and Firmicutes and SOP belonging to Chromatiales/Thiotrichales clade and Ectothiorhodospiraceae inγ-proteobacteria as well as MA belonging to methylotrophic species in Methanosarcinaceae and one hydrogenotrophic species inMethanomicrobiaceae. We also estimated amino acid composition, GC content, and preferential codon usage for the AprA andMcrA sequences from halophiles, nonhalophiles, and Tirez phylotypes. Even though our results cannot be currently conclusiveregarding the halotolerant strategies carried out by Tirez phylotypes, we discuss the possibility of a plausible “salt-in” signal in SRPand SOP as well as of a speculative complementary haloadaptation between salt-in and salt-out strategies in MA.
1. Introduction
Molecular oxygen is found only in those biotopes that harbororganisms carrying out oxygenic photosynthesis. In oxygen-deficient systems, the nature of the redox couple and con-centrations of electron acceptor/donor determine the suc-cession of dissimilatory metabolisms due to thermodynamicconditions [1]. For a given substrate and under standard con-ditions, the aerobic dissimilatory metabolisms provide aboutone order of magnitude more energy than the anaerobicones, for example, glucose respiration (ΔG◦′ = −2877 kJ/mol) versus glucose fermentation (ΔG◦′ = −197 kJ/mol) [2].
Therefore, in sedimentary environments oxygen is exhaustedat deeper layers and the dissimilatory metabolisms are anaer-obic as a result. Anaerobic microorganisms are of interestin extreme environments because environmental param-eters such as temperature and salinity regulate the ratesof organic matter remineralization [3]. Extreme halophilicmicroorganisms require at least 15% NaCl and tolerate upto 35% NaCl. Interestingly, the low activity of water and theexpense on biosynthesis only select heterotrophs and strictaerobes as extreme halophiles. However, some moderatehalophilic and strict anaerobes have been described; oneexample is the methanogen Methanohalobium evestigatum,

2 International Journal of Microbiology
which uses methylated compounds (e.g., methylamine andmethanol) to generate methane. Methylated substrates yieldmore energy (ΔG◦′ = −78.7 to −191.1 kJ per mol substrate)than H2/CO2 (ΔG◦′ = −34 kJ/mol substrate) or acetate(ΔG◦′ = −31 kJ mol substrate) and allow that methy-lotrophic methanogens such as M. evestigatum can tolerateup to 29.2% NaCl [4]. Differences in bioenergetic yield deter-mine an exclusion of hydrogenotrophic methanogens such asMethanocalculus halotolerans, which tolerates a lesser salinity:up to 12% NaCl [5]. A similar pattern has been describedfor sulfate-reducing prokaryotes: acetoclastic sulfate reducers(ΔG◦′ = −47.6 kJ mol substrate), most of them belongingto Desulfobacteraceae, cease to tolerate high osmolarityconditions, for example, Desulfobacter halotolerans grows upto 13% NaCl [6]; on the other hand, Desulfohalobiaceaemembers have higher salt tolerances (up to 25% NaCl)and grow with H2/CO2 (ΔG◦′ = −152.2 kJ mol) or lactate(ΔG◦′ = −160 kJ/mol).
To define whether extremes of salinity are relevant incomposition and persistence of anaerobic ecotypes, theephemeral systems and spatial gradients constitute appropri-ate sites of study. Even though there are some studies aboutmicrobial communities present along salt gradients, thoseapproaches have been performed on thalassic microbial mats[7]; therefore, they are depleted in sulfate at deep layers,but most of them are also formed only on intertidal zones.Sulfate is the second most abundant electron acceptor onEarth and consequently the dominant electron acceptorfor anaerobic metabolism in marine sediments [8]. Oneinteresting ephemeral and sulfate-rich system is Tirez lagoon,or sabkha, because it is subjected to flooding/desiccationregimes, located in “La Mancha,” an arid region in Spain.Tirez lagoon is athalassic since the ionic composition is farfrom seawater and it is characterized by a low Cl : SO4 ratio(about 1.18 in flooded season and 0.35 in the dry season),whilst in the Dead Sea this ratio is above 103 [9]. This systemis maintained at a neutral pH due to a high Mg2+ and Ca2+
concentration in combination with a low CO32− content
at the saltern and sediment environments. The traces ofCO3
2− are removed as dolomite (CaMg(CO3)2) preventingalkalinization [10]. Given this scenario, the primary objectiveof this study was to characterize the composition of theanaerobic populations in the ephemeral and sulfate rich TirezLagoon.
The identification of environmental sulfate reducingprokaryotes (SRP) and sulfur oxidizing prokaryotes (SOP)can be performed by enrichment culturing and molecu-lar ecology fingerprinting; however, a characterization ofmethanogenic archaea (MA) through isolation techniquesis problematic given their slow growth rates [11]. Theuse of molecular ecology fingerprinting techniques such asdenaturing gradient gel electrophoresis (DGGE) from PCR-amplified genes is informative to assess the temporal andspatial qualitative diversity in natural samples, and it alsorequires fewer sequencing resources in comparison to clonelibraries and/or metagenomic analysis [12]. Instead of the16S rRNA gene, the use of DGGE from PCR-amplified func-tional gene markers is profitable to elucidate the compositionof the anaerobic pathways of sulfate respiration (SR), sulfur
oxidation (SO), and methanogenesis (MT). The 16S rRNAgene-based analysis cannot provide an unambiguous linkbetween gene sequences and its physiological or metabolicrole [13].
Whereas the SRP and SOP organisms are phylogenet-ically and physiologically disperse along the Bacteria andArchaea domains [14], MA organisms are monophyleticrestricted to Archaea [15]. In the dissimilatory pathways ofsulfate reduction and sulfur oxidation, dissimilatory sulfitereductase (Dsr) and adenosine-5′-phosphosulfate (APS)reductase (Apr) are considered as key enzymes [14]. In thesulfate-reducing pathway, sulfate has to be activated to APSby ATP-sulfurylase (EC: 2.7.7.4) at the expense of ATP; Apr(EC: 1.8.99.2) converts the APS to sulfite and AMP; hereafter,sulfite is reduced to sulfide by Dsr (EC: 1.8.7.1). For thesulfur-oxidizing pathway, the reverse direction is operatedby homologous and conserved enzymes [16]. The alphasubunits of Apr and Dsr enzymes are found in all knownSRP and most of SOP [17]. Regarding the methanogenesispathway, the methyl coenzyme-M reductase (Mcr) (EC:2.8.4.1) catalyses the reduction of a methyl group boundto coenzyme-M, with the concomitant release of methane[15]. McrA is unique and ubiquitous in all known MA [18].McrA gene fragment provides more information than the 16SrRNA gene; even if the saturation rates are similar betweenthe McrA gene fragment and the complete 16S rRNA gene,the number of differences per site in the McrA fragmentis 2-3 times higher than that in the full-length 16S rrs[19]. Therefore, assignment of genera with McrA sequencesoffers more conclusive resolution than assignment with 16SrRNA gene sequences. The mutation rates and selectivepressures of the AprA and McrA metabolic gene markersand of the structural 16S rRNA gene are different; however,phylogenetic studies done with partial sequences of AprAand McrA belonging to the SRP, SOP, and MA lineages haveestablished an agreement with the phylogenetic relationshipsbased on 16S rRNA gene sequences [13, 18]. Therefore,these functional gene markers can provide an estimate of theSR, SO, and MT microbial diversity harbored in sedimentsof Tirez Lagoon. Indeed, databases have been enriched insequences of model strains for these two enzymes; as aconsequence, the aprA and mcrA gene markers also provideus information to identify SRP, SOP, and MA selectively incomplex microbial communities, for example, [20].
The second aim of this study was to investigate whetherthe composition and distribution of the encoded amino acidsin aprA and mcrA genes are indicative of haloadaptation tothe hypersaline sediment. Diverse lines of evidence reportthat halophilic microorganisms can bias their amino acidcomposition to deal with the multimolar salinities of theirenvironment [21, 22]. This adaptative and energetically effi-cient strategy is characteristic in “salt-in” halophiles, whereturgidity is maintained by the intracellular accumulationof K+ that is usually equilibrated with the presence ofextracellular Cl− [23]. Therefore, an increase of the acidicnature of cytoplasmic proteins, which is offset by an overalldecrease in basic amino acids, is needed to maintain anappropriate folding and functionality under osmotic stress[22, 24]. In cytoplasmic proteins, it has been also pointed
International Journal of Microbiology 3
out a slight decrease in hydrophobicity as another amino acidhaloadaptation [25, 26]. In contrast, “salt-out” halophilesbuild up concentrations of osmolytes (also named osmopro-tectants or compatible solutes) to increase the intracellularosmolarity; thereby maintaining the protein native statesin spite of a highest energetic cost to manufacture theorganic molecules [27]. Accordingly, only proteins in “salt-out” organisms exposed directly to the hypersaline mediumexhibit an excess of acidic amino acids [28]. All eukaryotes,most halophilic bacteria, and the halophilic methanogenicarchaea (such as Methanohalobium evestigatum) have evolvedthe “salt-out” strategy [21]. The widely disparate taxonomicposition of “salt-in” prokaryotes (Halobacteriales in Archaea,Salinibacter ruber, and Halanaerobiales in Bacteria) suggestsa convergent evolution of this osmoadaptation strategy [27].
Several studies have also reported that a high genomicCG content (often upwards of 60%) and a GC bias at thecodon usage level are common adaptations to hypersalineenvironments, presumably to avoid UV-induced thymidinedimer formation and accumulation of mutations [21, 23].For example, the high GC composition (65.9%) of Halobac-terium sp. NRC1 could reduce the chance of such lesionsand its third position GC bias correlates with an overrep-resentation of acidic residues (i.e., Asp and Glu) [29]. Theunique exception to this general trend has been pointed outso far in another extreme halophile Haloquadratum walsbyishows a remarkably low genomic GC content (47.9%) and aweak GC-bias at the codon usage level [30]. Given that otherspecific features of nucleotide selection may also be involvedin the GC content of organisms, the GC-bias measurementsare complementary to the amino acid composition but notdecisive in order to infer the “salt-in” strategy [25].
Therefore, the findings of this study try to contributeto the knowledge of diversity and haloadaptation of theSRP and MT thriving at rich sulfate sediment. Additionally,Tirez system is analog to the ocean of Europa, satellite ofJupiter, due to its sulfate abundance and neutral pH [31],and sulfates have been detected on Mars indeed [32]. Thus,this knowledge will provide insight regarding the possiblebiological limits for life in other analogous places.
2. Materials and Methods
2.1. Study Site and Sampling Procedure. Sediment sampleswere collected from Tirez lagoon, which has an area of<1 km2 and it was originated after endorheic inflow undersemiarid conditions. The lagoon is located in the southernsubplateau of the Iberian region of La Mancha (39◦ 32′
42′′ N y 03◦ 21′ O). The salt content fluctuates from 6%(w/v) during winter to 35% (w/v) during spring. In summer,the system becomes an evaporite. Temperature oscillation isabout 40◦C and −7◦C, the mean annual thermal oscillationis 55◦C, and the annual mean rainfall is averaged at 400 mm.Water drains through material from the Triassic period;dolomites and Ca-sulfate marls are from the Tertiary period[31].
Samples were collected in February and July 2005 andcorrespond to the winter and summer seasons, respectively.The winter and summer samplings were done by triplicate
in three points at the lagoon; all of them were located inthe salt pan or lagoon basin because it is the region coveredby salts in summer. The sample cores were obtained fromsites separated from each other by several meters. In order toanalyze seasonal changes in the lagoon, the summer sampleswere obtained from the holes-signals leaved by the winter(flooded) sampling. Sediment cores were obtained with aRing Kit core-sampler for soft soil to a depth of 40 cm. Thesampled cores were cooled at −20◦C with jelly bags and keptuntil further processing.
2.2. Physicochemical Parameters. The sediment cores weresampled in winter and used to perform physicochemicalanalyses. Eh and pH of the cores were measured with a probeconnected to a potentiometer Orion Model 290A + ThermoOrion (Thermo Fisher Scientific). Also, dissolved oxygenand temperature were measured with a Sylant Simplair F-15oxymeter (Syland Scientific GmbH). In order to determinethe interstitial sulfide concentration, the sample cores fromsurface to 20 cm in depth were sonicated for 5 min (LabsonicB. Braun sonicator). After centrifugation (14,000 rpm 10 minSorvall RC-5), supernatants were mixed with Zn acetate(2%) and sulfide concentration was determined using themethylene blue method [33]. The core samples used toanalyze ion content (Cl−, SO4
2−, and NH4+) and car-
bon : nitrogen (C : N) ratios were sampled from the surfaceto 20 cm in depth; samples were dehydrated at 110◦C for12 hrs for ionic chromatography and elemental analysis.Ionic chromatography analysis was completed with 100 mgof pulverized samples diluted in 25 mL of filtered milliQwater, whilst the elemental analysis was performed withdried and pulverized sediment. The sediments were assayedby chromatographic methods with an IC Dionex DX-600chromatograph and by spectrophotometric methods with aLECO CHNS-932 elemental analyzer at the Servicio Interde-partamental de Investigacion (UAM).
2.3. Enrichment of SRP. SRP organisms from winter sampleswere grown in a cysteine-reduced (4.12 mM) medium forsulfate reducers, modified from Raskin et al. [34], and con-tained glutamic acid (5.2 mM), glycine (0.2 mM), methanol(14 mM), methylamine (27 mM), peptone (250 mg/L), andyeast extract (250 mg/L). The salt content in sulfate-reducingmedia was 3.5% the Tirez saltern. The inoculation was donewith sedimentary slurry from samples collected in February2005 (winter season). Cell culture growth was monitoredthrough the count of the cell density with 4′,6-diamino-2-phenylindole (DAPI), Molecular Probes (Invitrogen) [35]in a Zeiss Axiovert 200M fluorescent microscope. Sulfideincrease was also followed [33] for 12 months of incubationat 30◦C. Nonaxenic cultures were subjected to DNA extrac-tion.
2.4. DNA Extraction. Core samples were cut with sterile sur-gical blades according to depth regions. The three coreswith a weight of ∼210 g were mixed with three volumesof PBS 1x at 4◦C to reduce microheterogeneities and towash salts. This mixture was sonicated for 3 min (LabsonicB. Braun sonicator). Integrity of bacterial cells after the
4 International Journal of Microbiology
treatment was confirmed by 4′,6-diamino-2-phenylindole(DAPI) 1 μg/mL. Total genomic DNA was extracted fromsupernatants of washed and centrifuged sediments (500 rpmfor 1 min Hettich Mikro 22 R centrifuge to precipitate rocks).In order to collect cells from nonaxenic cultures, 100 mLof the samples were filtered onto 0.22 μm of polycarbonatefilters (Millipore). Sediment and soil samples are character-ized by the presence of inhibitors such as humic acids andexopolimeric substances, thus we used a specialized DNAextraction kit (FAST DNA SPIN kit for soil) (QBiogene,Irving, Calif, USA) which has proved to retrieve a reliableDNA extraction to obtain a broad and intense band patterns,in comparison with variants via phenol DNA extraction[36], and it has been used for analyses of microbial diversityby DGGE in sediments, for example, [20]. Total genomicDNA was purified according to Genomic DNA purificationJetQuick kit (Genomed) instructions.
2.5. PCR Amplification. Amplifications were carried out ina Thermal Cycler 2720 (Applied Biosystems). PCR reactionswere performed in a mixture of 50 μL containing: 2 μLof template DNA, 1 mM dNTP’S, 0.5 μM of each primer,3 mM MgCl2, 1x enzyme buffer, and 0.03 U/μL AmpliTaqDNA Polymerase (Roche, Molecular Systems). The aprAgene fragment of ∼0.4 kb was amplified with the APSfw(TGGCAGATMATGATYMACGGG with a GC clamp) andAPSrv (GGGCCGTAACCGTCCTTGAA) primer pairs. Thefollowing conditions were implemented: a first denaturingstep at 94◦C for 3 min, the completion of 35 cycles of 30 sat 94◦C, an annealing at 60◦C for 55 s and at 72◦C for1 min, and a final extension of 72◦C for 7 min [37]. In themcrA gene fragment amplification, at first a 0.76 kb fragmentwas amplified with the primers ME1 (GCMATGCARATHG-GWATGTC) and ME2 (TCATKGCRTAGTTDGGRTAGT).The ME-PCR reaction was carried out with an initialdenaturing step at 94◦C (5 min), followed by 25 cycles of1 min at 94◦C, an annealing at 57◦C for 1 min and at 72◦Cfor 2 min, and a final extension of 72◦C during 10 min [38].ME-PCR product was used as template to amplify an internal0.47 kb fragment (Figure S4 see in supplementary Materialavailable at doi: 10.1155/2011/753758). Nested PCR was per-formed with the primers MLf (GGTGGTGTMGGATTCA-CACARTAYGCWACAGC) and MLr (TTCATTGCRTAGT-TWGGRTAGTT) with a GC clamp applying the followingconditions: a denaturing step of 5 min at 94◦C, 5 cycles at95◦C for 40 s, 55◦C for 1 min, 72◦C for 90 s (a ramp of0.1◦C/s was included between the annealing to the extensionsteps), followed by 30 cycles of 95◦C for 40 s, 55◦C for 1 min,72◦C for 90 s, and an extension of 72◦C for 7 min [18]. TheGC clamp was equivalent to 40 bp of GC at the 5′ end inorder to prevent a complete melting of the DNA fragments.Correct length PCR-DGGE products were visualized on0.5 μg/mL ethidium-bromide-stained gels at 2% agarose.
2.6. Denaturing Gradient Gel Electrophoresis (DGGE). Inorder to generate a DGGE pattern, an average of 50–70 μgof DNA from PCR-DGGE products were resolved usinga D-Code Universal Mutation Detection System (BioRadLaboratories) in polyacrylamide gels with a horizontal
denaturant gradient. All DGGE patterns were achieved understandardized denaturant and electrophoretic conditions:constant temperature of 60◦C polyacrylamide composition(acrylamide-N,N′-methylene bisacrylamide, 37 : 1) contain-ing 0–100% of denaturants (7 M urea and 40% formamidedeionized with mixed-bed resin), a running time of 4.5 hrsand a constant voltage of 200 V [39]. High resolving bandpatterns from environmental and culture samples wereobtained as follows (denaturant composition is given inpercentage): for aprA gene fragments, 50–80% from non-axenic cultures, and 40–70% from environmental samples.In mcrA gene fragments from environmental samples, theperformed gradients were done by duplicate at 40–70%and 40–60% to increase the resolution of distance amongbands. The gels were incubated in ethidium bromide for20 min and rinsed in distilled water for 30 min. All singlebands were excised from the gel with scalpels and elutedin 10 μL of milliQ water to avoid desiccation; hereafter,they were stored overnight at 4◦C. DNA was extractedfrom polyacrylamide by electrophoresis in 2% agarose gels(≤40 mA). The agarose bands were filtered through glassfiber columns at 14,000 rpm for 2 min (Hettich Mikro 22 Rcentrifuge). 5–10 μL of the precipitate obtained were usedas DNA template for the band reamplification of mcrAand aprA genes under the same PCR conditions however,a minor fraction of the bands were reamplified. The mcrAand aprA gene PCR products were sequenced using primerpairs APSfw/APSrv and MLf/Mlr in an ABI 377 sequencer(Applied Biosystems). Nucleotide sequences were cleanedand assembled using DNA Baser software (Heracle Software,Germany, http://www.DnaBaser.com/).
2.7. DGGE Band Pattern Analysis. According to the reviewof Fromin et al. [40], DGGE reproducibility mainly relieson the DNA extraction and/or PCR amplification steps;therefore, the fingerprint analysis (DGGE) was processedonce. The reproducibility of DGGE patterns has been testedpreviously by experimenting differences along the procedure,from sampling to PCR amplification conditions; despitethese modifications, the comparison of DGGE patterns wasconsistent showing changes in band intensities only [41].Thereby, the pattern of aprA DGGE gel from environmentalsamples was used to define a dendrogram. Then, the bandswere qualitatively scored as present/absent and no semiquan-titative analyses were performed for band intensity; the bandclustering was performed with the maximum likelihood(ML) restriction analysis (RESTML) included in the PHYLIPv.3.67 package [42].
GenBank Accession Numbers. The nucleotide sequence datareported here are available under the GenBank accessionnumbers: EU722715–EU722732, HM466937–HM466940,HM466943–HM466946 (aprA phylotypes), and EU091355–EU091364, HM466948 (mcrA phylotypes).
2.8. Phylogenetic Analysis. The translations of the aprAand mcrA sequences into amino acids were defined usingthe TRANSLATE tool with a standard code (http://expasy.org/tools/dna.html/). The best frames for all the aprA
International Journal of Microbiology 5
and mcrA fragments were firstly selected by the unstoppedamino acid (aa) sequences and, secondly, by matchingtheir best hits with those compiled in the nonredundantdatabase of the GenBank, which were detected through theBLASTP program (e-value ≤ 10−3) [43]. The final inferredaa sequences were compared against the Swiss Prot andGenBank databases in order to obtain their homologouscounterparts using the WU-BLAST program [44] with asignificant BLASTP e-value ≤ 10−3. From a first approach,we also included aprA and mcrA sequences from reportedenvironmental samples as seed sequences. A complete listof the sequences included in this study to reconstruct aphylogeny for the AprA and McrA enzymes can be seen inSupplementary Material (Tables S1 and S2, resp.).
Different filters were used, from the thousands of col-lected sequences, in order to choose the final candidatesinvolved in the reconstruction of a phylogenetic hypothesis.In this sense, we firstly applied a redundant analysis at90% identity using the CD-HIT program [45]. From theobtained sequences, a second analysis at 100% identity wasdone with the CD-HIT program, which excludes redundantphylotypes (subspecies and variants) of the same species,warranting the diversity of sequences only by includingstrictly different species from the same or different genera.The AprA phylotypes aps cw 1 (EU722715) and aps cw16 (EU722724) showed 100% of identity, as well as thephylotypes aps cw 3 (EU722716) and aps cw 10 (EU722720).Only one sequence was taken as a representative of theidentity cluster to reconstruct the phylogeny. In order tosupport a robust identification in the final phylogeny, weincluded species from the same genera for those cases inwhich the homologous counterparts are closely related to thephylotypes obtained in this work. When it was necessary,individual phylogenetic trees for the Tirez phylotypes weredone previously in order to improve their identification andto select the counterpart sequences for the final phylogeny.The aa sequences obtained from the previous approacheswere then aligned using the CLUSTALX program withdefault parameters [46]. In order to identify an evolutionarysignal from the sequence fragments obtained in this workand their homologous counterparts, we applied a manualand also an automatic approach to edit the alignment.
First, we manually edited the alignment through the useof the BIOEDIT program v.7.0.9 [47] in order to includeonly the functional domains of the α subunits of mcr andapr enzymes. The functional description of these domainsis fully detailed in Section 4 and in the Supplementarymaterial. The N-terminal domain of the α-subunit of theAprA (AprA alpha N) harbors the FAD cofactor-bindingdomain (aa positions: 2–261 and 394–487) and the cappingdomains (aa positions: 262–393). These functional domainshave been characterized from Archaeoglobus fulgidus in thereduced state (FADred-APS, PDB ID: 1JNR) [16] and in theoxidized state (FADox-APS, PDB ID: 2FJA) [48] as well as inDesulfovibrio gigas (PDB ID: 3GYX) [49]. Thus, a total of 100aa sequences were included in the AprA alignment, where 23phylotypes are derived from this work. The AprA alignmentincludes two of the nine (the absent sites are Asn-Nα74,Tyr-Yα95, Glu-Eα141, Val-Vα273, Gly-Gα274, Leu-Lα278, and
Arg-Rα317) functional active sites of the AprA alpha Ndomain: Arg-Rα265 and Trp-Wα234, previously reported [48].See the AprA alignment and catalytic sites in SupplementaryMaterial (Figure S2). On the other hand, the C-terminaldomain of the α-subunit of the McrA enzyme (Mcr alpha C)harbors an all-alpha multihelical bundle domain (PFAMdomain: PF02249). This functional domain has been charac-terized in Methanosarcina barkeri (PDB ID: 1E6Y, C-terminaldomain: 328–460) [50], Methanothermobacter thermoau-totrophicus (PDB ID: 1MRO, C-terminal domain: 315–440)[51], and Methanopyrus kandleri (PDB ID: 1E6V, C-terminaldomain: 319–444) [52]. A total of 80 aa sequences, 11 ofthem derived from this work, were included in the McrAalignment. The McrA alignment includes five of the sevenfunctional active sites of the Mcr alpha C domain (absentsites: Asn-Nα481 and Val-Vα482; present sites: Phe-Fα330, Tyr-Yα333, Phe-Fα443, Tyr-Yα444, and Gly-Gα445) [51]. See theMcrA alignment and catalytic sites in the supplementarymaterial (Figure S3).
Finally, we readjusted a final alignment defining theinformative sites and conserving the functional active sitesof the enzymes previously described, through the use ofthe software GBLOCKS v.0.91 [53]. Therefore, the finalalignments were performed on a region of 137 aas for AprAand 139 aas for MrcA, from which 122 and 132 positions wereinvolved in the phylogenetic analysis, respectively. In order toreconstruct a phylogenetic tree, a character-based approachfor the Apr alpha N and Mcr alpha C phylogenetic recon-structions was developed using the PROTPARS programin order to construct a maximum parsimony (MP) treeof sequences. Pyrobaculum aerophilum and Archaeoglobusfulgidus were used as outgroups in the Apr alpha N phy-logeny; whereas Methanopyrus kandleri was used as outgroupin the Mcr alpha C phylogeny. A distance approach for theApr alpha N and Mcr alpha C phylogenetic reconstructionswas also developed using the SEQBOOT program to generate1000 bootstrapped datasets from the sequences, whereby thepseudoreplicates were used in the PROTDIST program inorder to generate a distance matrix through the Jones-Taylor-Thornton (JTT) model of evolution [54]. The evolutionarydistances are in the units of the number of amino acidsubstitutions per site. The rate variation among sites wasmodeled with a gamma distribution estimated previouslyshape parameter = 0.9 for AprA and = 0.8 for McrA.Then, the distance matrix was used in the NEIGHBORprogram to construct a neighbor-joining (NJ) tree [55].The bootstrap consensus tree inferred from 100 replicatesis taken to represent the evolutionary history of the taxaanalyzed. Branches corresponding to partitions reproducedin less than 60% bootstrap replicates were collapsed with theCONSENSUS program (default parameters). The percentageof replicate trees (>50%) in which the associated taxaclustered together in the bootstrap test (100 replicates) isshown next to the branches. All these programs belong to thePHYLIP package v.3.68 [42]. No major branching differenceswere detected between the MP and NJ topologies obtainedfor both enzymes. The trees were visualized and reanno-tated using the MEGA and Microsoft Photoshop programs[56].

6 International Journal of Microbiology
2.9. Amino Acid Composition Analysis. We calculated theamino acid composition of all AprA and McrA sequencesused previously to construct the phylogenies. Using the Perlscripting language, a program was written to read eachamino acid sequence (FASTA format) and calculate thefrequency for each amino acid. We also calculated twohalophilia indicators from the amino acid composition ofevery sequence: the PAB factor estimates the surplus of polarand acidic amino acid compared to polar and basic ones (i.e.,PAB = [Asx + Glx] − [Arg + Lys]) [57], and the AB ratio ofthe acidic amino acids Glu and Asp to the basic amino acidsLys, His, and Arg (i.e., AB = [Asp + Glu] : [His + Arg + Lys])[21]. We divided the amino acid profiles from each markerinto two different data sets in order to calculate an averageand standard deviation of the samples. The first data set isbased on salinity adaptation by dividing sequences in Tirez,halophilic, and nonhalophilic species. The second data set isbased on the species forming the major taxonomic groupsin which the Tirez phylotypes are phylogenetically allocated.For AprA Desulfovibrionales, Desulfobacterales, Peptococ-cales, and Chromatiales; whilst for McrA, Methanomicro-biales and Methanosarcinales. Therefore, A spreadsheet wascreated using Microsoft Excel software for data tabulationand graph construction. See Supplementary Material.
2.10. GC Content and Codon Bias Analyses. We performedthe corresponding nucleotide alignments for all AprA andMcrA sequences used previously to construct the phyloge-nies. In order to reduce the bias of the GC measurementsby the use of sequences with different length and highlydivergent regions (i.e., long indels), we manually editedand readjusted the final alignment. Accordingly, highlyand long divergent regions (insertions and deletions) wereeliminated from the alignment. The final alignments onlyinclude the strict codon positions encoding for the functionaldomains of AprA (375 nucleotide positions, 125 codons) andMcrA (399 nucleotide positions, 133 codons) described onthe phylogenetic analysis section. Using the Perl scriptinglanguage, a program was written to read each nucleotidesequence (FASTA format) and calculate the total nucleotidepercentages as well as at the three individual codon positionsfor each sequence. We divided the GC profiles from each genemarker into the same data sets used to analyze amino acidcomposition (i.e., salinity adaptation and taxonomic clades)in order to calculate an average and standard deviation of thesamples. A correction for the amino acid usage was appliedby the calculation of the relative synonymous codon usage(RSCU) values from the nucleotide datasets based on salinityadaptation: Tirez, halophilic, and nonhalophilic species. TheRSCU for a particular codon (i) is given by: RSCUi =Xi/∑∑
Xi/n, where Xi is the number of times the codonhas been used for a given amino acid and n is the numberof synonymous codons for that amino acid. RSCU values arethe number of times a particular codon is observed, relativeto the number of times that the codon would be observedin the absence of any codon usage bias [58]. In the absenceof any codon usage bias, the RSCU value would be 1.00. Acodon that is used less frequently than expected will havea value of less than 1.00 and vice versa for a codon that is used
more frequently than expected. Finally, a spreadsheet wascreated using Microsoft Excel software for data tabulationand graph construction. See supplementary material.
3. Results
3.1. Physicochemical Characterization. Sediment cores fromTirez Lagoon sampled at different depths were subjectedto physicochemical analysis. Sulfide showed higher concen-trations at the zone of 0–10 cm depth (Figure 1(a)). Theoccurrence and distribution of sulfide along the depth profilecan reflect a biogenic origin by the presence of sulfate-reducing bacteria (SRB) in the hypersaline sediment. Theconcentration of H2S coincided with the presence of a blackdeposit of iron sulfide mainly in winter (Figure 2). Sulfatelevels increased with depth, its concentration ranging at0.2 M, and the highest values were detected at 10–15 cm indepth (≤300 mM), just below the highest concentration zoneof sulfide (Figure 1(a)). The complete sediment profile wasanoxic and in accordance with a negative redox potential(Figure 1(b)). The redox potential and oxygen levels slightlyincreased in the deepest zones (15–20 cm in depth). Theredox conditions of most part of the sediment core were inthe range of −300 and −200 mV, low enough to allow SRand MT activities [59]. The lowest Eh values were reachedat 0–10 cm in depth and coincided with the increase in sul-fide concentration (Figure 1(b)). Ammonium concentrationfluctuated between 1 and 6 μM. Likewise, the highest NH4
+
concentration (4–6 μM) was observed at 10–15 cm in depth(Figure 1(c)). The Cl : SO4 proportion fluctuated between 0.1and 0.3, these ratios are lower than the values reported inthe saltern [60] and they reflect the athalassic nature of thesystem. Sulfate concentration in Tirez Lagoon was lower thanin the also athalassic Chaka Lake sediment (10−1 mM). Eventhough chloride was undetermined in Chaka Lake sediment,its Cl : SO4 proportion is two times higher than the highestvalue registered at Tirez Lagoon [61]. Figure 1(d) shows thepH course on sediment depth; it is possible to observe thecharacteristic neutral pH of the system as well as a slightacidification, probably a consequence of biological volatilefatty acids (VFA) formation and sulfate reduction processes.The C : N ratio determined in the samples showed valuescharacteristic of low photoautotrophic activity at the surface[62] starting at >6 at 0–5 cm depth (Figure 1(d)). Therefore,preferential nitrogen mineralizers should be found at thesurface preceding carbon mineralizers at deeper zones.Figure 1(e) describes that divalent cations dominate overmonovalents. Finally, the ratio (Na+ + K+)/(Mg2++ Ca2+) inTirez is between 1.8 and 0.09, whilst in Salt Lake is >9.0 [9].
3.2. DGGE Patterns from aprA and mcrA Gene Fragments. Weapplied a denaturing gradient gel electrophoresis (DGGE)fingerprinting analysis through the use of two functionalgenes: adenosine-5′-phosphosulfate reductase (Apr) and themethyl coenzyme-M reductase (Mcr), in order to identifyecotypes from the sediments samples and nonaxenic culturesof Tirez Lagoon. AprA DGGE profiles are presented inFigure 3 and McrA DGGE profile in Figure 4. Thus, we

International Journal of Microbiology 7
20 40
100 200
SO42− (mM)
H2S (μM)
Sedi
men
tde
pth
(cm
)
5
10
(a)
0.5 1
−350 −250 −150
Eh (mV)O2 (μM)
(b)
1 2 3 4 5
20 40
Cl− (mM)NH4
+ (mM)
(c)
7.2 7.6
10 20
pH
Sedi
men
tde
pth
(cm
)
5
10
C : N
(d)
10 30 50
100 200
Ca2+ (mM)Mg2+ (mM)
K+ (mM)Na+ (mM)
(e)
Figure 1: Profiles plotting depth against physicochemical parameters measured in Tirez sediments from winter cores. (a) Sulfide and sulfate;(b) Redox potential (Eh) and oxygen; (c) chloride and ammonium; (d) pH and C : N ratio; (e) magnesium, calcium, potassium, and sodium.

8 International Journal of Microbiology
10 cm
Winter
(a)
Summer
(b)
Figure 2: Cores of sediments of Tirez ephemeral lagoon for analysis collected from winter and summer showing the dark zone in the upperregion probably due to metal sulfide precipitation. The evaporite is founded in summer sample.
obtained sequences of diverse phylotypes from DGGE pro-files representing the bulk content of three sampling points ofthe lagoon salt pan. The bands were prefixed as aps and mcr(from the gene marker) and subfixed as cw (from nonaxeniccultures obtained in winter) and ew and es (environmentalsediment sampled in winter and summer, resp.).
The aprA DGGE pattern from sediment profile(Figure 3(b)) revealed the presence of a more complexbanding pattern in comparison with the profile fromnonaxenic cultures (Figure 3(a)). At 15–25 cm depth, lowyield or no PCR product was obtained (Figure 3(b) lane5). Given that a considerable number of environmentalbands from the aprA DGGE profile could not be sequencedor specifically identified, probably due to the presence ofresidual PCR inhibitors such as humic acids coextracted withgenomic DNA [63] that were not purified by the JetQuickkit and that comigrate with DNA in the polyacrylamidegel [64] changes in population distribution were estimatedthrough the use of P-analysis with Maximum Likelihood(ML) in Phylip software in order to identify a significantclustering. Bands were taken as species, and patterns wereconstructed by presence and absence. The clustering patternis shown in Figure 3(c), and it was more in accordance witha disturbance due to seasonality instead of sediment depth.Additionally, P value showed no significant differencesbetween nodes W and S being P ≤ 0.05 as significant toreject the hypothesis that two population sets were derivedfrom the same communities.
From previous studies carried out in thalassic commu-nities, where salt gradient is between 8 and 20% (within
the range of Tirez), it has been reported that the rate ofmethanogenesis is below 0.1% of the total sulfate-reductionproductivity [65]. Therefore, a lower abundance of MA wasexpected in Tirez sedimentary community it is inferred fromthe lower Cl : SO4 ratio. In addition, the population sizethreshold for DGGE detection is ≤1% [39]. Thereby, we hadto perform a nested PCR from the mcrA gene in order toimprove the detection of the MA community in the sedimentsamples from Tirez. We firstly obtained a 0.76 kb mcrAfragment through the ME primer pair. Because such a lengthis inadequate to obtain a discernible DGGE pattern [66] anddue to low yield in ME amplicons, a small 0.47 kb mcrAfragment nested in the ME region was amplified throughthe ML primer pair (supplementary material, Figure S4).In agreement with Juottonen and collaborators [67], nodifferences in the diversity of MA organisms were expectedfrom the use of ME and ML PCR products. DifferentDGGE gradients for the ML-PCR products were tested inorder to obtain the best pattern resolution. We detectedtwo distinctive but adjacent bands in all DGGE winterprofiles (e.g., mcr-ew1 and mcr-ew2) obtained throughseveral gradients (Figures 4(a) and 4(c), 40–70% and 40–60% gradients, resp.). A pattern of bands in pairs is a resultof the low DGGE resolution, where two DNA fragmentsdiffer in one or few bases due to the use of ambiguousprimers [66]. Though ME-ML primers are ambiguous (seeSection 2), the phylotypes were placed in different ordersin methanogenic archaea. Thereby, nucleotide sequenceshave similar electrophoretic mobilities but they representdifferent sequences and, thus, a double band was ruled out.

International Journal of Microbiology 9
0–5
cw cw cw
cw1
cw2
cw3
cw4cw5
cw6
cw8
cw10cw11cw12
cw13
cw16
cw20
5–10 10–5
(a)
ew13
ew11
ew12
ew17
ew3
ew4
ew7
ew8
es22
es23
es24
es25
es28
es29
es es esew ew
0–5 0–55–15 5–15 15–25
(b)
W
S
ew (5–15 cm)
ew (0–5 cm)
es (15–25 cm)
es (5–15 cm)
ew (0–5 cm)
0.1
(c)
Figure 3: DGGE pattern of PCR-amplified aprA gene fragments from nonaxenic SRP cultures (a) and sediment samples (b). (a) seriesof DGGE patterns obtained from nonaxenic cultures inoculated from winter sediment (cw); (b) Series of DGGE patterns obtained fromenvironmental samples: winter (ew) and summer (es) obtained from different depths (cm). The aprA gene fragment from 15–25 cm depth(winter) was not amplified. (c) Maximum Likelihood cluster analysis of the B-pattern DGGE profile the scale bar represents expectednumbers of base substitutions.
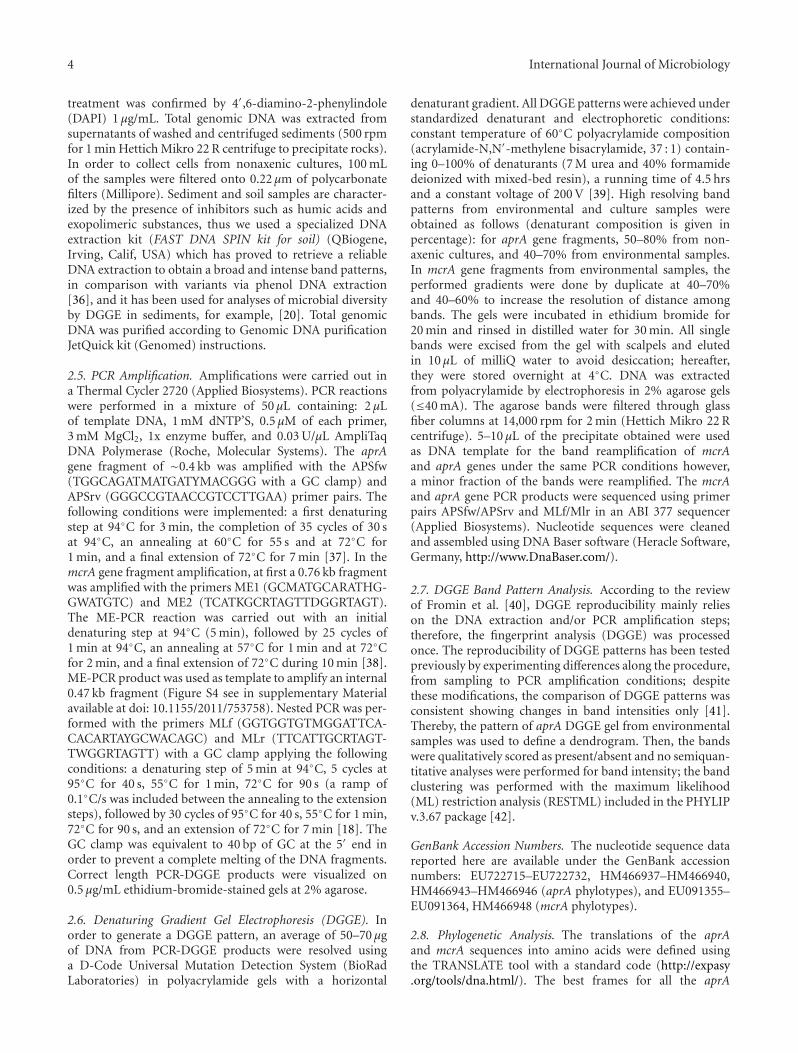
We also obtained a DGGE pattern from sediment sampled inflooded and dry seasons at different depths (Figure 4(c)). It isinteresting to note that the mcr-ew1 band (marked in Figures4(a) and 4(c)) appeared uniquely associated with floodedseason at 0–5 cm in depth (Figure 4(c)).
3.3. Phylogenetic Diversity of Sulfate-Reducing, Sulfate-Oxidi-zing and Methanogenic Organisms. Phylogenetic reconstruc-tions were done for the inferred amino acid (aa) sequencesof aprA and mcrA gene markers and their homologouscounterparts. We decided to analyze aa instead of nucleotidesbecause the latter reduces the inherent variation seen inprotein sequences, except for the third codon base. Wedefined two regions of unambiguously aligned aa, the firstone located in the N-terminal domain (137 aas) for the αsubunit of AprA (AprA alpha N), and the second one locatedin the C-terminal domain (139 aas) of the α subunit of
McrA (MrcA alpha C), both of them containing some ofthe catalytic sites involved in their metabolic role (supple-mentary material, Figures S2 and S3, resp.). It is importantto note that not only the phylogenetic topologies obtainedfor the AprA alpha N and McrA alpha C sequences arerobust, as can be seen by the significant bootstrap valuesin the main clustering branches, but also the internalgroups are supported by the expected clustering of theMcrA and AprA crystals previously characterized for (a) theMcrA in Methanosarcina barkeri belonging to Methanosarci-nales [50], Methanothermobacter thermoautotrophicus fromMethanobacteriales [51] and Methanopyrus kandleri inMethanopyrales [52]; (b) the AprA from Archaeoglobusfulgidus in Euryarchaeota [16], and Desulfovibrio gigas inDeltaproteobacteria [49].
The phylogenetic analysis of the 25 AprA Tirez sequencesis presented in Figure 5. This analysis included representativespecies from diverse SRP and SOP taxonomic groups such
10 International Journal of Microbiology
0–5
ew1
ew2
ew3
ew
(a)
0–5 5–15 15–25 25–35
ew1
ew2
ew4 ew5 ew6
ew ew ew ew
(b)
0–5 5–15 15–250–5 5–15 15–25 25–35ew1
ew2
ew ew ew ew
ew7
es1
es2 es3 es4
No band
es es es
(c)
Figure 4: DGGE pattern of PCR-amplified McrA gene fragments from environmental sediment samples. (a) winter pattern (0–5 cm depth),(b) winter patterns obtained from different depths, and (c) Winter (ew) and summer (es) patterns from different depths (cm). Bands acrossseveral lanes were identified as being in the same genera, and the arrow for ew1 shows its absence in the 0–5 cm depth summer sample (es).Band mcr-es5 is not shown in the figure.
as Euryarchaeota, Crenarchaeota, Firmicutes, β, γ, and∂-proteobacteria (supplementary material, Table S1). Themajor fraction (16 phylotypes) was affiliated to the SRP.Some of the environmental AprA phylotypes were notresolved at genera level, and the result has been discussedfor the next taxonomic rank. Cultured and environmen-tal SRP populations were identified as follows: culturedphylotypes (Desulfohalobiaceae, Peptococcaceae, and Desul-fobacteraceae) and environmental phylotyeps (Desulfobac-teraceae, and Peptococcaceae). One cluster formed by threephylotypes (aps-cw2, -cw4, and -cw5) was closely relatedto the halotolerant and alkaliphilic Desulfonatronovibriohydrogenovorans. Interestingly, the summer sediment did notreveal the presence of species in the haloadapted Desul-fohalobiaceae. Twelve phylotypes obtained from sediment(summer and winter) and enrichments were related to theacetoclastic and nonhalophilic species Desulfonema magnum.Two phylotypes (aps-cw6 -es29) were identified as Pepto-coccaceae. Whilst the phylotype aps-cw6 was conclusivelyaffiliated to Desulfotomaculum solfataricum belonging toFirmicutes, the phylotype aps-es29 was not resolved atgenera level; however, aps-es29 was allocated basal to therepresentative Firmicutes taxa used in this study. Actually,the affiliation of phylotype aps-es29 and other SOP Tirezphylotypes could become particularly uncertain given thewell-known horizontal APS reductase (Apr) gene transfer(HGT) events between the SRPs from Firmicutes and δ-proteobacteria as well as between the SOPs from β and γ-proteobacteria, respectively (see Figure 5). Both main Apr-HGT events are identified in this work and are in accordancewith previous phylogenetic studies [68].
In four of the environmental SOP phylotypes (aps-ew7,-ew8, and -ew13, aps-es28), the assignment of the aprA genefragment could not be conclusive at species level; thus, adetailed function in Tirez’s system remains uncertain. Theclosest clade for three phylotypes was a group of nonculturedmicroorganisms (endosymbionts) in Hydrogenophilaceae inβ-proteobacteria. The phylotype from summer sediment(aps-es28) remained unidentified at species level, and treetopology helped to designate it as γ-proteobacteria. Theenvironmental phylotype aps-ew3 was conclusively affiliatedto endosymbionts and close to Thiotrichaceae and Chro-matiaceae in γ-proteobacteria. Other three phylotypes werederived from enrichment (aps-cw11, -cw12, and -cw13) and
resulted with a short distance with the cultured haloalka-liphilic purple bacteria Thioalkalivibrio (Ectothiorhodospir-aceae) in γ-proteobacteria.
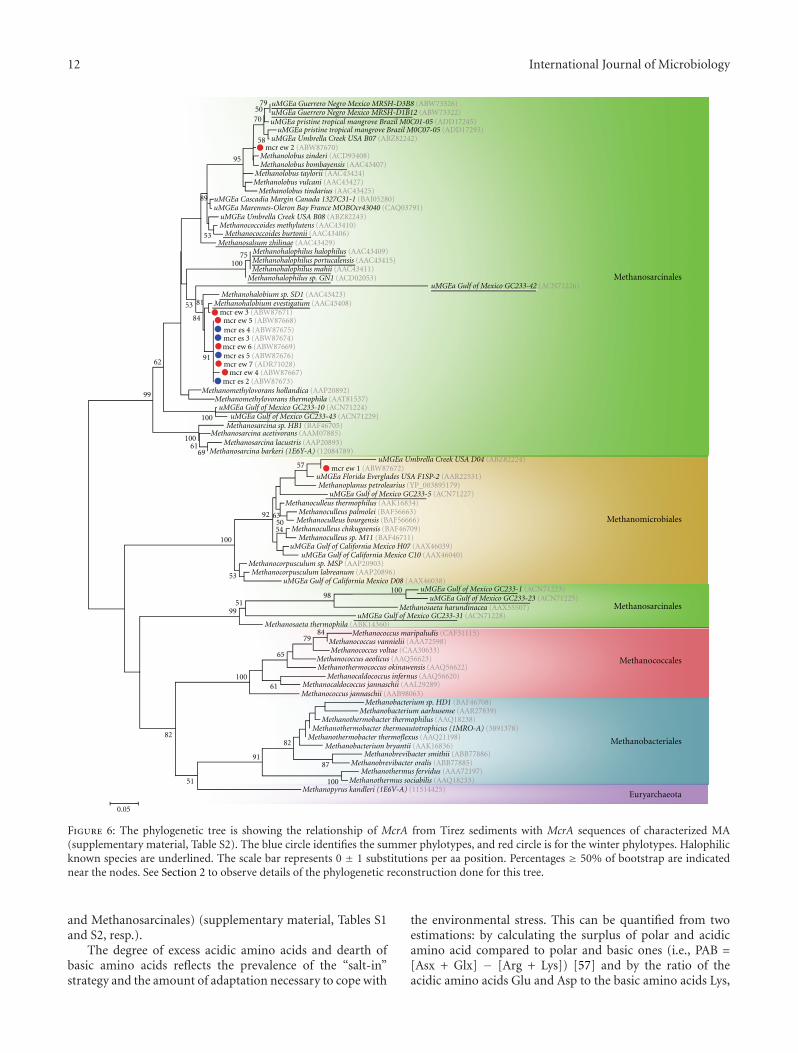
The phylogenetic reconstruction of the eleven McrAsequences obtained from the anoxic Tirez sediments isshown in Figure 6. This analysis included representativeMA species within Methanomicrobiales, Methanosarcinales,Methanococcales, and Methanobacteriales (supplementarymaterial, Table S2). The phylogenetic tree allowed the identi-fication of McrA phylotypes belonging to the Methanosarci-naceae and Methanomicrobiaceae. Nine phylotypes wereproximate to Methanohalobium evestigatum often found inhigh-salt environments. In the same way, phylotype mcr-ew2 was closely related to Methanolobus zinderi. Finally, thephylotype mcr-ew1 closely clustered to the hydrogenotrophicand nonosmoadapted species Methanoplanus petrolearius.
3.4. Amino Acid Composition, GC content, and Codon UsageBias in AprA and McrA Phylotypes. The aa composition andGC content in proteins from “salt-in” halotolerant organ-isms have been related to adaptations to high intracellularconcentration in order to favor an osmotic balance withinan hypersaline environment [23, 25]. Given that the catalysisof AprA and McrA enzymes occur in the cytoplasm, wewere interested in determine whether Tirez AprA and McrAsequences show a bias when compared to their halophilicand nonhalophilic homologous counterparts. Thus, wecalculated the aa composition from the alignment usedto reconstruct the phylogeny in order to estimate thehydrophobic (Gly, Leu, Val, Ile, Phe, Met, Ala, Trp, and Pro),polar (Ser, Thr, Cys, Tyr, Gln, and Asn), basic (His, Arg, andLys) and acidic (Glu and Asp) contents of the AprA and McrAenzyme fragments analyzed in this study. Additionally, weused the nucleotide alignment that covers the aa positionsselected to reconstruct the phylogeny for each gene marker inorder to estimate the general codon bias GC content and therelative synonymous codon usage (RSCU) (see Section 2).For this purpose, we divided the sequence profiles fromeach gene markers into two data sets the first one is basedon salinity adaptation (Tirez, halophilic and nonhalophilicspecies) and the second one is based on the major taxonomicgroups in which the Tirez phylotypes are phylogeneticallyallocated (AprA: Desulfovibrionales, Desulfobacterales, Pep-tococcales, and Chromatiales; McrA: Methanomicrobiales

International Journal of Microbiology 11
aps es 22 (ADR71025)
aps es 23 (ADR71026)
aps cw 8 (ACF15335)9963
71
65
9760
89
727095
9492
9996
81
51
51
81
50
50
59
57
53
83
5999
93
98
52
95
51
76
93
92
95
0.1
99
76
68
99
99
99
96
67
85
75
Desulfobacterium indolicum (ABR92477)
Desulfosarcina variabilis (ABR92511)Desulfonema limicola (ABR92505)Desulfococcus sp. DSM8541 (ABR92501)
Desulfobacter sp. DSM2057 (ABR92473)
Desulfocella halophila (AAL57384)Desulforegula conservatrix (ABR92509)
Desulfobacula toluolica (ABR92493)Desulfospira joergensenii (ABR92513)
Desulfonema ishimotonii (AAL57402)Desulfatibacillum alkenivorans (YP_002430735)
Desulfobacterium autotrophicum (YP_002601730) Desulfobacterium sp. PM4 (ABR92481) Desulfobacterium zeppelini (ABR92489)
Desulforhopalus vacuolatus (ABR92535) Desulfobulbus marinus (ABR92523)
Desulfonatronovibrio hvdrogenovorans (ABR92460) Desulfomicrobium baculatum (ABR92454)
Desulfocaldus sp. Hobo (ABR92452) Desulfothermus naphthae (ABR92458)
Desulfonauticus autotrophicus (ABR92464) Desulfonatronum lacustre (AAL57404)
Desulfovibrio sulfodismutans (ABR92450)
Desulfovibrio sp. DSM9953 (ABR92432)
aps ew 13 (ACF15345)
aps ew 7 (ADR71022) aps ew 8 (ADR71023)
aps ew 3 (ACF15344)
aps es 29 (ACF15348)
aps cw 6 (ACF15334)
aps cw 13 (ACF15339) aps cw 12 (ACF15338)
aps cw 11 (ACF15337)
aps es 28
Desulfotomaculum halophilum (AAL57434)
Desulfotomaculum thermobenzoicum (ABR92590) Desulfotomaculum thermoacetoxidans (ABR92588)
Desulfotomaculum luciae (ABR92571) Desulfotomaculum sp. DSM8775 (ABR92586)
Desulfotomaculum solfataricum (ABR92576)
Desulfotomaculum alkaliphilum (AAL57421) Desulfotomaculum acetoxidans (AAL57420)
Desulfacinum hydrothermale (AAL57415) Syntrophobacter fumaroxidans (YP_845177)
Desulfomonile tiedjei (ABR92551)
Desulforhabdus sp. DDT (ABR92557)
Desulfarculus baarsii (ABR92547)
Thiothrix nivea (ABV80025) Thiothrix sp. 12730 (ABV80023)
Thiodictyon bacillosum (ABV80017)
Thermodesulfatator indicus (ABR92416) Thermodesulfobacterium hveragerdense (ABR92414)
Thermodesulfovibrio yellowstonii (ABR92418) Thermacetogenium phaeum (ABR92597)
Thermodesulforhabdus norvegica DSM9990 (ABR92558) Thermodesulforhabdus norvegica DSM9990 (AAL57426)
Thiococcus pfennigii (ABV80070)
Thiocystis violacea (ABV80082)
Thiorhodovibrio winogradskyi (ABV80076) Thiohalocapsa halophila (ABV80050)
Thioalkalivibrio sp. K90mix (ZP_03690634)
Thiorhodococcus minor (ABV80084)
Thiolamprovum pedioforme (ABV80068)
Pyrobaculum aerophilum (NP_560100)
(NP_070498)
Archaeoglobus veneficus (ABR92410) Archaeoglobus profundus (ABR92408)
Archaeoglobus fulgidus DSM4304 (2FJA-A) Archaeoglobus fulgidus DSM4304 (1JNR-A)
Thiocapsa rosea (ABV80104)
Halochromatium glycolicum (ABV80054) Chromatium okenii (ABV80056)
Rhabdochromatium marinum (ABV80078)
Thermochromatium tepidum (ABV80058) Allochromatium warmingii (ABV80048)
Lamprocystis purpurea (ABV80005)
Desulfovibrio desulfuricans (YP_387606)
Thiobacillus denitrificans (YP_316040) Thiobacillus thioparus (ABV80027)
Thiobacillus plumbophilus (ABV80021) endosymbiont of Oligobrachia haakonmosbiensis (CAP03144)
endosymbiont of Inanidrilus leukodermatus (ABV80039)
endosymbiont of Sclerolinum contortum (CAP03145)
endosymbiont of Lucinoma aff. kazani (CAJ85653)
Desulfovibrio piger (AAL57396)
Desulfohalobium retbaense (ABR92456) Desulfovibrio gigas (3GYX-A) (281307059)
aps cw 4 (ACF15341) aps cw 5 (ACF15333)
aps cw 2 (ACF15342)
aps cw 1 [aps cw 16] (ACF15331, ACF15340)
aps cw 3 [aps cw 10] (ACF15332, ACF15336)
aps ew 17 (ADR71024)aps ew 4 (ADR71021)
Desulfonema magnum (ABR92507)
aps es 25 (ACF15347)
aps cw 20 (ADR71020)
aps es 24 (ACF15346)
δ-proteobacteria
δ-proteobacteria
β + γ proteobacteria
ThermodesulfobacteriaNitrospirae
Firmicutes
Firmicutes
γ-proteobacteria
Euryarchaeota
(HM466946)
Crenarchaeota
Figure 5: The phylogenetic tree is showing the relationship of AprA sequences from environmental samples and nonaxenic cultures fromTirez sediments and aprA sequences of characterized SRP and SOP (supplementary material, Table S1). The blue circle identifies the summerphylotypes and red circle is for the winter phylotypes. Halophilic known species are underlined. Same species from different strain withinteresting amino acid changes from basic (Lys and K) to polar (Gln, Q and Asn, N) are marked with grey squares (see supplementary FigureS2). The number of redundant phylotypes defined by an identity of 100% is indicated in parenthesis after the accession number. The scalebar represents 0 ± 1 substitutions per aa position. Percentages ≥ 50% of bootstrap are indicated near the nodes. See Section 2 to observedetails of the phylogenetic reconstruction done for this tree.
12 International Journal of Microbiology
uMGEa Guerrero Negro Mexico MRSH-D3B8 (ABW73326)uMGEa Guerrero Negro Mexico MRSH-D1B12 (ABW73322)
uMGEa Gulf of Mexico GC233-42 (ACN71226)
uMGEa Gulf of Mexico GC233-10 (ACN71224)
uMGEa Gulf of Mexico GC233-5 (ACN71227)
uMGEa Gulf of Mexico GC233-1 (ACN71223)uMGEa Gulf of Mexico GC233-23 (ACN71225)
uMGEa Gulf of Mexico GC233-31 (ACN71228)Methanosaeta harundinacea (AAX55507)
Methanococcus maripaludis (CAF31115)Methanococcus vannielii (AAA72598)Methanococcus voltae (CAA30633)
Methanococcus aeolicus (AAQ56623)
Methanococcus jannaschii (AAB98063)Methanobacterium sp. HD1 (BAF46708)
Methanobacterium aarhusense (AAR27839)
Methanobacterium bryantii (AAK16836)Methanobrevibacter smithii (ABB77886)
Methanobrevibacter oralis (ABB77885)Methanothermus fervidus (AAA72197)
Methanothermus sociabilis (AAQ18233)Methanopyrus kandleri (1E6V-A) (11514425)
Methanothermococcus okinawensis (AAQ56622)
Methanothermobacter thermophilus (AAQ18238)Methanothermobacter thermoautotrophicus (1MRO-A) (3891378)
Methanothermobacter thermoflexus (AAQ21198)
Methanocaldococcus infernus (AAQ56620)Methanocaldococcus jannaschii (AAL29289)
Methanosaeta thermophila (ABK14360)
uMGEa Gulf of California Mexico H07 (AAX46039)uMGEa Gulf of California Mexico C10 (AAX46040)
uMGEa Gulf of California Mexico D08 (AAX46038)
uMGEa Gulf of Mexico GC233-43 (ACN71229)
uMGEa pristine tropical mangrove Brazil M0C01-05 (ADD17245)uMGEa pristine tropical mangrove Brazil M0C07-05 (ADD17293)
uMGEa Umbrella Creek USA B07 (ABZ82242)
uMGEa Umbrella Creek USA B08 (ABZ82243)
uMGEa Umbrella Creek USA D04 (ABZ82224)
uMGEa Florida Everglades USA F1SP-2 (AAR22531)
uMGEa Cascadia Margin Canada 1327C31-1 (BAJ05280)uMGEa Marennes-Oleron Bay France MOBOcr43040 (CAQ03791)
Methanolobus zinderi (ACD93408)Methanolobus bombayensis (AAC43407)
Methanolobus taylorii (AAC43424)
Methanolobus tindarius (AAC43425)Methanolobus vulcani (AAC43427)
Methanococcoides methylutens (AAC43410)Methanococcoides burtonii (AAC43406)
Methanohalophilus halophilus (AAC43409)Methanosalsum zhilinae (AAC43429)
Methanohalophilus portucalensis (AAC43415)Methanohalophilus mahii (AAC43411)
Methanohalophilus sp. GN1 (ACD02053)
Methanohalobium sp. SD1 (AAC43423)Methanohalobium evestigatum (AAC43408)
Methanomethylovorans hollandica (AAP20892)Methanomethylovorans thermophila (AAT81537)
Methanosarcina sp. HB1 (BAF46705)
Methanosarcina lacustris (AAP20893)
Methanoplanus petrolearius (YP_003895179)
Methanoculleus thermophilus (AAK16834)Methanoculleus palmolei (BAF56663)
Methanoculleus bourgensis (BAF56666)Methanoculleus chikugoensis (BAF46709)
Methanoculleus sp. M11 (BAF46711)
Methanocorpusculum sp. MSP (AAP20903)Methanocorpusculum labreanum (AAP20896)
Methanosarcina barkeri (1E6Y-A) (12084789)
Methanosarcina acetivorans (AAM07885)
mcr ew 5 (ABW87668)
mcr ew 6 (ABW87669)
mcr ew 7 (ADR71028)mcr ew 4 (ABW87667)
mcr ew 1 (ABW87672)
mcr es 3 (ABW87674)
mcr es 5 (ABW87676)
mcr es 2 (ABW87673)
mcr es 4 (ABW87675)
mcr ew 3 (ABW87671)
mcr ew 2 (ABW87670)
79
70
75100
100
100
100
100
100
100
81
91
99
61
62
69
57
53
65
84
82
87
82
51
61
91
51
0.05
5054
92
99
79
98
63
84
50
58
53
53
95
89
Methanosarcinales
Methanosarcinales
Methanomicrobiales
Methanococcales
Methanobacteriales
Euryarchaeota
Figure 6: The phylogenetic tree is showing the relationship of McrA from Tirez sediments with McrA sequences of characterized MA(supplementary material, Table S2). The blue circle identifies the summer phylotypes, and red circle is for the winter phylotypes. Halophilicknown species are underlined. The scale bar represents 0 ± 1 substitutions per aa position. Percentages ≥ 50% of bootstrap are indicatednear the nodes. See Section 2 to observe details of the phylogenetic reconstruction done for this tree.
and Methanosarcinales) (supplementary material, Tables S1and S2, resp.).
The degree of excess acidic amino acids and dearth ofbasic amino acids reflects the prevalence of the “salt-in”strategy and the amount of adaptation necessary to cope with
the environmental stress. This can be quantified from twoestimations: by calculating the surplus of polar and acidicamino acid compared to polar and basic ones (i.e., PAB =[Asx + Glx] − [Arg + Lys]) [57] and by the ratio of theacidic amino acids Glu and Asp to the basic amino acids Lys,

International Journal of Microbiology 13
0
0.5
1
1.5
2
2.5
3
3.5
4
4.5
5
0
1
2
3
4
5
6
7
8
9
HalophilesTirez
RSCU halophilesRSCU Tirez
UU
U(F
)U
UC
(F)
UU
A(L
)U
UG
(L)
CU
U(L
)C
UC
(L)
CU
A(L
)C
UG
(L)
AU
U(I
)A
UC
(I)
AU
A(I
)A
UG
(M)
GU
U(V
)G
UC
(V)
GU
A(V
)G
UG
(V)
UC
U(S
)U
CC
(S)
UC
A(S
)U
CG
(S)
CC
U(P
)C
CC
(P)
CC
A(P
)C
CG
(P)
AC
U(T
)A
CC
(T)
AC
A(T
)A
CG
(T)
GC
U(A
)G
CC
(A)
GC
A(A
)G
CG
(A)
UA
U(Y
)U
AC
(Y)
CA
U(H
)C
AC
(H)
CA
A(Q
)C
AG
(Q)
AA
U(N
)A
AC
(N)
AA
A(K
)A
AG
(K)
GA
U(D
)G
AC
(D)
GA
A(E
)G
AG
(E)
UG
U(C
)U
GC
(C)
UG
G(W
)C
GU
(R)
CG
C(R
)C
GA
(R)
CG
G(R
)A
GU
(S)
AG
C(S
)A
GA
(R)
AG
G(R
)G
GU
(G)
GG
C(G
)G
GA
(G)
GG
G(G
)
UA
A(∗
)U
AG
(∗)
UG
A(∗
)Nonhalophiles RSCU nonhalophiles
Figure 7: Correspondence analysis of relative synonymous codon usage (RSCU) for AprA sequences from halophiles, nonhalophiles, andTirez phylotypes. The distribution of all codons (including the start and stop codons∗) for every amino acid across the three datasets isshown on the X-axis. The frequency of each codon (%) is represented with bars on the left Y-axis. RSCU values for each codon across thethree datasets are represented with differentiated dots on the right Y-axis. In the absence of any codon usage bias, the RSCU value wouldbe 1.00. A codon that is used less frequently than expected will have a value of less than 1.00 and vice versa for a codon that is used morefrequently than expected.
His, and Arg (i.e., AB = [Asp + Glu] : [His + Arg + Lys])[21]. On average, the amino acid composition measurements(Table 1) indicated that AprA Tirez phylotypes (PAB =2.87, AB = 0.62) were from similar to slightly higher incomparison with halophilic (PAB = 2.70, AB = 0.59) andnonhalophilic sequences (PAB = 2.35, AB = 0.62). However,the observed differences in PAB and AB indicators betweenTirez phylotypes and halophilic species are out of proportionto argue a “salt-in” signal in Tirez phylotypes given thatAprA differences are more than ten times less the differencebetween Escherichia coli and Halobacterium salinarum orHalomonas elongata and Halobacterium salinarum [57].
The total GC content of AprA Tirez phylotypes, halo-philes, and nonhalophiles organisms is 57.60%, 55.70%, and55.00%, respectively. The GC content of Tirez phylotypesis higher than the reported for Escherichia coli (50.3%) butlower than the extreme halotolerant species from the DeadSea metagenome (62–67%) and Halobacterium salinarum(65.7%) (Table 1). A codon usage in AprA Tirez phylotypesis consistent with that expected, when corrected for GCcomposition (Figure 7). In comparison to halophiles andnonhalophiles, AprA Tirez phylotypes show a significant
overrepresentation of amino residues with a preferential usefor a G or C in the third or first position: Val (GUC), Ser(UCC), Gln (CAG), Lys (AAG), Asn (AAC), Asp (GAC), andGlu (GAA). Even though Arg (CGG, AGG), Ala (GCG), andCys (UGC) are underrepresented amino acids in AprA Tirezphylotypes as well as Leu (CUG) and Gly (GGC, GGG) donot show compositional differences when compared withhalophiles and nonhalophiles sequences (supplementarymaterial, Figure S1b), all of them show a significant codonusage with GC bias (RSCU > 1.5) (Figure 7). Accordingly,the first, second, and third codon positions of AprA Tirezphylotypes have GC percentages of 54.2%, 42.4%, and76.0%, respectively, and they agree with the GC contentvalues previously reported in some “salt-in” halophiles(Table 1), with high GC content and a third position GC bias[21, 29]. Similar trends on aa composition and GC contentcan be seen for the AprA clades (Table S3 and Figure S1).
A slighter segregation of the McrA Tirez phylotypes fromthe nonhalophilic species is shown in Table 1. Accordingly,the AB indicator for McrA phylotypes was slightly lower(1.50) in comparison with the average of halophilic (1.67)and nonhalophilic species (1.75), whilst an opposite trend

14 International Journal of Microbiology
Table 1: The amino acid composition and G + C content of Tirez McrA and AprA sequences, their halophilic and nonhalophilic homologouscounterparts, metagenomes, and reference strains.
Acid Asx +Glx
Acid − Basic6
(Asx + Glx) −(Arg + Lys)
Acid : Basic7
(Asp + Glu) : (His+ Arg + Lys)
Lys Asp : Lys ArgG + C % in
totalsequence8
G + C % inthird codon
position8
AprA
Tirez1 15.90 ± 2.24 2.87 ± 2.54 0.62 ± 0.13 6.90 ± 1.40 0.35 ± 0.22 6.14 ± 0.90 57.60 ± 4.56 76.00 ± 9.99
Halophilic species2 14.90 ± 2.74 2.70 ± 3.02 0.59 ± 0.18 6.20 ± 0.90 0.30 ± 0.09 6.02 ± 0.59 55.70 ± 7.56 66.50 ± 20.70
Nonhalophilicspecies2 15.00 ± 1.95 2.35 ± 2.13 0.62 ± 0.12 6.30 ± 1.10 0.35 ± 0.11 6.34 ± 0.68 55.00 ± 6.94 65.50 ± 19.02
mcrA
Tirez1 22.07± 0.23 16.62 ± 0.24 1.50 ± 0.00 3.38 ± 0.62 2.04 ± 0.37 2.07 ± 0.40 47.20 ± 3.40 46.10 ± 11.70
Halophilic species3 21.09 ± 0.52 15.99 ± 0.76 1.67 ± 0.10 3.54 ± 0.29 2.08 ± 1.83 1.56 ± 0.00 51.50 ± 5.20 57.00 ± 12.60
Nonhalophilicspecies3,4 21.75 ± 1.22 16.44 ± 1.63 1.75 ± 0.35 3.65 ± 0.99 2.08 ± 0.80 1.67 ± 0.3 50.30 ±7.20 56.30 ± 21.30
Metagenomic7
Dead Sea n.d. n.d. 1.46 n.d. n.d. n.d. 62–67 n.d.
Reference strains5
Halobacteriumsalinarum
31.80 25.36 n.d. 2.34 ± 0.04 n.d. 4.10 ± 0.12 65.7 n.d.
Halomonaselongata
25.98 17.56 n.d. 3.7 n.d. 5.25 n.d. n.d.
Escherichia coli 26.04 15.85 n.d. 6.03 ± 0.14 n.d. 4.16 ± 0.02 50.3–50.9 n.d.1Average composition from amino acid sequences derived from this study.
2Average composition from amino acid sequences listed in supplementary material Table S1.3Average composition from amino acid sequences listed in supplementary material Table S2.4Thermophilic species were not included.5Amino acid composition of the bulk protein content in type species cultures [57].6PAB: amino acid proportions according to [57].7AB: amino proportions according to Rhodes et al.[21].8GC content percentage is calculated as GC% = (G + C/G + C + A + T) ∗ 100.
is shown with the PAB indicator: 16.62 for Tirez, 15.99for halophiles, and 16.44 for nonhalophiles. In contrast tothe AprA Tirez phylotypes, the total GC content (47.20%)and the third codon GC bias (46.10%) are significantlylower than the estimated for halophiles and nonhalophilicspecies (Table 1). The GC content of the first (53.1%) andsecond (42.4%) codon positions does not change the trendof McrA Tirez phylotypes (supplementary material, FigureS3c). Nevertheless, an overrepresentation of amino residuesin McrA Tirez phylotypes with a preferential codon use (incomparison to nonhalophiles sequences only) can be pointedout for Ile (AUU), Pro (CCA), Ala (GCA), Tyr (UAU), andAsn (AAC, AAU). Even though Lys (AAA), Asp (GAU), Ser(UCC, UCU), and Thr (ACA) are underrepresented aminoacids in McrA Tirez phylotypes in comparison to halophilesand nonhalophiles sequences (supplementary material, Fig-ure S1b), all of them show a preferential codon usage.Furthermore, it is important to note that the aa compositionand GC content trends for McrA clade profiles showed adifferentiated tendency in contrast to the estimated averagefrom all McrA Tirez phylotypes (supplementary material,Table S3). The first, second, and third codon position ofMethanomicrobiales present a high GC content values of52.6% (Tirez 54.1%), 40.0% (Tirez 39.1%), and 73.1%(Tirez 77.4%), respectively. Similarly, the polar and acidic
content in Methanomicrobiales (PAB = 17.12 and AB = 1.70)is interestingly higher than the bulk cell protein contentreported for E. coli (15.85) and close to the haloadaptationthreshold of H. elongata (17.56) [57].
4. Discussion
4.1. Identification of Anaerobic Prokaryotes in the Sedimentby Functional Gene Approach. SRP and MA are the frequentecotypes responsible of major biogeochemical processesin sedimentary systems. A functional gene PCR-DGGEapproach was applied to identify these anaerobic ecotypes.Regarding the sediment profile and community structurealong time and depth, the bands identified in the aprADGGE pattern from environmental samples are in agreementwith the presence of black sediments below the evaporitelayer observed in summer and winter seasons (Figure 2).This mineral precipitation and the sulfide detected inthe sediment (Figure 1(a)) are probably attributable to adissimilatory sulfate reduction where MA were also detected(Figure 3(c)). The use of a nested PCR implies additionalamplification cycles, and, thus, it has been used to increasethe visualization sensitivity of species present in low numbersby DGGE [69]. Interestingly, our findings via this approach

International Journal of Microbiology 15
denote a predominance of the SRP-SOP ecotypes over MA,given that we performed the nested-PCR approach to obtaina positive PCR product of mcrA gene fragment, whilst it wasnot necessary to apply it for the aprA gene fragment. Finally,a predominance of SRP-SOP ecotypes in Tirez Lake is inaccordance with the high values of sulfate registered on thesediment.
After the clustering analysis of sedimentary populationsrepresented in the aprA DGGE pattern, the changes are betterexplained by a seasonal disturbance in accordance with theephemeral lagoon. It is suggestible that population resilienceis mainly regulated by changes in salinity because the mainnodes indicate a partition into dry and flooded patterns(Figure 3(c)); note that salinity fluctuates from 6% (w/v)during winter to 35% (w/v) during spring. However, thestrong temperature oscillation can be also associated withsalinity over community composition. Additionally, the Pvalues (>0.05) indicate that the partition winter/summer isnot significant enough to describe well-differentiated com-munities since flooded node and dry node are more clusteredthan expected by chance.
Interestingly, most of the SOP, SRP, and MA phylo-types obtained in this work were related to environmentalsequences described from alkaliphilic or thalassic hypersalinesystems [6, 20]. However, few data is available from athalassicsystems [70]. In SRP were detected phylotypes (aps-cw4, -cw-5, and -cw2) from Desulfonatronovibrio hydrogenovorans,a lithoheterotrophic, halotolerant (grows in a salinity rangeof 1–12% NaCl), and alkaliphilic sulfate respirer. Surpris-ingly, D. hydrogenovorans does not grow at pH of 7 andthe highest pH of Tirez is below 8.0. Desulfohalobiaceaespecies are commonly adapted to high osmolarity due tothe anabolic metabolism of compatible solute synthesis anddependent on the use of lactate and hydrogen as electrondonors [4]. Desulfohalobium retbaense is considered the neu-trophilic and thalassic counterpart of D. hydrogenovorans,but it was not detected in Tirez.
Gram-Positive Desulfotomaculum solfataricum (aps-cw6)was detected in enrichments. Another phylotype, aps-es29,is also a member of Peptococcaceae, but it could not beassigned to a specific genus. These phylotypes did notcluster with Desulfotomaculum halophilum sequences, whichtolerates up to 12% NaCl [71]. However, a previous studyreports Desulfotomaculum isolates in a salt pan [72]. Sulfate-reducing bacteria in Peptococcaceae perform oxidation froma broad spectrum of electron donors such as lactate [73].Compatible solutes in Peptococcaceae have not been charac-terized; however, the theoretical energy yield, for example, inmedium supplied with lactate is ΔG◦′ = −160 kJ/mol, wouldgive enough energy for the osmoprotectant synthesis ortransport as, for example, Desulfovibrio vulgaris; D. vulgarisis trophically analog to Desulfotomaculum species. D. vulgarissynthesizes sugars such as trehalose or accumulates aminoacids such as glycine betaine and proline as compatiblesolutes as response to under salt stress. Stress response in D.vulgaris is based on genes with homologous in diverse anddistant species such as Bacillus subtilis [74]; thus, the find-ing of Peptococcaceae in Tirez, under analog bioenergetic
constraints, could be explained in the terms of the “salt-out”strategy (see Section 4).
The presence of Methanohalobium evestigatum andMethanolobus zinderi in the sulfate-rich and anoxic sedimentis easily sustained by functional arguments, even in summersamples, because their metabolism requires methylated sub-strates; thus, it is noncompetitive with SRP. M. evestigatumand M. zinderi are theoretically productive in bioenergeticterms [75], enough to exhibit compatible solute synthesis[76]. Methanolobus zinderi was isolated from an estuary andgrows at the higher rate and tolerates upper levels of divalentcations (Mg2+) in comparison with monovalent Na+ [77].This characteristic is remarkable because M. zinderi could beadequate to Tirez given that divalent cation Ca2+ dominateover monovalents in the sediment (Figure 1(e)). On theother hand, the increase of ammonium (NH+
4 4–6 μM) at10–15 cm depth and the decrease of Eh across the sedimentprofile (Figure 1) suggest the development of strict anaerobicand methylotrophic MA metabolisms [78].
None of the genera detected in both seasons clusteredwith acetoclastic MA. The absence of acetoclastic MA inhypersaline systems has been widely accepted as a conse-quence of the low Gibbs free energy dissipated from acetate assubstrate [4]. However, acetoclastic MA activity was reportedin Napoli mud volcano brines with 4.0 M chloride, where theCl : SO4 ratio is 200 times higher than the observed in Tirez[79]. In Tirez, the absence of acetoclastic MA is probablyexplained by substrate outcompetition, because the sulfate-reducing conditions prevail due to the high abundance ofsulfate in Tirez and to the putative adaptation of acetoclasticSRP such as Desulfonema magnum to the extreme sediment.
The sulfur-oxidizing populations have been frequentlydescribed in extreme hypersaline systems. Some of thephylotypes from environmental and enrichment culturingwere affiliated to endosymbionts; its potential ecologicalrole in the sediment is supported by the view that thesulfur cycle has been described in marine oligochaetes, whereendosymbionts identified as proteobacterial microorganismsparticipate as sulfur oxidizers [80]. Therefore, it is plausiblethat the free-living and nonisolated relative populations inTirez sediment have an analogous metabolic role. Threephylotypes from winter sediment and enrichments wereaffiliated to the chemoautotrophic genus Thioalkalivibrioand sulfur oxidizing endosymbionts in β/γ-proteobacteriaclade (Figure 5). These anaerobic ecotypes are expectedto be found in the extremely saline sediment as muchas the H2S is present (Figure 1(a)); in turn, H2S wouldbe oxidized anaerobically by these purple bacteria giventhat low Eh and partial O2 pressure were observed in thesampling site (Figure 1). The discrepancy in the finding ofThioalkalivibrio is due to its narrow range of optimal pH(9.5–10.0), the fact that species in Thioalkalivibrio are truealkaliphilic and are well adapted to athalassic soda lakes, thatis, dominated by monovalent cations [81], and consideringthat other sulfur oxidizing and halophilic SOP species suchas Thiomicrospira halophila or Hallochromatium spp. [82]were not detected and probably better adapted to neutralTirez saltern. Unfortunately, the SOP Tirez phylotype fromsummer sediment was not identified at species level.

16 International Journal of Microbiology
It has been argued that hypersaline environments areinappropriate for the biological development of anaerobicacetate oxidation as a consequence of the low negativebalance of the standard ΔG yielded by this dissimilatorymetabolism and due to the high maintenance energy neededfor the synthesis/accumulation of compatible solute underhigh osmotic conditions [4]. However, at high sulfate con-centrations, Desulfonema magnum populations were un-equivocally detected in the evaportitic sediment and wintersediment samples (environmental and derived from enrich-ment culturing) at 0–15 cm depth under an extreme salinitystress of 35% salts. This acetate-oxidizing Desulfobacteraceaehas not been described in hypersaline systems and wasthe most abundant phylotype identified in Tirez lagoon.D. magnum has an optimal salinity about 2.5% NaCl andhas been described in marine microbial mats [83]. Previousstudies have shown that Desulfobacteraceae are present inthalassic hypersaline basins [70] and athalassic soda lakes [6].This is a notable finding for the understanding of carboncycle in extreme hypersaline ecotypes because under extremeconditions there is a decline in organic matter remineraliza-tion; thereby, organisms encoding the corresponding aprAgene probably face the salinity changes. Halophilic speciesfrom Desulfobacterales have not been isolated; Desulfobacterhalotolerans is member of Desulfobacterales but has anoptimum growth with only of 1-2% NaCl [84]. Nevertheless,very little is known about the mechanisms involved in energyconservation that allow acetoclastic SRP organisms to survivein extreme saline conditions. The haloadaptation mechanism“salt-in” osmoadaptation has been suggested for Desulfobac-teraceae ecotypes identified in soda lakes to compensatesaline stress [6]. Possibly, Desulfonema, being an acetoclasticSR, exerts additional energy conserving mechanisms (asin the case of MA and acetogenic bacteria) consisting inextra transference of electrons from membrane complexesdependent on H+ or Na+ pumping. Such process is likelyto occur in the acetoclastic Desulfobacteraceae Desulfobac-terium autrotrophicum whose conservation mechanism ofchemiosmotic energy is analogous to that in homoacetogenicbacteria [85].
A mcrA phylotype from the hydrogenotrophic Metha-noplanus petrolearius was detected in the surface DGGEprofile from winter sediment at 0–5 cm depth (Figure 4),when salt content in the saltern is averaged at 6% w/v.This organism has a maximum tolerance at 5% and anoptimal growth at 1–3% NaCl [86]. It is feasible that the M.petrolearius salt tolerance determines its absence in summersamples and is correlated with the low energy yielded by themethanogenic pathway based on H2 and formate as electrondonors. MT activity based on these substrates has a lowtheoretical energy yielded (ΔG◦′). Therefore, it is plausiblethat M. petrolearius is less abundant than methylotrophicMA. Methanoplanus clones, which have been reported inthalassic hypersaline sediments but at 2.2 M Cl− and sulfatebelow the detection limit [87].
4.2. Halotolerant Strategies in Tirez Lagoon. In order to adjustto lower water activities of the environment and the resulting
decrease in cytoplasmic water, microorganisms must accu-mulate intracellular ions or organic solutes to reestablish theturgor pressure and preserve enzyme activity [27, 88]. “Salt-in” halophiles are adapted to hypersaline environments bya mechanism that involves at least equimolar extracellularand intracellular salt concentrations by a selective influx ofpotassium ions into the cytoplasm. The “salt-in” strategyfavors solubility and is energetically efficient, but unfoldsproteins at high concentration [24]. As a consequence, thishalotolerant strategy requires that the entire intracellularmachinery, that is, proteins, nucleic acids,s and their specificinteractions with one another, must be adapted to highsalt intracellular levels. The adaptations generally include anincrease of the acidic nature of intracellular proteins and/oran increment of genomic CG content and a GC-bias at thecodon usage level. Nevertheless, Paul et al. [25] demonstratedcommon genomic and proteomic trends in halophiles thattranscend the boundary of phylogenetic relationship andthe genomic GC content of the species. Accordingly, ithas been suggested that distantly lineages adopted “salt-in” strategy independently by convergent evolution given itsradical nature [27].
All previous studies have estimated average trends ofamino acid composition and GC content from selectedsequences or enzymes in marine aerobic populations [21,57] or from completely sequenced genomes obtained fromdiverse aerobic environments [22, 25]. Even though “salt-in”strategy was recently proposed to explain the finding of theresilience Desulfobacteraceae at hypersaline and alkaline lakes[6], this salt-adaptation strategy has been neither reported inspecies of the SRP-SOP nor in MA; in part, given the absenceof complete sequenced genomes and sequenced 16s RNAsfrom uncultured species. Therefore, we consider it usefulto use AprA and McrA markers to test “salt-in” signals. Anintuitive justification would be to expect a naturally biasedselection for AprA and McrA enzymes given their frequentor higher expression levels in the cytoplasm (in comparisonto other encoded genes at the genome) in order to copewith their ecological and metabolic role on anaerobic andhypersaline sediments.
Our results cannot be conclusive regarding the halo-tolerant strategies carried out by Tirez phylotypes, until alarge sequence data set can be achieved for these organisms.Nevertheless, the amino acid composition, GC content,and preferential codon usage trends exhibited by the AprAmarker from Tirez phylotypes suggest a plausible “salt-in”signal when compared to halophiles and non-haphiles. Theincrease in negatively charged (Asp and Glu) and polar (Ser,Asn, and Gln) residues in AprA Tirez phylotypes can beexplained by a codon usage with GC bias at the third posi-tion. The overrepresentation of these amino acid residuesand their preferential codon usage are consistent with reportson “salt-in” adaptation [22, 25]. Similarly, a higher frequencyof Val in AprA Tirez phylotypes compared to nonhalophilesand halophiles supports the observation of Madern et al. [24]and Paul et al. [25], but disagree with earlier propositionson underrepresentation of all strong hydrophobic residuesin halophiles [89]. We also report a slight decrement ofthe basic residue Arg in AprA Tirez phylotypes. The role of

International Journal of Microbiology 17
Arg in haloadaptation is quite controversial; its incrementin halophilic species can be expected by mutational bias[25] given that five of the six codons have a bias towardsGC nucleotides; however, Arg has been also reported in aconsistent decrement in specific haloadapted species [29, 57].Even though the slight increment of Lys observed in AprATirez phylotypes contradicts all previous propositions onunderrepresentation of the most important basic residues inall “salt-in” halophiles [22, 25], it has been recently suggestedthat dipeptides like Val-Lys significantly contribute to thehalostability in proteins [90].
As described on results, the mcr-ew1 Tirez phylotypeallocated in Methanomicrobiales shows an interestingly phy-logenetic tendency to use amino acids, not initially biased byGC content or codon usage, that could be involved in a weak-moderate “salt-in” strategy. For example, slight incrementsof the polar residues Asn, Ser, and Tyr, the negativelycharged residues Asp and Glu, and the hydrophobic residuesAla, Ile, and Pro in McrA Methanomicrobiales phylotypesare in agreement with salt-in signals previously reported[57]. Charged amino acids prevent charged ions fromattaching to proteins and thus they have a significant rolein stabilizing proteins against salty conditions and keepingwater molecules around these proteins [25, 50]. Similar toAprA Tirez phylotypes, we observed a decrement of Argand an increment of Lys (supplementary material, Table S3).The remaining McrA Tirez phylotypes do not exhibit a cleartendency about expected aa composition, GC content, andcodon usage bias to carry out “salt-in” haloadaptation. Thesephylotypes could compensate high salt extracellular concen-trations through mechanisms independent of amino acidcomposition and GC content and that do not compromisethe enzymatic activity [91]. The “salt-out” strategy requiresthe accumulation of specific small-molecular-weight com-pounds (i.e., compatible solutes or osmolytes) into thecytoplasm. Thereby, “salt-out” signal can be expected on theMcrA Tirez phylotypes close clustered at Methanohalobiumevestigatum and Methanohalobium sp. species belonging tothe Methanosarcinales. This observation is in agreementwith the compatible solute characterization described for thisclade [92]. It is also well know that M. evestigatum usesmethylated compounds such as methylamine and methanolto generate methane. These methylated substrates not onlyprovide more energy to M. evestigatum than the use of otherssubstrates for anabolic reactions, including the synthesisof compatible solutes, but also allow a tolerance up to29.2% of NaCl [93]. In “salt-out” strategy, little or noadjustment is required to intracellular macromolecules; infact, the compatible solutes often act as more general stressprotectants as well as just osmoprotectants [27].
Furthermore, halophiles do not live at constant saltconcentrations; but in many natural settings they are exposedto changing salinities due to evaporation or rain, and thusalso the intracellular conditions change considerably [23].Accordingly, enzyme activity on “salt-in” halophilic strategywill depend not only on the nature and concentration of thesalt, but also on extensive genetic alterations as a prerequisitefor adaptation to a saline intracellular environment [24,27]. Tajima’s neutrality test [94] for the AprA and McrA
enzyme fragments (used in this study) shows that both genemarkers are evolving under positive selection (DAprA = 3.13and DAprA = 2.96) (supplementary material, Table S4). Thismeans that key functional enzymes of anaerobic microor-ganisms on Tirez lagoon could undergone extensive geneticalterations that, if they help the organism to cope and adaptwith a saline intracellular environment, could be clearlydifferentiated and fast fixed on the populations. Two clearexamples of this flexible genetic alterations and selective fix-ation can be seen on AprA sequences of same species but thatwere obtained from different strains: Thermodesulforhabdusnorvegica DSM 9990 (EF442952.1) [95]; AF418159.1, [68]and Archaeoglobus fulgidus DSM 4304 (PDB: 1JNR-A) [16];PDB: 2FJA-A, [48], which show interesting amino acidchanges from basic (Lys and K) to polar (Gln, Q and Asn,N) residues (see Figure 5 and supplementary Figure S2).
In spite of the considerable diversity in nucleotide con-tent and amino acid composition of the AprA and McrAenzyme fragments involved in all analyses, it can be seena crucial conservation of catalytic sites (Arg-Rα265-Trp-Wα234 in AprA and Phe-Fα330-Tyr-Yα333-Phe-Fα443-Gly-Gα445
in McrA) as well as of cofactor and nucleotide binding sitesin both gene markers (Figures S1 and S2 for AprA andMcrA aa alignments, resp.). As previously reported for McrA[50], the same conservative trend holds true for most of thesurrounding residues of the AprA and McrA catalytic sites.Probably, the amino acid conservation and/or the structurallocalization of these catalytic regions on AprA and McrAgene markers underestimate the general trend compositionof “salt-in” adaptation from moderately to high halotolerantorganisms in Tirez lagoon. In fact, it is not possible to figureout at the moment if the diversity, weakness, or absence ofamino acid, GC content, and codon usage patterns reportedfor Tirez phylotypes in this study are a consequence of aminor and biased coverage of their not completely sequencedgenomes or if these inconclusive trends are true salt-insignals or a consequence of the use of complementary salt-adaptation strategies in bioenergetically constrained species,given that Tirez phylotypes have a clear anaerobic mode oflife on highly saline and sulfate sediments.
Accordingly, we do not discard the presence of mixedtypes of osmoadaptation in AprA and McrA Tirez phy-lotypes, where K+ accumulates to high levels (“salt-in”)along with neutral and negatively charged organic solutes(“salt-out”), as previously reported for many slightly andmoderately halophilic methanogens [96]. For example,Methanohalophilus portucalensis grows in 2.0 M NaCl and itsintracellular concentration of K+ is 0.76 M, indicating thatconcentration of intracellular K+ need not be the same asthat of extracellular Na+. Presumably, M. portucalensis usesthree zwitterions and other osmolytes to balance osmoticpressure [92, 96]. Likewise, K+ plays an important rolein the response of Methanococcus thermolithotrophicus tohyperosmotic (increased NaCl) or hypoosmotic (decreasedNaCl) shock. At the beginning of higher NaCl extracellularconcentration, M. thermolithotrophicus internalizes K+ untilreach a new steady-state intracellular concentration; then,synthesis and accumulation of L-α-glutamate occur. TheK+-α-glutamate pair functions as a temporary osmolyte
18 International Journal of Microbiology
whilst the nonmetabolizable zwitterion (Ne-acetyl-b-lysine)is synthesized and accumulated by M. thermolithotrophicusexclusively in response to high salt concentrations [96, 97].
4.3. Implications of Anaerobic Diversity for Tirez Biogeochem-istry. The characterization of SRP, SOP, and MA diversityin Tirez lagoon contributes to the knowledge of anaerobicdiversity of microorganisms in athalassohaline systems andhas inferences on the survival and adaptation of life understeep salt gradients. A characterization of the anaerobicdiversity in Tirez lagoon is a first step to explain functionalissues such as why not all anaerobic dissimilatory path-ways occur optimally in extreme biotopes and whether ananaerobic way of life faces higher energetic constraints inhypersaline systems in terms of salt composition [4]. Anyquantitative interpretation can be inferred because PCR-DGGE fingerprint is an inconclusive source of informationand fluorescence in situ hybridization (FISH), parallel exper-iments designed specifically to quantify ∂-proteobacteria andmethanogen populations along the sediment profile (winterand sediment), failed to yield any positive result (data notshown).
The structure and activity of hydrogenotrophic metha-nogenesis and acetoclastic sulfidogenesis under thalassichypersaline systems have been extensively studied [98, 99].But, it should be kept in mind that Tirez sediment is a sulfate-rich system with a peculiar salt composition, consideringthat in the evaporitic period minerals such as gypsum(CaSO4·2H2O), epsomite (MgSO4 ·7H2O), and hexahydrite(MgSO4·6H2O) are deposited and dominate over halite(NaCl) [60], and most importantly, the sulfate has a relevantrole in anaerobic systems as electron acceptor. Thus, presentresults might be of importance for the understanding ofacetate mineralization as a key process for carbon cyclingin extreme environments. In Tirez sulfate-rich sediment,among all the detected phylotypes, Desulfonema magnumand Methanoplanus petrolearius are the ecotypes of majorinterest due to energetic constraints; therefore, these ecotypesconstitute a probable signal of haloadaptation in anaerobicpopulations.
Although it was possible to characterize several anaer-obic prokaryotes involved in distinctive metabolic lineagesacross the Tirez sediment, DGGE and phylogenetic analysesrevealed a poor SRP, SOP, and MA phylotype composition;probably underestimated in comparison with other extremesystems [100]. Nevertheless, extant conditions in Tirez,as well as in other hypersaline environments, enable thepersistence of low energetic anaerobic metabolic capabilitiessuch as the Halanaerobiales fermenting bacteria (manuscriptin prep.), which use a well-adapted fermentation of organiccompounds to produce CO2/H2 and volatile fatty acids(VFA) such as acetate by the use of the “salt-in” strategy[101].
Typically, the carbon cycle in halophilic communitiesimplicates low rates of carbon mineralization to CO2 whichexplains the accumulation of acetate at salt saturationlevels [102]. In addition to H2 and acetate, methylatedcompounds as fermentation products of compatible solutescan be mineralized by MA [78, 103]. The perspective for
the nitrogen cycle is different in Tirez, its completion ispredictable given that it shares the characteristics of otherhypersaline systems, where methylotrophic MA contributeto nitrogen mineralization [103]. About the sulfur cycle,the sulfate-reducing microorganisms were identified in thesulfate-rich sediment and represent probable suppliers ofsulfide for sulfur-oxidizing populations. This understandingis useful to infer possible biological processes in analogoussystems such as Europa because the ocean present in thesatellite is rich in sulfates and divalent cations and probablyit is also in anoxic state [31, 104].
5. Conclusion
Extensive phylogenetic and physiological characterizations ofthalassic and alkaline anaerobic biotopes have been reported.Phylogenetic studies have been traditionally determined byphysiological characterization of marine species, and therecords of anaerobic phylotypes in hypersaline systems aredominated by thalassic species. Tirez lagoon has sabkhaproperties thus, it is a brine of interest to analyze strongspectra in salinity. Also, Tirez lagoon is characterized by alow chloride/sulfate ratio; this is remarkable considering thatsulfate serves as terminal electron acceptor in the marine sys-tems; however, few biological descriptions have been madewhen this anion is abundant under hypersaline conditions.Using the PCR-DGGE fingerprint technique for the func-tional adenosine-5′-phosphosulfate (aprA) and the methylcoenzyme M reductase (mcrA) gene markers, we have con-firmed the occurrence of hydrogenotrophic methanogenicand acetoclastic sulfate-reducing organisms in Tirez sedi-ment. Despite the steep osmotic change along the year in thelagoon, changes in composition of PCR-DGGE dendrogramreflected weak differences on winter-summer communitystructure.
The persistence of Desulfobacteraceae phylotypes insummer sediment as well as the finding of Methanomi-crobiales at the hypersaline and sulfate-rich sediment isremarkable (hydrogenotrophic MA are outcompeted by SRPin high concentrations of sulfate). Probably, these ecotypesare energetically constrained and, unfortunately, our findingson amino acid and nucleotide compositions cannot becurrently conclusive regarding the halotolerant strategiescarried out by Tirez phylotypes until a large sequencedata set can be achieved for these uncultured, anaerobicand bioenergetically constrained organisms. Nevertheless,it looks like AprA gene marker could be a useful “salt-in”indicator for different environmental (e.g., marine versussedimentary) samples, not only because its amino acidoverrepresentation and codon usage bias well correlate withthose found in halophiles but also because AprA gene markercould exhibit a preferential use of amino acid (e.g., Val andLys) on sediments in contrast to those found in marine andaerobic environments. Similarly, McrA gene marker showsan unexpected amino acid and nucleotide composition withnonclear “salt-in” signals exhibited. However, we speculatethat the diverse and not conclusive salt-in signals in theseecotypes (perhaps due to the absence of complete sequencedMcrA genes) could reflect that whereas protective osmolytes
International Journal of Microbiology 19
“salt-out” can be produced by MA Tirez populations in re-sponse to salt stress, probably also a weak “salt-in” strategymay contribute to adaptation of osmotic stress on sedimen-tary MA Tirez populations.
An extended understanding for acetoclastic sulfate re-ducing activity under high osmolarity conditions is neededin order to elucidate mechanisms that are involved in thebiological carbon mineralization. On the long term, thefindings of this work will provide valuable informationto determine habitable conditions of Europa, the mostinteresting moon of Jupiter for the Astrobiology field, as ananoxic and hypersaline environment.
Authors’ Contribution
L. Montoya, I. Lozada-Chavez, I. Marın and R. Amils con-ceived the study. L. Montoya, I. Marın, R. Amils and N.Rodriguez were involved in the fieldwork. L. Montoya per-formed the experimental work. I. Lozada-Chavez performedthe sequence analysis. L. Montoya and I. Lozada-Chavezperformed the analysis and interpretation of data, and wrotethe paper. All authors read, improved, and approved the finalpaper.
Acknowledgments
L. Montoya work was supported by a CONACyT Fellowship.I. Lozada-Chavez is funded by the Doctoral Fellowshipnumber 185993 from the National Council of Science andTechnology of Mexico. Constructive comments of the paperby the anonymous reviewers significantly improved thequality of the final version.
References
[1] R. Cord-Ruwisch, H. J. Seitz, and R. Conrad, “The capacityof hydrogenotrophic anaerobic bacteria to compete for tracesof hydrogen depends on the redox potential of the terminalelectron acceptor,” Archives of Microbiology, vol. 149, no. 4,pp. 350–357, 1988.
[2] D. C. Catling, C. R. Glein, K. J. Zahnle, and C. P. McKay,“Why O2 is required by complex life on habitable planets andthe concept of planetary “Oxygenation time”,” Astrobiology,vol. 5, no. 3, pp. 415–438, 2005.
[3] K. Tabuchi, H. Kojima, and M. Fukui, “Seasonal changes inorganic matter mineralization in a sublittoral sediment andtemperature-driven decoupling of key processes,” MicrobialEcology, vol. 60, no. 3, pp. 551–560, 2010.
[4] A. Oren, “Thermodynamic limits to microbial life at high saltconcentrations,” Environmental Microbiology, vol. 13, no. 8,pp. 1908–1923, 2011.
[5] B. Ollivier, M. L. Fardeau, J. L. Cayol et al., “Methanocalculushalotolerans gen. nov., sp. nov., isolated from an oil-pro-ducing well,” International Journal of Systematic Bacteriology,vol. 48, no. 3, pp. 821–828, 1998.
[6] M. Foti, D. Y. Sorokin, B. Lomans et al., “Diversity, activity,and abundance of sulfate-reducing bacteria in saline andhypersaline soda lakes,” Applied and Environmental Microbi-ology, vol. 73, no. 7, pp. 2093–2100, 2007.
[7] J. G. Dillon, S. Miller, B. Bebout, M. Hullar, N. Pinel, andD. A. Stahl, “Spatial and temporal variability in a stratifiedhypersaline microbial mat community,” FEMS MicrobiologyEcology, vol. 68, no. 1, pp. 46–58, 2009.
[8] A. Teske and K. B. Sørensen, “Uncultured archaea in deepmarine subsurface sediments: have we caught them all?”ISME Journal, vol. 2, no. 1, pp. 3–18, 2008.
[9] D. J. Kushner, “The Halobacteriaceae,” in The Bacteria: ATreatise on Structure and Function, C. R. Woese and R. S.Wolfe, Eds., pp. 171–214, Academic Press, 1985.
[10] J. S. Kargel, J. Z. Kaye, J. W. Head et al., “Europa’s crust andocean: origin, composition, and the prospects for life,” Icarus,vol. 148, no. 1, pp. 226–265, 2000.
[11] D. L. Valentine, “Adaptations to energy stress dictate theecology and evolution of the Archaea,” Nature ReviewsMicrobiology, vol. 5, no. 4, pp. 316–323, 2007.
[12] A. Nocker, M. Burr, and A. K. Camper, “Genotypic microbialcommunity profiling: a critical technical review,” MicrobialEcology, vol. 54, no. 2, pp. 276–289, 2007.
[13] B. Meyer and J. Kuever, “Molecular analysis of the diversityof sulfate-reducing and sulfur-oxidizing prokaryotes in theenvironment, using aprA as functional marker gene,” Appliedand Environmental Microbiology, vol. 73, no. 23, pp. 7664–7679, 2007.
[14] B. Meyer and J. Kuever, “Homology modeling of dissimila-tory APS reductases (AprBA) of sulfur-oxidizing and sulfate-reducing prokaryotes,” PLoS One, vol. 3, no. 1, Article IDe1514, 2008.
[15] R. K. Thauer, A. K. Kaster, H. Seedorf, W. Buckel, andR. Hedderich, “Methanogenic archaea: ecologically relevantdifferences in energy conservation,” Nature Reviews Microbi-ology, vol. 6, no. 8, pp. 579–591, 2008.
[16] G. Fritz, A. Roth, A. Schiffer et al., “Structure of adenylyl-sulfate reductase from the hyperthermophilic Archaeoglobusfulgidus at 1.6-A resolution,” Proceedings of the NationalAcademy of Sciences of the United States of America, vol. 99,no. 4, pp. 1836–1841, 2002.
[17] W. M. Hipp, A. S. Pott, N. Thum-Schmitz, I. Faath, C. Dahl,and H. G. Truper, “Towards the phylogeny of APS reductasesand sirohaem sulfite reductases in sulfate-reducing andsulfur-oxidizing prokaryotes,” Microbiology, vol. 143, no. 9,pp. 2891–2902, 1997.
[18] P. E. Luton, J. M. Wayne, R. J. Sharp, and P. W. Riley,“The mcrA gene as an alternative to 16S rRNA in thephylogenetic analysis of methanogen populations in landfill,”Microbiology, vol. 148, no. 11, pp. 3521–3530, 2002.
[19] E. Springer, M. S. Sachs, C. R. Woese, and D. R. Boone,“Partial gene sequences for the A subunit of methyl-coenzyme M reductase (mcrI) as a phylogenetic tool for thefamily Methanosarcinaceae,” International Journal of System-atic Bacteriology, vol. 45, no. 3, pp. 554–559, 1995.
[20] R. Wilms, H. Sass, B. Kopke, H. Cypionka, and B. Engelen,“Methane and sulfate profiles within the subsurface of atidal flat are reflected by the distribution of sulfate-reducingbacteria and methanogenic archaea,” FEMS MicrobiologyEcology, vol. 59, no. 3, pp. 611–621, 2007.
[21] M. E. Rhodes, S. T. Fitz-Gibbon, A. Oren, and C. H. House,“Amino acid signatures of salinity on an environmental scalewith a focus on the Dead Sea,” Environmental Microbiology,vol. 12, no. 9, pp. 2613–2623, 2010.
[22] S. Fukuchi, K. Yoshimune, M. Wakayama, M. Moriguchi, andK. Nishikawa, “Unique amino acid composition of proteinsin halophilic bacteria,” Journal of Molecular Biology, vol. 327,no. 2, pp. 347–357, 2003.
20 International Journal of Microbiology
[23] J. Soppa, “From genomes to function: haloarchaea as modelorganisms,” Microbiology, vol. 152, no. 3, pp. 585–590, 2006.
[24] D. Madern, C. Ebel, and G. Zaccai, “Halophilic adaptation ofenzymes,” Extremophiles, vol. 4, no. 2, pp. 91–98, 2000.
[25] S. Paul, S. K. Bag, S. Das, E. T. Harvill, and C. Dutta, “Molec-ular signature of hypersaline adaptation: insights fromgenome and proteome composition of halophilic prokary-otes,” Genome Biology, vol. 9, no. 4, article R70, 2008.
[26] G. W. Hutcheon, N. Vasisht, and A. Bolhuis, “Characteri-sation of a highly stable α-amylase from the halophilic ar-chaeon Haloarcula hispanica,” Extremophiles, vol. 9, no. 6, pp.487–495, 2005.
[27] H. Santos and M. S. da Costa, “Compatible solutes of organ-isms that live in hot saline environments,” EnvironmentalMicrobiology, vol. 4, no. 9, pp. 501–509, 2002.
[28] A. Oren, F. Larimer, P. Richardson, A. Lapidus, and L.N. Csonka, “How to be moderately halophilic with broadsalt tolerance: clues from the genome of Chromohalobactersalexigens,” Extremophiles, vol. 9, no. 4, pp. 275–279, 2005.
[29] S. P. Kennedy, W. V. Ng, S. L. Salzberg, L. Hood, and S.DasSarma, “Understanding the adaptation of Halobacteriumspecies NRC-1 to its extreme environment through compu-tational analysis of its genome sequence,” Genome Research,vol. 11, no. 10, pp. 1641–1650, 2001.
[30] H. Bolhuis, P. Palm, A. Wende et al., “The genome of thesquare archaeon Haloquadratum walsbyi: life at the limits ofwater activity,” BMC Genomics, vol. 7, article 169, 2006.
[31] O. Prieto-Ballesteros, N. Rodrıguez, J. S. Kargel, C. G. Kessler,R. Amils, and D. F. Remolar, “Tırez lake as a terrestrial analogof Europa,” Astrobiology, vol. 3, no. 4, pp. 863–877, 2003.
[32] D. T. Vaniman, D. L. Bish, S. J. Chipera, C. I. Fialips, J. W.Carey, and W. G. Feldman, “Magnesium sulphate salts andthe history of water on Mars,” Nature, vol. 431, no. 7009, pp.663–665, 2004.
[33] J. D. Cline, “Spectrophotometric determination of hydrogensulfide in natural waters,” Limnology and Oceanography, vol.14, pp. 454–458, 1969.
[34] L. Raskin, B. E. Rittmann, and D. A. Stahl, “Competitionand coexistence of sulfate-reducing and methanogenic pop-ulations in anaerobic biofilms,” Applied and EnvironmentalMicrobiology, vol. 62, no. 10, pp. 3847–3857, 1996.
[35] R. L. Kepner and J. R. Pratt, “Use of fluorochromes for directenumeration of total bacteria in environmental samples: pastand present,” Microbiological Reviews, vol. 58, no. 4, pp. 603–615, 1994.
[36] A. Aguilera, V. Souza-Egipsy, E. Gonzalez-Toril, O. Ren-dueles, and R. Amils, “Eukaryotic microbial diversity ofphototrophic microbial mats in two Icelandic geothermal hotsprings,” International Microbiology, vol. 13, no. 1, pp. 21–32,2010.
[37] B. Deplancke, K. R. Hristova, H. A. Oakley et al., “Molec-ular ecological analysis of the succession and diversity ofsulfate-reducing bacteria in the mouse gastrointestinal tract,”Applied and Environmental Microbiology, vol. 66, no. 5, pp.2166–2174, 2000.
[38] B. A. Hales, C. Edwards, D. A. Ritchie, G. Hall, R. W.Pickup, and J. R. Saunders, “Isolation and identification ofmethanogen-specific DNA from blanket bog peat by PCRamplification and sequence analysis,” Applied and Environ-mental Microbiology, vol. 62, no. 2, pp. 668–675, 1996.
[39] G. Muyzer, E. C. De Waal, and A. G. Uitterlinden, “Profilingof complex microbial populations by denaturing gradient
gel electrophoresis analysis of polymerase chain reaction-amplified genes coding for 16S rRNA,” Applied and Environ-mental Microbiology, vol. 59, no. 3, pp. 695–700, 1993.
[40] N. Fromin, J. Hamelin, S. Tarnawski et al., “Statistical analysisof denaturing gel electrophoresis (DGE) fingerprinting pat-terns,” Environmental Microbiology, vol. 4, no. 11, pp. 634–643, 2002.
[41] E. O. Casamayor, R. Massana, S. Benlloch et al., “Changes inarchaeal, bacterial and eukaryal assemblages along a salinitygradient by comparison of genetic fingerprinting methods ina multipond solar saltern,” Environmental Microbiology, vol.4, no. 6, pp. 338–348, 2002.
[42] J. Felsentein, PHYLIP (3.68 edn), Department of Genetics,University of Washington, 1993, Distributed by the author.
[43] S. F. Altschul, T. L. Madden, A. A. Schaffer et al., “GappedBLAST and PSI-BLAST: a new generation of protein databasesearch programs,” Nucleic Acids Research, vol. 25, no. 17, pp.3389–3402, 1997.
[44] R. Lopez, V. Silventoinen, S. Robinson, A. Kibria, and W.Gish, “WU-Blast2 server at the European BioinformaticsInstitute,” Nucleic Acids Research, vol. 31, no. 13, pp. 3795–3798, 2003.
[45] W. Li, L. Jaroszewski, and A. Godzik, “Tolerating some re-dundancy significantly speeds up clustering of large proteindatabases,” Bioinformatics, vol. 18, no. 1, pp. 77–82, 2002.
[46] J. D. Thompson, T. J. Gibson, F. Plewniak, F. Jeanmougin, andD. G. Higgins, “The CLUSTAL X windows interface: flexiblestrategies for multiple sequence alignment aided by qualityanalysis tools,” Nucleic Acids Research, vol. 25, no. 24, pp.4876–4882, 1997.
[47] T. Hall, BIOEDIT. (7.0.5. edn), Ibis Therapeutics, Divisionof Isis Pharmaceuticals, 1997, Biological sequence alignmenteditor, Distributed by the author.
[48] A. Schiffer, G. Fritz, P. M. H. Kroneck, and U. Ermler, “Reac-tion mechanism of the iron-sulfur flavoenzyme adenosine-5′-phosphosulfate reductase based on the structural charac-terization of different enzymatic states,” Biochemistry, vol. 45,no. 9, pp. 2960–2967, 2006.
[49] Y. L. Chiang, Y. C. Hsieh, J. Y. Fang et al., “Crystal structure ofadenylylsulfate reductase from Desulfovibrio gigas suggests apotential self-regulation mechanism involving the C termi-nus of the β-subunit,” Journal of Bacteriology, vol. 191, no.24, pp. 7597–7608, 2009.
[50] W. Grabarse, F. Mahlert, S. Shima, R. K. Thauer, andU. Ermler, “Comparison of three methyl-coenzyme Mreductases from phylogenetically distant organisms: unusualamino acid modification, conservation and adaptation,”Journal of Molecular Biology, vol. 303, no. 2, pp. 329–344,2000.
[51] U. Ermler, W. Grabarse, S. Shima, M. Goubeaud, and R. K.Thauer, “Crystal structure of methyl-coenzyme M reductase:the key enzyme of biological methane formation,” Science,vol. 278, no. 5342, pp. 1457–1462, 1997.
[52] S. Rospert, J. Breitung, K. Ma et al., “Methyl-coenzyme Mreductase and other enzymes involved in methanogenesisfrom CO2 and H2 in the extreme thermophile Methanopyruskandleri,” Archives of Microbiology, vol. 156, no. 1, pp. 49–55,1991.
[53] J. Castresana, “Selection of conserved blocks from multiplealignments for their use in phylogenetic analysis,” MolecularBiology and Evolution, vol. 17, no. 4, pp. 540–552, 2000.
[54] D. T. Jones, W. R. Taylor, and J. M. Thornton, “The rapid gen-eration of mutation data matrices from protein sequences,”

International Journal of Microbiology 21
Computer Applications in the Biosciences, vol. 8, no. 3, pp.275–282, 1992.
[55] N. Saitou and M. Nei, “The neighbor-joining method: a newmethod for reconstructing phylogenetic trees,” MolecularBiology and Evolution, vol. 4, no. 4, pp. 406–425, 1987.
[56] K. Tamura, J. Dudley, M. Nei, and S. Kumar, “MEGA4:molecular evolutionary genetics analysis (MEGA) softwareversion 4.0,” Molecular Biology and Evolution, vol. 24, no. 8,pp. 1596–1599, 2007.
[57] A. Oren and L. Mana, “Amino acid composition of bulk pro-tein and salt relationships of selected enzymes of Salinibacterruber, an extremely halophilic bacterium,” Extremophiles, vol.6, no. 3, pp. 217–223, 2002.
[58] P. M. Sharp, T. M. F. Tuohy, and K. R. Mosurski, “Codonusage in yeast: cluster analysis clearly differentiates highly andlowly expressed genes,” Nucleic Acids Research, vol. 14, no. 13,pp. 5125–5143, 1986.
[59] K. R. Sowers and J. E. M. Watts, “The study of strictlyanaerobic microorganisms,” in Extremophiles, F. A. Raineyand A. Oren, Eds., pp. 739–764, Elsevier-Academic Press,New York, NY, USA, 2006.
[60] J. A. de la Pena, “Las lagunas de la Mancha: un ejemplo deambiente continental,” in Memorias de la Real Academia deCiencias Exactas, Fısicas y Naturales, pp. 79–93, 1987.
[61] H. Jiang, H. Dong, G. Zhang, B. Yu, L. R. Chapman, andM. W. Fields, “Microbial diversity in water and sediment ofLake Chaka, an athalassohaline lake in northwestern China,”Applied and Environmental Microbiology, vol. 72, no. 6, pp.3832–3845, 2006.
[62] V. N. Bashkin, Modern Biogeochemistry, Kluwer AcademicPublishers, 2003.
[63] M. A. Schneegurt, S. Y. Dore, and C. F. Kulpa, “Direct extrac-tion of DNA from soils for studies in microbial ecology,”Current Issues in Molecular Biology, vol. 5, no. 1, pp. 1–8,2003.
[64] M. R. Frost and J. A. Guggenheim, “Prevention of depuri-nation during elution facilitates the reamplification of DNAfrom differential display gels,” Nucleic Acids Research, vol. 27,no. 15, p. e6, 1999.
[65] K. B. Sørensen, D. E. Canfield, and A. Oren, “Salinity re-sponses of benthic microbial communities in a solar saltern(Eilat, Israel),” Applied and Environmental Microbiology, vol.70, no. 3, pp. 1608–1616, 2004.
[66] G. Muyzer and K. Smalla, “Application of denaturing gradi-ent gel electrophoresis (DGGE) and temperature gradient gelelectrophoresis (TGGE) in microbial ecology,” Antonie vanLeeuwenhoek, vol. 73, no. 1, pp. 127–141, 1998.
[67] H. Juottonen, P. E. Galand, and K. Yrjala, “Detection ofmethanogenic Archaea in peat: comparison of PCR primerstargeting the mcrA gene,” Research in Microbiology, vol. 157,no. 10, pp. 914–921, 2006.
[68] M. W. Friedrich, “Phylogenetic analysis reveals multiplelateral transfers of adenosine-5′-phosphosulfate reductasegenes among sulfate-reducing microorganisms,” Journal ofBacteriology, vol. 184, no. 1, pp. 278–289, 2002.
[69] S. A. Dar, J. G. Kuenen, and G. Muyzer, “Nested PCR-denaturing gradient gel electrophoresis approach to deter-mine the diversity of sulfate-reducing bacteria in complexmicrobial communities,” Applied and Environmental Micro-biology, vol. 71, no. 5, pp. 2325–2330, 2005.
[70] S. Borin, L. Brusetti, F. Mapelli et al., “Sulfur cycling andmethanogenesis primarily drive microbial colonization of thehighly sulfidic Urania deep hypersaline basin,” Proceedings
of the National Academy of Sciences of the United States ofAmerica, vol. 106, no. 23, pp. 9151–9156, 2009.
[71] C. Tardy-Jacquenod, M. Magot, B. K. C. Patel, R. Matheron,and P. Caumette, “Desulfotomaculum halophilum sp. nov.,a halophilic sulfate-reducing bacterium isolated from oilproduction facilities,” International Journal of Systematic Bac-teriology, vol. 48, no. 2, pp. 333–338, 1998.
[72] S. Kerkar, Studies on bacteria of the dissimilatory reductiveprocesses of the sulphur cycle from the salt pans of Goa, M.S.thesis, Marine Sciences, Goa University, 2004.
[73] E. V. Belyakova and E. P. Rozanova, “Newly discoveredproperties of spore-forming sulfate-reducing bacteria, Desul-fotomaculum strains 435 and 781,” Microbiology, vol. 73, no.2, pp. 237–239, 2004.
[74] Z. He, A. Zhou, E. Baidoo et al., “Global transcriptional, phy-siological and metabolite analyses of the responses of Desul-fovibrio vulgaris Hildenborough to salt adaptation,” Appliedand Environmental Microbiology, vol. 76, no. 5, pp. 1574–1586, 2010.
[75] A. Oren, “Bioenergetic aspects of halophilism,” Microbiologyand Molecular Biology Reviews, vol. 63, no. 2, pp. 334–348,1999.
[76] R. S. Oremland and S. Polcin, “Methanogenesis and sulfatereduction: competitive and noncompetitive substrates inestuarine sediments,” Applied and Environmental Microbiol-ogy, vol. 44, pp. 1270–1276, 1982.
[77] S. N. Doerfert, M. Reichlen, P. Iyer, M. Wang, and J.G. Ferry, “Methanolobus zinderi sp. nov., a methylotrophicmethanogen isolated from a deep subsurface coal seam,”International Journal of Systematic and Evolutionary Micro-biology, vol. 59, no. 5, pp. 1064–1069, 2009.
[78] A. Oren, “Formation and breakdown of glycine betaine andtrimethylamine in hypersaline environments,” Antonie vanLeeuwenhoek, vol. 58, no. 4, pp. 291–298, 1990.
[79] C. S. Lazar et al., “Methanogenic diversity and activity inhypersaline sediments of the centre of the Napoli mud vol-cano, Eastern Mediterranean Sea,” Environ Microbiol, 2011.
[80] B. Meyer and J. Kuever, “Phylogenetic diversity and spatialdistribution of the microbial community associated with theCaribbean deep-water sponge Polymastia cf. corticata by 16SrRNA, aprA, and amoA gene analysis,” Microbial Ecology, vol.56, no. 2, pp. 306–321, 2008.
[81] D. Y. Sorokin, H. Banciu, M. van Loosdrecht, and J. G.Kuenen, “Growth physiology and competitive interactionof obligately chemolithoautotrophic, haloalkaliphilic, sulfur-oxidizing bacteria from soda lakes,” Extremophiles, vol. 7, no.3, pp. 195–203, 2003.
[82] D. Y. Sorokin, T. P. Tourova, A. M. Lysenko, and G. Muyzer,“Diversity of culturable halophilic sulfur-oxidizing bacteriain hypersaline habitats,” Microbiology, vol. 152, no. 10, pp.3013–3023, 2006.
[83] M. Fukui, A. Teske, B. Assmus, G. Muyzer, and F. Wid-del, “Physiology, phylogenetic relationships, and ecology offilamentous sulfate-reducing bacteria (genus Desulfonema),”Archives of Microbiology, vol. 172, no. 4, pp. 193–203, 1999.
[84] K. K. Brandt and K. Ingvorsen, “Desulfobacter halotoleranssp. nov., a halotolerant acetate-oxidizing sulfate-reducingbacterium isolated from sediments of Great Salt Lake, Utah,”Systematic and Applied Microbiology, vol. 20, no. 3, pp. 366–373, 1997.
[85] A. W. Strittmatter, H. Liesegang, R. Rabus et al., “Genomesequence of Desulfobacterium autotrophicum HRM2, amarine sulfate reducer oxidizing organic carbon completely

22 International Journal of Microbiology
to carbon dioxide,” Environmental Microbiology, vol. 11, no.5, pp. 1038–1055, 2009.
[86] B. Ollivier, J. L. Cayol, B. K. C. Patel, M. Magot, M. L.Fardeau, and J. L. Garcia, “Methanoplanus petrolearius sp.nov., a novel methanogenic bacterium from an oil-producingwell,” FEMS Microbiology Letters, vol. 147, no. 1, pp. 51–56,1997.
[87] P. J. Waldron, S. T. Petsch, A. M. Martini, and K. Nuslein,“Salinity constraints on subsurface archaeal diversity andmethanogenesis in sedimentary rock rich in organic matter,”Applied and Environmental Microbiology, vol. 73, no. 13, pp.4171–4179, 2007.
[88] A. D. Brown, Ed., Microbial Water Stress Physiology: Principlesand Perspectives, John Wiley & Sons.
[89] K. L. Britton, P. J. Baker, M. Fisher et al., “Analysis of proteinsolvent interactions in glucose dehydrogenase from theextreme halophile Haloferax mediterranei,” Proceedings of theNational Academy of Sciences of the United States of America,vol. 103, no. 13, pp. 4846–4851, 2006.
[90] E. Ebrahimie, M. Ebrahimi, N. R. Sarvestani, and M.Ebrahimi, “Protein attributes contribute to halo-stability,bioinformatics approach,” Saline Systems, vol. 7, no. 1, article1, 2011.
[91] A. D. Brown, “Microbial water stress,” Bacteriological Re-views, vol. 40, no. 4, pp. 803–846, 1976.
[92] M. C. Lai, K. R. Sowers, D. E. Robertson, M. F. Roberts,and R. P. Gunsalus, “Distribution of compatible solutesin the halophilic methanogenic archaebacteria,” Journal ofBacteriology, vol. 173, no. 17, pp. 5352–5358, 1991.
[93] J. L. Garcia, B. K. C. Patel, and B. Ollivier, “Taxonomic, phy-logenetic, and ecological diversity of methanogenic Archaea,”Anaerobe, vol. 6, no. 4, pp. 205–226, 2000.
[94] F. Tajima, “Statistical method for testing the neutral mutationhypothesis by DNA polymorphism,” Genetics, vol. 123, no. 3,pp. 585–595, 1989.
[95] B. Meyer and J. Kuevert, “Phylogeny of the alpha and betasubunits of the dissimilatory adenosine-5′-phosphosulfate(APS) reductase from sulfate-reducing prokaryotes—originand evolution of the dissimilatory sulfate-reduction path-way,” Microbiology, vol. 153, no. 7, pp. 2026–2044, 2007.
[96] D. D. Martin, R. A. Ciulla, and M. F. Roberts, “Osmoadap-tation in archaea,” Applied and Environmental Microbiology,vol. 65, no. 5, pp. 1815–1825, 1999.
[97] D. D. Martin, R. A. Ciulla, P. M. Robinson, and M. F. Roberts,“Switching osmolyte strategies: response of Methanococcusthermolithotrophicus to changes in external NaCl,” Biochimicaet Biophysica Acta, vol. 1524, no. 1, pp. 1–10, 2000.
[98] K. U. Kjeldsen, A. Loy, T. F. Jakobsen, T. R. Thomsen, M.Wagner, and K. Ingvorsen, “Diversity of sulfate-reducingbacteria from an extreme hypersaline sediment, Great SaltLake (Utah),” FEMS Microbiology Ecology, vol. 60, no. 2, pp.287–298, 2007.
[99] E. G. Potter, B. M. Bebout, and C. A. Kelley, “Isotopic com-position of methane and inferred methanogenic substratesalong a salinity gradient in a hypersaline microbial matsystem,” Astrobiology, vol. 9, no. 4, pp. 383–390, 2009.
[100] J. B. H. Martiny, B. J. M. Bohannan, J. H. Brown et al.,“Microbial biogeography: putting microorganisms on themap,” Nature Reviews Microbiology, vol. 4, no. 2, pp. 102–112,2006.
[101] E. N. Detkova and M. A. Pusheva, “Energy metabolism inhalophilic and alkalophilic bacteria,” Mikrobiologiia, vol. 75,no. 1, pp. 5–17, 2006.
[102] B. Ollivier, P. Caumette, J. L. Garcia, and R. A. Mah, “Anaero-bic bacteria from hypersaline environments,” MicrobiologicalReviews, vol. 58, no. 1, pp. 27–38, 1994.
[103] D. T. Welsh, “Ecological significance of compatible soluteaccumulation by micro-organisms: from single cells to globalclimate,” FEMS Microbiology Reviews, vol. 24, no. 3, pp. 263–290, 2000.
[104] K. P. Hand, R. W. Carlson, and C. F. Chyba, “Energy, chem-ical disequilibrium, and geological constraints on Europa,”Astrobiology, vol. 7, no. 6, pp. 1006–1022, 2007.

Submit your manuscripts athttp://www.hindawi.com
Hindawi Publishing Corporationhttp://www.hindawi.com Volume 2014
Anatomy Research International
PeptidesInternational Journal of
Hindawi Publishing Corporationhttp://www.hindawi.com Volume 2014
Hindawi Publishing Corporation http://www.hindawi.com
International Journal of
Volume 2014
Zoology
Hindawi Publishing Corporationhttp://www.hindawi.com Volume 2014
Molecular Biology International
GenomicsInternational Journal of
Hindawi Publishing Corporationhttp://www.hindawi.com Volume 2014
The Scientific World JournalHindawi Publishing Corporation http://www.hindawi.com Volume 2014
Hindawi Publishing Corporationhttp://www.hindawi.com Volume 2014
BioinformaticsAdvances in
Marine BiologyJournal of
Hindawi Publishing Corporationhttp://www.hindawi.com Volume 2014
Hindawi Publishing Corporationhttp://www.hindawi.com Volume 2014
Signal TransductionJournal of
Hindawi Publishing Corporationhttp://www.hindawi.com Volume 2014
BioMed Research International
Evolutionary BiologyInternational Journal of
Hindawi Publishing Corporationhttp://www.hindawi.com Volume 2014
Hindawi Publishing Corporationhttp://www.hindawi.com Volume 2014
Biochemistry Research International
ArchaeaHindawi Publishing Corporationhttp://www.hindawi.com Volume 2014
Hindawi Publishing Corporationhttp://www.hindawi.com Volume 2014
Genetics Research International
Hindawi Publishing Corporationhttp://www.hindawi.com Volume 2014
Advances in
Virolog y
Hindawi Publishing Corporationhttp://www.hindawi.com
Nucleic AcidsJournal of
Volume 2014
Stem CellsInternational
Hindawi Publishing Corporationhttp://www.hindawi.com Volume 2014
Hindawi Publishing Corporationhttp://www.hindawi.com Volume 2014
Enzyme Research
Hindawi Publishing Corporationhttp://www.hindawi.com Volume 2014
International Journal of
Microbiology


![Final Draft - HZG · 2013. 11. 26. · -1] using the algorithm developed by McDougall 157 et al., (2012). The following depths were sampled at all stations: 300, 200, 100 and 0 m](https://img.pdfslide.net/doc/110x75/60050b6f6381727d7b0cc5e0/final-draft-2013-11-26-1-using-the-algorithm-developed-by-mcdougall-157.jpg)