Embed Size (px)
Citation preview

WP/14/12
Thin Capitalization Rules and Multinational
Firm Capital Structure
Jennifer Blouin, Harry Huizinga,
Luc Laeven, and Gaëtan Nicodème
© 2014 International Monetary Fund WP/14/12
IMF Working Paper
Research Department
Thin Capitalization Rules and Multinational Firm Capital Structure1
Prepared by Jennifer Blouin, Harry Huizinga, Luc Laeven, and Gaëtan Nicodème
Authorized for distribution by Stijn Claessens
January 2014
Abstract
This paper examines the impact of thin capitalization rules that limit the tax deductibility of interest on the
capital structure of the foreign affiliates of US multinationals. We construct a new data set on thin
capitalization rules in 54 countries for the period 1982-2004. Using confidential data on the internal and
total leverage of foreign affiliates of US multinationals, we find that thin capitalization rules significantly
affect multinational firm capital structure. Specifically, restrictions on an affiliate’s debt-to-assets ratio
reduce this ratio on average by 1.9%, while restrictions on an affiliate’s borrowing from the parent-to-
equity ratio reduce this ratio by 6.3%. Also, restrictions on borrowing from the parent reduce the affiliate’s
debt-to-assets ratio by 0.8%, which shows that rules targeting internal leverage have an indirect effect on
the overall indebtedness of affiliate firms. The impact of capitalization rules on affiliate leverage is higher
if their application is automatic rather than discretionary. Furthermore, thin capitalization regimes have
aggregate firm effects: they reduce the firm’s aggregate interest expense but lower firm valuation. Overall,
our results show than thin capitalization rules, which thus far have been understudied, have a substantial
effect on the capital structure within multinational firms, with implications for the firm’s market valuation.
JEL Classification Numbers: G32, H25.
Keywords: Thin capitalization rule; Multinational firm; Capital structure; Taxation.
Author’s E-Mail Addresses: [email protected]; [email protected]; [email protected];
1 Jennifer Blouin is Associate Professor of Accounting at Wharton, University of Pennsylvania. Contact information: [email protected],
Phone: (215) 898 1266; Harry Huizinga is Professor of Economics at Tilburg University and Research Fellow at the CEPR; Luc Laeven is Lead
Economist at the International Monetary Fund, Professor of Finance at Tilburg University, and Research Fellow at the CEPR; and Gaëtan Nicodème
is Head of Unit at the European Commission’s General Directorate for Taxation and Customs Union and Adjunct Professor in Economics at ULB.
The statistical analysis of firm-level data on U.S. multinational companies was conducted by Jennifer Blouin at the Bureau of Economic Analysis,
Department of Commerce under arrangements that maintain legal confidentiality requirements. The views expressed in this study are those of the
authors and do not reflect those of the US Department of Commerce, the European Commission, the IMF, or IMF Board. We appreciate the helpful
comments of Fritz Foley, Niels Johannesen, Richard Sansing, Dirk Schindler, Terry Shevlin, and seminar participants at the University of Chicago,
Stanford University, Erasmus University in Rotterdam, the Solvay Brussels School of Economics and Management, Free University of Brussels, the
Norwegian School of Economics (NHH Bergen), the University of North Carolina’s Global Issues in Accounting Conference, the 2013 ZEW/CBT
Conference in Mannheim, the 2013 CESifo Public Sector Conference, and Oxford University’s tax symposium.
This Working Paper should not be reported as representing the views of the IMF.
The views expressed in this Working Paper are those of the author(s) and do not necessarily
represent those of the IMF or IMF policy. Working Papers describe research in progress by the
author(s) and are published to elicit comments and to further debate.
2
Contents Page
Abstract ......................................................................................................................................1
I. Introduction ............................................................................................................................3
II. Thin Capitalization Rrules ....................................................................................................7
III. Multinational Firm and Country Data..................................................................................9
IV. Empirical Results ...............................................................................................................12
A. The impact of introductions of thin capitalization regimes ....................................12
B. Regression results ....................................................................................................13 C. Extensions ...............................................................................................................17 D. Aggregate firm implications of thin capitalization rules ........................................18
V. Conclusions .........................................................................................................................20
References ................................................................................................................................21
Table
1. Characteristics of thin capitalization rules at year-end 2004 ...............................................23
2. Descriptive statistics and correlations ..................................................................................25
3. The introductive of thin capitalization rules and borrowing ................................................28
4. Thin capitalization restrictions on total debt and total borrowing by US affiliates .............29
5. Thin capitalization restrictions on internal debt and borrowing
from the parent relative to equity ........................................................................................30
6. Thin capitalization restrictions on the share of internal debt
and borrowing from the parent ...........................................................................................31
7. Internal leverage restrictions and the total debt and total borrowing
by US affiliates ...................................................................................................................32
8. The application of thin capitalization rules and US affiliate financing ...............................33
9. The short-term impact of changes in thin capitalization rules on
US affiliate financing ..........................................................................................................34 10. Impact of thin capitalization rules on Tobin’s Q, debt, and interest expense at the
consolidated firm level ........................................................................................................35
Figure
1. US affiliates’ debt ratios and corporate taxation ..................................................................36
3
I. INTRODUCTION
Interest on debt is generally deductible from taxable income at the corporate level. This
provides firms with an incentive to finance their operations with debt rather than equity,
especially in high tax countries (Graham, 1996, 2000; MacKie-Mason, 1990). To counteract the
negative consequences of debt finance for tax collection, many countries have instituted thin
capitalization rules that restrict the deductibility of interest above a certain debt level. In
principle, multinational enterprises can adjust the leverage of their foreign subsidiaries easily
through international debt shifting (Desai, Foley, and Hines, 2004; Huizinga, Laeven, Nicodème,
2008). This suggests that quantitative restrictions on foreign affiliates in the form of thin
capitalization rules can be an important determinant of foreign affiliate leverage. However,
studies of capital structure in the corporate finance literature typically capture tax advantages of
debt exclusively using information on tax rates, without consideration of other differences in tax
codes that constrain leverage and thus the value of tax shields (see, for example, Rajan and
Zingales, 1995). This is surprising given the prevalence of these measures and their potential
influence on capital structure decisions. Thin capitalization rules thus are an important source of
understudied variation in tax rates in capital structure studies.
This paper examines how thin capitalization rules worldwide affect the capital structure
of foreign affiliates of US multinational firms. Countries’ thin capitalization regimes differ
among several key dimensions. First, they tend to vary in the definition of the maximum debt
ratio, beyond which interest on debt is no longer deductible. The definitions of the maximum
debt ratios fall into two main categories: either they restrict total debt (relative to assets or
alternatively equity), or they limit debt from related parties (relative to equity). Second, thin
capitalization rules differ in the treatment of interest on debt determined to be excessive. For
instance, interest deductibility may be denied only for interest on debt in excess of the limit or on
all debt, and also possibly be requalified as a dividend with unfavorable tax consequences. Third,
countries vary in the zeal of their enforcement of thin capitalization rules. In some countries, the
rules trigger an automatic disallowance of interest deductions so there is not subjectivity in the
thin capitalization thresholds. Yet, other countries apply some discretion in their application, and
consider the corporate indebtedness at similar, but unrelated, firms (i.e., firms that stand at
“arm’s length”) to determine whether interest deductibility is limited.
The effect of thin capitalization rules on multinational firm leverage is not a priori
evident. Despite clear evidence from managerial survey results reported in Graham and Harvey
(2001) that tax implications are important determinants of firm leverage, the empirical literature
on taxation and capital structure, as reviewed in Auerbach (2002) and Graham (2003), has found
it remarkably difficult to identify strong effects of tax incentives on capital structure, due in part
to measurement problems and lack of variation in tax rates. This suggests we should expect to
find it similarly challenging to establish strong effects of thin capitalization rules on affiliate
leverage. Moreover, thin capitalization rules can be very detailed and we therefore need to
capitalize on the heterogeneity in these rules to identify clear effects. As Desai, Foley, and Hines
(2004) point out: “These rules are typically vaguely worded and seldom, though arbitrarily,
4
imposed, making their effects difficult to analyze quantitatively; any impact they have is likely to
reduce the estimated significance of factors influencing total indebtedness.” Also, their
effectiveness will depend on the extent to which they are enforced by local tax authorities.
Finally, even if we find that thin capitalization rules constrain affiliate leverage, as one would
expect, it is not a priori clear what their impact is on overall firm leverage and valuation because
multinational firms can relocate debt and activity away from countries with strict thin
capitalization rules.
We address these concerns by using both broad measures of thin capitalization rules that
simply denote whether such rules are in place, in addition to specific, well-defined aspects of
thin capitalization rules, to thus strike a balance between power and precision in identifying the
sensitivity of affiliate leverage to thin capitalization rules. Moreover, we achieve identification
by exploiting the substantial cross-country and time variation in thin capitalization rules, and by
considering the differential impact of these rules across affiliates within the same multinational
firm, thus contributing to the broader literature on taxation and debt, where the lack of variation
in corporate income tax rates has made it difficult to isolate taxation effects. In addition, we
study the aggregate implications of thin capitalization rules by investigating their impact on the
firm’s overall leverage, interest expense bill, and market valuation.
For our empirical analysis, we have constructed a unique data set on each of these
dimensions of thin capitalization regimes for 54 countries over the years 1982-2004. The end of
the sample period is determined by the last year for which we have detailed debt information on
foreign affiliates.2 There is much variation across countries both in terms of the existence of thin
capitalization rules and whether such rules apply to total or internal leverage. For 2004, we find
that 27 of these 54 countries had enacted explicit thin capitalization regimes. This group can be
divided into 16 countries that restricted total leverage (i.e., the ratio of total debt to assets), while
11 countries restricted internal leverage (i.e., the ratio of debt from related parties to equity).
Furthermore, 17 countries apply their thin capitalization rules automatically, while 10 countries
apply discretion based on comparisons with corporate indebtedness in arm’s length situations.
Our empirical analysis relates information on the existence and stringency of thin
capitalization regimes to the total or internal leverage of foreign affiliates of US multinationals
using confidential data from the US Bureau of Economic Analysis. Given the prevalence of
restrictions on total leverage in 2004, we first consider how these restrictions affect the total
leverage of foreign affiliates. On average, the existence of a total leverage restriction reduces an
affiliate’s total leverage by 1.9%. Stricter regimes reduce total leverage more; we find that lower
allowable total leverage ratios are associated with lower levels of leverage.
2 Note that the 2009 BEA annual (BE-10 and BE-11) surveys do not include as detailed information on the types of
liabilities as prior surveys.
5
In analogous fashion, we consider the impact of thin capitalization rules that limit internal
leverage on US affiliate internal leverage. The existence of such rules on average reduces the
internal leverage ratio by 6.3%. In addition, internal leverage declines with the allowable internal
leverage ratio. The large average impact of restrictions on internal debt may reflect that
multinationals can easily adjust internal leverage on the basis of tax considerations.
A high responsiveness of internal debt to restrictions on internal leverage suggests that
such restrictions can have a material impact on an affiliate’s total leverage as well. Indeed, we
find that the existence of restrictions on internal leverage on average reduces total leverage by
0.8%. Restrictions on internal leverage thus materially affect the foreign affiliate’s overall
leverage, going beyond affecting whether the parent firm funds its foreign affiliate through debt
or equity.
The impact of thin capitalization rules on leverage ratios depends importantly on how
they are applied. The impact of the existence of thin capitalization rules generally on total
leverage, in particular, is about twice as large if their application is objective (i.e., automatic
rather discretionary). In addition, an impact on total leverage of internal leverage restrictions
specifically is only found if its application is automatic.
As an extension, we exploit variation over time in thin capitalization rules to examine
how new thin capitalization regimes affect the various leverage ratios in the first years
following their introduction by estimating regressions of our leverage ratios in first differences
between benchmark years. The short-term response of thin capitalization rules generally tends to
be smaller than the average or long-term response. However, total leverage (internal leverage)
responds quickly and fully to the introduction of a total (internal) leverage restriction.
Furthermore, we show that thin capitalization regimes have aggregate firm effects. They
reduce the multinational firm’s aggregate interest expense bill and lower the overall valuation of
the firm, consistent with a reduced worldwide deductibility of interest from taxable income.
Taken together, our results suggest that thin capitalization rules are an effective policy
instrument to constrain leverage within the prescribed limits, with implications for firm valuation
as a whole.
Previously, Desai, Foley and Hines (2004) have examined the impact of taxation on the
capital structure of US multinationals using the same data source from the US Bureau of
Economic Analysis. Using data over the 1982-1994, they find that a 10% increase in the host-
country tax rate raises the total debt to assets ratio of US foreign affiliates by 2.6% (in their
regression 1 of Table II). We extend their analysis by considering the joint impact of host-
country taxation and thin capitalization rules on affiliate leverage through 2004. In a regression
analogous to Desai, Foley and Hines (2004), we find that a 10% higher local tax increases the
total debt to assets ratio by 2.0%, consistent with their findings for an earlier period.
Other work on the impact of taxation on the capital structure of multinational firms
similarly tends to ignore thin capitalization rules. Similar to Desai, Hines and Foley (2004),
6
Huizinga, Laeven, and Nicodème (2008) report that a 10% increase in the local tax rate is
associated with a rise in the ratio of a foreign affiliate’s total debt to assets ratio of about 2%
using data from 32 European countries between 1994 and 2003. Similar results are also obtained
by Mintz and Weichenrieder (2005) using data on the foreign subsidiaries of German
multinational firms. Using data on affiliates of US multinationals, as we do, Hines and Rice
(1994) show that US firms typically can arrange their finances to benefit from the deductibility
of interest expense in high-tax countries by deferring US taxes until profits are repatriated from
foreign affiliates. Froot and Hines (1995) examine the effects of limits to the deductibility of
interest expenses due to the US allocation rules on the financing of US multinational firms;
Desai and Hines (1999) analyze changes in joint venture capital structure in response to foreign
tax credit limitations; Altshuler and Grubert (2003) study inter-affiliate transactions motivated by
tax rules among affiliates of US multinationals; and Newberry and Dhaliwal (2001) examine the
role of local tax-loss carry-forwards on the international location of debt issuance by US
multinationals.
To the best of our knowledge, ours is the first paper to consider the role of thin
capitalization rules in the context of US multinational firms. Empirical analysis on the economic
effects of thin capitalization rules has so far been limited to German firms, using the
Bundesbank’s MiDi database, which provides data on German multinationals and their foreign
affiliates. A first set of papers investigate the impact of a change to Germany’s thin cap rule in
2001, which reduced the limit on the internal debt to equity ratio from 3 to 1.5, on affiliate
leverage. Wamser (2008) finds that firms for which the rule was binding prior to the 2001 reform
increased their external debt to capital ratio by 2.5% compared to those for which the rule was
not binding. Weichenrieder and Windischbauer (2008) find a similar result and point to a
loophole in the legislation which offers a more lenient thin cap rule for holding companies.
A second set of papers look more generally at the effectiveness of thin capitalization rules
in the host countries of foreign affiliates of German multinationals. Overesch and Wamser
(2010) find a negative effect of thin capitalization rules on internal debt based on German
inbound investment data from 1996 to 2004. Finally, Buettner, Overesch, Schreiber and Wamser
(2012) take into account information on thin capitalization rules to investigate the tax sensitivity
of the capital structure of the foreign subsidiaries of German multinationals.3 In particular, they
use data on the existence and maximum debt ratio of thin capitalization regimes in 29 countries
over the 1996-2004 period. They report that the existence of a thin capitalization rule reduces the
impact of a 10% tax increase on the ratio of total debt to assets for German foreign subsidiaries
from 2.1% to 1.6%. Their regression analysis, however, does not directly control for the
existence of thin capitalization rules, and thus potentially confounds the direct impact of thin
3 At a theoretical level, Haufler and Runkel (2012) show that tax competition between two identical countries leads
to inefficiently low tax rates and inefficiently lax thin capitalization rules (and inefficiently high tax-deductible
internal debt of multinational firms), hence a coordinated tightening of thin capitalization rules benefits both
countries, even though it intensifies competition via tax rates.

7
capitalization rules per se with their indirect effect through a changed tax sensitivity of leverage.
In our estimation, we explicitly include information on thin capitalization rules where indicated.
In addition, we collect information on thin capitalization rules for a much broader set of 54
countries, which allows us to distinguish the effects of the existence of thin capitalization rules
targeting total versus internal leverage on foreign-affiliate capital structure. Furthermore, our
data set on thin capitalization rules is more detailed, which allows us to estimate how various
features of thin capitalization regimes, including the method of applying thin capitalization rules,
affect their impact on foreign-affiliate capital structure. And, unlike existing work, we consider
the aggregate implications for leverage and valuation for the firm as a whole.
The paper continues as follows. Section 2 presents our international data set on thin
capitalization rules. Section 3 discusses the firm-level and other country-level data used in this
study. Section 4 presents the empirical results. Section 5 concludes.
II. THIN CAPITALIZATION RULES
This section describes our international data set on thin capitalization regimes. We have
collected information on the existence and main features of thin capitalization regimes in 54
countries over the 1980-2004 period. This information has been gathered from a variety of
sources, including the International Bureau for Fiscal Documentation, Brosens (2004), and
national tax authorities. Our focus is on regimes applicable to firms that are affiliates of foreign
parents.
In practice, thin capitalization regimes differ widely across countries in the restrictions
they put on the tax deductibility of interest on company debt, in the discretion that authorities
have in applying these restrictions, and in the alternative tax treatment of company interest that is
applicable in case full interest deductibility is denied.
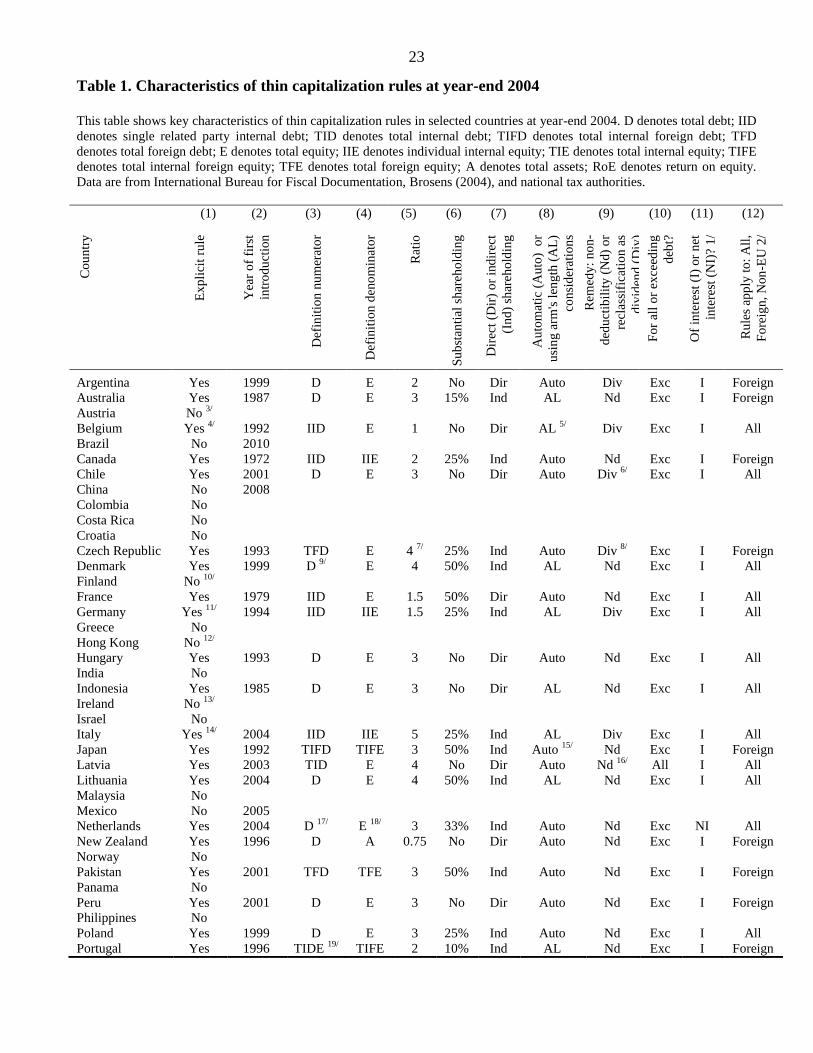
Table 1 provides information on thin capitalization rules internationally in 2004. As seen
in column 1, 27 out of 54 countries in the sample had an explicit thin capitalization regime in
that year.4 The year of first introduction of an explicit thin capitalization regime is indicated in
column 2. Early adopters included Canada in 1972 and France in 1979, followed by Australia,
Indonesia, the United Kingdom, and the United States in the 1980s. Other countries enacted their
thin capitalization rules after 1990. For completeness, the table also denotes the year of adoption
for those countries that introduced thin capitalization rules after 2004, the end of our sample
period.
Thin capitalization regimes cap the amount of debt for which interest is tax deductible.
Typically, interest deductibility is restricted if a measure of the company’s debt relative to its
4 Several other countries implicitly limited interested deductibility of foreign subsidiaries by having general anti-
abuse provisions against excessive deductions of interest from taxable income.

8
assets or equity exceeds a certain ratio. The exact definitions of the debt measure in the
numerator of the ratio and of assets or equity in its denominator vary widely across countries. As
seen in column 3, the pertinent debt measure can be total debt, internal debt from a single related
party, total internal debt, total internal foreign debt, or total foreign debt. The thin capitalization
ratio considers the relevant debt measure relative to total assets (only for the case of New
Zealand), total equity, internal equity from a single related party, total internal equity, total
internal foreign equity, or total foreign equity, as seen in column 4. The main distinction among
the various possible definitions of the thin capitalization ratio is whether it restricts interest
deductibility for total debt or internal debt. In the table, 16 countries are seen to limit interest
deductibility for total debt, while 11 countries limit the deductibility for internal debt. The
numerical value of the thin capitalization ratio is presented in column 5. Argentina, for instance,
imposes a ratio of total debt to total equity of 2.
Some countries restrict the applicability of the thin capitalization regime to foreign
subsidiaries that are substantially owned by their foreign parent. Column 6 lists the minimum
ownership share of the foreign parent for the thin capitalization regime to apply. In the case of
Denmark, for instance, the thin capitalization regime only applies if the foreign parent has a
substantial ownership share of 50% or more. The minimum substantial ownership share for the
thin capitalization rule to apply can be based on direct and/or indirect ownership of the foreign
affiliate. As seen in column 7, 17 countries are seen to also include indirect ownership.
Countries differ importantly in how strictly they apply the thin capitalization ratio in
determining the interest deductibility for resident foreign subsidiaries. Application of the thin
capitalization ratio can be automatic which means that interest deductibility is always restricted
if the foreign subsidiary’s debt ratio exceeds the relevant ratio (and never restricted if the debt
ratio is less than the relevant ratio, the so-called “safe harbor”). Alternatively, a country can use
discretion in applying the thin capitalization ratio, considering a foreign subsidiary’s leverage in
comparison to the leverage of similar resident firms that are not foreign subsidiaries (i.e.,
comparing actual leverage to leverage on an arm’s length basis). Column 8 shows that 17
countries apply their thin capitalization rule automatically.
Next, countries apply one of two primary methods to limit interest deductibility if
leverage is found to exceed the pertinent ratio. First, they can simply deny some or all interest
deductibility. Second, they can reclassify the excess interest as dividends. The second method of
interest limitation implies that nonresident dividend withholding taxes apply, rather than
nonresident interest withholding taxes. Hence, reclassification of interest as dividends is the
harsher remedy, if the pertinent dividend withholding tax exceeds the alternative interest
withholding tax. In column 9, we see that 18 countries only restrict interest deductibility, while 9
countries in addition reclassify interest as dividends.
The disallowance of interest can apply to interest on all debt, as is the case in Latvia, or
only to interest on debt in excess of the ratio limit, as is the case in all other countries (see
column 10). At the same time, the affected interest payments can be interest payments to the
9
provider of credit on a net basis, as in the case of the Netherlands, or alternatively on a gross
basis, as in all other cases (see column 11). Finally, the thin capitalization rule can apply to debt
from all sources (including domestic sources), to debt only from foreign sources, or to debt from
foreign, non-EU sources, as in the case of Spain (see column 12).
In the empirical work, we include variables reflecting the existence, stringency, and
automatic application of thin capitalization rules based on information as reflected in Table 1.
III. MULTINATIONAL FIRM AND COUNTRY DATA
Our empirical work uses data on the financial statements of US multinationals and their
foreign affiliates as collected by the Bureau of Economic Analysis in its annual survey of US
Direct Investment Abroad. Such reporting is made on a confidential and compulsory basis,
which enhances the representativeness of the data. Our sample contains data for five benchmark
years (1982, 1989, 1994, 1999 and 2004) and 54,273 affiliate-year observations.
The empirical analysis considers the impact of thin capitalization regimes on two
affiliate-firm leverage variables. First, Total leverage is the ratio of total US foreign affiliate debt
to assets. This total leverage variable is directly affected by thin capitalization regimes that
restrict total debt. Second, Internal leverage is the ratio of internal debt owed to the US parent to
equity, and is directly affected by thin capitalization regimes that target internal debt.5 To gauge
the broader implications of restrictions on internal debt for affiliate leverage, we in addition
examine the Internal debt share, defined as the ratio of internal debt relative to total debt. From
Panel A of Table 2, we see that Total leverage, Internal leverage and Internal debt share have
mean values of 0.552, 0.154, and 0.084 in the overall sample, respectively. However, there is
much variation in these leverage ratios across firms. For example, while Internal debt share is
close to zero for the median affiliate firm in the sample, the standard deviation of Internal debt
share is substantial at 0.352. Additionally, as seen in Figure 1, all three debt variables have
trended down over the 1982-2004 period. The average of Total leverage in particular has
declined from 59.4% in 1982 to 51.0% in 2004, while Internal leverage declined from 12.0% in
1982 to 2.5% in 2004. Over the same period, Internal debt share declined from 14.9% to 6.0%,
indicating a reduced reliance on internal finance by US multinationals.
The empirical analysis relates the affiliate debt variables to tax policy variables, as well
as a host of affiliate-level and host-country control variables. To allow comparison with earlier
5 The BEA data provide three categories of liabilities: (a) trade accounts and trade notes payable (current); (b) other
current liabilities and long-term debt and (c) o ther noncurrent liabilities. Our total leverage variables are based on
category (b). Because the BEA combines categories (a) and (b) for reporting internal liabilities, our internal leverage
includes trade credit. As a limitation, the BEA data do not provide any information on intercompany debt with other
affiliates in the organization. The only information provided is the liability to the US parent. So, there may be
affiliates that appear to have low intercompany debt while in reality holding debt from other affiliates within the
group.

10
results in the literature, our choice of control variables is determined by those used in previous
studies on international capital structures, in particular those by Rajan and Zingales (1995) and
Desai, Foley, and Hines (2004). Our measure of tax incentives is Country tax rate, constructed as
the median corporate tax rate in the affiliate host country estimated annually using affiliate-level
effective tax rates.6 A higher corporate tax burden is expected to increase affiliate leverage. The
decline in Country tax rate in Figure 1, along with the declines in Total leverage and Internal
leverage, is consistent with this. The concomitant decline in Internal debt share suggests a
relatively large sensitivity of internal debt to host-country taxation.
We define several variables to represent the existence, stringency, and method of
application of thin capitalization regimes. To start, Thin cap restriction is a dummy variable that
equals 1 if a country has an explicit thin capitalization, and zero otherwise. From Panel A of
Table 2, we see that a thin capitalization regime applies in 58.1% of our affiliate-year
observations. Next, we distinguish whether the regime restricts the use of total debt or the use of
internal debt. Specifically, Total leverage restriction is a dummy variable that equals 1 if a
country imposes a restriction related to total debt (relative to assets or equity), and zero
otherwise, while Internal leverage restriction is a dummy variable that equals 1 if a country
imposes a restriction on the use of internal debt (relative to equity). Mean values for these
variables in Table 2 imply that the thin capitalization restriction applies to total debt in 25.2% of
our observations (or 43.4% of the affiliates facing thin capitalization interest limitations).
As a measure of thin capitalization regime stringency, Total leverage ratio is the
maximum value of the ratio of total debt to assets. The Total leverage ratio is constructed as
f
1+fwhere f is the maximum total debt-to-equity ratio, in case the ratio test applies to the total
debt to equity ratio. Total leverage ratio has a value of one if no total leverage restriction applies.
The sample mean for this variable is 0.904. Analogously, Internal leverage ratio is the maximum
value of the ratio of internal debt to the sum of internal debt and equity. Internal leverage ratio is
constructed as
1 where is the maximum internal debt to equity ratio, in case an internal
leverage restriction applies. Internal leverage ratio has a value of one if no internal leverage
restriction applies. The mean value for this variable is 0.895. To capture discretion in the
application of the thin capitalization regime, Arm’s length is a dummy variable that equals 1 if
the application of the thin capitalization rules is based on subjective criteria such as comparisons
to peers, and zero otherwise. Arm’s length is one in 40.6% of the instances where a thin
capitalization regime is in force.
6 We follow Desai, Foley and Hines (2001) and estimate the country level tax rate as the median of affiliates’ ratio
of tax expense to pre-tax income. We eliminate affiliate observations with negative net income in our country-level
tax rate estimates.
11
Next, there are four non-tax, affiliate-level control variables constructed using BEA data.
First, Net PPE/assets is the ratio of net property, plant and equipment to total assets in the
affiliate. Tangible assets can be depreciated and provide a non-debt tax shield to minimize
taxable profit (DeAngelo and Masulis, 1980). At the same time, tangible assets may serve as
collateral enhancing leverage (Rajan and Zingales, 1995). Second, EBITDA/assets is the ratio of
earnings before interest, depreciation and amortization to total assets. Profitable firms may have
easier access to credit, providing a positive relation between EBITDA/assets and leverage.
Conversely, profitable firms have the means to pay down their debts reducing their leverage (as
suggested by the pecking order theory of Myers and Majluf (1984)). Third, Log of sales is the
logarithm of sales as a proxy for affiliate size.7 Larger firms may have easier access to credit
thanks to higher asset diversification and lower bankruptcy risks giving rise to higher leverage.
Fourth, Growth options is the compounded annual growth rate of total affiliate sales at the
industry and country level. This variable captures the prospects of future profitability and the
implied borrowing capacity. Hence, this variable is expected to be positively related to leverage.
We use three host-country level variables as additional controls. First, Creditor rights is
an index of creditor rights from Djankov, McLiesh and Shleifer (2007). Better creditor rights are
generally expected to facilitate leverage. Better creditor rights, however, by deepening external
debt markets may reduce the need for internal finance, and hence could be negatively related to
internal leverage. Second, Political risk is the annual index of political risk from the
International Country Risk Guide, rescaled so that a higher score indicates a higher risk. Its
impact on leverage is a priori ambiguous. Higher political risks may lead creditors to reduce their
lending to companies in the host country. On the other hand, from a company’s perspective, a
higher political risk may encourage borrowing to reduce the value at risk in the host country.
Third, Rate of inflation is the annual percentage change in the consumer price index from the
World Development Indicators database of the World Bank. Inflation is potentially negatively
related to leverage if it increases the risk premium to be paid to obtain credit. On the other hand,
higher inflation rates generally engender higher nominal interest rates increasing the value of the
debt tax shield, which could increase leverage.
Panel B of Table 2 reports regression variables at the aggregate firm level (the next
section provides more details on the construction of these variables). Aggregate thin cap
restriction is the ratio of the sum of the assets of foreign affiliates subject to a thin capitalization
restriction relative to the total assets of the consolidated firm. Aggregate total leverage
restriction is the ratio of the sum of the assets of foreign affiliates subject to a total leverage
restriction relative to the total assets of the consolidated firm. Aggregate internal leverage
restriction is the ratio of the sum of the assets of foreign affiliates subject to an internal leverage
restriction relative to the total assets of the consolidated firm. Aggregate interest expense is the
ratio of total interest expense to total assets of the consolidated worldwide firm. Aggregate
7 Sales is preferred to assets because this latter appears in the denominator of our dependent variables. In addition,
using assets would create a bias towards asset-intensive industries.
12
interest expense to debt is the ratio of total interest expense to total debt of the consolidated
worldwide firm.
The data indicate that thin capitalization rules are relevant from the perspective of the
multinational firm as a whole, with on average about 15 percent of the multinational firm’s assets
being subject to a thin capitalization restriction. Among these assets, on average about 6 percent
of assets are subject to a total leverage restriction and about 9 percent of assets are subject to an
internal leverage restriction. Interest expense on debt averages about 11 percent, reflecting that
borrowing costs are denominated in nominal terms and subject to sovereign risk in the host
country of the affiliate firm.
Panel C of Table 2 provides correlations among main debt, tax policy, and control
variables. Total leverage is seen to be positively correlated with the Country tax rate, and
negatively correlated with Thin cap restriction, Total leverage restriction and Internal leverage
restriction. Among the host-country control variables, Total leverage is positively correlated
with Creditor rights and negatively correlated with Political risk. Furthermore, Country tax rate
and Thin cap restriction are positively correlated, indicating that high-tax host countries are more
likely to have thin capitalization regimes. Consistent with this, Country tax rate is positively
related to Internal leverage restriction, but contrary to this it is negatively correlated with Total
leverage restriction.
IV. EMPIRICAL RESULTS
This section presents empirical results on the impact of thin capitalization regimes on the
capital structure of the foreign affiliates of US multinationals. In subsection 4.1, we present the
results of univariate tests of the effects of the introduction of thin capitalization regimes on total
and internal leverage. Subsection 4.2 presents the results of regressions that relate these two
variables and also the internal debt share to the existence of thin capitalization regimes and the
implied limits on debt ratios. Subsection 4.3 presents several extensions. First, we examine
whether thin capitalization regimes affect the main debt ratios differently depending on whether
the rules are applied automatically or take into account arm’s length considerations. Second, we
exploit cross-country variation over time in the introduction of thin capitalization regimes to
examine how new thin capitalization regimes affect the various debt ratios in the short-term,
defined as the first year after their introduction. Finally, in subsection 4.4 we construct measures
of the extent to which US multinationals are subject to thin capitalization regimes worldwide at
the consolidated firm level to see whether global thin capitalization regimes affect valuation,
total leverage, and interest payments at the level of the overall multinational firm.
A. The impact of introductions of thin capitalization regimes
In this subsection, we report univariate tests of the impact of introductions of thin
capitalization rules on mean values of affiliate total and internal leverage. Focusing on these
13
regime changes enhances the identification of the impact of thin capitalization rules on affiliate
debt because it is unlikely that the introduction of thin capitalization rules in non-US countries is
endogenously determined by US affiliate capital structures. During the sample period, eight
countries have introduced a total leverage restriction where we have sufficient data to construct
ex ante and ex post mean leverage values. Panel A of Table 3 lists the country names, the ex ante
and ex post mean values of Total leverage and Internal leverage, and the significance levels of
tests regarding whether ex post and ex ante mean values of the total and internal leverage
variables are different. For all eight introductions, the ex post mean value of Total leverage is
seen to be lower than the ex ante mean value. Across these cases, the introduction of a total
leverage restriction reduces mean Total leverage on average by 4.5%. The reduction in total
leverage is statistically significant in three-quarters of the countries. Internal leverage, in turn,
also declined in all eight cases, and significantly in six cases. The mean decline in Internal
leverage is 4.5%.
During the sample period, seven countries introduced an internal leverage restriction
where we can compare ex ante and ex post mean leverage variables as seen in Panel B.8 In each
of these seven cases, the introduction occasioned a drop in the mean Total leverage variable, and
the drop in mean Total leverage is statistically significant for all but one introductions. The
overall mean drop in Total leverage was 4.6%. In all seven instances, we also observe a
reduction in Internal leverage, with six of these reductions being statistically significant. The
overall mean drop in Internal leverage is 3.3%. These results suggest that the introduction of thin
capitalization rules tends to have a significant causal effect on affiliate leverage. In what follows,
we confirm this using regression analysis when controlling for other contemporaneous factors
that could potentially confound these univariate tests. But first we turn to regressions that
estimate the average effect of thin capitalization rules on affiliate leverage.
B. Regression results
In this section, we report regressions that relate measures of US affiliate borrowing to
variables describing various aspects of thin capitalization regimes, in addition to traditional
correlates of capital structure employed in the literature (see, for example, Rajan and Zingales,
1995; and Desai, Foley, and Hines, 2004). As discussed, there is much variation in thin
capitalization rules, with 43% of thin capitalization regimes in our sample restricting total
leverage. We start with considering the determinants of Total leverage, including information on
the existence and stringency of thin capitalization regimes that restrict total leverage. Then we
consider analogously how thin capitalization regimes, and in particular regimes that restrict
internal leverage, affect the Internal leverage variable.
8 Note that Australia has adopted both an internal and external thin capitalization regimes during our sample period.
In 1987, Australia adopted an internal leverage restriction and then changed to a total level restriction in 2002.
14
Next, we consider whether internal leverage restrictions affect the affiliate financing
structure beyond the ratio of internal debt to equity. Internal leverage restrictions possibly change
the mix of internal and external debt of the firm. To examine this, we first consider the impact of
internal leverage restrictions on the Internal debt share. The evidence of Table 3 suggests that
internal leverage restrictions affect Total leverage as well. To conclude, therefore, we examine
the relationship between internal leverage restrictions and Total leverage as well. Throughout,
regressions include parent, industry, and year fixed effects. Standard errors control for potential
two-way clustering across observations at the country and industry level.
Table 4 reports regressions of an affiliate’s total leverage. Regression 1 relates this
variable to Country tax rate and control variables. The estimated coefficient for the country tax
rate is 0.197 and it is significant at 1%. Thus, affiliates in high-tax host countries have higher
total leverage to benefit more from interest deductibility. Among the control variables, total
leverage is positively and significantly related to Net PPE/assets, consistent with the view that
tangible assets may serve as collateral for borrowings. EBITDA/assets obtains a negative and
significant coefficient, suggesting that profitable firms are able to pay down their debts. Log of
sales enters the regression with a positive and significant coefficient, indicating that larger firms
may have better access to credit. Creditor rights receives a positive and significant coefficient, as
creditor protection may increase the supply of credit to the firm. Political risk negatively and
significantly affects total leverage. Total leverage is negatively related to Inflation, as interest
rates may incorporate higher risk premiums in highly inflationary environments. Finally, total
leverage is positively related to Growth opportunities, but the estimated coefficient is statistically
insignificant. Overall, these results confirm the findings in Desai, Foley, and Hines (2004) that
were estimated using the same dataset for an earlier period.
Regression 2 includes the Thin cap restriction dummy variable that signals the existence
of a thin capitalization regime. This variable obtains a coefficient of -0.0214 that is significant at
the 1% level, indicating that thin capitalization regimes generally reduce affiliate total leverage.
The tax variable now obtains a somewhat higher coefficient of 0.223 that is significant at 1%,
suggesting that the estimate on the tax variable is biased downward in regression 1 on account of
the missing thin capitalization variable. In unreported regressions, we find that this reduction in
leverage is driven by a decrease in debt rather than an increase in assets.
A thin capitalization regime reduces or eliminates the incentive to take on more debt so
as to reduce taxable income. Hence, thin capitalization regimes potentially reduce the sensitivity
of the affiliate’s borrowing to a country’s corporate income tax rate. To test this, regression 3
includes an interaction term of the Country tax rate and Thin cap restriction variables. In this
regression, Thin cap restriction and its interaction with Country tax rate obtain coefficients of -
0.272 and 0.0183, respectively, that are insignificant.
In regression 4, we replace the Thin cap restriction variable by the Total leverage
restriction variable starting from regression 2. The Total leverage restriction variable obtains a
coefficient of -0.0186 that is significant at 1%. As expected, thin capitalization regimes that
15
target total leverage serve to reduce total leverage. Regression 5 includes an interaction term of
Country tax rate with Total leverage restriction. The total leverage restriction variable obtains a
coefficient of -0.0445 that is significant at 1%, but the interaction term is statistically
insignificant.
A key feature of a thin capitalization regime that restricts total leverage is the quantitative
value of the maximum total leverage. In regressions 6 and 7, we replace the Total leverage
restriction variable with the Total leverage ratio, found in regressions 3 and 4. The total leverage
ratio in these two regressions obtains coefficients of 0.0307 and 0.119, respectively, which are
significant at 10% and 5%, respectively. Recall that the definition of the total leverage ratio
implies that the more lenient the regime, the higher this ratio, hence we expect positive
coefficients. These results therefore indicate that a looser quantitative restriction on total
leverage enables the affiliate to maintain higher total leverage. The interaction term of Country
tax rate and Total leverage ratio in regression 7 is negative and statistically significant
suggesting that tighter thin capitalization limits are less constraining in affiliates facing higher
tax rates.
Overall, Table 4 shows that thin capitalization regimes, and in particular the Total
leverage restriction and the Total leverage ratio variables, have a material impact on Total
leverage.
Thin capitalization regimes that restrict internal leverage are expected to have a direct
impact on internal leverage. This is what we consider next. Table 5 presents regressions that
relate Internal leverage to thin capitalization regimes, and, in particular, to information on the
existence and quantitative value of regimes that restrict internal leverage. Otherwise, the
regressions in Table 5 are fully analogous to those in Table 4.
In regression 1, the Country tax rate receives a coefficient of 0.368 that is significant at
the 1% level. In regression 2, the Thin cap restriction dummy enters with a negative coefficient
of -0.0800 that is significant at 1%. Regression 3 adds the interaction of the Country tax rate and
the Thin cap restriction dummy variable, yielding an estimated coefficient that is statistically
insignificant. Regression 4 includes the Internal leverage restriction variable instead of the Thin
cap restriction variable, yielding a coefficient of -0.0629 that is significant at 1%. This variable
and its interaction with Country tax rate are both statistically insignificant in regression 5.
Regression 6 includes the Internal leverage ratio. This variable is estimated with a positive
coefficient of 0.196 that is significant at 1%. This is evidence that a quantitative relaxation of an
internal leverage restriction engenders higher internal leverage, as is to be expected. Regression
7 in addition includes an interaction of Country tax rate and Internal leverage ratio, providing
statistically insignificant coefficients for both the internal leverage ratio itself and the interacted
variable. Overall, Table 5 shows that thin capitalization regimes that restrict internal leverage
have a material impact on this leverage variable.
16
Next, we consider whether internal leverage restrictions affect the financing structure of
the US foreign affiliate more broadly, beyond the internal leverage ratio. In particular, we
consider in turn the impact of this type of restriction on the Internal debt share and Total
leverage.
Table 6 show regressions of the Internal debt share that apart from the different
dependent variable are analogous to Table 5. Regression 1 displays a positive relationship
between the Internal debt share and the Country tax rate, with an estimated coefficient for the
tax variable of 0.117 that is significant at 1%. This is consistent with the view that internal debt
is more tax sensitive than external debt. In regression 2, Thin cap restriction has a negative
coefficient that is significant at 10% suggesting that internal debt is more sensitive to thin
capitalization restrictions. In regression 6, the coefficient on Internal leverage ratio is positive
and significant. This is evidence that internal debt expands relative to total debt if the internal
leverage restriction is loosened. The Internal leverage restriction and its interaction with
Country tax rate, in turn, are estimated with significant positive and negative coefficients in
regression 7, suggesting that the internal debt to total debt ratio increases relatively little in high-
tax countries as the internal leverage restriction is relaxed.
Next, we consider the indirect impact of thin capitalization regimes that restrict internal
leverage on total leverage in Table 7. While thin capitalization rules that restrict internal leverage
have a direct bearing only on internal leverage, they may affect total leverage indirectly if
internal and external leverage are imperfect substitutes. This is indeed what we find. Specifically,
regressions 1 and 2 in Table 7 include the Internal leverage restriction and are otherwise
analogous to regressions 4 and 5 of Table 4. The Internal leverage restriction enters regression 1
of Table 7 with a coefficient of -0.0082 that is significant at 1%. Comparing regression 4 in
Table 4 with regression 1 in Table 7, we see that the impact of an internal leverage restriction on
total leverage is about half the impact of a total leverage restriction on the same leverage
variable. In regression 2, the estimated coefficients for Internal leverage restriction and its
interaction with Country tax rate, however, are both insignificant.
Regressions 3 and 4 of Table 4 are analogous to regressions 6 and 7 of Table 4. In
regression 3, the Internal leverage ratio enters with a positive coefficient that is significant at
5%. In regression 4, Internal leverage ratio and its interaction with Country tax rate obtain
coefficients that are both insignificant. Overall, restrictions on internal leverage appear to have a
significant impact on total leverage.
Results presented thus far may be influenced by the decision where to locate affiliates. To
address concerns that location decisions are driving the results, in unreported regressions we
rerun the regressions in Tables 4 to 7 for the sample of parents with affiliates in the same set of
countries over the period 1982 to 2004. The results are qualitatively unaltered.
17
C. Extensions
We first consider how discretion in the application of thin capitalization rules affects the
financing structure of the foreign affiliates of US multinationals. Discretion in the application of
the thin capitalization rules is captured by the Arm’s length variable which signals that interest
limitation is not automatic, but entails some subjectivity on the basis of arm’s length
considerations. Of all thin capitalization regimes, 40.6% allow for some discretion based on
arm’s length considerations. Regression 1 of Table 8 includes the Thin cap restriction variable
and its interaction with the Arm’s length variable in a total leverage regression similar to
regression 2 of Table 4. Thin cap restriction and its interaction with Arm’s length obtain
coefficients of -0.0276 and 0.0169, respectively, which are both significant. This suggests that
the impact of a thin capitalization rule on total leverage is reduced by 61% (=0.0169/0.0276) if
rules are applied based on arm’s length considerations. Regression 2 includes Total leverage
restriction and its interaction with Arm’s length in a total leverage regression, yielding a
coefficient of -0.0229 for the Total leverage restriction variable that is significant at 1% and a
coefficient of 0.0109 for its interaction with Arm’s length that is insignificant. These point
estimates suggest that discretion reduces the impact of total leverage restrictions on total
leverage by 48% (=0.0109/0.0229), although the effect is not significant. In regression 3,
Internal leverage restriction and its interaction with Arm’s length obtain estimates of -0.0200
and 0.0244 that are significant at 5% and 10%, respectively, suggesting that discretion fully
completely cancels out the effect of internal leverage restrictions on total leverage.
Regression 4 includes Thin cap restriction and its interaction with Arm’s length in an
Internal leverage regression, while regression 5 includes the Internal leverage restriction and its
interaction with Arm’s length in such a regression. In both regressions, the interaction terms are
statistically insignificant. Finally, regression 6 includes Thin cap restriction and its interaction
with Arm’s length in an Internal debt share regression, while regression 7 includes the Internal
leverage restriction and its interaction with Arm’s length in such a regression. None of these thin
capitalization variables are statistically significant in these two regressions. Overall, Table 8
provides some evidence that discretion reduces the impact of thin capitalization rules on total
leverage, but not on internal leverage or the internal debt share.
Next, we are interested to see whether the introduction of a new thin capitalization
regime prompts US multinationals to quickly adapt the capital structure of their foreign affiliates
to the new regime, and, in particular, in the first years of implementation. To do this, we estimate
a set of financial ratio regressions analogous to those in Table 8 in first differences (without the
Arm’s length variable). These first difference regressions also mitigate concerns that omitted
variables may influence our results. The first differences are differences between benchmark
years, which cover periods lasting either five or seven years. The results are reported in Table 9,
with Δ denoting that variables are expressed in first differences between benchmark years.
Regression 1 includes Δ Thin cap restriction in a regression of Δ Total leverage. Note that Δ Thin
cap restriction equals 1 (-1) in the first years of implementation (abolishment) of a thin
capitalization rule, while it is zero in all other years. Δ Thin cap restriction receives a coefficient

18
of -0.0113 that is significant at 10%, suggesting that the introduction of a thin capitalization
restriction reduces the total leverage ratio by 1.13% in its first years. This estimated coefficient is
about half of the estimate of -0.0214 for the Thin cap restriction variable in the corresponding
Total leverage regression 2 in Table 4, suggesting that the short-run impact of the introduction of
a thin capitalization regime is about half of its average or long-term effect.
The Δ Total leverage restriction variable receives a coefficient of -0.0248 in the Δ Total
leverage regression 2 of Table 9 that is significant at 5% and of similar magnitude as the
corresponding coefficient of -0.0186 in the level regression 4 of Table 4. Hence, the majority of
the effect of a total leverage restriction on total leverage appears to materialize during the first
years following its introduction. In the Δ Internal leverage regression 4, the included Δ Thin cap
restriction variable has a coefficient of -0.0452 that is significant at 5% and about half of the
corresponding estimate in the level regression 2 of Table 5. However, the Δ Internal leverage
restriction variable obtains a coefficient of -0.117 in regression 5 that is significant at 5% and is
almost twice as large as the corresponding estimate in the level regression 4 of Table 5. This
suggests that internal leverage reacts very quickly to a change in the internal leverage restriction,
and may even overreact in the short run. At any rate, the evidence suggests that the multinational
firm can adjust the internal leverage of a foreign affiliate relatively quickly, possibly because this
does not involve any external creditors. In the Δ Internal debt share regressions 6 and 7 the Δ
Thin cap restriction and Δ Internal leverage restriction are estimated with insignificant
coefficients, which could reflect that the first-years adjustment in this variable tends to be rather
small.
Generally, we report evidence that the financial structure of the foreign affiliates of US
multinationals, and in particular total and internal leverage, take considerably longer than a few
years to adjust to a change in the thin capitalization regime generally. However, Total (Internal)
leverage reacts relatively quickly to the introduction of a Total (Internal) leverage restriction.
D. Aggregate firm implications of thin capitalization rules
To conclude, we consider how thin capitalization regimes facing the foreign affiliates of
US multinationals affect the valuation, leverage, and interest expenses of the multinational firm
as a whole. To start, we consider how thin capitalization regimes affect firm valuation as
measured by Tobin’s q, where this variable is constructed as the ratio of the market value of the
overall firm’s equity plus debt to total assets using data from the Compustat and CRSP
databases. Thin capitalization regimes are expected to affect firm valuation negatively, as they
imply a reduced tax advantage of debt finance. In regression 1 of Table 10, Tobin’s q is related
to the Aggregate thin cap restriction variable that measures the extent to which the
multinational’s operations worldwide are subject to a thin capitalization regime. Specifically, this
aggregate variable is constructed as the ratio of the sum of the assets of foreign affiliates subject
a thin cap restriction to the total assets of the consolidated firm. Aggregate thin cap restriction is
seen to obtain an insignificant coefficient in regression 1. In regression 2, the aggregate thin

19
capitalization variable is split into analogous separate variables that measure the extent to which
the multinational’s operations are subject to a total leverage restriction and an internal leverage
restriction. Aggregate total leverage restriction obtains a negative and significant coefficient in
regression 2, while Aggregate internal leverage restriction is estimated to be insignificant. In
regressions 3 and 4, we replace Tobin’s q in regressions 2 and 3 by Tobin’s q net of the firm’s
industry mean Tobin’s q to account for systemic differences in firm valuation at the industry
level, and obtain very similar results. The economic effect of total leverage restrictions on firm
valuation is substantial. The coefficient estimates in regression 4 imply that a one standard
deviation increase in the aggregate total leverage restriction variable of 0.113 would translate
into a decrease in industry-adjusted Tobin’s q of 0.051, which is substantial given its mean of -
0.239 and its standard deviation of 1.539.
In regressions 5 and 6, the dependent variable is the ratio of debt to assets of the
consolidated worldwide firm. The aggregate thin capitalization regime variables are estimated to
be insignificant in both regressions. The absence of a significant impact of the aggregate thin
capitalization variables on worldwide leverage suggests that the multinational firm engages in
debt shifting from countries with thin capitalization regimes towards countries that lack such
regimes so as to keep overall leverage constant.
In regressions 7 and 8, the dependent variable is the ratio of interest expenses to total
assets of the consolidated firm. In regression 7, this interest expense ratio is seen to be negatively
and significantly related to the aggregate thin capitalization regime variable, while in regression
8 it is negatively and significantly related to the separate aggregate total and internal leverage
restriction variables. The reduced worldwide interest expenses on account of thin capitalization
regimes may reflect that any international debt shifting that occurs leads to lower borrowings in
high-interest countries, and vice versa. Also, the lower interest expenses may reflect that thin
capitalization regimes cause the multinational to choose financial structures that overall imply
less risk to external creditors, for instance on account of more internal equity funding of foreign
affiliates. Finally, in regressions 9 and 10 we repeat the aggregate interest expense regressions in
columns 7 and 8 by using the ratio of aggregate interest expenses to total debt (rather than assets)
at the consolidated firm level as the dependent variable. We obtain qualitatively similar results
when scaling interest expenses by total debt rather than total assets, indicating that results are not
driven by differences in aggregate leverage, consistent with the results on aggregate debt in
regressions 5 and 6. The economic effect of thin capitalization restrictions on aggregate interest
expenses is significant. The coefficient estimates in regression 9 imply that a one standard
deviation increase in the aggregate thin capitalization restriction variable of 0.186 would
translate into a decrease in aggregate interest expenses 0.025, which is substantial given its mean
of 0.111 and its standard deviation of 0.199.
Taken together, these results imply that thin capitalization rules affect the capital
structure within multinational firms, with aggregate implications for the interest expense and
firm valuation of multinational firms.
20
V. CONCLUSIONS
This paper examines the impact of thin capitalization rules that limit the tax deductibility
of interest on the leverage of the foreign affiliates of US multinationals. For this purpose, we
construct a new data set on thin capitalization rules in 54 countries for the period 1982-2004. The
data set provides information about the existence of explicit thin capitalization rules, their
stringency, and their application. Overall, in our sample thin capitalization regimes restrict the
ratio of an affiliate’s total debt to assets in about 43% of the cases. In other cases, thin
capitalization rules restrict the ratio of an affiliate’s indebtedness to related parties relative to its
equity.
The presence of restrictions on an affiliate’s ratio of overall debt to assets on average
reduces this leverage ratio by 1.9%. Restrictions on the ratio of an affiliate’s borrowing from the
parent company to its equity, in turn, on average reduce the targeted leverage ratio by 6.3%.
Furthermore, restrictions on borrowing from the parent on average reduce the overall debt to
assets ratio of the affiliate by 0.8%. This shows that restrictions on borrowing from related
parties have an important role in affecting the affiliate’s overall capital structure, going beyond
merely affected the parent firm’s choice between injecting the foreign affiliate with debt finance
or equity finance.
Further, we find that the impact of thin capitalization rules on affiliate leverage is higher,
if their application is automatic rather than discretionary.9 Finally, by exploiting changes in thin
capitalization regimes over time, we find that the first-year impact of new capitalization rules
generally on affiliate leverage tends to be part of the long-term effect. However, total leverage
(internal leverage) responds quickly and fully to the introduction of a total (internal) leverage
restriction. Thin capitalization rules on the affiliates of US multinational firms are found to
reduce the overall valuation of the firm, consistent with a reduced worldwide deductibility of
interest from taxable income.
Overall, our results show than thin capitalization rules, which thus far have been
understudied, have a substantial effect on capital structure within multinational firms. They
therefore provide an important qualification of existing studies on capital structure and taxation
of multinational firms, which thus far has generally ignored the effects of thin capitalization
rules. More broadly, our results offer new evidence on the relevance of taxation for corporate
debt, by focusing on thin capitalization rules that, more than statutory corporate income tax rates,
display great variation across countries.
9 This suggests that the application of thin capitalization rules should be automatic if the purpose is to limit tax base
erosion through interest deductions. The OECD (2013, p. 17) has announced that it intends to develop
recommendations regarding best practices in the design of rules to prevent base erosion through the use of interest
payments by September 2015.
21
REFERENCES
Altshuler, R., and H. Grubert, 2003, “Taxes, repatriation strategies and multinational financial
policy,” Journal of Public Economics, Vol. 87, pp. 73-107.
Auerbach, A.J., 2002, “Taxation and corporate financial policy.” In A.J. Auerbach, and M.
Feldstein, (eds.), Handbook of Public Economics, Volume III (New York: North-
Holland).
Brosens, L., 2004, “Thin capitalization rules and EU law,” EC Tax Review, Vol. 4, pp. 188-213.
Buettner, T., M. Overesch, U. Schreiber, and G. Wamser, 2012, “The impact of thin-
capitalization rules on the capital structure of multinational firms,” Journal of Public
Economics, Vol. 96, pp. 930-938.
DeAngelo, H., and R.W. Masulis, 1980, “Optimal capital structure under corporate and personal
taxation,” Journal of Financial Economics, Vol. 8, pp. 3-29.
Desai, M., F. Foley, and J. R. Hines, 2001, “Repatriation taxes and dividend distortions,”
National Tax Journal, Vol. 54, pp. 859-851.
———, 2004, “A multinational perspective on capital structure choice and internal capital
markets,” Journal of Finance, Vol. 59, pp. 2451-87.
Desai, M., and J.R. Hines, 1999, “‘Basket’ cases: Tax incentives and international joint venture
participation by American multinational firms,” Journal of Public Economics, Vol. 71,
pp. 379–402.
Djankov, S., C. McLiesh, and A. Shleifer, 2007, “Private credit in 129 countries,” Journal of
Financial Economics, Vol. 84, pp. 299-329.
Froot, K.A., and J.R. Hines, 1995, “Interest allocation rules, financing patterns, and the operation
of U.S. multinationals,” pp. 272-307. In M. Feldstein, J.R. Hines, R.G. Hubbard, (eds.),
The Effect of Taxation on Multinational Corporations, (Chicago: University of Chicago
Press).
Graham, J.R., 1996, “Debt and the marginal tax rate,” Journal of Financial Economics, Vol. 41,
pp. 41-73.
———, 2000, “How big are the tax benefits of debt?,” Journal of Finance, Vol. 55, pp. 1901-
1941.
———, 2003, “Taxes and corporate finance: A review,” Review of Financial Studies, Vol. 16,
pp. 1074–1128.
Graham, J.R., and C. Harvey, 2001, “The theory and practice of corporate finance: Evidence
from the field,” Journal of Financial Economics, Vol. 60, pp. 187–243.
Haufler, A., and M. Runkel, 2012, “Firms' financial choices and thin capitalization rules under
corporate tax competition,” European Economic Review, Vol. 56, pp. 1087-1103.
Hines, J., and E. Rice, 1994, “Fiscal paradise: Foreign tax havens and American business,”
Quarterly Journal of Economics, Vol. 109, pp. 149-182.
Huizinga, H., L. Laeven, and G. Nicodème, 2008, Capital structure and international debt
shifting, Journal of Financial Economics 88, 80-118.

22
MacKie-Mason, J., 1990, “Do taxes affect corporate financing decisions?,” Journal of Finance,
Vol. 45, pp. 1471-1493.
Mintz, J. and A. Weichenrieder, 2005, “Taxation and the financial structure of German outbound
FDI,” CESifo Working Paper No. 1612.
Myers, S.C., and N.S. Majluf, 1984, “Corporate financing and investment decisions when firms
have information that investors do not have,” Journal of Financial Economics, Vol. 13,
pp. 187–221.
Newberry, K.J., and D.S. Dhaliwal, 2001, “Cross-jurisdictional income shifting by U.S.
multinationals: Evidence from international bond offerings,” Journal of Accounting
Research, Vol. 39, pp. 643-662.
OECD, 2013, Action Plan on Base Erosion and Profit Shifting, Paris.
Overesch, M., and G. Wamser, 2010, “Corporate tax planning and thin-capitalization rules:
evidence from a quasi-experiment,” Applied Economics, Vol. 42, pp. 563-573.
Rajan, R.G., and L. Zingales, 1995, “What do we know about capital structure? Some evidence
from international data,” Journal of Finance, Vol. 50, pp. 1421-60.
Wamser, G., 2008, “The impact of thin capitalization rules on external debt usage: a propensity
score matching approach,” CESifo Working Paper No. 62.
Weichenrieder, A., and H. Windischbauer, 2008, “Thin capitalization rules and company
responses,” CESifo Working Paper No. 2456.
23
Table 1. Characteristics of thin capitalization rules at year-end 2004
This table shows key characteristics of thin capitalization rules in selected countries at year-end 2004. D denotes total debt; IID
denotes single related party internal debt; TID denotes total internal debt; TIFD denotes total internal foreign debt; TFD
denotes total foreign debt; E denotes total equity; IIE denotes individual internal equity; TIE denotes total internal equity; TIFE
denotes total internal foreign equity; TFE denotes total foreign equity; A denotes total assets; RoE denotes return on equity.
Data are from International Bureau for Fiscal Documentation, Brosens (2004), and national tax authorities.
(1) (2) (3) (4) (5) (6) (7) (8) (9) (10) (11) (12)
Co
un
try
Ex
pli
cit
rule
Yea
r o
f fi
rst
intr
od
uct
ion
Def
init
ion
nu
mer
ato
r
Def
init
ion
den
om
inat
or
Rat
io
Su
bst
anti
al s
har
eho
ldin
g
Dir
ect
(Dir
) o
r in
dir
ect
(In
d)
shar
eho
ldin
g
Au
tom
atic
(A
uto
) o
r
usi
ng
arm
's l
eng
th (
AL
)
con
sid
erat
ion
s
Rem
edy
: n
on-
ded
uct
ibil
ity
(N
d)
or
recl
assi
fica
tio
n a
s
div
iden
d (
Div
)
Fo
r al
l o
r ex
ceed
ing
deb
t?
Of
inte
rest
(I)
or
net
inte
rest
(N
I)? 1
/
Ru
les
app
ly t
o:
All
,
Fo
reig
n,
Non
-EU
2/
Argentina Yes 1999 D E 2 No Dir Auto Div Exc I Foreign
Australia Yes 1987 D E 3 15% Ind AL Nd Exc I Foreign
Austria No 3/
Belgium Yes 4/
1992 IID E 1 No Dir AL 5/
Div Exc I All
Brazil No 2010
Canada Yes 1972 IID IIE 2 25% Ind Auto Nd Exc I Foreign
Chile Yes 2001 D E 3 No Dir Auto Div 6/
Exc I All
China No 2008
Colombia No
Costa Rica No
Croatia No
Czech Republic Yes 1993 TFD E 4 7/
25% Ind Auto Div 8/
Exc I Foreign
Denmark Yes 1999 D 9/
E 4 50% Ind AL Nd Exc I All
Finland No 10/
France Yes 1979 IID E 1.5 50% Dir Auto Nd Exc I All
Germany Yes 11/
1994 IID IIE 1.5 25% Ind AL Div Exc I All
Greece No
Hong Kong No 12/
Hungary Yes 1993 D E 3 No Dir Auto Nd Exc I All
India No
Indonesia Yes 1985 D E 3 No Dir AL Nd Exc I All
Ireland No 13/
Israel No
Italy Yes 14/
2004 IID IIE 5 25% Ind AL Div Exc I All
Japan Yes 1992 TIFD TIFE 3 50% Ind Auto 15/
Nd Exc I Foreign
Latvia Yes 2003 TID E 4 No Dir Auto Nd 16/
All I All
Lithuania Yes 2004 D E 4 50% Ind AL Nd Exc I All
Malaysia No
Mexico No 2005
Netherlands Yes 2004 D 17/
E 18/
3 33% Ind Auto Nd Exc NI All
New Zealand Yes 1996 D A 0.75 No Dir Auto Nd Exc I Foreign
Norway No
Pakistan Yes 2001 TFD TFE 3 50% Ind Auto Nd Exc I Foreign
Panama No
Peru Yes 2001 D E 3 No Dir Auto Nd Exc I Foreign
Philippines No
Poland Yes 1999 D E 3 25% Ind Auto Nd Exc I All
Portugal Yes 1996 TIDE 19/
TIFE 2 10% Ind AL Nd Exc I Foreign
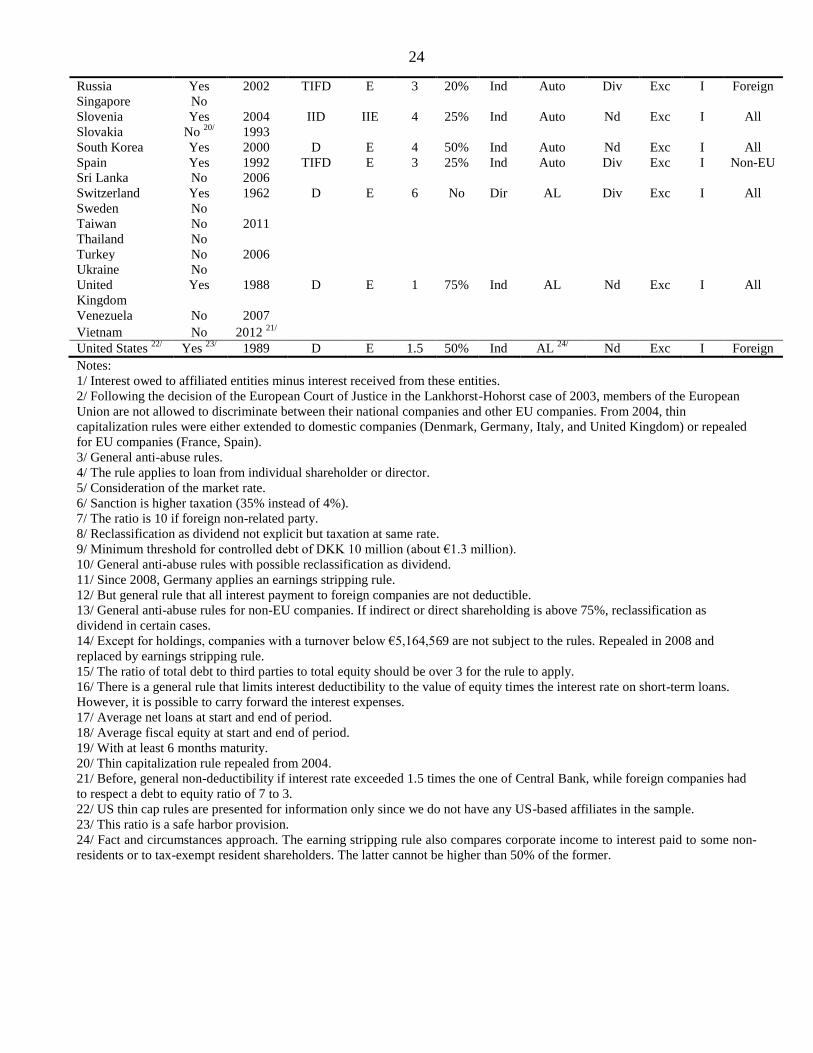
24
Russia Yes 2002 TIFD E 3 20% Ind Auto Div Exc I Foreign
Singapore No
Slovenia Yes 2004 IID IIE 4 25% Ind Auto Nd Exc I All
Slovakia No 20/
1993
South Korea Yes 2000 D E 4 50% Ind Auto Nd Exc I All
Spain Yes 1992 TIFD E 3 25% Ind Auto Div Exc I Non-EU
Sri Lanka No 2006
Switzerland Yes 1962 D E 6 No Dir AL Div Exc I All
Sweden No
Taiwan No 2011
Thailand No
Turkey No 2006
Ukraine No
United
Kingdom
Yes 1988 D E 1 75% Ind AL Nd Exc I All
Venezuela No 2007
Vietnam No 2012 21/
United States 22/
Yes 23/
1989 D E 1.5 50% Ind AL 24/
Nd Exc I Foreign
Notes:
1/ Interest owed to affiliated entities minus interest received from these entities.
2/ Following the decision of the European Court of Justice in the Lankhorst-Hohorst case of 2003, members of the European
Union are not allowed to discriminate between their national companies and other EU companies. From 2004, thin
capitalization rules were either extended to domestic companies (Denmark, Germany, Italy, and United Kingdom) or repealed
for EU companies (France, Spain).
3/ General anti-abuse rules.
4/ The rule applies to loan from individual shareholder or director.
5/ Consideration of the market rate.
6/ Sanction is higher taxation (35% instead of 4%).
7/ The ratio is 10 if foreign non-related party.
8/ Reclassification as dividend not explicit but taxation at same rate.
9/ Minimum threshold for controlled debt of DKK 10 million (about €1.3 million).
10/ General anti-abuse rules with possible reclassification as dividend.
11/ Since 2008, Germany applies an earnings stripping rule.
12/ But general rule that all interest payment to foreign companies are not deductible.
13/ General anti-abuse rules for non-EU companies. If indirect or direct shareholding is above 75%, reclassification as
dividend in certain cases.
14/ Except for holdings, companies with a turnover below €5,164,569 are not subject to the rules. Repealed in 2008 and
replaced by earnings stripping rule.
15/ The ratio of total debt to third parties to total equity should be over 3 for the rule to apply.
16/ There is a general rule that limits interest deductibility to the value of equity times the interest rate on short-term loans.
However, it is possible to carry forward the interest expenses.
17/ Average net loans at start and end of period.
18/ Average fiscal equity at start and end of period.
19/ With at least 6 months maturity.
20/ Thin capitalization rule repealed from 2004.
21/ Before, general non-deductibility if interest rate exceeded 1.5 times the one of Central Bank, while foreign companies had
to respect a debt to equity ratio of 7 to 3.
22/ US thin cap rules are presented for information only since we do not have any US-based affiliates in the sample.
23/ This ratio is a safe harbor provision.
24/ Fact and circumstances approach. The earning stripping rule also compares corporate income to interest paid to some non-
residents or to tax-exempt resident shareholders. The latter cannot be higher than 50% of the former.
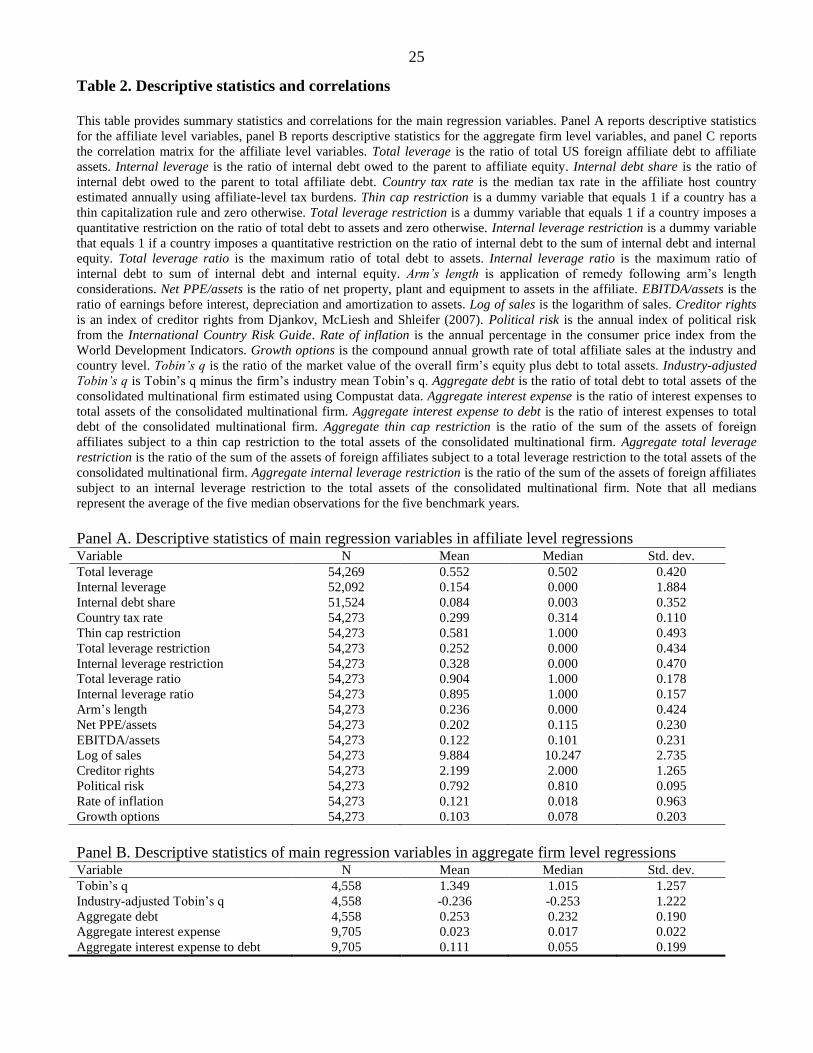
25
Table 2. Descriptive statistics and correlations
This table provides summary statistics and correlations for the main regression variables. Panel A reports descriptive statistics
for the affiliate level variables, panel B reports descriptive statistics for the aggregate firm level variables, and panel C reports
the correlation matrix for the affiliate level variables. Total leverage is the ratio of total US foreign affiliate debt to affiliate
assets. Internal leverage is the ratio of internal debt owed to the parent to affiliate equity. Internal debt share is the ratio of
internal debt owed to the parent to total affiliate debt. Country tax rate is the median tax rate in the affiliate host country
estimated annually using affiliate-level tax burdens. Thin cap restriction is a dummy variable that equals 1 if a country has a
thin capitalization rule and zero otherwise. Total leverage restriction is a dummy variable that equals 1 if a country imposes a
quantitative restriction on the ratio of total debt to assets and zero otherwise. Internal leverage restriction is a dummy variable
that equals 1 if a country imposes a quantitative restriction on the ratio of internal debt to the sum of internal debt and internal
equity. Total leverage ratio is the maximum ratio of total debt to assets. Internal leverage ratio is the maximum ratio of
internal debt to sum of internal debt and internal equity. Arm’s length is application of remedy following arm’s length
considerations. Net PPE/assets is the ratio of net property, plant and equipment to assets in the affiliate. EBITDA/assets is the
ratio of earnings before interest, depreciation and amortization to assets. Log of sales is the logarithm of sales. Creditor rights
is an index of creditor rights from Djankov, McLiesh and Shleifer (2007). Political risk is the annual index of political risk
from the International Country Risk Guide. Rate of inflation is the annual percentage in the consumer price index from the
World Development Indicators. Growth options is the compound annual growth rate of total affiliate sales at the industry and
country level. Tobin’s q is the ratio of the market value of the overall firm’s equity plus debt to total assets. Industry-adjusted
Tobin’s q is Tobin’s q minus the firm’s industry mean Tobin’s q. Aggregate debt is the ratio of total debt to total assets of the
consolidated multinational firm estimated using Compustat data. Aggregate interest expense is the ratio of interest expenses to
total assets of the consolidated multinational firm. Aggregate interest expense to debt is the ratio of interest expenses to total
debt of the consolidated multinational firm. Aggregate thin cap restriction is the ratio of the sum of the assets of foreign
affiliates subject to a thin cap restriction to the total assets of the consolidated multinational firm. Aggregate total leverage
restriction is the ratio of the sum of the assets of foreign affiliates subject to a total leverage restriction to the total assets of the
consolidated multinational firm. Aggregate internal leverage restriction is the ratio of the sum of the assets of foreign affiliates
subject to an internal leverage restriction to the total assets of the consolidated multinational firm. Note that all medians
represent the average of the five median observations for the five benchmark years.
Panel A. Descriptive statistics of main regression variables in affiliate level regressions Variable N Mean Median Std. dev.
Total leverage 54,269 0.552 0.502 0.420
Internal leverage 52,092 0.154 0.000 1.884
Internal debt share 51,524 0.084 0.003 0.352
Country tax rate 54,273 0.299 0.314 0.110
Thin cap restriction 54,273 0.581 1.000 0.493
Total leverage restriction 54,273 0.252 0.000 0.434
Internal leverage restriction 54,273 0.328 0.000 0.470
Total leverage ratio 54,273 0.904 1.000 0.178
Internal leverage ratio 54,273 0.895 1.000 0.157
Arm’s length 54,273 0.236 0.000 0.424
Net PPE/assets 54,273 0.202 0.115 0.230
EBITDA/assets 54,273 0.122 0.101 0.231
Log of sales 54,273 9.884 10.247 2.735
Creditor rights 54,273 2.199 2.000 1.265
Political risk 54,273 0.792 0.810 0.095
Rate of inflation 54,273 0.121 0.018 0.963
Growth options 54,273 0.103 0.078 0.203
Panel B. Descriptive statistics of main regression variables in aggregate firm level regressions Variable N Mean Median Std. dev.
Tobin’s q 4,558 1.349 1.015 1.257
Industry-adjusted Tobin’s q 4,558 -0.236 -0.253 1.222
Aggregate debt 4,558 0.253 0.232 0.190
Aggregate interest expense 9,705 0.023 0.017 0.022
Aggregate interest expense to debt 9,705 0.111 0.055 0.199
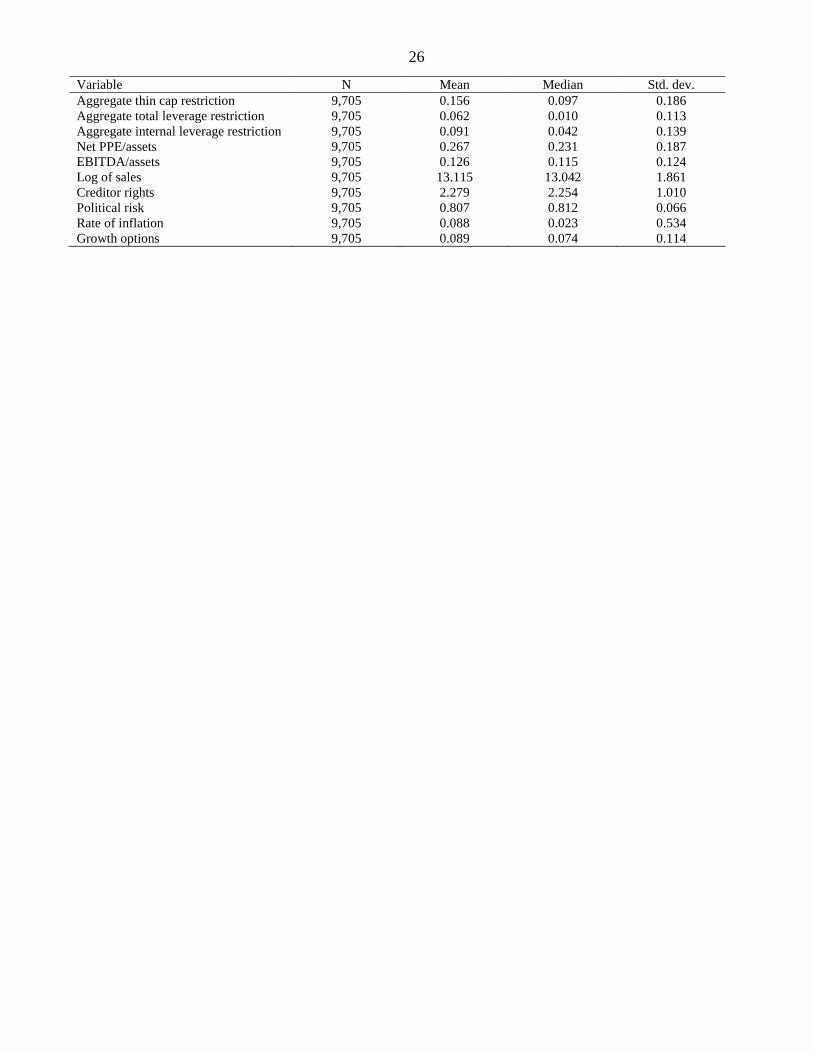
26
Variable N Mean Median Std. dev.
Aggregate thin cap restriction 9,705 0.156 0.097 0.186
Aggregate total leverage restriction 9,705 0.062 0.010 0.113
Aggregate internal leverage restriction 9,705 0.091 0.042 0.139
Net PPE/assets 9,705 0.267 0.231 0.187
EBITDA/assets 9,705 0.126 0.115 0.124
Log of sales 9,705 13.115 13.042 1.861
Creditor rights 9,705 2.279 2.254 1.010
Political risk 9,705 0.807 0.812 0.066
Rate of inflation 9,705 0.088 0.023 0.534
Growth options 9,705 0.089 0.074 0.114

27
Panel C. Correlation matrix of main regression variables
Total leverage
Internal leverage
Internal debt share
Country tax rate
Thin cap restriction
Total
leverage restriction
Internal
leverage restriction
Net PPE/ assets
EBITDA/ assets
Log of sales
Creditor rights
Political risk
Rate of inflation
Internal leverage -0.057
Internal debt share 0.238 0.416
Country tax rate 0.068 0.067 0.060
Thin cap restriction -0.042 -0.011 -0.004 0.095
Total leverage restriction -0.024 -0.020 -0.017 -0.224 0.569
Internal leverage restriction -0.025 0.008 0.012 0.331 0.577 -0.343
Net PPE/assets 0.003 0.016 0.062 0.032 -0.046 -0.061 0.008
EBITDA/assets -0.262 0.045 -0.102 0.002 -0.024 -0.028 0.000 0.044
Log of sales 0.072 0.053 -0.050 0.099 0.003 -0.072 0.075 0.176 0.156
Creditor rights 0.022 -0.001 -0.000 -0.131 0.318 0.410 -0.044 -0.071 -0.021 -0.058
Political risk -0.018 -0.002 -0.025 0.132 0.395 0.220 0.233 -0.151 -0.016 -0.017 0.265
Rate of inflation -0.020 -0.002 0.011 0.024 -0.103 -0.057 -0.062 0.057 0.045 0.014 -0.108 -0.171
Growth options -0.049 -0.017 -0.013 -0.182 0.025 0.132 -0.103 -0.083 -0.022 -0.247 0.031 0.050 -0.016
Bolded (italicized) correlations are significant at the 1% (5%) level.
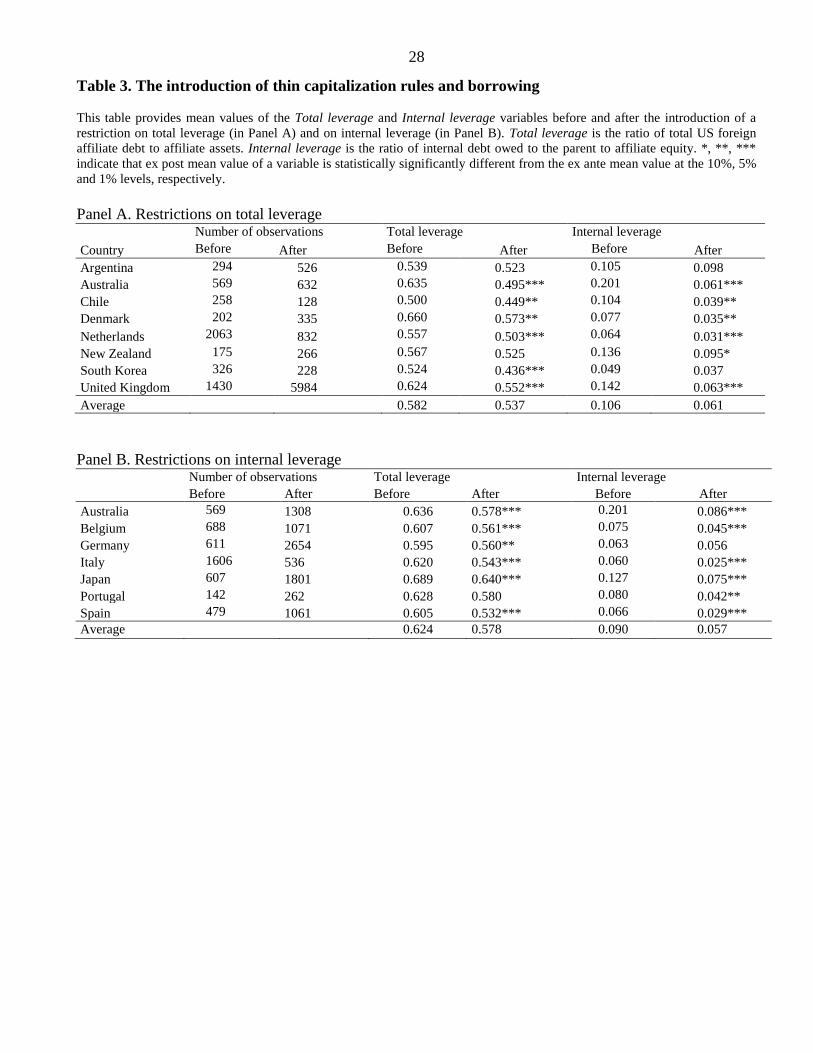
28
Table 3. The introduction of thin capitalization rules and borrowing
This table provides mean values of the Total leverage and Internal leverage variables before and after the introduction of a
restriction on total leverage (in Panel A) and on internal leverage (in Panel B). Total leverage is the ratio of total US foreign
affiliate debt to affiliate assets. Internal leverage is the ratio of internal debt owed to the parent to affiliate equity. *, **, ***
indicate that ex post mean value of a variable is statistically significantly different from the ex ante mean value at the 10%, 5%
and 1% levels, respectively.
Panel A. Restrictions on total leverage
Number of observations Total leverage Internal leverage
Country Before After Before After Before After
Argentina 294 526 0.539 0.523 0.105 0.098
Australia 569 632 0.635 0.495*** 0.201 0.061***
Chile 258 128 0.500 0.449** 0.104 0.039**
Denmark 202 335 0.660 0.573** 0.077 0.035**
Netherlands 2063 832 0.557 0.503*** 0.064 0.031***
New Zealand 175 266 0.567 0.525 0.136 0.095*
South Korea 326 228 0.524 0.436*** 0.049 0.037
United Kingdom 1430 5984 0.624 0.552*** 0.142 0.063***
Average 0.582 0.537 0.106 0.061
Panel B. Restrictions on internal leverage
Number of observations Total leverage Internal leverage
Before After Before After Before After
Australia 569 1308 0.636 0.578*** 0.201 0.086***
Belgium 688 1071 0.607 0.561*** 0.075 0.045***
Germany 611 2654 0.595 0.560** 0.063 0.056
Italy 1606 536 0.620 0.543*** 0.060 0.025***
Japan 607 1801 0.689 0.640*** 0.127 0.075***
Portugal 142 262 0.628 0.580 0.080 0.042**
Spain 479 1061 0.605 0.532*** 0.066 0.029***
Average 0.624 0.578 0.090 0.057
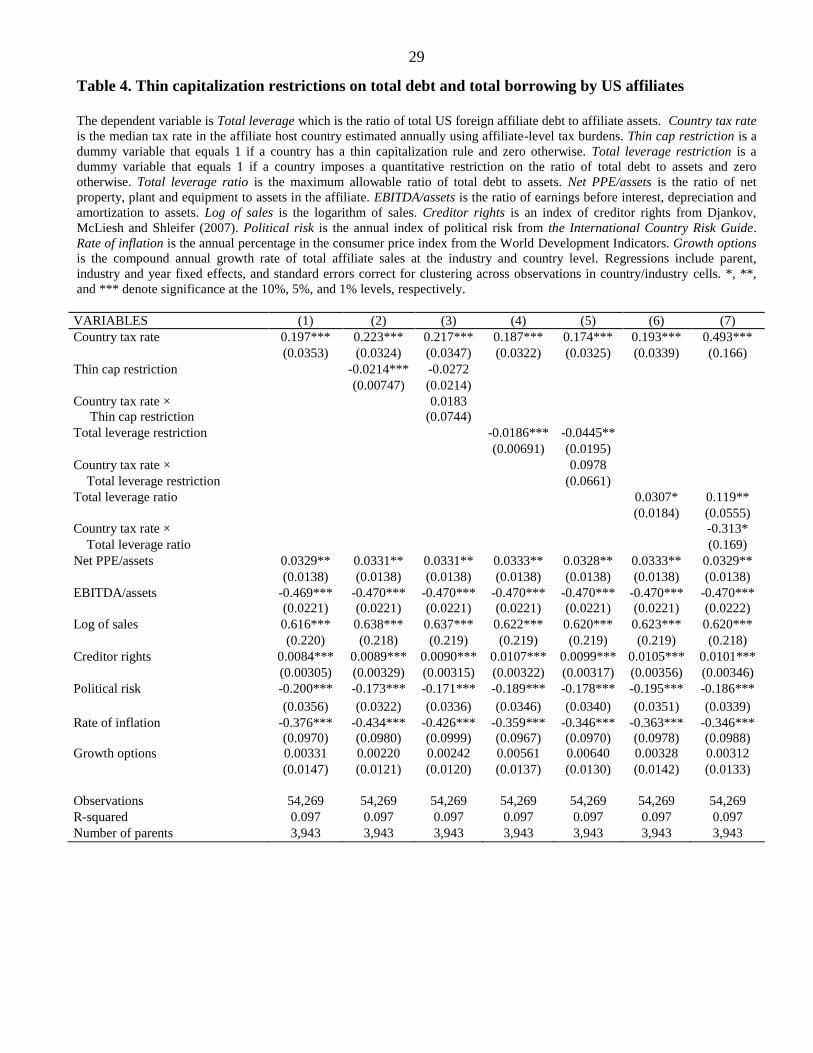
29
Table 4. Thin capitalization restrictions on total debt and total borrowing by US affiliates
The dependent variable is Total leverage which is the ratio of total US foreign affiliate debt to affiliate assets. Country tax rate
is the median tax rate in the affiliate host country estimated annually using affiliate-level tax burdens. Thin cap restriction is a
dummy variable that equals 1 if a country has a thin capitalization rule and zero otherwise. Total leverage restriction is a
dummy variable that equals 1 if a country imposes a quantitative restriction on the ratio of total debt to assets and zero
otherwise. Total leverage ratio is the maximum allowable ratio of total debt to assets. Net PPE/assets is the ratio of net
property, plant and equipment to assets in the affiliate. EBITDA/assets is the ratio of earnings before interest, depreciation and
amortization to assets. Log of sales is the logarithm of sales. Creditor rights is an index of creditor rights from Djankov,
McLiesh and Shleifer (2007). Political risk is the annual index of political risk from the International Country Risk Guide.
Rate of inflation is the annual percentage in the consumer price index from the World Development Indicators. Growth options
is the compound annual growth rate of total affiliate sales at the industry and country level. Regressions include parent,
industry and year fixed effects, and standard errors correct for clustering across observations in country/industry cells. *, **,
and *** denote significance at the 10%, 5%, and 1% levels, respectively.
VARIABLES (1) (2) (3) (4) (5) (6) (7)
Country tax rate 0.197*** 0.223*** 0.217*** 0.187*** 0.174*** 0.193*** 0.493***
(0.0353) (0.0324) (0.0347) (0.0322) (0.0325) (0.0339) (0.166)
Thin cap restriction -0.0214*** -0.0272
(0.00747) (0.0214)
Country tax rate × 0.0183
Thin cap restriction (0.0744)
Total leverage restriction -0.0186*** -0.0445**
(0.00691) (0.0195)
Country tax rate × 0.0978
Total leverage restriction (0.0661)
Total leverage ratio 0.0307* 0.119**
(0.0184) (0.0555)
Country tax rate × -0.313*
Total leverage ratio (0.169)
Net PPE/assets 0.0329** 0.0331** 0.0331** 0.0333** 0.0328** 0.0333** 0.0329**
(0.0138) (0.0138) (0.0138) (0.0138) (0.0138) (0.0138) (0.0138)
EBITDA/assets -0.469*** -0.470*** -0.470*** -0.470*** -0.470*** -0.470*** -0.470***
(0.0221) (0.0221) (0.0221) (0.0221) (0.0221) (0.0221) (0.0222)
Log of sales 0.616*** 0.638*** 0.637*** 0.622*** 0.620*** 0.623*** 0.620***
(0.220) (0.218) (0.219) (0.219) (0.219) (0.219) (0.218)
Creditor rights 0.0084*** 0.0089*** 0.0090*** 0.0107*** 0.0099*** 0.0105*** 0.0101***
(0.00305) (0.00329) (0.00315) (0.00322) (0.00317) (0.00356) (0.00346)
Political risk -0.200*** -0.173*** -0.171*** -0.189*** -0.178*** -0.195*** -0.186***
(0.0356) (0.0322) (0.0336) (0.0346) (0.0340) (0.0351) (0.0339)
Rate of inflation -0.376*** -0.434*** -0.426*** -0.359*** -0.346*** -0.363*** -0.346***
(0.0970) (0.0980) (0.0999) (0.0967) (0.0970) (0.0978) (0.0988)
Growth options 0.00331 0.00220 0.00242 0.00561 0.00640 0.00328 0.00312
(0.0147) (0.0121) (0.0120) (0.0137) (0.0130) (0.0142) (0.0133)
Observations 54,269 54,269 54,269 54,269 54,269 54,269 54,269
R-squared 0.097 0.097 0.097 0.097 0.097 0.097 0.097
Number of parents 3,943 3,943 3,943 3,943 3,943 3,943 3,943
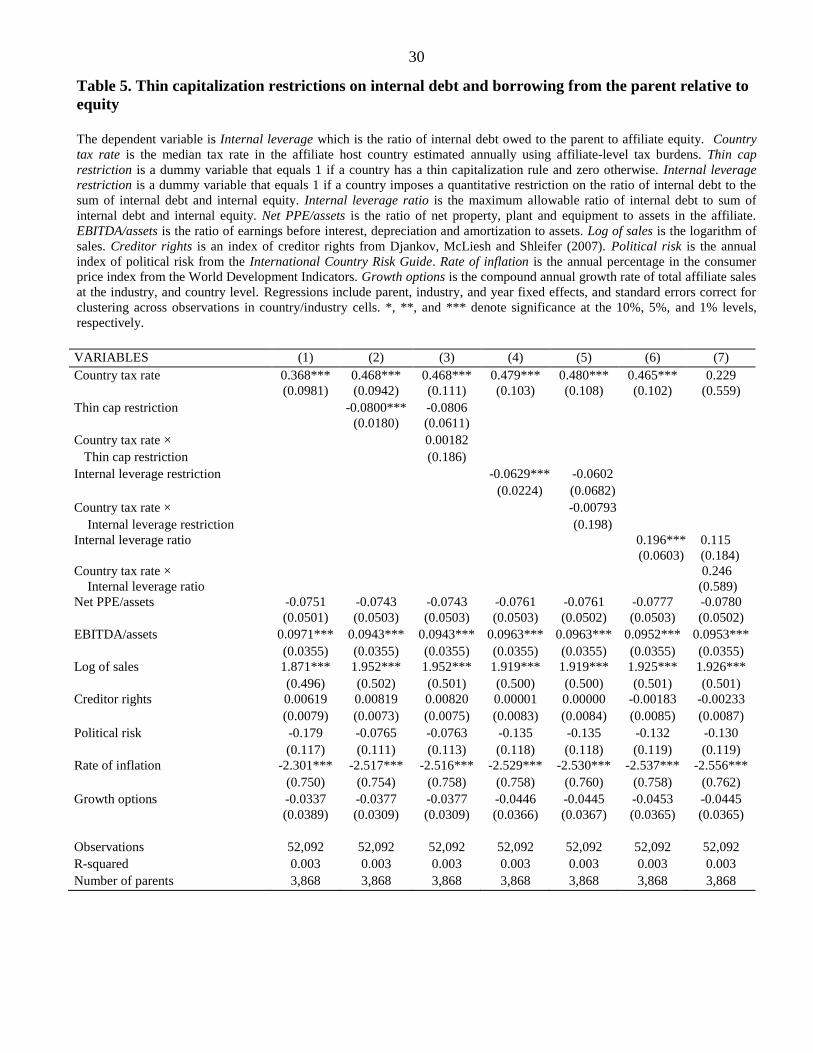
30
Table 5. Thin capitalization restrictions on internal debt and borrowing from the parent relative to
equity
The dependent variable is Internal leverage which is the ratio of internal debt owed to the parent to affiliate equity. Country
tax rate is the median tax rate in the affiliate host country estimated annually using affiliate-level tax burdens. Thin cap
restriction is a dummy variable that equals 1 if a country has a thin capitalization rule and zero otherwise. Internal leverage
restriction is a dummy variable that equals 1 if a country imposes a quantitative restriction on the ratio of internal debt to the
sum of internal debt and internal equity. Internal leverage ratio is the maximum allowable ratio of internal debt to sum of
internal debt and internal equity. Net PPE/assets is the ratio of net property, plant and equipment to assets in the affiliate.
EBITDA/assets is the ratio of earnings before interest, depreciation and amortization to assets. Log of sales is the logarithm of
sales. Creditor rights is an index of creditor rights from Djankov, McLiesh and Shleifer (2007). Political risk is the annual
index of political risk from the International Country Risk Guide. Rate of inflation is the annual percentage in the consumer
price index from the World Development Indicators. Growth options is the compound annual growth rate of total affiliate sales
at the industry, and country level. Regressions include parent, industry, and year fixed effects, and standard errors correct for
clustering across observations in country/industry cells. *, **, and *** denote significance at the 10%, 5%, and 1% levels,
respectively.
VARIABLES (1) (2) (3) (4) (5) (6) (7)
Country tax rate 0.368*** 0.468*** 0.468*** 0.479*** 0.480*** 0.465*** 0.229
(0.0981) (0.0942) (0.111) (0.103) (0.108) (0.102) (0.559)
Thin cap restriction -0.0800*** -0.0806
(0.0180) (0.0611)
Country tax rate × 0.00182
Thin cap restriction (0.186)
Internal leverage restriction -0.0629*** -0.0602
(0.0224) (0.0682)
Country tax rate × -0.00793
Internal leverage restriction (0.198)
Internal leverage ratio 0.196*** 0.115
(0.0603) (0.184)
Country tax rate × 0.246
Internal leverage ratio (0.589)
Net PPE/assets -0.0751 -0.0743 -0.0743 -0.0761 -0.0761 -0.0777 -0.0780
(0.0501) (0.0503) (0.0503) (0.0503) (0.0502) (0.0503) (0.0502)
EBITDA/assets 0.0971*** 0.0943*** 0.0943*** 0.0963*** 0.0963*** 0.0952*** 0.0953***
(0.0355) (0.0355) (0.0355) (0.0355) (0.0355) (0.0355) (0.0355)
Log of sales 1.871*** 1.952*** 1.952*** 1.919*** 1.919*** 1.925*** 1.926***
(0.496) (0.502) (0.501) (0.500) (0.500) (0.501) (0.501)
Creditor rights 0.00619 0.00819 0.00820 0.00001 0.00000 -0.00183 -0.00233
(0.0079) (0.0073) (0.0075) (0.0083) (0.0084) (0.0085) (0.0087)
Political risk -0.179 -0.0765 -0.0763 -0.135 -0.135 -0.132 -0.130
(0.117) (0.111) (0.113) (0.118) (0.118) (0.119) (0.119)
Rate of inflation -2.301*** -2.517*** -2.516*** -2.529*** -2.530*** -2.537*** -2.556***
(0.750) (0.754) (0.758) (0.758) (0.760) (0.758) (0.762)
Growth options -0.0337 -0.0377 -0.0377 -0.0446 -0.0445 -0.0453 -0.0445
(0.0389) (0.0309) (0.0309) (0.0366) (0.0367) (0.0365) (0.0365)
Observations 52,092 52,092 52,092 52,092 52,092 52,092 52,092
R-squared 0.003 0.003 0.003 0.003 0.003 0.003 0.003
Number of parents 3,868 3,868 3,868 3,868 3,868 3,868 3,868

31
Table 6. Thin capitalization restrictions on the share of internal debt and borrowing from the
parent
The dependent variable is the Internal debt share which is the ratio of internal debt owed to the parent to total affiliate debt.
Country tax rate is the median tax rate in the affiliate host country estimated annually using affiliate-level tax burdens. Thin
cap restriction is a dummy variable that equals 1 if a country has a thin capitalization rule and zero otherwise. Internal
leverage restriction is a dummy variable that equals 1 if a country imposes a quantitative restriction on the ratio of internal debt
to the sum of internal debt and internal equity. Internal leverage ratio is the maximum ratio of internal debt to sum of internal
debt and internal equity. Net PPE/assets is the ratio of net property, plant and equipment to assets in the affiliate.
EBITDA/assets is the ratio of earnings before interest, depreciation and amortization to assets. Log of sales is the logarithm of
sales. Creditor rights is an index of creditor rights from Djankov, McLiesh and Shleifer (2007). Political risk is the annual
index of political risk from the International Country Risk Guide. Rate of inflation is the annual percentage in the consumer
price index from the World Development Indicators. Growth options is the compound annual growth rate of total affiliate sales
at the industry, and country level. Regressions include parent, industry, and year fixed effects, and standard errors correct for
clustering across observations in country/industry cells. *, **, and *** denote significance at the 10%, 5%, and 1% levels,
respectively.
VARIABLES (1) (2) (3) (4) (5) (6) (7)
Country tax rate 0.117*** 0.130*** 0.104*** 0.131*** 0.130*** 0.136*** 0.195
(0.0330) (0.0339) (0.0307) (0.0339) (0.0348) (0.0338) (0.165)
Thin cap restriction -0.0103* -0.0348**
(0.00616) (0.0177)
Country tax rate × 0.0786
Thin cap restriction (0.0538)
Internal leverage restriction -0.00781 -0.0102
(0.00733) (0.0211)
Country tax rate × 0.00686
Internal leverage restriction (0.0604)
Internal leverage ratio 0.0374* 0.0576**
(0.0202) (0.0249)
Country tax rate × -0.0615*
Internal leverage ratio (0.0337)
Net PPE/assets 0.107*** 0.107*** 0.107*** 0.107*** 0.107*** 0.107*** 0.107***
(0.0129) (0.0130) (0.0129) (0.0130) (0.0130) (0.0130) (0.0130)
EBITDA/assets -0.121*** -0.121*** -0.121*** -0.121*** -0.121*** -0.121*** -0.121***
(0.00882) (0.00881) (0.00882) (0.00882) (0.00881) (0.00882) (0.00881)
Log of sales -0.262** -0.251** -0.255** -0.255** -0.256** -0.251** -0.251**
(0.115) (0.117) (0.116) (0.114) (0.114) (0.115) (0.115)
Creditor rights 0.00302 0.00327 0.00357 0.00226 0.00228 0.00148 0.00161
(0.00280) (0.00274) (0.00271) (0.00282) (0.00282) (0.00290) (0.00294)
Political risk -0.162*** -0.149*** -0.140*** -0.157*** -0.157*** -0.153*** -0.154***
(0.0336) (0.0307) (0.0298) (0.0336) (0.0335) (0.0342) (0.0340)
Rate of inflation 0.300** 0.272** 0.308** 0.272** 0.273** 0.255** 0.259**
(0.120) (0.119) (0.120) (0.120) (0.120) (0.119) (0.120)
Growth options -0.00666 -0.00722 -0.00624 -0.00804 -0.00809 -0.00891 -0.00909
(0.00818) (0.00755) (0.00769) (0.00803) (0.00806) (0.00781) (0.00785)
Observations 51,524 51,524 51,524 51,524 51,524 51,524 51,524
R-squared 0.026 0.026 0.026 0.026 0.026 0.026 0.026
Number of parents 3,871 3,871 3,871 3,871 3,871 3,871 3,871
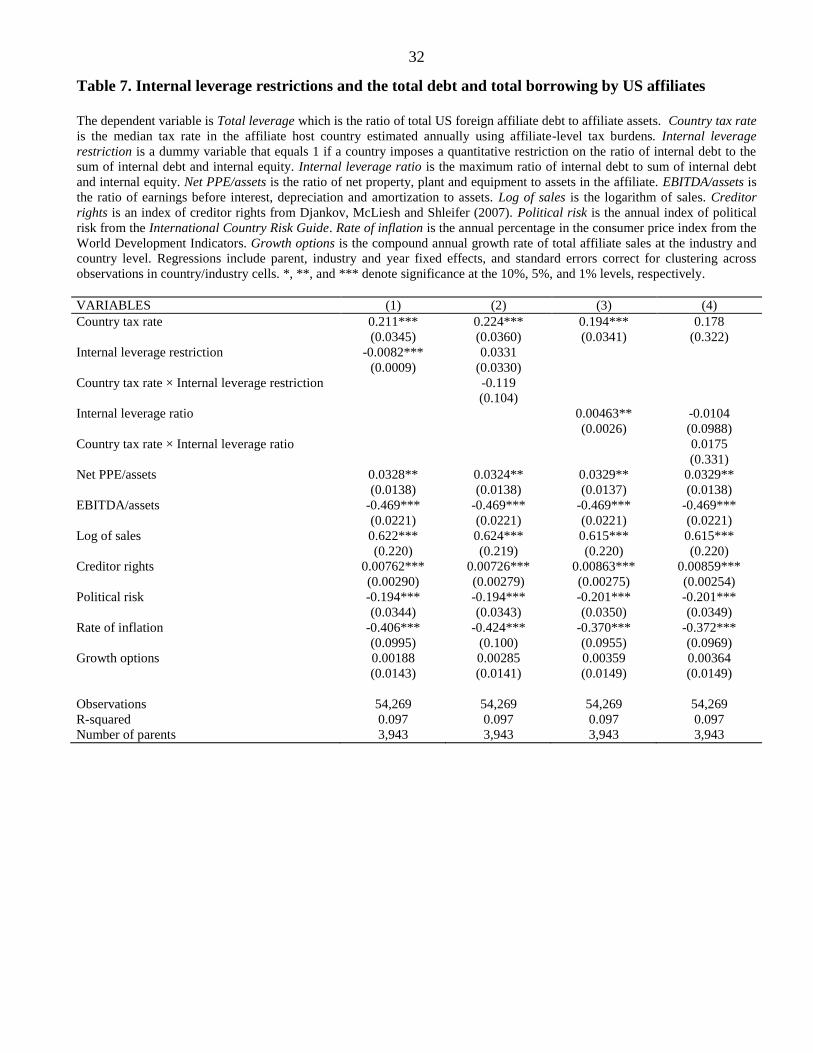
32
Table 7. Internal leverage restrictions and the total debt and total borrowing by US affiliates
The dependent variable is Total leverage which is the ratio of total US foreign affiliate debt to affiliate assets. Country tax rate
is the median tax rate in the affiliate host country estimated annually using affiliate-level tax burdens. Internal leverage
restriction is a dummy variable that equals 1 if a country imposes a quantitative restriction on the ratio of internal debt to the
sum of internal debt and internal equity. Internal leverage ratio is the maximum ratio of internal debt to sum of internal debt
and internal equity. Net PPE/assets is the ratio of net property, plant and equipment to assets in the affiliate. EBITDA/assets is
the ratio of earnings before interest, depreciation and amortization to assets. Log of sales is the logarithm of sales. Creditor
rights is an index of creditor rights from Djankov, McLiesh and Shleifer (2007). Political risk is the annual index of political
risk from the International Country Risk Guide. Rate of inflation is the annual percentage in the consumer price index from the
World Development Indicators. Growth options is the compound annual growth rate of total affiliate sales at the industry and
country level. Regressions include parent, industry and year fixed effects, and standard errors correct for clustering across
observations in country/industry cells. *, **, and *** denote significance at the 10%, 5%, and 1% levels, respectively.
VARIABLES (1) (2) (3) (4)
Country tax rate 0.211*** 0.224*** 0.194*** 0.178
(0.0345) (0.0360) (0.0341) (0.322)
Internal leverage restriction -0.0082*** 0.0331
(0.0009) (0.0330)
Country tax rate × Internal leverage restriction -0.119
(0.104)
Internal leverage ratio 0.00463** -0.0104
(0.0026) (0.0988)
Country tax rate × Internal leverage ratio 0.0175
(0.331)
Net PPE/assets 0.0328** 0.0324** 0.0329** 0.0329**
(0.0138) (0.0138) (0.0137) (0.0138)
EBITDA/assets -0.469*** -0.469*** -0.469*** -0.469***
(0.0221) (0.0221) (0.0221) (0.0221)
Log of sales 0.622*** 0.624*** 0.615*** 0.615***
(0.220) (0.219) (0.220) (0.220)
Creditor rights 0.00762*** 0.00726*** 0.00863*** 0.00859***
(0.00290) (0.00279) (0.00275) (0.00254)
Political risk -0.194*** -0.194*** -0.201*** -0.201***
(0.0344) (0.0343) (0.0350) (0.0349)
Rate of inflation -0.406*** -0.424*** -0.370*** -0.372***
(0.0995) (0.100) (0.0955) (0.0969)
Growth options 0.00188 0.00285 0.00359 0.00364
(0.0143) (0.0141) (0.0149) (0.0149)
Observations 54,269 54,269 54,269 54,269
R-squared 0.097 0.097 0.097 0.097
Number of parents 3,943 3,943 3,943 3,943
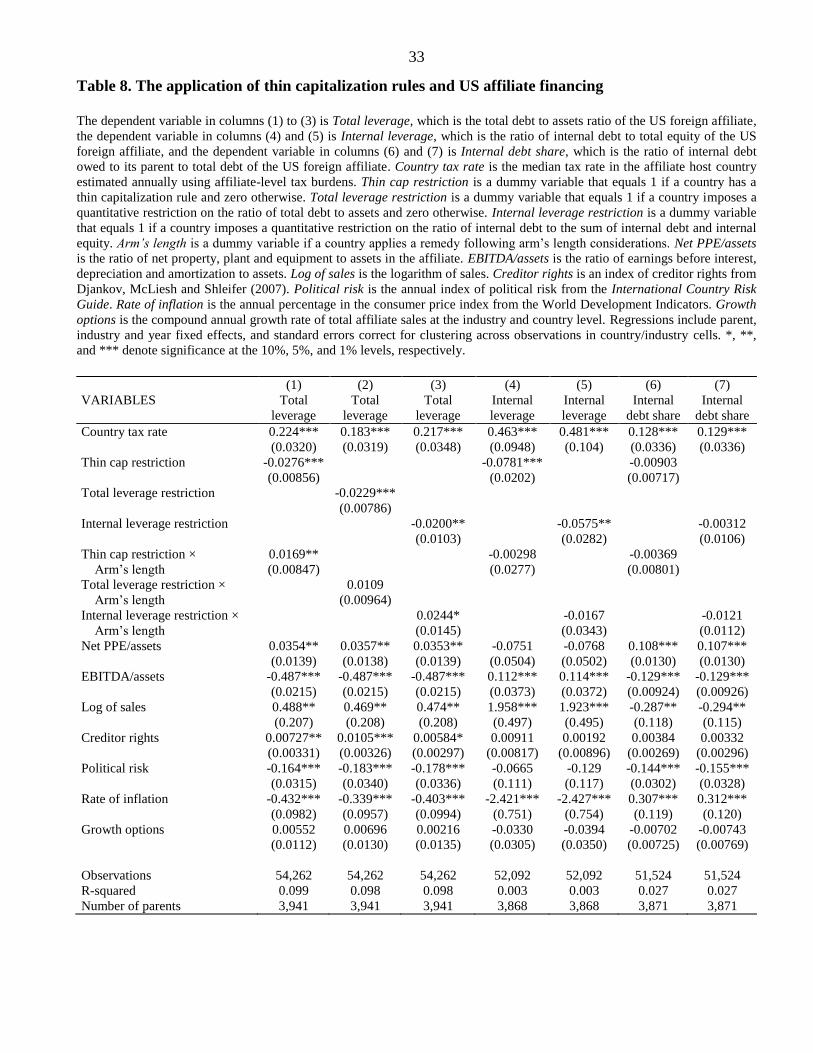
33
Table 8. The application of thin capitalization rules and US affiliate financing
The dependent variable in columns (1) to (3) is Total leverage, which is the total debt to assets ratio of the US foreign affiliate,
the dependent variable in columns (4) and (5) is Internal leverage, which is the ratio of internal debt to total equity of the US
foreign affiliate, and the dependent variable in columns (6) and (7) is Internal debt share, which is the ratio of internal debt
owed to its parent to total debt of the US foreign affiliate. Country tax rate is the median tax rate in the affiliate host country
estimated annually using affiliate-level tax burdens. Thin cap restriction is a dummy variable that equals 1 if a country has a
thin capitalization rule and zero otherwise. Total leverage restriction is a dummy variable that equals 1 if a country imposes a
quantitative restriction on the ratio of total debt to assets and zero otherwise. Internal leverage restriction is a dummy variable
that equals 1 if a country imposes a quantitative restriction on the ratio of internal debt to the sum of internal debt and internal
equity. Arm’s length is a dummy variable if a country applies a remedy following arm’s length considerations. Net PPE/assets
is the ratio of net property, plant and equipment to assets in the affiliate. EBITDA/assets is the ratio of earnings before interest,
depreciation and amortization to assets. Log of sales is the logarithm of sales. Creditor rights is an index of creditor rights from
Djankov, McLiesh and Shleifer (2007). Political risk is the annual index of political risk from the International Country Risk
Guide. Rate of inflation is the annual percentage in the consumer price index from the World Development Indicators. Growth
options is the compound annual growth rate of total affiliate sales at the industry and country level. Regressions include parent,
industry and year fixed effects, and standard errors correct for clustering across observations in country/industry cells. *, **,
and *** denote significance at the 10%, 5%, and 1% levels, respectively.
(1) (2) (3) (4) (5) (6) (7)
VARIABLES Total
leverage
Total
leverage
Total
leverage
Internal
leverage
Internal
leverage
Internal
debt share
Internal
debt share
Country tax rate 0.224*** 0.183*** 0.217*** 0.463*** 0.481*** 0.128*** 0.129***
(0.0320) (0.0319) (0.0348) (0.0948) (0.104) (0.0336) (0.0336)
Thin cap restriction -0.0276*** -0.0781*** -0.00903
(0.00856) (0.0202) (0.00717)
Total leverage restriction -0.0229***
(0.00786)
Internal leverage restriction -0.0200** -0.0575** -0.00312
(0.0103) (0.0282) (0.0106)
Thin cap restriction × 0.0169** -0.00298 -0.00369
Arm’s length (0.00847) (0.0277) (0.00801)
Total leverage restriction × 0.0109
Arm’s length (0.00964)
Internal leverage restriction × 0.0244* -0.0167 -0.0121
Arm’s length (0.0145) (0.0343) (0.0112)
Net PPE/assets 0.0354** 0.0357** 0.0353** -0.0751 -0.0768 0.108*** 0.107***
(0.0139) (0.0138) (0.0139) (0.0504) (0.0502) (0.0130) (0.0130)
EBITDA/assets -0.487*** -0.487*** -0.487*** 0.112*** 0.114*** -0.129*** -0.129***
(0.0215) (0.0215) (0.0215) (0.0373) (0.0372) (0.00924) (0.00926)
Log of sales 0.488** 0.469** 0.474** 1.958*** 1.923*** -0.287** -0.294**
(0.207) (0.208) (0.208) (0.497) (0.495) (0.118) (0.115)
Creditor rights 0.00727** 0.0105*** 0.00584* 0.00911 0.00192 0.00384 0.00332
(0.00331) (0.00326) (0.00297) (0.00817) (0.00896) (0.00269) (0.00296)
Political risk -0.164*** -0.183*** -0.178*** -0.0665 -0.129 -0.144*** -0.155***
(0.0315) (0.0340) (0.0336) (0.111) (0.117) (0.0302) (0.0328)
Rate of inflation -0.432*** -0.339*** -0.403*** -2.421*** -2.427*** 0.307*** 0.312***
(0.0982) (0.0957) (0.0994) (0.751) (0.754) (0.119) (0.120)
Growth options 0.00552 0.00696 0.00216 -0.0330 -0.0394 -0.00702 -0.00743
(0.0112) (0.0130) (0.0135) (0.0305) (0.0350) (0.00725) (0.00769)
Observations 54,262 54,262 54,262 52,092 52,092 51,524 51,524
R-squared 0.099 0.098 0.098 0.003 0.003 0.027 0.027
Number of parents 3,941 3,941 3,941 3,868 3,868 3,871 3,871
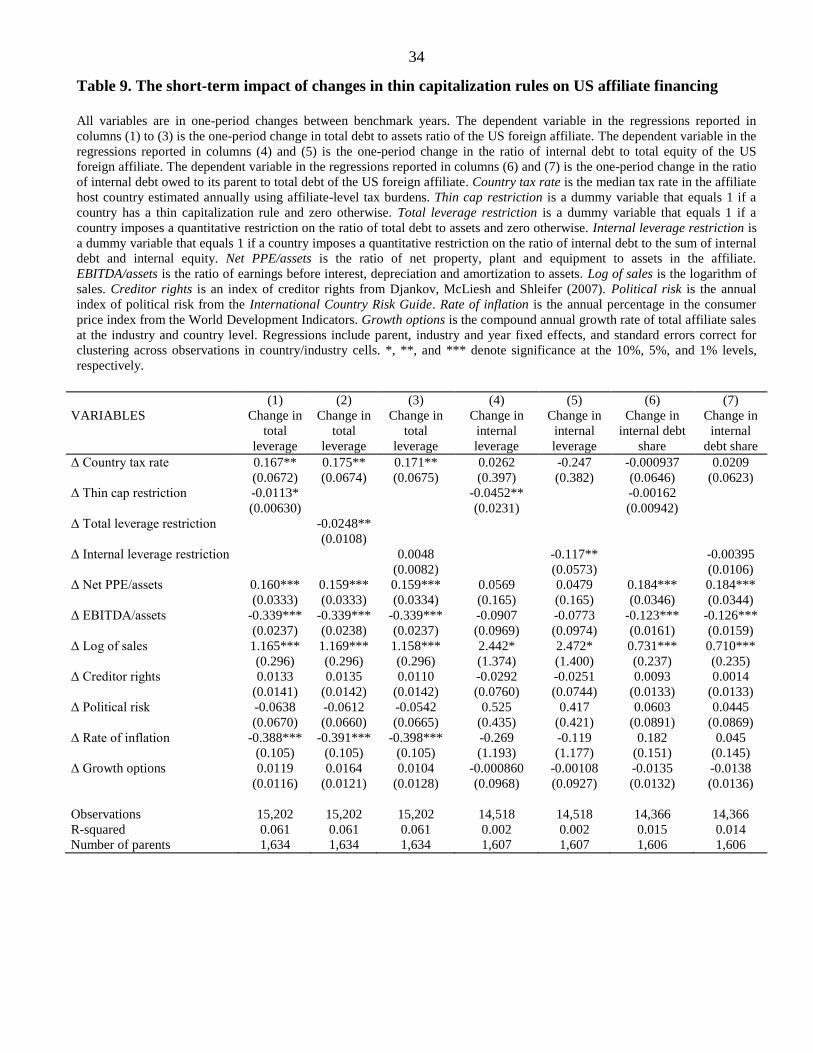
34
Table 9. The short-term impact of changes in thin capitalization rules on US affiliate financing
All variables are in one-period changes between benchmark years. The dependent variable in the regressions reported in
columns (1) to (3) is the one-period change in total debt to assets ratio of the US foreign affiliate. The dependent variable in the
regressions reported in columns (4) and (5) is the one-period change in the ratio of internal debt to total equity of the US
foreign affiliate. The dependent variable in the regressions reported in columns (6) and (7) is the one-period change in the ratio
of internal debt owed to its parent to total debt of the US foreign affiliate. Country tax rate is the median tax rate in the affiliate
host country estimated annually using affiliate-level tax burdens. Thin cap restriction is a dummy variable that equals 1 if a
country has a thin capitalization rule and zero otherwise. Total leverage restriction is a dummy variable that equals 1 if a
country imposes a quantitative restriction on the ratio of total debt to assets and zero otherwise. Internal leverage restriction is
a dummy variable that equals 1 if a country imposes a quantitative restriction on the ratio of internal debt to the sum of internal
debt and internal equity. Net PPE/assets is the ratio of net property, plant and equipment to assets in the affiliate.
EBITDA/assets is the ratio of earnings before interest, depreciation and amortization to assets. Log of sales is the logarithm of
sales. Creditor rights is an index of creditor rights from Djankov, McLiesh and Shleifer (2007). Political risk is the annual
index of political risk from the International Country Risk Guide. Rate of inflation is the annual percentage in the consumer
price index from the World Development Indicators. Growth options is the compound annual growth rate of total affiliate sales
at the industry and country level. Regressions include parent, industry and year fixed effects, and standard errors correct for
clustering across observations in country/industry cells. *, **, and *** denote significance at the 10%, 5%, and 1% levels,
respectively.
(1) (2) (3) (4) (5) (6) (7)
VARIABLES Change in
total
leverage
Change in
total
leverage
Change in
total
leverage
Change in
internal
leverage
Change in
internal
leverage
Change in
internal debt
share
Change in
internal
debt share
Δ Country tax rate 0.167** 0.175** 0.171** 0.0262 -0.247 -0.000937 0.0209
(0.0672) (0.0674) (0.0675) (0.397) (0.382) (0.0646) (0.0623)
Δ Thin cap restriction -0.0113* -0.0452** -0.00162
(0.00630) (0.0231) (0.00942)
Δ Total leverage restriction -0.0248**
(0.0108)
Δ Internal leverage restriction 0.0048 -0.117** -0.00395
(0.0082) (0.0573) (0.0106)
Δ Net PPE/assets 0.160*** 0.159*** 0.159*** 0.0569 0.0479 0.184*** 0.184***
(0.0333) (0.0333) (0.0334) (0.165) (0.165) (0.0346) (0.0344)
Δ EBITDA/assets -0.339*** -0.339*** -0.339*** -0.0907 -0.0773 -0.123*** -0.126***
(0.0237) (0.0238) (0.0237) (0.0969) (0.0974) (0.0161) (0.0159)
Δ Log of sales 1.165*** 1.169*** 1.158*** 2.442* 2.472* 0.731*** 0.710***
(0.296) (0.296) (0.296) (1.374) (1.400) (0.237) (0.235)
Δ Creditor rights 0.0133 0.0135 0.0110 -0.0292 -0.0251 0.0093 0.0014
(0.0141) (0.0142) (0.0142) (0.0760) (0.0744) (0.0133) (0.0133)
Δ Political risk -0.0638 -0.0612 -0.0542 0.525 0.417 0.0603 0.0445
(0.0670) (0.0660) (0.0665) (0.435) (0.421) (0.0891) (0.0869)
Δ Rate of inflation -0.388*** -0.391*** -0.398*** -0.269 -0.119 0.182 0.045
(0.105) (0.105) (0.105) (1.193) (1.177) (0.151) (0.145)
Δ Growth options 0.0119 0.0164 0.0104 -0.000860 -0.00108 -0.0135 -0.0138
(0.0116) (0.0121) (0.0128) (0.0968) (0.0927) (0.0132) (0.0136)
Observations 15,202 15,202 15,202 14,518 14,518 14,366 14,366
R-squared 0.061 0.061 0.061 0.002 0.002 0.015 0.014
Number of parents 1,634 1,634 1,634 1,607 1,607 1,606 1,606
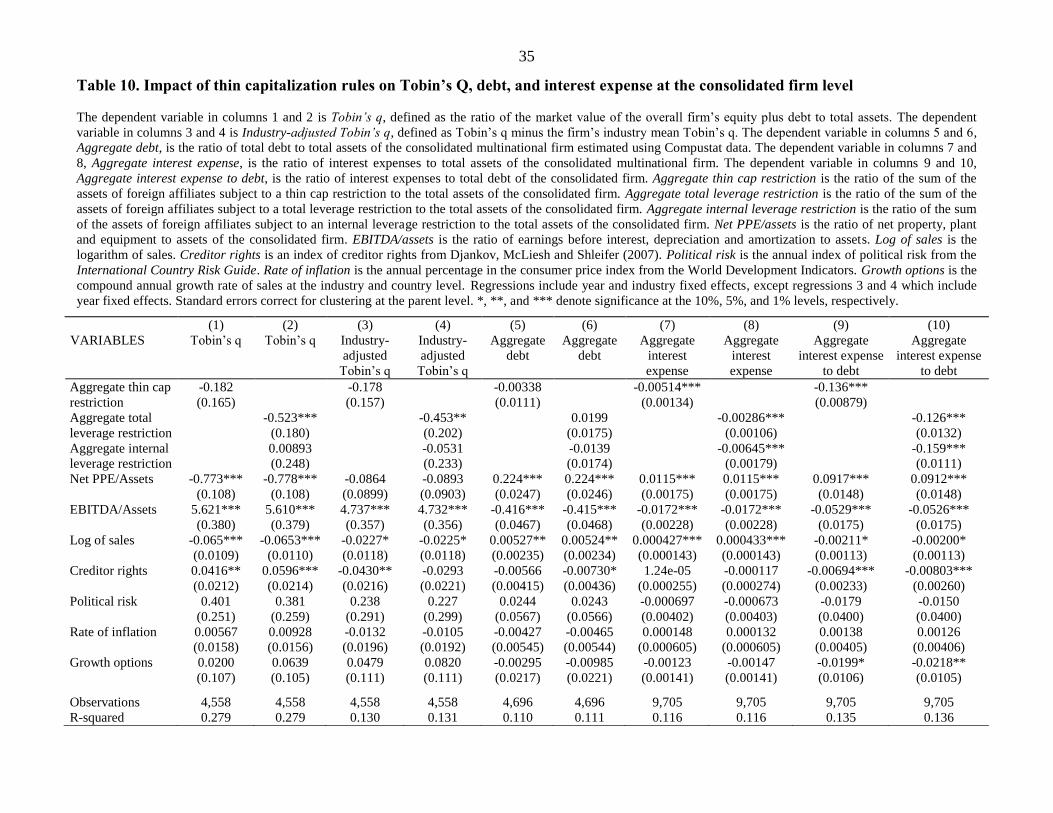
35
Table 10. Impact of thin capitalization rules on Tobin’s Q, debt, and interest expense at the consolidated firm level
The dependent variable in columns 1 and 2 is Tobin’s q, defined as the ratio of the market value of the overall firm’s equity plus debt to total assets. The dependent
variable in columns 3 and 4 is Industry-adjusted Tobin’s q, defined as Tobin’s q minus the firm’s industry mean Tobin’s q. The dependent variable in columns 5 and 6,
Aggregate debt, is the ratio of total debt to total assets of the consolidated multinational firm estimated using Compustat data. The dependent variable in columns 7 and
8, Aggregate interest expense, is the ratio of interest expenses to total assets of the consolidated multinational firm. The dependent variable in columns 9 and 10,
Aggregate interest expense to debt, is the ratio of interest expenses to total debt of the consolidated firm. Aggregate thin cap restriction is the ratio of the sum of the
assets of foreign affiliates subject to a thin cap restriction to the total assets of the consolidated firm. Aggregate total leverage restriction is the ratio of the sum of the
assets of foreign affiliates subject to a total leverage restriction to the total assets of the consolidated firm. Aggregate internal leverage restriction is the ratio of the sum
of the assets of foreign affiliates subject to an internal leverage restriction to the total assets of the consolidated firm. Net PPE/assets is the ratio of net property, plant
and equipment to assets of the consolidated firm. EBITDA/assets is the ratio of earnings before interest, depreciation and amortization to assets. Log of sales is the
logarithm of sales. Creditor rights is an index of creditor rights from Djankov, McLiesh and Shleifer (2007). Political risk is the annual index of political risk from the
International Country Risk Guide. Rate of inflation is the annual percentage in the consumer price index from the World Development Indicators. Growth options is the
compound annual growth rate of sales at the industry and country level. Regressions include year and industry fixed effects, except regressions 3 and 4 which include
year fixed effects. Standard errors correct for clustering at the parent level. *, **, and *** denote significance at the 10%, 5%, and 1% levels, respectively.
(1) (2) (3) (4) (5) (6) (7) (8) (9) (10)
VARIABLES Tobin’s q Tobin’s q Industry-
adjusted
Tobin’s q
Industry-
adjusted
Tobin’s q
Aggregate
debt
Aggregate
debt
Aggregate
interest
expense
Aggregate
interest
expense
Aggregate
interest expense
to debt
Aggregate
interest expense
to debt
Aggregate thin cap
restriction
-0.182 -0.178 -0.00338 -0.00514*** -0.136***
(0.165) (0.157) (0.0111) (0.00134) (0.00879)
Aggregate total
leverage restriction
-0.523*** -0.453** 0.0199 -0.00286*** -0.126***
(0.180) (0.202) (0.0175) (0.00106) (0.0132)
Aggregate internal
leverage restriction
0.00893 -0.0531 -0.0139 -0.00645*** -0.159***
(0.248) (0.233) (0.0174) (0.00179) (0.0111)
Net PPE/Assets -0.773*** -0.778*** -0.0864 -0.0893 0.224*** 0.224*** 0.0115*** 0.0115*** 0.0917*** 0.0912***
(0.108) (0.108) (0.0899) (0.0903) (0.0247) (0.0246) (0.00175) (0.00175) (0.0148) (0.0148)
EBITDA/Assets 5.621*** 5.610*** 4.737*** 4.732*** -0.416*** -0.415*** -0.0172*** -0.0172*** -0.0529*** -0.0526***
(0.380) (0.379) (0.357) (0.356) (0.0467) (0.0468) (0.00228) (0.00228) (0.0175) (0.0175)
Log of sales -0.065*** -0.0653*** -0.0227* -0.0225* 0.00527** 0.00524** 0.000427*** 0.000433*** -0.00211* -0.00200*
(0.0109) (0.0110) (0.0118) (0.0118) (0.00235) (0.00234) (0.000143) (0.000143) (0.00113) (0.00113)
Creditor rights 0.0416** 0.0596*** -0.0430** -0.0293 -0.00566 -0.00730* 1.24e-05 -0.000117 -0.00694*** -0.00803***
(0.0212) (0.0214) (0.0216) (0.0221) (0.00415) (0.00436) (0.000255) (0.000274) (0.00233) (0.00260)
Political risk 0.401 0.381 0.238 0.227 0.0244 0.0243 -0.000697 -0.000673 -0.0179 -0.0150
(0.251) (0.259) (0.291) (0.299) (0.0567) (0.0566) (0.00402) (0.00403) (0.0400) (0.0400)
Rate of inflation 0.00567 0.00928 -0.0132 -0.0105 -0.00427 -0.00465 0.000148 0.000132 0.00138 0.00126
(0.0158) (0.0156) (0.0196) (0.0192) (0.00545) (0.00544) (0.000605) (0.000605) (0.00405) (0.00406)
Growth options 0.0200 0.0639 0.0479 0.0820 -0.00295 -0.00985 -0.00123 -0.00147 -0.0199* -0.0218**
(0.107) (0.105) (0.111) (0.111) (0.0217) (0.0221) (0.00141) (0.00141) (0.0106) (0.0105)
Observations 4,558 4,558 4,558 4,558 4,696 4,696 9,705 9,705 9,705 9,705
R-squared 0.279 0.279 0.130 0.131 0.110 0.111 0.116 0.116 0.135 0.136
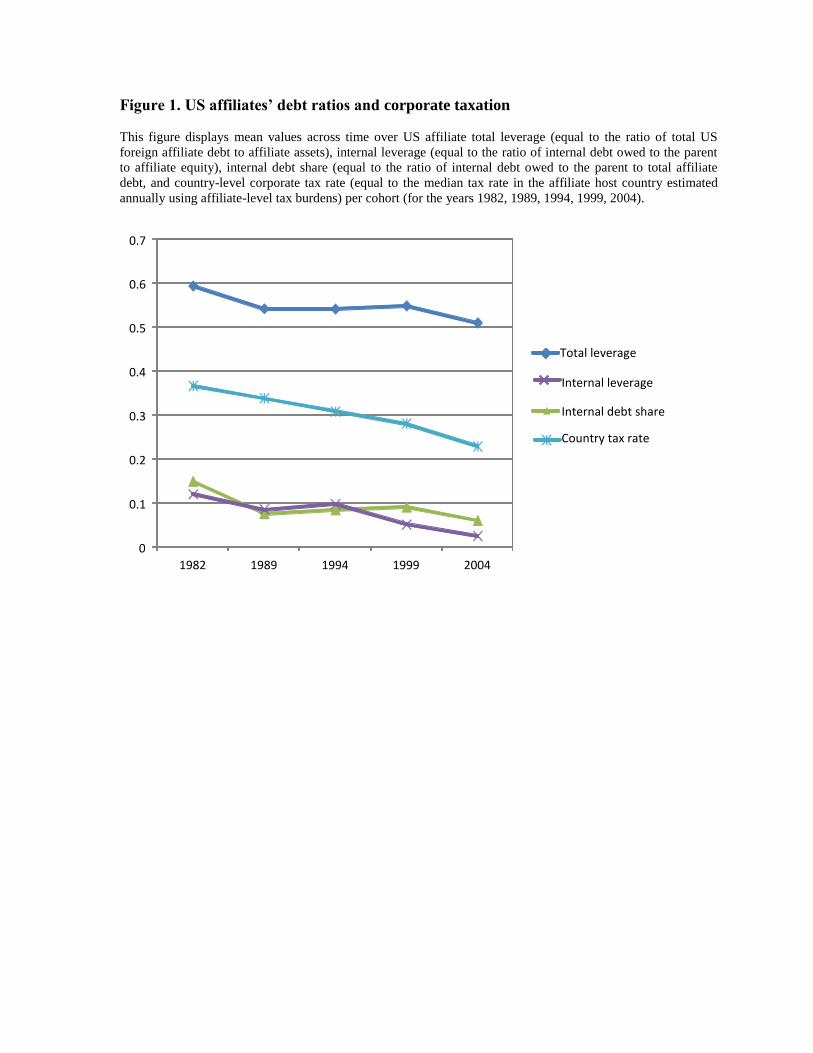
Figure 1. US affiliates’ debt ratios and corporate taxation
This figure displays mean values across time over US affiliate total leverage (equal to the ratio of total US
foreign affiliate debt to affiliate assets), internal leverage (equal to the ratio of internal debt owed to the parent
to affiliate equity), internal debt share (equal to the ratio of internal debt owed to the parent to total affiliate
debt, and country-level corporate tax rate (equal to the median tax rate in the affiliate host country estimated
annually using affiliate-level tax burdens) per cohort (for the years 1982, 1989, 1994, 1999, 2004).
0
0.1
0.2
0.3
0.4
0.5
0.6
0.7
1982 1989 1994 1999 2004
Total leverage
Internal debt share
Internal leverage
Country tax rate


![Transfer pricing in the multinational firm - [email protected]](https://img.pdfslide.net/doc/110x75/620f97d2ae5a5d5281725165/transfer-pricing-in-the-multinational-firm-emailprotected.jpg)