Embed Size (px)
Citation preview

Things to know before operating an NMR spectrometer Justin T. Douglas, KU NMR Core Lab v1.0 7/29/10
I. A tour of an NMR lab.
Figure 1 shows a picture of “Florence”, the 400 MHz Bruker DRX in Malott 3002. Although each NMR lab is configured a little bit differently, you should be able to walk into an NMR lab and recognize several important piece of instrumentation in Fig 1. The most critical components are the magnet, the console and the workstation.
II. Safety
The magnet is the single most important piece of hardware in the NMR spectrometer. At KU we have superconducting magnets at fields of ~9.4 T (400 MHz), 11.7 T (500 MHz), 14.1 T (600 MHz) and 18.8 T (800 MHz). For comparison the magnetic field of the Earth is only ~0.000030 - 0.000060 T.
Figure 1. “Florence”, the 400 MHz Bruker DRX Spectrometer in Malott 3002.
It is absolutely critical to understand that NMR magnets cannot be turned off and are always live and at field. Hence, it is very important to be in the habit of making sure that you do not take ferromagnetic objects within the “5 gauss line” (0.0005 T) of the superconducting magnet. The 5 gauss line is marked on the floor in the KU NMR labs (See Fig. 1). In the worse case scenario, the magnetic force can pull objects out of your grasp and (potentially) damage the spectrometer or injure a person. Ferromagnetic objects include: tools (hammers, wrenches, screwdrivers), metal buckets, metal chairs or floor buffers. Items such as iPods, cell phones, CDs or jump drives can be damaged by the magnetic field. The magnetic strip on credit cards, ATM cards and student ID cards can be erased. Finally if you have certain medical devices, such as a pacemaker or metal plates, you should not approach the magnet.
III. Loading a sample
In our experience, improper loading of the sample is the single largest cause of downtime to the spectrometers at KU. Hence, it is critical that each user understand how to load and unload their sample properly.
The sample sits in a sample holder, called the “spinner”. We use a tool called the “depth gauge” to control the placement of the NMR tube in the spinner. Figure 2 shows a picture of the spinner and depth gauge. It is crucial that you always use a spinner and always use the depth gauge to position the NMR tube in the spinner. A tube that is not placed in the spinner correctly will not sit in spectrometer properly. This situation could lead to no NMR signals or (in the most extreme cases) damage.
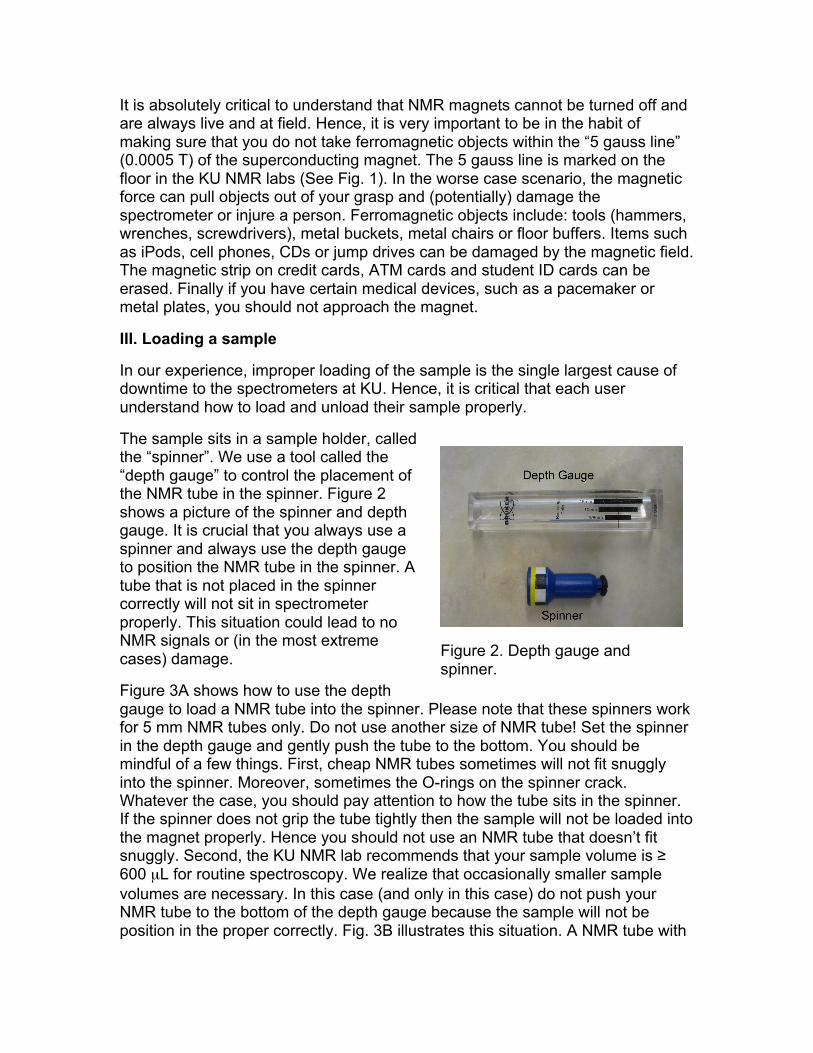
Figure 3A shows how to use the depth gauge to load a NMR tube into the spinner. Please note that these spinners work for 5 mm NMR tubes only. Do not use another size of NMR tube! Set the spinner in the depth gauge and gently push the tube to the bottom. You should be mindful of a few things. First, cheap NMR tubes sometimes will not fit snuggly into the spinner. Moreover, sometimes the O-rings on the spinner crack. Whatever the case, you should pay attention to how the tube sits in the spinner. If the spinner does not grip the tube tightly then the sample will not be loaded into the magnet properly. Hence you should not use an NMR tube that doesn’t fit snuggly. Second, the KU NMR lab recommends that your sample volume is ≥ 600 µL for routine spectroscopy. We realize that occasionally smaller sample volumes are necessary. In this case (and only in this case) do not push your NMR tube to the bottom of the depth gauge because the sample will not be position in the proper correctly. Fig. 3B illustrates this situation. A NMR tube with
Figure 2. Depth gauge and spinner.
300 µL sample volume adjusted to the maximum depth will not position the sample throughout detected region of the spectrometer. The thin black horizontal line on the depth gauge denotes the center of the detected region. In Fig. 3C a NMR tube with 400 µL sample volume is centered in the detected region by raising the NMR tube slightly. Note that this sample will be more difficult to shim (see below) and, hence, is not recommended.
Compressed air at ~4 bar (60 PSI) provides a cushion of air that gently lowers the sample to the magnet and lifts it back out again. We call this the “lift air”. Under no circumstances should you ever drop your sample into the magnet with no lift air flowing. Dropping a sample can cause damage to the probe and impact the resolution and sensitivity of the spectrometer for every other user. To activate the lift air, click the Lift On/Off button on the top left of the BSMS keyboard (We’ll show you how to do this during training). After a few seconds you should hear hissing sound coming from the bore of the magnet. Be sure you hear the hissing sound before proceeding. Place the properly gauged spinner and sample in bore of the magnet. You should feel a slight upward force from the lift air and if you gently let go of the sample, it should levitate on top of the magnet. Push the lift button to slowly reduce the pressure and gently lower the sample into the magnet.
Usually, you will spin the sample at 20 Hz to average out any magnetic field inhomogeneities across the short axis NMR tube (see part V. Shimming for more details). The spectrometer uses compressed air to spin the sample. After you’ve loaded your sample wait a few moments for the green “Sample Down” light on the BSMS keyboard, then press the Spin On/Off button to start the sample spinning (We will show you how to do this during the training.)
Figure 3. Pictures demonstrating a properly gauged sample (A), an improperly gauged sample (B) and an acceptably, but not recommended, gauged sample.
IV. Setting up the dataset
In Bruker’s Topsin software, all data is organized by datasets. A dataset is just a folder that contains all of the experiments run on a specific sample. For most people it is most convenient to name each dataset after the page number in their lab notebook. For instance, if I am planning on recording a 1H and 13C 1D spectra on a compound from pg 14 of notebook number 2, I would name the dataset JTD-2-14. Keep in mind that this dataset is actually a folder in the Linux operating system, so avoid spaces and special characters (the dash and underscore are acceptable). Each experiment is a subfolder in the dataset folder, which is denoted by a number. For instance, the 1H 1D could be experiment number 1 and the 13C could be experiment number 2 (the actual number is arbitrary).
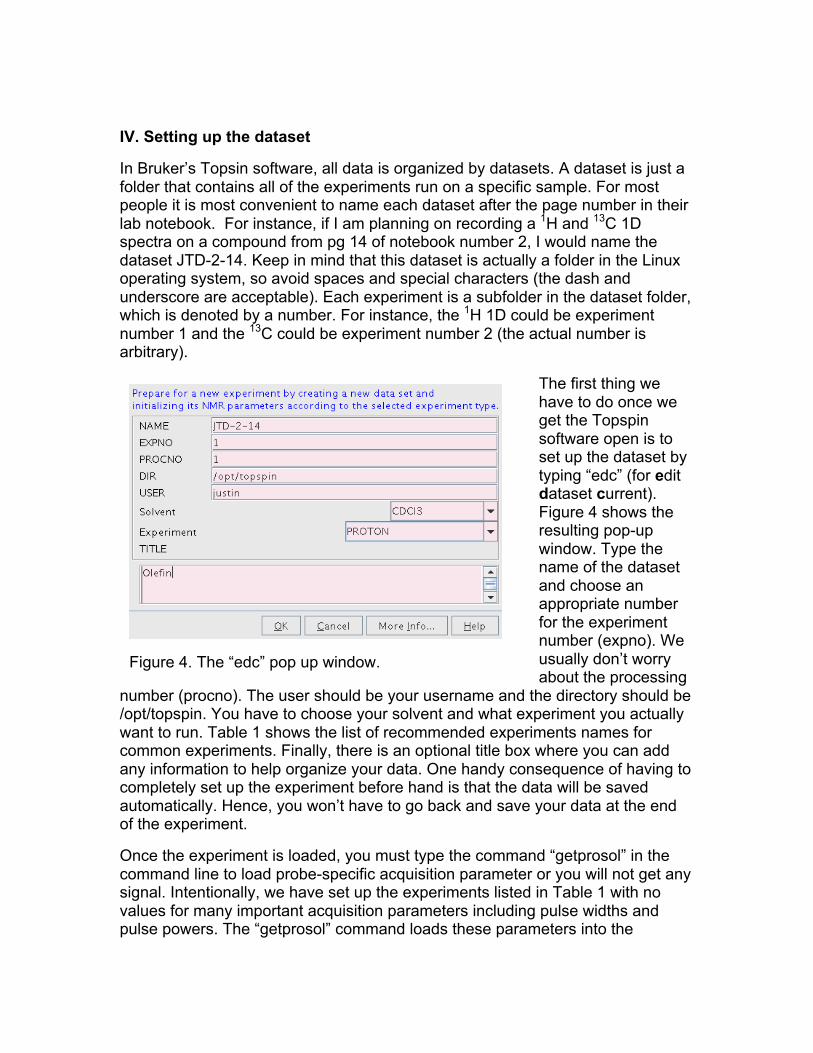
The first thing we have to do once we get the Topspin software open is to set up the dataset by typing “edc” (for edit dataset current). Figure 4 shows the resulting pop-up window. Type the name of the dataset and choose an appropriate number for the experiment number (expno). We usually don’t worry about the processing
number (procno). The user should be your username and the directory should be /opt/topspin. You have to choose your solvent and what experiment you actually want to run. Table 1 shows the list of recommended experiments names for common experiments. Finally, there is an optional title box where you can add any information to help organize your data. One handy consequence of having to completely set up the experiment before hand is that the data will be saved automatically. Hence, you won’t have to go back and save your data at the end of the experiment.
Once the experiment is loaded, you must type the command “getprosol” in the command line to load probe-specific acquisition parameter or you will not get any signal. Intentionally, we have set up the experiments listed in Table 1 with no values for many important acquisition parameters including pulse widths and pulse powers. The “getprosol” command loads these parameters into the
Figure 4. The “edc” pop up window.
experiment. If you forget to type “getprosol” then you will not get any signal in most experiments.
Table 1. Recommended Bruker experiments for common NMR experiments
Common Names Bruker Experiment
1D 1H PROTON
1D 13C w/1H decoupling C13CPD
1D 13C DEPT (CH and CH3 positive; CH2 negative) C13DEPT135
1D 13C APT C13APT
2D 1H-13C HSQC HSQCETGPSISP
2D 1H-13C HMBC HMBCGPND
2D 1H-1H COSY COSYGPSW
2D 1H-1H NOESY NOESYGPSW
Note: The Bruker experiment name may differ slightly depending on which instrument you are using. There is an up-to-date version of this table taped to the monitor of each workstation.
IV. Locking the spectrometer
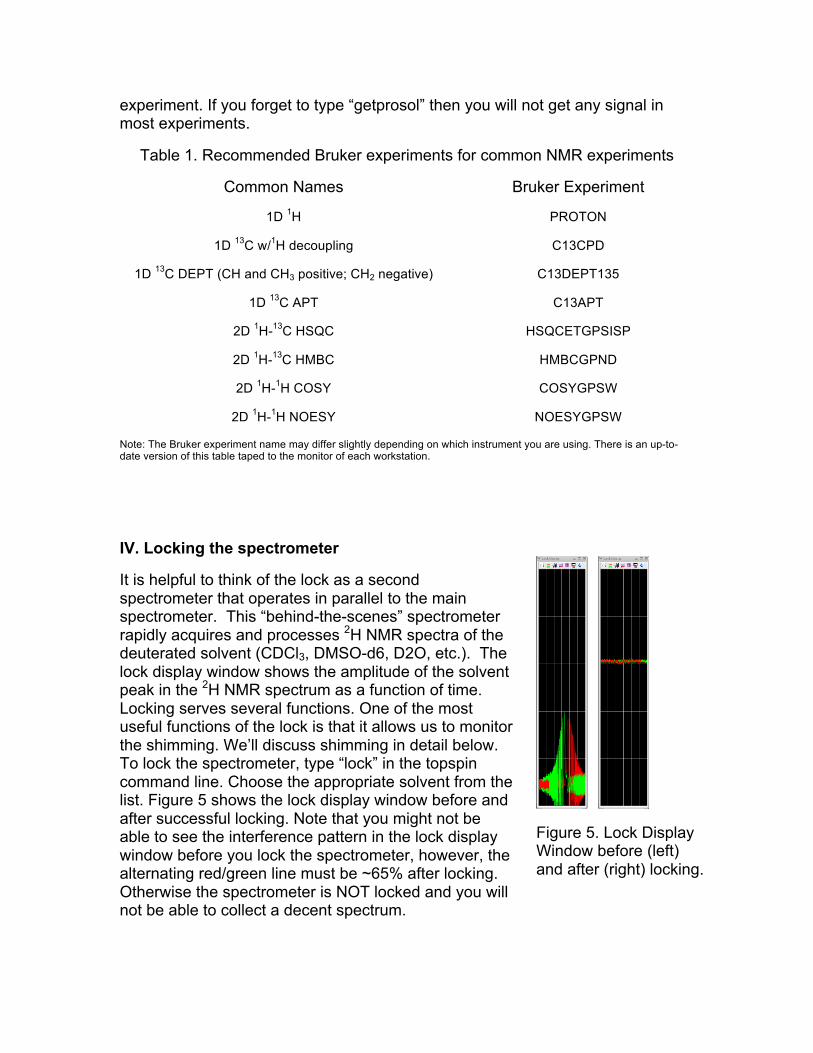
It is helpful to think of the lock as a second spectrometer that operates in parallel to the main spectrometer. This “behind-the-scenes” spectrometer rapidly acquires and processes 2H NMR spectra of the deuterated solvent (CDCl3, DMSO-d6, D2O, etc.). The lock display window shows the amplitude of the solvent peak in the 2H NMR spectrum as a function of time. Locking serves several functions. One of the most useful functions of the lock is that it allows us to monitor the shimming. We’ll discuss shimming in detail below. To lock the spectrometer, type “lock” in the topspin command line. Choose the appropriate solvent from the list. Figure 5 shows the lock display window before and after successful locking. Note that you might not be able to see the interference pattern in the lock display window before you lock the spectrometer, however, the alternating red/green line must be ~65% after locking. Otherwise the spectrometer is NOT locked and you will not be able to collect a decent spectrum.
Figure 5. Lock Display Window before (left) and after (right) locking.
V. Shimming
“Shimming” refers to the process of adjusting a series of electromagnets to maximize the homogeneity of the magnetic field. One important question is why is it critical that the magnet field be homogeneous? To understand the answer to this question, we have to review a bit of NMR theory. Recall that the resonance frequency (chemical shift) of a peak is defined as:
€
ν = 2πγB0(1−σ ) Eq. 1
Where
€
γ equals the gyromagnetic ratio,
€
B0 equals the magnitude of the static magnetic field and
€
σ equals the shielding constant.
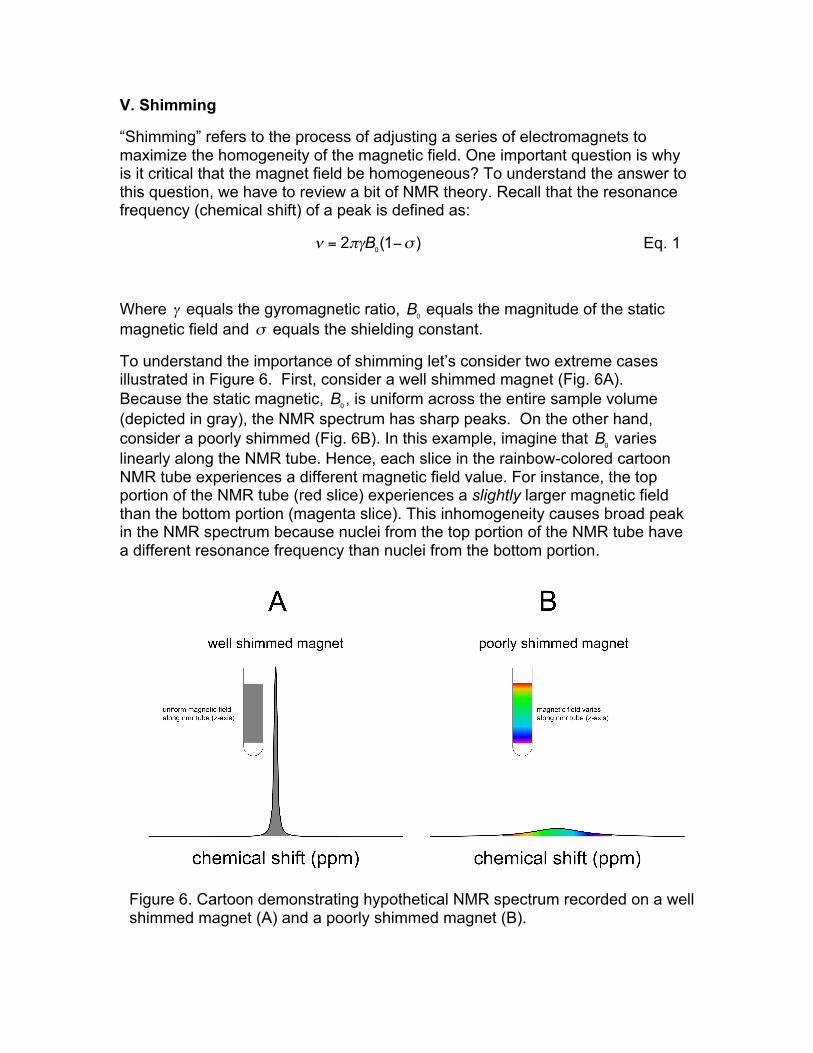
To understand the importance of shimming let’s consider two extreme cases illustrated in Figure 6. First, consider a well shimmed magnet (Fig. 6A). Because the static magnetic,
€
B0 , is uniform across the entire sample volume (depicted in gray), the NMR spectrum has sharp peaks. On the other hand, consider a poorly shimmed (Fig. 6B). In this example, imagine that
€
B0 varies linearly along the NMR tube. Hence, each slice in the rainbow-colored cartoon NMR tube experiences a different magnetic field value. For instance, the top portion of the NMR tube (red slice) experiences a slightly larger magnetic field than the bottom portion (magenta slice). This inhomogeneity causes broad peak in the NMR spectrum because nuclei from the top portion of the NMR tube have a different resonance frequency than nuclei from the bottom portion.
Figure 6. Cartoon demonstrating hypothetical NMR spectrum recorded on a well shimmed magnet (A) and a poorly shimmed magnet (B).
Now we can understand why the intensity of the lock signal is a proxy for the shimming. As the homogeneity of the magnetic field increases, the intensity of the lock signal increases. Hence, the goal of shimming is to get the lock signal as high as possible. Keep in mind that the y-axis of the lock display window (which is related to the intensity of the lock signal) has arbitrary units. It is possible to increase the lock to more than 100% during shimming! If you move the red/green line off the scale use the “lock gain” to bring the signal back into display window. We’ll discuss the concept of gain below and during training we’ll show you where the lock gain button is.
Locking and shimming are separate concepts, however, these techniques are intimately related from a practical standpoint. For example, when the workstation initially locks the solvent, it adjusts the gain to set the lock level to about 65% (Fig. 5). If the shimming is poor, the workstation will turn up the gain, which will amplify the noise (fuzziness in the lock display window). It is a good idea to get accustomed to the level of noise in the lock signal for each spectrometer and each solvent. If the noise is larger than normal, then probably the initial shims are poor. Perhaps person who used the spectrometer before you made significant adjustments for his/her sample. To get back to reasonable starting shim you can load in a shim file using the rsh (read shim file) command. This command loads in a file created by the staff that contains reasonable starting values for the shims. The name of the exact shim file to load is taped to the monitor for each spectrometer and we’ll point it out to you during user training.
In general there are three different shimming techniques available in the KU NMR labs: hand shimming, gradient shimming and topshim. Gradient shimming (gradshim) and topshim are computer-aided shimming routines. We have found topshim to be effective, robust and fast, but, unfortunately, it only works on our newer instruments. Gradshim works on all instruments, but it can be time consuming. Hand shimming works on all instruments and is often the fastest way to shim the magnet. During the user training, we will
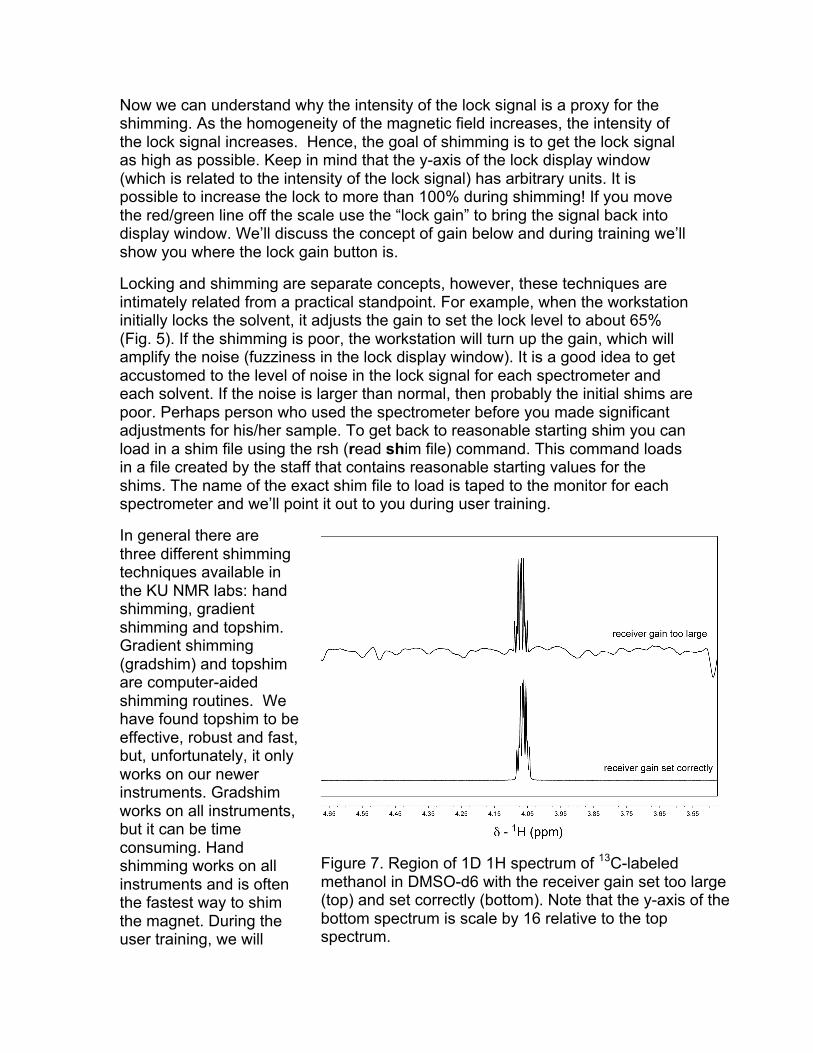
Figure 7. Region of 1D 1H spectrum of 13C-labeled methanol in DMSO-d6 with the receiver gain set too large (top) and set correctly (bottom). Note that the y-axis of the bottom spectrum is scale by 16 relative to the top spectrum.
introduce you the appropriate shimming for that specific spectrometer and give you an opportunity to practice shimming on your own.
VI. Setting the receiver gain
The receiver gain is like the volume on a stereo. If the volume on a stereo is set too low, you might struggle to hear the music. If the volume is set too high, the music might be distorted. The same logic applies to NMR. Figure 7 shows an example of the distortions from the receiver gain being set too high. The easiest way to set the receiver gain is by typing “rga” (for receiver gain automatic) at the command line.
We discussed the lock gain above. The concept is identical to the receiver gain. Both gains control the y-axis of output, the spectrum for the receiver gain and the lock display for the lock gain. Furthermore, we have the same goal when setting both gains: seeing the data.
VII. Data Acquisition and Processing
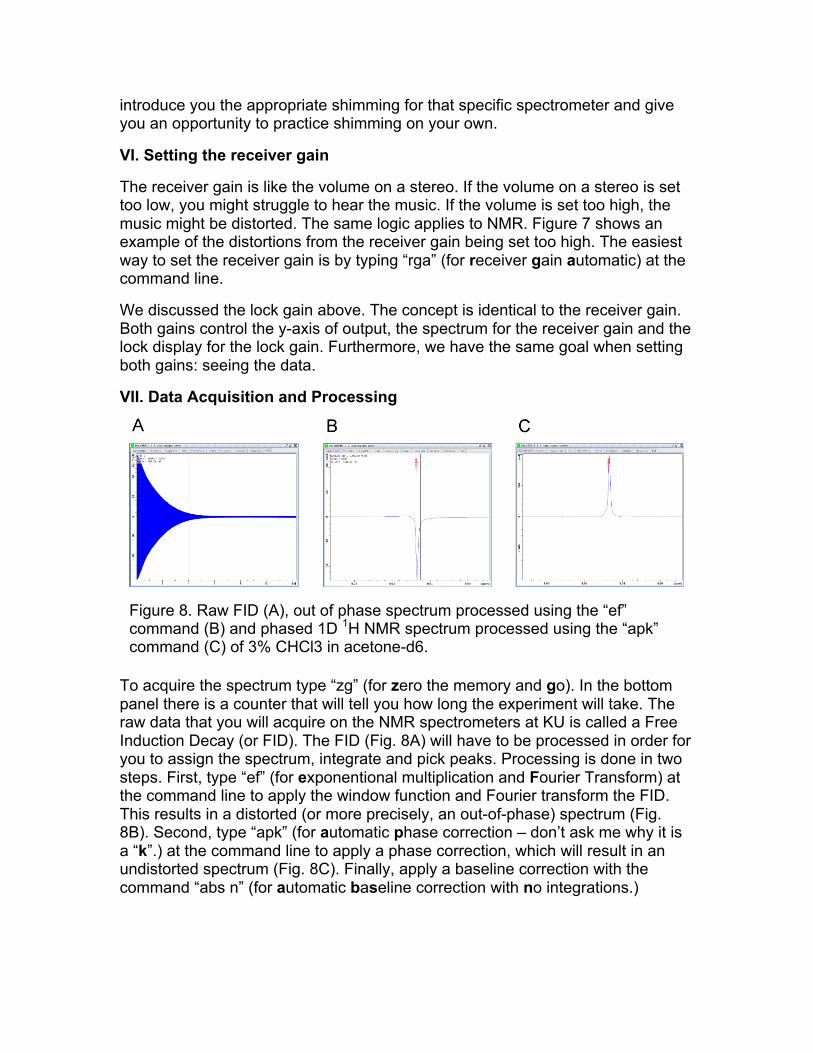
To acquire the spectrum type “zg” (for zero the memory and go). In the bottom panel there is a counter that will tell you how long the experiment will take. The raw data that you will acquire on the NMR spectrometers at KU is called a Free Induction Decay (or FID). The FID (Fig. 8A) will have to be processed in order for you to assign the spectrum, integrate and pick peaks. Processing is done in two steps. First, type “ef” (for exponentional multiplication and Fourier Transform) at the command line to apply the window function and Fourier transform the FID. This results in a distorted (or more precisely, an out-of-phase) spectrum (Fig. 8B). Second, type “apk” (for automatic phase correction – don’t ask me why it is a “k”.) at the command line to apply a phase correction, which will result in an undistorted spectrum (Fig. 8C). Finally, apply a baseline correction with the command “abs n” (for automatic baseline correction with no integrations.)
Figure 8. Raw FID (A), out of phase spectrum processed using the “ef” command (B) and phased 1D 1H NMR spectrum processed using the “apk” command (C) of 3% CHCl3 in acetone-d6.

Finally, see the KU NMR lab website for tutorial on processing using the Topspin, MestreNova, ACD and Spinworks. These tutorials include manual and automatic referencing, phasing, baseline corrections, peak picking and integrations.
VIII. Removing the sample
As we mentioned earlier, there is no need to save your data: it is automatically saved into the appropriate folder. Once the experiment is done, all that you need to do is remove your sample from the magnet. You have to turn off the lock and spins by pushing the Lock On/Off and Spin On/Off buttons on the BSMS keyboard (We will demonstrate this for you during user training). Then push the Lift On/Off button and remove your sample from the magnet. Then be sure to turn off the lift air by pushing the Lift On/Off button. Finally, be sure to log out of the computer, because we calculate bills based on when you log in and log out of the workstations.
Questions.
#1) The building air supply is not working. Will you be able to do NMR?
#2) You made a sample using CHCl3 (instead of CDCl3) as the solvent. Can you lock this sample?
#3) The shimming of the magnet is catastrophically poor. Will you be able to lock?
#4) Which of following is not OK to take inside the 5 gauss line of the magnet: cart for moving gas cylinders, cell phone, your new Ipad, a couple of quarters in your pocket.
#5) You forgot to do “apk” after running your experiment. Will you have to run it again?
#6) You want to run a proton and a carbon spectrum. Do you have to lock and shim twice, once before you run the proton and once before you run the carbon?
#7) How do you save your data on the Bruker Topspin software?
#8) What does the command “getprosol” do?
#9) What happens if the receiver gain is too high? What happens if the receiver gain is too low?
#10) You can’t find the depth gauge or a spinner. Will you be able to use the spectrometer?
#11) Name one reason that we lock the spectrometer.
#12) How can you distinguish a well shimmed and a poorly shimmed magnet?