Embed Size (px)
Citation preview


ii
[This page intentionally left blank.]

iii
Table of Contents
Five-Year Review Report .......................................................................................................... i
Table of Contents ..................................................................................................................... iii
List of Acronyms ...................................................................................................................... v
Executive Summary ................................................................................................................. vi
Five Year Review Summary Form ........................................................................................ viii
1.0 Introduction ................................................................................................................... 1
2.0 Site Chronology ............................................................................................................ 2
3.0 Site Background…………………………………………………………………….....5
LAND AND RESOURCE USE .............................................................................................................................. 5
HYDROLOGY.............................................................................................................................................................. 6
HISTORY OF CONTAMINATION ...................................................................................................................... 7
INITIAL RESPONSE ................................................................................................................................................. 7
BASIC FOR TAKING ACTION ............................................................................................................................ 8
4.0 Remedial Actions .......................................................................................................... 8
MEDIA COMPONENTS………………………………………………… .................................... 10
REMEDY DECISION DOCUMENTS………………………………………………… ............... 10
REMEDY IMPLEMENTATION………………………………………………… ........................ 10
OPERATION AND MAINTENANCE………………………………………………. .................. 12
5.0 Progress Since the Last Review .................................................................................. 15
6.0 Five Year Review Process .......................................................................................... 16
AMINISTRATIVE COMPONENTS, COMMUNITY NOTIFICATION, DOCUMENT
REVIEW ....................................................................................................................................................................... 16
DATA REVIEW ......................................................................................................................................................... 16
SITE INSPECTION ........................................................................................................................ 16
INTERVIEWS ............................................................................................................................................................. 18
7.0 Technical Assessment ................................................................................................. 18
QUESTION A: IS THE REMEDY FUNCTIONING AS INTENDED BY THE DECISION
DOCUMENTS? .......................................................................................................................................................... 18
QUESTION B: ARE THE EXPOSURE ASSUMPTIONS, TOXICITY DATA, CLEANUP
LEVELS AND RAOS USED AT THE TIME OF REMEDY SELECTION STILL VALID? ........ 19
QUESTION C: HAS ANY OTHER INFORMATION COME TO LIGHT THAT COULD
CALL INTO QUESTION THE PROTECTIVENESS OF THE REMEDY? ......................................... 20
TECHNICAL ASSESSMENT SUMMARY ........................................................................... 20
8.0 Issues ........................................................................................................................... 20
9.0 Recommendations and Follow-Up Actions ................................................................ 20

iv
10.0 Protectiveness Statement .................................................................................... …....21
11.0 Next Review................................................................................................................ 21
FIGURES Figure 1 - Map Showing Site Location Figure 2 - Map of Study Area Figure 3 – Conceptualized Hydrogeologic Cross-section Through the Southern Area APPENDICES Appendix A - Groundwater Data Analysis Appendix B - List of Documents Reviewed for FYR Report Appendix C - Site Inspection Report Appendix D - Technical Assessment Survey Forms

v
List of Acronyms
ADEQ Arizona Department of Environmental Quality
ADWR Arizona Department of Water Resources
ANPI Apache Nitrogen Products, Inc.
APC Apache Powder Company
ARARs Applicable or Relevant and Appropriate Requirements
AWQS Aquifer Water Quality Standard
BTEX benzene, toluene, ethylbenzene, xylene
CERCLA Comprehensive Environmental Response, Compensation, and Liability Act
CFR Code of Federal Regulations
COC chemicals of concern
DNT dinitrotoluene
EPA United States Environmental Protection Agency
ESD Explanation of Significant Differences
gpm gallons per minute
H+A Hargis + Associates, Inc.
LCU laterally-confining unit
MCA Molinos Creek sub-Aquifer
MCL Maximum Contaminant Level
µ/L micrograms per liter
mg/L milligrams per liter
MNA monitored natural attenuation
NARS Northern Area Remediation System
NPL National Priority List
O&M operation and maintenance
ppb parts per billion
ppm parts per million
RCRA Resource Conservation and Recovery Act
ROD Record of Decision
SAG Southern Area Groundwater
SDWA Safe Drinking Water Act
TNT trinitrotoluene
UAO Unilateral Administrative Order
VOC volatile organic compound

vi
Executive Summary This is the third Five-Year Review of Apache Powder Superfund Site (the “Site”) in Cochise
County, Arizona. The purpose of this Five-Year Review is to review information to determine if
the remedy is and will continue to be protective of human health and the environment. The
triggering action for this Five-Year Review (FYR) was the signing of the previous FYR in
September 2007.
The Apache Powder Superfund Site is located in Cochise County, approximately 7 miles
southeast of Benson, Arizona. The Site itself comprises approximately 1,100 acres of land
owned by Apache Nitrogen Products, Inc. (ANPI). ANPI has continued to manufacture
ammonium nitrate and other chemical products for the mining and agricultural industries while
the Superfund cleanup has been on-going. The San Pedro River flows along the eastern portion
of the Site from the southeast corner of the ANPI property north towards the northwest.
Discharges of process washdown waters to unlined ponds and washes caused groundwater to be
contaminated with nitrate and perchlorate. Other disposal practices led to soils contamination
with certain metals in various areas of the Site, including in some of the evaporation ponds.
In 1994, EPA selected the remedy for the Site to protect long-term human health and the
environment. In 1997, EPA issued an Explanation of Significant Differences which divided the
Site remedy for the shallow aquifer groundwater contamination into two areas: a Northern Area
and a Southern Area. In 2000, EPA signed ESD #2 which established cleanup standards for
metals that were not included in the 1994 ROD. In 2005, EPA signed a ROD Amendment which
changed the remedy for the cleanup of Southern Area Groundwater from the use of constructed
wetlands to monitored natural attenuation (MNA).
The remedy for the Site included capping of contaminated soils and sediments on site,
Institutional Controls (ICs), monitored natural attenuation (MNA) of contaminated groundwater
in the Southern Area of the Site, pump and treatment of contaminated groundwater in
constructed wetlands, and MNA for the leading edge of the plume beyond the influence of the
extraction well in the Northern Area of the Site.
According to the data reviewed, the site inspection, and the interviews, the groundwater remedy
is functioning as intended by EPA’s remedy decision documents in the Northern Area, but not as
quickly as expected in the Southern Area due to a “concentration stratification” effect. ANPI has
proposed in-situ treatment as a method for enhancing the MNA remedy in the Southern Area.
However, because the perched zone and Molinos Creek Sub-Aquifer (MCA) are hydraulically
isolated from the shallow aquifer associated with the San Pedro River and there are no drinking
water wells within the Southern Area, the functioning of the Southern Area remedy is not
impacting public health, only long-term monitoring costs. There have been no changes in the
Applicable or Relevant and Appropriate Requirements (ARARs) that would affect the
protectiveness of the remedy. The assumptions used in determining exposure pathways are
considered to be health protective and reasonable in evaluating risk for this site. There have been
no changes in the toxicity factors or other contaminant characteristics that could affect the

vii
protectiveness of the remedy and there has been no change to the standardized risk assessment
methodology that could affect the protectiveness of the remedy. There is no other information
that calls into question the protectiveness of the remedy.
The remedy at the Apache Powder Superfund Site is protective of human health and the
environment for both groundwater and soils because there is no current exposure. The ICs
restricting access to the contaminated shallow aquifer for drinking water purposes and restricting
access to pond soils on-site where residual contamination has been capped were put in place in
2008.

viii
Five-Year Review Summary Form
SITE IDENTIFICATION
Site Name: Apache Powder Superfund Site
EPA ID: AZD008399263
Region: IX State: AZ. City/County: St. David / Cochise County
SITE STATUS
NPL Status: Final
Multiple OUs?
No
Has the site achieved construction completion? Yes
Brine Concentrator, December 1994; NARS, November 1997; Soils Media Components, September 2008; PCOR, September 2008
REVIEW STATUS
Lead agency: EPA. If “Other Federal Agency” was selected above, enter Agency name:
Author name (Federal or State Project Manager): Andria Benner
Author affiliation: EPA
Review period: 02/01/2012 to 09/15/2012
Date of site inspection: 06/12/2012
Type of review: Statutory
Review number: 3
Triggering action date: September 2007.
Due date (five years after triggering action date): September 2012

ix
Five-Year Review Summary Form (continued)
Issues/Recommendations
Issues/Recommendations Identified in the Five-Year Review:
There are no issues that affect protectiveness. All required Land Use Restrictions and other
ICs are now fully in place. All issues and follow-up actions identified in the 2007 Second
FYR Report have been addressed or new data have precluded the need for those follow-up
actions.
Sitewide Protectiveness Statement (if applicable)
The remedy at the Apache Powder Superfund Site is protective of human health and the
environment for both groundwater and soils because there is no current exposure. The ICs
restricting access to the contaminated shallow aquifer for drinking water purposes and
restricting access to pond soils on-site where residual contamination has been capped were put
in place in 2008.

1
1.0 Introduction
The purpose of a Five Year Review (FYR) is to determine whether the remedy at a site is
protective of human health and the environment. The methods, findings, and conclusions of
these reviews are documented in FYR Reports. In addition, FYR Reports identify issues found
during the review, if any, and recommendations to address them. This is the third FYR for the
Apache Powder Superfund Site. The first FYR was completed in September 2002, and the
second FYR was completed in September 2007.
The Agency is preparing this Five-Year Review pursuant to the Comprehensive Environmental
Response, Compensation, and Liability Act (CERCLA) and the National Oil and Hazardous
Substances Pollution Contingency Plan (NCP). CERCLA §121 states:
If the President selects a remedial action that results in any hazardous substances,
pollutants, or contaminants remaining at the site, the President shall review such
remedial action no less often than each five years after the initiation of such remedial
action to assure that human health and the environment are being protected by the
remedial action being implemented. In addition, if upon such review it is the judgment of
the President that action is appropriate at such site in accordance with section 104 or
106, the President shall take or require such action. The President shall report to the
Congress a list of facilities for which such review is required, the results of all such
reviews, and any actions taken as a result of such reviews.
The agency interpreted this requirement further in the NCP. 40 CFR §300.430(f)(ii) states:
If a remedial action is selected that results in hazardous substances, pollutants, or
contaminants remaining at the site above levels that allow for unlimited use and
unrestricted exposure, the lead agency shall review such action no less often than every
five years after the initiation of the selected remedial action.
EPA Region 9 in coordination with the Arizona Department of Environmental Quality
(ADEQ) has conducted this FYR of the remedial actions implemented at the Apache Powder
Superfund Site, located seven miles south of the city of Benson, in Cochise County, Arizona.
The entire Site comprises one Operable Unit (OU). This review has been completed because
hazardous substances, pollutants, or contaminants remain at the Site above levels that allow for
unrestricted use and unlimited exposure. The triggering action for this review was the prior five
year review completed in September 2007. This review was conducted from April 2012
through September 2012. This report documents the results of the review.

2
2.0 Site Chronology
Table 2-1 provides a chronology of events at the Site
Table 2-1: Chronology of Site Events
Event Date
Apache Powder Company (APC) began manufacturing industrial chemicals and
explosives at the Site
1922
APC discharged facility wastewater to dry washes that discharged into San Pedro
River
1922 to 1971
Dye Carbonics operated a carbon dioxide plant at the Site 1973 to 1979
APC discharged facility wastewater into unlined evaporation ponds 1971 to 1995
Arizona Department of Health Services (ADHS) identified the Site as a potential
problem
1979
EPA proposed listing of Site on National Priority List (NPL) 1986
Preliminary investigation performed; San Pedro River hot-spot identified 1987
EPA issued a special Notice Letter to APC notifying it of its liability and offering the
opportunity to conduct a Remedial Investigation/ Feasibility Study (RI/FS)
1988
EPA issued a Unilateral Administrative Order (UAO) for Remedial
Investigation/Feasibility Study
1989
ANP supplied bottled water supplied to residents with nitrate-contaminated wells 1989
EPA listed Site on NPL 1990
APC changed name and became Apache Nitrogen Products, Inc. (ANPI) April 1990
EPA assumed federal lead from State for Site cleanup 1993
EPA directed ANP to remove approximately 262 drums containing dinitrotoluene
(DNT) and approximately 60 cubic yards of DNT–contaminated soils from Wash 3,
where they were stored in a temporary on-site storage area (TOSA)
1993
ANPI completed draft Remedial Investigation/ Feasibility Study Report 1994
EPA assumed federal lead from ANPI to complete FS June 1994
ADEQ and ANPI signed State Consent Decree (CD) to bring ANPI into compliance
with state air regulations, Resource Conservation and Recovery Act (RCRA)
hazardous waste requirements, and aquifer protection permit (APP) requirements
June 1994
EPA signed Record of Decision (ROD) September 1994
ANPI constructed eight deep aquifer replacement wells for households using bottled
water
October 1994
State of Arizona signed Consent Decree with ANPI for cleanup of active hazardous
waste and aquifer protection cleanup activities
November 1994
EPA issued Unilateral Administrative Order (UAO) for cleanup of groundwater and
soils under CERCLA
December 1994
ANPI completed construction of brine concentrator December 1994

3
Table 2-1: Chronology of Site Events
Event Date
Full scale start-up of brine concentrator to treat wastewater; wastewater no longer
discharged to unlined ponds
April 1995
EPA signed Explanation of Significant Differences (ESD) #1 to allow treatment of
the perched aquifer with the southern shallow aquifer in a southern area wetlands,
additional well installation, and soil characterization, treatment and removal
April 1997
ANPI constructed the Northern Area Remediation System (NARS) for treatment of
nitrate contaminated groundwater in Northern Area
1997
State CD closed Open Burn/Open Destruction (OBOD) Area March 1997
ANPI discovered a TNT-Contaminated Area August 1997
ANPI detected perchlorate in perched and shallow aquifer groundwater and shallow
soils; perchlorate investigation completed
November 1998
NARS in vegetation establishment and early start-up phase 1998 to 2003
ANPI completed an Unexploded Ordnance (UXO) Survey of TNT-Contaminated
Area
February 1999
EPA signed a Time-critical Removal Action Memorandum for removal of TNT-
contaminated soils under the UAO sections for ‘Other Response Actions’ and
‘Endangerment and Emergency Response’
November 1999
ANPI conducted TNT pre-burn of highly explosive materials December 1999
ANPI cleaned up Media Components 4 (White Waste Materials and Drum Storage
Area), 5 (Wash 3 Area), and 7 (Drums located outside Wash 3 Area); contaminated
soils were removed from these areas and the TNT-Contaminated Area
January 2000 to June
2000
ANPI completed a Removal Action Implementation Report issued for TNT-
contaminated Area and Remedial Implementation Report for Media Components 4,
5, and 7
August 2000
EPA signed ESD #2 to establish clean up standards for chemicals of concern (COC)
in soils recently detected or not mandated in the ROD; it also modified soil cleanup
remedies to ‘No Further Action’ where concentrations were non-hazardous or less
than State of Arizona SRLs (EPA clean-up standards)
September 2000
ANPI completed Remediation Implementation (RA) Report for Media Component 3
(Inactive Ponds 4A, 4B, 5A, 5B, 6A, 6B, 7, 8, and Dynagel Pond)
February 2001
ANPI conducted San Pedro River water quality follow-up sampling October 2001
ANPI commenced NARS start-up testing for the season June 2002
EPA conducted follow-up San Pedro water quality sampling July 2002
ANPI conducted an investigation to further characterize the lateral confining unit
(LCU) in the Southern Area shallow aquifer and the source of the nitrate hot-spot in
the San Pedro River in the Northern Area
September 2002
EPA completed first Five-Year Review Report September 2002
EPA approved NARS discharge treatability study plan November 2002
ANPI completed Characterization of Groundwater Systems in Southern Area Report June 2003
ANPI completed Applicability of Monitored Natural Attenuation (MNA) Report July 2003

4
Table 2-1: Chronology of Site Events
Event Date
ANPI completed Supplemental Feasibility Study for Media Component 2B (Southern
Area Groundwater)
August 2003
ANPI completed Summary of Soil Analytical Data Report February 2004
ADEQ completed risk assessment evaluations for selected inactive and formerly
active ponds on the Site no longer in use with residual concentrations of certain
metals (arsenic and beryllium)
August 2004
ANPI completed Screening Level Ecological Risk Assessment (SLERA) November 2004
ANPI completed Supplemental Feasibility Study Report for Pond Soils and
Sediments
April 2005
ANPI completed a Northern Area Groundwater Model July 2005
ANPI commenced full-scale treatment of nitrate in NARS July 2005
EPA signed ROD Amendment to change remedy to monitored natural attenuation of
the nitrate and perchlorate-contaminated groundwater in the Southern Area and
containment of the contaminated soils in some on-site ponds with a native soil cap
September 2005
ANPI completed RD/RA Work Plan for Pond Soils and Sediments (CERCLA Media
Components 3 and Formerly Active Ponds)
February 2006
ANPI completed Comprehensive Northern Area Characterization Workplan to
determine extent of nitrate in Northern Area
August 2006
ANPI completed Southern Area Workplan to install groundwater monitoring network
for MNA remedy
September 2006
ANPI completed Southern Area Characterization Report March 2007
ANPI completed re-grading and capping of ponds with residual soils contamination
above soil remedial levels (SRLs)
August 2007
ANPI completed Southern Area Performance Monitoring Plan September 2007
EPA completed second Five-Year Review Report September 2007
ANPI completed updated Community Outreach Plan September 2007
EPA completed Site Inspection Report – Remedial Action Complete January 2008
ANPI completed RA Implementation Report for Pond Soils and Sediments April 2008
ANPI completed Soils Engineering Control Plan April 2008
ANPI completed Northern Area Monitored Natural Attenuation (MNA) Assessment July 2008
ANPI completed Long-Term Site-Wide Remedies Performance Monitoring and
O&M Plan
July 2008
EPA signed ESD #3 modifying remedy to allow MNA for the contaminated
groundwater in the Northern Area at the leading edge of the plume outside the
capture zone
July 2008
ANPI signed a Declaration of Environmental Use Restriction (DEUR) with ADEQ
for the pond soils and the contaminated groundwater underlying the Site
August 2008
EPA completed Final RA Report for Soils September 2008

5
Table 2-1: Chronology of Site Events
Event Date
EPA completed Interim RA Report for Northern Area Groundwater September 2008
EPA completed Interim RA Report for Southern Area Groundwater September 2008
EPA completed Preliminary Close-Out Report (PCOR) for Remedies September 2008
ANPI completed Northern Area Performance Monitoring Plan for MNA of Shallow
Aquifer Groundwater in the Northern Area
February 2009
ANPI completed updated Alternate Domestic Water Supply Plan February 2009
EPA signed Consent Decree (CD) with ANP for remaining work, past and future
costs
September 2009
EPA determined Site had Ready for Reuse Status September 2009
ANPI completed and EPA approved an updated Quality Assurance Project Plan
(QAPP)
July 2010
ANPI reported the discovery of sulfur in buried rail cars requiring removal from soils November 2011
ANPI announced its intention to clean up any “legacy” contamination problems, as
part of demolishing historical structures no longer in use
March 2012
EPA’s contractor conducts FYR Site Inspection June 2012
ANPI provided EPA written notification of its multi-year, multi-phase plan to
upgrade the manufacturing facility on the Site.
June 2012
3.0 Site Background
The Apache Powder Superfund Site included a study area of approximately 9 square miles
located in Cochise County, approximately 7 miles southeast of Benson, Arizona. See Figure 1,
Map Showing Site Location. The ANPI property comprises approximately 1,100 acres of land
within this study area. The San Pedro River flows along the eastern portion of the Site from the
southeast corner of the ANPI property north towards the northwest. This river is a significant
riparian region. See Figure 2, Map of Study Area.
Major land uses within the vicinity of the industrial site include low-density residential and
agricultural use. The primary undeveloped landscape consists of high desert chaparral, mesquite
bosques, and riparian cottonwood stands that line the primary drainages including the San Pedro
River.
Land and Resource Use
An estimated 150-200 people live in the study area. There are privately owned residences
located north of the Site, with the nearest residence less than a quarter mile from the ANPI
facility. Approximately 1,100 people depend on wells for drinking water within three miles of
the Site study area. There is the potential for future expansion and growth in the St. David/

6
Benson community. However, with the recent economic downturn beginning in 2008, the
growth in the regional area surrounding the ANPI facility is relatively slow.
In late 2011, ANPI announced that it was interested in upgrading the existing operations facility
and removing any “legacy” contamination problems. The company has developed and submitted
initial plans to EPA and ADEQ for demolishing an estimated 160 historical industrial buildings
or structures on the Site. ANPI has hired several contractors to support this effort and has
identified lead-based paint and asbestos as possible contamination problems in some of these
industrial buildings. The demolition activities are planned in seven phases over several years.
As of September 2012, ANPI had commenced Phase IA of these demolition activities.
Hydrology
The Site is located in the Upper San Pedro River Basin, which is situated within the Basin and
Range physiographic province. The Basin and Range province is typified by broad, gently
sloping alluvial basins separated by north-northwest trending crystalline fault block mountains.
The basins were created by the subsidence of structural grabens along high-angle normal faults.
Due to the closed drainage environment during subsidence, sediments deposited gradationally,
with the coarse-grained sediments near the mountains and fine-grained sediments near the basin
centers. The thickness of the alluvial sediments in the Basin (the St. David Formation) is
unknown, but is thought to be greater than 1,000 feet near the center of the basin, thinning to a
veneer along the mountain fronts. The St. David Formation in the Basin is one such extensive
fine-grained unit, producing confined conditions in the center of the Basin surrounding the Site
(H+A, 2007a).
The dominant surface water drainage feature in the Basin is the San Pedro River. Its overall
watershed is approximately 2,500 square miles, including 700 square miles in Mexico. As the
fluvial dynamics of the region changed from an erosional to a depositional environment, the
surface water flow patterns were controlled by the paleo-channels. This resulted in the deposition
of coarse-grained sediments in the paleochannels and fine-grained sediments between the
paleochannels through lateral and vertical accretion (H+A, 2007a).
At the Site, the underlying St. David Formation is found underneath the operations area of the
facility. The upper section of this Formation in the vicinity of the Site is comprised of a dense,
low permeability clay that extends to depths of at least 300 feet below ground surface (bgs). It is
this geology that facilitated infiltration of the washdown water discharges from the plant
operations through unlined ponds and the formation of a “perched” groundwater system on top
of the clay in the Southern Area of the Site. Water within the “perched” zone that had
accumulated underneath the evaporation ponds eventually migrated across the St. David clay
surface eastward into an adjacent paleo-channel named the Molinos Creek Sub-Aquifer (MCA),
which was discovered in the early 2000s. As part of that same investigation, the MCA was
determined to be hydraulically separated from the alluvial groundwater basin of the San Pedro
River to the east of the MCA. Because the St. David clay surface occurs at elevations higher
than water level in the shallow alluvial aquifer, the shallow aquifer is not present beneath the
operations area of the ANPI facility. The groundwater used for manufacturing operations at the

7
facility is obtained by deep aquifer production wells drilled down at least 300 feet into a deep
confined aquifer within the St. David Formation. See Figure 3, Conceptualized Hydrogeologic
Cross-Section Through the Southern Area.
The deep aquifer is the source of drinking water for all the private domestic drinking water wells
located on property over the contaminated shallow aquifer or within a conservative buffer zone.
The Arizona Department of Water Resources coordinates closely with Arizona Department of
Environmental Quality and EPA to make sure that all new drinking water supply wells in the
vicinity of the contaminated plume are installed in the deep aquifer with adequate construction
methods to prevent any potential cross-contamination between the two aquifers.
History of Contamination
Apache Powder Company (APC), now known as Apache Nitrogen Products, Inc. or ANPI,
commenced operations in 1922. Explosives were manufactured at the ANPI facility and
wastewater was discharged to unlined ponds and tributary washes. ANPI disposal activities are
the source of the groundwater contamination in the shallow aquifer underneath the ANPI
property in the Southern Area, in the Northern Area adjacent to and immediately downgradient
of the ANPI property, and in the San Pedro River. Beginning in the early 1990s, ANPI installed
a groundwater monitoring network for the shallow aquifer to determine the extent of
contamination in both the Northern and Southern Areas of the Site. No contamination has been
found in the deep aquifer lying beneath a thick aquitard under the shallow aquifer. In 1998,
perchlorate was discovered in the groundwater in the Southern Area in the perched zone and in
the adjacent Molinos Creek Sub-Aquifer (MCA). Additional details of the history of operation
and disposal operations are included in the 2002 FYR Report, and in the USACE Analysis
attached to the 2007 FYR Report.
Initial Response
In response to the 1987 discovery of nitrate-contamination in the shallow aquifer underneath and
adjacent to the Site, ANPI provided bottled water to eight households whose drinking water
supply wells were removed from service in 1989. ANPI replaced these eight contaminated wells
with deep aquifer wells in 1994.
In 1990, ANPI was placed on the NPL. In June 1992, EPA and ADEQ agreed to split each
agency’s respective roles to ensure that the clean-up activities performed by ANPI were
comprehensive and duplicative requirements were not imposed by the agencies. ADEQ assumed
responsibility for ANPI’s compliance with State requirements for aquifer protection, air quality,
and hazardous waste management under RCRA. EPA, in turn, assumed responsibility for
overseeing ANPI’s cleanup of historical contamination at the Site under CERCLA (Superfund).
During the 1990s, investigations were conducted of various areas with soils contamination at the
Site. Initially, three areas of soils contamination were identified and several other areas were
later discovered. In 1999-2000, most areas with soils contamination were cleaned up.
Contaminated soils located in drums or in surface soils were excavated and removed for

8
treatment and disposal. The soils in one area contaminated with TNT were pretreated on site (by
burning) and subsequently shipped off-site for final disposal.
Basis for Taking Action
Hazardous substances and pollutants or contaminants released at the Site by media component
include:
Perched Groundwater: Arsenic, Fluoride, Nitrate and Perchlorate
Shallow Aquifer Groundwater: Nitrate and Perchlorate in Southern Area; Nitrate only in
Northern Area
San Pedro River Surface Water: Nitrate only
Inactive Pond Soils: Antimony, Arsenic, Barium, Beryllium, Chromium, Lead,
Manganese, and Nitrate
White Waste Area: Nitrate and Arsenic
Drum Storage Area: Vanadium Pentoxide, Cooling Tower Ceramic Packing Material
(later determined non-hazardous)
Wash 3 Area (excluding Open Burn Open Dump (OBOD) Area: 2,4-Dinitrotoluene
(DNT), 2,6 DNT, Lead and Paraffins (present as a result of DNT decomposition; later
determined non-hazardous)
Stained Soil Areas: DNT, Paraffins (later determined non-hazardous)
DNT Drums Located Outside of Wash 3 Area: 2,4-DNT, 2,6-DNT
Trinitrotoluene (TNT)-Contaminated Area: TNT, 2,4-DNT, 2,6-DNT, and 1,3,5-
Trinitrobenzene
4.0 Remedial Actions
Media Components The September 1994 Record of Decision (ROD) for the Site originally identified five media
components:
Media Component 1: Perched Groundwater Aquifer
Media Component 2: Shallow Groundwater Aquifer
Media Component 3: Inactive Ponds
Media Component 4: White Waste and Drum Storage Area
Media Component 5: Wash 3 Area (Excluding the Open Burn/Open Detonation Area)
Media Component 6 is not discussed because it does not identify a specific area of concern, but
instead required additional investigative groundwater studies.
Subsequently, the following additional areas of concern were discovered at the Site:
Media Component 7: Other Drums located outside of Wash 3 Area
Removal Action: Tri-nitrotoluene (TNT) Contaminated Area

9
Additionally, as a result of additional investigations, the Media Component 2 (Shallow Aquifer
Groundwater) was further divided into two new categories:
Northern Area Groundwater (Media Component 2A comprised of two sub-components,
the shallow aquifer groundwater within the capture zone of the extraction well, and the
groundwater to the far north beyond the radius of influence of the extraction well).
Southern Area Groundwater (Media Component 2B comprised of three sub-
components, the Perched Zone, the Molinos Creek Sub-Aquifer and the Southern Area
shallow aquifer groundwater near the San Pedro River).
For clarity, the next FYR in 2017 should evaluate the two remaining areas of
groundwater contamination, the Northern Area and the Southern Areas, as distinct areas
rather than referring back to the original 1994 Media Components for groundwater. Over
the intervening years, based on new data and various remedy changes, the terms used to
discuss the groundwater cleanup areas has evolved into these two categories.
This 2012 FYR will evaluate in detail media components 1 and 2A and 2B related to
groundwater contamination, and media component 3 (inactive ponds) because wastes were left in
place and ICs were required for the capped ponds.
Media Components 4, 5, and 7, and the Removal Action were completed and closed out prior to
or at the time of the 2007 FYR Report and documented in the 2007 Final RA Report for Soils.
These media components are not re-evaluated in this 2012 FYR Report. Remedy Decision Documents
The 1994 ROD required implementation of following remedial actions:
Use of a brine concentrator to treat plant process wastewater for total dissolved solids,
including nitrate, fluoride, and arsenic.
Extraction of nitrate contaminated shallow ground water and the construction of a wetlands
system (using biological treatment) to treat the water.
On-site containment (capping) of contaminated soils in the “Inactive Ponds.”
Excavation and off-site treatment and disposal of contaminated soils (arsenic and
dinitrotoluene [DNT]) from the White Waste Material and Drum Storage Area.
Excavation and off-site treatment and disposal of the lead- and DNT- contaminated soils
from the Wash 3 Area.
In 1997, EPA signed Explanation of Significant Difference (ESD) #1 which divided the Site
remedy for the shallow aquifer groundwater contamination into two areas: a Northern Area and
a Southern Area. This ESD allowed treatment of the shallow aquifer in separate areas and
allowed for other design modifications to the wetlands system.

10
In 2000, EPA signed ESD #2 which established cleanup standards for metals that were not
included in the 1994 ROD. This second ESD allowed “No Further Action” for soils media
components where hazardous substances were not detected or where levels of contaminants did
not exceed cleanup standards. ESD #2 also established an additional Media Component #7 -
Other Drums - because of the discovery of additional drums outside of Wash 3.
In 2005, EPA signed a ROD Amendment which changed the remedy for the cleanup of Southern
Area Groundwater from the use of constructed wetlands to monitored natural attenuation
(MNA). The ROD Amendment also established a cleanup standard for perchlorate of 14 ppb.
The Amendment also specified the institutional controls (ICs) needed for the Site to prevent use
of the contaminated shallow aquifer groundwater underneath the ANP facility and clarified that
future use would be non-residential.
The Remedial Action Objectives for the remedy described in the ROD Amendment are as
follows:
Restore the aquifer to drinking water standards for nitrate and EPA’s site-specific cleanup
level for perchlorate within a reasonable time frame;
Minimize future migration of groundwater contamination;
Restrict future use of the Site to non-residential uses;
Reduce or eliminate further contamination of groundwater and surface water to allow the
beneficial reuse of these resources; and
Reduce or eliminate the direct contact threat associated with contaminated soil.
Remedy Implementation
Alternate Water Supply
In 1994, at EPA’s direction, ANPI prepared an Alternate Domestic Water Supply Plan and
replaced eight nitrate-contaminated shallow aquifer drinking water wells in the Northern Area
with deep aquifer wells. The Alternate Water Supply Plan was updated again in 2007, and again
in 2009. In 2007, ANPI provided bottled water to two shallow aquifer well owners who retained
connections to the shallow aquifer wells for agricultural purposes only (the water was not being
used for drinking water purposes). By 2012, only one household with a shallow aquifer well in
the Northern Area is still provided bottled water because of nitrate levels exceeding the drinking
water standard of 10 ppm (10 mg/L). There are no households in the Southern Area that use the
shallow aquifer for drinking water purposes.
Media Component 1: Perched Groundwater Zone (part of Southern Area)
In April 1995, ANPI ceased discharge of process wastewaters to the evaporation ponds. As a
result, the perched zone has dewatered significantly in the intervening years. The ROD required
the perched zone to be treated by the brine concentrator; however, in the intervening year’s EPA
has allowed the perched zone to be actively dewatered by ANPI by pumping and then passive
evaporation in open storage vessels. ANPI periodically disposes of the residual salts from this

11
evaporation process at an EPA-approved landfill. As of 2012, the perched zone is now dry with
the exception of two monitoring piezometers.
Media Component 2: Shallow Aquifer Groundwater - later subdivided into Northern Area (2A) and Southern Area (2B)
In 1997, ANPI constructed the wetlands in the Northern Area and started extracting the shallow
aquifer groundwater to be treated. After the 1998 discovery of perchlorate in the perched zone
and the adjacent MCA in the Southern Area, the ROD was amended in 2005. This amendment
changed the remedy for the cleanup of Southern Area Groundwater (contaminated with nitrate
and perchlorate) from pump and treat with constructed wetlands treatment to monitored natural
attenuation (MNA) and continued use of institutional controls.
Northern Area Shallow Aquifer Remedy (2A)
The shallow extraction well #1 (SEW-1) and wetlands treatment system known as the Northern
Area Remediation System (NARS) was constructed in 1997 to remediate nitrate-contaminated
shallow aquifer groundwater in the Northern Area. The establishment phase was originally
estimated at 2 years. However, due to a number of unforeseen events, the first establishment
phase included the time period from September 1997 through June 2001. There was a limited-
scale start-up from June 2001 to November 2001 that ended when the wetland vegetation (cat
tails) entered winter dormancy. Start-up testing was conducted in phases in which the extraction
well was used to pump contaminated groundwater into the treatment cells of the wetlands to
evaluate the necessary residency time needed to treat the nitrate, prior to full-scale operation.
Additional start-up phases were performed in 2002, 2003, and 2004, with limited operational
phases in the fall of each year.
In May 2005, sufficient data had been compiled indicating that the NARS was reliably treating
nitrate down to the nitrate cleanup standard and full-scale startup and operation began in June
2005. As of 2012, the average effluent discharge has been below 2 ppm nitrate more than 95%
of the time. The discharge limit is 10 ppm nitrate, the state and federal maximum contaminant
limit (MCL) for nitrate. During the five year period there have only been two occasions during
unusually cold weather spells in which the alternate secondary discharge location needed to be
used for short periods (less than one week). As part of the operations and maintenance, if there
is any concern that the wetlands effluent may be above the MCL, ANPI must use the alternate
discharge point located at the wetlands to ensure no contaminated groundwater reaches the
shallow aquifer. Since the last FYR period, the NARS wetlands system has been operating 24/7,
365 days per year, with no shut-down periods, except for the two cold weather incidents
previously discussed.
Southern Area Shallow Aquifer Remedy (2B)
During this Five Year Review period, ANPI has been monitoring the Southern Area
Groundwater to evaluate the effectiveness of monitored natural attenuation (MNA), the selected
remedy as required by the 2005 ROD Amendment. Monitoring is the major implementation

12
activity underway for the MNA remedy in the Molinos Creek Sub-Aquifer (MCA) of the
Southern Area. In 2006 and early 2007, ANPI conducted various field activities to further
characterize the Southern Area, in particular the MCA, to design and locate wells for the MNA
monitoring network. In 2007 , the results indicated that water levels and nitrate and perchlorate
concentrations were continuing to drop in the MCA (although as of 2012, contaminant
concentrations are now increasing while water levels continue to decline); and the lateral
boundaries of the MCA were much smaller than originally thought. These findings confirmed
the hydraulic isolation of the MCA groundwater from the shallow aquifer associated with the
San Pedro River. These findings also indicated that in addition to the perched zone, the MCA
was created “artificially” by the discharge of ANPI’s plant washdown waters to washes and the
unlined evaporation ponds, which ultimately migrated laterally from the perched zone into the
MCA. However, because of these confined and contained (hydraulically stagnant) conditions,
the concentrations of contamination in the MCA are not declining at the rate originally projected,
as discussed in Chapter 6.0 of this Review.
Media Component 3: Inactive Ponds
Media Component 3 included nine unlined ponds at the ANPI Site that were classified as
“inactive” (Ponds 4A, 4B, 5A, 5B, 6A, 7, 8, and the Dynagel Pond). Only the Dynagel Pond and
Pond 7 were originally under EPA oversight. The Formerly Active Ponds 4A, 4B, 5A, 5B, 6A,
and 8, were originally under the State Consent Decree.
During 2007-2008, the final remedial action work on the inactive ponds, including Pond 7 and
the Dynagel Pond, was completed. As required by the 1994 ROD and the subsequent ESD #2,
the ponds were capped with native materials and institutional controls (in the form of a
Declaration of Environmental Use Restriction or DEUR) was put in place in August 2008 by
ANPI to prevent any potential exposure to the buried contamination.
Media Components 4, 5, 7, and TNT-Contaminated Area
The remedies for Media Component 4 – White Waste and Drum Storage Area; Media
Component 5, Media Component 7, and the TNT-Contaminated Area, which involved sampling,
excavation and off-site disposal, were all completed before or within the time period of the first
FYR. No further action or operation and maintenance were required for any of the actions once
completed.
Operation and Maintenance
Alternative Water Supply At the time of the 2005 ROD Amendment, a nearby private property owner raised concerns that
the deep aquifer replacement wells could be causing potential loss of capacity in other deep
aquifer wells under artesian pressure due to poor construction. As a result of this concern, in
2007, EPA directed its contractor, CH2M Hill, to evaluate the construction methodology of all
the replacement wells. The results of this study indicated that all the replacement wells were

13
constructed properly and to an engineering standard of higher quality than that required by the
State agencies. All wells were determined to be of good quality and functioning as designed.
No O&M issues were identified.
Media Component 1: Perched Groundwater Zone The O&M for Media Component 1 consists of maintaining the perched groundwater zone
evaporation treatment system and maintaining the few remaining wells and piezometers with
water in the perched zone for the purposes of groundwater monitoring. The pumps and wells for
both the evaporation extraction system and the perched zone monitoring network require
periodic maintenance. The residual salts from the nitrate and perchlorate-contaminated perched
zone groundwater need to be periodically removed from the bottom of the above-ground storage
tanks and disposed of in an EPA-approved landfill. Costs for monitoring over the FYR time
period are included in the costs in Table 4-2. The maintenance costs for the pump, which is
maintained by ANPI, are minimal. Maintenance on the above-ground storage vessels, in which
the perched water is allowed to passively evaporate, is also minimal.
Media Component 2: Shallow Aquifer Groundwater Northern Area Shallow Aquifer Remedy (2A) The activities required for O&M of full-scale operation of the NARS include:
Inspect components of system, and conduct service and maintenance
Monitor and collect extraction well and treatment cell hydrologic data, including influent
and effluent flow rates and water levels
Assess aquatic vegetation health and density
Add supplemental carbon in the form of molasses (if needed) to the denitrifying cells
Record and report operational data
Discharge water from the last treatment cell (Final Denitrification Area) to the primary
effluent discharge location or secondary location (if necessary due to treatment upset
conditions)
Perform field and laboratory water quality monitoring
Through May of 2012 the total mass of nitrate-N removed from the shallow aquifer since
pumping commenced in 1997 is estimated to be approximately 360,000 pounds. A total of
255,639,230 gallons have been extracted by SEW-1 since pumping commenced in 1997.

14
Operational costs for the NARS over the FYR time period are included in Table 4-1 (ANPI
2012).
Table 4-1 Operations and Maintenance Costs for the NARS
Year Costs (thousands $)
2007 113
2008 100
2009 77
2010 92
2011 89
2012 (estimated thru May 2012) 26
Groundwater sampling of the monitoring wells and private water supply wells, as well as the
surface water of the San Pedro River, is being performed by the ANPI contractor, Hargis and
Associates. O&M costs for monitoring (costs include the costs for monitoring the Southern Area
shallow and perched aquifers and the San Pedro River surface water) are included in Table 4-2
(ANPI, 2012).
Table 4-2 Combined Monitoring Costs for the Northern and Southern Area Groundwater
Year Costs (thousands $)
2007 107
2008 120
2009 143
2010 127
2011 112
2012 (estimated thru May 2012) 72
Southern Area Shallow Aquifer Remedy (2B)
Because the remedy for the Southern Area is MNA, no active treatment requiring O&M of a
treatment system is being conducted. The only O&M conducted by ANPI is groundwater
monitoring for water levels, and sample collection for nitrate and perchlorate concentrations.
Costs for the monitoring over the FYR time period are included in Table 4-2 above (ANPI,
2012).
Media Component 3: Inactive Ponds
The re-grading and capping of the inactive ponds, including Pond 7 and the Dynagel Pond, were
completed in August 2007. O&M of the native soil cap (primarily erosion and vegetation
control) began on an annual basis once construction was completed. ANPI also completed an
annual Pond Cover Inspection Report for the DEUR beginning in January 2009 for year 2008.
Subsequently, annual Pond Cover Inspection Reports have been completed in January of each
year during this five year review period. Costs for monitoring and the operations and

15
maintenance of the pond covers over the FYR period are included in Table 4-3 below (ANPI,
2012).
Table 4-3 Monitoring and O&M Costs for the Pond Covers
Year Costs (thousands $)
2007 30
2008 4
2009 5
2010 6
2011 5
2012 (estimated thru May 2012) 2.5
5.0 Progress Since the Last Review
The protectiveness statement from the second FYR for the Apache Superfund Site stated the
following:
“All immediate threats at the Site have been addressed. The remedy is protective in the
short term for both groundwater and soils because exposure pathways that could result
in unacceptable risks are being controlled. In order for the remedy to remain protective
in the long-term, Institutional Controls (ICs) must be put in place restricting access to the
contaminated shallow aquifer for drinking water purposes and restricting access to pond
soils on-site where residual contamination has been capped.”
Status of Issues and Recommendations from Second (2007) FYR
The following issues were identified in the 2007 FYR.
Long-term ICs have not been implemented yet for the groundwater or soils remedies.
ICs need to be put in place at the Site.
Status: Long-term ICs were implemented at the Site for both the groundwater and the
soils remedies in 2008. On September 2008, ANPI and ADEQ signed a DEUR for these
two media areas.
The groundwater model for the Northern Area needs to be updated with new data.
Status: In the intervening years since the 2007 FYR, the Northern Area groundwater
concentrations for nitrate have been declining as predicted by the earlier groundwater
model, and therefore it was determined that there was no need to update it.
In the Northern Area, additional monitoring of the interface and hydrogeological impact
of the effluent discharge from the wetlands system on the San Pedro River water and

16
shallow water sub-flow is needed to demonstrate that optimum capture not dilution is
occurring.
Status: As previously stated, since the 2007 FYR, the Northern Area groundwater
concentrations for nitrate have been declining as predicted by the earlier groundwater
model and capture analysis. These declines are due to capture of the contaminated
groundwater by SEW-1, not due to dilution. Re-evaluation of the radius of influence of
the prior groundwater model in 2008 indicated that the extraction system is operating at
optimum efficiency for capturing the residual contamination, and not inappropriately
capturing San Pedro sub-flow.
6.0 Five Year Review Process
Administrative Components, Community Notification, Document Review
In April 2012, EPA Region 9 published an announcement in the San Pedro Valley News - Sun
newspaper that the third FYR was underway. The FYR Analysis contains a review of relevant
documents (see Attachment B, List of Documents Reviewed for FYR). Input on the
performance of the remedy was sought through technical survey forms sent to ADEQ, ANP,
ANPI’s Contractor and EPA’s contractor, as well as other personnel familiar with the site.
Discussions were held with the ADEQ project manager, the ANP Environmental Health and
Safety Manager and staff, the ANPI’s consultants, Hargis + Associates, and EPA’s contractor,
Innovative Technical Solutions, Inc. (ITSI). EPA received no comments from the general public
about the FYR. A site inspection also was conducted by ITSI on June 12, 2012. A copy of the
Site Inspection Report is attached to this FYR (see Attachment C). EPA also plans to announce
completion of this third FYR Review in the San Pedro Valley News – Sun after it has been
approved, and distribute a Community Fact Sheet with the findings.
Data Review
Analysis of groundwater and surface water trends was conducted by EPA during the FYR
evaluation and the detailed findings are included in the Groundwater Data Evaluation
(Attachment A). The overall findings are described below.
Northern Area Groundwater
In the Northern Area, the majority of the surface water, monitoring and private wells that have
been sampled show decreasing nitrate concentrations since the last FYR in 2007. The farthest
downgradient wells network consisting of private wells (D(17-20)25bad), (D(17-20)24ccd),
(D(17-20)23acd), and (D(17-20)23ada), located beyond the influence of the extraction well
SEW-1 and covered by the MNA remedy for this far northern area, now all show concentrations

17
below the MCL for nitrate. The remedial groundwater cleanup standards in this far northern area
have been met.
The wells that continue to show high nitrate levels are MW-35 and MW-36, located near the area
along the San Pedro referred to as the “hot spot.” Nitrate concentrations have decreased from
2007 from an average of 200-400 ppm nitrate to 100-200 ppm nitrate in 2012, but these
concentrations are still quite elevated. For a detailed discussion of the Northern Area, see
Attachment A (Groundwater Data Analysis) to this 2012 FYR Report.
Southern Area Groundwater
In the 2007 FYR it was determined that because the Southern Area Groundwater (both the
perched zone and the MCA) is isolated from the San Pedro River and there are no private water
supply wells in the aquifer, there was low potential for exposure to the residual contamination in
this area.
During the current FYR period (2007 to 2012), the groundwater levels in the Southern Area are
decreasing due to the continued dewatering of the perched zone, and the lack of recharge and on-
going drought conditions in Arizona, which are impacting the MCA. However, the nitrate and
perchlorate concentrations in the Southern Area are generally increasing. The contaminant trend
lines are remaining elevated or increasing in the three MCA monitoring wells still relied upon for
monitoring (MW-21, MW-23, MW-39). During this review period, it also has been determined
that MW-24 located at the northern most point of the MCA is hydraulically isolated from the rest
of the MCA. And MW-15 has so little water remaining that it can no longer be sampled.
However, although monitoring data indicate increasing concentration trends, this does not
indicate increasing mass into the hydraulically contained Southern Area. Instead the increasing
trends are attributed to a “concentration stratification” effect with the COCs concentrating at the
bottom of the well screen because clean water was later discharged into the perched zone, which
then migrated into the MCA and is layered on top of the more contaminated water. It is also
noted that while the nitrate concentrations are increasing in the MCA, the perchlorate upward
trend has somewhat stabilized in recent years. Further monitoring will be necessary to evaluate
whether these trends will continue. Further analysis will also be needed to determine whether
other methods may be needed to accelerate the MNA cleanup in the MCA portion of the
Southern Area.
Analysis of the Southern Area data from the remaining wells (located in the MCA) that can be
sampled indicates that the projected cleanup time is now 100 years instead of 30 years for MNA
if no further actions are taken to enhance the remedy (H+A, 2012). ANPI has informed EPA that
it determined that this extended cleanup time frame does not meet their expectations. In August
2012, ANPI presented a preliminary proposal to EPA and ADEQ for an in situ treatability study
for the Southern Area. For a detailed discussion of the Southern Area Groundwater trends, see
Attachment A, Groundwater Data Analysis.

18
Site Inspection
The site visit was performed by EPA’s contractor, Innovative Technical Solutions, Inc. (ITSI) at
the ANPI Site on June 12, 2012. The NARS system, including the wetlands, selected locations
of the Northern Area and Southern Area monitoring network and the capped ponds were visited.
EPA, and its contractor ITSI, participated in the inspection of the ponds. ADEQ participated
with EPA and ITSI in the inspection of the wetlands system. ANPI personnel, and their
contractor, Hargis and Associates, were also present during the site inspection. Details of the site
visit are included in the Site Inspection Report and Site Checklist in Attachment C of this FYR.
One issue from the Site Inspection was that the collection system for the Perched Zone
groundwater could be expanded to optimize the collection of the residual perched zone water.
The current collection system is not adequate for maximizing the extraction and evaporation of
perched groundwater. The system is limited by an insufficient quantity and type of open
containment tanks (shallow pan-type tanks versus larger, deeper tanks). Consideration should be
given to expanding and optimizing the system.
Interviews
EPA sent site technical assessment survey forms to eight parties (State agency, contractors,
consultants, etc.) familiar with the Site cleanup. Generally, the parties are satisfied with the
remedial actions taken to date, although there were some acknowledgements that enhancements
may be needed to accelerate the cleanup time for the Southern Area MNA remedy. The
technical assessment survey forms are included in Attachment D.
7.0 Technical Assessment
Question A: Is the remedy functioning as intended by the decision documents?
The remedy is functioning as intended for the Northern Area groundwater. SEW-1 is extracting
groundwater from the area of high nitrate concentrations in the Northern Area. Since full-scale
operation of the NARS was achieved in June 2005, the wetlands treatment is operating as
intended by treating effluent consistently below the discharge criteria specified in the ROD and
ROD Amendment.
In the Southern Area, stopping discharge of wastewater to the unlined evaporation ponds in
1995, combined with ongoing extraction of groundwater from the perched aquifer, has resulted
in continuing decreased water levels in the perched zone and the adjacent MCA. With continued
dewatering, the perched zone may become dry and contaminants immobile by the time of the
next FYR. The water levels in the adjacent MCA in the Southern Area should also continue to
decrease, unless the current drought conditions should change and there is unexpected recharge
into the MCA and the perched zone.
However, as indicated above, the progress toward achieving the goal of dewatering the MCA is
slow and the projected timeframe for MNA in the Southern Area (MCA) is long. Monitoring

19
data indicate increasing concentration trends; however, this does not indicate increasing mass
into the closed basin. Instead the increasing trends are attributed to a “concentration
stratification” effect with the COCs concentrating at the bottom of the well screen, as previously
discussed. It is also noted that while the nitrate concentrations are increasing, the perchlorate
upward trend has somewhat stabilized in recent years.
The 1994 ROD identified the need for ICs to limit exposure to contaminants and prevent
disturbance of the soil caps on the inactive ponds. The ROD also called for ICs to prohibit the
use of the shallow aquifer groundwater for drinking purposes. A DEUR for both groundwater
and soils was placed on the ANPI property in 2008.
Access to the ANPI facility is restricted by existing high-security perimeter fencing surrounding
the 20-acre operations area of the facility. There is additional perimeter fencing around the
entire 1,100 acre property. There is a guarded entrance gate and sign-in building for any
business or facility visitors who need to access the operations area of the facility. The perimeter
and outlying areas of the facility are patrolled regularly by facility personnel. Bi-lingual signage
is also highly present at the Site for restricted areas, such as the capped ponds and the wetlands
area.
Ongoing education and outreach inform nearby residents and property owners of the extent of
the contaminated shallow aquifer groundwater plume, as required under the Community
Relations Plans required for the ICs. ANPI also submitted an updated Alternate Domestic Water
Supply Plan in 2009. An annual updated Well Inventory is also required as part of the ICs,
which ANPI has been submitting on an annual basis.
Question B: Are the exposure assumptions, toxicity data, cleanup levels and RAOs used at the time of remedy selection still valid?
There have been no changes in the ARARs that should affect the protectiveness of the remedy
and there have been no changes in standards or To Be Considered (TBCs) for the Site. The
ARARs are considered to be health protective and reasonable in evaluating risk for this site.
There have been no changes in the toxicity factors or other contaminant characteristics that could
affect the protectiveness of the remedy.
There has been no change to the standardized risk assessment methodology that could affect the
protectiveness of the remedy; however, the 1992 Baseline Preliminary Health Assessment/
Environmental Assessment (BPHE/EA) was conducted prior to implementation of current
guidance for human health and ecological risk assessments.
Substantial progress has been achieved since implementation of the remedy toward meeting the
Remedial Action Objectives (RAOs) for the Northern Area groundwater, with more limited
progress for the Southern Area groundwater remedy.

20
Question C: Has any other information come to light that could call into question the protectiveness of the remedy?
No information has come to light that could call into question the protectiveness of the remedy.
Technical Assessment Summary According to the data reviewed, the site inspection, and the interviews, the groundwater remedy
is functioning as intended by EPA’s remedy decision documents in the Northern Area, but not as
quickly as expected in the Southern Area. However, because the perched zone and MCA are
hydraulically isolated and there are no drinking water wells within the Southern Area, the
functioning of the Southern Area remedy is not impacting public health, only long-term
monitoring costs. There have been no changes in the ARARs that would affect the
protectiveness of the remedy. The assumptions used in determining exposure pathways are
considered to be health protective and reasonable in evaluating risk for this site. There have been
no changes in the toxicity factors or other contaminant characteristics that could affect the
protectiveness of the remedy and there has been no change to the standardized risk assessment
methodology that could affect the protectiveness of the remedy. There is no other information
that calls into question the protectiveness of the remedy.
8.0 Issues
There are no issues that affect protectiveness at the Apache Powder Superfund Site.
9.0 Recommendations and Follow-Up Actions
Although there are no issues that affect protectiveness, this Review includes additional
suggestions for accelerating site close-out and improving the effectiveness of the Site remedy.
Remedy enhancements, such as in-situ treatment, should be considered for MNA Remedy for
Southern Remedy Molinos Creek Sub-Aquifer (MCA)
The nitrate and perchlorate-contaminated groundwater in the Southern Area that is hydraulically
contained in the MCA has been showing increasing concentrations in some wells, and level or
decreasing concentrations in other wells. These fluctuations have been attributed to a
“concentration stratification” process occurring in specific wells as the overall area has been
dewatering due to active pumping or due to evapo-transpiration and phytoremediation processes.
However, the current selected remedy of MNA may not be able to clean up the Southern Area
and meet cleanup standards as quickly as originally projected. Pilot studies for in-situ
remediation to enhance the MNA remedy have been proposed by ANPI for the MCA, as the
Southern Area continues to be monitored. See Appendix A, Groundwater Data Analysis, for
more details.
21
Expanding the number or modifying the open containment tanks should be considered for
maximizing extraction and evaporation of the Perched Zone Groundwater
The current collection system is not adequate for maximizing the extraction and evaporation of
perched groundwater. The system is limited by an insufficient quantity and type of collection
vessels. Two deep, above-grade, open tanks are currently being used to collect the extracted
perched groundwater, while previously multiple shallow pan-type tanks were used. See Site
Inspection Report (Attachment C) for a picture of the open tanks. The rate of extraction was
reduced in 2010-2011 due to several factors, including the limitations on the tank capacity and
the slow evaporation rate. It appears that greater surface area and shallower containment tanks
could speed up the evaporation rate. Consideration should be given to modifying and expanding
(with a greater number of shallower tanks) the system to further optimize the dewatering process.
10.0 Protectiveness Statement
The remedy at the Apache Powder Superfund Site is protective of human health and the
environment for both groundwater and soils because there is no current exposure. The ICs
restricting access to the contaminated shallow aquifer for drinking water purposes and restricting
access to former pond soils on-site where residual contamination has been capped were put in
place in 2008.
11.0 Next Review The next FYR for the Apache Powder Superfund Site is required by September 2017.
Apache Powder Superfund Site Third Five-Year Report
Figure 1 Map Showing Site Location Site Location

��������������� ����
������������� ����������� ������������������������
���� �����
���������
��
����
�����
���������������
�������
������������
������ ���� !��!��
"��#���
�#��������
������$
#����������������
������"
�����������
�������$
������������ ��
��
���
��
���
�
���
�
������
!�����
���"� �"
���!�����
�����
��#����
����
��
��
�� ��
�
���
��
Apache Powder Superfund Site Third Five-Year Report
Figure 2 Map of Study Area

ES042007001PHX/Apache Powder_Saint David_study area site3.ai (9/07)
FIGURE 2STUDY AREA MAPApache Powder Superfund SiteSaint David, Arizona
Historical Extent ofPerched Aquifer
Approximate Extent of Contamination Nitrate-N and Perchlorate in Shallow Aquifer Groundwater (Nov ‘06)
Laterally Confining Unit
0 2,000
Approx. Scale in Feet

Apache Powder Superfund Site Third Five-Year Report
Figure 3 Conceptualized Hydrogeologic Cross Section Through the
Southern Area

~40 fbls
PZ
MW-21
~400 fbls
~>1000 fbls
P-03
~40 fbls
MW-21
~4000
P-03
fbls
ST. D
AVID
FO
RMAT
ION
CONCEPTUALIZED HYDROGEOLOGIC CROSS-SECTION THROUGH THE SOUTHERN AREA APACHE POWDER SUPERFUND SITE
NOT TO SCALE
EXPLANATIONANPI = Apache Nitrogen Products, Incfbls = feet below land surfaceLCU = Laterally Confining UnitMCA = Molinos Creek Sub-AquiferMW-21 = Monitor Well MW-21P-03 = Piezometer P-03PZ = Perched ZoneSPR = San Pedro River
~ 1 mile
Deep Aquifer
St. David clay
W EANPI property boundary
MCA LCU SPR
Shallow AquiferOverbank Deposits
Recent and Older Alluvial Materials

Apache Powder Superfund Site Third Five-Year Report
Appendix A Groundwater Data Analysis

APPENDIX A
GROUNDWATER DATA ANALYSIS – APACHE POWDER SUPERFUND SITE SITE HISTORY AND BACKGROUND INFORMATION Site Location The Apache Powder Superfund Site is located in Cochise County, Arizona, approximately seven miles southeast of the incorporated town of Benson, Arizona and 2.5 miles southwest of the unincorporated town of St. David (see Figure 1). The Site study area includes approximately nine square miles and includes 1,100 acres of land owned by Apache Nitrogen Products Inc. (ANPI), formerly known as the Apache Powder Company. The San Pedro River National Conservation Area, owned by the Bureau of Land Management, is located approximately two miles south of the site along the San Pedro River. The San Pedro River runs south to north along portions of the eastern boundary of the ANPI property.
Figure 1. Site Location Map (Source: EPA, 2007).
2
ANPI’s Manufacturing Activities
In 1922, ANPI began manufacturing industrial chemicals and explosives, including nitroglycerin, nitric acid, ammonium nitrates, and blasting agents. Presently, ANPI continues to manufacture solid and liquid ammonium nitrate, ammonium nitrate-based fertilizers, nitric acid and aqua ammonia primarily for agricultural and mining customers. Historically, these operations produced both liquid and solid wastes, of which some were disposed of on ANPI property. These past use and disposal practices resulted in contamination of soils on the facility and groundwater contamination in a perched system underneath the plant’s operations area, in the nearby shallow aquifer and the San Pedro River. The groundwater contaminants in the Southern Area of the site are nitrate and perchlorate. The shallow aquifer groundwater is contaminated only with nitrate in the Northern Area of the Site. Regional Geology and Hydrogeology The Site is located in the Upper San Pedro River Basin, which is situated within the Basin and Range physiographic province. The Basin and Range province is typified by broad, gently sloping alluvial basins separated by north-northwest trending crystalline fault block mountains. The basins were created by the subsidence of structural grabens along high-angle normal faults. Sedimentation within the grabens coincided with the gradual subsidence, resulting in a thick sequence of fine- to coarse-grained late Cenozoic terrestrial sediments derived from the igneous, metamorphic, and sedimentary rocks of the surrounding mountain range. Due to the closed drainage environment during subsidence, sediments deposited gradationally, with the coarse-grained sediments near the mountains and fine-grained sediments near the basin centers. The thickness of the alluvial sediments in the Basin (the St. David Formation) is unknown, but is thought to be greater than 1,000 feet near the center of the basin, thinning to a veneer along the mountain fronts. Extensive fine-grained units overlying coarser grained sediments produced confined conditions in the center of several basins. The St. David Formation in the Basin is one such extensive fine-grained unit, producing confined conditions in the center of the Basin surrounding the Site (H+A, 2007a). See Figure 2, Conceptual Hyydrogeologic Cross-Section of the Southern Area. San Pedro River The dominant surface water drainage feature in the Basin is the San Pedro River. Its overall watershed is approximately 2,500 square miles, including 700 square miles in Mexico. The San Pedro River originates near Cananea, Sonora, Mexico, approximately 65 miles south of the Site, and flows north to join the Gila River near Winkelman, Arizona. The ancestral San Pedro River began depositing recent flood-plain sediments throughout a period of aggradation during the last 10,000 years. As the fluvial dynamics of the region changed from an erosional to a depositional environment, the surface water flow patterns were controlled by the paleo-channels. This resulted in the deposition of coarse-grained sediments in the paleochannels and fine-grained sediments between the paleochannels through lateral and vertical accretion (H+A, 2007a).

3
Figure 2, Conceptual Hydrogeologic Cross-Section of the Southern Area
(Source: Hargis + Associates, 2012) ANPI’s Groundwater Usage Throughout its operational history, ANPI has relied on groundwater for industrial, landscape irrigation, and drinking water uses. Industrial use, landscape irrigation, and drinking water supplies are derived exclusively from wells tapping the deep, regional, aquifer located within the St. David Formation, with the exception of process waters that are treated and recycled via the brine concentrator. The brine concentrator was installed in 1995 by ANPI to treat wash-down waters from the on-going manufacturing operations. Shallow aquifer or perched groundwater is not and never has been used by ANPI for any of these purposes (H+A, 2007a), ANPI’s Wastewater Discharge Activities From 1922 until 1971, manufacturing wastewater was routed via ditches to washes that discharged to the San Pedro River (see Figure 3). These dry wash tributaries of the San Pedro River were informally numbered from north to south by EPA as Washes 1 through 6. Most manufacturing wastewater was discharged to Washes 5 and 6, which drain the watersheds in which most of the ANPI operations are situated. Wash 4 also received discharge waste streams from historical operations, but such operations were discontinued by the early 1990's. According to historical accounts, no wastewater is believed to have discharged into Washes 1 and 2, which drain the northernmost areas of the site (see Figure 3). All the washes received natural overland runoff from the site and adjacent parts of their watersheds. Industrial waste streams from historical ANPI
4
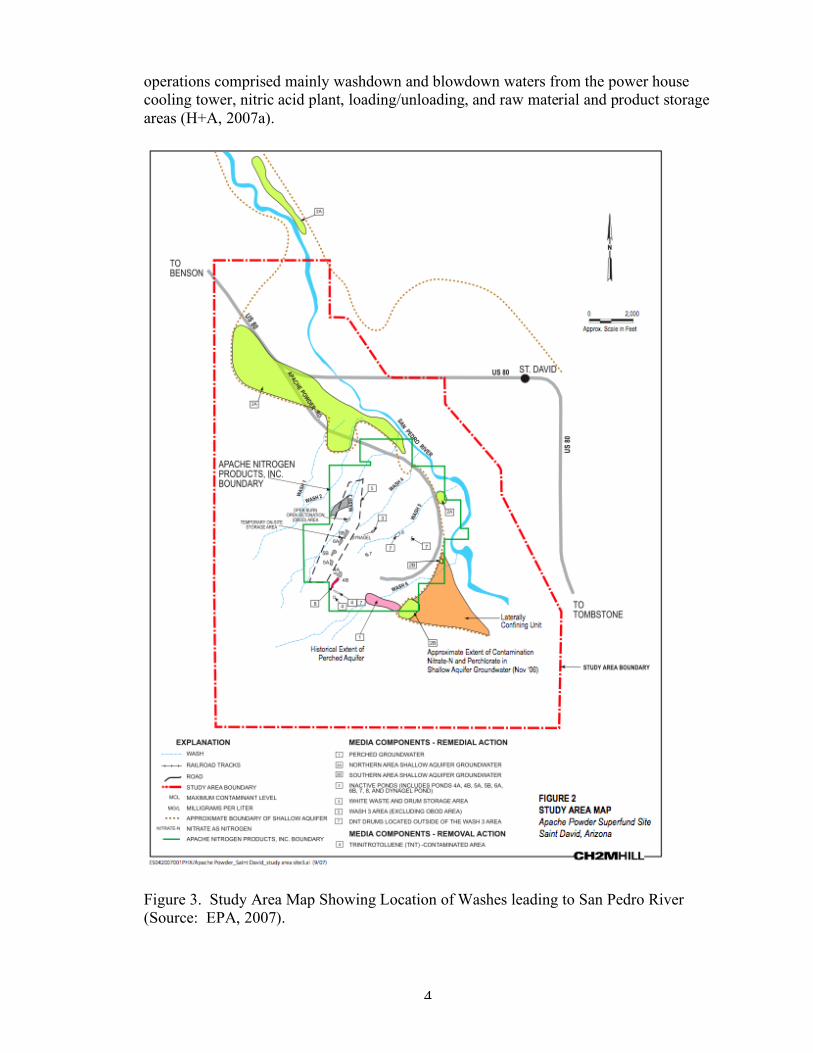
operations comprised mainly washdown and blowdown waters from the power house cooling tower, nitric acid plant, loading/unloading, and raw material and product storage areas (H+A, 2007a).
Figure 3. Study Area Map Showing Location of Washes leading to San Pedro River (Source: EPA, 2007).

5
From 1971 to 1995, ANPI used unlined evaporation ponds throughout the site and wastewater was routed via unlined channels to several of these ponds). Ponds 1A, 1B, 2A, 2B, 3A, and 3B received the bulk of the wastewaters. These ponds are located south of the Site Operations Area within the Wash 6 watershed (H+A, 1991, 2000a). Additionally, Ponds 9, 9A, and 9B received wastewater from the Cord Plant until it was closed in the early 1990's. Wastewater from the Prill Plant was routed to Pond 7, and wastewater from the Dynagel Plant was routed to the Dynagel Pond for a time. Both the Prill and Dynagel operations were located in the Wash 5 watershed (H+A, 2007a).
Figure 4. Location of Evaporation Ponds (Source: H+A, 2008a) During their active use, impounded wastewater and wastewater flowing in the unlined channels infiltrated into the underlying coarse terrace deposits. Downward percolation of the wastewater was eventually impeded upon encountering the St. David clay, the uppermost fine-grained stratum of the St. David Formation, forming a dense, aquitard. As the volume of water infiltrating increased, a "mound' of water formed and began to spread laterally, creating what is now known as the perched groundwater zone. This effect was particularly prominent in the vicinity of Ponds IA, IB, 2A, 2B, 3A, and 3B, which received the bulk of the wastewater discharge. Perched groundwater most likely also developed beneath Ponds 7, 9, 9A, 9B, and Dynagel, but to a much lesser extent (see Figure 4). The accreting mound of perched groundwater underlying the former group of ponds is known to have migrated laterally eventually discharging into the Molinos Creek Sub-Aquifer (MCA), a hydraulically isolated paleo-channel identified during investigations conducted in the early 2000s, located adjacent to the shallow

6
aquifer. It is unlikely that perched groundwater underlying the other ponds shared the same fate owing to both its lesser volume and greater distance from the MCA (H+A, 2007a). By the early 1990's ANPI discontinued its operations involving discharges to Ponds 7, 9, 9A, 9B, and Dynagel. In April 1995 it became possible to discontinue discharge of wastewaters to Ponds 1A, 1B, 2A, 2B, 3A, and 3B due to the construction of the Brine Concentrator facility to which the wastewater stream was rerouted and which continues to receive and treat process wastewaters through the present day. The overall effect of these water management and source control operations has had the effect of allowing the previously established mound of perched groundwater in the Southern Area to recede both in saturated thickness and areal extent. In turn, the seepage of the contaminated perched groundwater into the MCA terminated (H+A, 2007a) Impact of Waste Discharge Practices on Shallow Aquifer Site discharges and runoff from all these operations resulted in the Southern Area perched groundwater and the adjacent Molinos Creek Sub-aquifer becoming contaminated with both nitrate and perchlorate. In the Northern Area, the shallow aquifer and the San Pedro River were contaminated with nitrate only. In the early 1990s, ANPI undertook a program in the Northern Area to replace eight privately-owned domestic supply wells by constructing new wells tapping the uncontaminated deeper aquifer after these households were provided bottled water in 1989. An Alternate Domestic Water Supply Plan has been in place since the early 1990s and has been updated during the intervening years to ensure that no households within the vicinity of the contaminated shallow aquifer consume contaminated water. As of 2012, only one household remains on bottled water in the Northern Area due to nitrate concentrations above the drinking water standard of 10 mg/L in that domestic supply well. Site Contaminants The waste streams containing varying concentrations of nitrate are believed to be the primary source of nitrate that is now present in Northern and Southern Area shallow aquifer groundwater. In addition to nitrate in groundwater, in 1998 perchlorate was discovered in the Southern Area groundwater both within the perched zone groundwater and the adjacent Molinos Creek Sub-Aquifer (MCA) in the Southern Area. The perchlorate-contamination resulted from the former use of saltpeter (sodium nitrate) imported from Chile by ANPI as a process feedstock. The Chilean saltpeter contained natural impurities of perchlorate. The Chilean saltpeter was used extensively by ANPI from 1922 until 1948 to manufacture nitric acid. In 1948, ANPI converted to an ammonia oxidation process to produce nitric acid. After 1948, onsite use and storage of Chilean saltpeter continued in the manufacture of dynamite until 1983 and for the manufacture of Carbagel and Dynagel products until 1987. While perchlorate was not manufactured or used intentionally at the Site, it was identified as a contaminant in the imported saltpeter.

7
CONCEPTUAL SITE MODEL FOR GROUNDWATER A Conceptual Site Model (CSM) is a method used to summarize and integrate all relevant technical information about the Site to explain why the Site’s conditions have led to the selection of a specific remedy for a Site. The CSM takes into consideration the Regional and Site’s hydrogeology, the types of contamination present, the environmental media (soils, water, air) affected, and the remedial actions taken to date. A conceptual model for a groundwater flow and hydrologic system is an interpretation or working description of the characteristics and dynamics of the physical hydrologic system. The groundwater CSM for the Apache Powder Superfund site has been revised several times over the years as new information has become available. 1994 Original Conceptual Site Model The original CSM, upon which the 1994 Record of Decision (ROD) was based, considered the contaminant history and the waste disposal activities which occurred at the Site. At the time, the overall premise of the CSM was that the discharge of nitrate in wash-down waters into the various washes resulted in contamination in the Southern Area, which in turn migrated northward in the San Pedro River and the nearby shallow aquifer to the Northern Area of the Site. In 1994, only nitrate was considered a COC. Perchlorate was not identified at the Site in the Southern Area until 1998. In 1994, the CSM was comprised of the following elements:
• Historical operation of the ammonium nitrate manufacturing began in 1922. - Wastewater discharges from plant originally routed to unlined ditches, which
led to ephemeral washes. - Washes were tributaries to the San Pedro River and entered into the San Pedro
River alluvial floodplain. Therefore contaminants probably both infiltrated into SPR alluvium & aquifer and were transported downstream via surface water flow.
- This created a long plume that extended both in the Southern & Northern Areas.
- Plume moved rapidly within the alluvial system, but stagnated somewhat along the aquifer boundary. Note that the alluvium is asymmetrical, such that the San Pedro River is closer to the boundary on the Apache (west) side than on the St. David side. In all probability, the contamination “hugged” the boundary or was dispersed as it flowed in the more active part of the alluvium. (Hargis, 2012)
1998 Perchlorate Discovery Led to New Investigations However, in 1998 when perchlorate was discovered in the perched groundwater system in the Southern Area, another round of characterization and investigation activities was conducted by ANPI to identify the extent of perchlorate contamination. Multiple studies were conducted to determine if perchlorate was present in the Northern Area or the San Pedro River, or just in the Southern Area of the Site. Other field studies were done to more fully define the extent of the Southern Area contamination. In 2003, a Southern Area Characterization Report was completed by ANPI. The Report concluded that the

8
Southern Area, as defined as the perched zone and the adjacent Molinos Creek Sub-Aquifer (MCA), was not hydraulically connected to the Northern Area. Perchlorate was never detected outside of the Southern Area. Consequently, the Site and the corresponding CSM evolved into a Southern Area CSM and a Northern Area CSM, with separate remedy decision documents, including separate Interim Remedial Action Groundwater Reports, being developed for each area (see Figure 6). In 2006, additional field work resulted in further refinement of the 2003 conceptual model for the Southern Area. In general, the conceptual model for the Southern Area comprises an alluvial system that is hydraulically isolated from the alluvial aquifer in the San Pedro River. Groundwater-bearing alluvium is referred to as the MCA (Molinos Creek Sub-aquifer) as differentiated from the SPA (San Pedro Aquifer) to the east along the San Pedro River. The westward boundary of the MCA is formed at the limit of “younger” alluvial materials associated with the San Pedro River. This younger alluvium forms a contrast with older terrace deposits known informally as “granite wash” and the underlying upper St. David Formation.
Figure 5. Molinos Creek Sub-Aquifer (MCA), Including Monitoring Well Network and Exploratory Boreholes to Define Extent of MCA (Source: H+A, June 2012). To the east, the MCA is bounded by a fine-grained unit known as the Lateral Confining Unit (LCU), which is believed to be formed by overbank silty and clayey materials of the ancestral San Pedro River. Coarser alluvial materials in the MCA occur in distinct areas that in turn support hydraulically distinct bodies of groundwater. These areas historically are believed to have received artificial recharge in the form of runoff and wastewater discharges from the plant via surface washes and/or underground seepage

9
from former unlined evaporation ponds. Presently, hydrographic data indicate that groundwater in the perched zone and MCA is receding, receiving little to no recharge. Moreover, based on the flatness of the hydraulic gradients, there appears to be little if any, groundwater movement within these hydraulically isolated zones. (H+A, 2007a) Results from the 2006 exploratory borings indicated that the LCU is more extensive than previous mappings. The exploratory borings also indicated that the MCA was not a continuous feature, but rather was separated into two hydraulically discrete areas, termed the northern and southern lobes. The investigations further defined the limited areal extent of these two lobes. The areal extent of the northern lobe is limited to a small area in the immediate vicinity of monitor well MW-24. The areal extent of the southern lobe is also smaller than previously delineated (see Figure 5). (H+A, 2007a) The Southern Area Conceptual Site Model As of 2012, the Southern Area CSM is composed of the following elements, building on the overall initial CSM from 1994, and subsequent studies in the 2000s, previously described:
• Around the early 1970’s, wastewater discharges were rerouted to unlined ponds
(mostly in the south in Wash 6 watershed). Pond 7 & Dynagel are in Wash 5 watershed (as well as most of the Powder Line). - ANPI still used unlined ditches to convey water to unlined ponds. - Ponds evaporated some water, causing concentration of chemicals. - Water also infiltrated creating a perched zone, which probably already was there
because of infiltration through unlined ditches. - As perched zone mounding increased, flow began over the (buried) St. David
clay surface and into the adjacent alluvium forming the MCA. - Water levels in the MCA increased (MW-15, MW-21, and MW-23).
• Discharge to unlined ponds was discontinued in 1995 when the brine concentrator was constructed and came on line. - Perched zone began to recede as a result of flow into the MCA, as well as
dewatering activities (pumping of perched water into evaporation tanks) and overall regional drought conditions (lack of recharge).
- In 1995, the last large influx of fresh water to the evaporation ponds, perched zone and MCA occurred from the pressure testing of the 1.2 million gallon brine concentrator surge tank.
- This water went into the unlined ponds, then into the perched zone, and then flowed to the MCA.
- During the 2000s until the present (2012), the perched zone water level elevations have continued to drop as dewatering of the perched zone continues, resulting in the discharge to adjacent MCA ceasing in about 2003.
• Presently, limited residual water in the perched zone in a few low places. - Water levels have been dropped as a result of (1) no source of recharge since the
evaporation ponds were taken out of use in 1996, (2) active dewatering of the perched zone with low-flow extraction wells, and (3) evapo-transpiration (ET).
- Stratification of contaminant concentrations as dewatered over time. - MCA is of limited areal extent and hydraulically isolated as a result of the LCU.

10
• MCA water levels have also receded over time. - Result of (1) no recharge from the perched zone once those water levels dropped,
(2) ET losses, and (3) infiltration into underlying and adjacent low permeability units.
- Stratification of contaminant concentrations in MCA due to the sequence of influent water quality. Older discharges from perched zone were more concentrated with site contaminants, and newer discharges (such as the freshwater from brine concentrator) were less so. This same phenomenon is observed in the perched zone.
- As of 2012, estimated quantity of water in MCA is about 100 acre feet. • Perchlorate is limited to Southern area as a result of its geographic usage on the
plant as well as its use timeframe in plant production history. - In 1998, perchlorate was discovered in perched zone, and later in MCA. - Limited areal extent of perchlorate may be a further indication of the isolation of
the MCA, or the effect of the aquifer’s dispersive mechanisms acting on the comparatively lower concentrations of perchlorate in the wastewaters.
- Note: perchlorate is about 3 orders of magnitude lower in concentration than nitrate. (Hargis, 2012)
The Northern Area Conceptual Site Model As of 2012, the Northern Area CSM builds on the historical development of the plume and the CSM from 1994 previously described, with some additional elements based on field studies and monitoring activities conducted during the intervening years, as outlined below: • Historically, as previously described, ANPI released wastewater via ditches to
several washes that discharged to shallow aquifer alluvium and the San Pedro River.
• Pond 7 and the Dynagel pond are in the Wash 5 watershed (as well as most of the Powder Line). Wash 5 is located to the north much closer to the Northern Area than the other washes.
• In the early 1970s, wastewater discharges were rerouted to unlined evaporation ponds, and the earlier practice of discharges to washes ceased.
• A residual “hot-spot” at the base of Wash 3 (downgradient from Wash 5) appears to have captured nitrate from wash-down waters historically released down Wash 5 in subsurface soils and sediments. Known area of plume discharge along SW-3/4 reach.
• No perchlorate has been detected in the Northern Area. • Alternating reaches of recharge and discharge exist along the San Pedro River
(intermittent stream). • Stagnant areas along aquifer boundary (in the keyhole area west of extraction well
SEW-1, known as the Carnes area) where contaminants persist. • Variable heterogeneities also contribute to irregular distribution of contamination. • Some irrigation pumping during dry periods contributed to further spreading to the
north prior to establishing hydraulic control by the Northern Area Remediation System (NARS). (Hargis, 2012)

11
AREAS OF GROUNDWATER CLEANUP There are two major areas of groundwater cleanup underway at the Apache Powder Superfund Site: the Northern Area and the Southern Area (see Figure 6). Analyses of groundwater and surface water trends were conducted by the U.S. Environmental Protection Agency (EPA) during the five-year Review (FYR) evaluation process for 2007 through 2012. The overall findings are described below.
Figure 6. Map Showing Northern and Southern Groundwater Areas (Source: H+A, 2009)

12
NORTHERN AREA GROUNDWATER The Northern Area remedy comprises two hydraulically connected geographic areas with different remedies for cleaning up the nitrate-contaminated groundwater:
• The NARS (Northern Area Remediation System) area within the capture zone of extraction well SEW-1. The remedy for this area is pumping the contaminated shallow aquifer and treating it in a constructed wetlands.
• The MNA area downgradient beyond the influence of the capture zone. The remedy for this area is monitored natural attenuation (MNA).
There is a third geographic area within the Northern Area upgradient of the NARS area along the San Pedro River near Wash 3 in the vicinity of MW-36 (commonly referred to as the nitrate “hot-spot”). The conceptual site model (CSM) for this area indicates that the nitrate is slowly moving downgradient (northward) within the shallow aquifer sub-flow along the western boundary of the San Pedro River, where it is then captured by SEW-1. Northern Area Groundwater Status During 2007 FYR At the time of the 2007 FYR, the majority of the surface water, monitoring wells, and private wells that were sampled in the Northern Area showed decreasing nitrate concentrations. In 2007, the farthest downgradient wells in the Northern Area consisted of private wells D(17-20)25bad, D(17-20)24ccd, D(17-20)23acd, and D(17-20)23ada with nitrate concentrations below the maximum contaminant level (MCL) of 10 milligrams per liter (mg/L). To evaluate the efficacy of the NARS, more monitoring was recommended to see if long-term decreasing trends were achieved. The 2007 FYR noted that a portion of the nitrate plume was beyond the capture zone of extraction well SEW-1. The 2007 review also noted those areas did not have shallow drinking water wells, and that the concentration levels were generally less than 30 mg/L at the time. The following year, in 2008, EPA signed Explanation of Significant Differences (ESD) #3, modifying the Northern Area remedy to allow MNA for the groundwater at the leading edge of the plume beyond the influence of extraction well SEW-1. The 2007 FYR did not specifically discuss the MW-36 “hot-spot” area, although MW-36 had nitrate concentrations ranging from an estimated high of 600 mg/L in 2005 to an estimated low of 300 mg/L in 2007. Northern Area Groundwater Status During 2012 FYR
NARS Capture Area As of late 2011, water quality trends for nitrate continued to decline during the five year period for all monitor wells within the capture zone of extraction well SEW-1, with the exception of monitor wells MW-08, MW-34, MW-35, and MW-36. The latter 3 wells are located upgradient of the Site along the San Pedro River in an area referred to as the nitrate “hot-spot.” Increases in shallow aquifer well MW-08 appear to be due to its

13
proximity to extraction well SEW-1 and the circulation pattern caused by its cone of depression in proximity to the shallow aquifer boundary (see Figure 7).
Figure 7. Northern Area Groundwater – Performance Monitoring Well Locations (Source: H+A, 2012b)

14
Nitrate concentrations in the “hot-spot” located quite a distance upgradient from the extraction well, SEW-1, show an inconsistent trend line. Nitrate concentrations at shallow aquifer monitoring well, MW-36, located at the “hot spot,” were on a relatively steady decline between 2005 and November 2007, but then suddenly started to increase through August 2008 to 320 mg/L. During 2011 through early 2012, nitrate returned to a decreasing trend (towards the 200 mg/L range). The sudden increase in 2008 was interpreted as: (1) an indication of SEW-1 affecting gradients and concentrations at the MW-36 location as well as in areas upgradient, and (2) high concentrations lingering in some areas upgradient from MW-36, probably along the aquifer boundary, due to poor circulation and aquifer heterogeneities. A similar sharp increase also occurred at MW-34 (located upgradient of the “hot spot”) between February 2009 and May 2010, with nitrate increasing from 0.67 mg/L to a high of 120 mg/L. The nitrate concentrations in MW-34 dropped back down to its original trend line in August 2010, and have remained there through February 2012. This unexpected increase in MW-34 appears to be due to the same factors as those contributing to the MW-36 increase. Seasonal pumping and recharge factors also may have contributed to these periodic increases. In 2011 and again in 2012, EPA recommended that an additional monitoring well be installed on the west side of the San Pedro River northwest of MW-35 and west of SW-03 to better track residual nitrate contamination moving downgradient from the MW-36 area towards extraction well SEW-1. During the June 2012 technical meeting, EPA mentioned that EPA’s comments had included this recommendation. ANPI and EPA agreed that this recommendation may be considered again in a few years depending on the nitrate trends in this area.
Northern MNA Area In this Northern Area beyond the influence of extraction well SEW-1, the nitrate has continued its downward trend in all wells during the review period, with the exception of one shallow aquifer private well, D(18-21)06bc, which still has nitrate levels above the MCL as of November 2011. The monitoring wells in this northern area are a mixture of site monitoring wells and private shallow aquifer agricultural wells. During the period of 2006-2008, the following monitoring wells installed by ANPI dropped and stayed below the MCL for nitrate: MW-20, MW-38, MW-40 (with the exception of one exceedance in 2010), MW-41A, MW-41B, and MW-42. ANPI’s 2011 Annual Report noted that typically a 3-5 year verification monitoring period is required to verify attainment of cleanup. Many of these shallow aquifer wells in the MNA management zone achieved this remediation goal by 2008.
SOUTHERN AREA GROUNDWATER The Southern Area Groundwater remedy comprises three separate, but related, geographic areas now monitored by a limited number of wells because many wells in the original groundwater monitoring network for the Southern Area are now dry. The selected remedy for the Southern Area is MNA. The three areas and the monitoring wells still able to be monitored for water quality are:
• Perched Zone: P-01 and P-03; P-10 and MW-29 (these last two wells were checked to confirm they were dry).

15
• Molinos Creek Sub-Aquifer (MCA): MW-21, MW-23, MW-24, MW-39. • Shallow Aquifer near San Pedro River: MW-14, MW-22, MW-25, MW-33.
The perched zone groundwater underlies the formerly active evaporation ponds located in the southern portion of ANP’s primary operations area. These ponds historically received process wastewater or washdown waters containing nitrate and perchlorate from plant operations, resulting in contamination of the shallow aquifer groundwater in the Southern Area and the nearby MCA. Until the perched zone became significantly dewatered in recent years, the contaminated perched groundwater spilled over into the MCA. The shallow aquifer near the San Pedro River north of the perched zone and MCA continues to be monitored as a sentinel point and buffer zone. Southern Area Groundwater Status During 2007 FYR The data review section 6.2 of the 2007 FYR stated that “wells in the Southern Area predominantly display a decreasing trend in nitrate and perchlorate concentrations over the time of this five-year review …” However, this statement does not appear quite accurate. At the time of the 2007 FYR the wells that could be sampled in the perched zone and in the adjacent MCA showed stable or increasing water quality trends, as the water levels were dropping in these wells. See attached hydrographs for both the perched zone and MCA monitoring wells (Figures 9, 10, 12, 13 and 14). The perched zone was continuing to be dewatered by active extraction and evaporation and this dewatering also continued to lower the water levels in the MCA. The 2007 FYR selects one well, MW-21 in the MCA, as an example of a well that showed increases of nitrate and perchlorate, attributed to the lowered water levels in the MCA and the apparent “concentrating” effect on the well. The 2007 FYR states that the increasing trend in MW-21 had occurred in a relatively short time period making it difficult to establish the accuracy of the trend or the cause for the concentration increases. The 2007 FYR Report concludes that because the Southern Area groundwater is isolated from the San Pedro River and there are no private water supply wells in the aquifer, there is low potential for exposure to the contamination. However, continued monitoring of the nitrate and perchlorate concentrations was recommended, along with water levels, to possibly establish trends. Southern Area Groundwater Status During 2012 FYR During the data analysis of the perched zone and MCA monitoring wells for the 2012 FYR, the continuing downward decline of water levels in the remaining monitoring wells, combined with either generally stable or increasing groundwater quality trends for both nitrate and perchlorate is much clearer, with five additional years of data collection. The data indicate that the groundwater contaminants are increasing in concentration to a greater extent than observed in 2007 as the water levels continue to decline. The increasing trends are attributed to a “concentration stratification” effect with the contaminants of concern (COCs) concentrating at the bottom of the well screen because clean water was later discharged from the perched zone, which then migrated into the MCA and is layered on top of the more contaminated water. It is also noted that while the nitrate concentrations are increasing in the MCA, the perchlorate upward trend has

16
somewhat stabilized in recent years. Further monitoring will be needed to determine whether these trends will continue.
Perched Zone Because the perched zone is a potential source of contaminated discharge into the MCA, there has been continued dewatering of this area through active pumping and continued monitoring of this area to ensure that this area is not recharged. The following perched zone monitoring wells have gone dry during the review period (2007-2012) and no longer can be sampled: P-10, MW-04, MW-29, MW-30, MW-31, and MW-32. Overall, since 1996 when the discharge of washdown waters into the evaporation ponds was ceased, the following other perched zone monitoring wells and piezometers have gone dry: P-02, P-04, P-05, P-06, P-07, P-08, P-09, P-11, and monitor wells MW-02 and MW-07. (See Figure 8)
Figure 8. Location of Monitoring Wells in Perched Zone and Change in Areal Extent of Perched Zone (Source: H+A, 2012a)

17
The only two perched zone wells with sufficient water to be sampled for nitrate or perchlorate are P-01 and P-03. Two other monitoring points, MW-29 and P-10, are still monitored quarterly to confirm that they are dry and that there is no hydraulic connection between the perched zone and the MCA. The monitoring points are located in the subsurface drainage channel between the perched zone and the MCA (see Figure 11). The concentrations of nitrate and perchlorate remaining in the perched zone are represented on the hydrographs for P-01 and P-03 (see Figures 9 and 10). The nitrate and perchlorate concentrations in P-01 generally declined to levels below the cleanup standards of 10 mg/l for nitrate and 14 ug/l for perchlorate by 2004, when water quality sampling ceased. However, in November 2011 and January 2012, when P-01 was resampled after 8 years, the nitrate concentrations were in the 150-180 mg/L range, and the perchlorate concentrations were in the 13-14 micrograms per liter (ug/L) range. In contrast, the perchlorate concentrations in P-03 during the same 12-year period ranged from 400 to 700 ug/L, and the nitrate concentrations have steadily increased during the same 12 years, from 2,000 mg/L to a high of almost 10,000 mg/L in January 2012. As previously discussed, the explanation for these increasing concentrations observed in the two remaining perched zone wells with minimal water remaining for sample collection has been identified as a form of “concentration stratification.” This is defined as the process of high concentrations of nitrate and perchlorate concentrating at the bottom of the perched zone, as the quantity of water is reduced in the well while “clean” recharge water is layering on top. Therefore, as the water level declines, samples collected from increasing depths in the aquifer are more “concentrated.”
Molinos Creek Sub-Aquifer (MCA) The MCA is groundwater-bearing alluvium located in a hydraulically isolated paleochannel to the east and northeast of the perched zone and west of the San Pedro River shallow aquifer (see Figure 5). The MCA is believed to exist only as a result of historic discharges from the site. It was artificially created as a result of subsurface discharges into the MCA from the perched zone. Current water level data indicate that the water levels are declining in the MCA owing to a lack of artificial or natural recharge, as well as perhaps to current drought conditions in Arizona and evapo-transpiration loss. There is a flat hydraulic gradient across the MCA and there appears to be little, if any, lateral groundwater movement. This not only further indicates the hydraulic isolation of the MCA from the San Pedro River shallow aquifer, but also explains some of the water quality observations for the nitrate and perchlorate trends in this area. In the current five year review period (2007 to 2012), there have been stable or upward trends in water quality concentrations for nitrate and perchlorate similar to those observed when the perched zone wells have gone dry. Only three of the five original monitoring wells are being used for monitoring the MCA as of June 2012. These wells are: MW-21, MW-23, and MW-39. In the intervening years, it has been determined that MW-24 (located at the northernmost point of the MCA) is hydraulically isolated

18
from the rest of the MCA (although MW-24 is still being monitored), and MW-15 has so little water remaining, due to declining water levels in the MCA, that it no longer can be sampled. (See Figure 11)
Figure 9. Water Level and Water Quality Hydrographs for Perched Zone Piezometer P-01 (Source: H+A, 2012b).

19
Figure 10. Source: Hargis + Associates. Water Level and Water Quality Hydrographs for Perched Zone Piezometer P-03. (Source: H+A, 2012b).

20
The concentrations of nitrate and perchlorate in these MCA monitoring wells have either remained stable or increased over the last five years. In MW-21, nitrate concentrations have increased from an estimated 500 mg/L in 2007 to a high of 3,700 mg/L in 2012, and perchlorate has increased from an estimated 100 ug/L in 2007 to a high of 300 ug/L in 2012 (see Figure 12). In MW-23, nitrate and perchlorate have stayed stable or decreased slightly. Nitrate in MW-23 has ranged from below the MCL until 2006 to a high of 20 mg/L in 2007, and most recently nitrate has hovered above and below the MCL, while perchlorate has ranged from a recent high of 60 ug/L in 2008 to more recent concentrations in the 20 ug/L range as of 2010-2012 (see Figure 13). MW-39 is similar to MW-23, with the nitrate and perchlorate concentrations remaining relatively stable but elevated. During the period of 2008-2012, the nitrate concentrations in MW-39 ranged from 75 to 150 mg/L, with the exception of 290 mg/L detected in 2008; and perchlorate remained relatively stable in the 100 ug/L range, with the exception of approximately 250 ug/L detected in 2008 (see Figure 14). During the June 2012 annual technical meeting with ANPI, EPA continued ongoing discussions with ANPI regarding the fact that there appear to be no reliable downward trends occurring in the MCA. Instead, the three remaining MCA monitoring wells are behaving similarly to the perched zone wells (i.e., they are exhibiting the same “stratification” characteristics in which the concentrations are rising to levels significantly above the cleanup levels, as the water levels are declining in the MCA). Most likely due to the stagnant conditions of the MCA, the concentrations in some wells are staying stable but elevated at levels above the cleanup standards. The current MCA trends are not exhibiting the characteristics expected from an MNA remedy. ANPI has recognized this issue and is now proceeding to develop a proposal for an in situ pilot study in the MCA to determine if in situ bioremediation could be effective in the MCA or perched zone in meeting the cleanup standards for the Southern Area.
Shallow Aquifer Near San Pedro River The Southern Area Monitored Natural Attenuation (MNA) performance monitoring network also includes the following six monitoring wells: MW-01, MW-06, MW-14, MW-22, MW-25, and MW-33 (see Figure 11). The purpose of these wells is to complete the MNA management zone monitoring network. Of these six wells, two (MW-01 and MW-06) are upgradient monitor wells located south of the site for establishing background conditions. MW-14 and MW-22 are classified as sentinel wells to monitor whether the plume boundary in the MCA has advanced. The remaining wells (MW-25, MW-33) are classified as buffer zone wells to estimate the anticipated maximum distance the contamination could migrate if not detected by the sentinel wells (See Figure 11). The water in all these wells has been non-detect for perchlorate since monitoring of the Site was initiated. Perchlorate has been detected only in the perched zone and MCA. Regarding nitrate, during the current FYR period, these shallow aquifer monitoring wells located along the San Pedro River quite a distant downgradient from the MCA and the perched zone have not been observed to have nitrate concentrations of any significance. The nitrate concentrations have been either at levels below the detection limit of 1 mg/L or at very low levels (2-4 mg/L), well below the MCL of 10 mg/L.

21
Figure 11. Map of Southern Area Groundwater Performance Monitoring Network. (Source: H+A, 2007b).

22
Figure 12 Water Level and Water Quality Hydrographs for Molinos Creek MNA Management Zone Monitor Well MW-21. (Source: H+A, 2012b)

23
Figure 13. Water Level and Water Quality Hydrographs for Molinos Creek MNA Management Zone Monitor Well MW-23. (Source: H+A, 2012b)

24
Figure 14. Water Level and Water Quality Hydrographs for Molinos Creek MNA Management Zone Monitor Well MW-39. (Source: H+A, 2012b)

25
CONCLUSIONS AND RECOMMENDATIONS NORTHERN AREA GROUNDWATER The groundwater remedy in the Northern Area has been performing as predicted, if not better than predicted, during the 2007-2012 FYR period. The Northern Area Remediation System (NARS) has been extremely effective in removing the nitrate 24/7, 365 days a year, with the exception of two short intervals during 2010 and 2011, when unexpected cold spells dropped the water temperature and the alternate discharge point needed to be used for short periods of time. The alternative discharge point was established in 1997 when the NARS was designed to provide a point for temporarily discharging effluent that did not meet the discharge treatment standards until EPA-approved modifications could be made to the wetlands treatment system operations. Examples of these modifications may include increased dosage of molasses, reduced pumping rates of the extraction well or increased residency time in the treatment ponds. Action is now being taken by ANPI to include in the O&M Manual a protocol for more carefully tracking temperature changes during the winter months, so that interventions such as slowing down the pumping rate or adding molasses (actions taken during these two events) can be taken in advance rather than after the effluent discharge concentrations are observed to be rising above the MCL. Performance Criteria The 1994 ROD established groundwater cleanup standard for nitrate, and the 2005 ROD Amendment established a groundwater cleanup standard for perchlorate. The primary performance criteria for the Northern Area Groundwater are the cleanup standards. In addition, the 2008 Northern Area Performance Monitoring Plan established performance standards for the Monitored Natural Attenuation (MNA) remedy selected for the leading (distal) edge of the plume in the Northern Area where nitrate contamination migrated beyond the influence of the extraction well SEW-1 and the capture zone for the NARS. The MNA remedy for the Northern Area groundwater at the Site requires performance monitoring and evaluation to assure that the remedy is progressing toward cleanup standards at an acceptable rate. A program for the evaluation of remedy performance has been outlined within this document. The key elements of the performance monitoring and evaluation include:
• Evaluation of groundwater nitrate-N reduction in the Northern Area shallow aquifer MNA management zone on an annual basis according to method outlined.
• Verification of containment of the nitrate-N concentrations within their presently known extent of SEW-1 capture area. This includes maintaining continued performance of the NARS.
• Evaluation if the Site data trends fit the conceptual model. • Overall evaluation of performance based on a moving five-year trend. This is
directed at projecting the ultimate timeframe for cleanup. • Monitoring water levels and water quality as outlined.

26
• Evaluation of institutional controls. • Annual reporting of performance to EPA and other agencies.
2012 Northern Area Groundwater Findings
Extraction well SEW-1 and the extraction system are functioning as designed and are effectively capturing the remaining nitrate in the Northern Area. All the wells in the Northern MNA area, with the exception of one private shallow aquifer agricultural well, are now below the MCL for nitrate. In the immediate vicinity of the NARS and SEW-1, the nitrate concentrations have again continued to decline to levels close to the cleanup standard. The one area with elevated nitrate concentrations is the MW-36 “hot-spot” area, although the nitrate concentrations in this area have decreased by a third from the concentrations detected during the last FYR (from approximately 320 mg/L in 2007 to 200 mg/L in 2012). The evaluation of the data trends fit the conceptual model. The Institutional Controls, the Alternate Water Supply Plan and an annual Well Inventory Update, have been implemented to ensure that no households within the vicinity of the nitrate-contaminated shallow aquifer groundwater are exposed to contaminated drinking water. In summary these key findings are:
• NARS capture appears to be controlling further spreading of nitrate to north. • MNA appears to have reduced the plume north of NARS capture zone. • Institutional Controls are in place. • Alternate Domestic Water Supply Program remains active. • Well Inventory is updated annually.
2012 Northern Area Groundwater Recommendations The following recommendations are made in this 2012 FYR for the Northern Area Groundwater:
• In-situ treatment could potentially reduce nitrate concentrations in vicinity of MW-36. The in-situ treatability study planned for the MCA should be evaluated upon completion to determine if similar enhancements could accelerate cleanup in the Northern Area.
• A new monitoring well located east of SEW-1 on the west side of the San Pedro River, north of MW-36, may be helpful to monitor transport of residual contamination from the vicinity of MW-36 at the base of Wash 3. (This new proposed well is separate from the well previously proposed for installation on the east side of the San Pedro River.)
SOUTHERN AREA GROUNDWATER The groundwater remedy in the Southern Area is not showing the downward contaminant trends that are observed in the Northern Area. The perched zone monitoring wells with sufficient water remaining to be sampled (P-01 and P-03) either have nitrate and perchlorate concentrations that are remaining stable or significantly above the cleanup standards and continue to show signs of “concentration stratification,” as previously discussed. This same observation can be made for MCA well MW-21.

27
The other two MCA wells (MW-23, and MW-39), which have sufficient water to be sampled, are remaining reasonably stable, but in the case of MW-39 at concentrations exceeding the cleanup standards. Of the numerous monitoring wells installed in these two contaminated areas over the last 20 years, all but two perched zone piezometers and three MCA wells are dry. The other 6 Southern Area monitoring wells are downgradient sentinel or buffer zone wells and upgradient wells located outside of the area of hydraulically contained nitrate and perchlorate contamination. Performance Criteria The 2007 Performance Monitoring Plan for the Southern Area states that the MNA remedy for Southern Area groundwater at the Site requires performance monitoring and evaluation to assure that the remedy is progressing toward cleanup standards at an acceptable rate. The key elements of the performance monitoring and evaluation include:
• Evaluation of groundwater volume reduction and COC mass reduction in the MCA on an annual basis according to methods outlined.
• Overall evaluation of performance based on a moving five-year trend. This is directed at projecting the ultimate timeframe for cleanup.
• Verification of containment of the COCs within their presently known area(s). This includes maintaining the existing degree of hydraulic separation between the perched zone and MCA.
• Annual reporting of performance to EPA and other agencies. (H+A, 2007b) In 2007, the Performance Monitoring Plan for the Southern Area concluded that insufficient data existed to determine rates and trends of volume and mass reduction appropriate for rigorous assessment of remedy performance acceptability; however, preliminary trends based on application of historical data support the appropriateness of this methodology. On the basis of a five-year review interval, decisions on the acceptability of remedy performance will be made. If the five-year review indicates unfavorable performance, consideration will be given to the need to consider implementation of a contingent or supplemental remedy. The primary criteria to be considered in regard to a determination of unfavorable remedy performance would include, but not necessarily be limited to
• Unfavorable water quality trends, • New sources or releases, and • New health risk factors.
2012 Southern Area Groundwater Findings
Based on the data review and the criteria of decreasing water quality trends, the MNA cleanup remedy does not appear to be progressing at the rate originally projected.
• MNA does not appear to be reducing concentrations of perchlorate and nitrate. • Criteria for determining reduction of contaminant mass have not been able to be
measured, due to increasing contaminant trends.

28
However the remedy, including the dewatering efforts, have proven effective in the following areas:
• Perchlorate and nitrate-contamination are hydraulically contained and captured. • Water levels continue to drop in the MCA and to a lesser extent in the perched
zone. • Hydraulic separation between the perched zone and MCA has been maintained.
Some type of enhancement to this MNA remedy may be necessary to meet cleanup standards within a reasonable timeframe. ANPI has developed a preliminary proposal for an in situ pilot study test in the Southern Area. If any unexpected problems should occur during the pilot study (i.e., clogged wells, new contaminants of potential concern identified), any potential damage would be limited to a small geographic area. ANPI plans to submit more developed pilot study proposal for Agency review during the next few months. As a backup alternative, some type of submergent wetlands system or a renewed look at the feasibility of treating the perchlorate- and nitrate-contaminated groundwater in an open wetlands system may also be options for enhancing treatment in the Southern Area. A second issue regarding the adequacy of the existing monitoring network within the MCA for monitoring either an in situ pilot study or proving the Southern Area has met cleanup standards also has been raised with ANPI. While the goal for the perched system has been to dewater it completely, this may not be a feasible goal for the MCA. With only three monitoring wells remaining in the MCA, there may not be sufficient monitoring coverage to make a closeout determination. Also, it is not clear whether there are sufficient monitoring wells for conducting an in situ pilot study in the MCA. These issues will need to be revisited when the in situ pilot treatability study proposal is submitted for Agency review. 2012 Southern Area Groundwater Recommendations The following recommendations are made in this 2012 FYR for the Southern Area Groundwater:
• Additional monitoring wells may be needed in the MCA of the Southern Area. • Recommend in-situ pilot study to see if biodegradation will reduce levels in
MCA.

29
REFERENCES Hargis + Associates, Comprehensive Northern Area Characterization Workplan, Apache Powder Superfund (2006) Site, Cochise County, Arizona, August 21, 2006. Hargis + Associates (2007a), Southern Area Characterization Report, Apache Powder Superfund Site, Cochise County, Arizona, March 27, 2007. Hargis + Associates (2007b), Southern Area Performance Monitoring Plan, Revision 2.0, Apache Powder Superfund Site, Cochise County, Arizona, September 19, 2007. Hargis + Associates (2008a), Soils Engineering Control Plan, Apache Powder Superfund Site, Cochise County, Arizona, April 22, 2008. Hargis + Associates (2008b), Northern Area Monitored Natural Attenuation Assessment, Revision 1.0, Apache Powder Superfund Site, Cochise County, Arizona, July 14, 2008. Hargis + Associates (2009), Performance Monitoring Plan for Monitored Natural Attenuation of Shallow Aquifer Groundwater in the Northern Area of the Apache Powder Superfund Site, Revision 1.0, Apache Powder Superfund Site, Cochise County, Arizona, February 12, 2009. Hargis + Associates (2012a), 2011 Annual Performance Monitoring and Site-Wide Status Report, Revision 1.0, Apache Powder Superfund Site, Cochise County, Arizona, August 13, 2012. Hargis + Associates (2012b), Summary of Quarterly Performance Monitoring for Northern and Southern Areas, February 2012, Apache Powder Superfund Site, May 18, 2012. Hargis + Associates (2012c), E-Mail Communication from L. Leonhart, Ph.D., Hargis, to A. Benner, EPA, regarding Conceptual Site Model, dated July 3, 2012. U.S. Environmental Protection Agency (2007), Interim Remedial Action Report for the Southern Area Groundwater, Apache Powder Superfund Site, Cochise County, Arizona, September 27, 2007. U.S. Environmental Protection Agency (2008), Interim Remedial Action Report for the Northern Area Groundwater, Apache Powder Superfund Site, Cochise County, Arizona, September 25, 2008.

Apache Powder Superfund Site Third Five-Year Report
Appendix B List of Documents Reviewed for FYR Report

1
Documents Reviewed for Apache Superfund Site
2012 Third Five Year Review
Hargis + Associates Documents
2007-03-09 Operation and Maintenance Plan, Northern Area Remediation System,
Revision 3.0
2007-03-20 2006 Annual Summary of Groundwater and Surface Water Monitoring
Program
2007-06-25 Summary of Quarterly Groundwater and Surface Water Monitoring Program,
February 2007
2007-08-10 Summary of Quarterly Groundwater and Surface Water Monitoring Program,
May 2007
2007-09-05 Southern Area Performance Monitoring Plan, Revision 1.0
2007-09-11 2007 Well Inventory Update
2007-10-16 Alternate Domestic Water Supply Plan, Revision 2.0
2007-10-17 Community Outreach Plan
2008-01-29 EPA Site Inspection Report RA Complete
2008-02-14 Summary of Quarterly Groundwater and Surface Water Monitoring Program,
November 2007
2008-03-20 2007 Annual Summary of Groundwater and Surface Water Monitoring
Program
2008-04-22 Remedial Action (RA) Implementation Report for Pond Soils and Sediments
(CERCLA Media Component 3 and Formerly Active Ponds), Revision 1.0
2008-06-17 Summary of Quarterly Groundwater and Surface Water Monitoring Program,
February 2008

2
2008-07-14 Northern Area Monitored Natural Attenuation (MNA) Assessment,
Revision 1.0
2008-07-18 Long-Term Site-Wide Remedies Performance Monitoring and Operations
and Maintenance (O&M)
2009-01-06 2008 Annual Pond Cover Inspection Report
2009-02-09 Summary of Quarterly Performance Monitoring for Northern and Southern
Areas, November 2008
2009-02-12 Performance Monitoring Plan for Monitored Natural Attenuation (MNA) of
Shallow Aquifer Groundwater in the Northern Area, Rev. 1.0
2009-02-12 Alternate Domestic Water Supply Plan, Revision 3.0
2009-03-30 2008 Annual Annual Performance Monitoring and Side-Wide Status Report,
Revision 1.0
2009-07-13 Summary of Quarterly Performance Monitoring for Northern and Southern
Areas, February 2009
2009-11-05 Summary of Quarterly Performance Monitoring for Northern and Southern
Areas, May 2009
2009-12-04 2009 Well Inventory Update
2009-12-23 Summary of Quarterly Performance Monitoring for Northern and Southern
Areas, August 2009
2010-01-05 2009 Annual Pond Cover Inspection Report
2010-02-08 Summary of Quarterly Performance Monitoring for Northern and Southern
Areas, November 2009
2010-05-07 Summary of Quarterly Performance Monitoring for Northern and Southern
Areas, February 2010
2010-06-14 Quality Assurance Project Plan (QAPP), Performance Monitoring and
Operation and Maintenance of Remedies, Revision 1.0

3
2010-06-28 2009 Annual Performance Monitoring and Side-Wide Status Report
2010-08-10 Summary of Quarterly Performance Monitoring for Northern and Southern
Areas, May 2010
2010-10-21 2010 Well Inventory Update
2010-12-02 Summary of Quarterly Performance Monitoring for Northern and Southern
Areas, August 2010
2011-01-06 2010 Annual Pond Cover Inspection Report
2011-03-29 2010 Annual Performance Monitoring and Side-Wide Status Report
2011-05-17 Summary of Quarterly Performance Monitoring for Northern and Southern
Areas, February 2011
2011-08-12 Revised Quarterly Performance Monitoring for Northern and Southern Areas,
February 2011
2011-08-12 Summary of Quarterly Performance Monitoring for Northern and Southern
Areas, May 2011
2011-10-24 2011 Well Inventory Update
2011-11-04 Summary of Quarterly Performance Monitoring for Northern and Southern
Areas, August 2011
2012-01-12 2012 Annual Pond Cover Inspection Report
2012-02-17 Summary of Quarterly Performance Monitoring for Northern and Southern
Areas, November 2011
2012-03-29 2011 Annual Performance Monitoring and Site-Wide Status Report
U.S. Environmental Protection Agency (EPA) Documents
1994-09-30 Record of Decision (ROD), Apache Powder Superfund Site
1997-04-16 Explanation of Significant Difference (ESD) #1

4
2000-09-29 Explanation of Significant Difference (ESD) #2
2002-09 First Five Year Review Report
2005-09-30 Amendment to the ROD, Apache Powder Superfund Site
2007-09 Technical Analysis 2002-2007 for Five Year Review (Army Corps)
2007-09-25 Second Five Year Review Report
2007-09-26 Site Inspection Report for Completion of Southern Area Groundwater
Remedy (CH2M Hill)
2007-09-27 Interim Remedial Action Report for Southern Area Groundwater
2008-01-29 Site Inspection Report for Completion of Soils Remedy (CH2M Hill)
2008-07-02 Site Inspection Report for Completion of Northern Area Groundwater
Remedy (CH2M Hill)
2008-07-31 Explanation of Significant Difference (ESD) #3
2008-09-25 Interim Remedial Action Report for Northern Area Groundwater
2008-09-25 Final Remedial Action Report for Contaminated Soils
2008-09-28 Preliminary Close Out Report
Other Documents
2008-08-22 Declaration of Environmental Use Restriction (DEUR)

Apache Powder Superfund Site Third Five-Year Report
Appendix C Site Inspection Report

Five-Year Review Site Inspection Checklist
I. SITE INFORMATION
Site name: Apache Powder Date of inspection: June 12, 2012
Location and Region: St David, AZ (EPA Region 9) EPA ID: AZD008399263
Agency, office, or company leading the five-year review: EPA San Francisco Region 9
Weather/temperature: Sunny, 98 º F
Remedy Includes: (Check all that apply) ☒ Landfill cover/containment ☒ Monitored natural attenuation ☒ Access controls ☐ Groundwater containment ☒ Institutional controls ☐ Vertical barrier walls ☒ Groundwater pump and treatment ☐ Surface water collection and treatment ☒ Other ___ Groundwater source control MNA _____________
Attachments: ☒ Inspection team roster attached ☒ Site map attached
II. INTERVIEWS (Check all that apply)
1. O&M site manager Craig Boudle Safety-Health & Environmental Manager June 12, 2012_ Name Title Date Interviewed: ☒ at Site ☒ at office ☒ by phone Phone no. 520-720-2114_ Problems, suggestions; □ Report attached ________________________________________________ __________________________________________________________________________________
2. O&M staff ________Jeff Bauer _____________EHS Manager________ June 12, 2012____________ Name Title Date
Interviewed: ☒ at Site ☒ at office ☐ by phone Phone no. 520-720-2177_
Problems, suggestions; □ Report attached _______________________________________________ __________________________________________________________________________________

3. Local regulatory authorities and response agencies (i.e., State and Tribal offices, emergency response office, police department, office of public health or environmental health, zoning office, recorder of deeds, or other city and county offices, etc.) Fill in all that apply.
Agency ADEQ____ Contact Robert Wallin __ Project Manager June 12, 2012 520-628-6743_
Name Title Date Phone no. Problems; suggestions; ☐ Report attached _______________________________________________ __________________________________________________________________________________
Agency ____________________________ Contact ____________________________ __________________ ________ ____________
Name Title Date Phone no. Problems; suggestions; ☐ Report attached _______________________________________________ __________________________________________________________________________________
4. Other interviews (optional) ☐ Report attached.

III. ON-SITE DOCUMENTS & RECORDS VERIFIED (Check all that apply)
1. O&M Documents ☒ O&M manual ☒ Readily available ☒ Up to date ☐ N/A ☐ As-built drawings ☐ Readily available ☐ Up to date ☒ N/A ☒ Maintenance logs ☒ Readily available ☒ Up to date ☐ N/A Remarks: __Wetlands documented weekly; ponds documented thru e-mail & hard copy. All documents maintained/tracked using Tab Ware Database and kept on hard drive.___________________________
2. Site-Specific Health and Safety Plan ☒ Readily available ☒ Up to date ☐ N/A ☐ Contingency plan/emergency response plan ☐ Readily available ☐ Up to date ☒ N/A Remarks_________________________________________________________________________ _________________________________________________________________________________
3. O&M and OSHA Training Records ☒ Readily available ☒ Up to date ☐ N/A Remarks__________________________________________________________________________ _________________________________________________________________________________
4. Permits and Service Agreements ☒ Air discharge permit ☒ Readily available ☒ Up to date ☐ N/A ☒ Effluent discharge ☒ Readily available ☒ Up to date □ N/A ☒ Waste disposal, POTW ☒ Readily available ☒ Up to date □ N/A ☐ Other permits_____________________ ☐ Readily available ☐ Up to date ☐ N/A Remarks: __All appropriate documents are in files and readily available; air discharge permit is also posted. Apache is classified as an exempt small quantity generator. _________________________ _______________________________________________________________________________
5. Gas Generation Records ☒ Readily available ☒ Up to date ☐ N/A Remarks__________________________________________________________________________ _________________________________________________________________________________
6. Settlement Monument Records ☒ Readily available ☒ Up to date ☐ N/A Remarks______Apache Cost Recovery Settlement with EPA December 2009__
7. Groundwater Monitoring Records ☒ Readily available ☒ Up to date ☐ N/A Remarks__________________________________________________________________________ _________________________________________________________________________________
8. Leachate Extraction Records ☐ Readily available ☐ Up to date ☒ N/A Remarks__________________________________________________________________________ _________________________________________________________________________________
9. Discharge Compliance Records ☒ Air ☒ Readily available ☒ Up to date ☐ N/A ☒ Water (effluent) ☒ Readily available ☒ Up to date ☐ N/A Remarks___Air records are provided to ADEQ quarterly. Wetlands reporting and treatment logs maintained and up to date._______________________________________________________
10. Daily Access/Security Logs ☐ Readily available ☐ Up to date ☒ N/A Remarks__________________________________________________________________________ _________________________________________________________________________________

IV. O&M COSTS
1. O&M Organization ☐ State in-house ☐ Contractor for State ☐ PRP in-house ☐ Contractor for PRP ☐ Federal Facility in-house ☐ Contractor for Federal Facility ☒ Other_____EPA has a copy of the O&M Organization.________________________________
______________________________________________________________________________
2. O&M Cost Records ☒ Readily available ☐ Up to date ☐ Funding mechanism/agreement in place Original O&M cost estimate: _ANPI has provided EPA O&M cost information needed for the FYR. □ Breakdown attached
Total annual cost by year for review period if available
From__________ To__________ __________________ ☐ Breakdown attached
Date Date Total cost From__________ To__________ __________________ ☐ Breakdown attached
Date Date Total cost From__________ To__________ __________________ ☐ Breakdown attached
Date Date Total cost From__________ To__________ __________________ ☐ Breakdown attached
Date Date Total cost From__________ To__________ __________________ ☐ Breakdown attached
Date Date Total cost
3. Unanticipated or Unusually High O&M Costs During Review Period Describe costs and reasons: All cost information has been provided to EPA. ____________________________________________________________________________ _________________________________________________________________________________ _________________________________________________________________________________ _________________________________________________________________________________
V. ACCESS AND INSTITUTIONAL CONTROLS ☒ Applicable ☐ N/A
A. Fencing
1. Fencing damaged ☐ Location shown on Site map ☒ Gates secured ☐ N/A Remarks___Fencing is in good condition (approximately 2 years old). Fencing is high-security around operations area of ANPI facility. The Wetlands treatment area is fenced for traffic._(See Photo Nos. 1 and 2)____________________________________ _________________________________________________________________________________
B. Other Access Restrictions
1. Signs and other security measures □ Location shown on Site map □ N/A Remarks Signage is in good condition and placed appropriately throughout facility including at former evaporation ponds.__(See Photo Nos. 3 and 4)______________________________________________ ___________________________________________________________________________________

C. Institutional Controls (ICs)
1. Implementation and enforcement Site conditions imply ICs not properly implemented ☐ Yes ☒ No ☐ N/A
Site conditions imply ICs not being fully enforced ☐ Yes ☒ No ☐ N/A
Type of monitoring (e.g., self-reporting, drive by) ___self-reporting_________________________ Frequency ____Every 90 days______________________________________________________ Responsible party/agency ___Apache Powder__________________________________________ Contact ______Jeff Bauer EHS Manager _ 520-720-2177___
Name Title Date Phone no.
Reporting is up-to-date ☒ Yes ☐ No ☐ N/A Reports are verified by the lead agency ☒Yes ☐ No ☐ N/A
Specific requirements in deed or decision documents have been met ☒ Yes ☐ No ☐ N/A Violations have been reported ☐ Yes ☐ No ☒ N/A Other problems or suggestions: ☐ Report attached _Formerly active ponds are capped with two feet of native soil .There is a Declaration of Environmental Use Restriction (DEUR) on the formerly active ponds. ANPI’s contractor Hargis + Associates prepares an annual Pond Cover Report after inspecting ponds for compliance with the DEUR’s engineering controls requirements. ________________________________________________________________________
2. Adequacy ☒ ICs are adequate ☐ ICs are inadequate ☐ N/A Remarks__________________________________________________________________________ _________________________________________________________________________________ _________________________________________________________________________________
D. General
1. Vandalism/trespassing ☐ Location shown on Site map ☒ No vandalism evident Remarks: _No vandalism. Trespassers have been arrested via Border Patrol outside the internal operational fencing on one occasion during the last few years.______________________________
2. Land use changes on Site ☐ N/A Remarks____Improvements to the stormwater drainage system, including cutting new swales along roadsides.________________________________________________________________________
3. Land use changes off Site ☐ N/A Remarks__Nothing significant near the facility.___________________________________________ _________________________________________________________________________________
VI. GENERAL SITE CONDITIONS
A. Roads ☒ Applicable ☐ N/A
1. Roads damaged ☐ Location shown on Site map ☒ Roads adequate ☐ N/A Remarks__________________________________________________________________________ _________________________________________________________________________________

B. Other Site Conditions
Remarks: None __________________________________________________________________ _________________________________________________________________________________ _______________________________________________________________________________ _______________________________________________________________________________ ________ _______________________________________________________________________________
VII. EVAPORATIVE POND COVERS ☒ Applicable ☐ N/A
A. Landfill Surface
1. Settlement (Low spots) ☐ Location shown on Site map ☒ Settlement not evident Areal extent______________ Depth____________ Remarks____________________________________________________________ __________________________________________________________________
2. Cracks ☐ Location shown on Site map ☒ Cracking not evident Lengths____________ Widths___________ Depths__________ Remarks____________________________________________________________ __________________________________________________________________
3. Erosion ☐ Location shown on Site map ☒ Erosion not evident Areal extent______________ Depth____________ Remarks_Pond covers are in good condition with no visible erosion (See photo No. 5) Wattles are used to prevent erosion on the pond covers. As wattles began to deteriorate, a new one is placed on top of the old one and they are staked together for maximum erosion control. (See Photo No.6)________________
4. Holes ☐ Location shown on Site map ☒ Holes not evident Areal extent______________ Depth____________ Remarks__________________________________________________________________________ _________________________________________________________________________________
5. Vegetative Cover ☒ Grass ☐ Cover properly established ☐ No signs of stress ☐ Trees/Shrubs (indicate size and locations on a diagram) Remarks_Native vegetation including some native shrubs and /trees taking hold (See Photo Nos. 7 and 8) _______________________________________________________________________________
6. Alternative Cover (armored rock, concrete, etc.) ☒ N/A Remarks__________________________________________________________________________ _________________________________________________________________________________
7. Bulges ☐ Location shown on Site map ☒ Bulges not evident Areal extent______________ Height____________ Remarks__________________________________________________________________________ _________________________________________________________________________________
8. Wet Areas/Water Damage ☒ Wet areas/water damage not evident ☐ Wet areas ☐ Location shown on Site map Areal extent______________ ☐ Ponding ☐ Location shown on Site map Areal extent______________ ☐ Seeps ☐ Location shown on Site map Areal extent______________ ☐ Soft subgrade ☐ Location shown on Site map Areal extent______________ Remarks__________________________________________________________________________ _________________________________________________________________________________

9. Slope Instability ☐ Slides ☐ Location shown on Site map ☒ No evidence of slope instability Areal extent______________ Remarks__________________________________________________________________________ _________________________________________________________________________________
B. Benches ☐ Applicable ☒ N/A (Horizontally constructed mounds of earth placed across a steep landfill side slope to interrupt the slope in order to slow down the velocity of surface runoff and intercept and convey the runoff to a lined channel.)
1. Flows Bypass Bench ☐ Location shown on Site map ☒ N/A or okay Remarks__________________________________________________________________________ _________________________________________________________________________________
2. Bench Breached ☐ Location shown on Site map ☒ N/A or okay Remarks__________________________________________________________________________ _________________________________________________________________________________
3. Bench Overtopped ☐ Location shown on Site map ☒ N/A or okay Remarks__________________________________________________________________________ _________________________________________________________________________________
C. Letdown Channels ☐ Applicable ☒ N/A (Channel lined with erosion control mats, riprap, grout bags, or gabions that descend down the steep side slope of the cover and will allow the runoff water collected by the benches to move off of the landfill cover without creating erosion gullies.)
1. Settlement ☐ Location shown on Site map ☒ No evidence of settlement Areal extent______________ Depth____________ Remarks__________________________________________________________________________ _________________________________________________________________________________
2. Material Degradation ☐ Location shown on Site map ☒ No evidence of degradation Material type_______________ Areal extent_____________ Remarks__________________________________________________________________________ _________________________________________________________________________________
3. Erosion ☐ Location shown on Site map ☒ No evidence of erosion Areal extent______________ Depth____________ Remarks__ (See Photo Nos. 5 and 6).____________________________________________________ _________________________________________________________________________________
4. Undercutting ☐ Location shown on Site map ☒ No evidence of undercutting Areal extent______________ Depth____________ Remarks__________________________________________________________________________ _________________________________________________________________________________
5. Obstructions Type_____________________ ☒ No obstructions
☐ Location shown on Site map Areal extent______________ Size____________ Remarks__________________________________________________________________________ _________________________________________________________________________________

6. Excessive Vegetative Growth Type____________________
☒ No evidence of excessive growth
☐ Vegetation in channels does not obstruct flow
☐ Location shown on Site map Areal extent______________
Remarks_Grass and some native trees and shrubs taking hold on pond covers. (Covers consist of native soil.)_To protect the pond covers from vehicular traffic, vegetation on the pond covers is maintained within the perimeters of the ponds in order to keep them easily visible._(See Photo Nos. 7 and 8)____
VIII. WETLANDS BANK MANAGEMENT X Applicable □ N/A
A. Landfill Surface
1. Settlement (Low spots) ☐ Location shown on Site map ☒ Settlement not evident Areal extent______________ Depth____________ Remarks____________________________________________________________ __________________________________________________________________
2. Cracks ☐ Location shown on Site map ☒ Cracking not evident Lengths____________ Widths___________ Depths__________ Remarks____________________________________________________________ __________________________________________________________________
3. Erosion ☐ Location shown on Site map ☒ Erosion not evident Areal extent______________ Depth____________ Remarks__________________________________________________________________________ _____(See Photo Nos. 7 and 8)________________________________________________________
4. Holes ☐ Location shown on Site map ☒ Holes not evident Areal extent______________ Depth____________ Remarks__________________________________________________________________________ _________________________________________________________________________________
5. Vegetative Cover ☒ Grass ☒ Cover properly established ☐ No signs of stress
☐ Trees/Shrubs (indicate size and locations on a diagram) Remarks___Wetlands vegetation is well established. Native grasses and flowers established on slopes; tamarisk and salt cedar must be managed regularly. (See Photo Nos. 9-11)_______________________
6. Alternative Cover (armored rock, concrete, etc.) ☒ N/A Remarks__________________________________________________________________________ _________________________________________________________________________________
7. Bulges ☐ Location shown on Site map ☒ Bulges not evident Areal extent______________ Height____________ Remarks__________________________________________________________________________ _________________________________________________________________________________
8. Wet Areas/Water Damage ☒ Wet areas/water damage not evident ☐ Wet areas ☐ Location shown on Site map Areal extent______________ ☐ Ponding ☐ Location shown on Site map Areal extent______________ ☐ Seeps ☐ Location shown on Site map Areal extent______________ ☐ Soft subgrade ☐ Location shown on Site map Areal extent______________ Remarks__________________________________________________________________________ _________________________________________________________________________________

9. Slope Instability ☐ Slides ☐ Location shown on Site map ☒ No evidence of slope instability Areal extent______________ Remarks__________________________________________________________________________ _________________________________________________________________________________
B. Benches ☐ Applicable ☒ N/A (Horizontally constructed mounds of earth placed across a steep landfill side slope to interrupt the slope in order to slow down the velocity of surface runoff and intercept and convey the runoff to a lined channel.)
1. Flows Bypass Bench ☐ Location shown on Site map ☒ N/A or okay Remarks__________________________________________________________________________ _________________________________________________________________________________
2. Bench Breached ☐ Location shown on Site map ☒ N/A or okay Remarks__________________________________________________________________________ _________________________________________________________________________________
3. Bench Overtopped ☐ Location shown on Site map ☒ N/A or okay Remarks__________________________________________________________________________ _________________________________________________________________________________
C. Letdown Channels ☐ Applicable ☒ N/A (Channel lined with erosion control mats, riprap, grout bags, or gabions that descend down the steep side slope of the cover and will allow the runoff water collected by the benches to move off of the landfill cover without creating erosion gullies.)
1. Settlement ☐ Location shown on Site map ☒ No evidence of settlement Areal extent______________ Depth____________ Remarks__________________________________________________________________________ _________________________________________________________________________________
2. Material Degradation ☐ Location shown on Site map ☒ No evidence of degradation Material type_______________ Areal extent_____________ Remarks__________________________________________________________________________ _________________________________________________________________________________
3. Erosion ☐ Location shown on Site map ☒ No evidence of erosion Areal extent______________ Depth____________ Remarks_______(See Photo No. 10)_____________________________________________________ __________________________________________________________________________________
4. Undercutting ☐ Location shown on Site map ☒ No evidence of undercutting Areal extent______________ Depth____________ Remarks__________________________________________________________________________ _________________________________________________________________________________
5. Obstructions Type_____________________ ☒ No obstructions
☐ Location shown on Site map Areal extent______________ Size____________ Remarks__________________________________________________________________________ _________________________________________________________________________________

6. Excessive Vegetative Growth Type____________________
☒ No evidence of excessive growth
☐ Vegetation in channels does not obstruct flow
☐ Location shown on Site map Areal extent______________
Remarks_Tamarisk and salt cedar must be managed regularly. (See Photo No. 11)_ ______________
E. Gas Collection and Treatment ☐ Applicable ☒ N/A
1. Gas Treatment Facilities ☐ Flaring ☐ Thermal destruction ☐ Collection for reuse ☐ Good condition ☐ Needs Maintenance Remarks__________________________________________________________________________ _________________________________________________________________________________
2. Gas Collection Wells, Manifolds and Piping ☐ Good condition ☐ Needs Maintenance Remarks__________________________________________________________________________ _________________________________________________________________________________
3. Gas Monitoring Facilities (e.g., gas monitoring of adjacent homes or buildings) ☐ Good condition ☐ Needs Maintenance ☒ N/A Remarks__________________________________________________________________________ _________________________________________________________________________________
F. Cover Drainage Layer ☒ Applicable ☐ N/A
1. Outlet Pipes Inspected ☒ Functioning ☐ N/A Remarks__Rip-rap covered with moss is in a small pool at the outlet before it enters the San Pedro River. Weirs at Wetlands are maintained by removing plant growth on a weekly basis. Vegetation was observed in the weirs obstructing water flow between ponds (See Photo No. 12) _________________
2. Outlet Rock Inspected ☐ Functioning ☒ N/A Remarks__________________________________________________________________________ _________________________________________________________________________________
□. Detention/Sedimentation Ponds ☐ Applicable ☒N/A
1. Siltation Areal extent______________ Depth____________ ☒ N/A ☐ Siltation not evident Remarks__________________________________________________________________________ _________________________________________________________________________________
2. Erosion Areal extent______________ Depth____________ X Erosion not evident Remarks__________________________________________________________________________ _________________________________________________________________________________
3. Outlet Works ☒ Functioning ☐ N/A
Remarks__Improvements are being made to the stormwater drainage system at the Site. Water distribution system at the Site, including piping, is being replaced to prevent any possible leakage from system resulting in potential recharge of the perched zone.___________________________________ _________________________________________________________________________________

4. Dam ☐ Functioning ☒ N/A Remarks__________________________________________________________________________ _________________________________________________________________________________
H. Retaining Walls ☐ Applicable ☒ N/A
1. Deformations ☐ Location shown on Site map ☐ Deformation not evident Horizontal displacement____________ Vertical displacement_______________ Rotational displacement____________ Remarks___________________________________________________________________________
_________________________________________________________________________________
2. Degradation ☐ Location shown on Site map ☐ Degradation not evident Remarks__________________________________________________________________________ _________________________________________________________________________________
I. Perimeter Ditches/Off-Site Discharge ☐ Applicable ☒ N/A
1. Siltation ☐ Location shown on Site map ☐ Siltation not evident Areal extent______________ Depth____________ Remarks__See Section VII and VIII for drainage, erosion, and offsite discharge.________________ _________________________________________________________________________________
2. Vegetative Growth ☐ Location shown on Site map ☒ N/A ☐ Vegetation does not impede flow Areal extent______________ Type____________ Remarks__________________________________________________________________________ _________________________________________________________________________________
3. Erosion ☐ Location shown on Site map ☒ Erosion not evident Areal extent______________ Depth____________ Remarks__________________________________________________________________________ _________________________________________________________________________________
4. Discharge Structure ☐ Functioning ☒ N/A Remarks__________________________________________________________________________ _________________________________________________________________________________
VIII. VERTICAL BARRIER WALLS ☐ Applicable ☒ N/A
1. Settlement ☐ Location shown on Site map ☐ Settlement not evident Areal extent______________ Depth____________ Remarks__________________________________________________________________________ _________________________________________________________________________________
2. Performance Monitoring Type of monitoring__________________________ ☐ Performance not monitored Frequency_______________________________ ☐ Evidence of breaching Head differential__________________________ Remarks__________________________________________________________________________ _________________________________________________________________________________
IX. GROUNDWATER/SURFACE WATER REMEDIES ☒ Applicable ☐ N/A
A. NARS Groundwater Extraction Wells, Pumps, and Pipelines ☒ Applicable ☐ N/A

1. Pumps, Wellhead Plumbing, and Electrical ☒ Good condition ☐ All required wells properly operating ☐ Needs Maintenance ☐ N/A Remarks___All wells and pumps in operation at the NARS are functioning properly and well maintained. _______________________________________________________________________ _________________________________________________________________________________
2. Extraction System Pipelines, Valves, Valve Boxes, and Other Appurtenances ☒ Good condition ☐ Needs Maintenance Remarks_____All equipment is inspected weekly by Apache Powder._________________________ _________________________________________________________________________________
3. Spare Parts and Equipment ☒ Readily available ☐ Good condition ☐ Requires upgrade ☐ Needs to be provided Remarks__Warehouse on Site where spare parts are kept. ___________________________________ _________________________________________________________________________________
B. Perched Zone (Southern Area) Collection Structures, Pumps, and Pipelines ☒ Applicable ☐ N/A
1. Collection Structures, Pumps, and Electrical
☒ Good condition ☐ Needs Maintenance
Remarks_The current collection system is not adequate for maximizing the extraction and evaporation of perched groundwater. The system is limited by an insufficient quantity and type of containment vessels (shallow pan-type vessels versus deep-pool type vessels). Consideration should be given to expanding and optimizing the system. (See Photo Nos. 13-16) __________________________________________________________
2. Surface Water Collection System Pipelines, Valves, Valve Boxes, and Other Appurtenances ☐ Good condition ☐ Needs Maintenance Remarks__________________________________________________________________________ _________________________________________________________________________________
3. Spare Parts and Equipment
☒ Readily available ☐ Good condition ☐ Requires upgrade ☐ Needs to be provided
Remarks__________________________________________________________________________ _________________________________________________________________________________
C. Constructed Wetlands Treatment System (Northern Area) ☒ Applicable ☐ N/A
1. Treatment Train (Check components that apply) ☐ Metals removal ☐ Oil/water separation ☒ Bioremediation ☐ Air stripping ☐ Carbon adsorbers ☐ Filters_________________________________________________________________________ ☐ Additive (e.g., chelation agent, flocculent)_Molasses (carbon amendment) (See Photo Nos. 17and 18) ☐ Others_________________________________________________________________________ ☒ Good condition ☐ Needs Maintenance ☒ Sampling ports properly marked and functional ☒ Sampling/maintenance log displayed and up to date ☒ Equipment properly identified ☒ Quantity of groundwater treated annually___> 71 Million gallons in 2011 (NARS) ☐ Quantity of surface water treated annually________________________ Remarks___Sampling data is included in weekly reports. __________________________________ _________________________________________________________________________________

2. Electrical Enclosures and Panels (properly rated and functional) ☒ N/A ☐ Good condition ☐ Needs Maintenance Remarks__________________________________________________________________________ _________________________________________________________________________________
3. Tanks, Vaults, Storage Vessels ☐ N/A ☒ Good condition ☐ Proper secondary containment ☐ Needs Maintenance Remarks_Molasses storage tanks are kept at the Wetlands (See photo Nos. 17 and 18)._Tanks are used for collection of water from perched aquifer. (See Photo Nos. 13 and 14)_________________________
4a. Discharge Structure and Appurtenances
☐ N/A ☐ Good condition ☒ Needs Maintenance
Remarks_Weirs between ponds at Wetlands need be cleaned of vegetation._(See Photo No. 12) ____________________________________________________________________________
4b. Discharge Structure and Appurtenances
☐ N/A ☒ Good condition ☐ Needs Maintenance
Remarks_Discharge point flow meter (operated by a solar panel) is in good condition. (See Photo No. 19)______________________________________________________________________________
5. Treatment Building(s) ☒ N/A ☐ Good condition (esp. roof and doorways) ☐ Needs repair ☐ Chemicals and equipment properly stored Remarks__________________________________________________________________________ _________________________________________________________________________________
6. Monitoring Wells (pump and treatment remedy) ☒ Properly secured/locked ☒ Functioning ☒ Routinely sampled ☒Good condition ☒ All required wells located ☐ Needs Maintenance ☐ N/A Remarks Wetlands ponds are sampled by hand.___________________________________________ _________________________________________________________________________________
D. Monitoring Data
1. Monitoring Data
☒ Is routinely submitted on time ☒ Is of acceptable quality
2. Monitoring data suggests:
☐ Groundwater plume is effectively contained
☒ Contaminant concentrations are declining in the Northern Area but not in the Southern Area.
D. Monitored Natural Attenuation for Southern Area
1. Monitoring Wells (natural attenuation remedy) ☒ Properly secured/locked ☒ Functioning ☒ Routinely sampled ☒ Good condition ☐ All required wells located ☐ Needs Maintenance ☐ N/A Remarks___ Additional monitoring wells may be needed in the Molinos Creek Sub-Aquifer (MCA) area of the Southern Groundwater Area to replace monitoring wells that have gone dry due to the lowered water table. _________________________________________________________________________________

X. OTHER REMEDIES
As noted above, consideration needs to be given to other alternatives for enhancing the Southern Area MNA remedy, such as the in-situ pilot testing recently proposed by ANPI.
Also, during the Site Inspection, ANPI personnel toured an historic area of the Site known as the “Powder Line”. Over 160 structures (no longer operational) have been identified on the Site. ANPI has identified these structures as a “legacy” issue. ANPI plans to remove these structures over the next 3-5 years as the facility is upgraded. In preparation for the demolition of the structures, this historic area is currently being surveyed and inventoried for potential hazardous waste, such as asbestos and lead-based paint. Buried sulfur in rails cars was also recently discovered at the Site. As these areas are investigated and characterized other wastes may be discovered requiring cleanup under CERCLA. (See Photo Nos. 20 and 21).
Green remediation has been implemented at the Apache Powder main buildings with the use of Xeriscaping, Water Harvesting, and a Solar Canopies. (See Photo Nos. 22-24)
XI. OVERALL OBSERVATIONS
A. Implementation of the Remedy
Describe issues and observations relating to whether the remedy is effective and functioning as designed. Begin with a brief statement of what the remedy is to accomplish (i.e., to contain contaminant plume, minimize infiltration and gas emission, etc.). The two existing evaporative collection tanks (see Photo Nos. 13 and 14) replaced two more shallow collection pans previously utilized. However, in order to accelerate dewatering of the perched water, it appears that the system could be optimized. One potential method for optimization might be achieved by going back to using the more shallow collection pans, adding additional pans or collection tanks, or installing larger collection tanks or pans to take advantage of more surface area. ________________________________________________________________ _________________________________________________________________________________ In the future, it may be necessary to install an additional groundwater monitor wells in the Molinos Creek Sub-Aquifer area of the Southern Area and downgradient of the hot-spot in the Northern Area.______________________________________________________________________________ __________________________________________________________________________________ Removal actions may be needed in the future to manage any hazardous wastes that may be discovered when ANPI demolishes and removes historic buildings no longer in use as the Site. See discussion in Section X above. (See Photo Nos. 20 and 21)____________________________________________ __________________________________________________________________________________
B. Adequacy of O&M
Describe issues and observations related to the implementation and scope of O&M procedures. In particular, discuss their relationship to the current and long-term protectiveness of the remedy. The Wetlands require continual maintenance in order to keep up with the native vegetative growth. Maintenance is necessary for the removal of invasive vegetation in the ponds such as Tamarask and Salt Cedar as well as for native vegetation along the slopes of the ponds to prevent erosion. (See Photo Nos. 10-12)_________________________________________________________________________ __________________________________________________________________________________

C. Early Indicators of Potential Remedy Problems
Describe issues and observations such as unexpected changes in the cost or scope of O&M or a high frequency of unscheduled repairs that suggest that the protectiveness of the remedy may be compromised in the future. ____________________________________________________________________ __________________________________________________________________________________ __________________________________________________________________________________ _________________________N/A______________________________________________________ __________________________________________________________________________________ __________________________________________________________________________________ __________________________________________________________________________________ __________________________________________________________________________________ __________________________________________________________________________________
D. Opportunities for Optimization
Describe possible opportunities for optimization in monitoring tasks or the operation of the remedy. Consideration has been given to conducting an in-situ treatability pilot test in the Molinos Creek Subaquifer (MCA) in the Southern Area. _________________________________________________ __________________________________________________________________________________ Consideration needs to be given to optimizing the extraction and evaporation of the remaining water in the perched groundwater system as described above in Section A._____________________________ __________________________________________________________________________________ __________________________________________________________________________________ __________________________________________________________________________________

PhotogrApache P5-Year In Photogra
Faci
Descriptionof the ANPI fhigh-securitygates, with a all vehicle an
Photogra
Faci
Descriptionof high-securoperations arwire). Fencinto prevent ve
raphic Dowder Sup
nspection,
aph No. 1
lity Fenc
n: The operafacility is fence
fencing and guard shack
nd pedestrian
aph No. 2
lity Fenc
n: Photo deprity fencing arrea (inset shong at the Wetehicle access
Documenperfund SJune 12, 2
ing
ations area ed with locked controlling traffic.
ing
picts type round ows razor lands area only.
ntation Site 2012
Page 1 of 12

PhotogrApache P5-Year In Photogra
SignaEvap
Descriptionshows typicponds. Signcondition an
Photogra
SignaEvapo
Descriptionshows typicaround the pponds. (Orasigns and wsigns.)
raphic Dowder Sup
nspection,
aph No. 3
age at Fororation P
n: This photcal signage ans were in gond well place
aph No. 4
age at Fororation P
n: This photoal placemenperimeter of ange shows fhite shows b
Documenperfund SJune 12, 2
rmer Pond
tograph at the ood ed.
rmer Pond
ograph nt of signs f the front of back of
ntation Site 2012
Page 2 of 12

PhotogrApache P5-Year In Photogra
FormePo
Descriptionrepresents awell maintavisible. Waerosion and boundaries.
Photogra
FormePo
Descriptionand well mathe pond covvehicular trabegin to detplaced on tostaked toget
raphic Dowder Sup
nspection,
aph No. 5
er Evaporaond Cove
n: This photoa typical ponined with no
attles help prdefine pond
aph No. 6
er Evaporaond Cove
n: Wattles araintained to pvers from eraffic. When eriorate a ne
op and the twther as show
Documenperfund SJune 12, 2
ation r
ograph d cover,
o erosion revent d cover
ation r
re in place protect rosion and wattles
ew one is wo are
wn here.
ntation Site 2012
Page 3 of 12

PhotogrApache P5-Year In Photogra
VegetaEvapo
Descriptiontaking hold Typical natishown in the
Photogra
VegetaActive
Descriptionnative vegeton the pondnative busheareas.
raphic Dowder Sup
nspection,
aph No. 7
tion on Foration PCovers
n: Native vegon the pondive vegetatioe photograph
aph No. 8
tion on Fe Pond Co
n: In some artation is takicovers inclu
es and trees
Documenperfund SJune 12, 2
ormer Pond
getation is covers.
on is h.
ormer overs
reas, ng hold uding in some
ntation Site 2012
Page 4 of 12

PhotogrApache P5-Year In Photogra
The
Descriptionappear healtbe a successcontaminate
Photogra Wetland
Descriptionseeding, donnative grassthe slopes in(treatment cerosion alon
raphic Dowder Sup
nspection,
aph No. 9
e Wetland
n: The Wetlathy and contsful remedy ed groundwa
aph No. 10
ds VegetaErosion
n: Successfune in 2011, pes and flowento the pondcells), prevenng the slopes
Documenperfund SJune 12, 2
ds
ands tinues to for nitrate
ater.
0
ation to
ul hydro-provides ers along
ds nting s. .
ntation Site 2012
Page 5 of 12

PhotogrApache P5-Year In Photogra Wetlands
T
Descriptionarrows) andshown), botmust be con
Photogra
Weir MW
Descriptionbetween thecells) at the kept free of regularly in properly.
raphic Dowder Sup
nspection,
aph No. 1
s Salt CedTamarisk
n: Salt cedard Tamarisk (nh invasive sp
ntinually mai
aph No. 12
MaintenanWetlands
n: Weirs locae ponds (treaWetlands mvegetation aorder to fun
Documenperfund SJune 12, 2
1
dar and
r (see not pecies, intained.
2
nce at
ated atment must be and debris nction
ntation Site 2012
Page 6 of 12

PhotogrApache P5-Year In Photogra
PercColle
Descriptionused to collefrom the pershown here.
Photogra
PercColle
Descriptionwater collecperched systpump opera
raphic Dowder Sup
nspection,
aph No. 13
ched Systection Ta
n: One of twect water purched aquife.
aph No. 14
ched Systection Ta
n: Interior viction tank fortem with the
ating.
Documenperfund SJune 12, 2
3
tem nks
wo tanks mped
er is
4
tem nks
iew of a r the e water
ntation Site 2012
Page 7 of 12
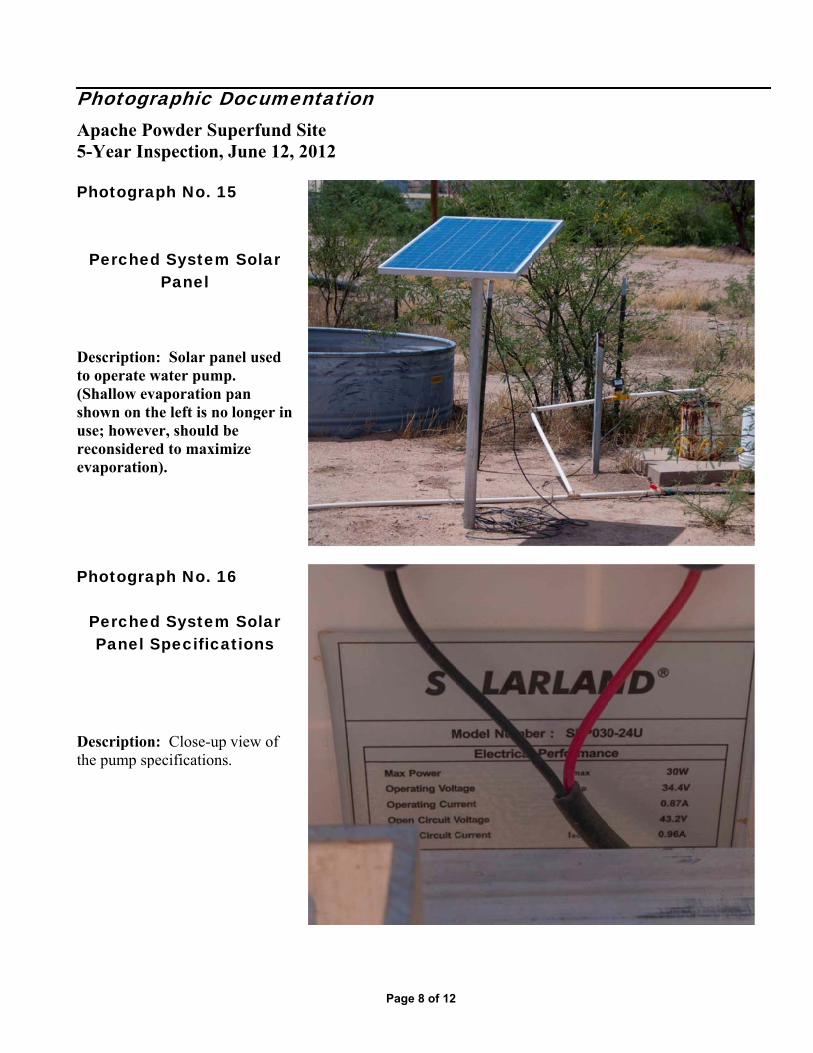
PhotogrApache P5-Year In Photogra
Perched
Descriptionto operate w(Shallow evshown on thuse; howevreconsidereevaporation
Photogra
PerchedPanel S
Descriptionthe pump sp
raphic Dowder Sup
nspection,
aph No. 15
d System
Panel
n: Solar panwater pumpvaporation phe left is no er, should bed to maximn).
aph No. 16
d SystemSpecifica
n: Close-up pecifications
Documenperfund SJune 12, 2
5
m Solar
nel used p. pan longer in
be mize
6
m Solar ations
view of .
ntation Site 2012
Page 8 of 12

PhotogrApache P5-Year In Photogra
Wetlan
Descriptiongallon molalocated at thMolasses fropumped intotrailer-mounphotograph
Photogra
Wetlan
Description500-gallon mtrailer-mounmolasses fropermanent tto be pumpe250-gallon tright side of
raphic Dowder Sup
nspection,
aph No. 17
nds MolaTanks
n: Permanenasses storagehe Wetlands.om this tanko the 500-ganted tank shonumber 17.
aph No. 18
nds MolaTanks
n: Trailer-momolasses tannted tank traom the 5,000tank in photoed into the ptotes, shownf the photogr
Documenperfund SJune 12, 2
7
asses
nt 5,000- tank .
k is allon own in
8
asses
ounted nk. This nsports 0-gallon ograph 12 ortable
n on the raph.
ntation Site 2012
Page 9 of 12

PhotogrApache P5-Year In Photogra
Wetlan(Fl
Descriptionmeasure efflthe Wetlandrenewable ecell. Monitassociated pequipment wgood shape condition.
Photogra
“Po
DescriptionThe row of binto the sideas the “Powdsticks were aApache Powearly1920’s.an explosionone building
raphic Dowder Sup
nspection,
aph No. 19
nds Equipow Meter
n: Flow Metefluent dischads is poweredenergy from tor wells and
pump-and-trewere found tand in work
aph No. 20
owder Lin
n: buildings shos of the hills der Line”. Dyassembled in
wder beginnin The idea wa
n occurred, ong would be.
Documenperfund SJune 12, 2
9
pment r)
er to rge from d by a solar d eat to be in king
0
e”
own built is known
ynamite them for
ng in the as that if nly the
ntation Site 2012
Page 10 of 12
2

PhotogrApache P5-Year In Photogra
GreenX
Descriptionincorporatedtheir main oshows the uappropriate
Photogra
GreenSo
Descriptionsolar canopymain adminissolar panels energy and othe building.
raphic Dowder Sup
nspection,
aph No. 22
n RemediaXeriscape
n: ANPI hasd “Green” deoffices. Thisse of Xeriscfor the deser
aph No. 23
n Remediaolar Powe
n: ANPI cons over the fron
stration buildinprovide renew
off-sets power
Documenperfund SJune 12, 2
2
ation e
s esign into s photo ape, rt climate.
3
ation er
structed a nt of the ng. The wable r needs for
ntation Site 2012
Page 11 of 12
2

PhotogrApache P5-Year In Photogra
GreenWate
Descriptiongutters placethe main offharvest rain used to fill ton an outsidused to main
raphic Dowder Sup
nspection,
aph No. 24
n Remediaer Harvest
n: ANPI utiled along thefice buildingwater. This
the fountain de patio. Wantain the Xe
Documenperfund SJune 12, 2
4
ation ting
lizes roofs of
gs to s water is located
ater is also riscape.
ntation Site 2012
Page 12 of 12
2

Apache Powder Superfund Site Third Five-Year Report
Appendix D Technical Assessment Survey Forms

Apache 2012 Five-Year Review Technical Interview Questionnaire Interviewee/Title: Jeff Bauer / EHS Specialist Organization/Company/Agency: Apache Nitrogen Products, Inc. Address/Phone/E-Mail: PO Box 700, Benson, AZ 85602/ 520.720.2177 Site Name: Apache Powder Superfund Site, Cochise County, AZ EPA ID No.: AZD008399263
Date Interview Questionnaire Completed: 6/12/12 1. What is your current role as it relates to the site? What is your overall impression of the work conducted at the site to date? (general sentiment) Response: Superfund operations: Impressed and proud to work with the wetlands along with
all other superfund activities and reporting.
2. Have any problems been encountered which required, or will require changes to this remedial design or ROD? Response: No.
3. What does the monitoring data show? Are there any trends that show contaminant levels are decreasing? Have any new or emerging COCs been identified? If so, have they impacted the effectiveness of the remedy? Response: Overall COC’s are decreasing.
4. Have there been routine communications or activities (site visits, inspections, reporting activities, etc) conducted by your office regarding the site? If so please give purpose and results. Response: 2 meetings for 2012 with ANPI, EPA & ADEQ, emails going over the 5 year
review. Technical meeting on 6/12/12 along with the 5 year review checklist.

5. Would you say that O&M and/or sampling efforts have been optimized? Please describe how improved efficiency has or has not occurred. Response: O&M acceptable due to COC’s are general decreasing. De-water the perched zone.
6. Are you aware of any institutional controls, site access controls, new ordinances in place, changes in actual or projected land use, complaints being filed or unusual activities at the site? If so, please describe in detail. Response: No
7. Do you have any comments, suggestions, or recommendations regarding the site? Response: ANPI has a new General Manager

Apache 2012 Five-Year Review Technical Interview Questionnaire Interviewee/Title: Patricia A. Clymer Organization/Company/Agency: ITSI Gilbane Company Address/Phone/E-Mail: 1501 W. Fountainhead Parkway, Tempe AZ 85282 520-977-7794 / [email protected] Site Name: Apache Powder Superfund Site, Cochise County, AZ EPA ID No.: AZD008399263
Date Interview Questionnaire Completed: August 1, 2012 1. What is your current role as it relates to the site? What is your overall impression of the work conducted at the site to date? (general sentiment) Response: I am the Project Manager for ITSI Gilbane, supporting EPA at the Site. I believe that
ANPI has done an excellent job with the site. They have shown creativity in their work with
their implementation of the remedies and are dedicated to continuing to improve.
2. Have any problems been encountered which required, or will require changes to this remedial design or ROD? Response:
The Perched Zone collection system is not adequate for maximizing the extraction and
evaporation of the perched groundwater. The system is limited by an insufficient
quantity and type (shallow pan-type vessels versus deep-pool type vessels).
Consideration should be given to expanding and optimizing the system.
Consideration has been given to accelerating the cleanup time for the Molinos Creek
Subaquifer (MCA) in the Southern Area. 3. What does the monitoring data show? Are there any trends that show contaminant levels are decreasing? Have any new or emerging COCs been identified? If so, have they impacted the effectiveness of the remedy? Response: Southern Area Groudwater
In the perched zone, both perchlorate and nitrate concentrations have increased over the
last several years. The explanation for these increasing concentrations has been
explained as a stratification process in which high concentrations of nitrate and
perchlorate collect at the bottom of the perched aquifer as it is dewatered and cleaner

recharge water collects nearer the surface of the aquifer. A new remedial action objective
for this area may be needed. In the Molinos Creek Sub-Aquifer (MCA) the concentrations of nitrate and perchlorate
have not decreased as should be the case with MNA. Instead, concentrations have
remained stable in some monitor wells and actually increased in others. The water level
is also declining in this area. Though there may be an explanation for the increase in
contaminant concentrations, other alternatives should be considered to enhance the MNA
remedy.
Monitoring results of the Shallow Aquifer near San Pedro River has remained either non-
detect or at levels below the MCL for perchlorate and nitrate.
Northern Area Remediation System (NARS) Monitoring results for the groundwater remedy (wetlands/pump and treat) indicates that
the system is very effective and performing well.
4. Have there been routine communications or activities (site visits, inspections, reporting activities, etc) conducted by your office regarding the site? If so please give purpose and results. Response: In support of EPA, I have attended annual technical meetings, reviewed site
documents, and monitoring data, and have been responsible for conducting annual site
inspections for the former ponds and the wetlands. No problems were identified during the
inspections with the exception of minor maintenance regarding vegetative growth at the wetlands
and some occasional erosion around the former ponds. All of the issues were dealt with in a
timely fashion.
5. Would you say that O&M and/or sampling efforts have been optimized? Please describe how improved efficiency has or has not occurred. Response: I believe that O&M and sampling has been efficient.
6. Are you aware of any institutional controls, site access controls, and new ordinances in place, changes in actual or projected land use, complaints being filed or unusual activities at the site? If so, please describe in detail. Response: No. 7. Do you have any comments, suggestions, or recommendations regarding the site? Response:
The SEW-1 monitoring well network might benefit from the installation of an additional
well placed south-east of SEW-1 and west of the San Pedro River that would ensure the
contamination from the “hot-spot” area upgradient of the SEW-1 is being captured by
SEW-1 and not discharging to the San Pedro River.

Apache 2012 Five-Year Review Technical Interview Questionnaire Interviewee/Title: Mellissa Himebauch EHS Intern Organization/Company/Agency: Apache Nitrogen Products, Inc. Address/Phone/E-Mail: 520-975-9438 [email protected] Site Name: Apache Powder Superfund Site, Cochise County, AZ EPA ID No.: AZD008399263
Date Interview Questionnaire Completed: 06/14/2012 1. What is your current role as it relates to the site? What is your overall impression of the work conducted at the site to date? (general sentiment) Response: My current role is as an Environmental Intern. I feel that the company is trying very
hard to be environmentally responsible. They have been making huge efforts with the help of
new management to clean up and manage areas that have been of concern.
2. Have any problems been encountered which required, or will require changes to this remedial design or ROD? Response: As I am an intern that has only been with the company for 3 weeks I am unsure at
this point that any changes need to be made.
3. What does the monitoring data show? Are there any trends that show contaminant levels are decreasing? Have any new or emerging COCs been identified? If so, have they impacted the effectiveness of the remedy? Response: The only area that I have had any experience with is the Wetlands area. Looking at
the history of the reports I can see a downward trend in the level of Nitrates coming into the
wetlands from just 2 years ago. I can also see that the wetlands are functioning very well and the
levels drop dramatically after the first couple ponds. I am not aware of any new or emerging
COC’s.

4. Have there been routine communications or activities (site visits, inspections, reporting activities, etc) conducted by your office regarding the site? If so please give purpose and results. Response: As a department we visit the site on an almost daily basis to ensure that everything is
functioning well. We monitor and document the Nitrate levels, water levels, and temperatures in
house as well as have Hargis & Associates assist with that as required. Weekly reports on the
Nitrate levels from the wetlands are sent to Hargis for their review.
5. Would you say that O&M and/or sampling efforts have been optimized? Please describe how improved efficiency has or has not occurred. Response: I feel that the efforts Apache makes to monitor and sample the wetlands area is
optimized.
6. Are you aware of any institutional controls, site access controls, new ordinances in place, changes in actual or projected land use, complaints being filed or unusual activities at the site? If so, please describe in detail. Response: As a new Intern I am not aware of any at this point.
7. Do you have any comments, suggestions, or recommendations regarding the site? Response: I think that this is a really great site and with the new proactive management the
company will be able to move in a positive direction in regards to any environmental concerns.

Apache 2012 Five-Year Review Technical Interview Questionnaire Interviewee/Title: Leo S. Leonhart, PhD, RG, Principal Hydrogeologist, Project Director Organization/Company/Agency: Hargis + Associates, Inc. Address/Phone/E-Mail: 1820 E. River Road, Suite 220, Tucson, Arizona 85718 520-881-7300 x201 [email protected] Site Name: Apache Powder Superfund Site, Cochise County, AZ EPA ID No.: AZD008399263 Date Interview Questionnaire Completed: June 9, 2012 1. What is your current role as it relates to the site? What is your overall impression of the work conducted at the site to date? (general sentiment) Response: I am the project director for Hargis + Associates, Inc., the primary environmental contractor for ANPI over the past 23 years. My overall impression of the work to date is that it represents an impressive achievement over a formidable environmental challenge that developed at the site over its early years of operation. I am proud to have assisted in this project. 2. Have any problems been encountered which required, or will require changes to this remedial design or ROD? Response: The rate of progress towards the remedial goals in the Southern Area (MCA) groundwater cleanup indicates a very long timeframe. Remedy enhancements are presently under consideration. 3. What does the monitoring data show? Are there any trends that show contaminant levels are decreasing? Have any new or emerging COCs been identified? If so, have they impacted the effectiveness of the remedy? Response: As indicated above, the progress toward achieve the goal of dewatering the MCA is slow and projected timeframe is long. Monitoring data at monitor well MW-21 indicate increasing concentration trends, however, this does not indicate increasing mass into the closed basin, but rather a limitation in the ability to quantify the vertical distribution of COCs. At the same time, it is noted that, while the nitrate-N, is increasing, at this well, the perchlorate trend has somewhat stabilized. 4. Have there been routine communications or activities (site visits, inspections, reporting activities, etc) conducted by your office regarding the site? If so please give purpose and results.

Response: H+A, as ANPI’s environmental contractor, conducts quarterly groundwater monitoring and NARS monitoring at the site. Additionally, H+A performs an annual inspection of the pond covers. There are occasional meetings and frequent phone conversations with ANPI environmental staff. NARS operational data are reviewed weekly and, if necessary, discussed with the staff (e.g., trends, spikes, maintenance, upsets, etc.). Significant information resulting from these activities is summarized in the Annual Report, as well as monthlies and quarterlies submitted to EPA & ADEQ. 5. Would you say that O&M and/or sampling efforts have been optimized? Please describe how improved efficiency has or has not occurred. Response: I believe the O&M activities are constantly under review and optimization is under consideration. For example, issues with NARS operations are often raised by ANPI personnel. Review of weekly reports are reviewed by H+A & Dr. Gearheart, noting any particular problems or opportunities for improvement. H+A’s quarterly monitoring provides oversight of ANPI’s personnel, etc. If any component of the project is presently not optimized, it soon will be. 6. Are you aware of any institutional controls, site access controls, new ordinances in place, changes in actual or projected land use, complaints being filed or unusual activities at the site? If so, please describe in detail. Response: I am not aware of any such issues. 7. Do you have any comments, suggestions, or recommendations regarding the site? Response: ANPI is actively engaged in a multi-year program of site improvement and modernization. This work will improve both the operations and property. The Agency should consider these plans as they move forward as an opportunity to enhance environmental quality in various innovative ways.

Apache 2012 Five-Year Review Technical Interview Questionnaire Interviewee/Title: Eric Roudebush, PE, Project Manager Organization/Company/Agency: Hargis + Associates, Inc. Address/Phone/E-Mail: 1820 E. River Road, Suite 220, Tucson, AZ 85718 520-881-7300 Ext 204 [email protected] Site Name: Apache Powder Superfund Site, Cochise County, AZ EPA ID No.: AZD008399263
Date Interview Questionnaire Completed: July, 31, 2012 1. What is your current role as it relates to the site? What is your overall impression of the work conducted at the site to date? (general sentiment) Response: I am the Apache Nitrogen Products, Inc. (ANPI) project manager for Hargis + Associates, Inc. (H+A). My impression of the work conducted at the site to date is that the work has been very effective in investigating, monitoring, and remediating the site COCs. 2. Have any problems been encountered which required, or will require changes to this remedial design or ROD? Response: No, although remedy enhancements are being evaluated. 3. What does the monitoring data show? Are there any trends that show contaminant levels are decreasing? Have any new or emerging COCs been identified? If so, have they impacted the effectiveness of the remedy? Response: In general, the Northern Area groundwater quality trends show decreasing concentrations. In the Southern Area MCA, the groundwater level data show a decreasing trend and the water quality data show an increasing trend. No new or emerging COCs have been identified.

4. Have there been routine communications or activities (site visits, inspections, reporting activities, etc) conducted by your office regarding the site? If so please give purpose and results. Response: H+A conducts quarterly groundwater and NARS monitoring. H+A also conducts annual inspections of the pond covers. The monitoring results are presented to EPA and ADEQ in monthly, quarterly, and annual reports. 5. Would you say that O&M and/or sampling efforts have been optimized? Please describe how improved efficiency has or has not occurred. Response: I believe the O&M and sampling efforts have been optimized. However, additional optimization efforts will be considered as necessary.
6. Are you aware of any institutional controls, site access controls, new ordinances in place, changes in actual or projected land use, complaints being filed or unusual activities at the site? If so, please describe in detail. Response: I am not aware of any such issues. 7. Do you have any comments, suggestions, or recommendations regarding the site? Response: A great deal of progress has occurred since ANPI was listed as a Superfund site. The ANPI management is very proactive in the site remediation process.

Apache 2012 Five-Year Review Technical Interview Questionnaire Interviewee/Title: Robert Walllin, Hydrologist/Project Manager Organization/Company/Agency: Arizona Department of Environmental Quality Address/Phone/E-Mail: 400 W. Congress St., Ste 433, Tucson, AZ 85701 (520) 628-6743, [email protected] Site Name: Apache Powder Superfund Site, Cochise County, AZ EPA ID No.: AZD008399263
Date Interview Questionnaire Completed: 6/12/12 1. What is your current role as it relates to the site? What is your overall impression of the work conducted at the site to date? (general sentiment) Role: Arizona Department of Environmental Quality Project Manager Response: The remedies currently in place are working. Levels of groundwater contamination
are gradually decreasing. Continued monitoring will be required for many years. Enhanced
remedies proposed by ANPI would help accelerate the process, and would be acceptable to
ADEQ.
2. Have any problems been encountered which required, or will require changes to this remedial design or ROD? Response: Current remedies are working. Enhanced remedies would accelerate the process.
3. What does the monitoring data show? Are there any trends that show contaminant levels are decreasing? Have any new or emerging COCs been identified? If so, have they impacted the effectiveness of the remedy? Response: Contaminant levels are decreasing except in one area where the concentration of
contaminants due to dewatering. However, these increases can be explained. An enhanced
remedy proposed for this area will help to remove contamination.
4. Have there been routine communications or activities (site visits, inspections, reporting activities, etc) conducted by your office regarding the site? If so please give purpose and results. Response: There have been routine communications between ADEQ, EPA, ANPI and
contractors regarding reporting and commentary on monitoring reports. ANPI is effectively
maintaining its remedy operations. Site visits have not been necessary.
5. Would you say that O&M and/or sampling efforts have been optimized? Please describe how improved efficiency has or has not occurred. Response: The Annual Monitoring Reports demonstrate that O&M of remedies is effective and
sampling has been optimized. Recommendations made in Annual Monitoring Reports for
improved monitoring strategies have been implemented to improve efficiency.
6. Are you aware of any institutional controls, site access controls, new ordinances in place, changes in actual or projected land use, complaints being filed or unusual activities at the site? If so, please describe in detail. Response: There have been no new institutional controls, ordinances, land uses or complaints.
ANPI has put up new fencing to enhance security at the site.
7. Do you have any comments, suggestions, or recommendations regarding the site? Response: ADEQ will review and comment on proposals for enhanced remedy pilot tests.