Embed Size (px)
Citation preview

THIRD QUARTER 2017INVESTOR CONFERENCE CALL
November 9, 2017

1
SAFE HARBOR STATEMENT
This presentation contains “forward-looking” statements within the meaning of Section 27A of theSecurities Act of 1933, as amended, and Section 21E of the Securities Exchange Act of 1934, as amended,that are based on our management’s beliefs and assumptions and on information currently available tomanagement. These forward-looking statements include, without limitation, statements regarding ourindustry, business strategy, plans, goals and expectations concerning our market position, productexpansion, future operations, margins, profitability, future efficiencies, and other financial and operatinginformation. When used in this discussion, the words “may,” “believes,” “intends,” “seeks,” “anticipates,”“plans,” “estimates,” “expects,” “should,” “assumes,” “continues,” “potential,” “could,” “will,” “future” and thenegative of these or similar terms and phrases are intended to identify forward-looking statements.
Forward-looking statements involve known and unknown risks, uncertainties, inherent risks and otherfactors that may cause our actual results, performance or achievements to be materially different from anyfuture results, performance or achievements expressed or implied by the forward-looking statements.Forward-looking statements represent our management’s beliefs and assumptions only as of the date ofthis presentation. Our actual future results may be materially different from what we expect due to factorslargely outside our control, including the occurrence of severe weather conditions and other catastrophes,the cyclical nature of the insurance industry, future actions by regulators, our ability to obtain reinsurancecoverage at reasonable rates and the effects of competition. These and other risks and uncertaintiesassociated with our business are described under the heading “Risk Factors” in our most recently filedAnnual Report on Form 10-K, which should be read in conjunction with this presentation. The companyand subsidiaries operate in a dynamic business environment, and therefore the risks identified are notmeant to be exhaustive. Risk factors change and new risks emerge frequently. Except as required by law,we assume no obligation to update these forward-looking statements publicly, or to update the reasonsactual results could differ materially from those anticipated in the forward-looking statements, even if newinformation becomes available in the future.
1

2
Raised $30 million in sub debt (to pay for ADC and remove senior lender facility)
Executed an Adverse Development Cover for accident years 2005-2016
Strengthened 2017 reserves and announced storm losses for Harvey and Irma
Completed private placement of $5 million in common stock with management / Board
Poised to generate operating profits in Q4 and beyond
CONIFER: STATE OF THE BUSINESS
3
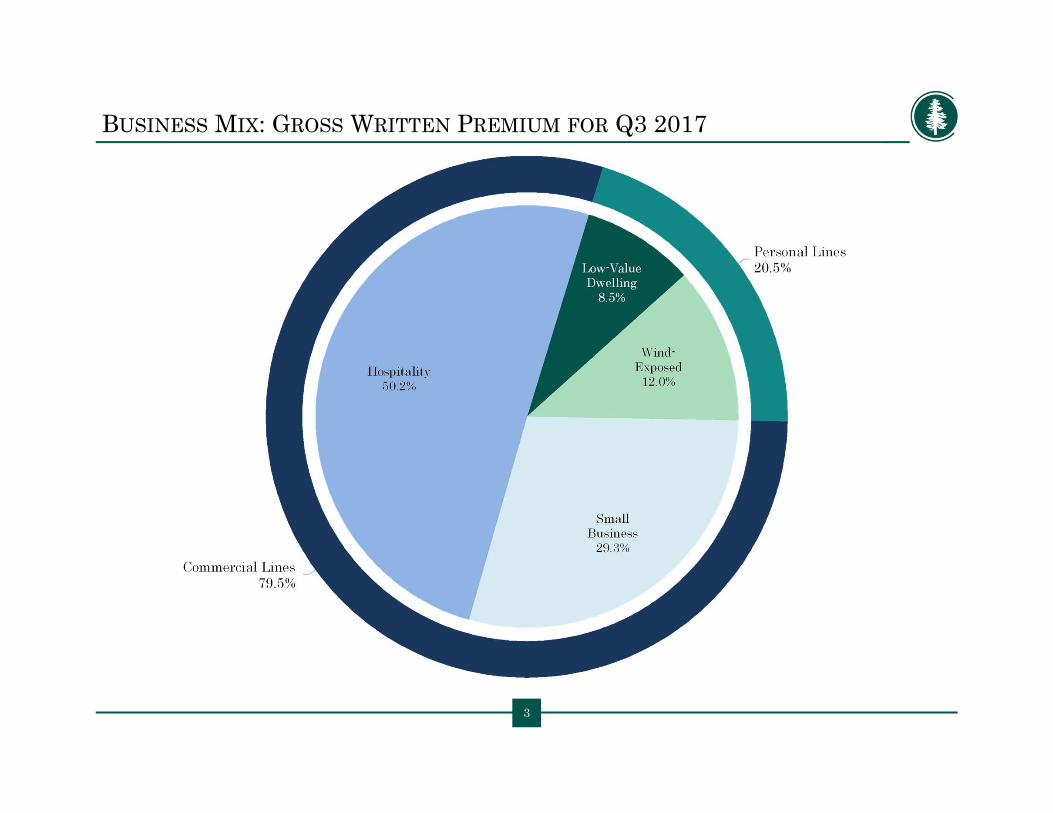
BUSINESS MIX: GROSS WRITTEN PREMIUM FOR Q3 2017
3

$14.8
$8.7
$0
$5
$10
$15
$20
$25
Q3 2017
MIL
LIO
NS
Small Business
Hospitality
COMMERCIAL LINES OVERVIEW
• Commercial Lines represented roughly 80% of the premiums written in the third quarter
• Quarter over quarter, Commercial gross written premiums were up 13% in Q3 2017 • The premium increase was mainly led by a 25% increase in Hospitality business in the third quarter• Conifer continues to write Commercial Lines in all 50 states
4
GROSS WRITTEN PREMIUM
As of September 30, 2017Top Five States
GROSS WRITTEN PREMIUM$ in thousands
Florida $ 15,105 22.8%Michigan 13,418 20.3%Pennsylvania 6,309 9.5%Texas 4,289 6.5%Ohio 3,124 4.7%All Other 24,014 36.2%Total $ 66,258 100.0%
$11.9
$8.9
$0
$5
$10
$15
$20
$25
Q3 2016
MIL
LIO
NS
Small Business
Hospitality
$5.1
$3.6
$2.6
$2.5
$0
$1
$2
$3
$4
$5
$6
$7
$8
$9
Q3 2016 Q3 2017
MIL
LIO
NS
Wind-Exposed Low-Value Dwelling
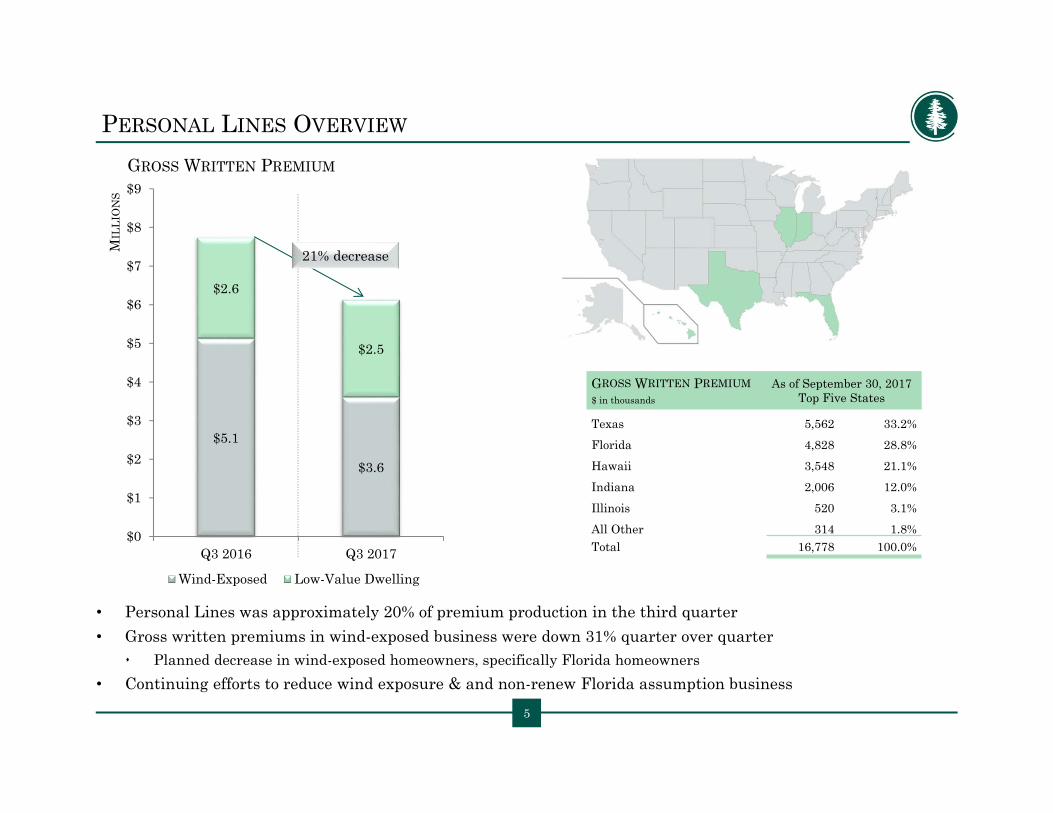
• Personal Lines was approximately 20% of premium production in the third quarter• Gross written premiums in wind-exposed business were down 31% quarter over quarter
Planned decrease in wind-exposed homeowners, specifically Florida homeowners• Continuing efforts to reduce wind exposure & and non-renew Florida assumption business
PERSONAL LINES OVERVIEW
GROSS WRITTEN PREMIUM$ in thousands
As of September 30, 2017Top Five States
Texas 5,562 33.2%Florida 4,828 28.8%Hawaii 3,548 21.1%Indiana 2,006 12.0%Illinois 520 3.1%All Other 314 1.8%Total 16,778 100.0%
5
GROSS WRITTEN PREMIUM
21% decrease
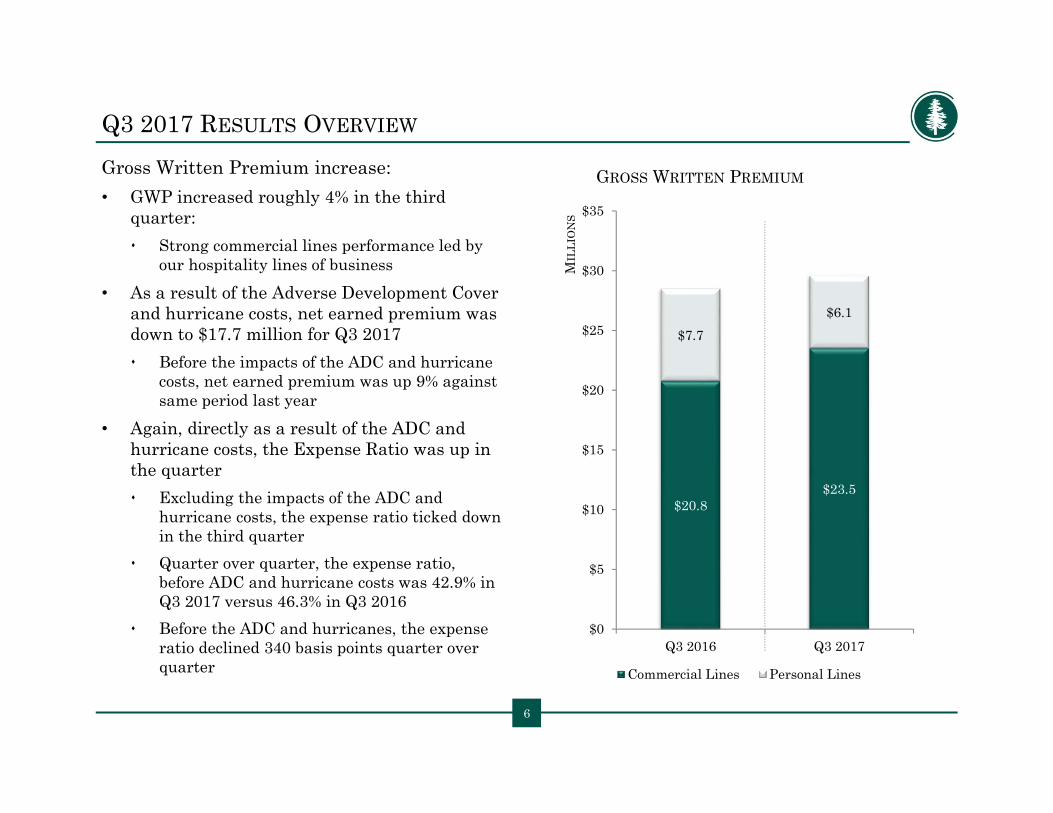
$20.8$23.5
$7.7$6.1
$0
$5
$10
$15
$20
$25
$30
$35
Q3 2016 Q3 2017
MIL
LIO
NS
Commercial Lines Personal Lines
Q3 2017 RESULTS OVERVIEW
Gross Written Premium increase:• GWP increased roughly 4% in the third
quarter: Strong commercial lines performance led by
our hospitality lines of business• As a result of the Adverse Development Cover
and hurricane costs, net earned premium was down to $17.7 million for Q3 2017 Before the impacts of the ADC and hurricane
costs, net earned premium was up 9% against same period last year
• Again, directly as a result of the ADC and hurricane costs, the Expense Ratio was up in the quarter Excluding the impacts of the ADC and
hurricane costs, the expense ratio ticked down in the third quarter
Quarter over quarter, the expense ratio, before ADC and hurricane costs was 42.9% in Q3 2017 versus 46.3% in Q3 2016
Before the ADC and hurricanes, the expense ratio declined 340 basis points quarter over quarter
6
GROSS WRITTEN PREMIUM

7
48.0% 43.7%
61.9%59.1%
2016 2017*
Expense Ratio Loss Ratio
RESULTS OVERVIEW: COMBINED RATIO
• As a result of the Adverse Development Cover and hurricane costs in general, the Combined ratio spiked significantly in the third quarter and for the nine month period
• For the nine month period ended September 30, 2017, and excluding the affects of the ADC and hurricanes, the Accident Year loss ratio was 59%.
109.9%102.8%
*before impact of ADC and Q3 2017 hurricane activity
NINE MONTHS ENDED SEPTEMBER 30

8
54.1%
49.8%
48.0%
46.3%45.3% 44.9%
43.4%42.9%
Q4 2015 Q1 2016 Q2 2016 Q3 2016 Q4 2016 Q1 2017 Q2 2017 Q3 2017*
• Total expense ratio of 61.4% in Q3 2017 Before impact of ADC and hurricane activity, expense ratio was 42.9%
• Sequential expense ratio improvement quarter to quarter• 1120 basis point improvement overall since Q4 2015 • Continuing downward trend reflects commitment to streamlining expenses on all levels
RESULTS OVERVIEW: Q3 2017 EXPENSE RATIO
1120 basis point reduction
*before impact of ADC and Q3 2017 hurricane activity
9
BALANCE SHEET STRENGTHENING
ADVERSE DEVELOPMENT COVERAGE PURCHASE
COVERAGE AMOUNT: $19,500,000 xs $38,050,000 ($17,550,000 after co-participation)
COVERAGE YEARS: Accident dates from January 1, 2005 through December 31, 2016, paid subsequent to June 30, 2017
PREMIUM: $7,200,000
CO-PARTICIPATION: 10% of development retained
PROFIT SHARING: 35% profit commission paid at commutation
SWISS RE CLAIMS AUDIT
• Results of Swiss Re claims audit as part of ADC transaction: The Swiss Re team brought 7 auditors to review our claims department and files. In the follow up
meeting, they were universally positive about our claims operation, structure and management.They reviewed some 10% (roughly 300 files) of our total outstanding claims universe and were within $64,000 of our reserve estimates on those same 300 files that they reviewed. Our claims operation overall was one of the best that they had reviewed / audited.
CATASTROPHE LOSSES
• Current estimated total loss of $5.6 million associated with Hurricanes Harvey and Irma• Exposure to California wildfires limited to Quick Service Restaurant segment – no claims filed

10
CAPITAL RAISE: TRANSACTION SUMMARY
SUBORDINATED DEBT PLACEMENT
ISSUER: Conifer Holdings, Inc.
INVESTOR: Affiliates of Elanus Capital Management, LLC
DEAL SIZE: $30 million in subordinated notes
MATURITY: September 29, 2032 (15 Years)
ANNUAL INTEREST RATE: 8.0% Fixed
INTEREST DEFERRAL PERIOD: Up to four quarters
ISSUER CALL OPTIONS: 100% of par from July 31, 2018 through October 31, 2018; 105% of par after September 29, 2020
COVENANTS: Standard affirmative, financial, and negative covenants
COMMON EQUITY PRIVATE PLACEMENT
ISSUER: Conifer Holdings, Inc.
INVESTORS: Officers & Directors of the Company
DEAL SIZE: $5.0 million in common equity
ISSUE PRICE: $6.25 per share

11
Q3 2017 INCOME STATEMENT
• Company reported a net loss of $18.9 million, or $2.46 per share for Q3 2017• $1.80 per share for valuation allowance against deferred tax assets not reflected in book value• Book value per share of $6.16, or $52.5 million of shareholders’ equity
Three Months Ended September 30,
($ in thousands, except per share data) 2017 2016
Gross Written Premium $29,581 $28,497
Net Written Premium 18,395 24,634
Net Earned Premium 17,659 23,380
Net Income (Loss) (18,898) (1,475)
EPS, Basic and Diluted $(2.46) $(0.19)
Adjusted Operating Income (Loss) (19,054) (1,523)
Adjusted Operating Income (Loss) per share $(2.48) $(0.20)
11

12
CONSERVATIVE INVESTMENT STRATEGY
• Investment philosophy is to maintain a highly liquid portfolio of investment-grade fixed income securities
• Total cash & investment securities of $176.7M at September 30, 2017: Average duration: 2.9 years Average tax-equivalent yield: ~2.3% Average credit quality: AA
FIXED INCOME PORTFOLIOCREDIT RATING
$ in thousands September 30, 2017
Fair Value % of TotalAAA $ 32,299 26.5%
AA 48,875 40.1%
A 23,889 19.6%
BBB 14,748 12.1%
BB 731 0.6%
NR 1,341 1.1%
TOTALFIXED INCOMEINVESTMENTS
$ 121,883 100.0%
PORTFOLIO ALLOCATION
U.S. Government Obligations
7.0%
State & Local Governments
12.3%
Corporate Debt30.5%
Commercial Mortgage &
Asset-Backed Securities
42.5%
Equity Securities
7.7%


APPENDIX

15
FINANCIAL RESULTS: CHI CONSOLIDATED BALANCE SHEET
SUMMARY BALANCE SHEET$ in thousands
September 30, 2017 December 31, 2016
Cash and invested assets $ 176,701 $ 141,023
Reinsurance recoverables 15,772 7,498
Goodwill and intangible assets 992 1,007
Total assets $ 236,309 $ 203,701
Unpaid losses and loss adjustment expenses 82,756 54,651
Unearned premiums 55,669 58,126
Senior debt 29,010 17,750
Total Liabilities $ 183,815 $ 135,907
Total Shareholders' Equity $ 52,494 $ 67,794

16
SUMMARY FINANCIAL STATEMENTS: INCOME STATEMENT
16
OPERATING RESULTS Three Months Ended September 30,$ in thousands, except per share data 2017 2016Gross Written Premiums 29,581 28,497
Ceded Written Premiums 11,186 3,863
Net Written Premiums 18,395 24,634
Net Earned Premiums 17,659 23,380
Net investment income 768 560
Net realized investment gains 39 71Other gains 0 0
Other income 477 303
Total revenue 18,943 24,314
Losses and loss adjustment expenses, net 26,468 14,582
Policy acquisition costs 6,655 6,266
Operating expenses 4,474 4,710
Interest expense 303 168
Total expenses 37,900 25,726
Income (loss) before equity earnings and income taxes (18,957) (1,412)
Equity earnings (losses) of affiliates, net of tax (76) (47)
Income tax (benefit) expense (135) 16
Net income (loss) (18,898) (1,475)Earnings (loss) per common share, basic and diluted (2.46) (0.19)Weighted average common shares outstanding, basic and diluted 7,675,952 7,608,284

17
CAPITAL RAISE: SOURCES & USES
SOURCES AND USES
Sources:
Subordinated Debt $ 30,000
New Common Equity 5,000
Total Sources $ 35,000
Uses:Repayment of Current Debt $ 16,375
Estimated Transaction Costs 1,000
Contributions to Subsidiaries* to support ADC, reserve strengthening, hurricane losses and growth
17,300
CHI (holdco) 325
Total Uses $ 35,000