Embed Size (px)
Citation preview

Third Quarter 2012 Results
31 October 2012
© AB InBev 2012 – All rights reserved

© AB InBev 2012 – All rights reserved
Forward looking statements There are statements in this document, such as statements that include the words or phrases “outlook”, “will likely result”, “are expected to”, “will continue”, “is anticipated”, “estimate”, “project”, “may” or similar expressions that are “forward looking statements”. These statements are subject to certain risks and uncertainties. Actual results may differ materially from those suggested by these statements due to, among others, the risks or uncertainties listed below. These forward looking statements are not guarantees of future performance. Rather, they are based on current views and assumptions and involve known and unknown risks, uncertainties and other factors, many of which are outside our control and are difficult to predict, that may cause actual results or developments to differ materially from any future results or developments expressed or implied by the forward looking statements. Factors that could cause actual results to differ materially from those contemplated by the forward looking statements include, among others: local, regional, national and international economic conditions, including the risks of a global recession or a recession in one or more of our key markets, and the impact they may have on us and our customers and our assessment of that impact; limitations on our ability to contain costs and expenses; our expectations with respect to expansion, premium growth, accretion to reported earnings, working capital improvements and investment income or cash flow projections; our ability to continue to introduce competitive new products and services on a timely, cost-effective basis; the effects of competition and consolidation in the markets in which we operate, which may be influenced by regulation, deregulation or enforcement policies; changes in consumer spending; changes in applicable laws, regulations and taxes in jurisdictions in which we operate, including the laws and regulations governing our operations, changes to tax benefit programs as well as actions or decisions of courts and regulators; changes in pricing environments; volatility in the prices of raw materials, commodities, water and energy; difficulties in maintaining relationships with employees; the monetary and interest rate policies of central banks, in particular the European Central Bank, the Board of Governors of the U.S. Federal Reserve System, the Bank of England, Banco Central do Brasil and other central banks; continued availability of financing and our ability to achieve our targeted coverage and debt levels and terms, including the risk of constraints on financing in the event of a credit rating downgrade; financial risks, such as interest rate risk, foreign exchange rate risk, commodity risk, asset price risk, equity market risk, counterparty risk, sovereign risk, liquidity risk, inflation or deflation; regional or general changes in asset valuations; greater than expected costs (including taxes) and expenses; the risk of unexpected consequences resulting from acquisitions; tax consequences of restructuring and our ability to optimize our tax rate; the outcome of pending and future litigation and governmental proceedings; changes in government policies; natural and other disasters; any inability to economically hedge certain risks; inadequate impairment provisions and loss reserves; technological changes; and our success in managing the risks involved in the foregoing. Where mentioned in the presentation, all performance measures (EBITDA, EBIT, profit, tax rate, EPS) are presented on a “normalized” basis, which means they are presented before non-recurring items. Our statements regarding financial risks, including interest rate risk, foreign exchange rate risk, commodity risk, asset price risk, equity market risk, counterparty risk, sovereign risk, inflation and deflation, are subject to uncertainty. For example, certain market and financial risk disclosures are dependent on choices about key model characteristics and assumptions and are subject to various limitations. By their nature, certain of the market or financial risk disclosures are only estimates and, as a result, actual future gains and losses could differ materially from those that have been estimated. Without prejudice to our obligations under Belgian and US law in relation to disclosure and ongoing information, we undertake no obligation to update publicly or revise any forward looking statements, whether as a result of new information, future events or otherwise.
1

© AB InBev 2012 – All rights reserved
Summary
• Revenue +9.1% in 3Q12
• Revenue per hl +10.2% in 3Q12
US revenue per hl +5.7%
Brazil revenue per hl +18.3%
• Focus Brands +1.3% and Global Brands +5.8% in 3Q12
• EBITDA growth +10.6% in 3Q12 and + 6.9% in 9M12
• EBITDA margin +54 bps to 38.7% in 3Q12
• EPS +7.3% in 3Q12 to $1.17 and +21.6% in 9Q12 to $3.43
2 Note: EBITDA is presented on a “normalized” basis before non-recurring items.

© AB InBev 2012 – All rights reserved
Global Brands volume +5.8% in 3Q12
3

© AB InBev 2012 – All rights reserved
US results – 3Q12
• Industry STRs (Selling Day Adjusted)
-0.4% in 3Q12, + 0.3% in 9M12
Strongest performance since 2008
Weather in 1Q12, innovations
• AB InBev
STRs (Selling Day Adjusted) -0.9% in 3Q12
and -0.2% in 9M12
Marginal market share decline of
23 bps in 3Q12 and 26 bps in 9M12
Drivers of volume and share:
• Bud Light family, Michelob Ultra, Stella
Artois & Shock Top
Shipments +1.5% in 3Q12
Revenue / hl +5.7% (1)
• 200 bps of brand mix
4 (1) Revenue / hl figure refers to Beer only for the US © AB InBev 2012 – All rights reserved

© AB InBev 2012 – All rights reserved
Bud Light – NFL Season in full swing
5 © AB InBev 2012 – All rights reserved Note: US Volume growth and share figures are based on estimated STRs

© AB InBev 2012 – All rights reserved 6
• New 22oz bottle and 12oz bottle/18 pack
• Share of over 0.9% since launch
© AB InBev 2012 – All rights reserved
Bud Light Platinum

© AB InBev 2012 – All rights reserved
Bud Light Lime – Lime-A-Rita
7
• One of the hottest brands in beer
• 2nd fastest growing brand in the category
• +80% distribution in the off-trade, with estimated share in 3Q12 of over 0.4%
• Initial research shows +40% of volume being sourced from hard liquor and other beverages outside of beer
© AB InBev 2012 – All rights reserved 7

© AB InBev 2012 – All rights reserved 8 © AB InBev 2012 – All rights reserved
Budweiser activations in 3Q12

© AB InBev 2012 – All rights reserved
Budweiser – MLB and Folds of Honor
9 © AB InBev 2012 – All rights reserved

Michelob Ultra volumes +7.3% in 3Q12
Note: US Volume growth and share figures are based on estimated STRs © AB InBev 2012 – All rights reserved 10
+15 bps
of share in 3Q12

© AB InBev 2012 – All rights reserved Note: US Volume growth and share figures are based on estimated STRs
Best of Belgium promotions
High-end portfolio continues to thrive
11 11 © AB InBev 2012 – All rights reserved
Stella Artois volumes +17%
in 3Q12

© AB InBev 2012 – All rights reserved © AB InBev 2012 – All rights reserved Note: US Volume growth figures are based on estimated STRs
• 70% volume growth in 9M12
• End of The World Midnight Wheat joins 4 other line extensions
Shock Top – End of The World Midnight pack
12

© AB InBev 2012 – All rights reserved
Beer Brazil results – 3Q12
• Industry
Volumes +1.8% in 3Q12, +2.6% in 9M12
• AB InBev
Beer volumes +0.2% in 3Q12, and +2.3% in 9M12
Beer market share -110 bp due to timing of price increase
Beer revenue / hl growth of +18.3% (1)
Good growth in premium segment
13 (1) Revenue / hl figure applies to Beer Brazil

© AB InBev 2012 – All rights reserved © AB InBev 2012 – All rights reserved 14
Skol – New visual identity

© AB InBev 2012 – All rights reserved
4% 4%
20% 22%
25%
30%
46%
54%
Jan Feb Mar Apr May Jun Jul Aug
Source: Company data
Production footprint - 2012
300 ml Returnable Glass Bottle (RGB) opportunity
300ml Coverage (Off trade Key accounts)
São Paulo Guarulhos Jacareí
2011
2012
Rio de Janeiro Piraí 1 Piraí 2
15

© AB InBev 2012 – All rights reserved
Route to Market innovations
Micro Events Nosso Bar
Pit stops
16

© AB InBev 2012 – All rights reserved 17
Premium portfolio
© AB InBev 2012 – All rights reserved

© AB InBev 2012 – All rights reserved 18 © AB InBev 2012 – All rights reserved
The premium opportunity is driven mainly by international brands
Premium represents only ~5% of industry volumes
Weight within Premium volumes (%)
Source: Nielsen
Premium brand penetration (% of beer consumers)
Source: Ipsos
30% 99% 98%
91% 87% 76%
Domestic
2010 2009 2008
2%
2007
1%
2011
13% 9%
24%
International

© AB InBev 2012 – All rights reserved
China results – 3Q12
• Beer Volume +2.2%
Industry performance in regional strongholds impacted by adverse weather conditions
• Focus Brands +9.2% led by Budweiser and Harbin
• Market share growth of 20 bps YTD August (1)
• Revenue/hl +10.1% (2) mainly driven by brand mix, as we continue to focus on premiumization
19
(1) Internal estimate
(2) Revenue/hl calculation for Asia Pacific Zone

© AB InBev 2012 – All rights reserved 20
Budweiser Music Kingdom J-LO campaign highlights
Oct 20th
Kick-off
Nov 24th
Dream prize
Budweiser exclusive sponsor of
Jennifer Lopez concert in Shanghai
Activation and displays Digital
© AB InBev 2012 – All rights reserved

© AB InBev 2012 – All rights reserved
Harbin NBA sponsorship Season highlights
© AB InBev 2012 – All rights reserved
Packaging
Retail Campaign
• Online video
• TV commercials
• Billboards and transportation
• Print media
• Program sponsorship
21

© AB InBev 2012 – All rights reserved
Geographic expansion through Greenfields and M&A is a key enabler for growth
22
2012
Existing Wholly- Owned Plant
Core Market
Expansion Market
Greenfield Projects
M&A
Xinxiang (Province Henan)
• 2.5 Mio hl capacity • Opened in June 2012
Zhangzhou (Province Fujian)
• 2.5 Mio hl capacity • Opened in May 2012

© AB InBev 2012 – All rights reserved
Canada highlights – 3Q12
• Beer volumes -0.8% in 3Q12 and +0.7% in 9M12
• Strong volume and share performance by Bud Light
• Stable market share in 3Q12, and remains around 41% in 9M12 (1)
23 (1) Internal estimates
2012 Stella Artois World Draught Master Championship –
Montreal, Canada

© AB InBev 2012 – All rights reserved
Latin America South – 3Q12 highlights
• Total volumes -2.3%
Beer volumes flat
Non-beer -5.9%
• Argentina beer volumes -1.8% with estimated market share gains
• Strong performance by Stella Artois
• Launch of Quilmes Night and rollout of Quilmes 1890
• EBITDA +21.7% to a margin of 43.7%
24
% organic growth 3Q12 9M12
Beer volumes -2.3% 0.3%
Revenue 18.7% 19.6%
Revenue/hl 21.5% 19.2%
EBITDA 21.7% 18.4%
EBITDA margin 109 bp -42 bp
© AB InBev 2012 – All rights reserved
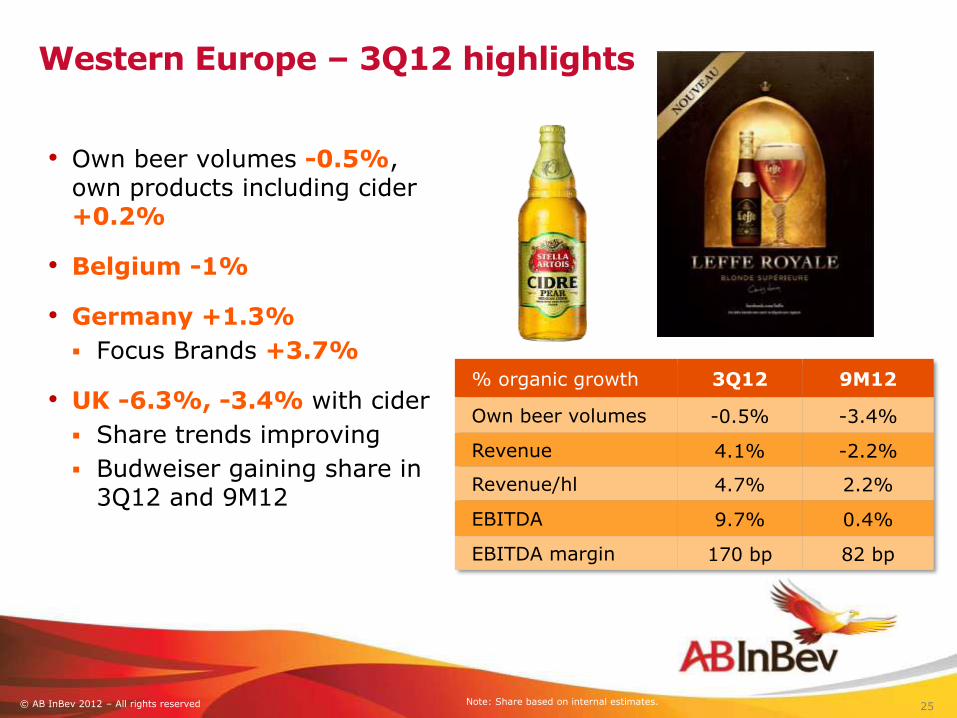
Western Europe – 3Q12 highlights
• Own beer volumes -0.5%, own products including cider +0.2%
• Belgium -1%
• Germany +1.3%
Focus Brands +3.7%
• UK -6.3%, -3.4% with cider
Share trends improving
Budweiser gaining share in 3Q12 and 9M12
25
% organic growth 3Q12 9M12
Own beer volumes -0.5% -3.4%
Revenue 4.1% -2.2%
Revenue/hl 4.7% 2.2%
EBITDA 9.7% 0.4%
EBITDA margin 170 bp 82 bp
Note: Share based on internal estimates.

© AB InBev 2012 – All rights reserved
Central & Eastern Europe – 3Q12 highlights
• Total volumes -13.5%
• Russia beer volumes -17.0%
Industry weakness & share loss
Bud reached market share of 1.3%, priced at premium
• Ukraine beer volumes -8.3%
Bud reached 1% market share a few months after launch
• EBITDA +41.3%, Revenue per hl +12.9%
26
% organic growth 3Q12 9M12
Beer volumes -13.5% -11.7%
Revenue -2.3% 0.9%
Revenue/hl 12.9% 14.2%
EBITDA 41.3% 29.5%
EBITDA margin 707 bp 378 bp

© AB InBev 2012 – All rights reserved
Russia update – 3Q12
Industry background
• Challenging regulatory environment contributing to a declining industry since 2008
• Competitor promotional activity
Action & Strategy
• “Fix the Mix”
Focus on Premiumization, especially Bud
Improve profitability of brand portfolio
• Restructuring
Improve cost base for the new reality
Closure of brewing and malting facilities in Kursk
27
© AB InBev 2012 – All rights reserved
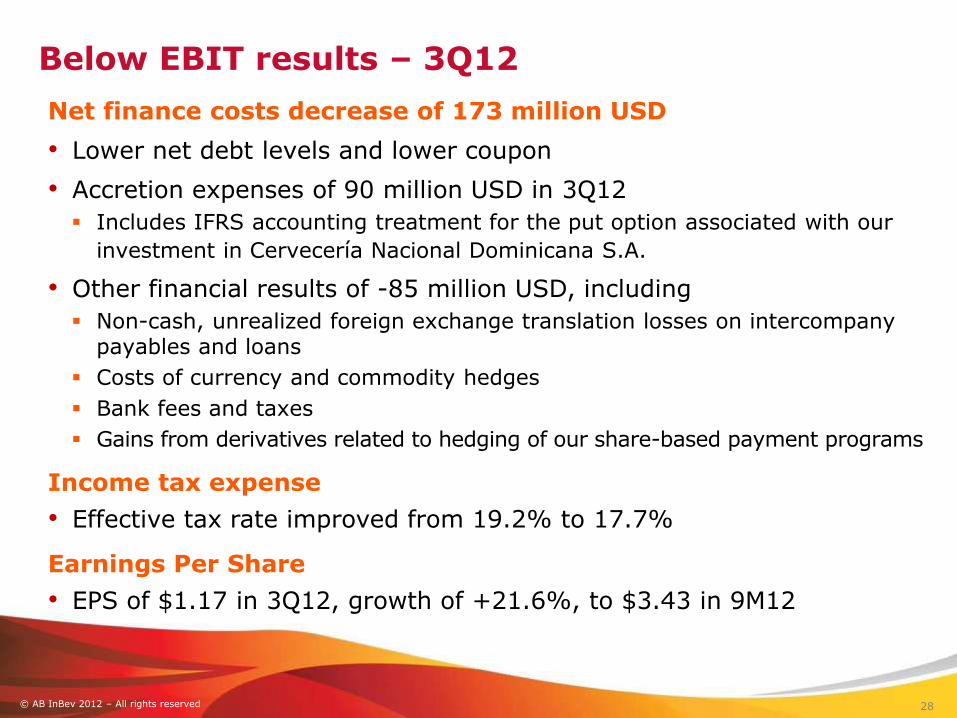
Below EBIT results – 3Q12
Net finance costs decrease of 173 million USD
• Lower net debt levels and lower coupon
• Accretion expenses of 90 million USD in 3Q12
Includes IFRS accounting treatment for the put option associated with our
investment in Cervecería Nacional Dominicana S.A.
• Other financial results of -85 million USD, including
Non-cash, unrealized foreign exchange translation losses on intercompany payables and loans
Costs of currency and commodity hedges
Bank fees and taxes
Gains from derivatives related to hedging of our share-based payment programs
Income tax expense
• Effective tax rate improved from 19.2% to 17.7%
Earnings Per Share
• EPS of $1.17 in 3Q12, growth of +21.6%, to $3.43 in 9M12
28

© AB InBev 2012 – All rights reserved
In summary
29
• Solid Revenue growth and Revenue per hl growth
• Strong Focus Brands and Global Brands volumes
• EBITDA growth +10.6% in 3Q12 and + 6.9% in 9M12
• EBITDA margin expansion

© AB InBev 2012 – All rights reserved 30