Embed Size (px)
Citation preview
Quarterly OverviewThird Quarter 2013
The forward-looking statements contained herein are based on Management’s current forecasts and outlook. For better illustration and decision-making, figures for Suramericana, SURA Asset Management and its subsidiaries are administrative rather than accountant, and therefore may differ from those presented to entities officers. Thus, Grupo de Inversiones Suramericana assumes no obligation to update or correct the information contained in this presentation.
Disclaimer
ContentCorporate Strategy
Financial Review
Annexes
Corporate Strategy
55
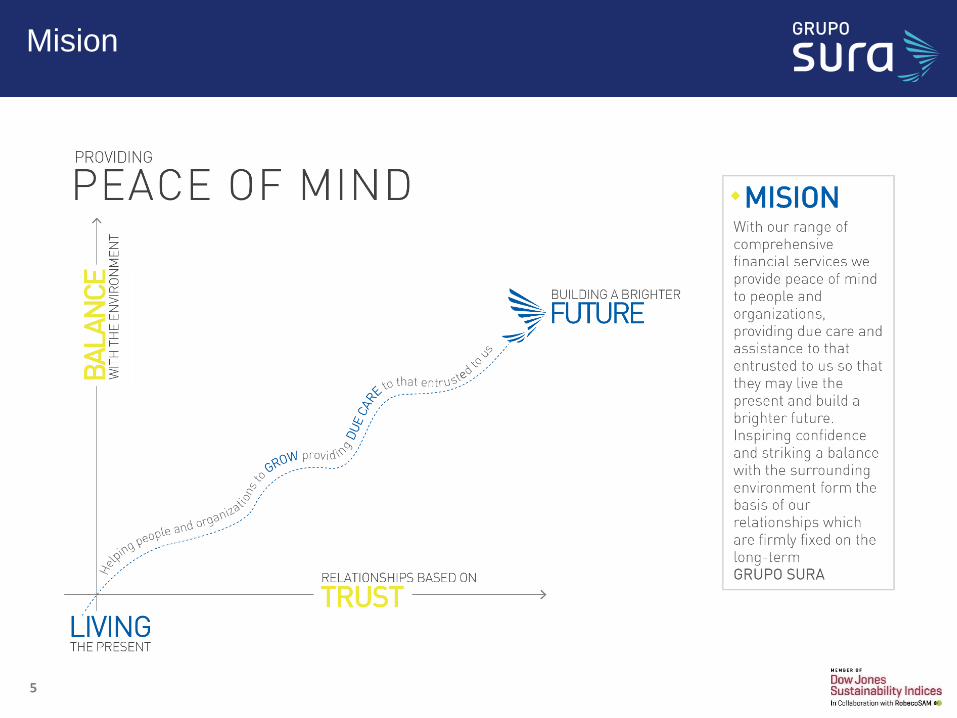
Mision
66
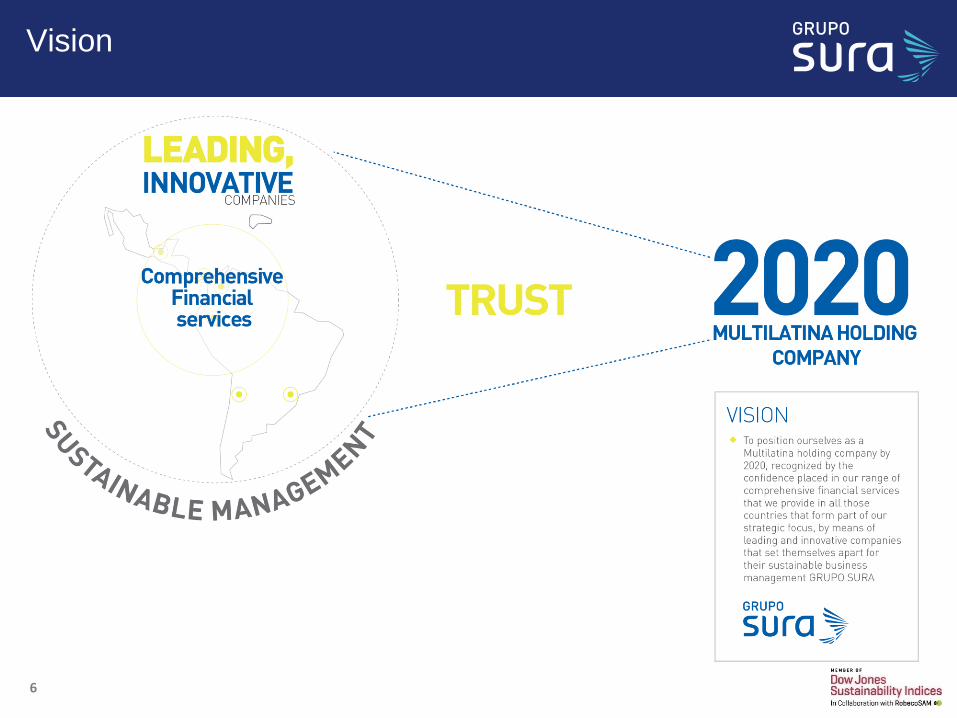
Vision

Financial Review
88
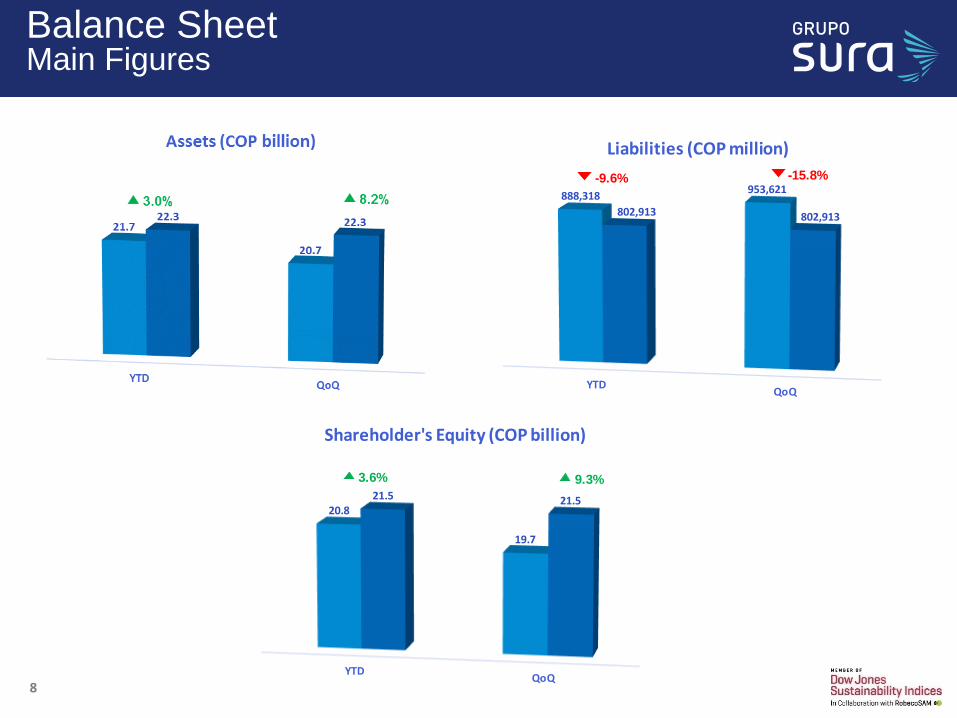
Balance SheetMain Figures
YTDQoQ
20.8
19.7
21.5 21.5
Shareholder's Equity (COP billion)
3.6% 9.3%
YTDQoQ
888,318953,621
802,913 802,913
Liabilities (COP million)
-9.6% -15.8%
99
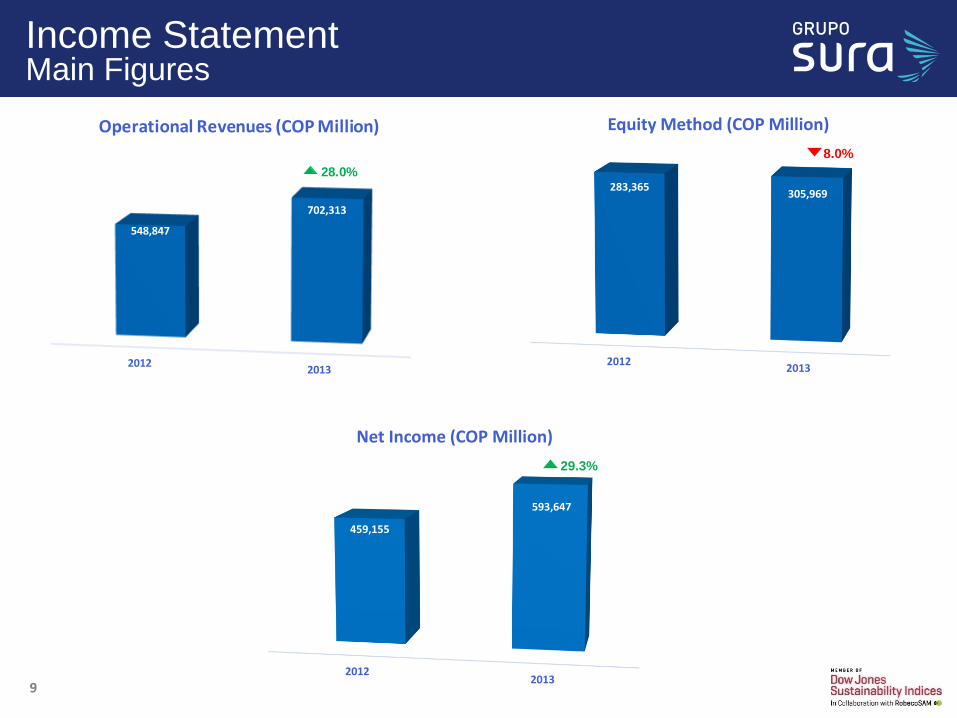
Income StatementMain Figures
9
20122013
283,365305,969
Equity Method (COP Million)
8.0%
20122013
548,847
702,313
Operational Revenues (COP Million)
28.0%
20122013
459,155
593,647
Net Income (COP Million)
29.3%
1010
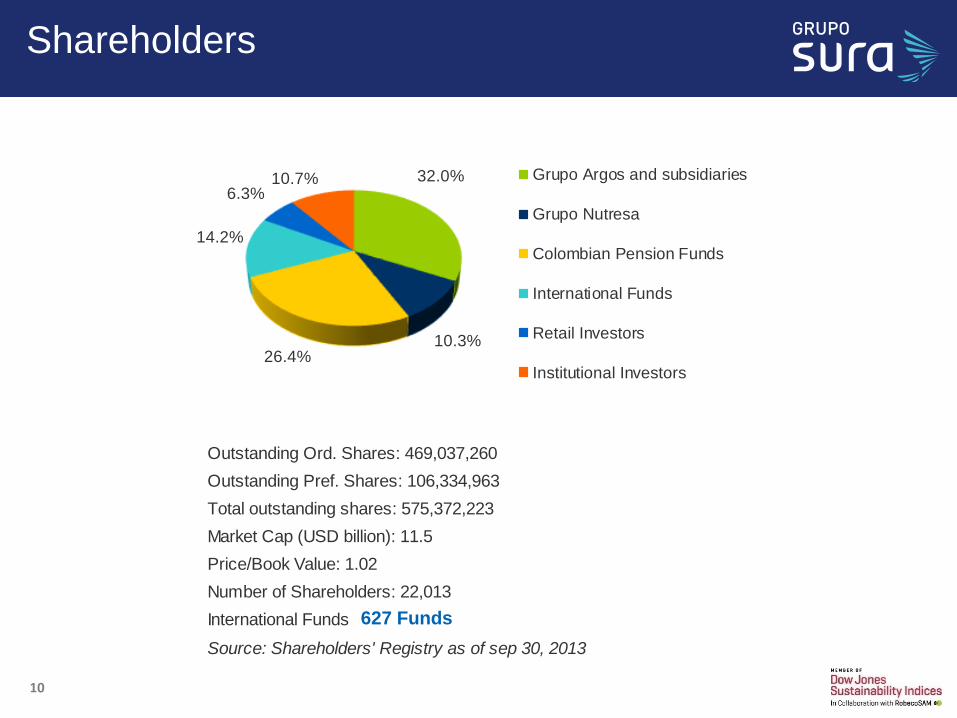
Shareholders
10
32.0%
10.3%26.4%
14.2%
6.3%10.7% Grupo Argos and subsidiaries
Grupo Nutresa
Colombian Pension Funds
International Funds
Retail Investors
Institutional Investors
Outstanding Ord. Shares: 469,037,260
Outstanding Pref. Shares: 106,334,963
Total outstanding shares: 575,372,223
Market Cap (USD billion): 11.5
Price/Book Value: 1.02
Number of Shareholders: 22,013
International Funds: 627
Source: Shareholders' Registry as of sep 30, 2013
627 Funds
1111
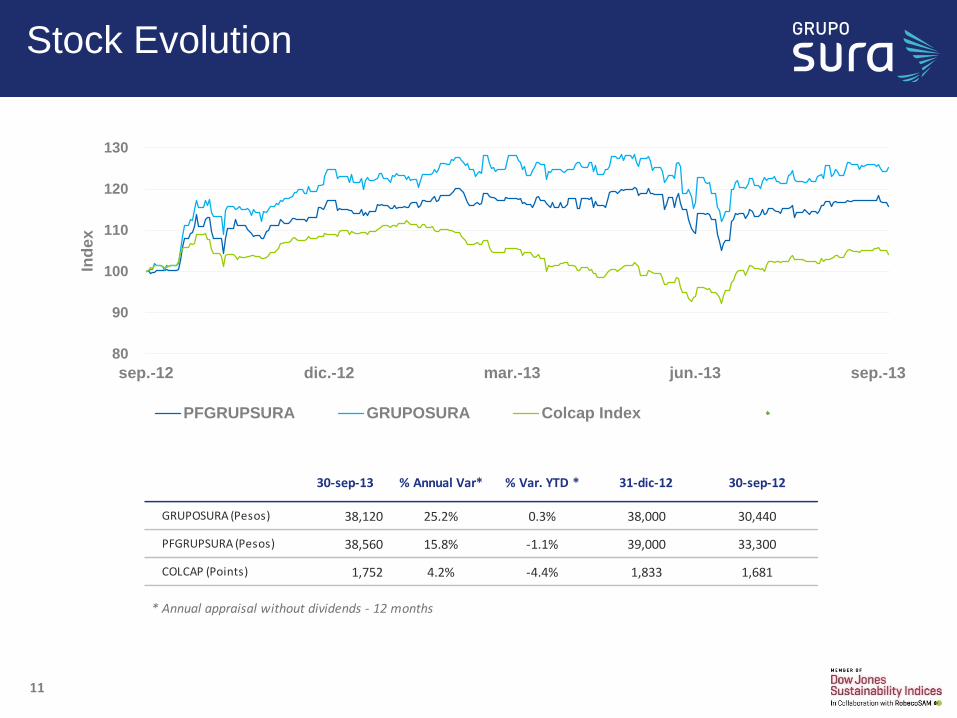
Stock Evolution
30-sep-13 % Annual Var* % Var. YTD * 31-dic-12 30-sep-12
GRUPOSURA (Pesos) 38,120 25.2% 0.3% 38,000 30,440
PFGRUPSURA (Pesos) 38,560 15.8% -1.1% 39,000 33,300
COLCAP (Points) 1,752 4.2% -4.4% 1,833 1,681
* Annual appraisal without dividends - 12 months
80
90
100
110
120
130
sep.-12 dic.-12 mar.-13 jun.-13 sep.-13
Ind
ex
PFGRUPSURA GRUPOSURA Colcap Index
1212
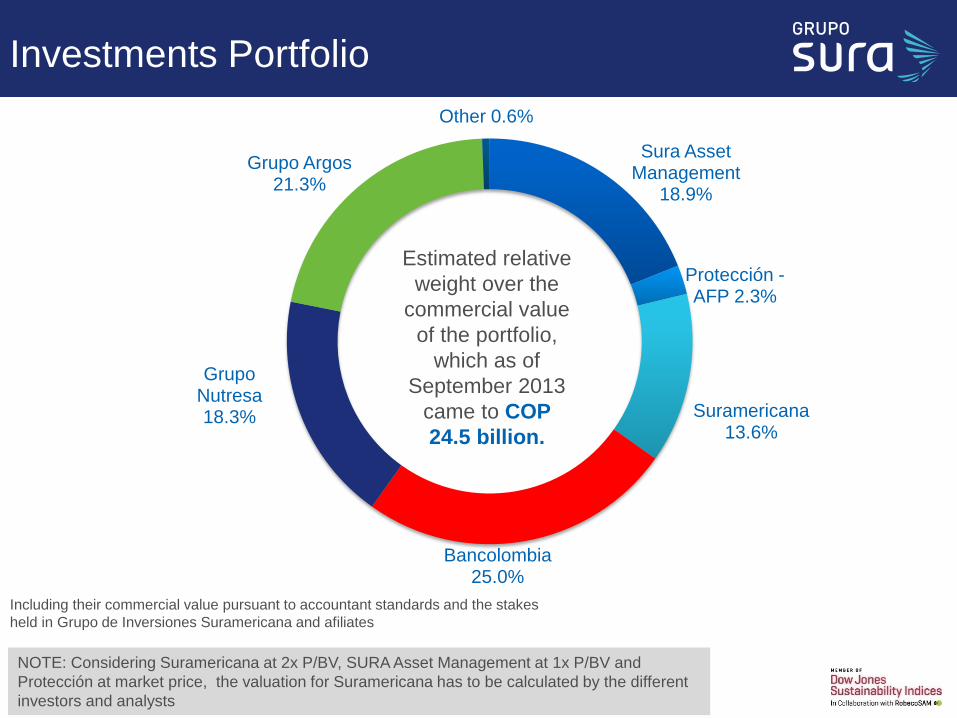
Sura Asset Management
18.9%
Protección -AFP 2.3%
Suramericana13.6%
Bancolombia25.0%
Grupo Nutresa18.3%
Grupo Argos21.3%
Other 0.6%
12
Investments Portfolio
Estimated relative
weight over the
commercial value
of the portfolio,
which as of
September 2013
came to COP
24.5 billion.
Including their commercial value pursuant to accountant standards and the stakes
held in Grupo de Inversiones Suramericana and afiliates
NOTE: Considering Suramericana at 2x P/BV, SURA Asset Management at 1x P/BV and
Protección at market price, the valuation for Suramericana has to be calculated by the different
investors and analysts
1313 13
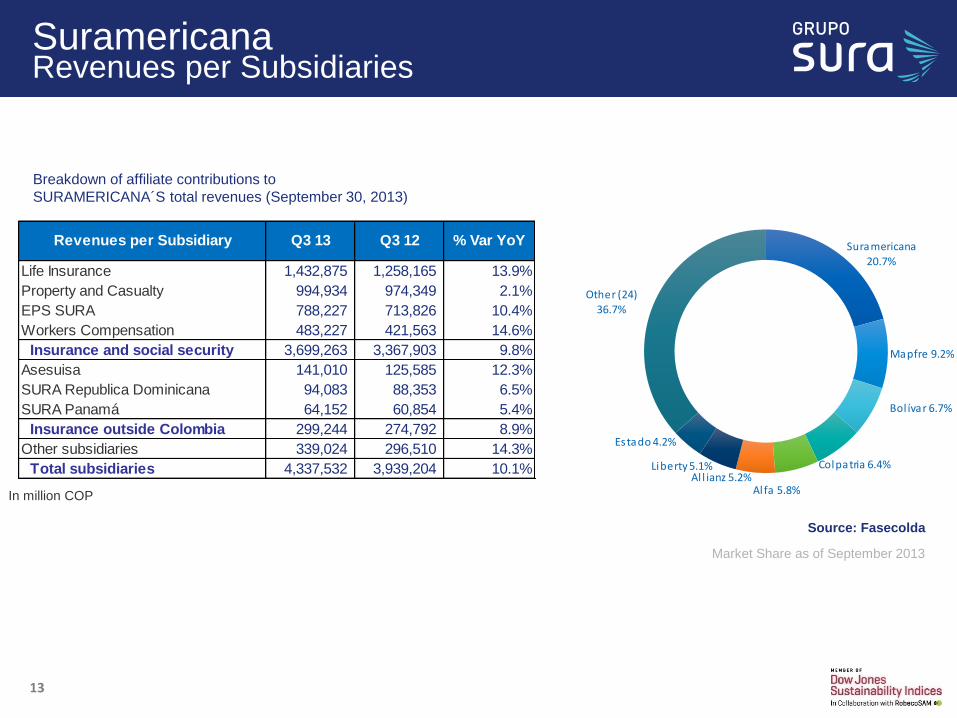
SuramericanaRevenues per Subsidiaries
Breakdown of affiliate contributions to
SURAMERICANA´S total revenues (September 30, 2013)
In million COP
Source: Fasecolda
Market Share as of September 2013
Life Insurance 1,432,875 1,258,165 13.9%
Property and Casualty 994,934 974,349 2.1%
EPS SURA 788,227 713,826 10.4%
Workers Compensation 483,227 421,563 14.6%
Insurance and social security 3,699,263 3,367,903 9.8%
Asesuisa 141,010 125,585 12.3%
SURA Republica Dominicana 94,083 88,353 6.5%
SURA Panamá 64,152 60,854 5.4%
Insurance outside Colombia 299,244 274,792 8.9%
Other subsidiaries 339,024 296,510 14.3%
Total subsidiaries 4,337,532 3,939,204 10.1%
Revenues per Subsidiary Q3 13 Q3 12 % Var YoY Suramericana
20.7%
Mapfre 9.2%
Bol ívar 6.7%
Colpatria 6.4%
Alfa 5.8%Al l ianz 5.2%
Liberty 5.1%
Estado 4.2%
Other (24)
36.7%

1414 14
Suramericana:Individual FIgures
In million COP
Total assets 2,149,186 1,959,661 9.7%
Current assets 72,104 20,358 254.2%
Investments 2,077,196 1,939,404 7.1%
Total liabilites 103,419 224,944 -54.0%
Shareholders' equity 2,045,822 1,734,727 17.9%
Operating income 257,378 264,012 -2.5%
Earnings from Equity Method 257,315 263,883 -2.5%
Operating expenses -16,393 -12,194 34.4%
Net income 218,850 248,646 -12.0%
Suramericana Individual FS (COP
Million)Q3 13 Q3 12 % Var. YoY
1515 15
0
0
0
1
1
1
1
Automóviles Incendio y Lucro Transportes Ingeniería
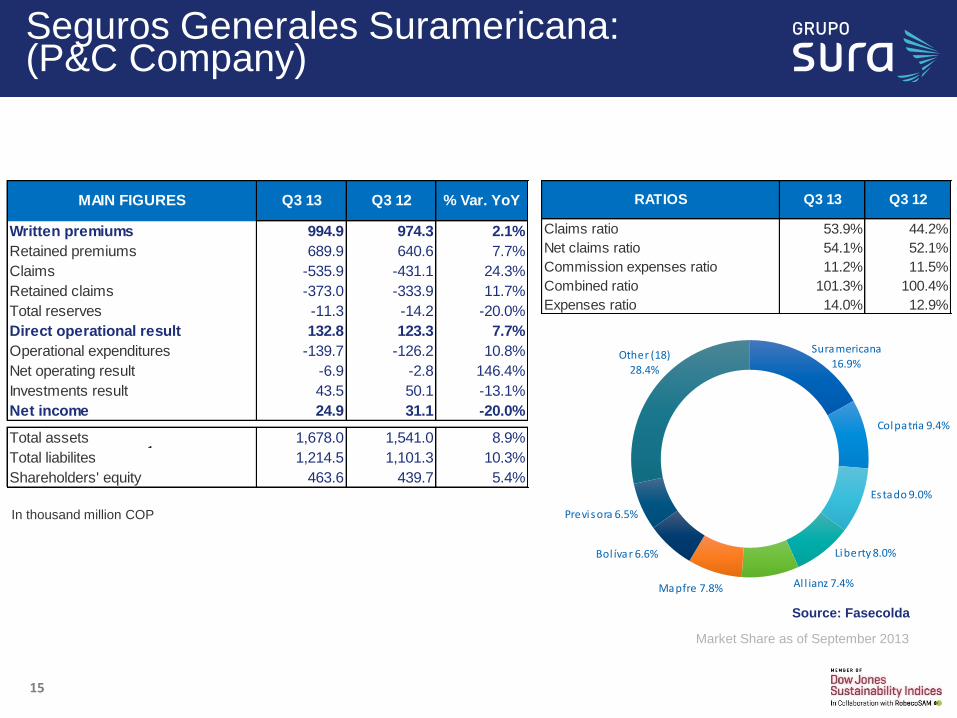
Seguros Generales Suramericana: (P&C Company)
In thousand million COP
Source: Fasecolda
Market Share as of September 2013
Written premiums 994.9 974.3 2.1%
Retained premiums 689.9 640.6 7.7%
Claims -535.9 -431.1 24.3%
Retained claims -373.0 -333.9 11.7%
Total reserves -11.3 -14.2 -20.0%
Direct operational result 132.8 123.3 7.7%
Operational expenditures -139.7 -126.2 10.8%
Net operating result -6.9 -2.8 146.4%
Investments result 43.5 50.1 -13.1%
Net income 24.9 31.1 -20.0%
Total assets 1,678.0 1,541.0 8.9%
Total liabilites 1,214.5 1,101.3 10.3%
Shareholders' equity 463.6 439.7 5.4%
MAIN FIGURES Q3 13 Q3 12 % Var. YoY
Claims ratio 53.9% 44.2%
Net claims ratio 54.1% 52.1%
Commission expenses ratio 11.2% 11.5%
Combined ratio 101.3% 100.4%
Expenses ratio 14.0% 12.9%
RATIOS Q3 13 Q3 12
Suramericana16.9%
Colpatria 9.4%
Estado 9.0%
Liberty 8.0%
Mapfre 7.8% Al l ianz 7.4%
Bol ívar 6.6%
Previsora 6.5%
Other (18)28.4%
1616 16
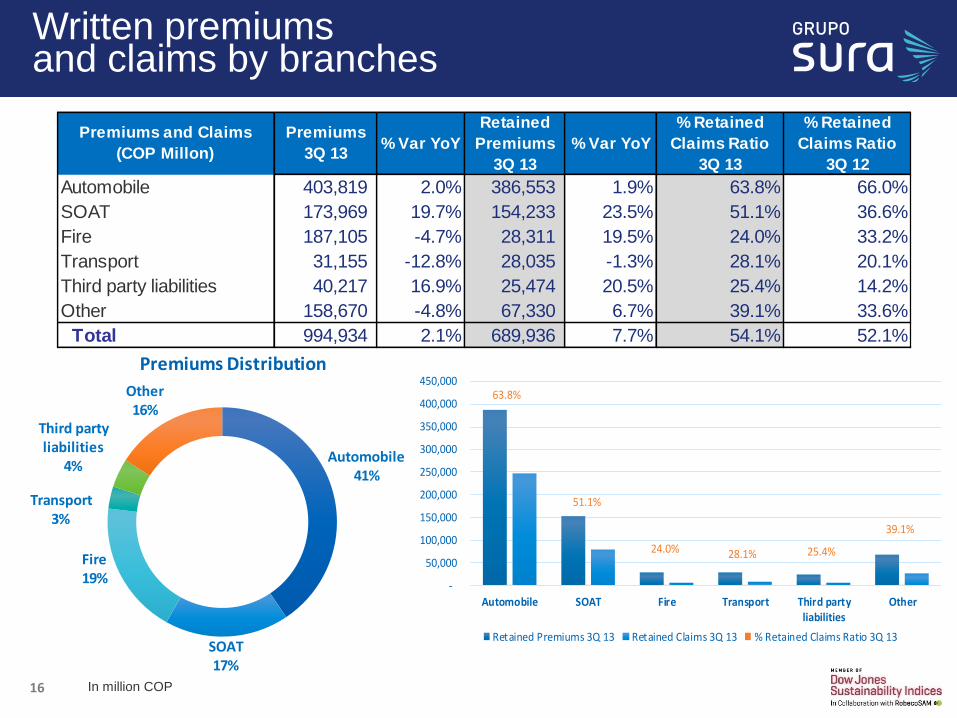
Written premiums and claims by branches
In million COP
Automobile 403,819 2.0% 386,553 1.9% 63.8% 66.0%
SOAT 173,969 19.7% 154,233 23.5% 51.1% 36.6%
Fire 187,105 -4.7% 28,311 19.5% 24.0% 33.2%
Transport 31,155 -12.8% 28,035 -1.3% 28.1% 20.1%
Third party liabilities 40,217 16.9% 25,474 20.5% 25.4% 14.2%
Other 158,670 -4.8% 67,330 6.7% 39.1% 33.6%
Total 994,934 2.1% 689,936 7.7% 54.1% 52.1%
% Retained
Claims Ratio
3Q 12
% Var YoY
% Retained
Claims Ratio
3Q 13
% Var YoY
Retained
Premiums
3Q 13
Premiums and Claims
(COP Millon)
Premiums
3Q 13
Automobile41%
SOAT17%
Fire19%
Transport3%
Third party liabilities
4%
Other16%
Premiums Distribution
63.8%
51.1%
24.0% 28.1% 25.4%
39.1%
-
50,000
100,000
150,000
200,000
250,000
300,000
350,000
400,000
450,000
Automobile SOAT Fire Transport Third partyliabilities
Other
Retained Premiums 3Q 13 Retained Claims 3Q 13 % Retained Claims Ratio 3Q 13
1717 17
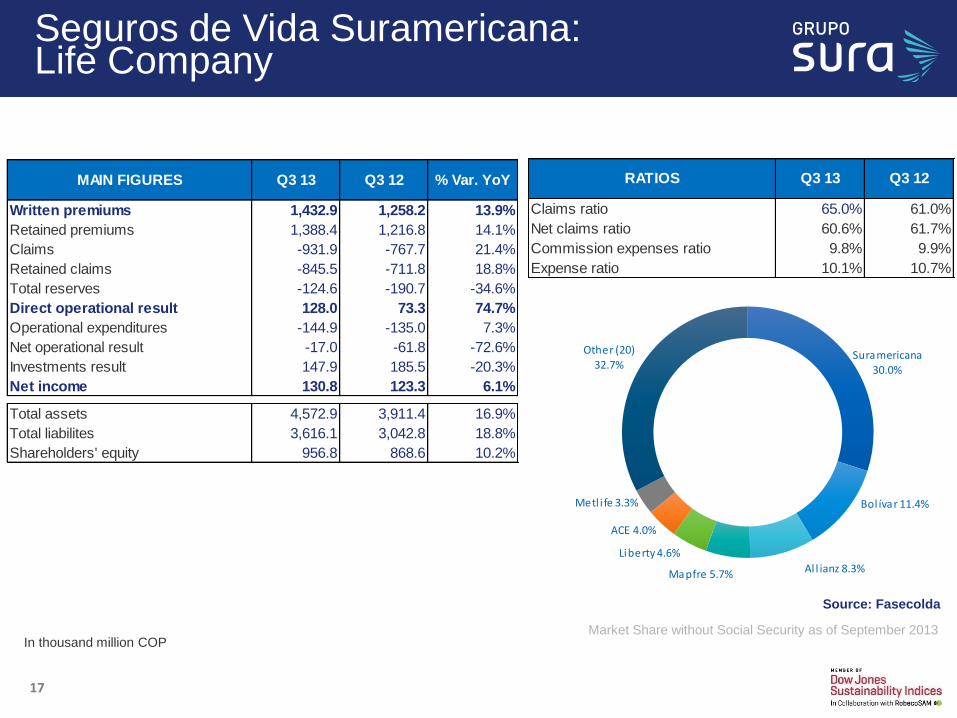
Seguros de Vida Suramericana:Life Company
In thousand million COP
Source: Fasecolda
Market Share without Social Security as of September 2013
Written premiums 1,432.9 1,258.2 13.9%
Retained premiums 1,388.4 1,216.8 14.1%
Claims -931.9 -767.7 21.4%
Retained claims -845.5 -711.8 18.8%
Total reserves -124.6 -190.7 -34.6%
Direct operational result 128.0 73.3 74.7%
Operational expenditures -144.9 -135.0 7.3%
Net operational result -17.0 -61.8 -72.6%
Investments result 147.9 185.5 -20.3%
Net income 130.8 123.3 6.1%
Total assets 4,572.9 3,911.4 16.9%
Total liabilites 3,616.1 3,042.8 18.8%
Shareholders' equity 956.8 868.6 10.2%
MAIN FIGURES Q3 13 Q3 12 % Var. YoY
Claims ratio 65.0% 61.0%
Net claims ratio 60.6% 61.7%
Commission expenses ratio 9.8% 9.9%
Expense ratio 10.1% 10.7%
RATIOS Q3 13 Q3 12
Suramericana30.0%
Bol ívar 11.4%
Al l ianz 8.3%Mapfre 5.7%
Liberty 4.6%
ACE 4.0%
Metl i fe 3.3%
Other (20)
32.7%
1818 18
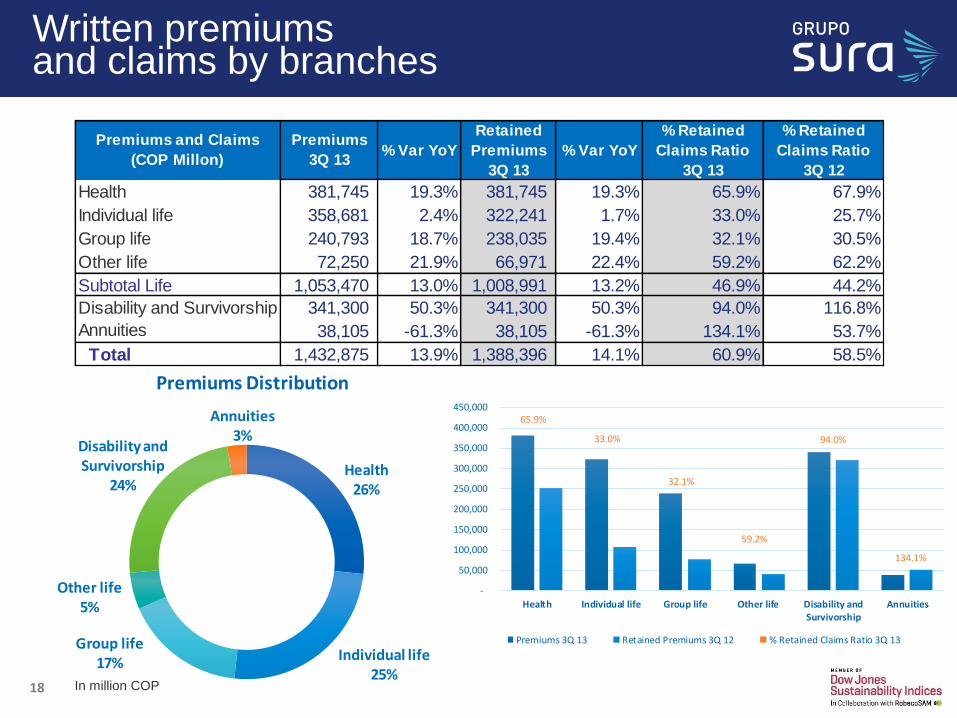
Written premiums and claims by branches
In million COP
Health 381,745 19.3% 381,745 19.3% 65.9% 67.9%
Individual life 358,681 2.4% 322,241 1.7% 33.0% 25.7%
Group life 240,793 18.7% 238,035 19.4% 32.1% 30.5%
Other life 72,250 21.9% 66,971 22.4% 59.2% 62.2%
Subtotal Life 1,053,470 13.0% 1,008,991 13.2% 46.9% 44.2%
Disability and Survivorship 341,300 50.3% 341,300 50.3% 94.0% 116.8%
Annuities 38,105 -61.3% 38,105 -61.3% 134.1% 53.7%
Total 1,432,875 13.9% 1,388,396 14.1% 60.9% 58.5%
Premiums and Claims
(COP Millon)
Premiums
3Q 13% Var YoY
Retained
Premiums
3Q 13
% Var YoY
% Retained
Claims Ratio
3Q 13
% Retained
Claims Ratio
3Q 12
Health26%
Individual life25%
Group life17%
Other life 5%
Disability and Survivorship
24%
Annuities3%
Premiums Distribution
65.9%
33.0%
32.1%
59.2%
94.0%
134.1%
-
50,000
100,000
150,000
200,000
250,000
300,000
350,000
400,000
450,000
Health Individual life Group life Other life Disability andSurvivorship
Annuities
Premiums 3Q 13 Retained Premiums 3Q 12 % Retained Claims Ratio 3Q 13
1919 19
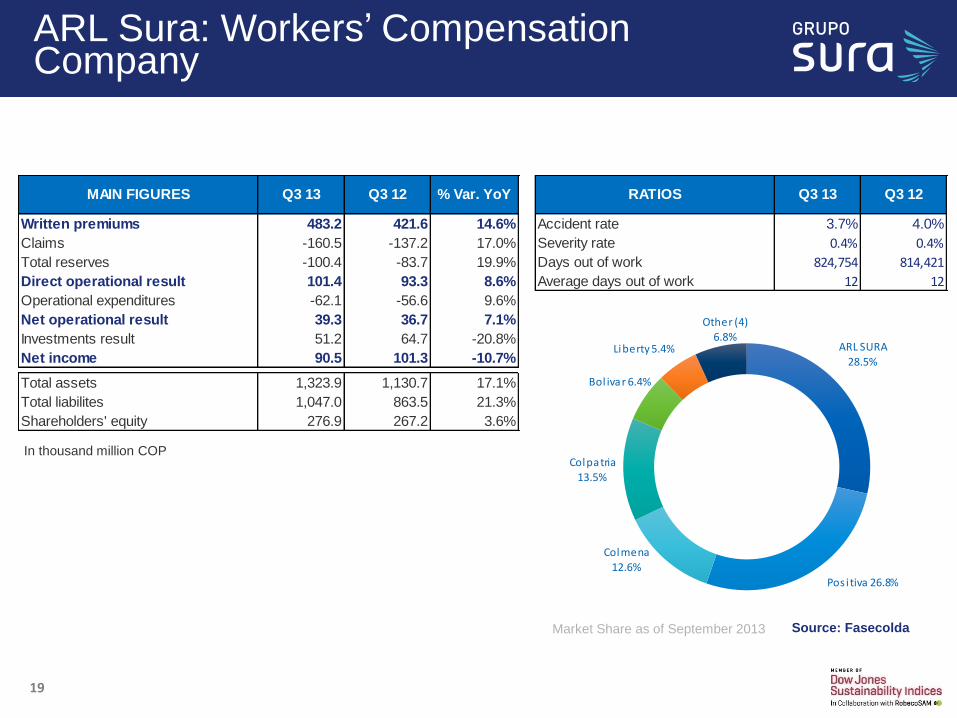
ARL Sura: Workers’ CompensationCompany
In thousand million COP
Market Share as of September 2013 Source: Fasecolda
Written premiums 483.2 421.6 14.6%
Claims -160.5 -137.2 17.0%
Total reserves -100.4 -83.7 19.9%
Direct operational result 101.4 93.3 8.6%
Operational expenditures -62.1 -56.6 9.6%
Net operational result 39.3 36.7 7.1%
Investments result 51.2 64.7 -20.8%
Net income 90.5 101.3 -10.7%
Total assets 1,323.9 1,130.7 17.1%
Total liabilites 1,047.0 863.5 21.3%
Shareholders' equity 276.9 267.2 3.6%
MAIN FIGURES Q3 13 Q3 12 % Var. YoY
Accident rate 3.7% 4.0%
Severity rate 0.4% 0.4%
Days out of work 824,754 814,421
Average days out of work 12 12
RATIOS Q3 13 Q3 12
ARL SURA28.5%
Pos itiva 26.8%
Colmena
12.6%
Colpatria13.5%
Bol ivar 6.4%
Liberty 5.4%
Other (4)6.8%
2020 20
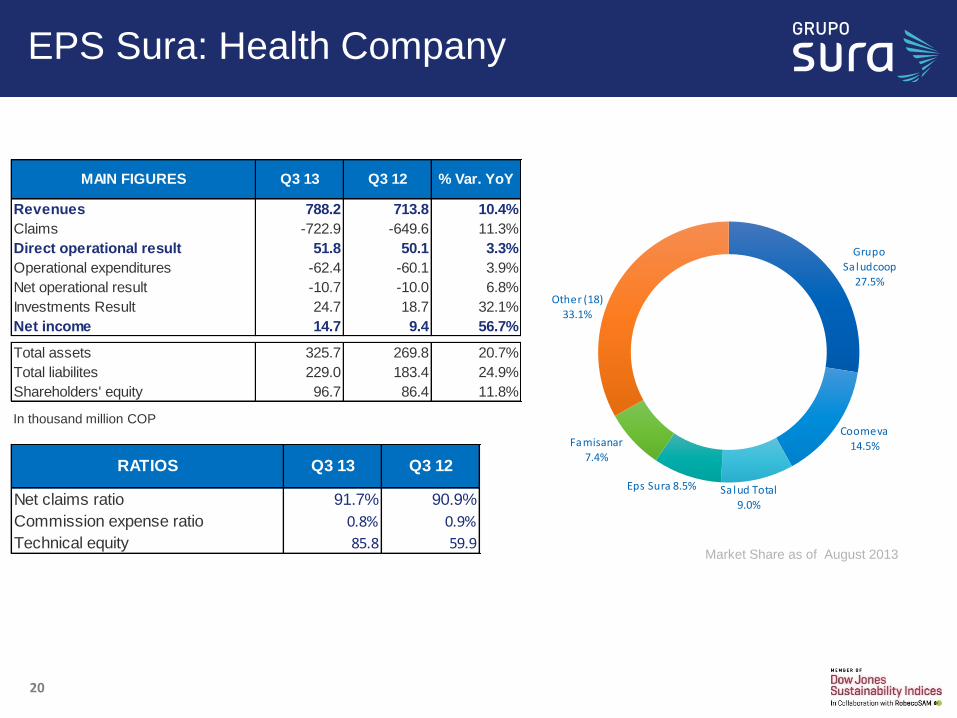
EPS Sura: Health Company
In thousand million COP
Market Share as of August 2013
Revenues 788.2 713.8 10.4%
Claims -722.9 -649.6 11.3%
Direct operational result 51.8 50.1 3.3%
Operational expenditures -62.4 -60.1 3.9%
Net operational result -10.7 -10.0 6.8%
Investments Result 24.7 18.7 32.1%
Net income 14.7 9.4 56.7%
Total assets 325.7 269.8 20.7%
Total liabilites 229.0 183.4 24.9%
Shareholders' equity 96.7 86.4 11.8%
MAIN FIGURES Q3 13 Q3 12 % Var. YoY
Net claims ratio 91.7% 90.9%
Commission expense ratio 0.8% 0.9%
Technical equity 85.8 59.9
RATIOS Q3 13 Q3 12
Grupo
Sa ludcoop27.5%
Coomeva14.5%
Salud Total
9.0%
Eps Sura 8.5%
Famisanar7.4%
Other (18)33.1%
2121
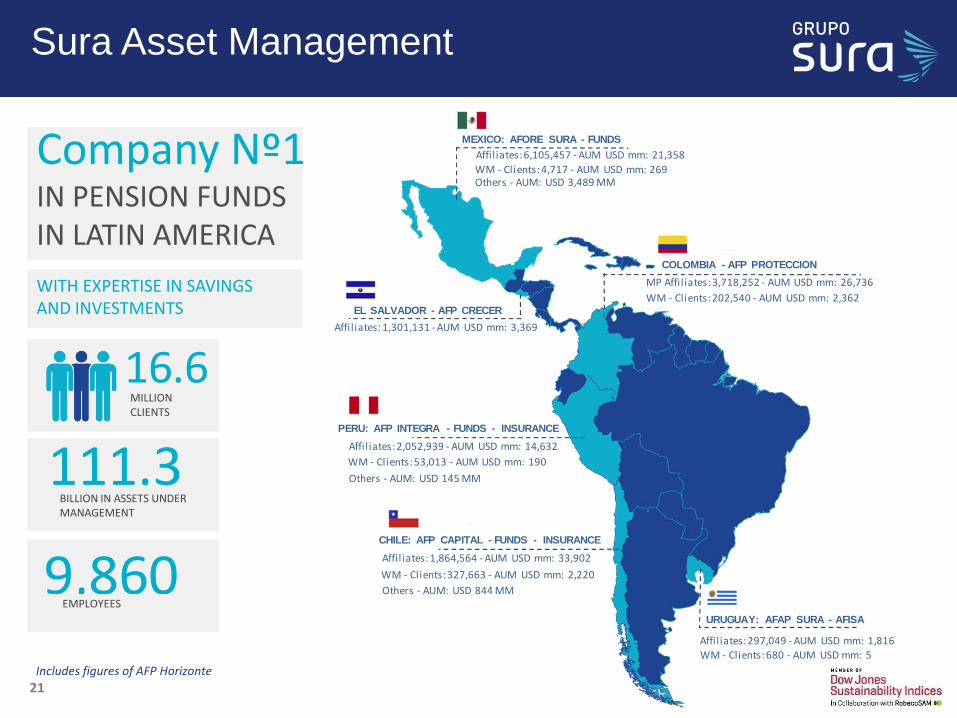
Sura Asset Management
WITH EXPERTISE IN SAVINGS AND INVESTMENTS
MILLION CLIENTS
BILLION IN ASSETS UNDER MANAGEMENT
EMPLOYEES
Company Nº1IN PENSION FUNDS IN LATIN AMERICA
16.6
111.3 16.6
111.3
9,860111.3
9,860
Includes figures of AFP Horizonte
MEXICO: AFORE SURA - FUNDS
COLOMBIA - AFP PROTECCION
EL SALVADOR - AFP CRECER
PERU: AFP INTEGRA - FUNDS - INSURANCE
CHILE: AFP CAPITAL - FUNDS - INSURANCE
URUGUAY: AFAP SURA - AFISA
Others - AUM: USD 3,489 MMWM - Clients: 4,717 - AUM USD mm: 269
Affil iates: 6,105,457 - AUM USD mm: 21,358
WM - Clients: 202,540 - AUM USD mm: 2,362
MP Affil iates: 3,718,252 - AUM USD mm: 26,736
Affil iates: 297,049 - AUM USD mm: 1,816
Affil iates: 1,301,131 - AUM USD mm: 3,369
Others - AUM: USD 145 MM
WM - Clients: 53,013 - AUM USD mm: 190
Affil iates: 2,052,939 - AUM USD mm: 14,632
Others - AUM: USD 844 MM
WM - Clients: 327,663 - AUM USD mm: 2,220
Affil iates: 1,864,564 - AUM USD mm: 33,902
WM - Clients: 680 - AUM USD mm: 5
2222
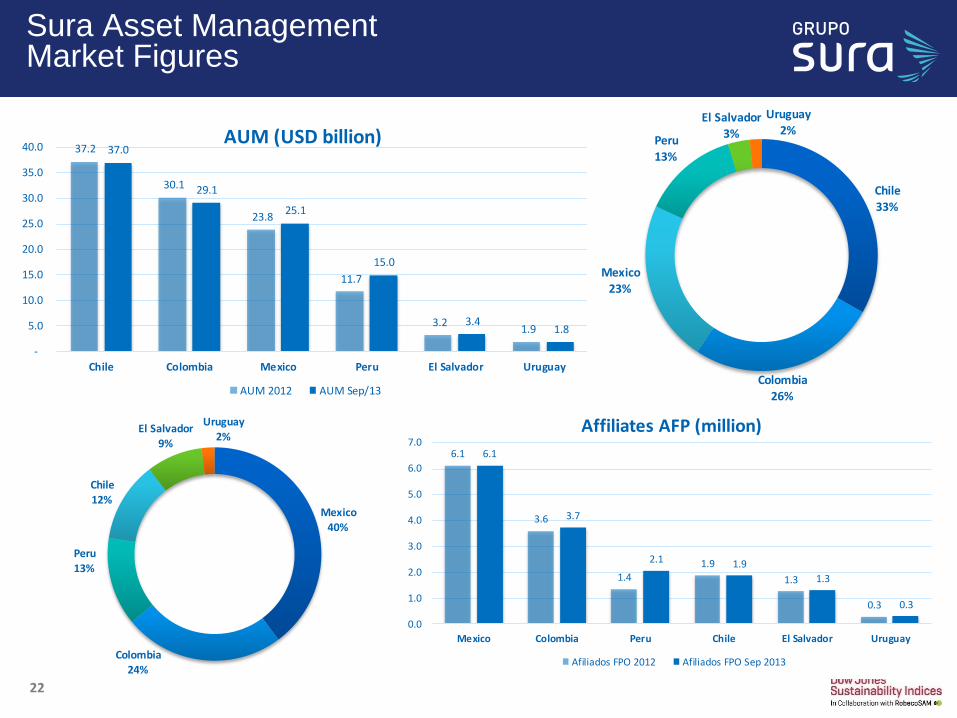
Sura Asset ManagementMarket Figures
Chile
33%
Colombia26%
Mexico
23%
Peru
13%
El Salvador3%
Uruguay
2%
Mexico40%
Colombia24%
Peru
13%
Chile
12%
El Salvador
9%
Uruguay
2%
37.2
30.1
23.8
11.7
3.2 1.9
37.0
29.1
25.1
15.0
3.41.8
-
5.0
10.0
15.0
20.0
25.0
30.0
35.0
40.0
Chile Colombia Mexico Peru El Salvador Uruguay
AUM (USD billion)
AUM 2012 AUM Sep/13
6.1
3.6
1.41.9
1.3
0.3
6.1
3.7
2.1 1.9
1.3
0.3
0.0
1.0
2.0
3.0
4.0
5.0
6.0
7.0
Mexico Colombia Peru Chile El Salvador Uruguay
Mill
ones
Affiliates AFP (million)
Afiliados FPO 2012 Afiliados FPO Sep 2013

2323
Sura Asset ManagementIndividual Income Statement
Earnings from the equity method 370,405 50,714
Interests 116 0
Adjustment for diff. in foreign-exchange (19,045) (2)
Other 159 -
Revenues 351,635 50,712
Payroll expenses 5,399 624
Fees 7,744 265
Administrative expenses 9,980 2,152
Financial expenses - commissions 74,016 84
Expenses 97,139 3,125
Income before taxes 254,496 47,587
Income and complementary taxes provision 24,297 3
Net income 230,199 47,584
3T 12Income Statements (COP Millions) 3T 13
Figures in million COP
2424
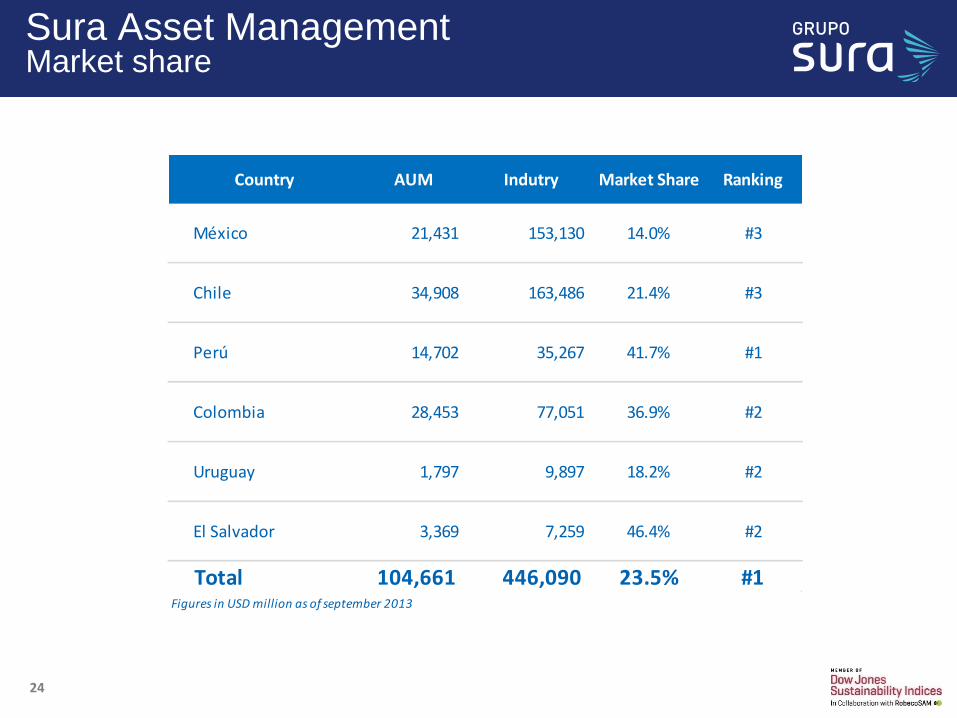
Sura Asset ManagementMarket share
Country AUM Indutry Market Share Ranking
México 21,431 153,130 14.0% #3
Chile 34,908 163,486 21.4% #3
Perú 14,702 35,267 41.7% #1
Colombia 28,453 77,051 36.9% #2
Uruguay 1,797 9,897 18.2% #2
El Salvador 3,369 7,259 46.4% #2
Total 104,661 446,090 23.5% #1Figures in USD million as of september 2013
CEO: David Bojanini
CFO: Ignacio Calle
IR: Luis Eduardo Martínez
E-mail: [email protected]
Teléfono: (574) 4355941
www.gruposura.com.co