Embed Size (px)
Citation preview
Chartwell Consulting (USA), LLC 34 Park Street, Montclair, NJ 07042
[email protected] www.chartwellusa.com
Phone (973) 783-2900 Fax (973) 783-2998
CHARTWELL REVIEW
October 2017 THIRD QUARTER 2017 Volume XXIV, Issue No.3
The third quarter was another strong one for U.S. and global equity and “risk on” markets. Growth stocks and emerging-market categories were the strongest performers, boosted by their exposure to big gains in the information technology sector. Credit categories continued to lead gains in the bond market, and year-to-date returns are almost universally positive across major asset categories and sectors. As the “Economist” headlined, there is “a bull market in everything.”
The Goldilocks narrative rests on five pillars –
Inflation is low, but not too low, and will remain so;
We are in the middle of a synchronized expansion in global economic growth, but not one that is so robust as to raise important inflation risks;
Base interest rates are low, and will pretty much remain so. Fed funds might rise to match the target inflation rate, but extremely accommodative policies in Europe and Japan will cap how hot US$ term yields can get;
Turning to fundamental factors, international corporate earnings growth has accelerated for several quarters and even surpassed U.S. corporate profit growth (which is ticking along very nicely in 2017 after a timeout in 2016). Earnings revisions have also stabilized for the first time in years, although lofty forward earnings growth expectations may provide a tougher hurdle to clear in the year ahead, particularly in emerging markets.
Despite dollar weakness in 2017, the value of most currencies also remains in the lower half of historical ranges versus the U.S. dollar. Meanwhile, yields and credit spreads across bond sectors will remain low relative to history, as will broad market default rates.
There you have it. Not too cold; not too hot; Just right.
As Chuck Prince, former CEO of Citi, famously said – “When the music’s playing, you’ve got to get up and dance. And, we’re dancing.”
Enjoy the porridge.
Figure 1: Index Benchmarks
Market Index Trailing Returns *
3Q 17 1 Yr 3 Yr 5 Yr 10 Yr
S&P 500 4.5 18.6 10.8 14.2 7.4 U.S. Top-cap Stocks 4.9 19.8 11.1 14.3 7.4 U.S. Mid-cap Stocks 3.5 15.3 9.5 14.3 8.1 U.S. Small-cap Stocks 5.7 20.7 12.2 13.8 7.9 Non-US Stocks (EAFE) 5.4 19.1 5.0 8.4 1.3 Non-US Stocks (Emerg) 7.9 22.5 4.9 4.0 1.3 3 mo. T-Bills 0.3 0.6 0.3 0.2 0.4 U.S. Aggregate Bonds 0.9 0.1 2.7 2.1 4.3 High Yield Bonds 2.0 9.1 5.9 6.4 7.7 Global Aggregate Bonds 0.8 (0.2) 3.1 3.1 4.3 Consumer Prices 0.8 2.2 1.2 1.3 1.7 Bloomberg Commodity 2.5 (0.3) (10.4) (10.5) (6.8) MSCI World Real Estate 2.1 4.2 7.5 7.8 2.6
Figure 2: Average Mutual Fund Returns
Fund Category Trailing Returns *
3Q 17 1 Yr 3 Yr 5 Yr 10 Yr
U.S. Large-cap 4.6 18.4 9.6 13.4 7.0 U.S. Mid-cap 3.8 16.9 8.9 13.1 7.3 U.S. Small-cap 5.4 19.5 10.9 13.3 7.5 International Lg. Cap 5.6 18.9 5.5 8.3 1.8 International Sm. Cap 7.4 20.6 9.5 11.5 4.3 Emerg. Mkt. Equity 7.1 19.7 4.3 4.3 1.5 Balanced/Hybrid 2.9 10.0 5.5 7.4 5.3 General Bond 1.0 1.1 2.7 2.3 4.7 High Yield Bond 1.8 7.8 4.5 5.3 6.6 Equity Hedge Funds 3.5 11.0 4.6 6.3 2.9
*Annualized trailing returns for periods ending 9/30/17.
Goldilocks
Copyright @2017 Chartwell Consulting (USA) LLC All rights reserved. More Information: [email protected]
Economies, Economics, Prices, and Policy
9/2017 9/2016
CPI - headline, y-o-y 2.2% 1.5% CPI - core, y-o-y 1.7% 2.0% Real GDP Growth* 2.3% 1.5% Employment (000's) 154,345 151,926 Employment / Population % 60.4% 59.6%
* 3Q17 vs. 3Q16, y-o-y The American economy continues to expand, and the growth rate has recently recovered from what were quite sluggish levels. A year ago, real GDP had increased at an annual rate of only 1.5% during the previous 12 months. Today, that figure is 2.3%. Still too low by most standards, but the direction is favorable. And, 3rd quarter real GDP rose at an annual rate of 3.0%, effectively the same pace as Q2 despite three major hurricanes. Figure 3: Breaking Down Real U.S. GDP
% Change from Preceding Period (seasonally adjusted at annualized rates) Factor 3Q ‘17* 2Q '17 1Q '17 4Q '16
Real GDP Growth 3.0 3.1 1.2 1.8 Nominal GDP Growth ///'
5.2 4.1 3.3 3.8 Real Final Sales 2.3 2.9 2.7 0.7 Personal Spending 2.4 3.3 1.9 2.9 Private Investment 6.0 3.9 (1.2) 8.5
- Fixed, Businesses 3.9 6.7 7.2 0.2 - Fixed, Residential (6.0) (7.3) 11.1 7.1 - Chg. In Inventories ($bn) $38 $5 $0 $70 Export growth 2.3 3.5 7.3 (3.8) Import growth (0.8) 1.5 4.3 8.1 Government Spending (0.1) (0.2) (0.6) 0.2
* BEA advanced estimate on 10.27.17 Personal spending contributed more than half of the quarter’s growth (normally it’s around 70%). Household spending on durable goods rose 8.3% in real terms during Q3, after a 7.6% real rise in Q2. Business fixed investment also grew, but at a slower pace than during the first half. After six months of constrained inventory spending, goods accumulation accounted for nearly one-quarter of the period’s growth.
On the flipside, spending on services, especially household-related, dipped, and residential investment (buying houses) declined for the second straight quarter.
Continuing a pattern we observed in Q2, the pace of payroll jobs growth weakened as we moved through the quarter. Ultimately just 340k jobs were created, compared to 581k jobs in Q2. September saw new payroll jobs fall by 33k, apparently due to hurricane-related problems. What is confusing is the household survey. It reflected a huge jump of 1.1 million in employed during the quarter, as the unemployment rate dropped to just 4.2%.
The continued favorable jobs market has recently led to only small gains in wages or incomes. Average weekly earnings of private nonfarm employees were flat in Q3 after a 0.6% rise in Q2. They increased just 0.6% in real terms during the past year through September, despite employment growth of over 2 million
Disposable personal incomes increased by $92bn on an annualized basis in the quarter, but that is only a 0.6% gain. Total personal spending rose by $188bn (+1.4%). To accommodate this, our national savings rate dipped to a 10-year low of 3.1% in September. Just like the late 1990’s and mid-2000’s, as household net worth approaches 500% of GDP, household savings rates drop. Headline inflation numbers popped during the quarter, as oil and gas prices rose. Yet, core inflation remains quiet.
⇒ Before seasonal adjustments, "headline" CPI rose 0.8% during the 3rd quarter, and is up 2.2% for the year ended September. This was a sharp increase from 1.5% during the prior twelve months.
⇒ In opposition, core CPI (ex-food & energy) rose 0.4% during the second quarter, and only +1.7% during the past year.
⇒ The headline Producer Price Index for final goods and services rose 0.5% during the latest quarter, and 2.6% the past year. The core PPI ex-food & energy advanced 2.1% the past year.
On the monetary policy front, neither the Fed nor the ECB plans to reduce their balance sheets have started to be implemented. The Fed is expected to start in Q4, by not rolling over $4-8 billion of maturing bonds each month. These amounts will rise steadily through 2018. The ECB is currently targeting a 3Q18 start date, but details are nebulous. One report is for the ECB to cut back purchases to $30bn/month, from a current $70bn.
By the time you read this, a new Fed chairman will have been announced by the Fed. Jerome Powell, an adherent of Janet Yellen, is expected to be named. The President wants a “low interest rate guy.” Even so, betting strongly favors a 0.25% rise in the Fed funds rate in December.
On the fiscal front, many remain optimistic for a significant drop in business tax rates, personal tax rates, and (too bad) certain deductions. Congress is expected to pass new tax rules in Q4, reducing expected government revenues by an estimated $150 billion per year (which will initially need to be borrowed). It’s not specifically clear how major reductions in business tax revenue would be made up, but the core principal is that faster economic growth rates will spur business and personal incomes, which will in turn result in rising tax payments. We would all do well to study the outcomes associated with the Reagan tax cuts in the late 1980’s, although our demographics today are much less favorable.
Copyright @2017 Chartwell Consulting (USA) LLC All rights reserved. More Information: [email protected]
Not too hot . . . .
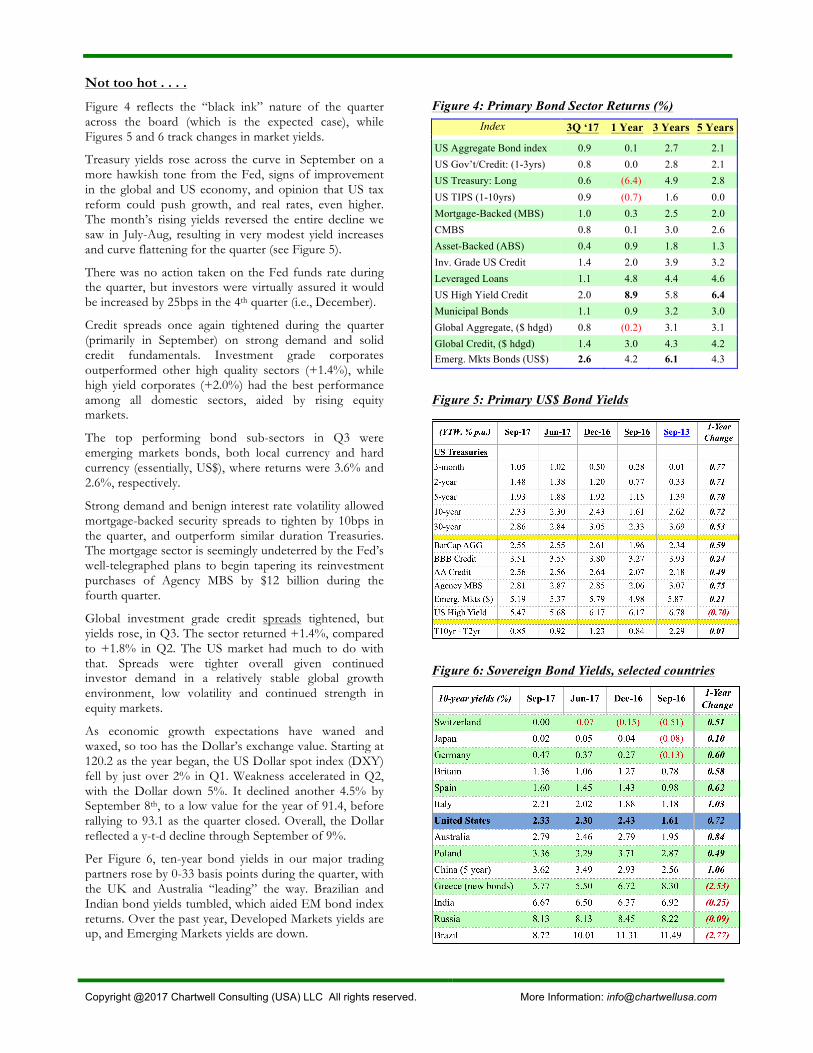
Figure 4 reflects the “black ink” nature of the quarter across the board (which is the expected case), while Figures 5 and 6 track changes in market yields.
Treasury yields rose across the curve in September on a more hawkish tone from the Fed, signs of improvement in the global and US economy, and opinion that US tax reform could push growth, and real rates, even higher. The month’s rising yields reversed the entire decline we saw in July-Aug, resulting in very modest yield increases and curve flattening for the quarter (see Figure 5).
There was no action taken on the Fed funds rate during the quarter, but investors were virtually assured it would be increased by 25bps in the 4th quarter (i.e., December).
Credit spreads once again tightened during the quarter (primarily in September) on strong demand and solid credit fundamentals. Investment grade corporates outperformed other high quality sectors (+1.4%), while high yield corporates (+2.0%) had the best performance among all domestic sectors, aided by rising equity markets.
The top performing bond sub-sectors in Q3 were emerging markets bonds, both local currency and hard currency (essentially, US$), where returns were 3.6% and 2.6%, respectively.
Strong demand and benign interest rate volatility allowed mortgage-backed security spreads to tighten by 10bps in the quarter, and outperform similar duration Treasuries. The mortgage sector is seemingly undeterred by the Fed’s well-telegraphed plans to begin tapering its reinvestment purchases of Agency MBS by $12 billion during the fourth quarter.
Global investment grade credit spreads tightened, but yields rose, in Q3. The sector returned +1.4%, compared to +1.8% in Q2. The US market had much to do with that. Spreads were tighter overall given continued investor demand in a relatively stable global growth environment, low volatility and continued strength in equity markets.
As economic growth expectations have waned and waxed, so too has the Dollar’s exchange value. Starting at 120.2 as the year began, the US Dollar spot index (DXY) fell by just over 2% in Q1. Weakness accelerated in Q2, with the Dollar down 5%. It declined another 4.5% by September 8th, to a low value for the year of 91.4, before rallying to 93.1 as the quarter closed. Overall, the Dollar reflected a y-t-d decline through September of 9%.
Per Figure 6, ten-year bond yields in our major trading partners rose by 0-33 basis points during the quarter, with the UK and Australia “leading” the way. Brazilian and Indian bond yields tumbled, which aided EM bond index returns. Over the past year, Developed Markets yields are up, and Emerging Markets yields are down.
Figure 4: Primary Bond Sector Returns (%) Index 3Q ‘17 1 Year 3 Years 5 Years
US Aggregate Bond index 0.9 0.1 2.7 2.1 US Gov’t/Credit: (1-3yrs) 0.8 0.0 2.8 2.1 US Treasury: Long 0.6 (6.4) 4.9 2.8 US TIPS (1-10yrs) 0.9 (0.7) 1.6 0.0 Mortgage-Backed (MBS) 1.0 0.3 2.5 2.0 CMBS 0.8 0.1 3.0 2.6 Asset-Backed (ABS) 0.4 0.9 1.8 1.3 Inv. Grade US Credit 1.4 2.0 3.9 3.2 Leveraged Loans 1.1 4.8 4.4 4.6 US High Yield Credit 2.0 8.9 5.8 6.4 Municipal Bonds 1.1 0.9 3.2 3.0 Global Aggregate, ($ hdgd) 0.8 (0.2) 3.1 3.1 Global Credit, ($ hdgd) 1.4 3.0 4.3 4.2 Emerg. Mkts Bonds (US$) 2.6 4.2 6.1 4.3
Figure 5: Primary US$ Bond Yields
Figure 6: Sovereign Bond Yields, selected countries
Copyright @2017 Chartwell Consulting (USA) LLC All rights reserved. More Information: [email protected]
Not too Cold . . . . . .
The US Equity market continued to climb the proverbial “wall of worry” with the S&P 500 posting a 4.5% gain for the quarter and repeatedly setting new all-time highs in the process. Since the market correction that ended in early February 2016 (the S&P dropped 11.6% in a shade over three months), the broad US large cap stock index rose 35%, plus dividends, through the end of September.
During the quarter we passed the 10-year point following the start of the last bear market (mid-September 2007). In that 10 years, the S&P 500 index returned an annualized 7.5%, and small cap stocks returned nearly 9%. So, if you invested on the eve of the last bear market, you would have slightly more than doubled your money to date.
Stock volatility remains at record low levels, causing many observers to fret about the unusual level of resiliency in the market (the so-called “buy the dips” syndrome). Despite this highly favorable environment, fund flows into US equity strategies have totaled just $27bn this year, compared to $268bn into taxable bonds portfolios and $173bn into world equities. Figure 7: U.S. Equity Market - Size/Style Returns
Trailing 3Q '17 1-yr 3-yrs 5-yrs Growth Large Cap 4.6 21.6 13.2 15.4 Mid Cap 5.3 17.8 10.0 14.2 Small Cap 6.2 21.0 12.2 14.3
Value
Large Cap 3.6 16.0 8.3 12.7 Mid Cap 2.1 13.4 9.2 14.3 Small Cap 5.1 20.6
.9
12.1 13.3
Very large-cap stocks (the R200 index) posted a total return of 4.9% in Q3, and are up 15% this year. But it continues to be a very large cap growth stock driven domestic market. That sub-class added a 6.1% return in Q3, and has returned 22% in 2017. By comparison, very large-cap value stocks have returned 3.6% and 8.2%, respectively.
Having underperformed by quite a wide margin already during the first half of 2017, small/mid-cap stock indices again produced mixed results in Q3. First, midcap growth stocks underperformed small growth. And midcap value underperformed everything. The same holds true for the past year (see Figure 7).
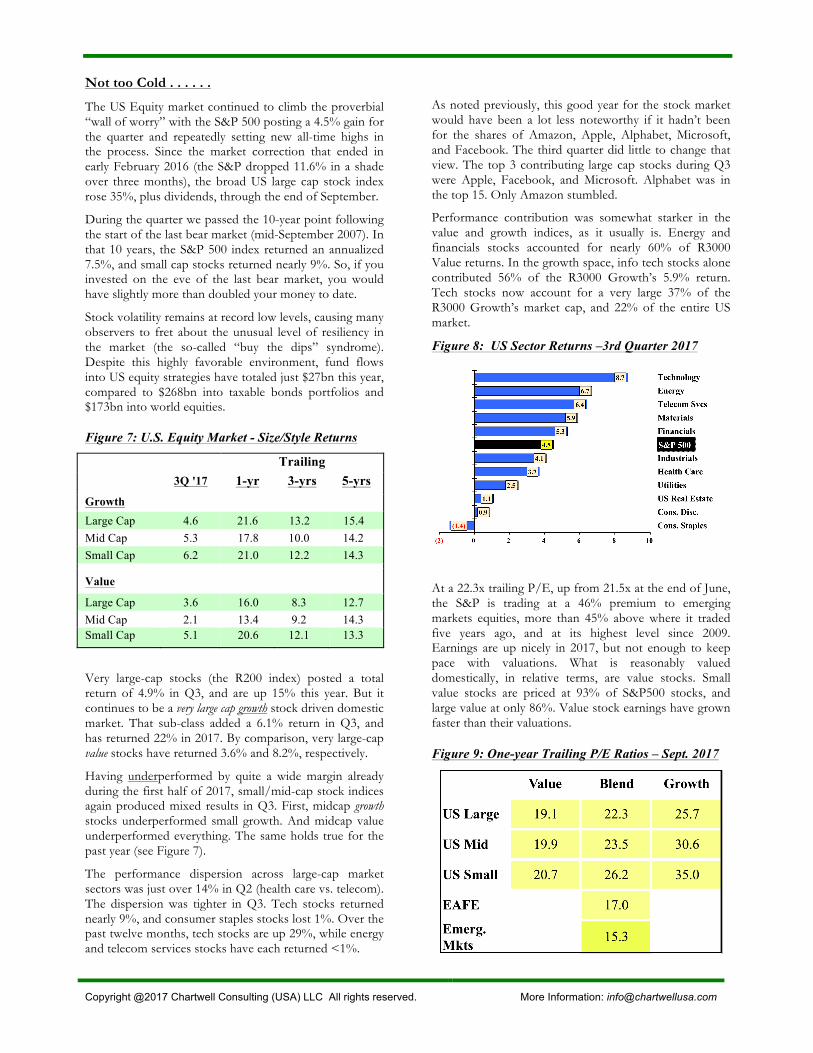
The performance dispersion across large-cap market sectors was just over 14% in Q2 (health care vs. telecom). The dispersion was tighter in Q3. Tech stocks returned nearly 9%, and consumer staples stocks lost 1%. Over the past twelve months, tech stocks are up 29%, while energy and telecom services stocks have each returned <1%.
As noted previously, this good year for the stock market would have been a lot less noteworthy if it hadn’t been for the shares of Amazon, Apple, Alphabet, Microsoft, and Facebook. The third quarter did little to change that view. The top 3 contributing large cap stocks during Q3 were Apple, Facebook, and Microsoft. Alphabet was in the top 15. Only Amazon stumbled.
Performance contribution was somewhat starker in the value and growth indices, as it usually is. Energy and financials stocks accounted for nearly 60% of R3000 Value returns. In the growth space, info tech stocks alone contributed 56% of the R3000 Growth’s 5.9% return. Tech stocks now account for a very large 37% of the R3000 Growth’s market cap, and 22% of the entire US market.
Figure 8: US Sector Returns –3rd Quarter 2017
At a 22.3x trailing P/E, up from 21.5x at the end of June, the S&P is trading at a 46% premium to emerging markets equities, more than 45% above where it traded five years ago, and at its highest level since 2009. Earnings are up nicely in 2017, but not enough to keep pace with valuations. What is reasonably valued domestically, in relative terms, are value stocks. Small value stocks are priced at 93% of S&P500 stocks, and large value at only 86%. Value stock earnings have grown faster than their valuations. Figure 9: One-year Trailing P/E Ratios – Sept. 2017
Copyright @2017 Chartwell Consulting (USA) LLC All rights reserved. More Information: [email protected]
Just Right
The synchronized expansion in global economic activity—along with low inflation and accommodative monetary policies - continued to provide a steady backdrop for global asset markets in the third quarter of 2017. Several major market indices reached record highs during the quarter, as stocks advanced on signs of a brighter outlook for corporate earnings.
International equity returns outpaced US equities for the quarter and year-to-date. International growth stocks also continued to outpace their value counterparts year-to-date, but not during the 3rd quarter.
The US dollar weakened versus the euro, the British pound and most emerging market currencies, providing a tailwind for US dollar-based investors.
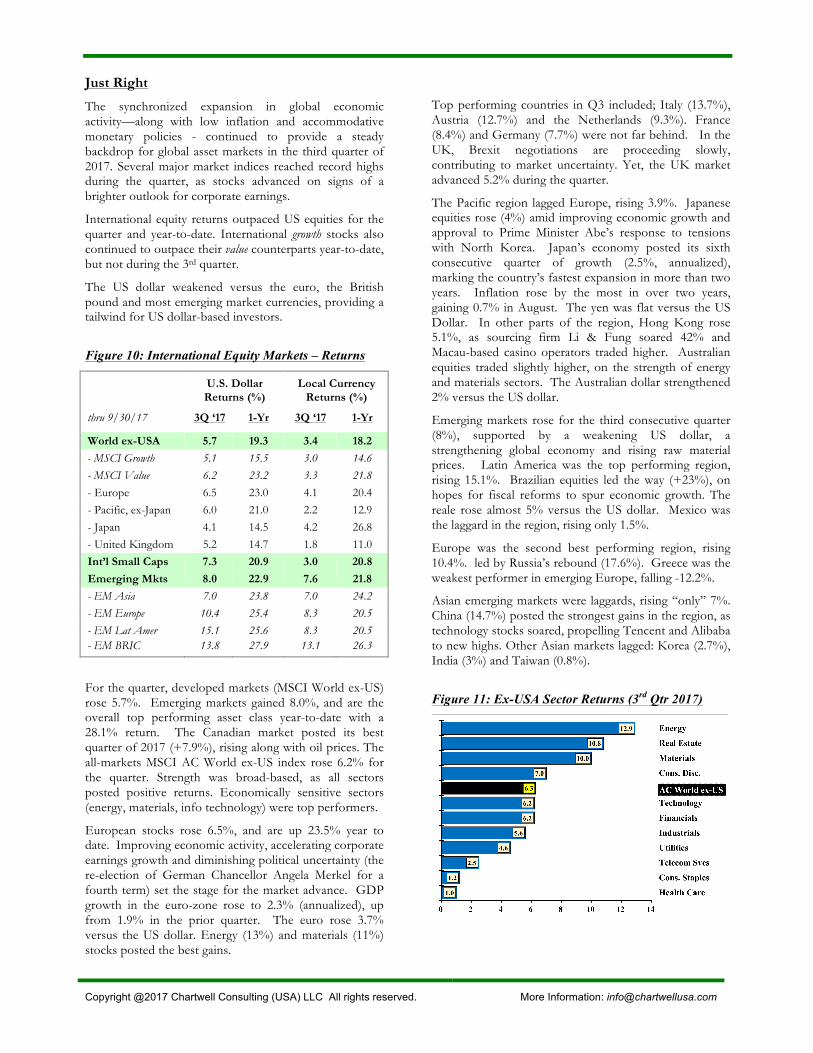
Figure 10: International Equity Markets – Returns
U.S. Dollar Returns (%)
Local Currency Returns (%)
thru 9/30/17 3Q ‘17 1-Yr 3Q ‘17 1-Yr
World ex-USA 5.7 19.3 3.4 18.2
- MSCI Growth 5.1 15.5 3.0 14.6 - MSCI Value 6.2 23.2 3.3 21.8 - Europe 6.5 23.0 4.1 20.4 - Pacific, ex-Japan 6.0 21.0 2.2 12.9 - Japan 4.1 14.5 4.2 26.8 - United Kingdom 5.2 14.7 1.8 11.0 Int’l Small Caps 7.3 20.9 3.0 20.8
Emerging Mkts 8.0 22.9 7.6 21.8
- EM Asia 7.0 23.8 7.0 24.2 - EM Europe 10.4 25.4 8.3 20.5 - EM Lat Amer 15.1 25.6 8.3 20.5 - EM BRIC 13.8 27.9 13.1 26.3
For the quarter, developed markets (MSCI World ex-US) rose 5.7%. Emerging markets gained 8.0%, and are the overall top performing asset class year-to-date with a 28.1% return. The Canadian market posted its best quarter of 2017 (+7.9%), rising along with oil prices. The all-markets MSCI AC World ex-US index rose 6.2% for the quarter. Strength was broad-based, as all sectors posted positive returns. Economically sensitive sectors (energy, materials, info technology) were top performers.
European stocks rose 6.5%, and are up 23.5% year to date. Improving economic activity, accelerating corporate earnings growth and diminishing political uncertainty (the re-election of German Chancellor Angela Merkel for a fourth term) set the stage for the market advance. GDP growth in the euro-zone rose to 2.3% (annualized), up from 1.9% in the prior quarter. The euro rose 3.7% versus the US dollar. Energy (13%) and materials (11%) stocks posted the best gains.
Top performing countries in Q3 included; Italy (13.7%), Austria (12.7%) and the Netherlands (9.3%). France (8.4%) and Germany (7.7%) were not far behind. In the UK, Brexit negotiations are proceeding slowly, contributing to market uncertainty. Yet, the UK market advanced 5.2% during the quarter.
The Pacific region lagged Europe, rising 3.9%. Japanese equities rose (4%) amid improving economic growth and approval to Prime Minister Abe’s response to tensions with North Korea. Japan’s economy posted its sixth consecutive quarter of growth (2.5%, annualized), marking the country’s fastest expansion in more than two years. Inflation rose by the most in over two years, gaining 0.7% in August. The yen was flat versus the US Dollar. In other parts of the region, Hong Kong rose 5.1%, as sourcing firm Li & Fung soared 42% and Macau-based casino operators traded higher. Australian equities traded slightly higher, on the strength of energy and materials sectors. The Australian dollar strengthened 2% versus the US dollar.
Emerging markets rose for the third consecutive quarter (8%), supported by a weakening US dollar, a strengthening global economy and rising raw material prices. Latin America was the top performing region, rising 15.1%. Brazilian equities led the way (+23%), on hopes for fiscal reforms to spur economic growth. The reale rose almost 5% versus the US dollar. Mexico was the laggard in the region, rising only 1.5%.
Europe was the second best performing region, rising 10.4%. led by Russia’s rebound (17.6%). Greece was the weakest performer in emerging Europe, falling -12.2%.
Asian emerging markets were laggards, rising “only” 7%. China (14.7%) posted the strongest gains in the region, as technology stocks soared, propelling Tencent and Alibaba to new highs. Other Asian markets lagged: Korea (2.7%), India (3%) and Taiwan (0.8%).
Figure 11: Ex-USA Sector Returns (3rd Qtr 2017)
Copyright @2017 Chartwell Consulting (USA) LLC All rights reserved. More Information: [email protected]
Back Page Perspectives – DEBT
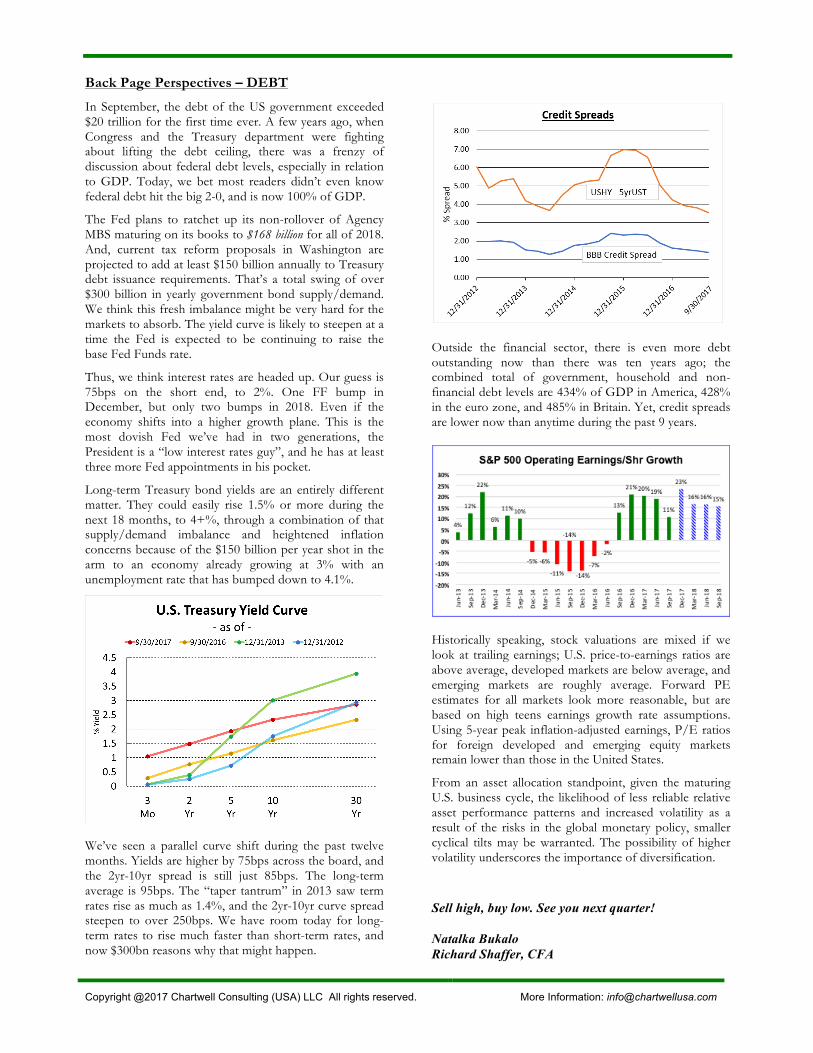
In September, the debt of the US government exceeded $20 trillion for the first time ever. A few years ago, when Congress and the Treasury department were fighting about lifting the debt ceiling, there was a frenzy of discussion about federal debt levels, especially in relation to GDP. Today, we bet most readers didn’t even know federal debt hit the big 2-0, and is now 100% of GDP.
The Fed plans to ratchet up its non-rollover of Agency MBS maturing on its books to $168 billion for all of 2018. And, current tax reform proposals in Washington are projected to add at least $150 billion annually to Treasury debt issuance requirements. That’s a total swing of over $300 billion in yearly government bond supply/demand. We think this fresh imbalance might be very hard for the markets to absorb. The yield curve is likely to steepen at a time the Fed is expected to be continuing to raise the base Fed Funds rate.
Thus, we think interest rates are headed up. Our guess is 75bps on the short end, to 2%. One FF bump in December, but only two bumps in 2018. Even if the economy shifts into a higher growth plane. This is the most dovish Fed we’ve had in two generations, the President is a “low interest rates guy”, and he has at least three more Fed appointments in his pocket.
Long-term Treasury bond yields are an entirely different matter. They could easily rise 1.5% or more during the next 18 months, to 4+%, through a combination of that supply/demand imbalance and heightened inflation concerns because of the $150 billion per year shot in the arm to an economy already growing at 3% with an unemployment rate that has bumped down to 4.1%.
We’ve seen a parallel curve shift during the past twelve months. Yields are higher by 75bps across the board, and the 2yr-10yr spread is still just 85bps. The long-term average is 95bps. The “taper tantrum” in 2013 saw term rates rise as much as 1.4%, and the 2yr-10yr curve spread steepen to over 250bps. We have room today for long-term rates to rise much faster than short-term rates, and now $300bn reasons why that might happen.
Outside the financial sector, there is even more debt outstanding now than there was ten years ago; the combined total of government, household and non-financial debt levels are 434% of GDP in America, 428% in the euro zone, and 485% in Britain. Yet, credit spreads are lower now than anytime during the past 9 years.
Historically speaking, stock valuations are mixed if we look at trailing earnings; U.S. price-to-earnings ratios are above average, developed markets are below average, and emerging markets are roughly average. Forward PE estimates for all markets look more reasonable, but are based on high teens earnings growth rate assumptions. Using 5-year peak inflation-adjusted earnings, P/E ratios for foreign developed and emerging equity markets remain lower than those in the United States.
From an asset allocation standpoint, given the maturing U.S. business cycle, the likelihood of less reliable relative asset performance patterns and increased volatility as a result of the risks in the global monetary policy, smaller cyclical tilts may be warranted. The possibility of higher volatility underscores the importance of diversification.
Sell high, buy low. See you next quarter! Natalka Bukalo Richard Shaffer, CFA