Embed Size (px)
Citation preview

1
Third Quarter 2021 Investor Review
November 3, 2021
2
Forward Looking Statements and GAAP Disclaimer
These slides contain (and the accompanying oral discussion will contain) forward-looking statements, which are generally identifiable by use of the words "believes," "expects," "intends,"
"anticipates," "plans to," "seeks," "should," "estimates," "projects," "may," "likely" or similar expressions. Such statements may include, but are not limited to, statements about future financial and
operating results, the Company's plans, objectives, expectations and intentions and other statements that are not historical facts. Forward-looking statements are neither historical facts nor
assurances of future performance. Such statements are based upon the beliefs and expectations of Clean Harbors' management as of this date only and are subject to certain risks and
uncertainties that could cause actual results to differ materially, including, without limitation, the impact of the HydroChemPSC acquisition and those items identified as "Risk Factors,” disclosed in
our periodic filings with the Securities and Exchange Commission, including our Annual Report on Form 10-K filed on February 24, 2021. Therefore, readers are cautioned not to place undue
reliance on these forward-looking statements, which reflect management’s opinions only as of the date hereof. Our actual results and financial condition may differ materially from those indicated
in the forward-looking statements. Clean Harbors undertakes no obligation to revise or publicly release the results of any revision to these forward-looking statements other than through its filings
with the SEC, which may be viewed in the "Investors" section of the Clean Harbors website.
Statement Regarding use of Non-GAAP Measures:
Adjusted EBITDA, adjusted free cash flow, adjusted net income and adjusted earnings per share, as presented in these slides, are non-GAAP financial measures and should not be considered
alternatives to other measurements under generally accepted accounting principles (GAAP), but viewed only as a supplement to those measurements. These non-GAAP measures are not
calculated identically by all companies. Therefore, our measurements of Adjusted EBITDA, adjusted free cash flow, adjusted net income (loss) and adjusted earnings (loss) per share are clearly
defined and may not be comparable to similarly titled measures reported by other companies. We believe that Adjusted EBITDA provides additional useful information to investors since our loan
covenants are based upon levels of Adjusted EBITDA achieved and the fact that management routinely evaluates the performance of its businesses based upon levels of Adjusted EBITDA. We
believe adjusted free cash flow provides useful information to investors about our ability to generate cash. We believe adjusted net income (loss) and adjusted earnings (loss) per share provide
useful information about our performance excluding non-recurring or extraordinary items.
Adjusted EBITDA consists of net income (loss) plus accretion of environmental liabilities, stock-based compensation, depreciation and amortization, net interest expense, loss on early
extinguishment of debt, provision for income taxes and excludes other gains, losses and non-cash charges not deemed representative of fundamental segment results and other (income)
expense, net. Adjusted free cash flow consists of net cash from operating activities excluding cash impacts of items derived from non-operating activities, such as taxes paid in connection with
divestitures, less additions to property, plant and equipment plus proceeds from sale of fixed assets. All amounts in USD unless otherwise noted.
For a reconciliation of Adjusted EBITDA and adjusted net income to net income, a reconciliation of adjusted earnings per share to net income per share and a reconciliation of net cash from
operating activities to adjusted free cash flow, please refer to the appendix of this presentation.

3
Summary of Q3 Results
* For a reconciliation of non-GAAP measures to its nearest GAAP equivalent, please refer to the appendix in this presentation.
▪ Revenue of $951.5M, a 22% increase YoY
▪ Net income of $65.4 million or EPS of $1.20 and Adjusted EPS of $1.14
▪ Adjusted EBITDA* increased 10% to $185.1M; Adjusted EBITDA margin was 19.5%
▪ Adjusted free cash flow was $61.1 million, on track to hit annual target
▪ Environmental Services segment benefited from steady flow of high-value waste streams,
pricing initiatives and demonstrated recovery in service businesses, supported by cost
mitigation programs and productivity gains
▪ Safety-Kleen Sustainability Solutions segment significantly increased revenue and
profitability due to market driven re-refining spread and higher YoY volumes
▪ Corporate segment increased YoY due to higher incentive comp and professional fees, as
well as cybersecurity and system investments

4
$180.0 $166.5
27.7%
22.3%
12.0%
17.0%
22.0%
27.0%
32.0%
37.0%
42.0%
$0.0
$20.0
$40.0
$60.0
$80.0
$100.0
$120.0
$140.0
$160.0
$180.0
Q3 2020 Q3 2021
Adjusted EBITDA Margin
$650.6
$745.6
Q3 2020 Q3 2021
Revenue(in millions)
Adjusted
EBITDA*(in millions)
* For a reconciliation of Adjusted EBITDA to net income, please refer to the appendix in this presentation.
+ 15%
- 8%
Q3 Performance
▪ Revenue up YoY due to growth in higher value waste streams and
strong demand for Industrial Services and Field Services
▪ Adjusted EBITDA declined, as expected, based on much higher
levels of government assistance and COVID decontamination work
a year ago, as well as inflationary pressures, partly offset by
revenue growth, pricing, and cost savings
▪ Incinerator utilization was 82% vs. 80% a year ago. Average price
up 18% from Q3’20, driven by pricing initiatives and higher value
waste streams
▪ Landfill tonnage down 5% YoY as project volumes stall due to
lingering pandemic concerns, while average price per ton up 17%
▪ $8M from decontamination response work vs. $29M a year ago;
higher than expected as pandemic remains a factor
▪ Performed 232K parts washer services; most SK core offerings
trending positively
Environmental Services

5
$128.7
$205.8
Q3 2020 Q3 2021
+ 60%
Q3 Performance
▪ Revenue increased YoY due to higher volumes, price increases
and limited shutdowns vs prior year when the pandemic slowed
production. Product demand was robust throughout the quarter
due to industry supply conditions and growing interest in our
sustainable offerings
▪ Adjusted EBITDA and margin improvement reflect wider than
normal re-refining spread due to supply-driven increases in base
oil pricing, as well as productivity gains and cost initiatives
▪ Gathered 60 million gallons of waste oil, compared with 50 million
a year ago; average collection costs are higher than a year ago
as we shifted from a charge-for-oil to a pay-for oil environment
▪ In line with expectations, blended products accounted for 21% of
volume compared with 25% a year ago and 21% in Q2; direct
volume was 8% in the quarter, compared with 9% a year ago and
6% in Q2
$29.6
$70.8
23.0%
34.4%
17.0%
29.0%
41.0%
$-
$10.0
$20.0
$30.0
$40.0
$50.0
$60.0
$70.0
Q3 2020 Q3 2021
Adjusted EBITDA Margin
Revenue(in millions)
* For a reconciliation of Adjusted EBITDA to net income, please refer to the appendix in this presentation.
Adjusted
EBITDA*(in millions)
Safety-Kleen Sustainability Solutions
+ 139%

6
▪ $1.25 billion all-cash transaction completed in early October
▪ Raised $1 billion term loan at favorable rate (L + 200)
▪ Expect to achieve $40M+ of synergies after first full year of operation
▪ Confident this transaction will drive considerable shareholder value
▪ Affords us network, resource and market density
▪ Cross-selling opportunities will be abundant on both sides
▪ Early integration going well; strong cultural fit
– Overview

7
▪ Invest capex to drive growth
▪ Evaluate acquisition and divestiture
opportunities
▪ Execute authorized buyback plan
▪ Assess current debt structure
Capital Allocation Strategy – Driven by ROIC
Organic Growth
Investments
Acquisitions
& Divestitures
Share
Repurchases
Debt
Repayment
1 2
43

8
FINANCIAL OVERVIEW
9
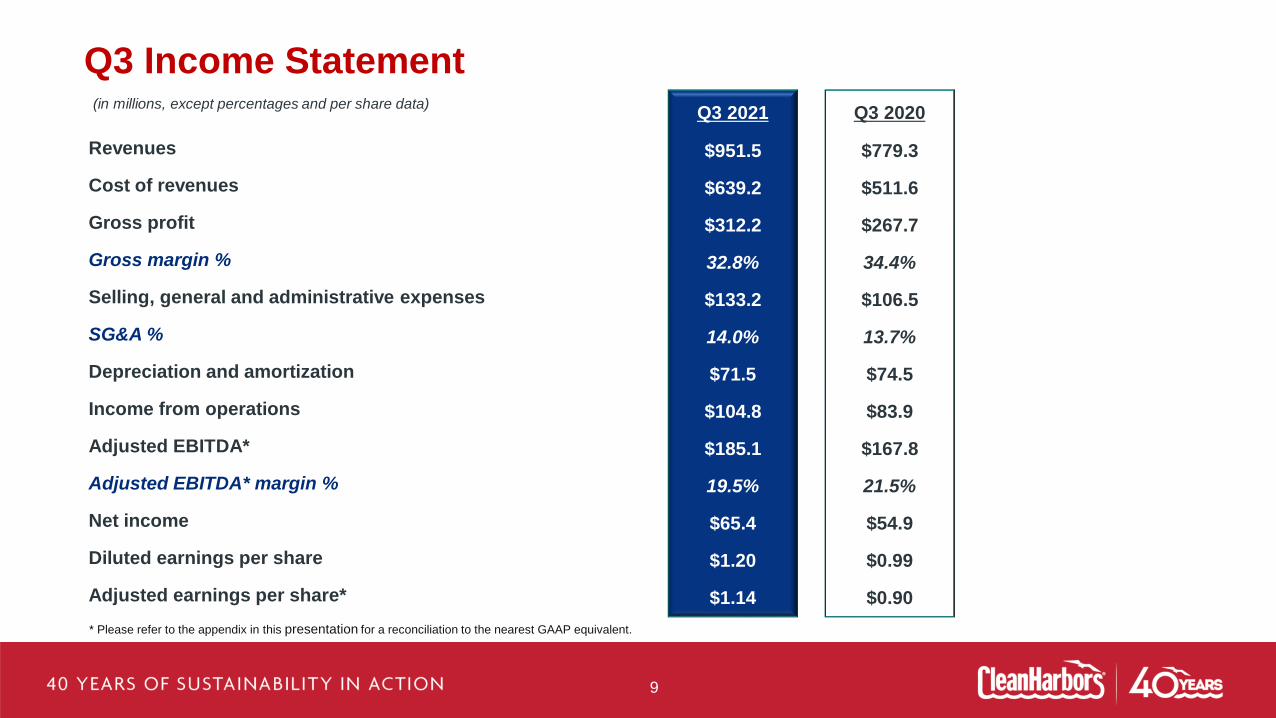
Q3 Income Statement(in millions, except percentages and per share data)
* Please refer to the appendix in this presentation for a reconciliation to the nearest GAAP equivalent.
Revenues
Cost of revenues
Gross profit
Gross margin %
Selling, general and administrative expenses
SG&A %
Depreciation and amortization
Income from operations
Adjusted EBITDA*
Adjusted EBITDA* margin %
Net income
Diluted earnings per share
Adjusted earnings per share*
Q3 2020
$779.3
$511.6
$267.7
34.4%
$106.5
13.7%
$74.5
$83.9
$167.8
21.5%
$54.9
$0.99
$0.90
Q3 2021
$951.5
$639.2
$312.2
32.8%
$133.2
14.0%
$71.5
$104.8
$185.1
19.5%
$65.4
$1.20
$1.14

10
6/30/21
$666.3
$249.2
$718.8
$1,555
$205.9
Balance Sheet Highlights
Cash and short-term marketable securities
Accounts payable
Billed and unbilled receivables
Current and long-term debt
Environmental liabilities
(in millions) 9/30/21
$711.5
$286.6
$773.1
$1,554
$203.8
12/31/20
$571.0
$195.9
$667.2
$1,557
$202.7

11
Q3 2021
$102.8
($41.7)
$61.1
$3.0
Cash Flow Highlights
Cash from operations
Capital expenditures, net of disposals
Adjusted free cash flow*
Share repurchases
(in millions)
* Please refer to the appendix in this presentation for a reconciliation to the nearest GAAP equivalent.
Q3 2020
$143.9
($20.4)
$123.5
$22.2

12
Full-Year 2021
Range
Net Income
Adjusted EBITDA*
$171
$655
to $196
to $675
Guidance (as of November 3, 2021)
* Please refer to the appendix in this presentation for a reconciliation of Adjusted EBITDA and Adjusted Free Cash Flow to the nearest GAAP equivalent.
Net Cash from Operating Activities
Adjusted Free Cash Flow*
$500
$310
to $540
to $330
(in millions)

13
APPENDIX

14
Non-GAAP Results Reconciliation
(in thousands, except percentages)
For the Three Months Ended For the Nine Months Ended
September 30,
2021
September 30,
2020
September 30,
2021
September 30,
2020
Net income $ 65,443 $ 54,910 $ 154,254 $ 95,505
Accretion of environmental liabilities 2,799 2,822 8,625 8,149
Stock-based compensation 6,001 6,662 12,786 12,739
Depreciation and amortization 71,451 74,470 215,206 221,497
Other (income) expense, net (199) (2,268) 2,509 597
Loss on sale of businesses — 118 — 3,376
Interest expense, net of interest income 17,984 17,407 53,953 54,848
Provision for income taxes 21,605 13,712 54,973 35,269
Adjusted EBITDA $ 185,084 $ 167,833 $ 502,306 $ 431,980
Adjusted EBITDA Margin 19.5% 21.5% 18.7% 18.4 %

15
For the Three Months Ended For the Nine Months Ended
September 30,
2021
September 30,
2020
September 30,
2021
September 30,
2020
Adjusted net income
Net income $ 65,443 $ 54,910 $ 154,254 $ 95,505
Loss on sale of businesses — 118 — 3,376
Tax-related valuation allowances and other* (3,228) (5,128) (3,221) (4,502)
Adjusted net income $ 62,215 $ 49,900 $ 151,033 $ 94,379
Adjusted earnings per share
Earnings per share $ 1.20 $ 0.99 $ 2.81 $ 1.71
Loss on sale of businesses — — — 0.06
Tax-related valuation allowances and other* (0.06) (0.09) (0.06) (0.08)
Adjusted earnings per share $ 1.14 $ 0.90 $ 2.75 $ 1.69
(in thousands, except per share amounts)
Non-GAAP Results Reconciliation
* For the three and nine months ended September 30, 2020, other amounts include a $1.6 million benefit, or $0.03 per share, related to tax
benefits from impacts of amendments to prior period tax filings.

16
Non-GAAP Results Reconciliation
(in thousands)For the Three Months Ended For the Nine Months Ended
September 30,
2021
September 30,
2020
September 30,
2021
September 30,
2020
Adjusted free cash flow
Net cash from operating activities $ 102,794 $ 143,946 $ 368,226 $ 317,432
Additions to property, plant and equipment(54,666) (24,636) (146,654) (150,357)
Purchase and capital improvements of corporate HQ— — — 21,080
Proceeds from sale and disposal of fixed assets12,945 4,206 16,424 7,307
Adjusted free cash flow $ 61,073 $ 123,516 $ 237,996 $ 195,462

17
Non-GAAP Guidance Reconciliation
For the Year Ending
December 31, 2021
Projected net cash from operating activities $500 to $540
Additions to property, plant and equipment (206) to (226)
Proceeds from sale and disposal of fixed assets 16 to 16
Projected adjusted free cash flow $310 to $330
For the Year Ending
December 31, 2021
Projected GAAP net income $171 to $196
Adjustments:
Accretion of environmental liabilities 12 to 11
Stock-based compensation 18 to 19
Depreciation and amortization 305 to 295
Other expense, net 3 to 3
Interest expense, net 78 to 77
Provision for income taxes 68 to 74
Projected Adjusted EBITDA $655 to $675
(in millions)
(in millions)

18
QUESTIONS?