Embed Size (px)
Citation preview
8/2/2019 Third Quarter Ended 31 December 2011
http://slidepdf.com/reader/full/third-quarter-ended-31-december-2011 1/19
PETROLIAM NASIONAL BERHAD(20076-K)
(Incorporated in Malaysia)
QUARTERLY REPORT FOR THE THIRD QUARTER ENDED 31 DECEMBER 2011
1
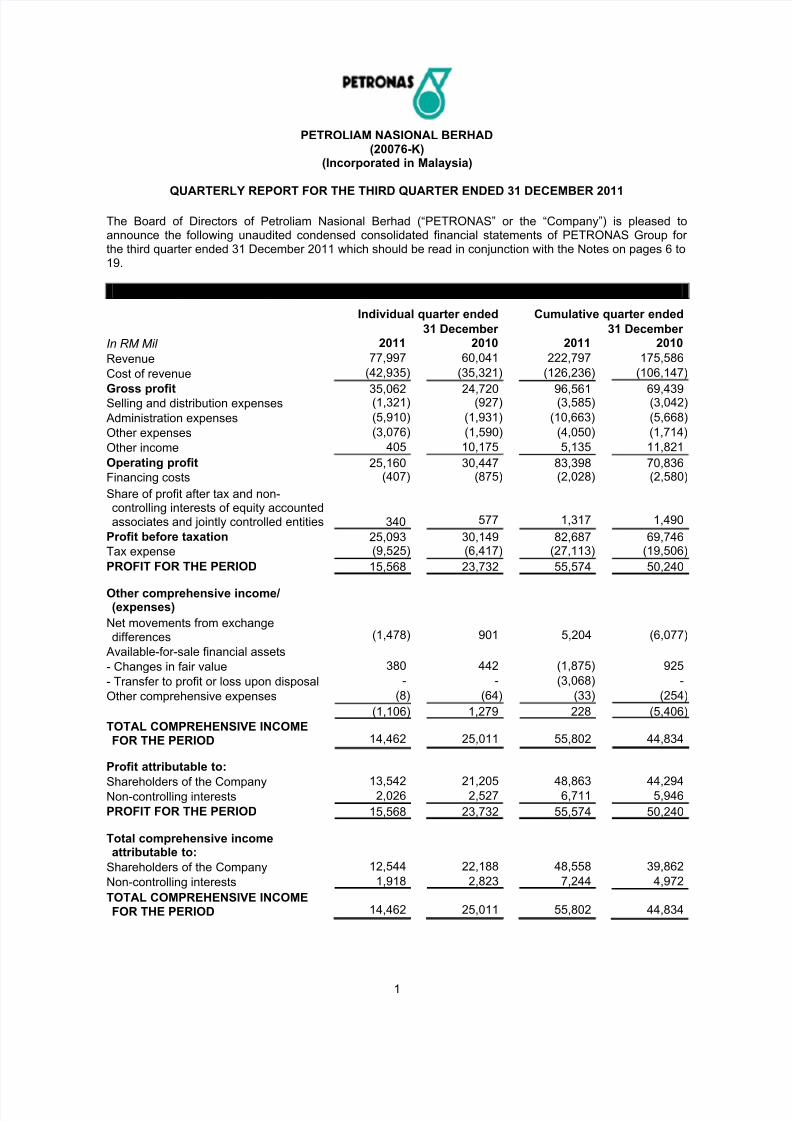
The Board of Directors of Petroliam Nasional Berhad (“PETRONAS” or the “Company”) is pleased toannounce the following unaudited condensed consolidated financial statements of PETRONAS Group for the third quarter ended 31 December 2011 which should be read in conjunction with the Notes on pages 6 to19.
UNAUDITED CONDENSED CONSOLIDATED STATEMENT OF COMPREHENSIVE INCOME
Individual quarter ended Cumulative quarter ended
31 December 31 December
In RM Mil 2011 2010 2011 2010
Revenue 77,997 60,041 222,797 175,586Cost of revenue (42,935) (35,321) (126,236) (106,147)
Gross profit 35,062 24,720 96,561 69,439
Selling and distribution expenses (1,321) (927) (3,585) (3,042)
Administration expenses (5,910) (1,931) (10,663) (5,668)
Other expenses (3,076) (1,590) (4,050) (1,714)
Other income 405 10,175 5,135 11,821
Operating profit 25,160 30,447 83,398 70,836
Financing costs (407) (875) (2,028) (2,580)
Share of profit after tax and non-controlling interests of equity accountedassociates and jointly controlled entities 340 577 1,317 1,490
Profit before taxation 25,093 30,149 82,687 69,746Tax expense (9,525) (6,417) (27,113) (19,506)
PROFIT FOR THE PERIOD 15,568 23,732 55,574 50,240
Other comprehensive income/(expenses)
Net movements from exchangedifferences (1,478) 901 5,204 (6,077)
Available-for-sale financial assets
- Changes in fair value 380 442 (1,875) 925
- Transfer to profit or loss upon disposal - - (3,068) -
Other comprehensive expenses (8) (64) (33) (254)
(1,106) 1,279 228 (5,406)
TOTAL COMPREHENSIVE INCOMEFOR THE PERIOD 14,462 25,011 55,802 44,834
Profit attributable to:
Shareholders of the Company 13,542 21,205 48,863 44,294
Non-controlling interests 2,026 2,527 6,711 5,946
PROFIT FOR THE PERIOD 15,568 23,732 55,574 50,240
Total comprehensive incomeattributable to:
Shareholders of the Company 12,544 22,188 48,558 39,862
Non-controlling interests 1,918 2,823 7,244 4,972
TOTAL COMPREHENSIVE INCOMEFOR THE PERIOD 14,462 25,011 55,802 44,834
8/2/2019 Third Quarter Ended 31 December 2011
http://slidepdf.com/reader/full/third-quarter-ended-31-december-2011 2/19
PETROLIAM NASIONAL BERHAD(20076-K)
(Incorporated in Malaysia)
QUARTERLY REPORT FOR THE THIRD QUARTER ENDED 31 DECEMBER 2011
2
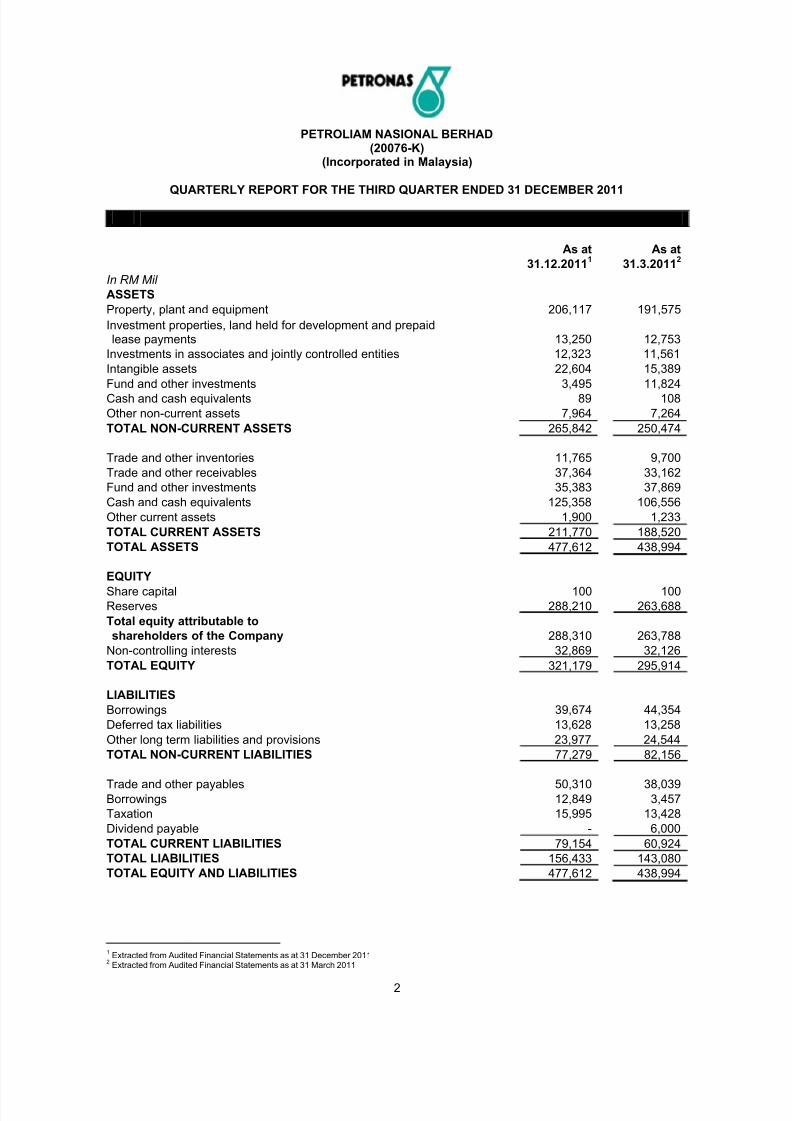
CONDENSED CONSOLIDATED STATEMENT OF FINANCIAL POSITION
As at As at
31.12.20111
31.3.20112
In RM Mil
ASSETS
Property, plant and equipment 206,117 191,575
Investment properties, land held for development and prepaidlease payments 13,250 12,753
Investments in associates and jointly controlled entities 12,323 11,561Intangible assets 22,604 15,389
Fund and other investments 3,495 11,824
Cash and cash equivalents 89 108
Other non-current assets 7,964 7,264
TOTAL NON-CURRENT ASSETS 265,842 250,474
Trade and other inventories 11,765 9,700
Trade and other receivables 37,364 33,162
Fund and other investments 35,383 37,869
Cash and cash equivalents 125,358 106,556
Other current assets 1,900 1,233
TOTAL CURRENT ASSETS 211,770 188,520
TOTAL ASSETS 477,612 438,994
EQUITY
Share capital 100 100
Reserves 288,210 263,688
Total equity attributable to
shareholders of the Company 288,310 263,788
Non-controlling interests 32,869 32,126
TOTAL EQUITY 321,179 295,914
LIABILITIES
Borrowings 39,674 44,354
Deferred tax liabilities 13,628 13,258
Other long term liabilities and provisions 23,977 24,544
TOTAL NON-CURRENT LIABILITIES 77,279 82,156
Trade and other payables 50,310 38,039
Borrowings 12,849 3,457
Taxation 15,995 13,428
Dividend payable - 6,000
TOTAL CURRENT LIABILITIES 79,154 60,924
TOTAL LIABILITIES 156,433 143,080
TOTAL EQUITY AND LIABILITIES 477,612 438,994
1Extracted from Audited Financial Statements as at 31 December 2011
2Extracted from Audited Financial Statements as at 31 March 2011
8/2/2019 Third Quarter Ended 31 December 2011
http://slidepdf.com/reader/full/third-quarter-ended-31-december-2011 3/19
PETROLIAM NASIONAL BERHAD(20076-K)
(Incorporated in Malaysia)
QUARTERLY REPORT FOR THE THIRD QUARTER ENDED 31 DECEMBER 2011
3
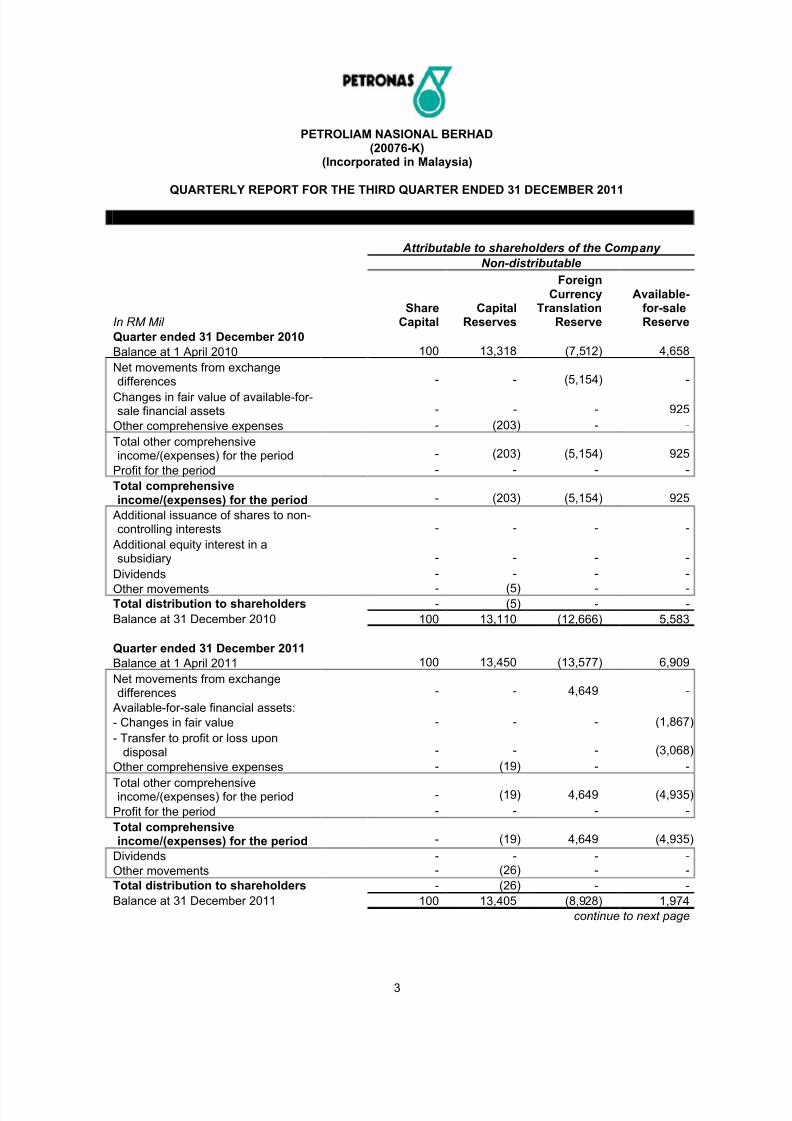
UNAUDITED CONDENSED CONSOLIDATED STATEMENT OF CHANGES IN EQUITY Attributable to shareholders of the Company
Non-distributable
In RM Mil Share
CapitalCapital
Reserves
ForeignCurrency
TranslationReserve
Available-for-saleReserve
Quarter ended 31 December 2010
Balance at 1 April 2010 100 13,318 (7,512) 4,658
Net movements from exchangedifferences - - (5,154) -
Changes in fair value of available-for-sale financial assets - - - 925
Other comprehensive expenses - (203) - -
Total other comprehensiveincome/(expenses) for the period - (203) (5,154) 925
Profit for the period - - - -
Total comprehensiveincome/(expenses) for the period - (203) (5,154) 925
Additional issuance of shares to non-controlling interests - - - -
Additional equity interest in asubsidiary - - - -
Dividends - - - -
Other movements - (5) - -
Total distribution to shareholders - (5) - -
Balance at 31 December 2010 100 13,110 (12,666) 5,583
Quarter ended 31 December 2011
Balance at 1 April 2011 100 13,450 (13,577) 6,909
Net movements from exchangedifferences - - 4,649 -
Available-for-sale financial assets:
- Changes in fair value - - - (1,867)- Transfer to profit or loss upon
disposal - - - (3,068)
Other comprehensive expenses - (19) - -
Total other comprehensiveincome/(expenses) for the period - (19) 4,649 (4,935)
Profit for the period - - - -
Total comprehensiveincome/(expenses) for the period - (19) 4,649 (4,935)
Dividends - - - -
Other movements - (26) - -
Total distribution to shareholders - (26) - -
Balance at 31 December 2011 100 13,405 (8,928) 1,974continue to next page
8/2/2019 Third Quarter Ended 31 December 2011
http://slidepdf.com/reader/full/third-quarter-ended-31-december-2011 4/19
PETROLIAM NASIONAL BERHAD(20076-K)
(Incorporated in Malaysia)
QUARTERLY REPORT FOR THE THIRD QUARTER ENDED 31 DECEMBER 2011
4
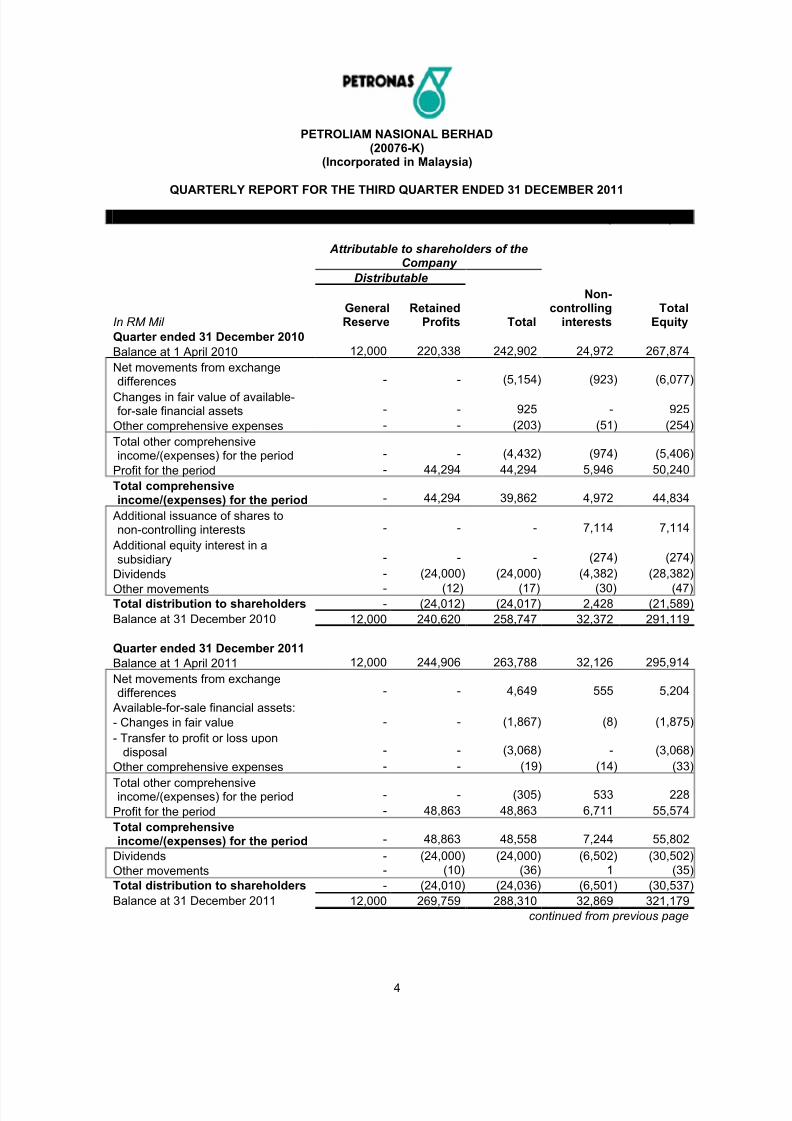
UNAUDITED CONDENSED CONSOLIDATED STATEMENT OF CHANGES IN EQUITY (continued) Attributable to shareholders of the
Company
Distributable
In RM Mil GeneralReserve
RetainedProfits Total
Non-controlling
interestsTotal
Equity
Quarter ended 31 December 2010
Balance at 1 April 2010 12,000 220,338 242,902 24,972 267,874
Net movements from exchangedifferences - - (5,154) (923) (6,077)
Changes in fair value of available-for-sale financial assets - - 925 - 925
Other comprehensive expenses - - (203) (51) (254)
Total other comprehensiveincome/(expenses) for the period - - (4,432) (974) (5,406)
Profit for the period - 44,294 44,294 5,946 50,240
Total comprehensiveincome/(expenses) for the period - 44,294 39,862 4,972 44,834
Additional issuance of shares tonon-controlling interests - - - 7,114 7,114
Additional equity interest in asubsidiary - - - (274) (274)
Dividends - (24,000) (24,000) (4,382) (28,382)
Other movements - (12) (17) (30) (47)
Total distribution to shareholders - (24,012) (24,017) 2,428 (21,589)
Balance at 31 December 2010 12,000 240,620 258,747 32,372 291,119
Quarter ended 31 December 2011
Balance at 1 April 2011 12,000 244,906 263,788 32,126 295,914
Net movements from exchangedifferences - - 4,649 555 5,204
Available-for-sale financial assets:
- Changes in fair value - - (1,867) (8) (1,875)- Transfer to profit or loss upon
disposal - - (3,068) - (3,068)
Other comprehensive expenses - - (19) (14) (33)
Total other comprehensiveincome/(expenses) for the period - - (305) 533 228
Profit for the period - 48,863 48,863 6,711 55,574
Total comprehensiveincome/(expenses) for the period - 48,863 48,558 7,244 55,802
Dividends - (24,000) (24,000) (6,502) (30,502)
Other movements - (10) (36) 1 (35)
Total distribution to shareholders - (24,010) (24,036) (6,501) (30,537)
Balance at 31 December 2011 12,000 269,759 288,310 32,869 321,179continued from previous page
8/2/2019 Third Quarter Ended 31 December 2011
http://slidepdf.com/reader/full/third-quarter-ended-31-december-2011 5/19
PETROLIAM NASIONAL BERHAD(20076-K)
(Incorporated in Malaysia)
QUARTERLY REPORT FOR THE THIRD QUARTER ENDED 31 DECEMBER 2011
5
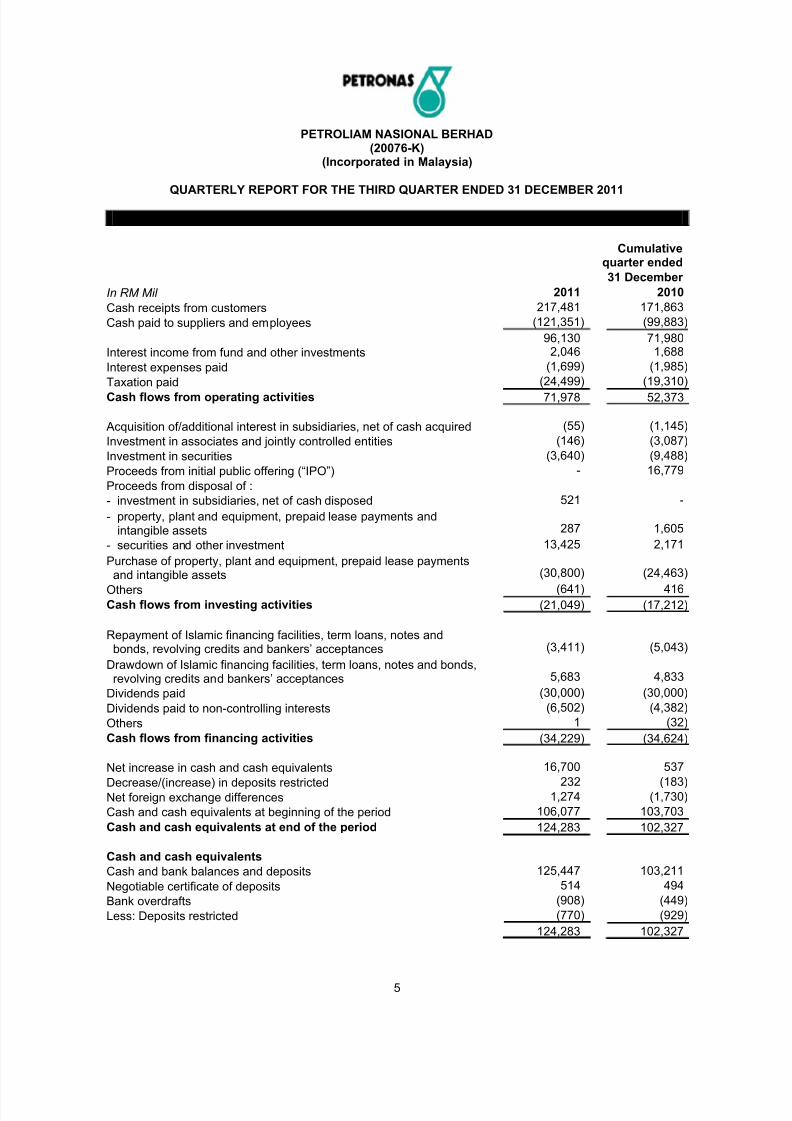
UNAUDITED CONDENSED CONSOLIDATED CASH FLOW STATEMENT
Cumulativequarter ended
31 December
In RM Mil 2011 2010
Cash receipts from customers 217,481 171,863
Cash paid to suppliers and employees (121,351) (99,883)
96,130 71,980
Interest income from fund and other investments 2,046 1,688
Interest expenses paid (1,699) (1,985)
Taxation paid (24,499) (19,310)
Cash flows from operating activities 71,978 52,373
Acquisition of/additional interest in subsidiaries, net of cash acquired (55) (1,145)
Investment in associates and jointly controlled entities (146) (3,087)
Investment in securities (3,640) (9,488)
Proceeds from initial public offering (“IPO”) - 16,779
Proceeds from disposal of :
- investment in subsidiaries, net of cash disposed 521 -
- property, plant and equipment, prepaid lease payments andintangible assets 287 1,605
- securities and other investment 13,425 2,171
Purchase of property, plant and equipment, prepaid lease paymentsand intangible assets (30,800) (24,463)
Others (641) 416
Cash flows from investing activities (21,049) (17,212)
Repayment of Islamic financing facilities, term loans, notes andbonds, revolving credits and bankers‟ acceptances (3,411) (5,043)
Drawdown of Islamic financing facilities, term loans, notes and bonds,revolving credits and bankers‟ acceptances 5,683 4,833
Dividends paid (30,000) (30,000)
Dividends paid to non-controlling interests (6,502) (4,382)
Others 1 (32)Cash flows from financing activities (34,229) (34,624)
Net increase in cash and cash equivalents 16,700 537
Decrease/(increase) in deposits restricted 232 (183)
Net foreign exchange differences 1,274 (1,730)
Cash and cash equivalents at beginning of the period 106,077 103,703
Cash and cash equivalents at end of the period 124,283 102,327
Cash and cash equivalents
Cash and bank balances and deposits 125,447 103,211
Negotiable certificate of deposits 514 494
Bank overdrafts (908) (449)Less: Deposits restricted (770) (929)
124,283 102,327
8/2/2019 Third Quarter Ended 31 December 2011
http://slidepdf.com/reader/full/third-quarter-ended-31-december-2011 6/19
PETROLIAM NASIONAL BERHAD(20076-K)
(Incorporated in Malaysia)
QUARTERLY REPORT FOR THE THIRD QUARTER ENDED 31 DECEMBER 2011
6
PART A – EXPLANATORY NOTES PURSUANT TO FRS 134
1. BASIS OF PREPARATION
The unaudited condensed consolidated financial statements have been prepared in accordance withFRS 134, Interim Financial Reporting. The results for the interim periods are unaudited and should beread in conjunction with the Group‟s audited consolidated financial statements and the accompanyingnotes for the period ended 31 December 2011.
2. SIGNIFICANT ACCOUNTING POLICIES
PETRONAS prepares its audited consolidated financial statements annually on the basis of FinancialReporting Standards (FRSs) issued by the Malaysian Accounting Standards Board (MASB). Thefinancial information presented herein has been prepared in accordance with the accounting policiesused in preparing the audited consolidated financial statements for 31 December 2011. These policiesdo not differ significantly from those used in the audited consolidated financial statements for 31March 2011 other than that disclosed in the first quarter report relating to adoption of new and revisedFRSs and Amendments to FRSs as of 1 April 2011.
3. AUDIT REPORT OF PRECEDING ANNUAL FINANCIAL STATEMENTS
There was no qualified audit report issued by the auditors in the annual financial statements for theperiod ended 31 December 2011.
4. SEASONALITY OR CYCLICALITY OF OPERATIONS
The Group‟s operations, on overall, are not significantly affected by seasonal or cyclical fluctuations of the business/industry.
5. EXCEPTIONAL ITEMS
There was no exceptional item during the quarter under review.
6. DIVIDENDS
During the period ended 31 December 2011:
i. the Company paid a third tax exempt interim dividend under Section 84 of the Petroleum (IncomeTax) Act, 1967 of RM60,000 per ordinary share amounting to RM6.0 billion in respect of thefinancial year ended 31 March 2011;
ii. the shareholders approved and the Company paid a tax exempt final dividend under Section 84of the Petroleum (Income Tax) Act, 1967 of RM220,000 per ordinary share amounting to RM22.0billion in respect of the financial year ended 31 March 2011; and
iii. the Company declared and paid a first tax exempt interim dividend under Section 84 of thePetroleum (Income Tax) Act, 1967 of RM20,000 per ordinary share amounting to RM2.0 billion inrespect of the financial period ended 31 December 2011.
8/2/2019 Third Quarter Ended 31 December 2011
http://slidepdf.com/reader/full/third-quarter-ended-31-december-2011 7/19
PETROLIAM NASIONAL BERHAD(20076-K)
(Incorporated in Malaysia)
QUARTERLY REPORT FOR THE THIRD QUARTER ENDED 31 DECEMBER 2011
7
6. DIVIDENDS (continued)
The Directors propose a tax exempt final dividend under Section 84 of the Petroleum (Income Tax) Act, 1967 of RM280,000 per ordinary share amounting to RM28.0 billion in respect of the financialperiod ended 31 December 2011 for shareholders‟ approval at the forthcoming Annual GeneralMeeting.
The financial statements of the current financial period do not reflect this proposed dividend. Such
dividend, if approved by the shareholders, will be accounted for in equity as an appropriation of retained profits in the financial year ending 31 December 2012.
7. SIGNIFICANT AND SUBSEQUENT EVENTS
Upon the secession of the Republic of South Sudan (“RSS”) from the Republic of Sudan (“RoS”) on 9July 2011, significant parts of Contract Areas under the Group‟s Exploration and Production Service Agreements (“EPSA”) for Block 1,2&4, Block 3&7 and Block 5A signed with the RoS, now lie under the jurisdiction of the RSS. Subsequently, the RSS agreed to grant Foreign Oil companies (“FOCs”)including the Group, rights to conduct petroleum operations in the original Contract Areas of thesethree blocks located in South Sudan through Transition Agreements (“TAs”) which were signed on 13January 2012. The TAs contain substantially the same fiscal and contractual terms and conditions.
Following disputes between the RSS and RoS, the Government of RSS through the Ministry of Petroleum and Mining has issued a Shut Down Order in respect of all petroleum operations in Block1,2&4, Block 3&7 and Block 5A located in South Sudan. All producing wells in these blocks located inSouth Sudan were completely shut down on 23 January 2012, 24 January 2012 and 6 February 2012respectively under close supervision by the RSS National Intelligence Security Services. As aconsequence, no new oil production has since flowed from South Sudan.
Following the above shut downs, the Group has in consultation with other foreign parties undertakenvarious measures including preservation of the oil fields facilities as well as conducting ongoingdiscussions with senior officials of the RSS and RoS in order to minimise the adverse impact to theGroup. The full impact of the above shut downs to the Group is not yet determinable and is largelydependent upon the outcome of the negotiations between the RSS and RoS.
8. CHANGES IN COMPOSITION OF THE GROUP
There was no material change in the composition of the Group.
9. OPERATING SEGMENTS
The Group has four reportable operating segments comprising Exploration and Production, Gas andPower, Downstream and Corporate and Others. Corporate and Others segment comprises primarilylogistics and maritime segment, property segment and central treasury function.
Performance is measured based on segment net operating profit after tax (“NOPAT”), which is derivedfrom net profit after tax excluding financing cost, share of profits of associates and jointly controlledentities and other non-operating income and expenses, as included in the internal management reports.
Segment NOPAT is used to measure performance as the Group chief operating decision maker, whichin this case is the PETRONAS Executive Committee, believes that such information is the mostrelevant in evaluating the results of the segments.
PART A – EXPLANATORY NOTES PURSUANT TO FRS 134 (continued)
8/2/2019 Third Quarter Ended 31 December 2011
http://slidepdf.com/reader/full/third-quarter-ended-31-december-2011 8/19
PETROLIAM NASIONAL BERHAD(20076-K)
(Incorporated in Malaysia)
QUARTERLY REPORT FOR THE THIRD QUARTER ENDED 31 DECEMBER 2011
8
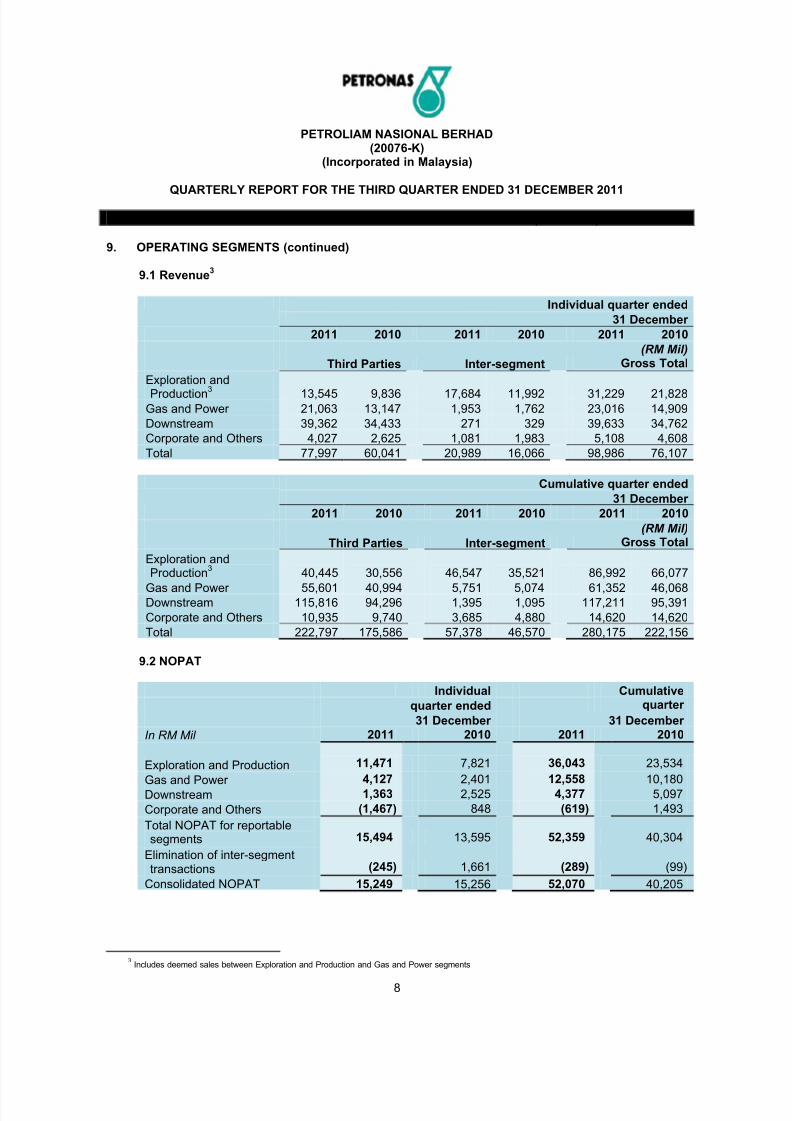
9. OPERATING SEGMENTS (continued)
9.1 Revenue3
Individual quarter ended
31 December
2011 2010 2011 2010 2011 2010
(RM Mil)
Third Parties Inter-segment Gross Total
Exploration andProduction
313,545 9,836 17,684 11,992 31,229 21,828
Gas and Power 21,063 13,147 1,953 1,762 23,016 14,909
Downstream 39,362 34,433 271 329 39,633 34,762
Corporate and Others 4,027 2,625 1,081 1,983 5,108 4,608
Total 77,997 60,041 20,989 16,066 98,986 76,107
Cumulative quarter ended
31 December
2011 2010 2011 2010 2011 2010
(RM Mil)
Third Parties Inter-segment Gross Total
Exploration andProduction
340,445 30,556 46,547 35,521 86,992 66,077
Gas and Power 55,601 40,994 5,751 5,074 61,352 46,068
Downstream 115,816 94,296 1,395 1,095 117,211 95,391
Corporate and Others 10,935 9,740 3,685 4,880 14,620 14,620
Total 222,797 175,586 57,378 46,570 280,175 222,156
9.2 NOPAT
Individual Cumulative
quarter ended quarter
31 December 31 December In RM Mil 2011 2010 2011 2010
Exploration and Production 11,471 7,821 36,043 23,534
Gas and Power 4,127 2,401 12,558 10,180
Downstream 1,363 2,525 4,377 5,097
Corporate and Others (1,467) 848 (619) 1,493
Total NOPAT for reportablesegments 15,494 13,595 52,359 40,304
Elimination of inter-segmenttransactions (245) 1,661 (289) (99)
Consolidated NOPAT 15,249 15,256 52,070 40,205
3 Includes deemed sales between Exploration and Production and Gas and Power segments
PART A – EXPLANATORY NOTES PURSUANT TO FRS 134 (continued)
8/2/2019 Third Quarter Ended 31 December 2011
http://slidepdf.com/reader/full/third-quarter-ended-31-december-2011 9/19
PETROLIAM NASIONAL BERHAD(20076-K)
(Incorporated in Malaysia)
QUARTERLY REPORT FOR THE THIRD QUARTER ENDED 31 DECEMBER 2011
9
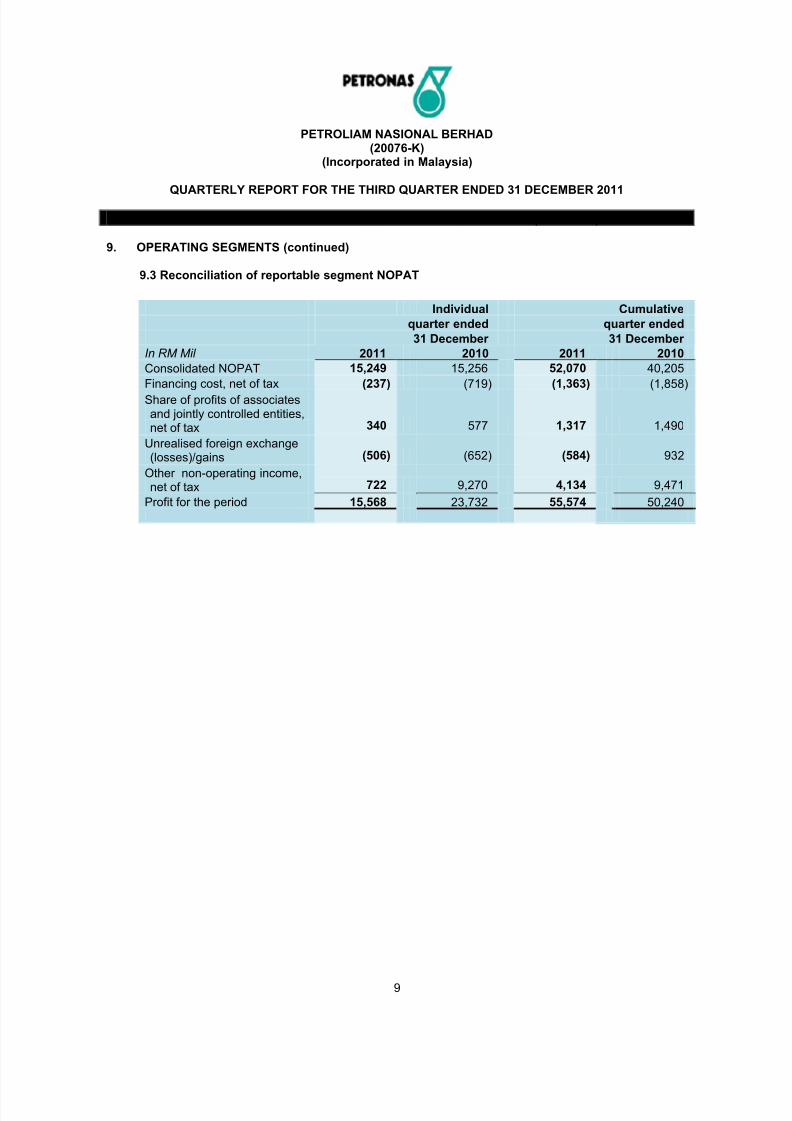
9. OPERATING SEGMENTS (continued)
9.3 Reconciliation of reportable segment NOPAT Individual Cumulative
quarter ended quarter ended
31 December 31 December
In RM Mil 2011 2010 2011 2010Consolidated NOPAT 15,249 15,256 52,070 40,205
Financing cost, net of tax (237) (719) (1,363) (1,858)
Share of profits of associatesand jointly controlled entities,net of tax 340 577 1,317 1,490
Unrealised foreign exchange(losses)/gains (506) (652) (584) 932
Other non-operating income,net of tax 722 9,270 4,134 9,471
Profit for the period 15,568 23,732 55,574 50,240
PART A – EXPLANATORY NOTES PURSUANT TO FRS 134 (continued)
8/2/2019 Third Quarter Ended 31 December 2011
http://slidepdf.com/reader/full/third-quarter-ended-31-december-2011 10/19
PETROLIAM NASIONAL BERHAD(20076-K)
(Incorporated in Malaysia)
QUARTERLY REPORT FOR THE THIRD QUARTER ENDED 31 DECEMBER 2011
10
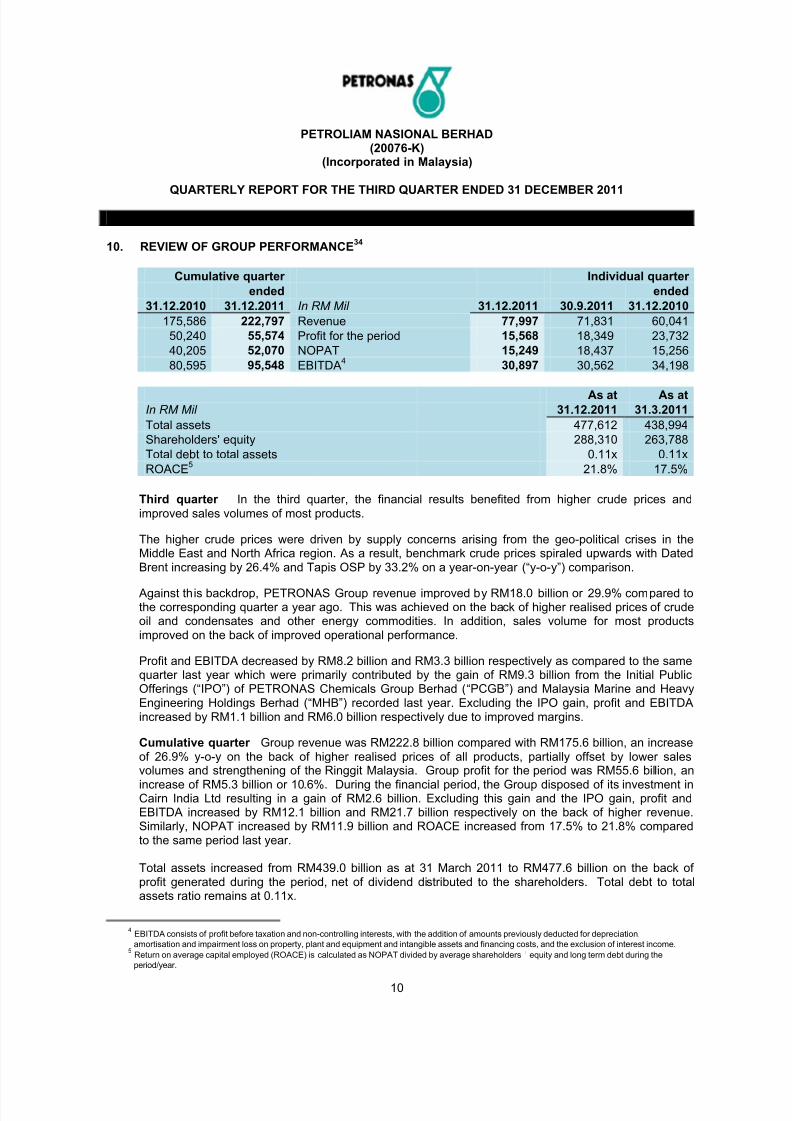
10. REVIEW OF GROUP PERFORMANCE34
Cumulative quarter Individual quarter
ended ended
31.12.2010 31.12.2011 In RM Mil 31.12.2011 30.9.2011 31.12.2010
175,586 222,797 Revenue 77,997 71,831 60,041
50,240 55,574 Profit for the period 15,568 18,349 23,732
40,205 52,070 NOPAT 15,249 18,437 15,256
80,595 95,548 EBITDA4 30,897 30,562 34,198
As at As at
In RM Mil 31.12.2011 31.3.2011
Total assets 477,612 438,994
Shareholders' equity 288,310 263,788
Total debt to total assets 0.11x 0.11x
ROACE5
21.8% 17.5%
Third quarter In the third quarter, the financial results benefited from higher crude prices and
improved sales volumes of most products.
The higher crude prices were driven by supply concerns arising from the geo-political crises in theMiddle East and North Africa region. As a result, benchmark crude prices spiraled upwards with DatedBrent increasing by 26.4% and Tapis OSP by 33.2% on a year-on-year (“y-o-y”) comparison.
Against this backdrop, PETRONAS Group revenue improved by RM18.0 billion or 29.9% compared tothe corresponding quarter a year ago. This was achieved on the back of higher realised prices of crudeoil and condensates and other energy commodities. In addition, sales volume for most productsimproved on the back of improved operational performance.
Profit and EBITDA decreased by RM8.2 billion and RM3.3 billion respectively as compared to the samequarter last year which were primarily contributed by the gain of RM9.3 billion from the Initial PublicOfferings (“IPO”) of PETRONAS Chemicals Group Berhad (“PCGB”) and Malaysia Marine and HeavyEngineering Holdings Berhad (“MHB”) recorded last year. Excluding the IPO gain, profit and EBITDA
increased by RM1.1 billion and RM6.0 billion respectively due to improved margins.
Cumulative quarter Group revenue was RM222.8 billion compared with RM175.6 billion, an increaseof 26.9% y-o-y on the back of higher realised prices of all products, partially offset by lower salesvolumes and strengthening of the Ringgit Malaysia. Group profit for the period was RM55.6 billion, anincrease of RM5.3 billion or 10.6%. During the financial period, the Group disposed of its investment inCairn India Ltd resulting in a gain of RM2.6 billion. Excluding this gain and the IPO gain, profit andEBITDA increased by RM12.1 billion and RM21.7 billion respectively on the back of higher revenue.Similarly, NOPAT increased by RM11.9 billion and ROACE increased from 17.5% to 21.8% comparedto the same period last year.
Total assets increased from RM439.0 billion as at 31 March 2011 to RM477.6 billion on the back of profit generated during the period, net of dividend distributed to the shareholders. Total debt to total
assets ratio remains at 0.11x.
4 EBITDA consists of profit before taxation and non-controlling interests, with the addition of amounts previously deducted for depreciation,
amortisation and impairment loss on property, plant and equipment and intangible assets and financing costs, and the exclusion of interest income. 5 Return on average capital employed (ROACE) is calculated as NOPAT divided by average shareholders‟ equity and long term debt during the
period/year.
PART B – OTHER EXPLANATORY NOTES
8/2/2019 Third Quarter Ended 31 December 2011
http://slidepdf.com/reader/full/third-quarter-ended-31-december-2011 11/19
PETROLIAM NASIONAL BERHAD(20076-K)
(Incorporated in Malaysia)
QUARTERLY REPORT FOR THE THIRD QUARTER ENDED 31 DECEMBER 2011
11
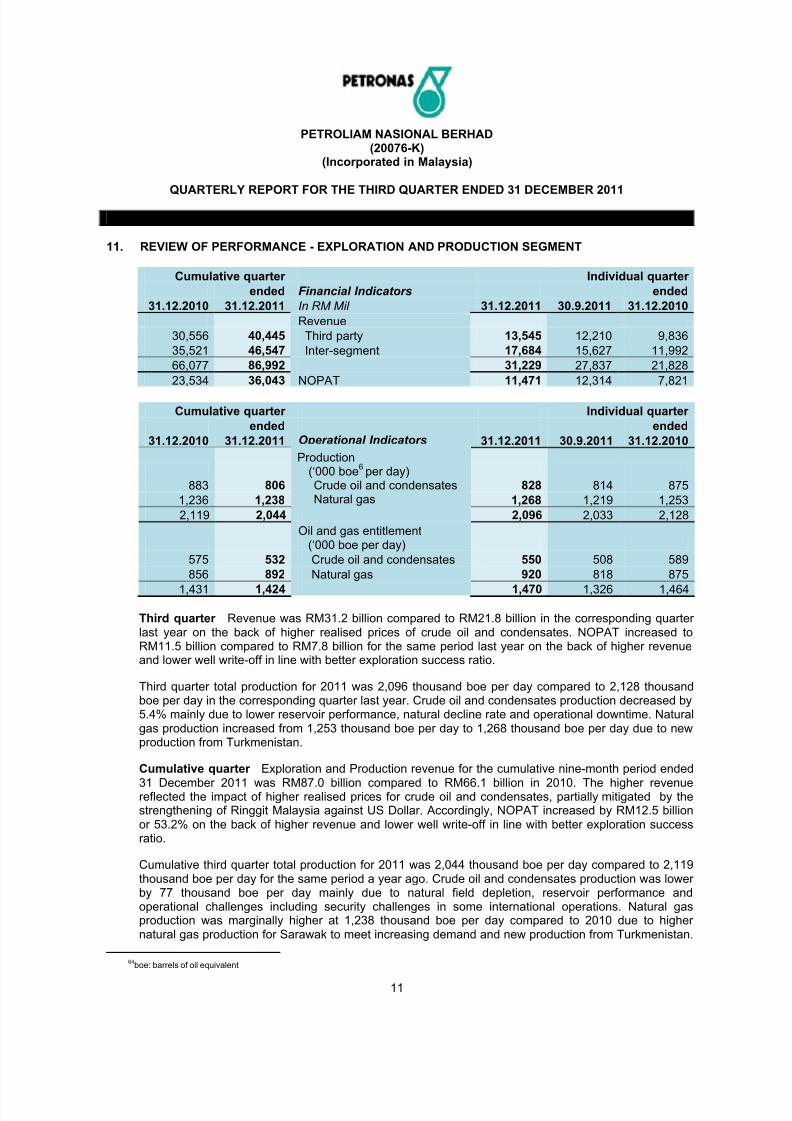
11. REVIEW OF PERFORMANCE - EXPLORATION AND PRODUCTION SEGMENT
Cumulative quarter Individual quarter
ended Financial Indicators ended
31.12.2010 31.12.2011 In RM Mil 31.12.2011 30.9.2011 31.12.2010
Revenue
30,556 40,445 Third party 13,545 12,210 9,836
35,521 46,547 Inter-segment 17,684 15,627 11,992
66,077 86,992 31,229 27,837 21,828
23,534 36,043 NOPAT 11,471 12,314 7,821
Cumulative quarter Individual quarter
ended ended
31.12.2010 31.12.2011 Operational Indicators 31.12.2011 30.9.2011 31.12.2010
Production(„000 boe
64per day)
883 806 Crude oil and condensates 828 814 875
1,236 1,238 Natural gas 1,268 1,219 1,253
2,119 2,044 2,096 2,033 2,128
Oil and gas entitlement(„000 boe per day)
575 532 Crude oil and condensates 550 508 589
856 892 Natural gas 920 818 875
1,431 1,424 1,470 1,326 1,464
Third quarter Revenue was RM31.2 billion compared to RM21.8 billion in the corresponding quarter last year on the back of higher realised prices of crude oil and condensates. NOPAT increased toRM11.5 billion compared to RM7.8 billion for the same period last year on the back of higher revenueand lower well write-off in line with better exploration success ratio.
Third quarter total production for 2011 was 2,096 thousand boe per day compared to 2,128 thousandboe per day in the corresponding quarter last year. Crude oil and condensates production decreased by
5.4% mainly due to lower reservoir performance, natural decline rate and operational downtime. Naturalgas production increased from 1,253 thousand boe per day to 1,268 thousand boe per day due to newproduction from Turkmenistan.
Cumulative quarter Exploration and Production revenue for the cumulative nine-month period ended31 December 2011 was RM87.0 billion compared to RM66.1 billion in 2010. The higher revenuereflected the impact of higher realised prices for crude oil and condensates, partially mitigated by thestrengthening of Ringgit Malaysia against US Dollar. Accordingly, NOPAT increased by RM12.5 billionor 53.2% on the back of higher revenue and lower well write-off in line with better exploration successratio.
Cumulative third quarter total production for 2011 was 2,044 thousand boe per day compared to 2,119thousand boe per day for the same period a year ago. Crude oil and condensates production was lower by 77 thousand boe per day mainly due to natural field depletion, reservoir performance andoperational challenges including security challenges in some international operations. Natural gasproduction was marginally higher at 1,238 thousand boe per day compared to 2010 due to higher natural gas production for Sarawak to meet increasing demand and new production from Turkmenistan.
64
boe: barrels of oil equivalent
PART B – OTHER EXPLANATORY NOTES (continued)
Production(„000 boe
6per day)
Crude oil and condensatesNatural gas
8/2/2019 Third Quarter Ended 31 December 2011
http://slidepdf.com/reader/full/third-quarter-ended-31-december-2011 12/19
PETROLIAM NASIONAL BERHAD(20076-K)
(Incorporated in Malaysia)
QUARTERLY REPORT FOR THE THIRD QUARTER ENDED 31 DECEMBER 2011
12
PART B – OTHER EXPLANATORY NOTES (continued)
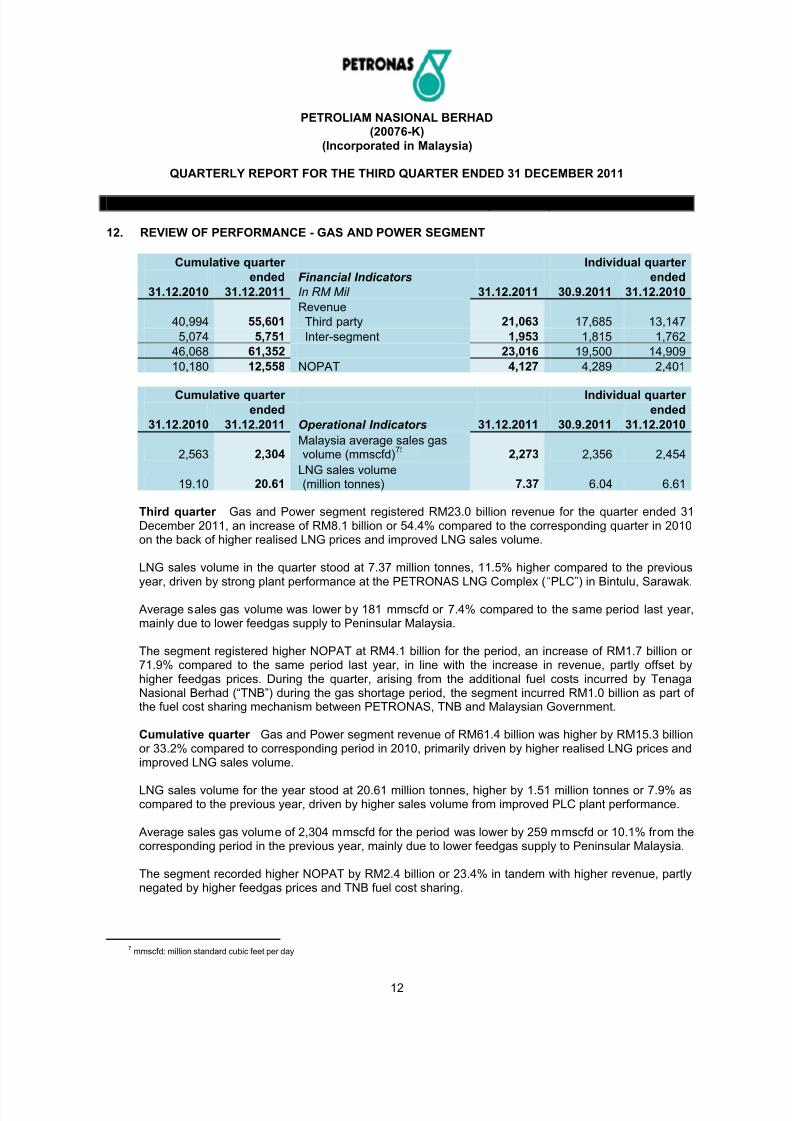
12. REVIEW OF PERFORMANCE - GAS AND POWER SEGMENT
Cumulative quarter Individual quarter
ended Financial Indicators ended
31.12.2010 31.12.2011 In RM Mil 31.12.2011 30.9.2011 31.12.2010
Revenue
40,994 55,601 Third party 21,063 17,685 13,147
5,074 5,751 Inter-segment 1,953 1,815 1,762
46,068 61,352 23,016 19,500 14,909
10,180 12,558 NOPAT 4,127 4,289 2,401
Cumulative quarter Individual quarter
ended ended
31.12.2010 31.12.2011 Operational Indicators 31.12.2011 30.9.2011 31.12.2010
2,563 2,304Malaysia average sales gasvolume (mmscfd)
759 2,273 2,356 2,454
19.10 20.61LNG sales volume(million tonnes) 7.37 6.04 6.61
Third quarter Gas and Power segment registered RM23.0 billion revenue for the quarter ended 31
December 2011, an increase of RM8.1 billion or 54.4% compared to the corresponding quarter in 2010
on the back of higher realised LNG prices and improved LNG sales volume.
LNG sales volume in the quarter stood at 7.37 million tonnes, 11.5% higher compared to the previousyear, driven by strong plant performance at the PETRONAS LNG Complex (“PLC”) in Bintulu, Sarawak.
Average sales gas volume was lower by 181 mmscfd or 7.4% compared to the same period last year,mainly due to lower feedgas supply to Peninsular Malaysia.
The segment registered higher NOPAT at RM4.1 billion for the period, an increase of RM1.7 billion or 71.9% compared to the same period last year, in line with the increase in revenue, partly offset byhigher feedgas prices. During the quarter, arising from the additional fuel costs incurred by TenagaNasional Berhad (“TNB”) during the gas shortage period, the segment incurred RM1.0 billion as part of the fuel cost sharing mechanism between PETRONAS, TNB and Malaysian Government.
Cumulative quarter Gas and Power segment revenue of RM61.4 billion was higher by RM15.3 billionor 33.2% compared to corresponding period in 2010, primarily driven by higher realised LNG prices andimproved LNG sales volume.
LNG sales volume for the year stood at 20.61 million tonnes, higher by 1.51 million tonnes or 7.9% ascompared to the previous year, driven by higher sales volume from improved PLC plant performance.
Average sales gas volume of 2,304 mmscfd for the period was lower by 259 mmscfd or 10.1% from thecorresponding period in the previous year, mainly due to lower feedgas supply to Peninsular Malaysia.
The segment recorded higher NOPAT by RM2.4 billion or 23.4% in tandem with higher revenue, partlynegated by higher feedgas prices and TNB fuel cost sharing.
7mmscfd: million standard cubic feet per day
8/2/2019 Third Quarter Ended 31 December 2011
http://slidepdf.com/reader/full/third-quarter-ended-31-december-2011 13/19
PETROLIAM NASIONAL BERHAD(20076-K)
(Incorporated in Malaysia)
QUARTERLY REPORT FOR THE THIRD QUARTER ENDED 31 DECEMBER 2011
13
PART B – OTHER EXPLANATORY NOTES (continued)
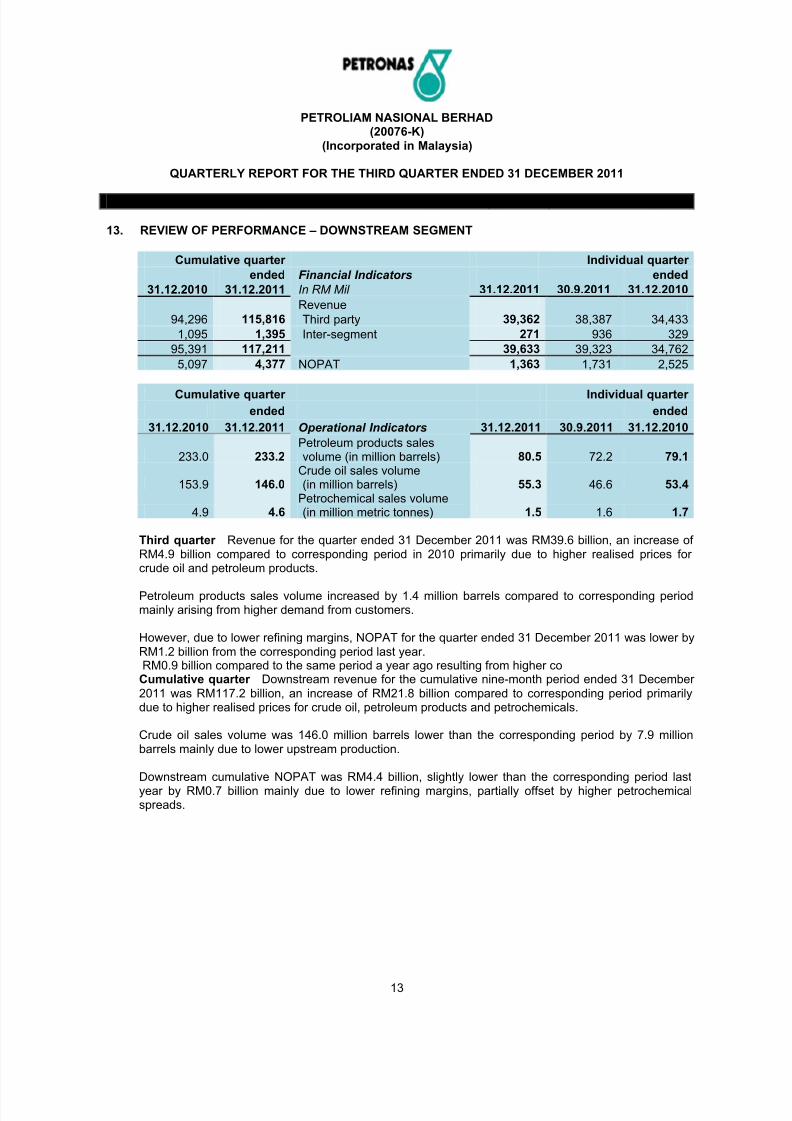
13. REVIEW OF PERFORMANCE – DOWNSTREAM SEGMENT
Cumulative quarter Individual quarter
ended Financial Indicators ended
31.12.2010 31.12.2011 In RM Mil 31.12.2011 30.9.2011 31.12.2010
Revenue
94,296 115,816 Third party 39,362 38,387 34,433
1,095 1,395 Inter-segment 271 936 329
95,391 117,211 39,633 39,323 34,762
5,097 4,377 NOPAT 1,363 1,731 2,525
Cumulative quarter Individual quarter
ended ended
31.12.2010 31.12.2011 Operational Indicators 31.12.2011 30.9.2011 31.12.2010
233.0 233.2Petroleum products salesvolume (in million barrels) 80.5 72.2 79.1
153.9 146.0Crude oil sales volume(in million barrels) 55.3 46.6 53.4
4.9 4.6Petrochemical sales volume(in million metric tonnes) 1.5 1.6 1.7
Third quarter Revenue for the quarter ended 31 December 2011 was RM39.6 billion, an increase of RM4.9 billion compared to corresponding period in 2010 primarily due to higher realised prices for crude oil and petroleum products.
Petroleum products sales volume increased by 1.4 million barrels compared to corresponding periodmainly arising from higher demand from customers.
However, due to lower refining margins, NOPAT for the quarter ended 31 December 2011 was lower byRM1.2 billion from the corresponding period last year.RM0.9 billion compared to the same period a year ago resulting from higher co Cumulative quarter Downstream revenue for the cumulative nine-month period ended 31 December
2011 was RM117.2 billion, an increase of RM21.8 billion compared to corresponding period primarilydue to higher realised prices for crude oil, petroleum products and petrochemicals.
Crude oil sales volume was 146.0 million barrels lower than the corresponding period by 7.9 millionbarrels mainly due to lower upstream production.
Downstream cumulative NOPAT was RM4.4 billion, slightly lower than the corresponding period lastyear by RM0.7 billion mainly due to lower refining margins, partially offset by higher petrochemicalspreads.
8/2/2019 Third Quarter Ended 31 December 2011
http://slidepdf.com/reader/full/third-quarter-ended-31-december-2011 14/19
PETROLIAM NASIONAL BERHAD(20076-K)
(Incorporated in Malaysia)
QUARTERLY REPORT FOR THE THIRD QUARTER ENDED 31 DECEMBER 2011
14
PART B – OTHER EXPLANATORY NOTES (continued)
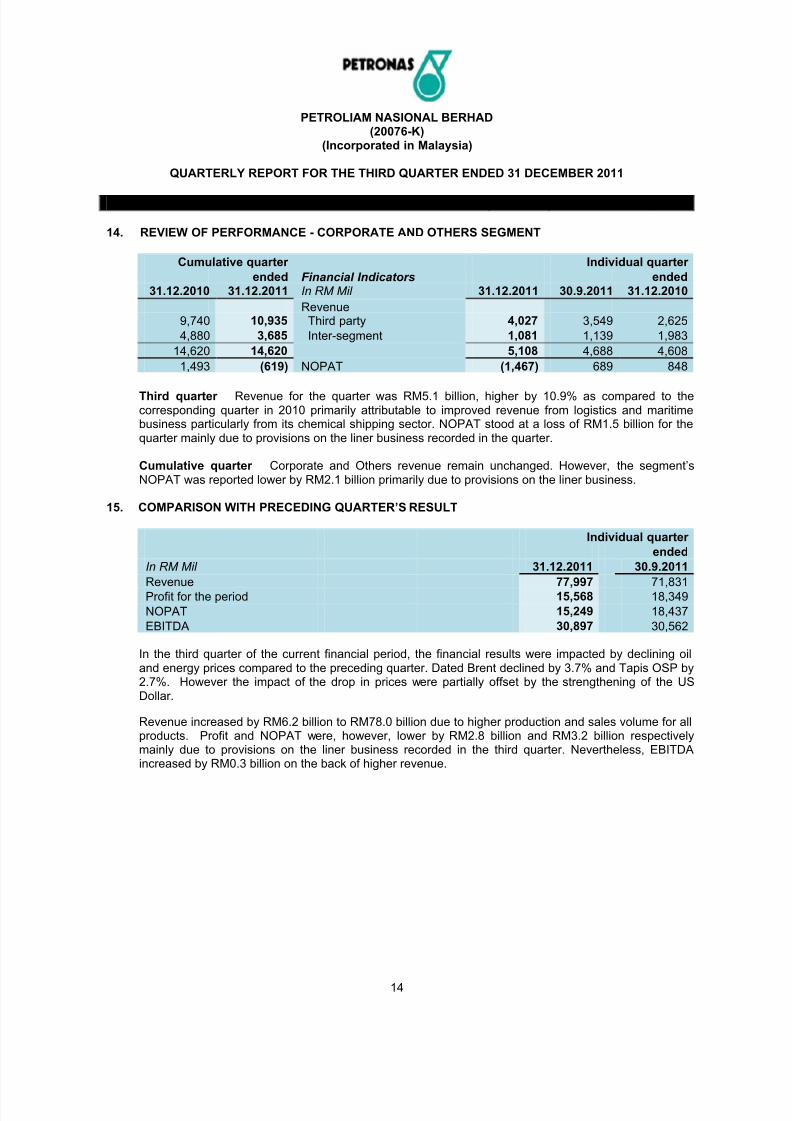
14. REVIEW OF PERFORMANCE - CORPORATE AND OTHERS SEGMENT
Cumulative quarter Individual quarter
ended Financial Indicators ended31.12.2010 31.12.2011 In RM Mil 31.12.2011 30.9.2011 31.12.2010
Revenue9,740 10,935 Third party 4,027 3,549 2,625
4,880 3,685 Inter-segment 1,081 1,139 1,983
14,620 14,620 5,108 4,688 4,608
1,493 (619) NOPAT (1,467) 689 848
Third quarter Revenue for the quarter was RM5.1 billion, higher by 10.9% as compared to thecorresponding quarter in 2010 primarily attributable to improved revenue from logistics and maritimebusiness particularly from its chemical shipping sector. NOPAT stood at a loss of RM1.5 billion for thequarter mainly due to provisions on the liner business recorded in the quarter.
Cumulative quarter Corporate and Others revenue remain unchanged. However, the segment‟sNOPAT was reported lower by RM2.1 billion primarily due to provisions on the liner business.
15. COMPARISON WITH PRECEDING QUARTER’S RESULT
Individual quarter ended
In RM Mil 31.12.2011 30.9.2011
Revenue 77,997 71,831
Profit for the period 15,568 18,349
NOPAT 15,249 18,437
EBITDA 30,897 30,562
In the third quarter of the current financial period, the financial results were impacted by declining oiland energy prices compared to the preceding quarter. Dated Brent declined by 3.7% and Tapis OSP by2.7%. However the impact of the drop in prices were partially offset by the strengthening of the USDollar.
Revenue increased by RM6.2 billion to RM78.0 billion due to higher production and sales volume for allproducts. Profit and NOPAT were, however, lower by RM2.8 billion and RM3.2 billion respectivelymainly due to provisions on the liner business recorded in the third quarter. Nevertheless, EBITDAincreased by RM0.3 billion on the back of higher revenue.
8/2/2019 Third Quarter Ended 31 December 2011
http://slidepdf.com/reader/full/third-quarter-ended-31-december-2011 15/19
PETROLIAM NASIONAL BERHAD(20076-K)
(Incorporated in Malaysia)
QUARTERLY REPORT FOR THE THIRD QUARTER ENDED 31 DECEMBER 2011
15
PART B – OTHER EXPLANATORY NOTES (continued)
16. NEXT FINANCIAL YEAR PROSPECTS
The oil and gas industry continues to be affected by the uncertainties in macro-economicenvironment surrounding the Eurozone and continuing geo-political tensions in the Middle East. Accordingly, volatility in the oil prices, oil demand and the US Dollar currency will continue to affectthe Group‟s performance. Despite these uncertainties, the Board expects PETRONAS Group todeliver satisfactory performance in the next financial year.
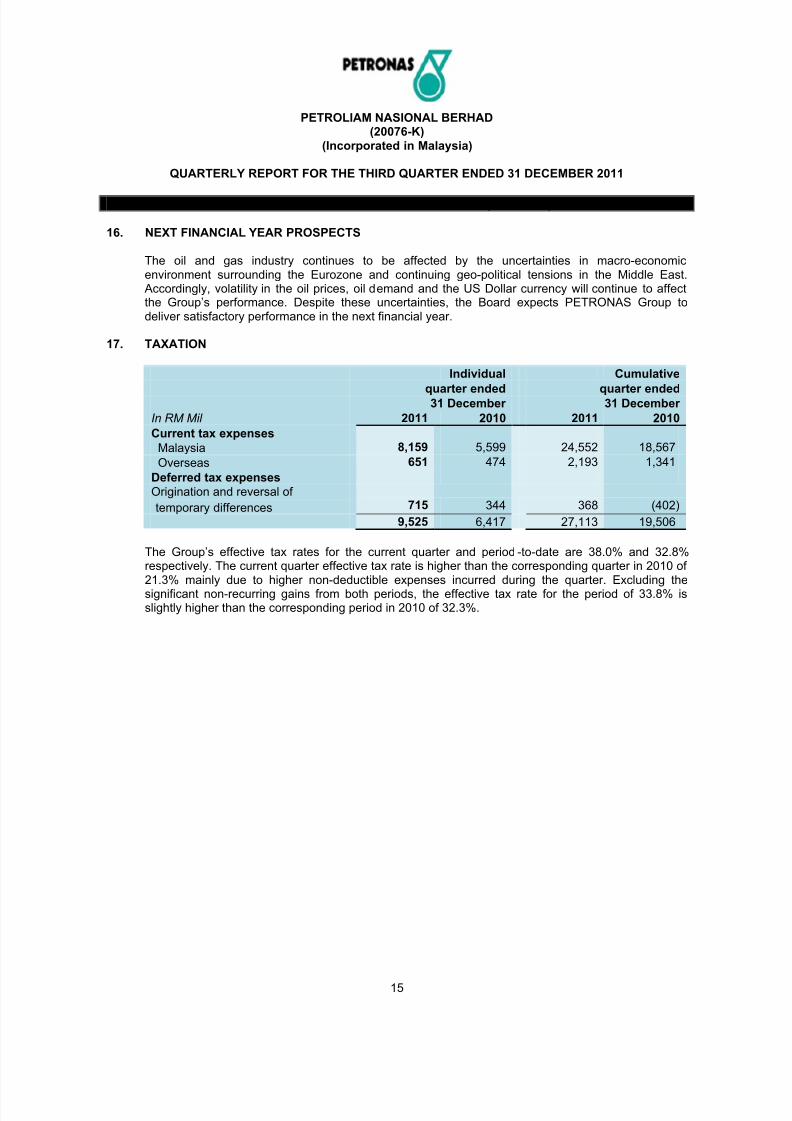
17. TAXATION
Individual Cumulative
quarter ended quarter ended
31 December 31 December
In RM Mil 2011 2010 2011 2010
Current tax expenses
Malaysia 8,159 5,599 24,552 18,567
Overseas 651 474 2,193 1,341
Deferred tax expenses
Origination and reversal of
temporary differences 715 344 368 (402)
9,525 6,417 27,113 19,506
The Group‟s effective tax rates for the current quarter and period -to-date are 38.0% and 32.8%respectively. The current quarter effective tax rate is higher than the corresponding quarter in 2010 of 21.3% mainly due to higher non-deductible expenses incurred during the quarter. Excluding thesignificant non-recurring gains from both periods, the effective tax rate for the period of 33.8% isslightly higher than the corresponding period in 2010 of 32.3%.
8/2/2019 Third Quarter Ended 31 December 2011
http://slidepdf.com/reader/full/third-quarter-ended-31-december-2011 16/19
PETROLIAM NASIONAL BERHAD(20076-K)
(Incorporated in Malaysia)
QUARTERLY REPORT FOR THE THIRD QUARTER ENDED 31 DECEMBER 2011
16
PART B – OTHER EXPLANATORY NOTES (continued)
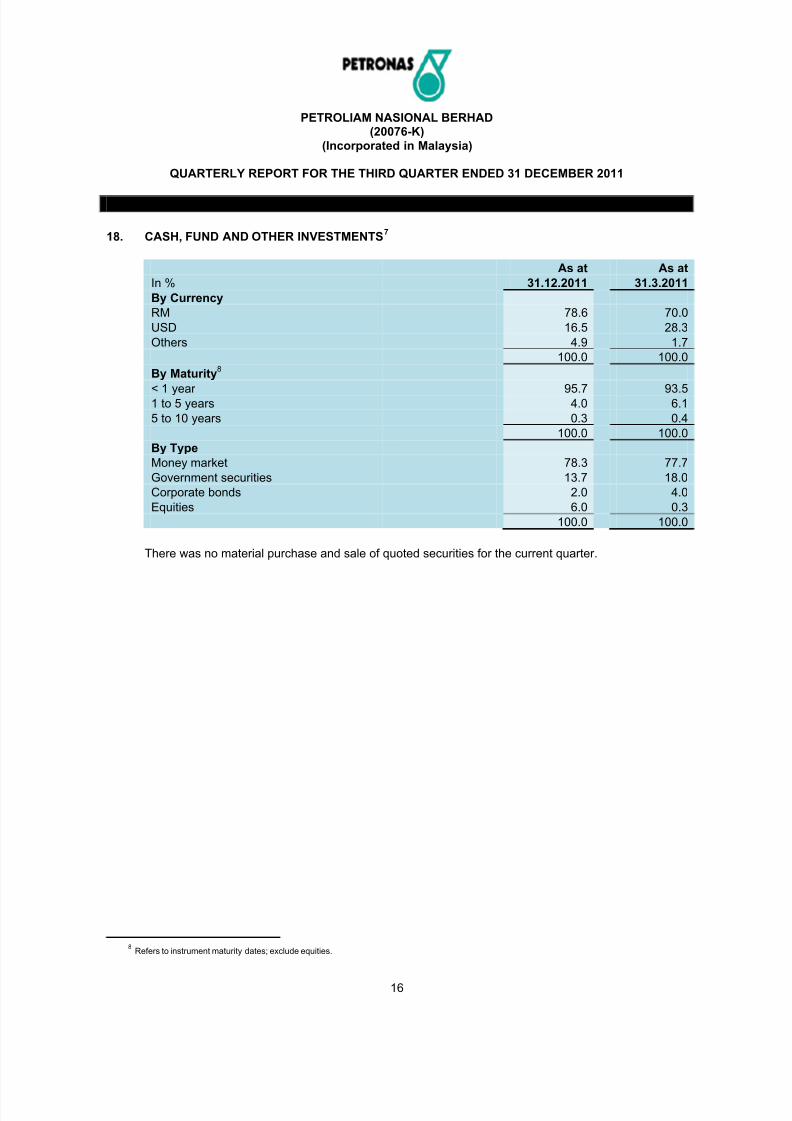
18. CASH, FUND AND OTHER INVESTMENTS7
As at As at
In % 31.12.2011 31.3.2011
By Currency
RM 78.6 70.0
USD 16.5 28.3
Others 4.9 1.7
100.0 100.0By Maturity
86
< 1 year 95.7 93.5
1 to 5 years 4.0 6.1
5 to 10 years 0.3 0.4
100.0 100.0
By Type
Money market 78.3 77.7
Government securities 13.7 18.0
Corporate bonds 2.0 4.0
Equities 6.0 0.3
100.0 100.0
There was no material purchase and sale of quoted securities for the current quarter.
8 Refers to instrument maturity dates; exclude equities.
8/2/2019 Third Quarter Ended 31 December 2011
http://slidepdf.com/reader/full/third-quarter-ended-31-december-2011 17/19
PETROLIAM NASIONAL BERHAD(20076-K)
(Incorporated in Malaysia)
QUARTERLY REPORT FOR THE THIRD QUARTER ENDED 31 DECEMBER 2011
17
PART B – OTHER EXPLANATORY NOTES (continued)
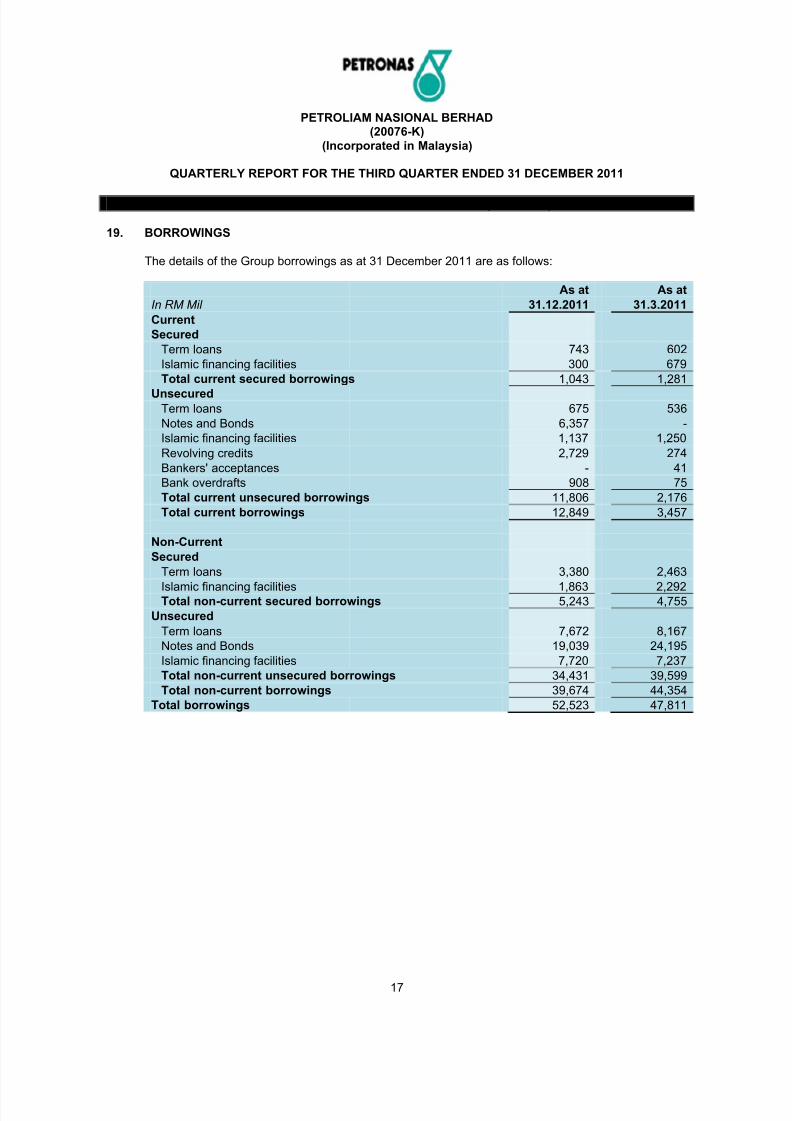
19. BORROWINGS
The details of the Group borrowings as at 31 December 2011 are as follows: As at As at
In RM Mil 31.12.2011 31.3.2011
Current
Secured
Term loans 743 602
Islamic financing facilities 300 679
Total current secured borrowings 1,043 1,281
Unsecured
Term loans 675 536
Notes and Bonds 6,357 -
Islamic financing facilities 1,137 1,250
Revolving credits 2,729 274
Bankers' acceptances - 41
Bank overdrafts 908 75
Total current unsecured borrowings 11,806 2,176
Total current borrowings 12,849 3,457
Non-CurrentSecured
Term loans 3,380 2,463
Islamic financing facilities 1,863 2,292
Total non-current secured borrowings 5,243 4,755
Unsecured
Term loans 7,672 8,167
Notes and Bonds 19,039 24,195
Islamic financing facilities 7,720 7,237
Total non-current unsecured borrowings 34,431 39,599
Total non-current borrowings 39,674 44,354
Total borrowings 52,523 47,811
8/2/2019 Third Quarter Ended 31 December 2011
http://slidepdf.com/reader/full/third-quarter-ended-31-december-2011 18/19
PETROLIAM NASIONAL BERHAD(20076-K)
(Incorporated in Malaysia)
QUARTERLY REPORT FOR THE THIRD QUARTER ENDED 31 DECEMBER 2011
18
PART B – OTHER EXPLANATORY NOTES (continued)
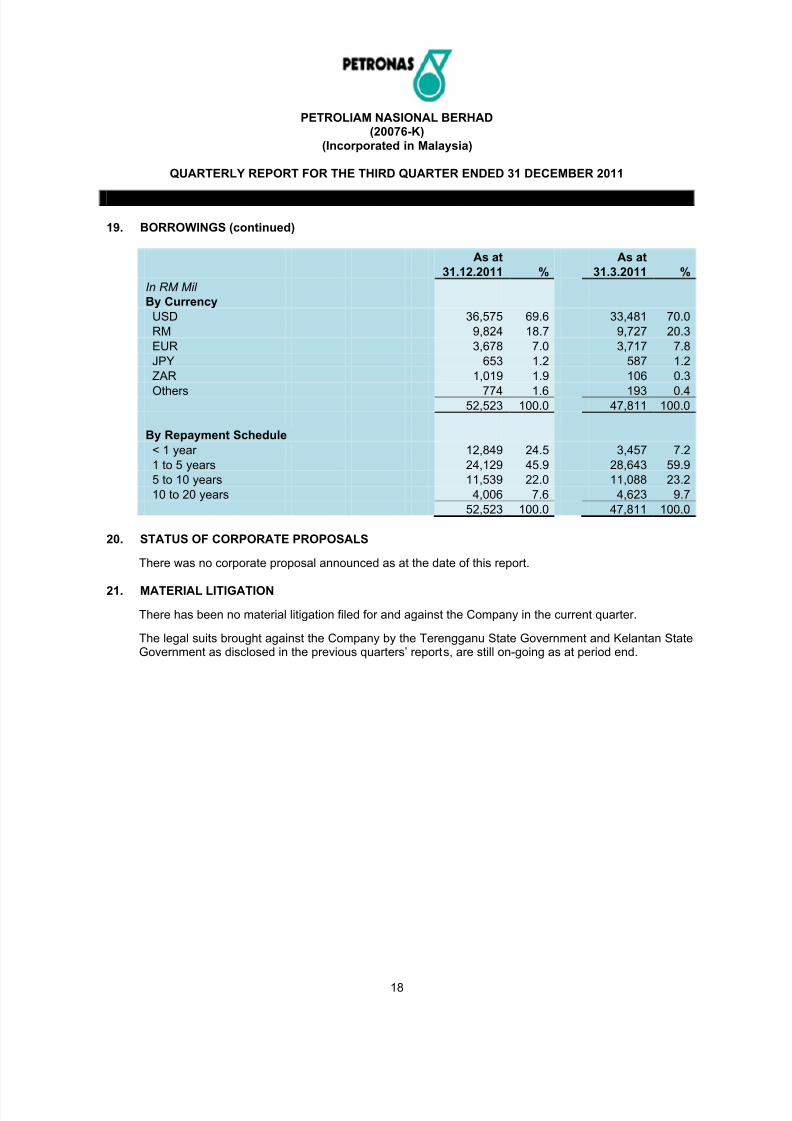
19. BORROWINGS (continued)
As at As at
31.12.2011 % 31.3.2011 %
In RM Mil
By Currency
USD 36,575 69.6 33,481 70.0
RM 9,824 18.7 9,727 20.3
EUR 3,678 7.0 3,717 7.8
JPY 653 1.2 587 1.2ZAR 1,019 1.9 106 0.3
Others 774 1.6 193 0.4
52,523 100.0 47,811 100.0
By Repayment Schedule
< 1 year 12,849 24.5 3,457 7.2
1 to 5 years 24,129 45.9 28,643 59.9
5 to 10 years 11,539 22.0 11,088 23.2
10 to 20 years 4,006 7.6 4,623 9.7
52,523 100.0 47,811 100.0
20. STATUS OF CORPORATE PROPOSALS
There was no corporate proposal announced as at the date of this report.
21. MATERIAL LITIGATION
There has been no material litigation filed for and against the Company in the current quarter.
The legal suits brought against the Company by the Terengganu State Government and Kelantan StateGovernment as disclosed in the previous quarters‟ reports, are still on-going as at period end.
8/2/2019 Third Quarter Ended 31 December 2011
http://slidepdf.com/reader/full/third-quarter-ended-31-december-2011 19/19
PETROLIAM NASIONAL BERHAD(20076-K)
(Incorporated in Malaysia)
QUARTERLY REPORT FOR THE THIRD QUARTER ENDED 31 DECEMBER 2011
PART B – OTHER EXPLANATORY NOTES (continued)
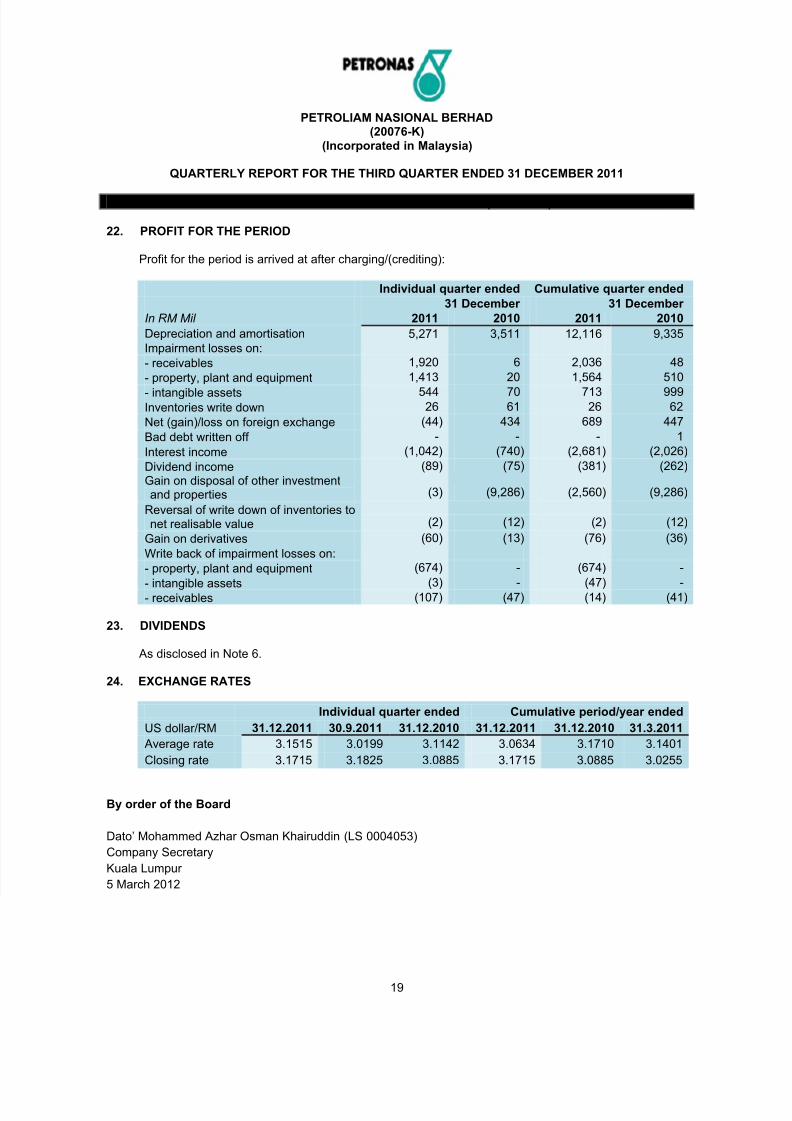
22. PROFIT FOR THE PERIOD
Profit for the period is arrived at after charging/(crediting):
Individual quarter ended Cumulative quarter ended 31 December 31 December
In RM Mil 2011 2010 2011 2010
Depreciation and amortisation 5,271 3,511 12,116 9,335
Impairment losses on:
- receivables 1,920 6 2,036 48- property, plant and equipment 1,413 20 1,564 510
- intangible assets 544 70 713 999
Inventories write down 26 61 26 62
Net (gain)/loss on foreign exchange (44) 434 689 447
Bad debt written off - - - 1
Interest income (1,042) (740) (2,681) (2,026)
Dividend income (89) (75) (381) (262)
Gain on disposal of other investmentand properties (3) (9,286) (2,560) (9,286)
Reversal of write down of inventories tonet realisable value (2) (12) (2) (12)
Gain on derivatives (60) (13) (76) (36)Write back of impairment losses on:
- property, plant and equipment (674) - (674) -
- intangible assets (3) - (47) -
- receivables (107) (47) (14) (41)
23. DIVIDENDS
As disclosed in Note 6.
24. EXCHANGE RATES
Individual quarter ended Cumulative period/year ended
US dollar/RM 31.12.2011 30.9.2011 31.12.2010 31.12.2011 31.12.2010 31.3.2011
Average rate 3.1515 3.0199 3.1142 3.0634 3.1710 3.1401
Closing rate 3.1715 3.1825 3.0885 3.1715 3.0885 3.0255
By order of the Board
Dato‟ Mohammed Azhar Osman Khairuddin (LS 0004053)
Company Secretary
Kuala Lumpur
5 March 2012