Embed Size (px)
Citation preview
Patricia Woertz Douglas Schmalz John Rice Brian Peterson Dwight Grimestad Chairman, CEO SVP and CFO EVP, Global Marketing SVP, Corporate Affairs VP, Investor Relations
and President and Risk Management
Third Quarter FY2007Earnings Conference CallArcher Daniels Midland Company
2
Safe Harbor StatementThird Quarter FY2007
Some of our comments constitute forward-looking statements that reflect management’s current views and estimates of future economic circumstances, industry conditions, company performance and financial results.
The statements are based on many assumptions and factors, including availability and prices of raw materials, market conditions, operating efficiencies, access to capital and actions of governments. Any changes in such assumptions or factors could produce significantly different results. To the extent permitted under applicable law, the Company assumes no obligation to update any forward-looking statements as a result of new information or future events.
3
Table of ContentsThird Quarter FY2007
Financial Earnings Highlights Page 4
Earnings Summary Page 5
Target Performance Objectives Page 6
Operating Profit by Segment Page 7-12
Summary of Financial Condition Page 13
Capital Projects Update Page 14
Cash Flow Highlights Page 15
Q&A Page 16
Upcoming Events Page 17
Appendix Page 18-21
4
Financial Earnings HighlightsThird Quarter FY2007
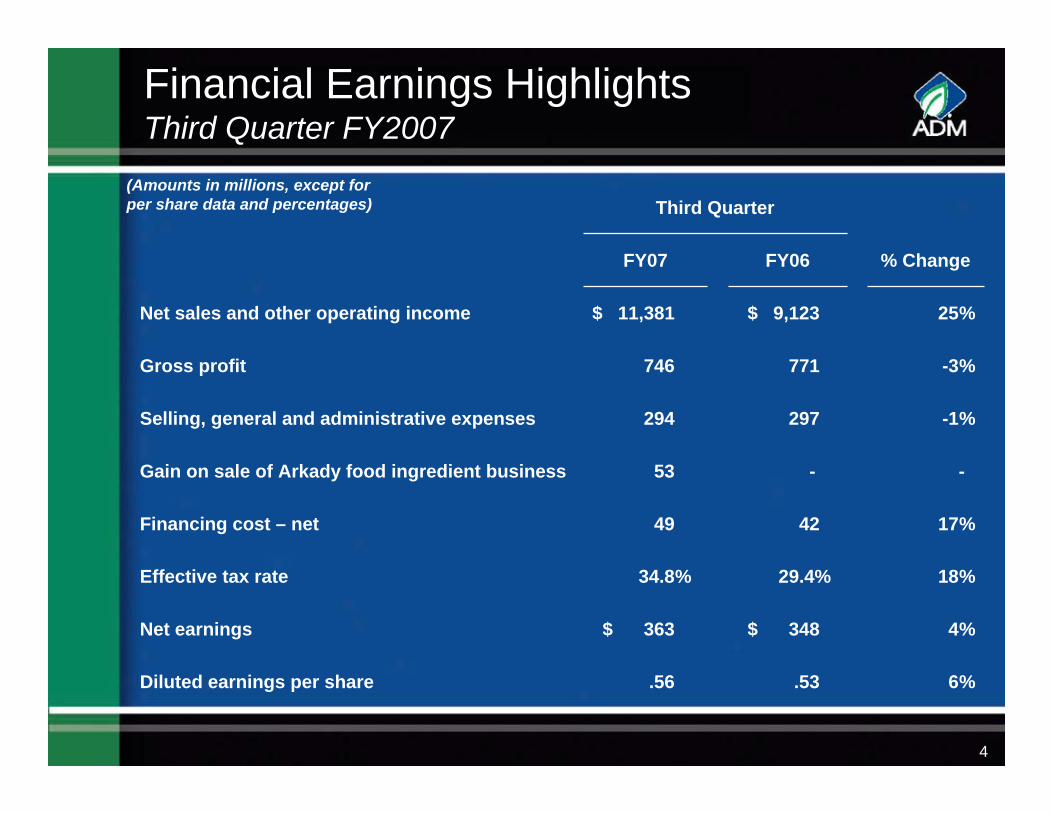
--53Gain on sale of Arkady food ingredient business
Third Quarter
% ChangeFY06FY07
.56
$ 363
34.8%
49
294
746
$ 11,381
18%29.4%Effective tax rate
6%.53Diluted earnings per share
4%$ 348Net earnings
17%42Financing cost – net
-1%297Selling, general and administrative expenses
-3%771Gross profit
25%$ 9,123Net sales and other operating income
(Amounts in millions, except for per share data and percentages)
5
$0
$500
Earnings Summary Third Quarter FY2007
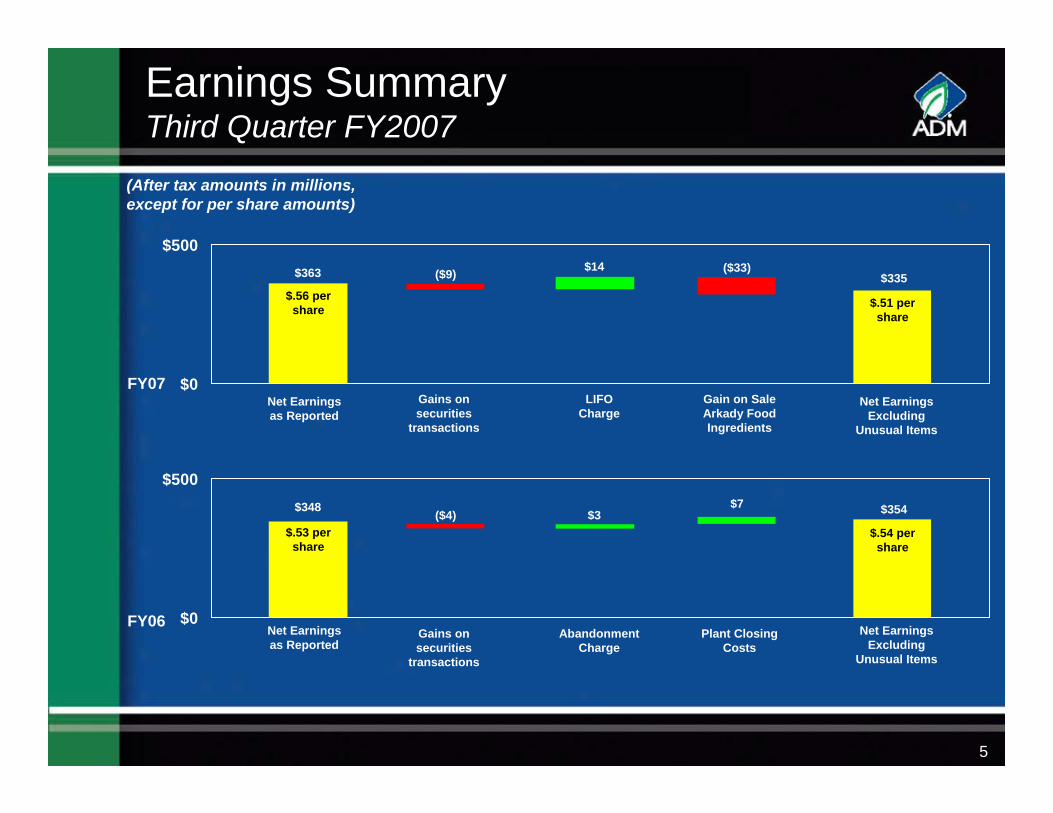
(After tax amounts in millions, except for per share amounts)
Net Earnings Excluding
Unusual Items
Gains on securities
transactions
LIFOCharge
Net Earnings as Reported
$.51 per share
$.56 per share
($9) $14
FY07
FY06
$363 $335
Gain on Sale Arkady Food Ingredients
($33)
$0
$500
$.54 per share
$.53 per share
($4) $3$348 $354$7
Gains on securities
transactions
Abandonment Charge
Plant Closing Costs
Net Earnings Excluding
Unusual Items
Net Earnings as Reported
6
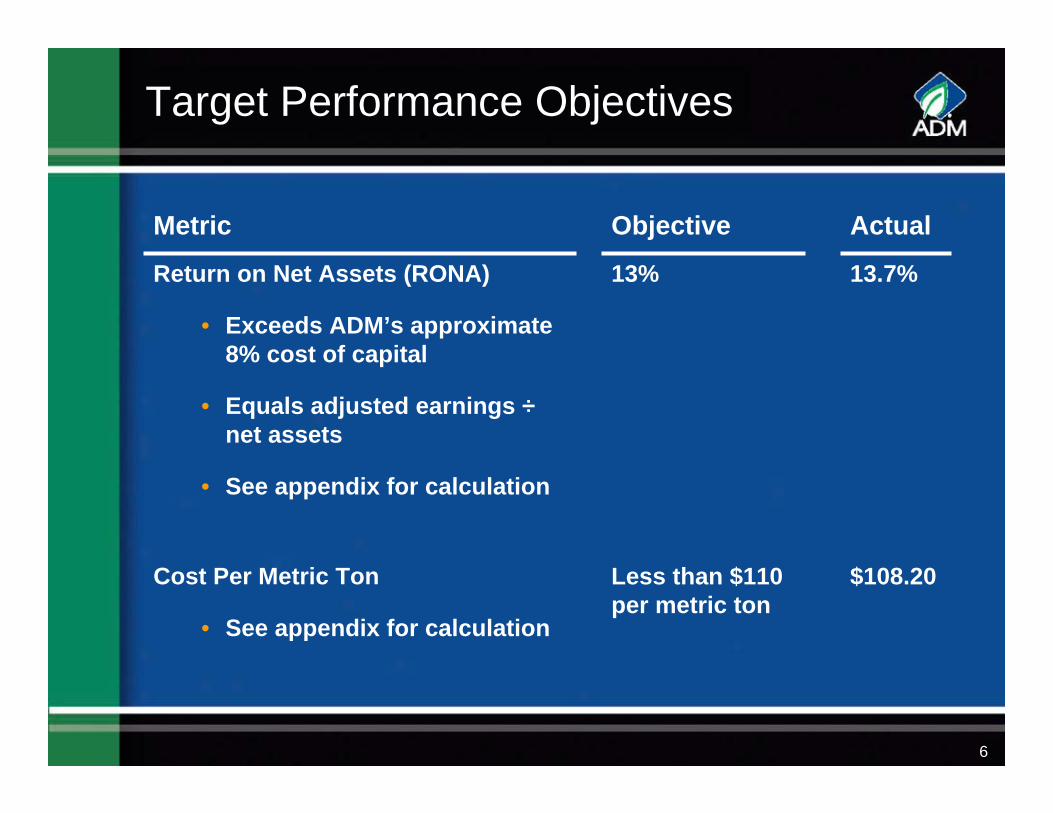
Target Performance Objectives
$108.20Less than $110 per metric ton
Cost Per Metric Ton
• See appendix for calculation
13.7%13%Return on Net Assets (RONA)
• Exceeds ADM’s approximate 8% cost of capital
• Equals adjusted earnings ÷net assets
• See appendix for calculation
ActualObjectiveMetric
7
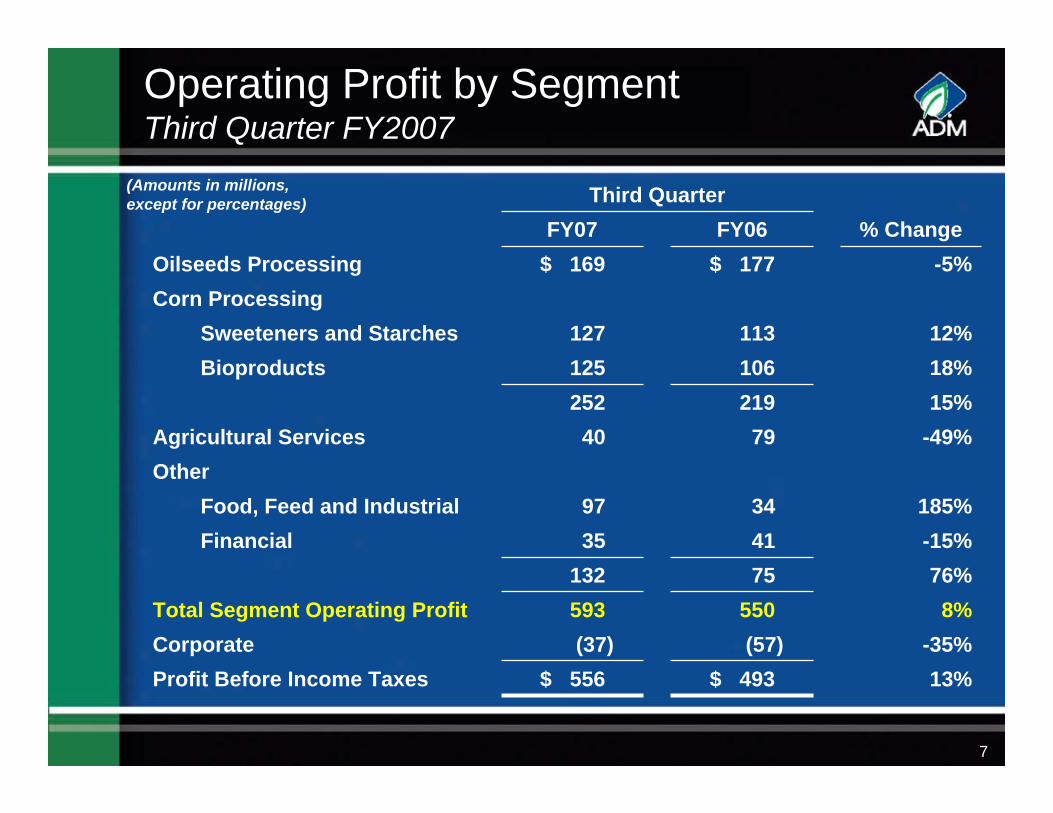
Operating Profit by SegmentThird Quarter FY2007
13%-35%
8%76%
-15%185%
-49%15%18%12%
-5%% Change
Third QuarterFY06FY07
$ 556 (37)
593132
3597
40252125127
$ 169
75
219
$ 493 Profit Before Income Taxes(57)Corporate
550Total Segment Operating Profit
41Financial34Food, Feed and Industrial
Other79Agricultural Services
106Bioproducts113Sweeteners and Starches
Corn Processing$ 177Oilseeds Processing
(Amounts in millions, except for percentages)
8
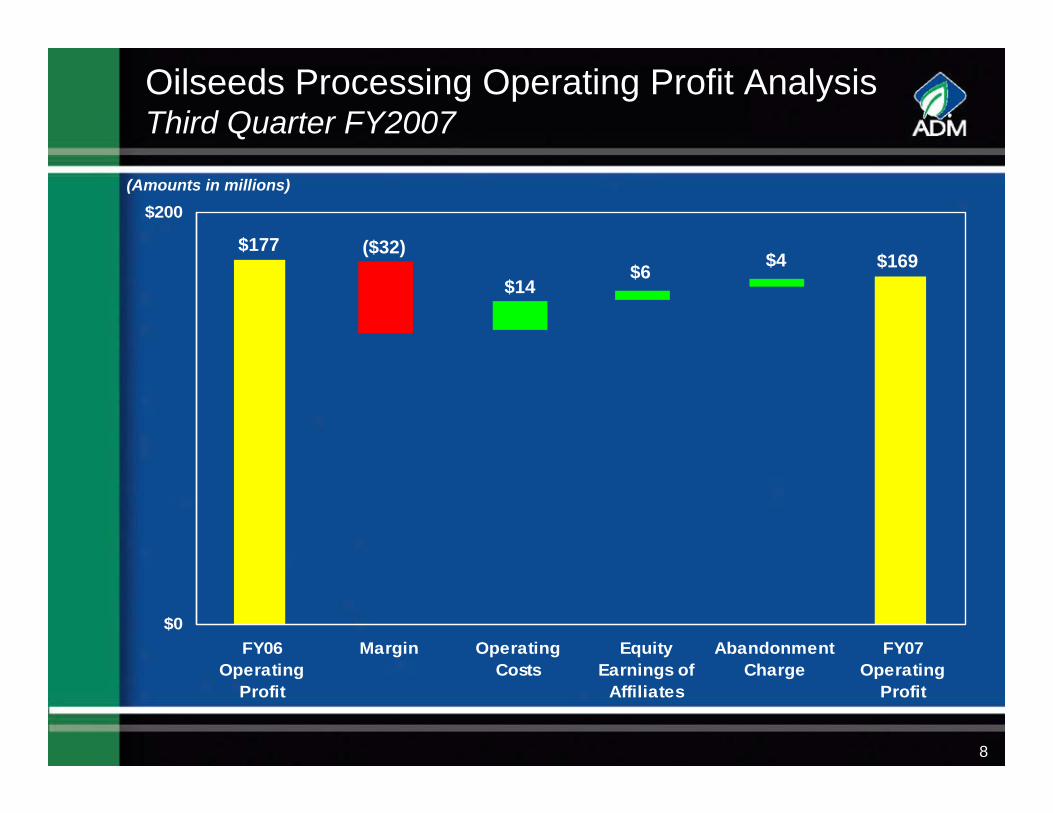
Oilseeds Processing Operating Profit AnalysisThird Quarter FY2007
$0
$200
FY06Operating
Profit
Margin OperatingCosts
EquityEarnings of
Affiliates
AbandonmentCharge
FY07Operating
Profit
$14
$177$169
(Amounts in millions)
($32)$6 $4
9
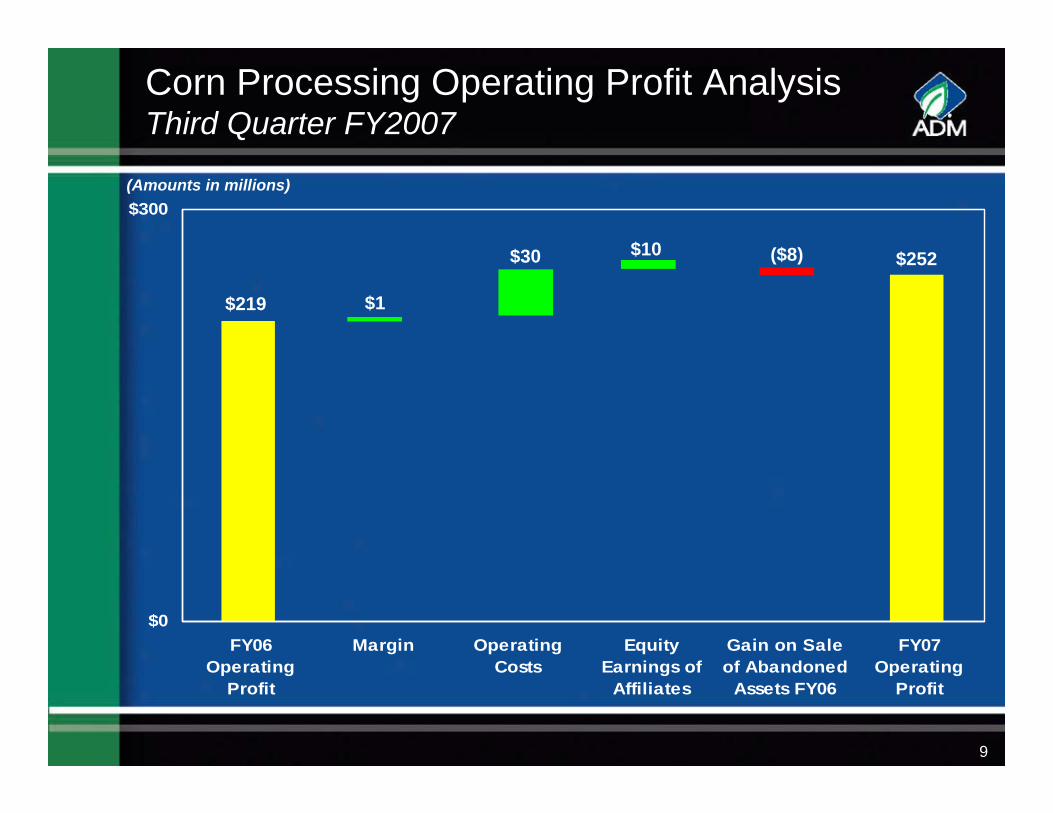
$0
$300
FY06Operating
Profit
Margin OperatingCosts
EquityEarnings of
Affiliates
Gain on Saleof Abandoned
Assets FY06
FY07Operating
Profit
($8)
Corn Processing Operating Profit AnalysisThird Quarter FY2007
$219 $1
$30 $10 $252
(Amounts in millions)
10
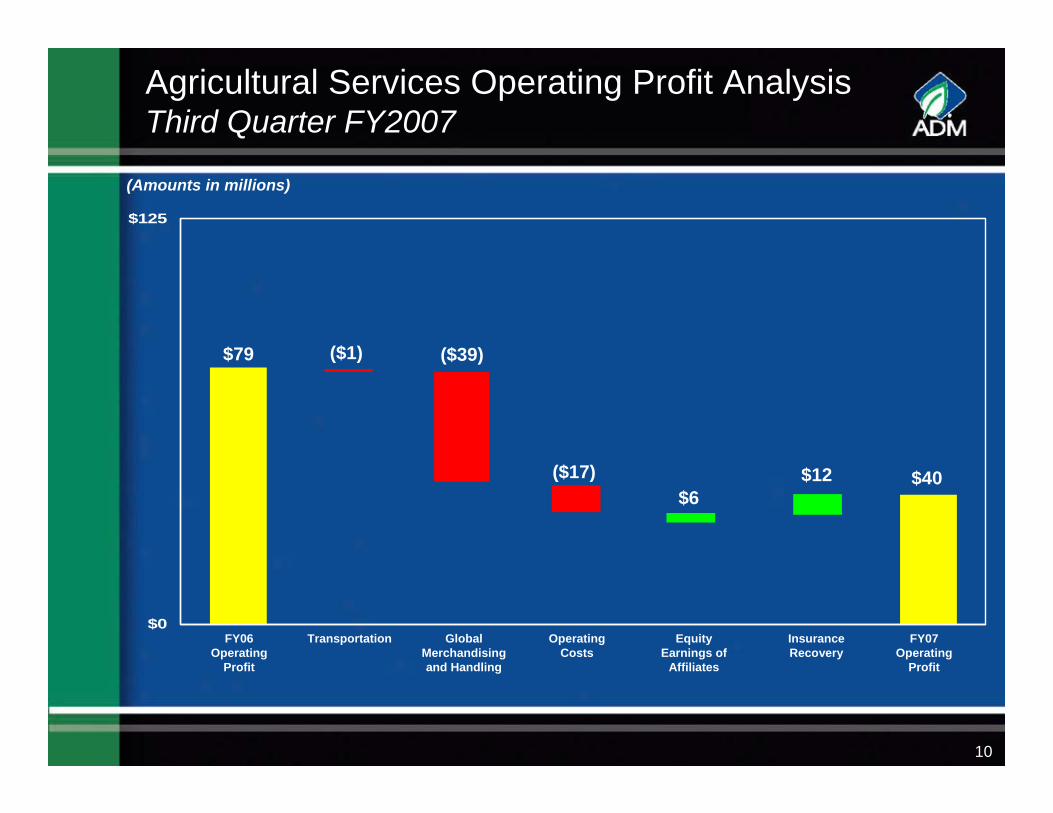
$0
$125
$6
Agricultural Services Operating Profit AnalysisThird Quarter FY2007
$79 ($1) ($39)
($17) $40
(Amounts in millions)
FY06 Operating
Profit
FY07 Operating
Profit
Insurance Recovery
Equity Earnings of
Affiliates
Operating Costs
Global Merchandising and Handling
Transportation
$12
11
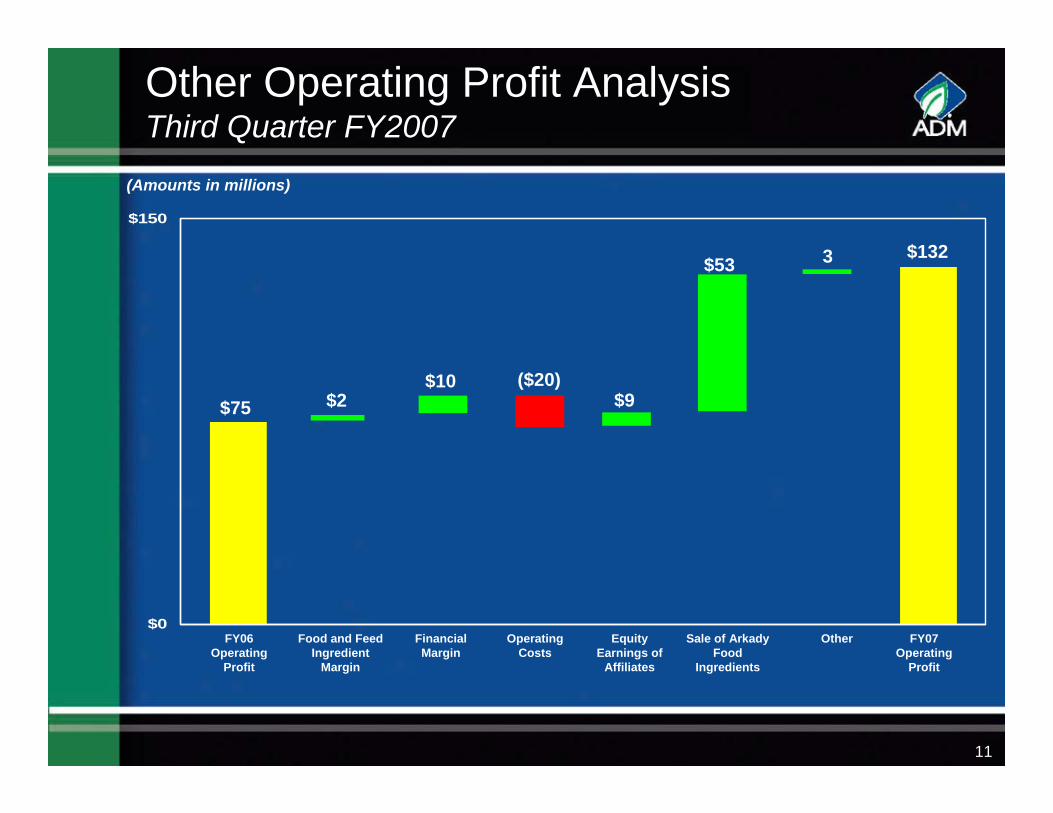
$0
$150
Other Operating Profit AnalysisThird Quarter FY2007
3
$75 $2$10 ($20)
$132
(Amounts in millions)
FY06 Operating
Profit
FY07 Operating
Profit
Sale of Arkady Food
Ingredients
Equity Earnings of
Affiliates
Operating Costs
Financial Margin
Food and Feed Ingredient
Margin
$53
Other
$9
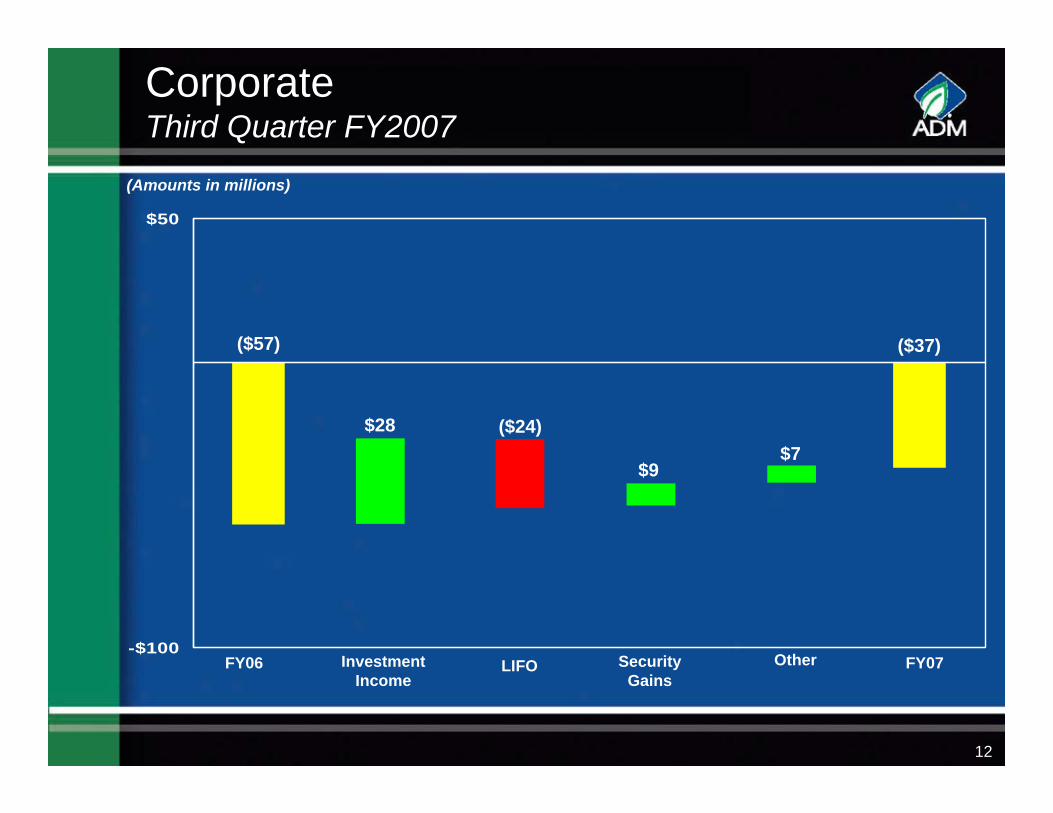
12
CorporateThird Quarter FY2007
-$100
$50
($57)
$28 ($24)$7
($37)
FY06 Investment Income
LIFO Security Gains
Other FY07
$9
(Amounts in millions)
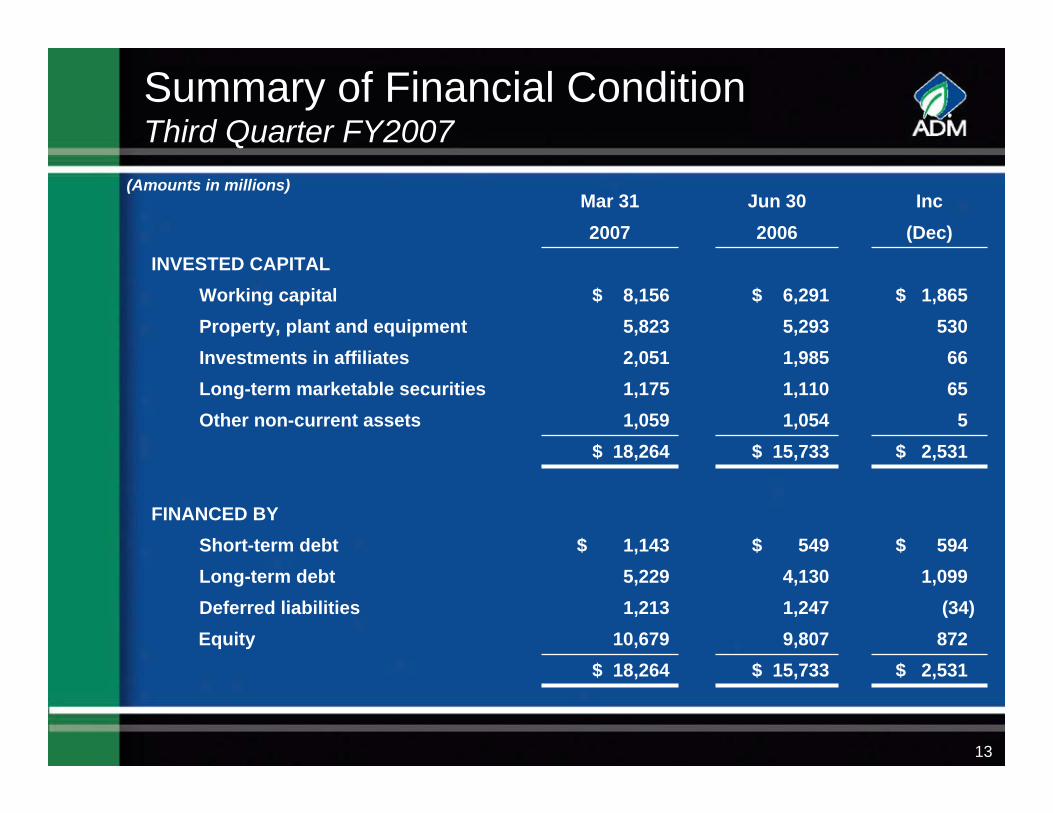
13
Summary of Financial Condition Third Quarter FY2007
IncJun 30Mar 31
8729,80710,679Equity$ 2,531$ 15,733$ 18,264
$ 2,531$ 15,733$ 18,264
(Dec)20062007
1,2135,229
$ 1,143
1,0591,1752,0515,823
$ 8,156
(34)1,247Deferred liabilities
651,110Long-term marketable securities
1,0994,130Long-term debt$ 594$ 549Short-term debt
FINANCED BY
51,054Other non-current assets
661,985Investments in affiliates5305,293Property, plant and equipment
$ 1,865$ 6,291Working capitalINVESTED CAPITAL
(Amounts in millions)
14
October 08
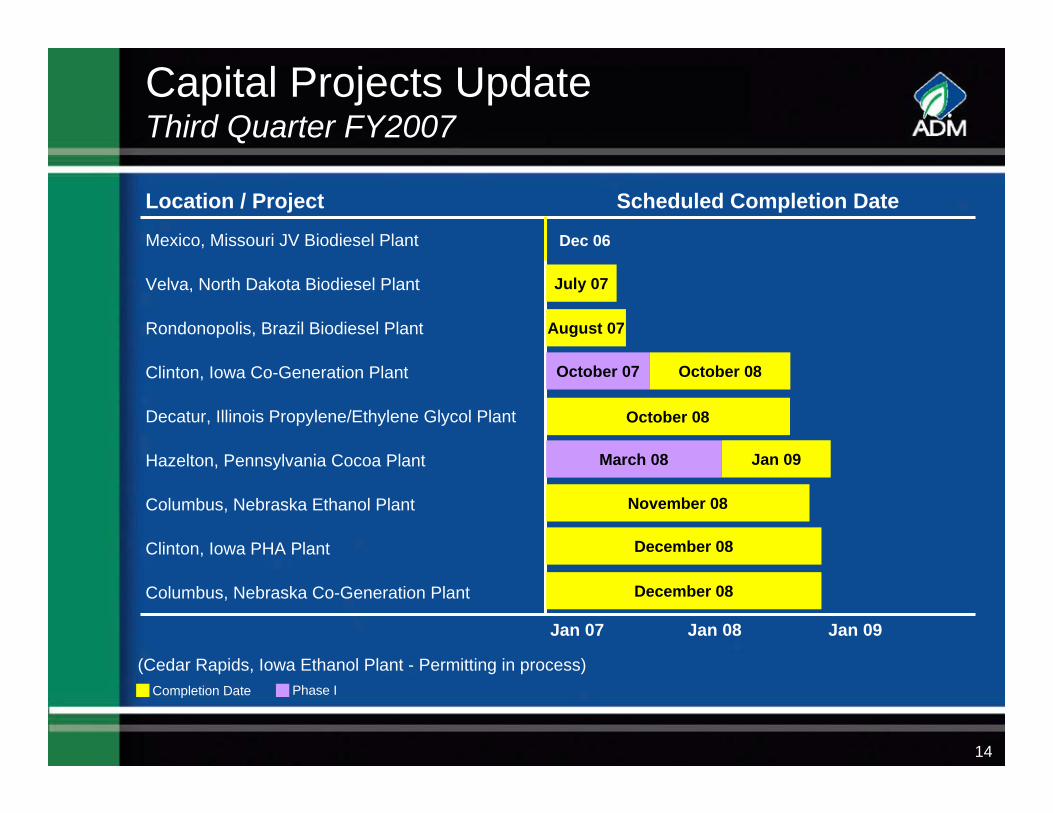
Capital Projects UpdateThird Quarter FY2007
Decatur, Illinois Propylene/Ethylene Glycol Plant
Mexico, Missouri JV Biodiesel Plant
Jan 09Jan 08Jan 07
Columbus, Nebraska Co-Generation Plant
Clinton, Iowa PHA Plant
Columbus, Nebraska Ethanol Plant
Hazelton, Pennsylvania Cocoa Plant
Clinton, Iowa Co-Generation Plant
Rondonopolis, Brazil Biodiesel Plant
Velva, North Dakota Biodiesel Plant
Scheduled Completion DateLocation / Project
(Cedar Rapids, Iowa Ethanol Plant - Permitting in process)
July 07
August 07
October 07
March 08
November 08
December 08
December 08
Dec 06
October 08
Jan 09
Completion Date Phase I
15
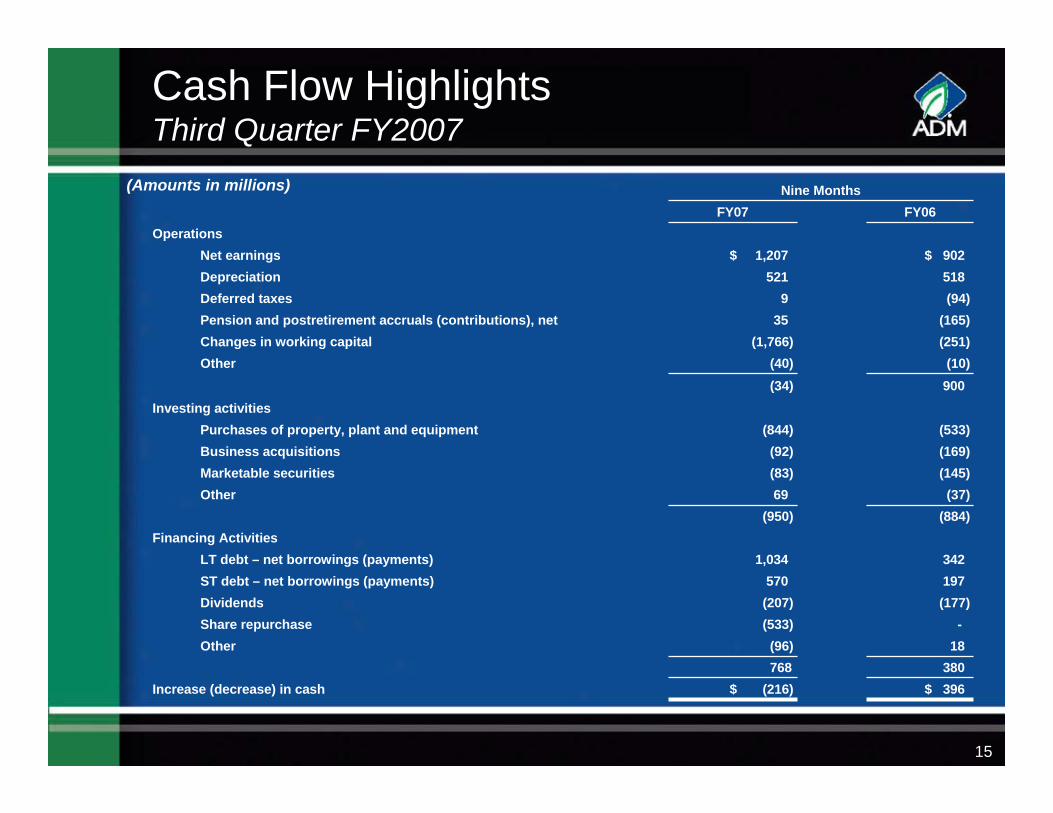
Cash Flow HighlightsThird Quarter FY2007
-(533)Share repurchase
(145)(83)Marketable securities
518521Depreciation
(165)35Pension and postretirement accruals (contributions), net(94)9Deferred taxes
Investing activities(533)(844)Purchases of property, plant and equipment(169)(92)Business acquisitions
(37)69Other(884)(950)
Financing Activities
38076818(96)Other
(177)(207)Dividends197570ST debt – net borrowings (payments)3421,034LT debt – net borrowings (payments)
900(34)
Nine MonthsFY06FY07
$ (216)
(40)(1,766)
$ 1,207
(10)Other
$ 396Increase (decrease) in cash
(251)Changes in working capital
$ 902Net earningsOperations
(Amounts in millions)
Q&A
16
17
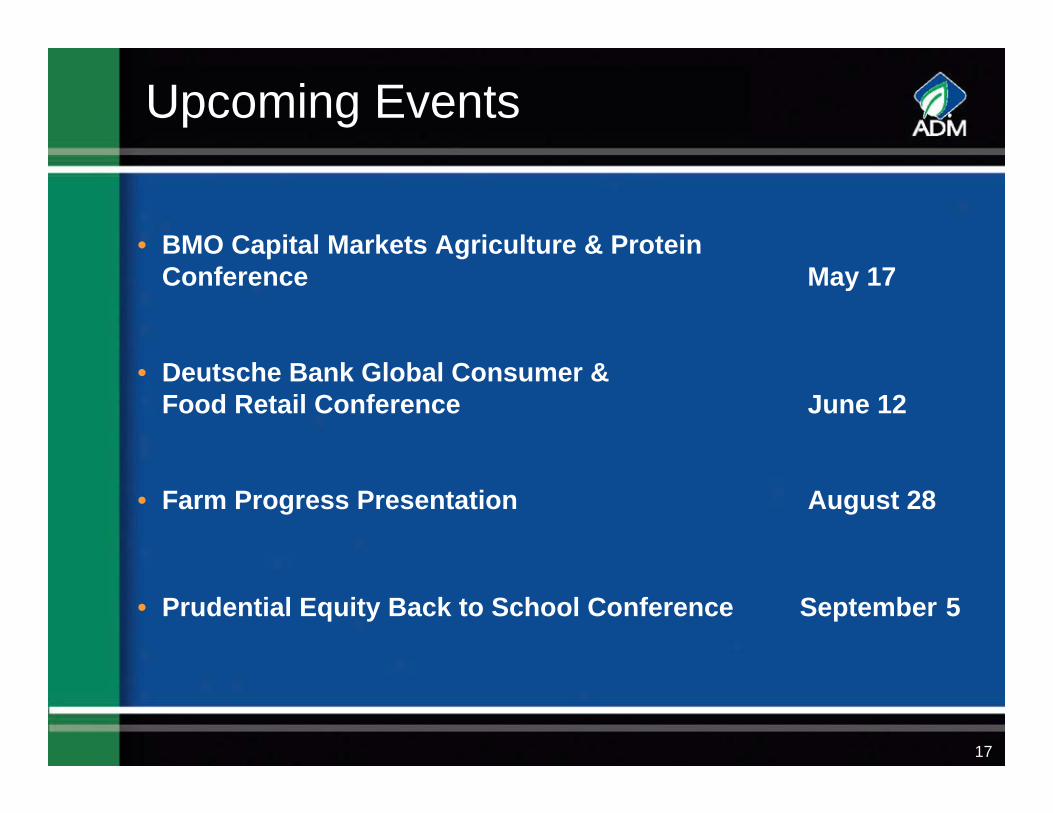
Upcoming Events
• BMO Capital Markets Agriculture & Protein Conference May 17
• Deutsche Bank Global Consumer & Food Retail Conference June 12
• Farm Progress Presentation August 28
• Prudential Equity Back to School Conference September 5
Appendix
18
19
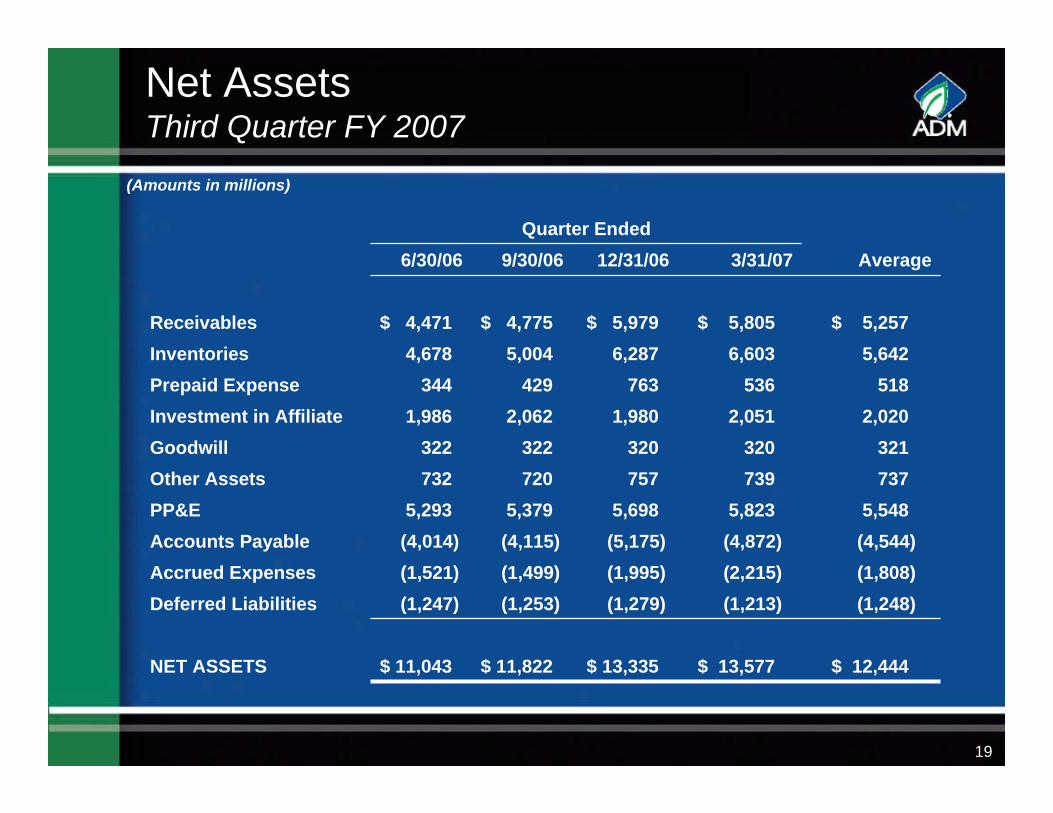
Net AssetsThird Quarter FY 2007
(Amounts in millions)
$ 13,577
(1,213)(2,215)(4,872)5,823
739320
2,051536
6,603$ 5,805
3/31/07Quarter Ended
$ 12,444$ 13,335$ 11,822$ 11,043NET ASSETS
737757720732Other Assets5,5485,6985,3795,293PP&E
Average12/31/069/30/066/30/06
(1,253)(1,499)(4,115)
3222,062
4295,004
$ 4,775
(1,247)(1,521)(4,014)
3221,986
3444,678
$ 4,471
2,0201,980Investment in Affiliate
(1,248)(1,279)Deferred Liabilities(1,808)(1,995)Accrued Expenses(4,544)(5,175)Accounts Payable
321320Goodwill
518763Prepaid Expense5,6426,287Inventories
$ 5,257$ 5,979Receivables
20
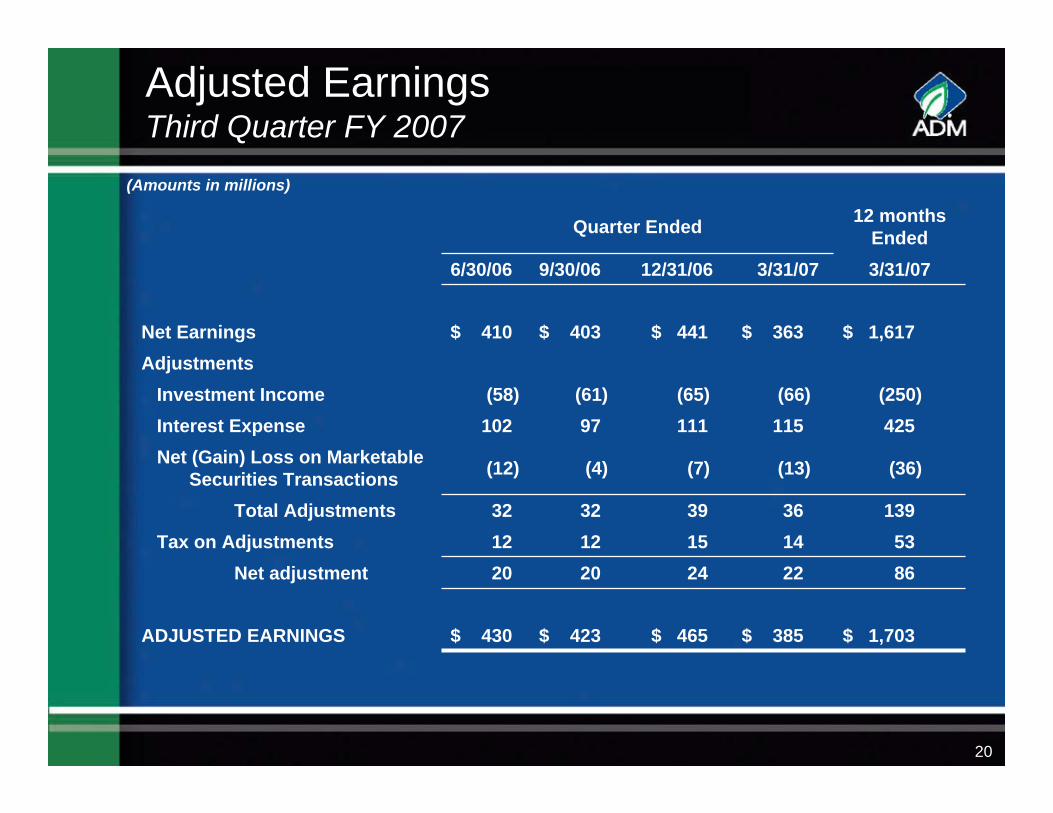
Adjusted EarningsThird Quarter FY 2007
(Amounts in millions)
$ 385
221436
(13)
115(66)
$ 363
3/31/07
12 months EndedQuarter Ended
$ 1,703$ 465$ 423$ 430ADJUSTED EARNINGS
139393232Total Adjustments53151212Tax on Adjustments
3/31/0712/31/069/30/066/30/06
20
(4)
97(61)
$ 403
20
(12)
102(58)
$ 410
425111Interest Expense
8624Net adjustment
(36)(7)Net (Gain) Loss on Marketable Securities Transactions
(250)(65)Investment IncomeAdjustments
$ 1,617$ 441Net Earnings
21
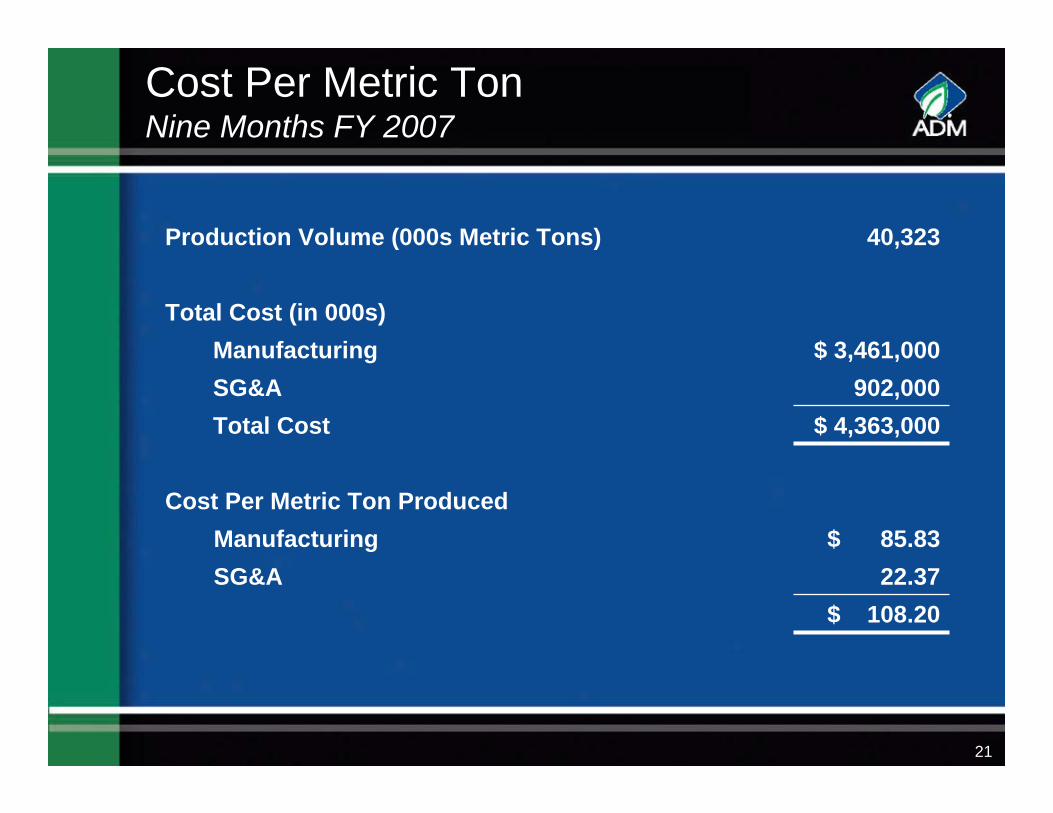
Cost Per Metric TonNine Months FY 2007
$ 85.83Manufacturing22.37SG&A
Total Cost (in 000s)$ 3,461,000Manufacturing
902,000SG&A$ 4,363,000Total Cost
$ 108.20
40,323
Cost Per Metric Ton Produced
Production Volume (000s Metric Tons)